Article

Biochemical Composition and Phycoerythrin Extraction from Red Microalgae: A Comparative Study Using Green Extraction Technologies

by
Paula Ardiles
1,
Pedro Cerezal-Mezquita
1,
Francisca Salinas-Fuentes
1,
Daniel Órdenes
1,2,
Gabriel Renato
3 and
Mari Carmen Ruiz-Domínguez
1,*
1
Laboratorio de Microencapsulación de Compuestos Bioactivos, (LAMICBA), Departamento de Ciencias de los Alimentos y Nutrición, Facultad de Ciencias de la Salud, Universidad de Antofagasta, Antofagasta 1240000, Chile
2
Departamento de Tecnología Médica, Facultad de Ciencias de la Salud, Universidad de Antofagasta, Antofagasta 1240000, Chile
3
Adroit Biotechnologies (UK) Limited Company, MRN House, Binfield Road, London SW4 6TB, UK
*
Author to whom correspondence should be addressed.
Processes 2020, 8(12), 1628; https://doi.org/10.3390/pr8121628
Submission received: 26 November 2020 / Revised: 4 December 2020 / Accepted: 8 December 2020 / Published: 10 December 2020
(This article belongs to the Section Pharmaceutical Processes)

Abstract

:
Porphyridium spp. is a debated family that produces phycoerythrin (PE) for use in multiple industrial applications. We compared the differences in the biochemical composition and phycoerythrin yield of P. cruentum and P. purpureum by conventional and green extraction technologies. The protein content in P. cruentum was 42.90 ±1.84% w/w. The omega-3 fatty acid (FA) was highlighted by eicosapentaenoic acid (EPA, C20:5, ω-3, ~9.74 ± 0.27% FA) and arachidonic acid (ARA, C20:4, ω-6, ~18.02 ± 0.81% FA) represented the major omega-6 fatty acid. Conversely, P. purpureum demonstrated a higher lipid content (17.34 ± 1.35% w/w) and an FA profile more saturated in palmitic (C16:0, 29.01 ± 0.94% FA) and stearic acids (C18:0, 50.02 ± 1.72% FA). Maceration and freeze/thaw were the conventional methods, whereas microwave (MW) and ultrasound (US) served as green procedures for PE extraction under the factorial-design methodology. Aqueous solvents, extraction-time and power were the main factors in the statistical extraction designs based on Response-Surface Methodology (RSM). Overall, the PE extraction yield was higher (2-to 6-fold) in P. cruentum than in P. purpureum. Moreover, green technologies (US > MW) improved the PE recovery in comparison with the conventional methods for both of the microalgae. The maximum PE yield (33.85 mg/g) was obtained under optimal US conditions (15 min and buffer solvent (PBS)) for P. cruentum. Finally, we proved the biochemical differences between the red microalgae and ratified the advantages of using green extraction for PE because it reduced the processing times and costs and increased the economic and functional-applications of bioactive compounds in the industry.

Graphical Abstract

1. Introduction

The genus Porphyridium belongs to the division Rhodophyta or red algae. Recently, it has received great attention for its potential application in the food, nutraceutical, cosmetic and pharmaceutical industries thanks to its bioactive composition [1,2,3,4]. Particularly, Porphyridium spp. and Spirulina (Arthrospira spp.) are classified as GRAS (Generally Recognized As Safe) by the Food Drug Administration (FDA). They stand out for contributing to the valuable market of phycobiliproteins (phycoerythrin, phycocyanin, and allophycocyanin) and other fluorescent agents. Notably, the market for 2025 is projected to reach US $ 19.0 million for phycocyanin and $ 6.3 million for phycoerythrin [5]. The Porphyridium family provokes controversy in its classification. Some authors consider species such as P. cruentum, P. aerugineum, P. sordidum, P. griseum, P marinum and P. violaceum to be different [4,6]. However, other reports unify all these species in the single P. purpureum or consider P. cruentum and P. purpureum as synonymous [7,8,9]. P. cruentum has been used in different studies with greater frequency than other species. The principal differences between them are related to the chloroplast/phycobilisome composition [6], the location and variety of organelles [10] and the composition of its metabolites [11]. However, this aspect is not very clear.
The algal genus Porphyridium is specifically known for producing phycobiliproteins, polyunsaturated fatty acids (PUFAs) and exopolysaccharides (EPS) [12,13,14]. The phycobiliproteins are a group of colored, water-soluble proteins that constitute the major complex light-harvesting pigments of cyanobacteria, red algae, glaucocystophytes and cryptophytes [12,15]. Phycoerythrin (PE) is the main pigment present in the Porphyridium sp. and it constitutes ~60–80% of the total soluble proteins [16,17]. This phycobiliprotein has a brilliant and intense red/pink color (λmax: 540–570 nm) that exhibits high stability under physiological conditions and displays a great fluorescence [12,16,17]. Moreover, PE is beneficial to human health because of its antioxidant, anti-inflammatory and hepatoprotective properties [18,19]. The antioxidant activity of phycobiliproteins decreases the production of reactive oxygen species (ROS) and reduces the rate of diseases such as cancer, diabetes, inflammation and neurodegenerative diseases [4,18,20].
The genus Porphyridium also produces PUFAs such as eicosapentaenoic acid (EPA, 20:5, ω-3) and arachidonic acid (ARA, 20:4, ω-6) that comprise more than 40% of the total fatty acids [21,22]. They are well known for a variety of health benefits such as blood cholesterol reduction (thus reducing the risks of atherosclerosis), anti-inflammation or as precursors to distinct biologically active groups like the prostaglandins [23,24,25]. The exopolysaccharides (EPS) are also characteristic of the Porphyridium family as constituents of its cell wall [20]. They have a typical sulfated chemical structure capable of providing different biological activities such as immunomodulatory, anti-inflammatory, hypocholesterolemic, antimicrobial and antiviral properties [26,27,28]; antihyperglycemic activity is a recent discovery [28].
Lately, innovative extraction techniques denominated as “green technologies” have emerged as substitutes for conventional extraction procedures. They focus on procuring bioactive compounds from a diversity of natural resources like the microalgae by improving the extraction yields, quality, and purity of the recovered molecules in a safe manner. They also reduce energy consumption and utilize green solvents (GRAS) [29,30,31,32]. Among the many innovative technologies available, the most employed procedures are microwave extraction (MW), ultrasound extraction (US), high-pressure homogenization (HPH), supercritical-fluid extraction (SFE), and accelerated solvent extraction (ASE) (also called pressurized liquid/solvent extraction (PLE/PSE) or subcritical solvent extraction (SSE) [29,33]. In this study, two conventional extraction procedures namely maceration and freeze/thaw were compared with two green technologies, namely microwave (MW) and ultrasound (US), to understand their effects on the extraction yield of PE from Porphyridium spp. Briefly, the MW systems consist of electromagnetic radiation (frequency from 300 MHz to 300 GHz). This energy (heat) is transferred to the solution (biomass-solvent) and provokes the disruption of molecular bonds and migration of dissolved ions. The solvent penetrates the matrix in an augmented manner and facilitates the extraction of the bioactive compounds [33,34]. In contrast, the US method focuses on the cavitation phenomenon [32,35]. Generally, the advantages of using the US technique for molecular extraction include effective mixing and high mass transfer attributed to the significant penetration of the solvent into the sample matrix and a greater surface contact area between the solid-liquid phases [35]. Both processes are advantageous with better processing times, enhanced qualities, reduced chemical and physical risks and environment-friendly natures [32,36].
Thus, considering the debate on the nomenclature of the Porphyridium family, the objective of this work was to compare the biochemical composition in two species of red microalgae and assess the potential of PE yield achieved by conventional extraction (maceration and freeze/thawing) and green extraction techniques (MW and US). Two experimental designs based on Response Surface Methodology (RSM) with factors such as aqueous solvents, extraction-time and power were employed. Therefore, this study would help reinforce the knowledge on the variable bioactive composition of macronutrients such as proteins, carbohydrates, lipids and fatty acids and the phycoerythrin content of the Porphyridium genus and its use as the producer of high-value metabolites in the healthy living market.

2. Materials and Methods

2.1. Biomass and Chemicals

The microalgae Porphyridium cruentum (CIB 77 from CIBNOR [37], La Paz, Mexico) and Porphyridium purpureum (CCAP 1380/3 from Swansea University, Wales, United Kingdom) selected for this research were kind donations from the Mexican Company “Microalgas Oleas de México S.A.” (Guadalajara, Mexico). The microalgae were cultured under the F/2 culture medium as in Guillard [38] and harvested at the end of the exponential growth. These microalgae were provided freeze-dried (freeze-dry system Labconco Freezone 18 L Benchtop Freeze Dry System, Kansas City, MO, USA) and packed in vacuum-sealing plastic bags and stored at 4 ± 2 °C in darkness until use. Three solvents were used to extract phycoerythrin (PE) from the Porphyridium spp.: (i) PBS: 50 mM Na-phosphate buffer (pH 7.0), (ii) DW: distilled water, and (iii) CCS: 1.5% w/v calcium chloride solution. All solutions were of analytical grade. The standard solutions of BSA (protein analysis) and glucose (carbohydrate determination) were purchased from Sigma-Aldrich (Santiago, Chile). For fatty acid identification and quantification, a standard fatty acid methyl ester (FAME) mix, C4–C24, supplied by Supelco Analytical (Bellefonte, PA, USA) was used, and tripentadecanoin > 99% (Nu-Check Pre, Inc., Elysian, MN, USA) was employed as the internal standard.

2.2. Macronutrient Analysis

The protein content was analyzed colorimetrically and measured on a spectrophotometer (Shimadzu Ultraviolet-Visible (UV-Vis) 1280, Kyoto, Japan) using the Lowry method [39], with BSA (bovine serum albumin) solutions for the standard curve (0.0–2.0 mg/mL). The results were expressed as the percentage of total proteins with respect to their dry biomass (% w/w) and were presented as the average of triplicate analyses (n = 3, ±SD). Total carbohydrate analysis was performed according to modified Dubois et al. [40] and Geresh et al. [41] using a series of glucose solutions as the standard (0.0–1.0 mg/mL). The biomass used for carbohydrate measurement was subjected to acid hydrolysis for cell rupture. Briefly, 20 mg of the dry biomass was incubated in 5 mL of 2.5 M HCl for 3 h at 100 ºC (Spectroquant Thermoreactor TR 320, Merck, Darmstadt, Germany). This mixture was neutralized with 5 mL of 2.5 M NaOH to obtain the microalgal extract. Finally, aliquots of 278 μL extract, 167 μL phenol solution (5% w/v), and 1000 μL concentrated sulfuric acid were incubated for 30 min at room temperature, and the absorbance of these samples was measured at 483 nm on the microplate reader (Synergy HTX Multi-Mode microplate reader, software Gen5 2.0, BioTek Instruments, Winooski, VT, USA). The results were expressed as the percentage of total carbohydrates with respect to the dry biomass (% w/w) and were presented as the average of triplicate analyses (n = 3, ±SD). Total lipids were obtained using the method of Axelsson et al. [42]. The dry biomass of each Porphyridium sp. (~20 mg) was resuspended in chloroform:methanol (2:1, v/v) by manually shaking the tube vigorously for a few seconds or until the biomass was dispersed in the solvent system. Finally, a 0.73% (w/v) NaCl water solution was added to produce a 2:1:0.8 system of chloroform:methanol:water (v/v/v). The total lipids were then calculated gravimetrically in triplicate (n = 3, ±SD). The previous evaporation with N2 was performed on the Flexivap Work Station (Glas-Col 109A YH-1, Terre Haute, IN, USA). It was expressed as the percentage of total lipids with respect to the biomass (% w/w).

2.3. Fatty Acid Composition

The extraction of fatty acid methyl esters (FAMEs) was performed according to ISO-5508 [43]. The reaction mixture was prepared by adding 50 mg of the freeze-dried biomass of each Porphyridium sp. with biomass:solvent ratio of 1:30 and 10 ppm of the internal standard with continuous agitation. The flasks were then washed with 3 mL of hexane and Milli-Q water until the solution turned neutral; the mixture was separated into two layers by centrifugation (360× g, 10 min). The upper oil layer (FAMEs diluted in hexane) was transferred to an amber vial for analysis and quantification through gas chromatography (Shimadzu GC-2010, Tokyo, Japan). The system was equipped with a flame ionization detector (FID) and a split/splitless injector. Samples (1 µL) were injected into a RESTEK capillary column (30 m. ID. 0.32 mm., d.f. 0.25 μm film thickness). The injector temperature was maintained at 250 °C in the split mode with a split ratio of 1:20. Nitrogen was used as the carrier gas at a constant flow rate of 1.25 mL/min. The oven temperature was programmed initially at 80 °C for 5 min, then increased to 165 °C at the rate of 4 °C/min for 2 min, and further increased to 180 °C at the rate of 2 °C/min for 5 min. Next, it was heated at the rate of 2 °C/min to 200 °C for 2 min followed by increasing at the rate of 4 °C/min to 230 °C for 2 min. After reaching 250 °C at the rate of 2 °C/min, the solution was finally maintained at this temperature for 2 min. The detector temperature was maintained at 280 °C. Individual FAMEs were identified by comparing their retention times with those of the mixed FAME standards (FAME Mix C4–C24, Supelco Analytical). They were quantified by comparing their peak areas with those of the mixed FAME standards and that of an internal standard (tripentadecanoin ~10 ppm/sample).

2.4. Phycoerythrin (PE)

For estimating the yield of phycoerythrin (PE) extraction, crude extracts obtained from different extraction procedures of each red microalga were utilized as described below. They were measured using a Shimadzu Ultraviolet–Visible (UV–Vis) 1280 (Shimadzu, Kyoto, Japan) spectrophotometer under Bennett et al. [44] equations. Further, the PE extraction yield (w/w) was calculated using the following Equation (1):
PE mg g = PE   concentration × V dW
where PE is the crude phycoerythrin (in mg/mL) obtained under the Bennett and Bogorad formulae, V is the volume of the solvent (in mL) and dW represents the dry biomass (in grams) used in each extraction procedure.

2.5. Conventional Extraction of Phycoerythrin

2.5.1. Maceration

For extraction, 20 mg each of the dry biomass of the two Porphyridium sp. were mixed with 5 mL of each solvent and subjected to repeated maceration, extraction and vortexing (Velp Scientifica Mixer-Wizard, Usmate, Italy) for proper mixing. The cell debris was removed by centrifugation (Swing Rotor Bench-top centrifuge, Champion S-50D, Vernon Hills, IL, USA) at 3140× g for 5 min. The centrifugation was repeated until the solvent was colorless. The supernatants were pooled and labeled as the crude extract. This procedure was performed in triplicate (n = 3, ±SD).

2.5.2. Freeze–Thaw

The dry biomass of Porphyridium sp. (20 mg per microalgal sample) was resuspended in 5 mL of each solvent and subjected to repeated freeze–thaw cycles (Freezer Daewoo FR385s, Gangnam-gu, Seoul, Korea) of −22 ± 2 °C and 20 ± 2 °C temperature shocks for the release of PE. The cell debris was removed by centrifugation at 3140× g for 5 min. The centrifugation was repeated until the solvent was colorless. The supernatant was pooled and labeled as the crude extract. This was performed in triplicate (n = 3, ±SD).

2.6. Green Extraction Design for Phycoerythrin

2.6.1. Microwave (MW)

The microwave process was performed using a domestic microwave oven (Fensa MF-28G, Valparaíso, Chile) capable of operating at a maximum input of 1000 W at a frequency of 2450 MHz. For this, 20 mg each of P. cruentum and P. purpureum were extracted with 5 mL of each solvent several times until the supernatant was colorless. The aliquots were then centrifuged at 3140× g for 5 min. To optimize the MW extraction conditions, a factorial experimental 33 design based on three factors with three levels each was employed as follows: power (100, 200, and 300 W), extraction time (15, 30, and 60 s) and solvent type (PBS, DW, and CCS). The effect of these factors and their interactions on the specific response (the PE content in each red microalgal strain) was studied by preparing a total of 81 experiments (n = 3, ±SD) as shown in Table 1.

2.6.2. Ultrasound (US)

This process was performed using an ultrasound probe system (UP 100H, Hielscher Company, Teltow, Germany) with an operating frequency of 30 kHz. The theoretical maximum amplitude was maintained at 100% (100 W) in the continuous mode, and the temperature was controlled (30 ± 2 °C) using a water bath. For this experiment, 20 mg each of the dry biomass of the two Porphyridium spp. were mixed with 5 mL of each solvent for performing several extractions until the supernatant was colorless. The aliquots were then centrifuged at 3140× g for 5 min. The schematic of the US experimental setup is illustrated in Table 2. It was performed using a factorial experimental 32 design based on two factors with three levels each as follows: extraction-time (5, 10, and 15 min) and solvent type (PBS, DW, and CCS). The effect of the factors and their interactions on the specific response of PE content in each red microalgal strain was studied by preparing a total of 27 experiments (n = 3, ±SD), as shown in Table 2.

2.7. Statistical Analyses

The Statgraphics Centurion XVI® Statistics software (StatPoint Technologies, Inc., Warrenton, VA, USA) was employed for data elaboration and statistical analysis using a level of significance established at 95%. One-way analysis of variance (ANOVA), together with the Student–Newman–Keuls test, was employed for group extracts based on statistically significant differences. The experimental design and data analysis were carried out using response surface methodology (RSM). The effects of the independent factors on the response variables in the separation process were assessed using the pure error by considering a level of confidence of 95% for all the variables. The effect of each factor, and its statistical significance for each of the response variables, was analyzed from the standardized Pareto chart. The response surfaces of the respective mathematical models were also obtained, and the significance was accepted at p ≤ 0.05. The regression equation and ANOVA were also performed for the US and MW techniques (see Supplementary Materials). All experiments were carried out in triplicate (n = 3), and the data were represented as mean ± SD (standard deviation).

3. Results and Discussion

3.1. Biochemical Composition and Phycoerythrin Extraction Yield from Porphyridium spp.

The biochemical (macronutrient) composition of the two studied Porphyridium spp. in comparison with other Porphyridium species described previously is shown in Table 3. The protein content of P. cruentum was two-fold higher than that of P. purpureum. However, the carbohydrate and lipid contents were similar in these two microalgae. In general, other reports showed similar proximal compositions to that of the Porphyridium spp. The proximal ranges described by Becker [45] are broader than those reported in other studies; the exception was in the carbohydrate content (more than two-fold compared to our data, 40–57%, w/w). Assunção et al. [46] defined the nutritional characterization of P. purpureum and Ruttnera lamellosa (Haptophyceae) and obtained similar content of proteins (15.08 ± 0.02% dry weight) as reported in our results. However, Assunção et al. [46] observed different values for lipid content (1.73 ± 0.13% dry weight) and carbohydrate content, calculated as the nitrogen-free extract (NFE) (63.69 ± 0.40% dry weight). They associated this high content of carbohydrate with a low amount of lipids because the available carbon was directed toward carbohydrate metabolism rather than lipid metabolism [47]. Moreover, Matos et al. [48] and Niccolai et al. [49] tested several microalgae for potential food applications. They respectively cultivated P. cruentum and P. purpureum F&M-M under nutrient-replete media and found the macronutrient composition within the range of our study. The lipid content was the only nutrient that was approximately three-fold less than the value reported by Matos et al. [48]. Thus, these results demonstrate the variability in the macronutrient composition for members of the Porphyridium family; it is a very versatile genus for a multitude of industrial applications.
Table 3 also shows the fatty acid profile of the studied Porphyridium spp. versus other algae. The highest percentage of monounsaturated fatty acids (MUFA) was contributed by C18:0 (stearic acid, >50% of the total fatty acids) in P. purpureum; this was followed by C16:0 (palmitic acid, 29.01–41.02%) in both the Porphyridium strains. P. cruentum contained a higher content (>18% of total fatty acids) of ω6-PUFA, mainly contributed by arachidonic acid (ARA, C20:4 ω-6). However, the amount of ARA was only around 2% in P. purpureum. Among ω3-PUFAs, the content of eicosapentaenoic acid (EPA, C20:5 ω-3). The percentage of total fatty acids was 10-fold more in P. cruentum than in P. purpureum. The profiles of other fatty acids of the Porphyridium strains are reported in Table 3. They were comparable with our strains and showed similar profiles. For P. cruentum, Di Lena et al. [50] described a fatty acid profile highlighted by the presence of ARA and EPA (refer Table 3, 18.02 and 15.88% of fatty acid, respectively) in the genus Porphyridium. Assunção et al. [46] obtained a similar profile of fatty acids in P. purpureum, wherein stearic acid stood out as the major fatty acid (52.78 ± 2.82%). Conversely, the fatty acid profile described by Harwood [51] was very different from that described for the Porphyridium strains in this study. Arachidonic acid and eicosapentaenoic acid are the main PUFAs of the Porphyridium family that are nutritionally necessary [48]. Particularly, the presence of ARA in the fatty acid profile increases the production of prostaglandin E2 (a class of hormone-like substances that participate in a wide range of bodily functions), thromboxane and leukotriene [52]. For these reasons, the genus Porphyridium is attractive for nutrition applications because these microalgae can synthesize high amounts of EPA and ARA acids and thus can be used to enrich functional foods with ω-3/6 fatty acids and thus improve the human-cell functioning.
In this study we also assessed (refer Table 4) the potential of PE yield reached by conventional extraction such as maceration (soaking in solvent) and freeze–thawing procedures from both red microalgae. Numerous reports have described the preferred solvents for phycobiliprotein extraction, such as phosphate buffer, pure water, ammonium chloride, CaCl2 solution and ionic liquids, among others [17,53,54]. Table 4 shows significant differences in PE yield when varied solvents were used for the two Porphyridium species. The maximal PE extraction yield obtained from P. cruentum was three-fold greater than that from P. purpureum. The difference was more significant (10-fold) when CCS (1.5%, w/v) was used as the extractant. On the other hand, extraction using PBS and DW showed similar yields. In general, the PE extraction yield obtained using conventional methods was consistent with that reported in the literature. For example, Osório et al. [55] determined several pigments from different commercial dried algae such as Porphyra spp. (red seaweed) and Arthrospira spp. (blue-green alga). They extracted two phycobiliproteins with PBS (pH = 6.8) by the conventional method. The content of phycoerythrin was slightly higher in Porphyra spp. (8.32 ± 0.29 mg/g) than in Arthrospira spp. (8.18 ± 0.30 mg/g); the difference was not significant (p > 0.05). Our PE values were almost double of these values (Osório, et al.) when PBS or DW was used as the extractant. Other groups optimized the culturing conditions for enhanced production of bioactive compounds from microalgae. Wang et al. [56] defined a uniform design method and regression analysis for investigating the effects of initial pH, light, intensity, inoculation ratio and liquid volume in the flask on the optimal biomass, exopolysaccharide (EPS), and PE production of Porphyridium cruentum in batch culture (at the laboratory scale). Under optimal conditions, they predicted a PE production of 123.0 mg/L (equivalent to 37.39 mg/g with respect to dry biomass). Xu et al. [57] also worked under an induced cultivation pattern for PE biosynthesis from P. purpureum. Their results revealed an improved PE extraction yield with a value of approximately 3.05% (w/w) of the dry biomass. Here, the extractant used was 0.1 M PBS (pH 7.0) and the cultivation period was reduced from 18 to 12 days for enhancing the production efficiency.
Thus, phycobiliproteins are water-soluble and very stable at physiological pH; their pH stability exists between 5.0 and 7.0. They are proteins, and many factors, such as extreme pH, high ionic strengths, elevated temperatures, and alcohol concentrations, are unfavorable and could affect their molecular structure [17,58]. For these reasons, the selection of a solvent for extraction such as PBS or water is primordial. On the other hand, conventional methods have been described for extracting a part of the total phycocyanin from microalgae because of the potential resistance offered by the cell wall for its disruption (increasing with dry biomass as in our case). However, the freeze-thaw method can improve the phycobiliprotein recoveries by enhancing the cell wall disruption. Conversely, these conventional methods are time-consuming and require high energy. They could be useful for small-scale extractions of bioactive compounds, but they can be costly when the production scale is increased [59].

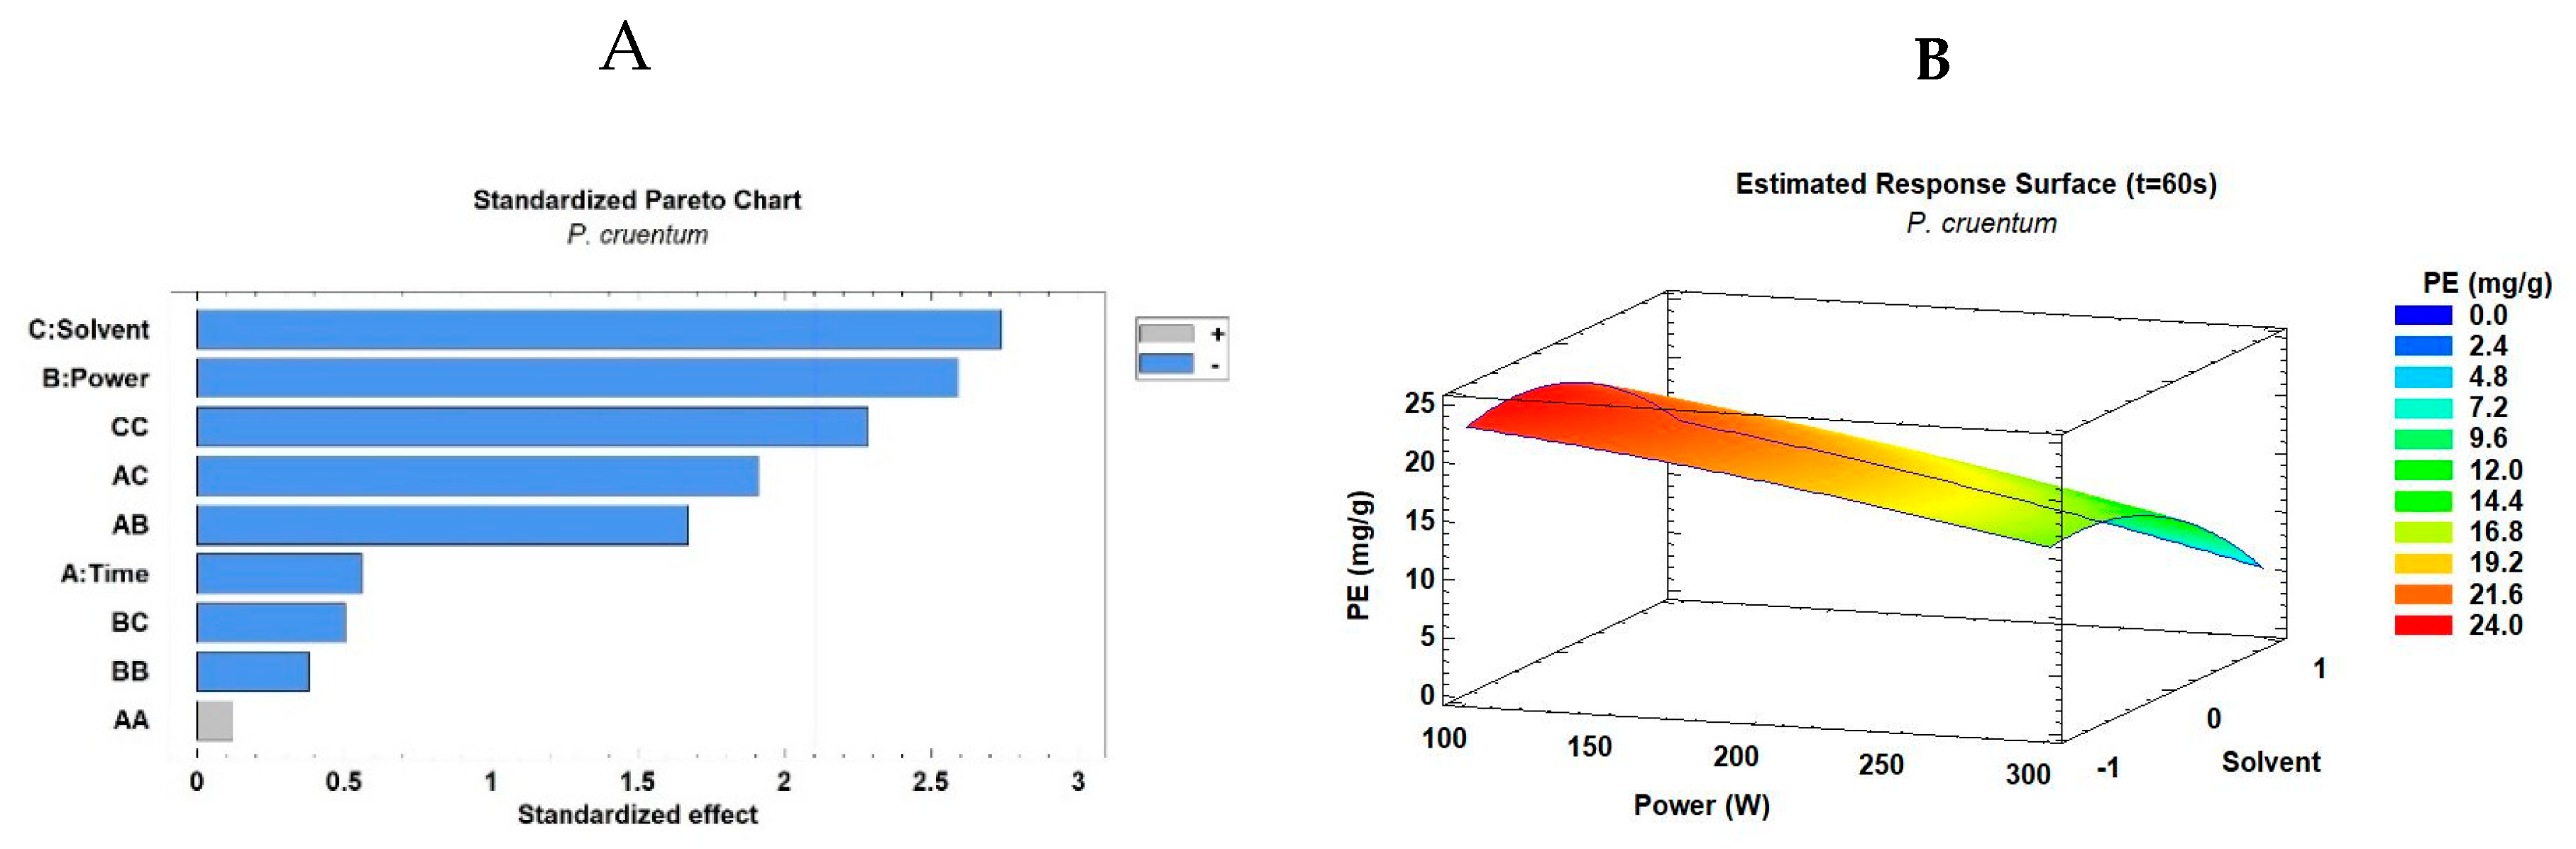
3.2. Microwave Extraction of Phycoerythrin from Porphyridium spp.

The microwave method (MW) has been described as an innovative alternate technology for the extraction of bioactive molecules from natural sources. Here, microwave experiments were based on 33 factorial design to evaluate the PE extraction yield from Porphyridium spp. As shown in Table 1, the factors were three with three levels each such as extraction time (30, 45, and 60 s), power (100, 200 and 300, W) and solvent (PBS (−1), DW (0) and CCS (1)). The microwave data complement the supplementary material (data shown in Table S1). The optimum PE extraction yield in P. cruentum (23.59 mg/g) was obtained after microwaving for 60 s at 100 W and using a mixture of solvents PBS+DW (56:44, v/v).
In fact, Figure 1 A,B shows the Pareto Chart and Response surface curve based on Response Surface Methodology (RSM), respectively. It depicts the combined effects of extraction time, power and solvents on PE extraction from P. cruentum. Power and solvent (included its quadratic form) were the significant variables in the MW procedure. The recovery of this bioactive compound was favored under a longer extraction time at low power and using an extractant similar to PBS (Figure 1B). Although in this case, since the value of R2 was 0.61 (refer Supplementary Materials Table S1) for PE extraction by the MW model, it could be accepted since it represents the tendency of data. However, the results were slightly different in P. purpureum. The optimum PE extraction yield was lower (8.21 mg/g). The optimal extraction conditions were different in P. purpureum such as an extraction time of 60 s, power of 200 W, and a mixture of similar solvents of PBS+DW (54:46, v/v). Separately, Figure 2 A,B shows the Pareto Chart and Response surface curve from P. cruentum, respectively. Here, the solvent and its quadratic form were the significant variables in the process. An intermediate extraction time and power were the best conditions to extract PE from P. purpureum using the MW method (Figure 2B). The model fitted showed a higher R2 value of 0.80 (see Supplementary Materials Table S1) for the extraction of PE from P. purpureum, favoring the predictability in the MW process for this species. However, the nature of the solvent was similar in both microalgae.
The trend of PE extraction yield from both red microalgae was similar in the MW process than that under conventional extraction. The PE extraction yield of P. cruentum was three-fold superior to that of P. purpureum, again favoring the differences between both species. In all cases, the PE extraction yield was superior in the MW methods than under conventional techniques such as maceration and freeze-thaw. Particularly, the differences were more significant in P. purpureum than in P. cruentum; the yield was two-fold more with all solvents in the MW method. Other groups have worked with microwave technology for phycobiliprotein extraction. Juin et al. [60] employed microwave-assisted extraction (MAE) to obtain phycobiliproteins from P. purpureum (freeze-dried cells and deionized water as the extractant). The maximal PE extraction yield (73.7 ± 2.3 mg/g) was obtained after 10 s at 40 °C. Their results were higher than the PE values observed here. Moreover, they proved that increasing the irradiation time to 5 min at 40 °C had no impact on the PE extraction yield. Our results indicated that all extractable PE was recovered during the intermediate-low power at 30–60 s of microwave irradiation. On the other hand, Zhao et al. [61] demonstrated specific effects on the stability of astaxanthin standard using MW and US extraction techniques. Firstly, MW induced the conversion of (all-E)-astaxanthin to its Z forms, preferentially to (13Z)-astaxanthin, while the US degraded this pigment into colorless compounds because of cavitation produced in the solvent by the propagation of ultrasonic waves. In these extraction procedures, the role played by the screening and optimization of statistical designs is very important. These kinds of designs can examine qualitative, quantitative and mixer-related factors and simultaneously improve the optimal extraction conditions of the bioactive compounds [62]. Finally, the literature indicates that phycobiliproteins can be efficiently extracted from algae using MW as an innovative technology because it provides high extraction yields and reduces the extraction time [60].

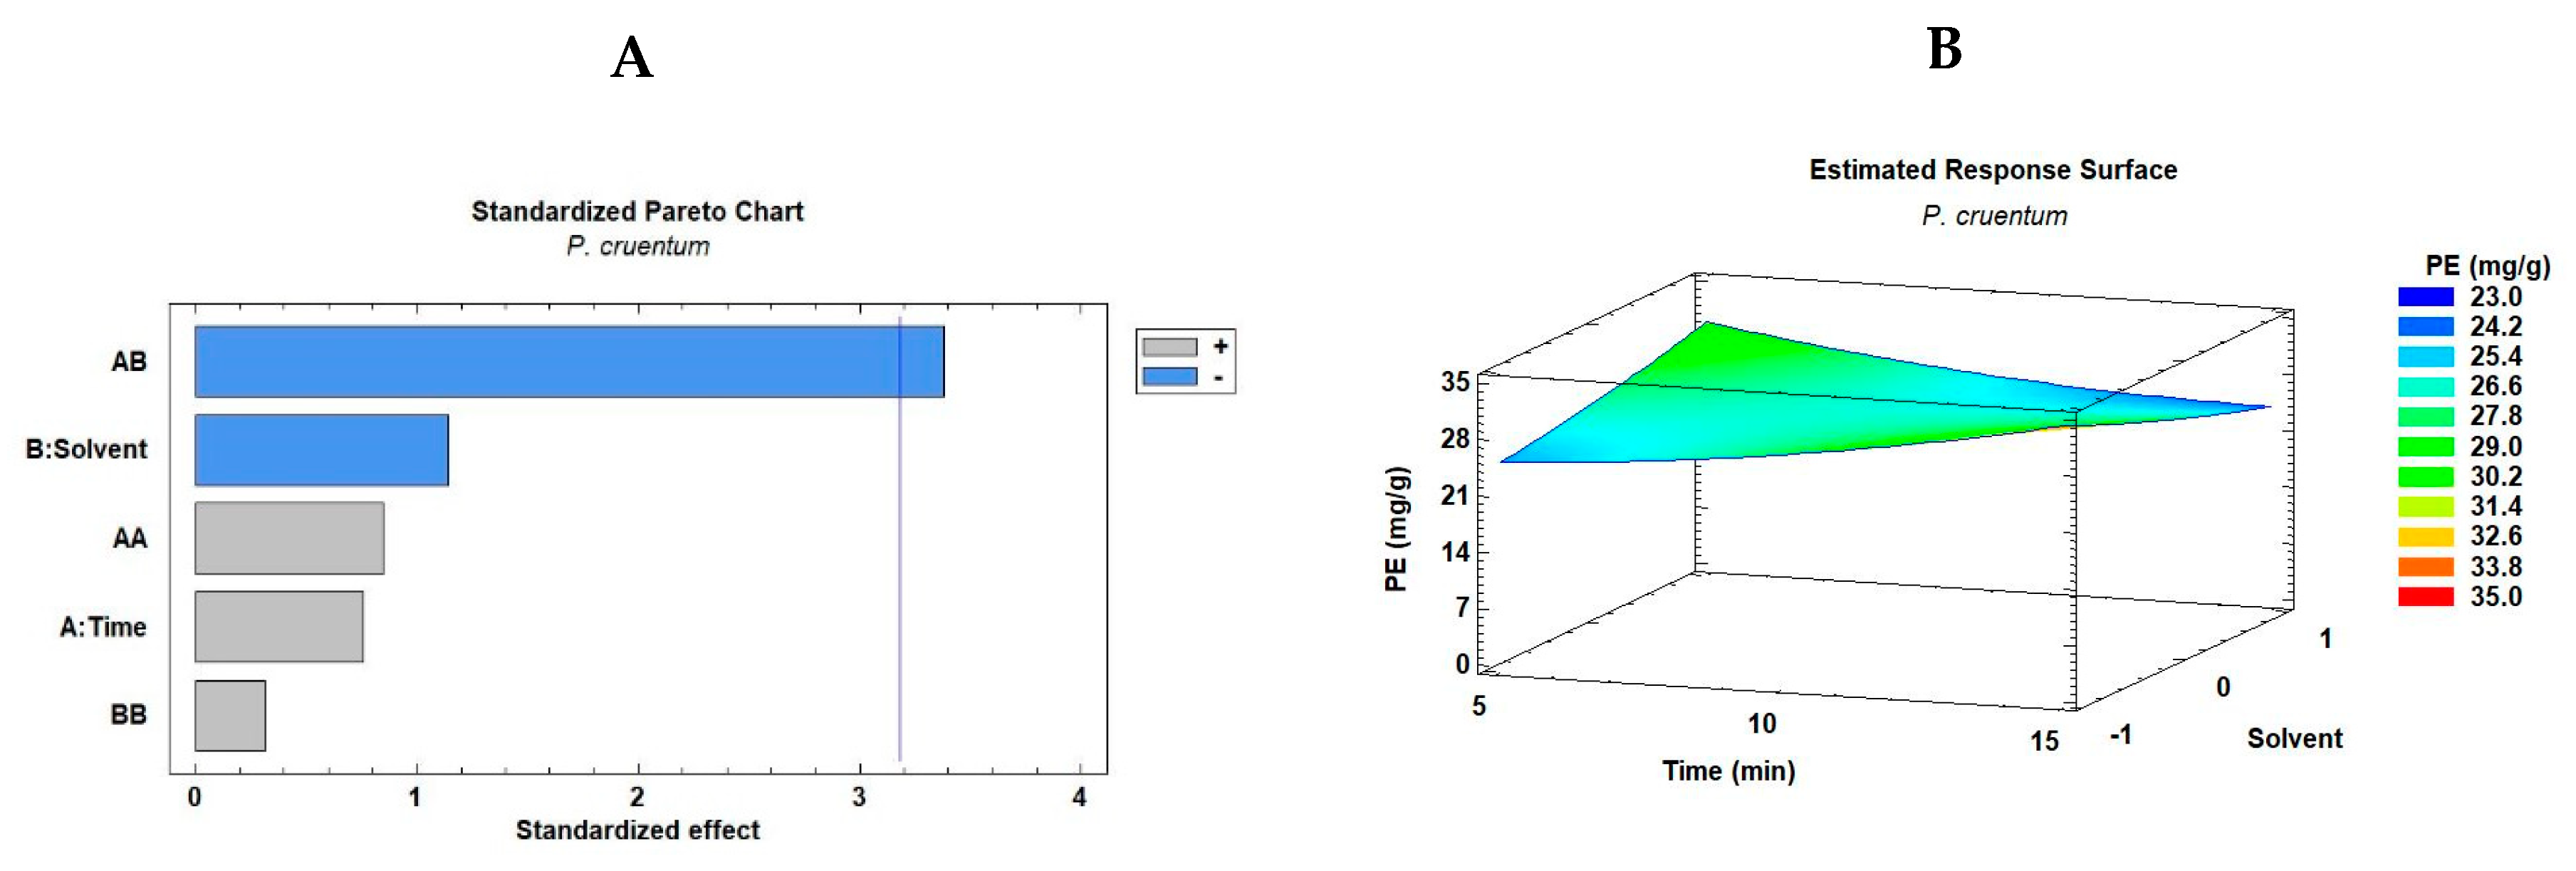
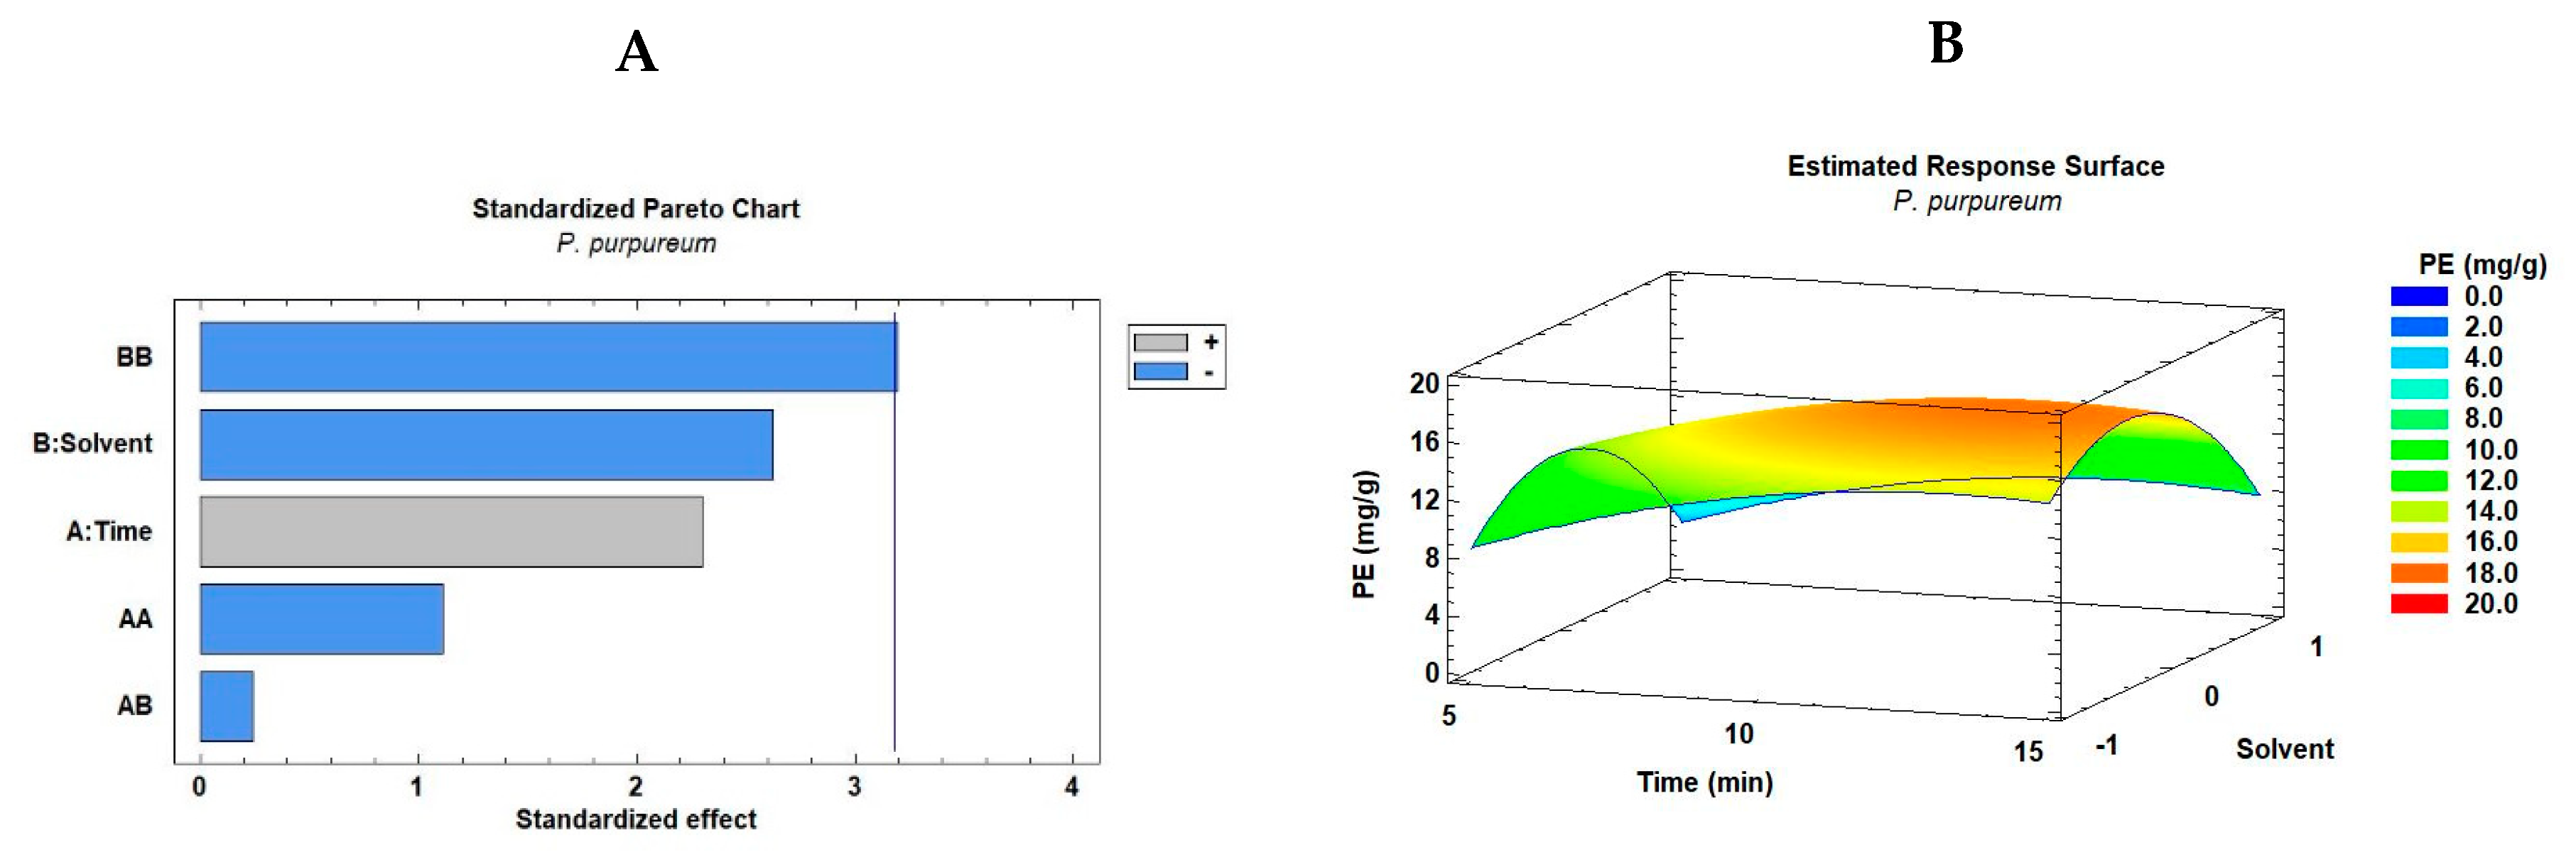
3.3. Ultrasound Extraction of Phycoerythrin from Porphyridium spp.

Recently, US has been preferred in most extraction studies involving phycobiliprotein recovery because of the effect of cavitation caused by the ultrasound waves at the surface of the cell wall; these waves help to disrupt the cell wall and favor the release of the intracellular contents in a few minutes. Besides that, the application of an experimental design is an operative way to identify and optimize the significant factors and to achieve a competent result with few experimental trials [62]. On this occasion, the 32 factorial design was performed to enhance the conditions of PE extraction yield from Porphyridium spp. by the US procedure (refer to Table 2). Two factors were used with three levels, such as extraction time (5, 10, and 15 min) and solvent (PBS (−1), DW (0) and CCS (1)) under 100% amplitude (100 W) in the continuous mode. The optimal extraction time predicted by the statistical software was similar in both Porphyridium spp. (greater extraction time such as 13–15 min). However, the optimal solvent employed was different for both microalgae. The PE extraction yield improved in P. cruentum by using 100% PBS while P. purpureum preferred a solvent similar to DW (25:75 PBS + DW, v/v). The optimal PE extraction yield from P. cruentum was 33.85 mg/g; this was almost two-fold more than that of P. purpureum. Experimentally, more PE content (around three-fold higher) was extracted from P. cruentum than from P. purpureum under the same extraction conditions (Table 2).
On the other hand, Pareto charts and response surface curves (Response Surface Methodology (RSM)) depicting the combined effects of extraction time and solvent are described in Figure 3 and Figure 4A,B. Moreover, these figures complement the supplementary material (Table S2), where the ANOVA and regression coefficients of PE extraction yield by US extraction are shown. Figure 3 A,B describes the Pareto charts and Response Surface curves from P. cruentum, respectively. Particularly, Figure 3A demonstrated that the solvent interaction time was the unique significant factor in the US procedure for PE yield. The other individual factors were not significant in the extraction process. Figure 3B represents “surface” as the response of the factorial experimental design with the factors being extraction time and three types of aqueous solvents for optimizing PE extraction in P. cruentum. The area with the major PE extraction yield (32.63 ± 1.09 mg/g) was achieved using PBS as the solvent and maximum extraction time. DW followed closely as the extractant in the same extraction time (31.05 ± 0.20 mg/g).
Conversely, Figure 4A indicated that the quadratic solvent factor was the unique significant element in the PE extraction process by US technology in P. purpureum. The RSM (Figure 4B) demonstrated the orange/red area wherein maximal PE extraction was observed from P. purpureum under a longer extraction time and using a mixture of solvents PBS+DW (optimal value of 17.70 mg/g). The coefficient of determination (R2) defines the reliability in the data accounted for by the statistical models. P. cruentum and P. purpureum were adjusted suitably with values of R2 = 0.83 and 0.89, respectively (refer Supplementary Materials Table S2).
As previously described, the main advantages of using ultrasound energy for molecular extraction are an efficient and fast mixing of the biomass-solvent and high mass transfer [35]. The mechanical effects (cavitation combined with an increased mass transfer) provoke significant destruction of the cells and enhance intracellular product recovery into the solvent. In the review described by Mason et al. [36], the advantages and differences between US and MW as extraction processes are explored. Both techniques offer different approaches in that US is generally used to improve conventional solvent extraction, whereas MW is known for its ability to remove constituents via heating without solvents. Moreover, for large-scale extraction, the US is a proven technology, and the scale-up of MW is in the development stage. In general, our results on PE extraction yield were two-fold superior using US compared to MW for both microalgae. Specifically, using PBS and DW as the PE extractant, more differences were noted in the extraction yield. Comparing data obtained from conventional methods, the PE yield in P. purpureum improved greatly when CCS was the solvent; this increment was around three-fold superior to that obtained using the freeze–thaw method and eight-fold superior to that using maceration.
With respect to green extraction studies on other phycobiliproteins from algae, İlter et al. [63] worked with several removal methods for optimizing the phycocyanin (PC) extraction from Arthrospira platensis. They used classical, ultrasound and microwave procedures. Particularly, PC extraction was significantly influenced by the extraction time in all the above methods; this was similar to our US results. They obtained the maximum PC yield (102.97 mg/g) at 25 min. Mittal et al. [64] focused on optimizing the methodology for the extraction of PE and PC from marine macroalgae Gelidium pusillum. They used the US and other conventional methods independently and in combination. The best phycobiliprotein extraction efficiency was achieved by the combination of US and maceration methods provoking synergistic effect (77 and 93% of PE and PC, respectively). Conversely, the US resulted in a very low phycobiliprotein yield when used in isolation compared to serial extraction. Finally, the US method (acoustic cavitation) demonstrated that it easily breaks the tissues, and advantages the thermal effects and cell microstructure. Together, it enhances the penetration of the solvent into cells and instantly releases bioactive compounds into the surrounding environment.

4. Conclusions

In this study, we assessed the macronutrient composition and fatty acid profiles from two strains belonging to the genus Porphyridium. Moreover, the role played by different extraction technologies in phycoerythrin (PE) recovery was evaluated. The conclusions of this study are (1) P. cruentum and P. purpureum demonstrated different biochemical compositions, although some authors unified both species. A profile rich in proteins and omega 3/6 (EPA and ARA) fatty acids was highlighted in P. cruentum. The presence of a higher lipid content and a saturated fatty acid profile (C16:0 and C18:0, palmitic and stearic acids, respectively) was more marked in P. purpureum. Thus, we proved that this algal genus highlighted the presence of several bioactive compounds, albeit in different proportions. Next, we also extracted PE from both Porphyridium spp. using various extraction methods (conventional: maceration and freeze/thawing; green: microwave (MW) and ultrasonication (US)). The effects of the process variables of extraction such as extraction time, power, and solvent (PBS: 50 mM Na-Phosphate buffer solution (pH 7.0), DW: distilled water and CCS: 1.5% w/v calcium chloride solution) were investigated under a factorial statistical design. (2) The PE extraction yield from P. cruentum was superior to that from P. purpureum under all extraction methods. In each process, the most significant factor was the solvent variable; PBS or DW (or their mixture) was the most appropriate extractant compared to CCS. Moreover, the US was the most effective method in PE extraction for both microalgae (between two-six-fold greater PE extraction yields). The optimum contents under US extraction were 33.85 mg/g and 23.59 mg/g for P. cruentum and P. purpureum, respectively. (3) A factorial design based on Response Surface Methodology (RSM) proved to be an operative and useful model demonstrating a good agreement between the experimental and optimal conditions. This model helped achieve maximum yields with the consumption of minimum time and resources during the optimization of PE extraction. According to these results, we would propose the US method as the most appropriate in the extraction of the bioactive compounds present in both red microalgae. Moreover, this method reached better contents of these molecules and the statistical model adjusted better in the predictability (average R2 = 0.86) found for PE of both Porphyridium spp. Henceforth, the selection of algal species along with the type of solvent and extraction technology should be determined considering the targets of the extraction processes so that costs are reduced and the bioactive applications of microalgae are increased in the industry.

Supplementary Materials

The following are available online at https://www.mdpi.com/2227-9717/8/12/1628/s1, Table S1: Regression coefficients (values of variables are specified in their original units) of phycoerythrin (PE) extraction yield by microwave extraction (MW) from Porphyridium spp., statistics for the fit obtained by multiple linear regression., and Table S2: Regression coefficients (values of variables are specified in their original units) of phycoerythrin (PE) extraction yield by ultrasound extraction (US) from Porphyridium spp., statistics for the fit obtained by multiple linear regression.

Author Contributions

Conceptualization, M.C.R.-D.; methodology, P.A. and M.C.R.-D.; software, P.A., P.C.-M. and M.C.R.-D.; validation, M.C.R.-D.; formal analysis, P.A., P.C.-M. and M.C.R.-D.; investigation, P.A., F.S.-F., and D.Ó.; resources, G.R.; data curation, P.A.; writing—original draft preparation, M.C.R.-D.; writing—review and editing, P.C.-M.; funding acquisition, M.C.R.-D. All authors have read and agreed to the published version of the manuscript.

Funding

This research was funded by several projects belonging to national public resources ANID (National Agency for Research and Development of Chile) and the University of Antofagasta. They are codified as PAI-79160037, FONDECYT-11170017, and Undergraduate Thesis Scholarship Fund-649/19, respectively.

Acknowledgments

Our research group “LAMICBA” sincerely thanks the Department of Biotechnology Research belonging to “Empresa Microalgas Oleas de México S.A.” from Guadalajara (Mexico) for kindly providing the microalgae samples.

Conflicts of Interest

The authors declare no conflict of interest

References

  1. Bernaerts, T.M.; Kyomugasho, C.; Van Looveren, N.; Gheysen, L.; Foubert, I.; Hendrickx, M.E.; Van Loey, A.M. Molecular and rheological characterization of different cell wall fractions of Porphyridium cruentum. Carbohydr. Polym. 2018, 195, 542–550. [Google Scholar] [CrossRef] [PubMed]
  2. Patel, A.K.; Laroche, C.; Marcati, A.; Ursu, A.V.; Jubeau, S.; Marchal, L.; Petit, E.; Djelveh, G.; Michaud, P. Separation and fractionation of exopolysaccharides from Porphyridium cruentum. Bioresour. Technol. 2013, 145, 345–350. [Google Scholar] [CrossRef] [PubMed]
  3. Li, T.; Xu, J.; Wu, H.; Jiang, P.; Chen, Z.; Xiang, W. Growth and biochemical composition of Porphyridium purpureum SCS-02 under different nitrogen concentrations. Mar. Drugs 2019, 17, 124. [Google Scholar] [CrossRef] [PubMed] [Green Version]
  4. Li, S.; Ji, L.; Shi, Q.; Wu, H.; Fan, J. Advances in the production of bioactive substances from marine unicellular microalgae Porphyridium spp. Bioresour. Technol. 2019, 292, 122048. [Google Scholar] [CrossRef] [PubMed]
  5. Global Forecast to 2025. Algal Pigments Market by Type (Beta Carotene, Astaxanthin, Fucoxanthin, Phycocyanin, Phycoerythrin), Application (Food and Beverages, Nutraceuticals, Aquaculture, Cosmetics, Pharmaceuticals), and Geography MRFB-104360; Meticulous Market Research Pvt. Ltd.: Maharashtra, India, 2020; p. 150. [Google Scholar]
  6. Ott, F.D. A brief review of the species of Porphyridium with additional records for the rarely collected alga Porphyridium sordidum Geitler, 1932 (rhodophycophyta, porphyridiales). Arch. Protistenkd. 1987, 134, 35–41. [Google Scholar] [CrossRef]
  7. Guiry, M. Macroalgae of Rhodophycota, Phaeophycota, Chlorophycota, and two genera of Xanthophycota. Collect. Patrim. Nat. 2001, 50, 20–38. [Google Scholar]
  8. Bhattacharya, D.; Price, D.C.; Chan, C.X.; Qiu, H.; Rose, N.; Ball, S.; Weber, A.P.M.; Cecilia Arias, M.; Henrissat, B.; Coutinho, P.M.; et al. Genome of the red alga Porphyridium purpureum. Nat. Commun. 2013, 4, 1941. [Google Scholar] [CrossRef] [Green Version]
  9. Barozai, M.Y.K.; Qasim, M.; Din, M.; Achakzai, A.K.K. An update on the microRNAs and their targets in unicellular red alga Porphyridium cruentum. Pak. J. Bot. 2018, 50, 817–825. [Google Scholar]
  10. Neushul, M. A Freeze-Etching Study of the Red Alga Porphyridium. Am. J. Bot. 1970, 57, 1231–1239. [Google Scholar] [CrossRef]
  11. Medina-Cabrera, E.V.; Rühmann, B.; Schmid, J.; Sieber, V. Characterization and comparison of Porphyridium sordidum and Porphyridium purpureum concerning growth characteristics and polysaccharide production. Algal Res. 2020, 49, 101931. [Google Scholar] [CrossRef]
  12. Román, R.B.; Alvarez-Pez, J.; Fernández, F.A.; Grima, E.M. Recovery of pure B-phycoerythrin from the microalga Porphyridium cruentum. J. Biotechnol. 2002, 93, 73–85. [Google Scholar] [CrossRef]
  13. Geresh, S.; Arad, S.M.; Levy-Ontman, O.; Zhang, W.; Tekoah, Y.; Glaser, R. Isolation and characterization of poly-and oligosaccharides from the red microalga Porphyridium sp. Carbohydr. Res. 2009, 344, 343–349. [Google Scholar] [CrossRef] [PubMed]
  14. Akimoto, M.; Shirai, A.; Ohtaguchi, K.; Koide, K. Carbon dioxide fixation and polyunsaturated fatty acid production by the red alga porphyridium cruentum. Appl. Biochem. Biotechnol. 1998, 73, 269–278. [Google Scholar] [CrossRef]
  15. Roy, S.; Llewellyn, C.A.; Egeland, E.S.; Johnsen, G. Phytoplankton Pigments: Characterization, Chemotaxonomy and Applications in Oceanography; Cambridge University Press: Cambridge, UK, 2011. [Google Scholar]
  16. Gantt, E.; Lipschultz, C.A. Phycobilisomes of Porphyridium cruentum. Pigment analysis. Biochemistry 1974, 13, 2960–2966. [Google Scholar] [CrossRef]
  17. Viskari, P.J.; Colyer, C.L. Rapid extraction of phycobiliproteins from cultured cyanobacteria samples. Anal. Biochem. 2003, 319, 263–271. [Google Scholar] [CrossRef]
  18. Hsieh-Lo, M.; Castillo, G.; Ochoa-Becerra, M.A.; Mojica, L. Phycocyanin and phycoerythrin: Strategies to improve production yield and chemical stability. Algal Res. 2019, 42, 101600. [Google Scholar] [CrossRef]
  19. Spolaore, P.; Joannis-Cassan, C.; Duran, E.; Isambert, A. Commercial applications of microalgae. J. Biosci. Bioeng. 2006, 101, 87–96. [Google Scholar] [CrossRef] [Green Version]
  20. Yang, H.; Jin, X.; Lam, C.W.K.; Yan, S.-K. Oxidative stress and diabetes mellitus. Clin. Chem. Lab. Med. 2011, 49, 1773–1782. [Google Scholar] [CrossRef]
  21. Khozin, I.; Adlerstein, D.; Bigongo, C.; Heimer, Y.M.; Cohen, Z. Elucidation of the biosynthesis of eicosapentaenoic acid in the microalga Porphyridium cruentum (II. Studies with radiolabeled precursors). Plant Physiol. 1997, 114, 223–230. [Google Scholar] [CrossRef] [Green Version]
  22. Durmaz, Y.; Monteiro, M.; Bandarra, N.; Gökpinar, Ş.; Işik, O. The effect of low temperature on fatty acid composition and tocopherols of the red microalga, Porphyridium cruentum. J. Appl. Phycol. 2007, 19, 223–227. [Google Scholar] [CrossRef]
  23. Bergé, J.; Debiton, E.; Dumay, J.; Durand, P.; Barthomeuf, C. In vitro anti-inflammatory and anti-proliferative activity of sulfolipids from the red alga Porphyridium cruentum. J. Agric. Food Chem. 2002, 50, 6227–6232. [Google Scholar] [CrossRef] [PubMed]
  24. Cohen, Z. The production potential of eicosapentaenoic and arachidonic acids by the red alga Porphyridium cruentum. J. Am. Oil Chem. Soc. 1990, 67, 916–920. [Google Scholar] [CrossRef]
  25. Khozin-Goldberg, I.; Iskandarov, U.; Cohen, Z. LC-PUFA from photosynthetic microalgae: Occurrence, biosynthesis, and prospects in biotechnology. Appl. Microbiol. Biotechnol. 2011, 91, 905–915. [Google Scholar] [CrossRef] [PubMed]
  26. Dvir, I.; Stark, A.H.; Chayoth, R.; Madar, Z.; Arad, S.M. Hypocholesterolemic effects of nutraceuticals produced from the red microalga Porphyridium sp. in rats. Nutrients 2009, 1, 156–167. [Google Scholar] [CrossRef] [PubMed] [Green Version]
  27. Tannin-Spitz, T.; Bergman, M.; van-Moppes, D.; Grossman, S.; Arad, S.M. Antioxidant activity of the polysaccharide of the red microalga Porphyridium sp. J. Appl. Phycol. 2005, 17, 215–222. [Google Scholar] [CrossRef]
  28. Setyaningsih, I.; Prasetyo, H.; Agungpriyono, D.R.; Tarman, K. Antihyperglycemic activity of Porphyridium cruentum biomass and extra-cellular polysaccharide in streptozotocin-induced diabetic rats. Int. J. Biol. Macromol. 2020, 156, 1381–1386. [Google Scholar] [CrossRef]
  29. Poojary, M.M.; Barba, F.J.; Aliakbarian, B.; Donsì, F.; Pataro, G.; Dias, D.A.; Juliano, P. Innovative alternative technologies to extract carotenoids from microalgae and seaweeds. Mar. Drugs 2016, 14, 214. [Google Scholar] [CrossRef]
  30. Barba, F.J.; Grimi, N.; Vorobiev, E. New approaches for the use of non-conventional cell disruption technologies to extract potential food additives and nutraceuticals from microalgae. Food Eng. Rev. 2015, 7, 45–62. [Google Scholar] [CrossRef]
  31. Chemat, F.; Vian, M.A.; Cravotto, G. Green extraction of natural products: Concept and principles. Int. J. Mol. Sci. 2012, 13, 8615–8627. [Google Scholar] [CrossRef] [Green Version]
  32. Chemat, F.; Zille, H.; Khan, M.K. Applications of ultrasound in food technology: Processing, preservation and extraction. Ultrason. Sonochem. 2011, 18, 813–835. [Google Scholar] [CrossRef]
  33. Kadam, S.U.; Tiwari, B.K.; O’Donnell, C.P. Application of Novel Extraction Technologies for Bioactives from Marine Algae. J. Agric. Food Chem. 2013, 61, 4667–4675. [Google Scholar] [CrossRef] [PubMed]
  34. Routray, W.; Orsat, V. Microwave-assisted extraction of flavonoids: A review. Food Bioprocess Technol. 2012, 5, 409–424. [Google Scholar] [CrossRef]
  35. Khan, M.K.; Chemat, F. Application of Low and High Power Ultrasound in Food Analysis. Anal. Chem. Lett. 2011, 1, 103–114. [Google Scholar] [CrossRef]
  36. Mason, T.; Chemat, F.; Vinatoru, M. The extraction of natural products using ultrasound or microwaves. Curr. Org. Chem. 2011, 15, 237–247. [Google Scholar] [CrossRef]
  37. CIBNOR. Available online: https://www.cibnor.gob.mx/ (accessed on 30 September 2020).
  38. Guillard, R.R. Culture of phytoplankton for feeding marine invertebrates. In Culture of Marine Invertebrate Animals; Springer: Berlin/Heidelberg, Germany, 1975; pp. 29–60. [Google Scholar]
  39. Lowry, O.H.; Rosebrough, N.J.; Farr, A.L.; Randall, R.J. Protein measurement with the Folin phenol reagent. J. Biol. Chem. 1951, 193, 265–275. [Google Scholar]
  40. Dubois, M.; Gilles, K.A.; Hamilton, J.K.; Rebers, P.t.; Smith, F. Colorimetric method for determination of sugars and related substances. Anal. Chem. 1956, 28, 350–356. [Google Scholar] [CrossRef]
  41. Geresh, S.; Adin, I.; Yarmolinsky, E.; Karpasas, M. Characterization of the extracellular polysaccharide of Porphyridium sp.: Molecular weight determination and rheological properties. Carbohydr. Polym. 2002, 50, 183–189. [Google Scholar] [CrossRef]
  42. Axelsson, M.; Gentili, F. A Single-Step Method for Rapid Extraction of Total Lipids from Green Microalgae. PLoS ONE 2014, 9, 6. [Google Scholar] [CrossRef] [Green Version]
  43. ISO-5508. Animal and Vegetable Fats and Oils-Analysis by Gas Chromatography of Methyl esters of Fatty Acids; ISO 5508: 1990; International Organization for Standardization: Geneve, Switzerland, 1990. [Google Scholar]
  44. Bennett, A.; Bogorad, L. Complementary chromatic adaptation in a filamentous blue-green alga. J. Cell Biol. 1973, 58, 419–435. [Google Scholar] [CrossRef]
  45. Becker, E. Micro-algae as a source of protein. Biotechnol. Adv. 2007, 25, 207–210. [Google Scholar] [CrossRef]
  46. Assunção, M.F.; Varejão, J.M.; Santos, L.M. Nutritional characterization of the microalga Ruttnera lamellosa compared to Porphyridium purpureum. Algal Res. 2017, 26, 8–14. [Google Scholar] [CrossRef]
  47. Hermann-Krauss, C.; Koller, M.; Muhr, A.; Fasl, H.; Stelzer, F.; Braunegg, G. Archaeal production of polyhydroxyalkanoate (PHA) co-and terpolyesters from biodiesel industry-derived by-products. Archaea 2013, 2013, 129268. [Google Scholar] [CrossRef] [PubMed] [Green Version]
  48. Matos, Â.P.; Feller, R.; Moecke, E.H.S.; de Oliveira, J.V.; Junior, A.F.; Derner, R.B.; Sant’Anna, E.S. Chemical characterization of six microalgae with potential utility for food application. J. Am. Oil Chem. Soc. 2016, 93, 963–972. [Google Scholar] [CrossRef]
  49. Niccolai, A.; Chini Zittelli, G.; Rodolfi, L.; Biondi, N.; Tredici, M.R. Microalgae of interest as food source: Biochemical composition and digestibility. Algal Res. 2019, 42, 101617. [Google Scholar] [CrossRef]
  50. Di Lena, G.; Casini, I.; Lucarini, M.; del Pulgar, J.S.; Aguzzi, A.; Caproni, R.; Gabrielli, P.; Lombardi-Boccia, G. Chemical characterization and nutritional evaluation of microalgal biomass from large-scale production: A comparative study of five species. Eur. Food Res. Technol. 2020, 246, 323–332. [Google Scholar] [CrossRef]
  51. Harwood, J.L. Algae: Critical sources of very long-chain polyunsaturated fatty acids. Biomolecules 2019, 9, 708. [Google Scholar] [CrossRef] [Green Version]
  52. De Jesus Raposo, M.F.; de Morais, A.M.M.B.; de Morais, R.M.S.C. Influence of sulphate on the composition and antibacterial and antiviral properties of the exopolysaccharide from Porphyridium cruentum. Life Sci. 2014, 101, 56–63. [Google Scholar] [CrossRef]
  53. Khatoon, H.; Kok Leong, L.; Abdu Rahman, N.; Mian, S.; Begum, H.; Banerjee, S.; Endut, A. Effects of different light source and media on growth and production of phycobiliprotein from freshwater cyanobacteria. Bioresour. Technol. 2018, 249, 652–658. [Google Scholar] [CrossRef]
  54. Ruiz-Domínguez, M.C.; Jáuregui, M.; Medina, E.; Jaime, C.; Cerezal, P. Rapid Green Extractions of C-Phycocyanin from Arthrospira maxima for Functional Applications. Appl. Sci. 2019, 9, 1987. [Google Scholar] [CrossRef] [Green Version]
  55. Osório, C.; Machado, S.; Peixoto, J.; Bessada, S.; Pimentel, F.B.; C Alves, R.; Oliveira, M. Pigments Content (Chlorophylls, Fucoxanthin and Phycobiliproteins) of Different Commercial Dried Algae. Separations 2020, 7, 33. [Google Scholar] [CrossRef]
  56. Wang, J.; Chen, B.; Rao, X.; Huang, J.; Li, M. Optimization of culturing conditions of Porphyridium cruentum using uniform design. World J. Microbiol. Biotechnol. 2007, 23, 1345–1350. [Google Scholar] [CrossRef]
  57. Xu, Y.; Jiao, K.; Zhong, H.; Wu, S.; Ho, S.-H.; Zeng, X.; Li, J.; Tang, X.; Sun, Y.; Lin, L. Induced cultivation pattern enhanced the phycoerythrin production in red alga Porphyridium purpureum. Bioprocess. Biosyst. Eng. 2020, 43, 347–355. [Google Scholar] [CrossRef] [PubMed]
  58. Chaiklahan, R.; Chirasuwan, N.; Bunnag, B. Stability of phycocyanin extracted from Spirulina sp.: Influence of temperature, pH and preservatives. Process Biochem. 2012, 47, 659–664. [Google Scholar] [CrossRef]
  59. Azmir, J.; Zaidul, I.S.M.; Rahman, M.M.; Sharif, K.M.; Mohamed, A.; Sahena, F.; Jahurul, M.H.A.; Ghafoor, K.; Norulaini, N.A.N.; Omar, A.K.M. Techniques for extraction of bioactive compounds from plant materials: A review. J. Food Eng. 2013, 117, 426–436. [Google Scholar] [CrossRef]
  60. Juin, C.; Chérouvrier, J.-R.; Thiéry, V.; Gagez, A.-L.; Bérard, J.-B.; Joguet, N.; Kaas, R.; Cadoret, J.-P.; Picot, L. Microwave-assisted extraction of phycobiliproteins from Porphyridium purpureum. Appl. Biochem. Biotechnol. 2015, 175, 1–15. [Google Scholar] [CrossRef] [PubMed] [Green Version]
  61. Zhao, L.; Zhao, G.; Chen, F.; Wang, Z.; Wu, J.; Hu, X. Different Effects of Microwave and Ultrasound on the Stability of (all-E)-Astaxanthin. J. Agric. Food Chem. 2006, 54, 8346–8351. [Google Scholar] [CrossRef]
  62. Sharif, K.; Rahman, M.; Azmir, J.; Mohamed, A.; Jahurul, M.; Sahena, F.; Zaidul, I. Experimental design of supercritical fluid extraction–A review. J. Food Eng. 2014, 124, 105–116. [Google Scholar] [CrossRef]
  63. İlter, I.; Akyıl, S.; Demirel, Z.; Koç, M.; Conk-Dalay, M.; Kaymak-Ertekin, F. Optimization of phycocyanin extraction from Spirulina platensis using different techniques. J. Food Compos. Anal. 2018, 70, 78–88. [Google Scholar] [CrossRef]
  64. Mittal, R.; Tavanandi, H.A.; Mantri, V.A.; Raghavarao, K.S.M.S. Ultrasound assisted methods for enhanced extraction of phycobiliproteins from marine macro-algae, Gelidium pusillum (Rhodophyta). Ultrason. Sonochem. 2017, 38, 92–103. [Google Scholar] [CrossRef]
Figure 1. Pareto Chart (A) and Response surface curve (B) depicting the combined effects of extraction time (30, 45, and 60 s), power (100, 200, and 300 W), and solvent type (PBS (−1), DW (0), and CCS (1)) on the PE extraction yield by microwave extraction (MW) from P. cruentum. The response surface curve was prepared by considering 60 s as the optimal extraction time for P. purpureum.
Processes 08 01628 g001
Figure 2. Pareto Chart (A) and Response surface curve (B) depicting the combined effects of extraction time (30, 45, and 60 s), power (100, 200, and 300, W), and solvent type (PBS (−1), DW (0), and CCS (1)) on the PE extraction yield from the red microalga P. purpureum by the microwave method (MW). Response surface curve was prepared by considering 30 s as the optimal extraction time for P. purpureum.
Processes 08 01628 g002
Figure 3. Pareto Charts (A) and Response surface curves (B) depicting the combined effects of extraction time (5, 10, and 15 min) and solvent type ((PBS (−1), DW (0), and CCS (1)) and CCS 1.5%, w/v (1) on the PE extraction yield under ultrasound conditions (US) from P. cruentum.
Processes 08 01628 g003
Figure 4. Pareto Charts (A) and Response surface curves (B) depicting the combined effects of extraction time (5, 10, and 15 min) and solvent type (PBS (−1), DW (0), and CCS (1)) on the PE extraction yield by ultrasound method (US) from P. purpureum.
Processes 08 01628 g004
Table 1. Experimental design matrix depicting the extraction conditions and results for phycoerythrin (PE) extraction yield as the response variable after optimization of the microwave (MW) conditions of Porphyridium spp. Values presented are mean ± standard deviation (SD), n = 3.
Exp.FactorsResponse Variable
PE Extraction Yield
(mg/g)
Extraction-Time
(s)
Power
(W)
SolventP. cruentumP. purpureum
130100–1 (PBS)10.69 ± 0.526.60 ± 0.32
245100–121.06 ± 0.245.35 ± 0.21
360100–123.94 ± 1.846.37 ± 0.31
430200–120.43 ± 0.568.54 ± 0.41
545200–114.50 ± 0.496.11 ± 0.30
660200–123.20 ± 0.818.74 ± 0.01
730300–117.37 ± 0.507.36 ± 0.37
845300–118.56 ± 0.016.37 ± 0.20
960300–110.64 ±0.464.35 ± 0.20
10301000 (DW)19.23 ± 0.736.80 ± 0.32
1145100023.36 ± 0.5510.79 ± 0.49
1260100023.94 ± 0.015.51 ± 0.19
1330200023.69 ± 0.477.39 ± 0.06
1445200016.01 ± 0.646.31 ± 0.30
1560200014.65 ± 0.345.85 ± 0.28
1630300015.93 ± 0.798.07 ± 0.40
1745300015.54 ± 0.374.64 ± 0.23
1860300017.91 ± 0.744.54 ± 0.19
19301001 (CCS)19.79 ± 0.543.69 ± 0.10
2045100112.83 ± 0.491.56 ± 0.03
2160100113.27 ± 0.133.11 ± 0.11
2230200112.72 ± 0.501.58 ± 0.04
2345200118.07 ± 0.032.15 ± 0.05
246020019.16 ± 0.231.34 ± 0.03
2530300114.13 ± 0.701.51 ± 0.08
264530017.80 ± 0.091.21 ± 0.05
276030018.18 ± 0.391.69 ± 0.08
Abbreviations: PBS (−1): 50 mM Na-Phosphate buffer (pH 7.0); DW (0): distilled water; and CCS (1): 1.5% w/v calcium chloride solution.
Table 2. Experimental design matrix depicting the extraction conditions and results for phycoerythrin (PE) extraction yield as the response variable studied after optimization of the ultrasound (US) conditions of Porphyridium spp. Values presented are mean ± standard deviation (SD), n = 3.
Exp.FactorsResponse Variable
PE Extraction Yield
(mg/g)
Extraction-Time
(min)
SolventP. cruentumP. purpureum
15–1 (PBS)25.32 ± 1.1110.06 ± 0.32
210–128.95 ± 0.7813.06 ± 0.32
315–132.63 ± 1.0913.07 ± 0.64
450 (DW)26.53 ± 1.019.13 ± 0.41
510024.74 ± 0.7917.20 ± 0.21
615031.05 ± 0.2019.26 ± 0.25
751 (CCS)30.72 ± 0.314.96 ± 0.28
810126.94 ± 0.997.55 ± 0.34
915123.02 ± 0.056.70 ± 0.37
Abbreviations: PBS (−1): 50 mM Na-Phosphate buffer (pH 7.0); DW (0): distilled water; and CCS (1): 1.5% w/v calcium chloride solution.
Table 3. Comparison of the macronutrient composition and fatty acid profile of the microalgal species of this study compared to other Porphyridium spp. described in previous works.
Macronutrient
(%, w/w)
P. cruentumP. purpureumP. cruentumP. cruentumP. purpureum
F&M-M
Proteins42.90 ± 1.84 b26.30 ± 0.94 a28–3935.4 ± 0.934.2 ± 0.10
Carbohydrates13.89 ± 0.17 a14.42 ± 0.22 b40–5712.5 ± 0.617.0 ± 1.72
Lipids14.67 ± 0.24 a17.34 ± 1.35 b9–145.3 ± 0.313.1 ± 1.12
References**[45][48][49]
Fatty Acids Profile
(%, Total FA)
P. cruentumP. purpureumP. cruentumP. purpureumP. purpureum
C16:0, Palmitic41.02 ± 1.75 b29.01 ± 0.94 a34.1133.81 ± 0.0925
C16:1, Palmitoleic5.22 ± 0.16n.d.2.63n.d.n.d.
C18:0, Stearic1.35 ± 0.04 a50.02 ± 1.72 b0.8752.78 ± 2.82n.d.
C18:1, Oleic4.23 ± 0.11 a5.70 ± 0.15 b2.322.64 ± 0.96n.d.
C18:2, Linoleic9.19 ± 0.35 b6.49 ± 0.23 a10.541.10 ± 0.4523
C20:0, Arachidic11.23 ± 0.41 b5.90 ± 0.15 an.d.0.96 ± 0.32n.d.
C20:4ω-6, ARA18.02 ± 0.81 b1.98 ± 0.07 a29.122.66 ± 0.5739
C20:5ω-3, EPA9.74 ± 0.27 b0.90 ± 0.02 a15.880.54 ± 0.4613
Others FAn.d.n.d.5.435.51n.d.
References**[50][46][51]
* Present study. Note 1: Each data point represents the mean ± SD of replicates (SD ≤ 5%, n = 3). Different superscript letters (a,b) indicate statistically significant differences (p < 0.05). Note 2: Nucleic acids and ash account for the percentage left to make 100% w/w of biochemical composition. Abbreviations: FA: Fatty acids; n.d.: non-detected; ARA: arachidonic acid; EPA: eicosapentaenoic acid.
Table 4. Total phycoerythrin (mg/g biomass) determined in the Porphyridium spp. extracts under conventional methods using three types of solvents.
Solvent/MicroalgaeMacerationFreeze–Thawing
P. cruentumP. purpureumP. cruentumP. purpureum
PBS15.71 ± 0.59 b5.61 ± 1.17 b16.01 ± 0.72 a5.20 ± 0.67 b
DW15.93 ± 0.19 b5.19 ± 0.69 b16.08 ± 0.35 a,b5.49 ± 0.96 b
CCS12.01 ± 0.64 a0.86 ± 0.04 a17.66 ± 1.18 b1.85 ± 0.70 a
Note: Each data point represents the mean ± SD of replicates. Different superscript letters (a,b) indicate statistically significant differences (p < 0.05). Abbreviations: PBS: 50 mM Na-phosphate buffer (pH 7.0), DW: distilled water and CCS: 1.5% w/v calcium chloride solution.
Publisher’s Note: MDPI stays neutral with regard to jurisdictional claims in published maps and institutional affiliations.

