Article

Shear-Thinning Effect of the Spinning Disc Mixer on Starch Nanoparticle Precipitation

School of Engineering, Merz Court, Newcastle University, Newcastle Upon Tyne NE1 7RU, UK
*
Author to whom correspondence should be addressed.
Processes 2020, 8(12), 1622; https://doi.org/10.3390/pr8121622
Submission received: 16 November 2020 / Revised: 4 December 2020 / Accepted: 7 December 2020 / Published: 9 December 2020
(This article belongs to the Special Issue Process Intensification in Chemical Reaction Engineering)

Abstract

:
Spinning disc technology is capable of achieving intensified micromixing within thin liquid films created through large shear rates, typically of the order of 103 s−1, generated by means of fast disc surface rotation. In this study the effect of the high shear on solvent–antisolvent mixing and starch nanoparticle precipitation is reported. Rheological studies of starch solutions at 2% w/v and 4% w/v have demonstrated their shear-thinning behaviour at the large shear rates experienced on the spinning disc surface. The effect of such high shear rate on starch nanoparticle precipitation is investigated alongside solute concentration and several other operating parameters such as flow rate, disc rotational speed, and solvent/antisolvent ratio. A reduction in nanoparticle size has been observed with an increase in starch concentration, although agglomeration was found to be more prevalent amongst these smaller particles particularly at larger flow rates and disc rotational speeds. Micromixing time, estimated on the basis of an engulfment mechanism, has been correlated against shear rate. With fast micromixing of the order of 1 ms observed at higher shear rates, and which are practically unaffected by the starch concentrations used, micromixing is not thought to be influential in determining the particle characteristics highlighted in this work.

1. Introduction

Starch is a polysaccharide molecule made up of straight chained amylose and branched amylopectin polymers, it is found in sources such as corn, rice, and potato. The ratio of amylose and amylopectin vary from source to source, and with it, the properties of the starch [1]. Regular corn starch is composed of 75% amylopectin and 25% amylose [2]. Starch is most commonly known for its application in food processing where it may be used as a thickener or stabiliser. However, non-food applications include being used as a binder in the paper industry, in textile warp sizing, and in the plastic and petroleum industries [3]. Interestingly, over the past two decades, nanosized starch has attracted significant attention, offering further promising applications and improved quality [4]. Starch nanoparticles are relevant to many industries. They have been applied as drug carriers in pharmaceuticals, absorbents in wastewater treatment, enhanced binders in papermaking, and as reinforcers in nanocomposites, amongst many other applications [5,6,7].
Despite the many methods of producing starch nanoparticles, solvent–antisolvent precipitation is often a preferred method. Being a bottom-up process, it is safer, greener, and results in higher yields and smaller nanoparticles in comparison to that of acid hydrolysis, a typical example of a top-down approach of starch particle formation [8,9,10,11]. There are two key steps to the solvent–antisolvent process, the first being dissolution of the solute, starch, in a solvent. Solvents previously used for this purpose have included dimethylsulphoxide (DMSO) and sodium hydroxide (NaOH) [4,12,13]. An antisolvent is then introduced to the solution, typically an alcohol. Shorter chained alcohols such as ethanol have been recognised to be the most promising, yielding smaller sized particles [12]. With the exception of the author’s previous publication [14], starch solvent–antisolvent precipitation has only been conducted through semi-batch processes using a dropwise or low flow rate addition of the antisolvent. The reason behind this is that due to the high viscosity of the starch solution, stirred tank systems are not able to allow sufficient mixing between the starch–solvent mixture and the antisolvent [12,15,16,17,18]. The viscosity of a solution plays a key role in precipitation processes. A more viscous solution would slow down the collision frequency and mass transfer of molecules from the solution to the surface of the newly formed particle. This in turn would delay particle nucleation and growth, both vital stages of precipitation, thereby reducing particle size [19]. In contrast, Hebeish et al. (2014), who studied the effect of starch concentration of up to 10% w/v on particle size in a semi-batch process, reported a rise in particle size with an increase in concentration [9]. It was established that as a result of the high viscosity impeding uniform penetration of the solute/solvent by the antisolvent, the starch nanoparticles produced were of larger sizes with high polydispersity index (PdI) values.
High shear mixers are ideal for controlling particle size and size distribution in viscous systems. One such high shear mixing device is the spinning disc, which generates high centrifugal forces in the processed liquid through rotation of a horizontal disc surface [20,21]. It has been applied to many processes such as reactive precipitation [22,23,24,25,26,27,28], antisolvent precipitation [29,30,31], catalytic reactions [30,32], and acid–base neutralisation reactions [33], as well as polymerisation reactions where the viscosity of the bulk medium increases throughout the course of the reaction [34,35,36,37]. Boodhoo and Jachuck (2000) explored the spinning disc reactor (SDR) for the polymerisation of styrene, achieving a faster reaction rate through enhanced mass transfer within the reactor [34]. Dobie et al. (2013) carried out bulk photo-copolymerisation in a spinning disc reactor, observing a shear-thinning effect of the rotating disc on the liquid, which lowered viscosity of the liquid, aiding mass transfer [36]. Disentanglement and extension of coiled polymer chains subjected to the high shear environment of the spinning disc enable easier flow of the material and hence lower viscosity [38]. Additionally, plug flow conditions on the spinning disc are more likely to be established at conditions of high flow rates and disc rotational speeds, resulting in well controlled residence time distribution of the process liquid [21].
In earlier work conducted by the current authors [14], a spinning disc was used to carry out the solvent–antisolvent precipitation of starch nanoparticles. The study demonstrated the production of small nanoparticles with narrow particle size distributions. This was attributed to the high shear generated by the disc that creates instabilities within the thin liquid film, intensifying micromixing between the solute–solvent and the antisolvent. This previous study primarily entailed precipitation using a single concentration of 2% w/v starch in a sodium hydroxide solution. Further evaluation of the effect of concentration on the starch nanoparticles produced in a spinning disc is required. The current work focused on the rheology of the starch solutions at the high shear rates present in the spinning disc reactor and the implications it has on the solvent–antisolvent precipitation of starch nanoparticles at different concentrations of starch solution.

2. Materials and Methods

The reagents, sodium hydroxide in pellet form and 99.8% absolute ethanol, were purchased from Fisher Scientific, UK; corn starch was purchased from Sigma Aldrich. Starch solutions were prepared in a 0.5 M sodium hydroxide solvent, with Tween 80 added for its surfactant properties.
Viscosity measurements of starch were carried out in an Ostwald viscometer tube immersed inside a water bath at 25 °C. Shear rate effects on viscosity were determined using a Bohlin Visco 88 viscometer with a cup and bob attachment. Shear rates between 66.67 and 1220 s−1 can be achieved using this viscometer. The temperature was maintained at 25 °C by immersing the device in a water bath. For all viscosity data collected, a total of three measurements were performed at each concentration and shear rate, and the averaged viscosities were reported, with their associated errors determined from standard deviation.
For the solvent–antisolvent precipitation processes, a semi-batch reactor (SBR) and a spinning disc reactor (SDR) were used for comparison. The key features of the SDR (Figure 1) were described in our earlier publication [39]. In brief, it consists of a disc of diameter 30 cm surrounded by a stainless steel housing. Two disc surfaces (Figure 2) were used in the SDR’s performance characterisation: a smooth stainless steel texture and a grooved disc with eight concentric grooves machined in the surface. The disc temperature was maintained at 25 °C through a temperature-controlled water tank. The solvent/solute and the antisolvent streams were fed to the reactor via two single liquid distributors (1.5 mm internal diameter) positioned 2 cm above the centre of the disc. Finally, samples were collected from the bottom of the reactor and quenched in deionised water prior to analysis.
The semi-batch system comprises a vessel of 6.6 cm diameter and a marine propeller impeller of 3.5 cm diameter, rotating at a speed of 800 rpm. The temperature was maintained at 25 °C by circulating water through the jacketed reactor vessel. 100 mL solutions of 1% w/v and 2% w/v starch in 0.5 M sodium hydroxide solution were prepared and a total of 100 mL ethanol antisolvent was added to the starch solution at a flow rate of 1 mL/s. Samples from the vessel were collected immediately after the ethanol had been added and quenched in deionised water.
Particle size and particle size distributions (PSD) were measured by subjecting the samples to dynamic light scattering (DLS-Mode Nano ZS Malvern instruments, Malvern, UK) analysis. The measurements were performed in triplicates and the size distributions averaged. In most cases, an agglomeration peak is apparent as well as a smaller sized primary peak. However, for simplification, unless specifically stated, the intensity-based mean size of the primary peak was reported as well as its individual polydispersity index (PdI) to quantify the width of the primary peak. To describe the overall size distribution for the bi-modal peak, the Z-average and overall PdI values were used.

3. Results and Discussion

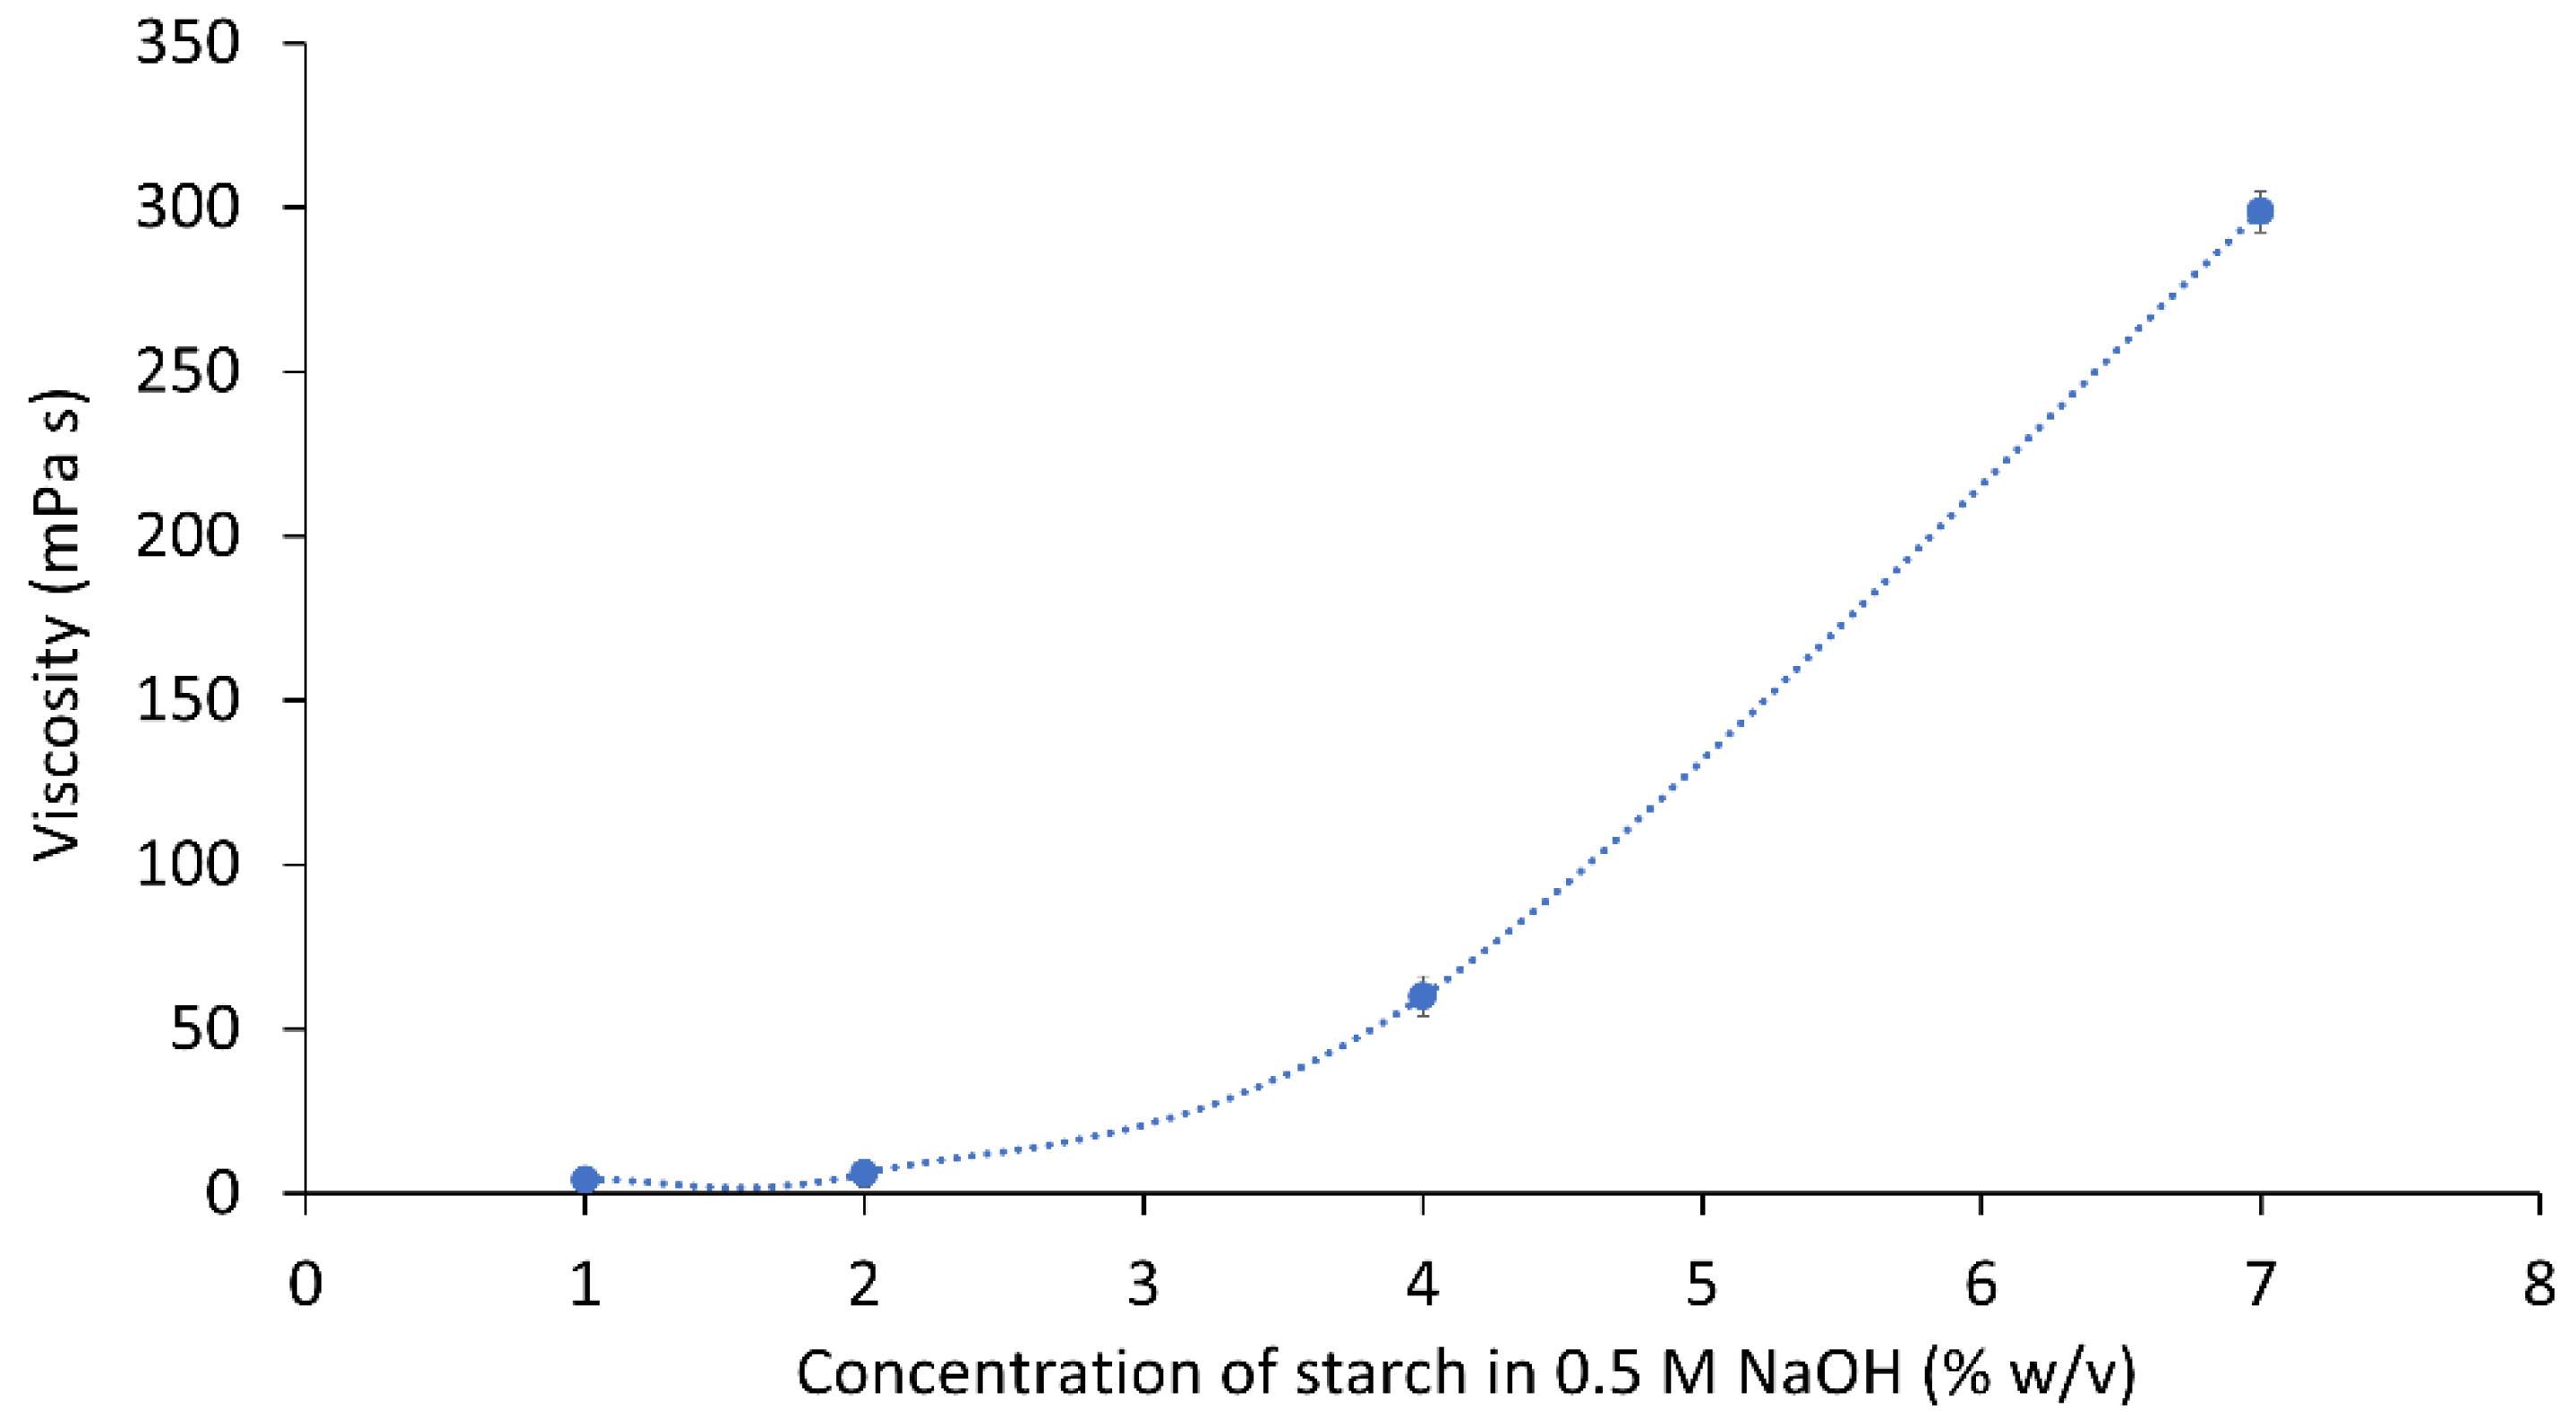
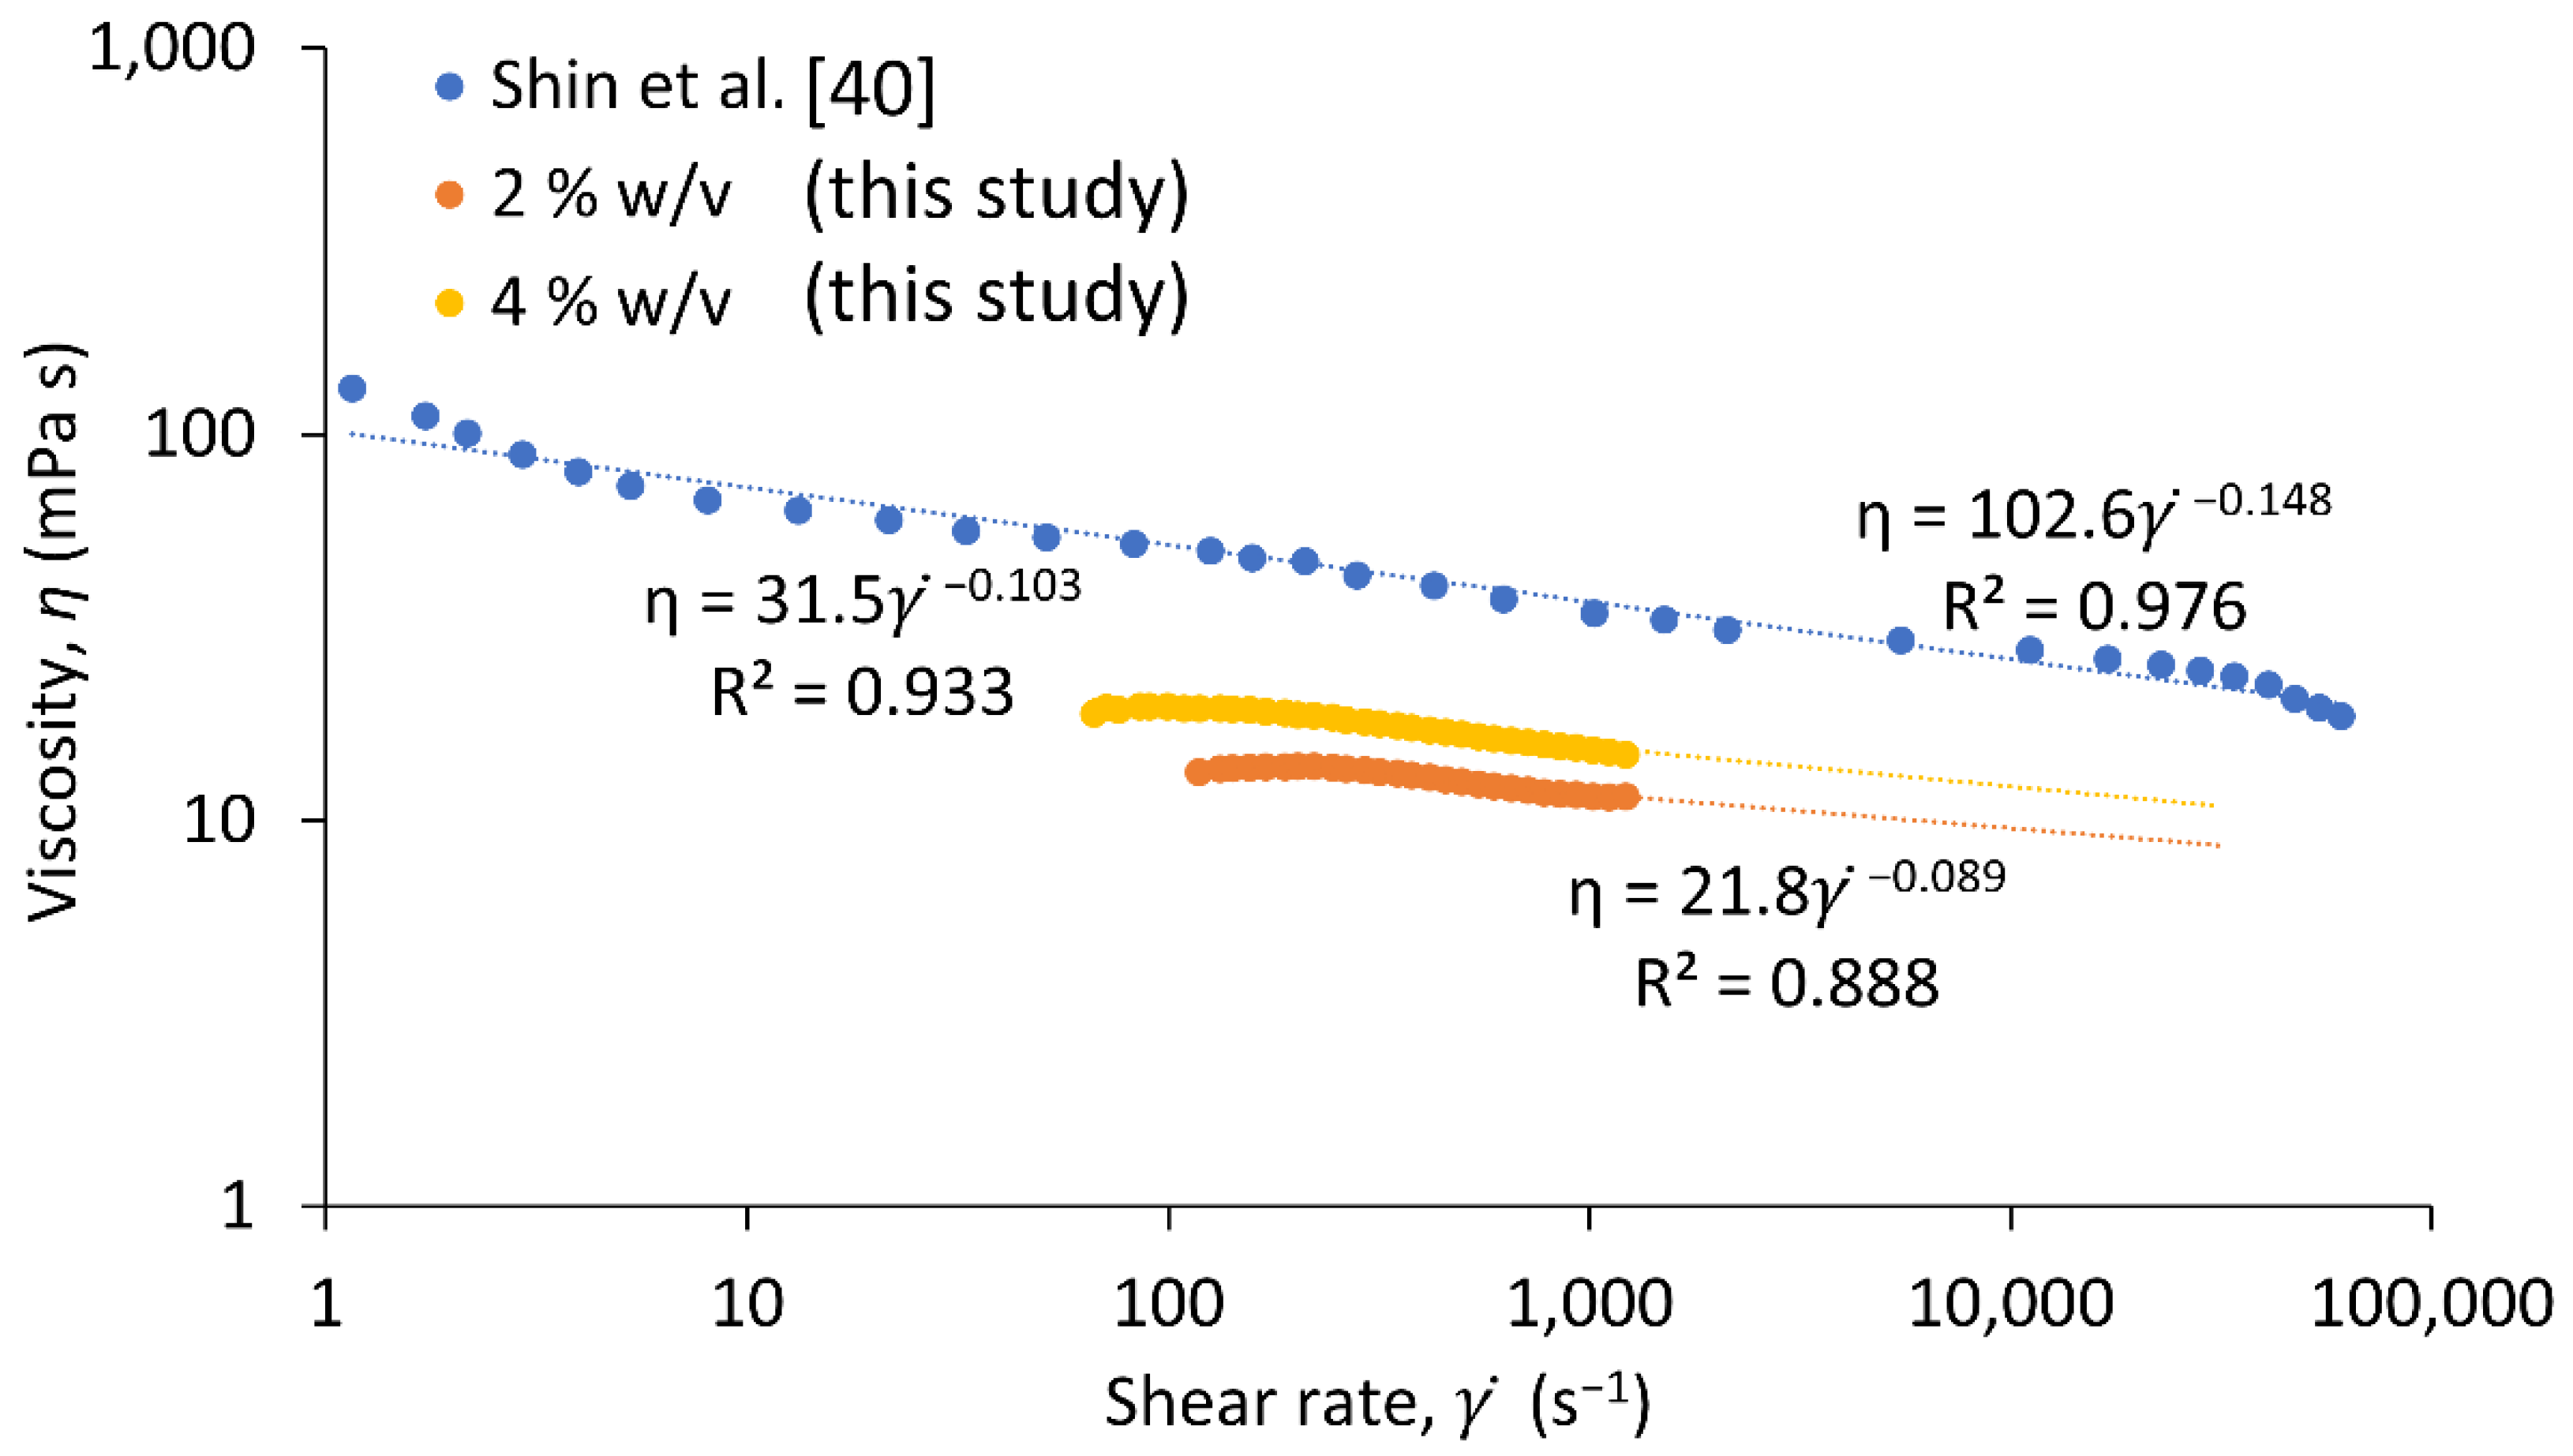
3.1. Effect of Starch Concentration on Viscosity

Without the application of any shear, the viscosity of starch solutions at various concentrations is summarised in Figure 3. The error bars displayed in the figure have been estimated from the replicates performed, as described earlier. There is an exponential rise in viscosity as concentration of starch increases. This behaviour has also been described in studies by other authors [9,12,15]. It should be brought to attention that concentrations above 7% w/v were too viscous to be analysed in our work using an Ostwald viscometer. Due to handling and pumping limitations, the current precipitation work is largely concerned with 2% w/v and 4% w/v concentrations of starch which indicate a difference of an order of magnitude in viscosity (6 mPa s and 60 mPa s, respectively).

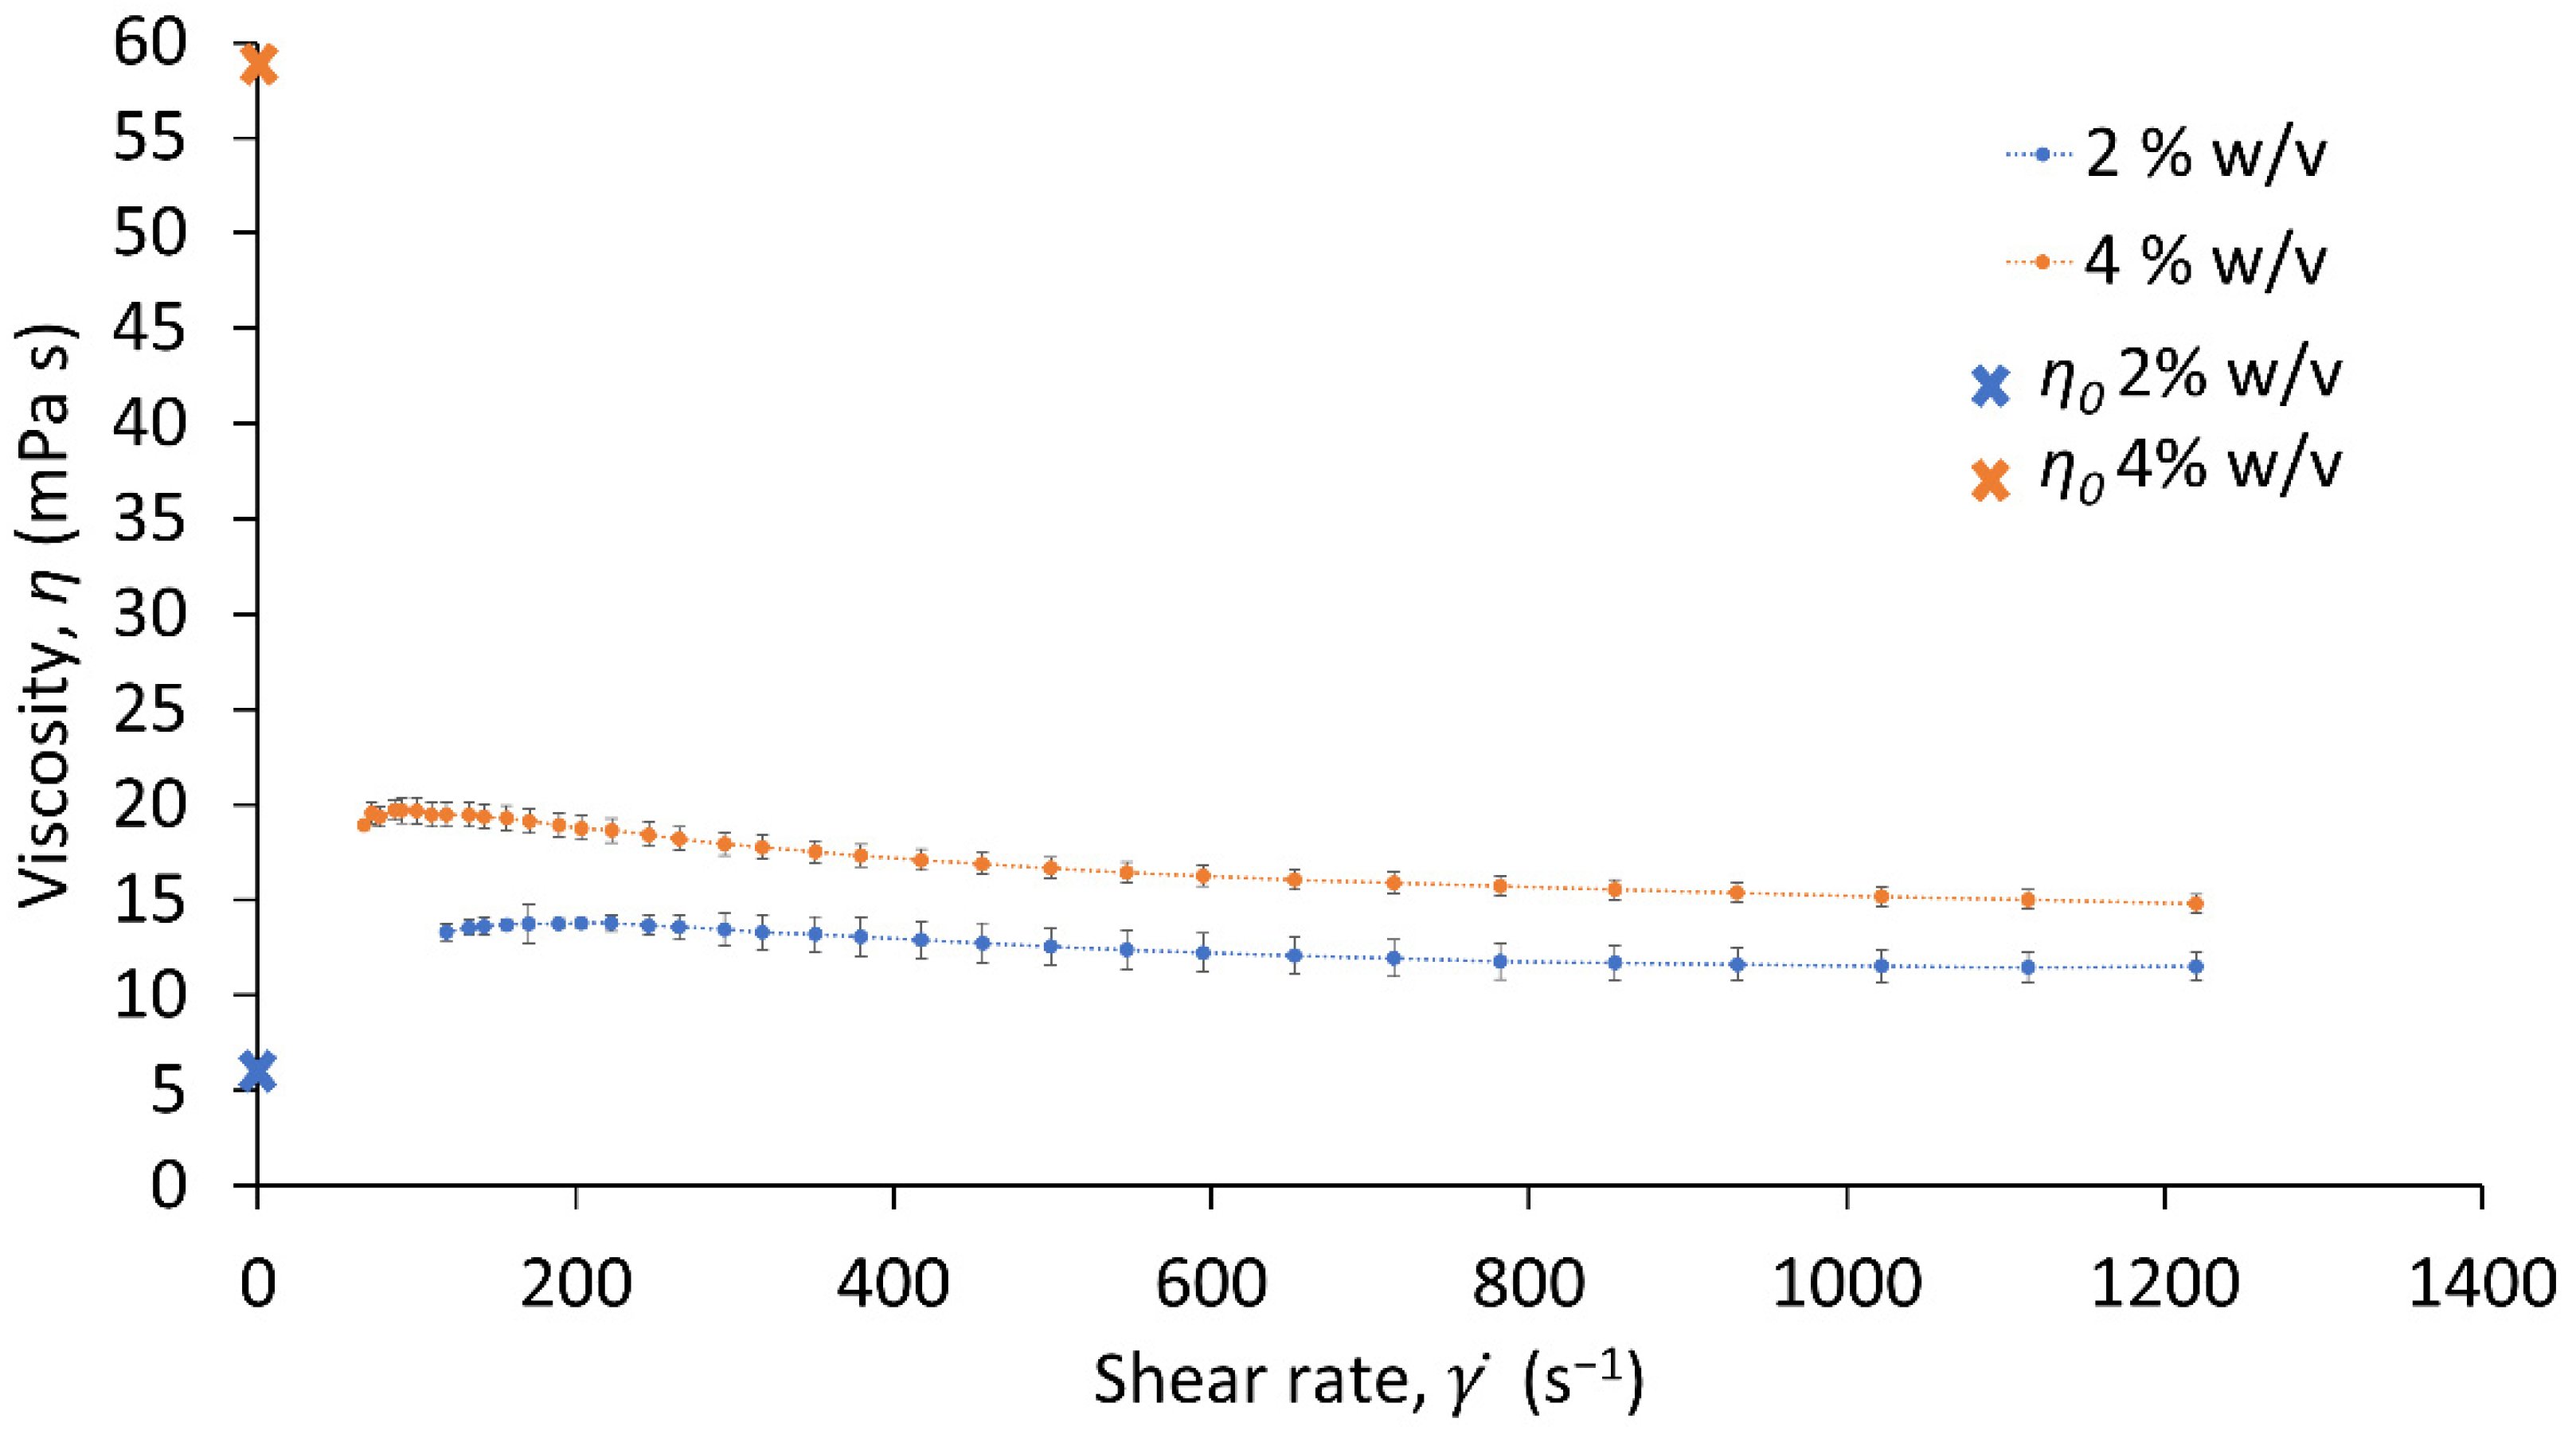
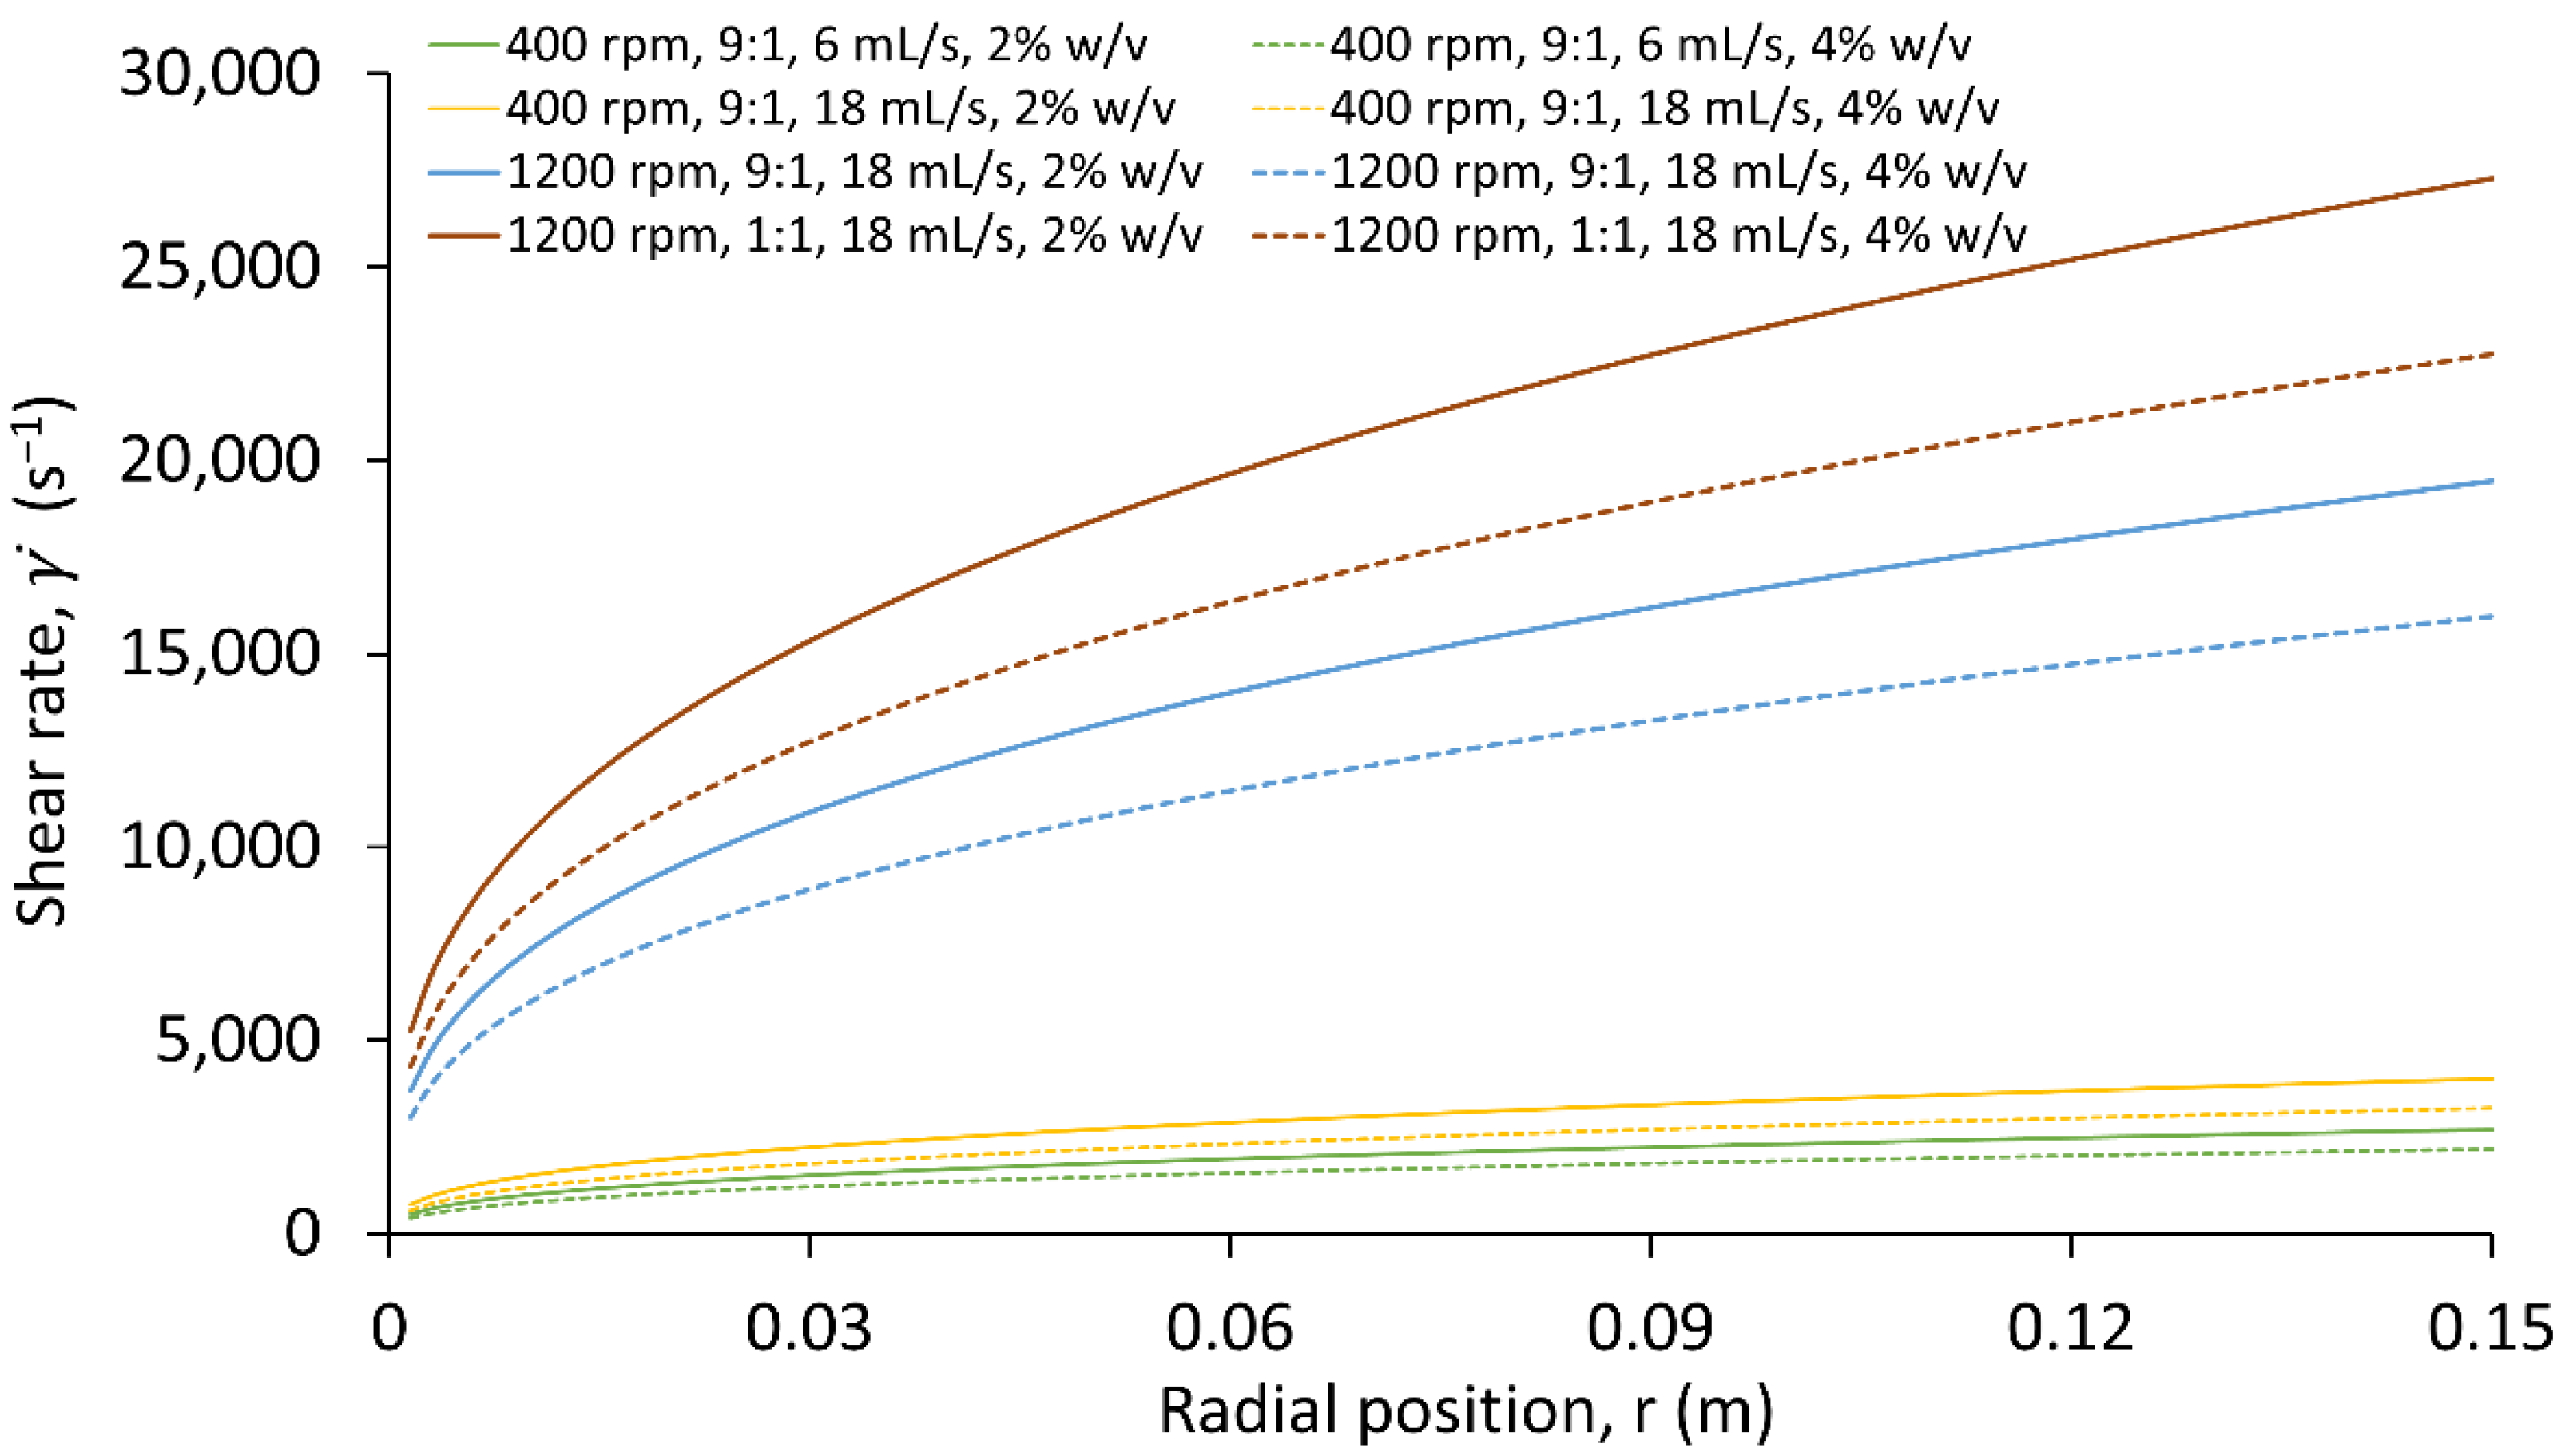
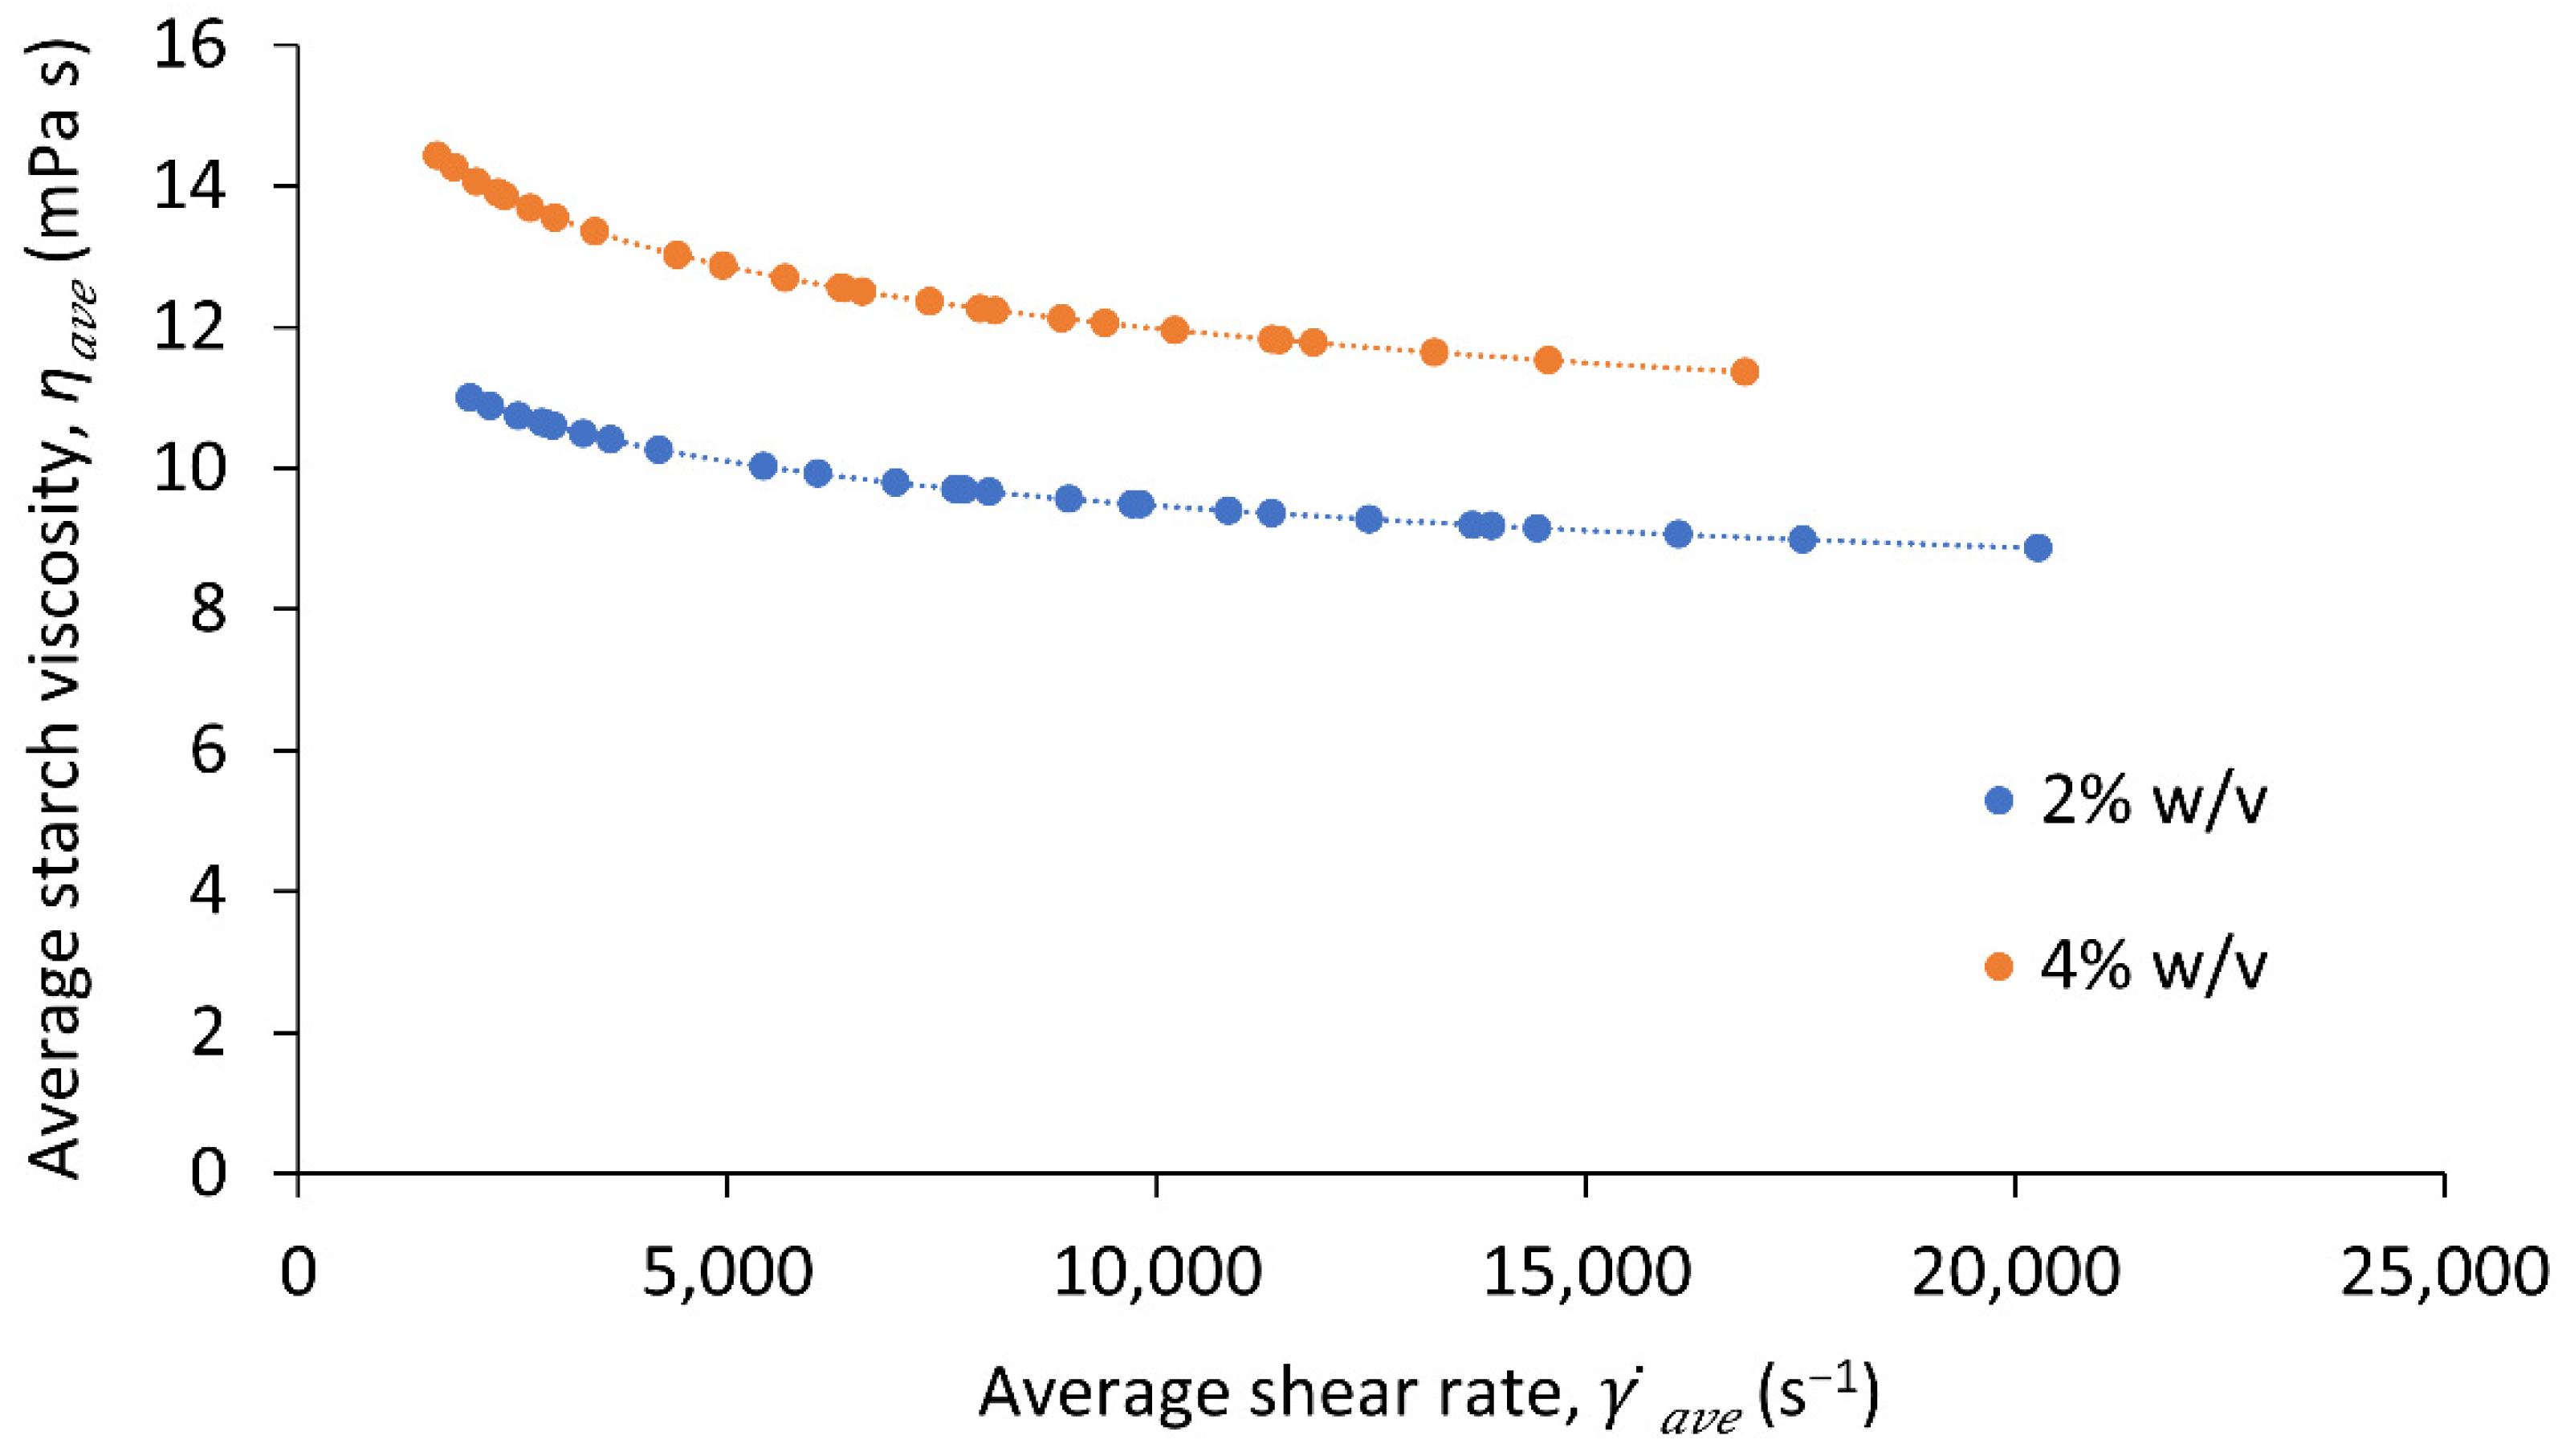
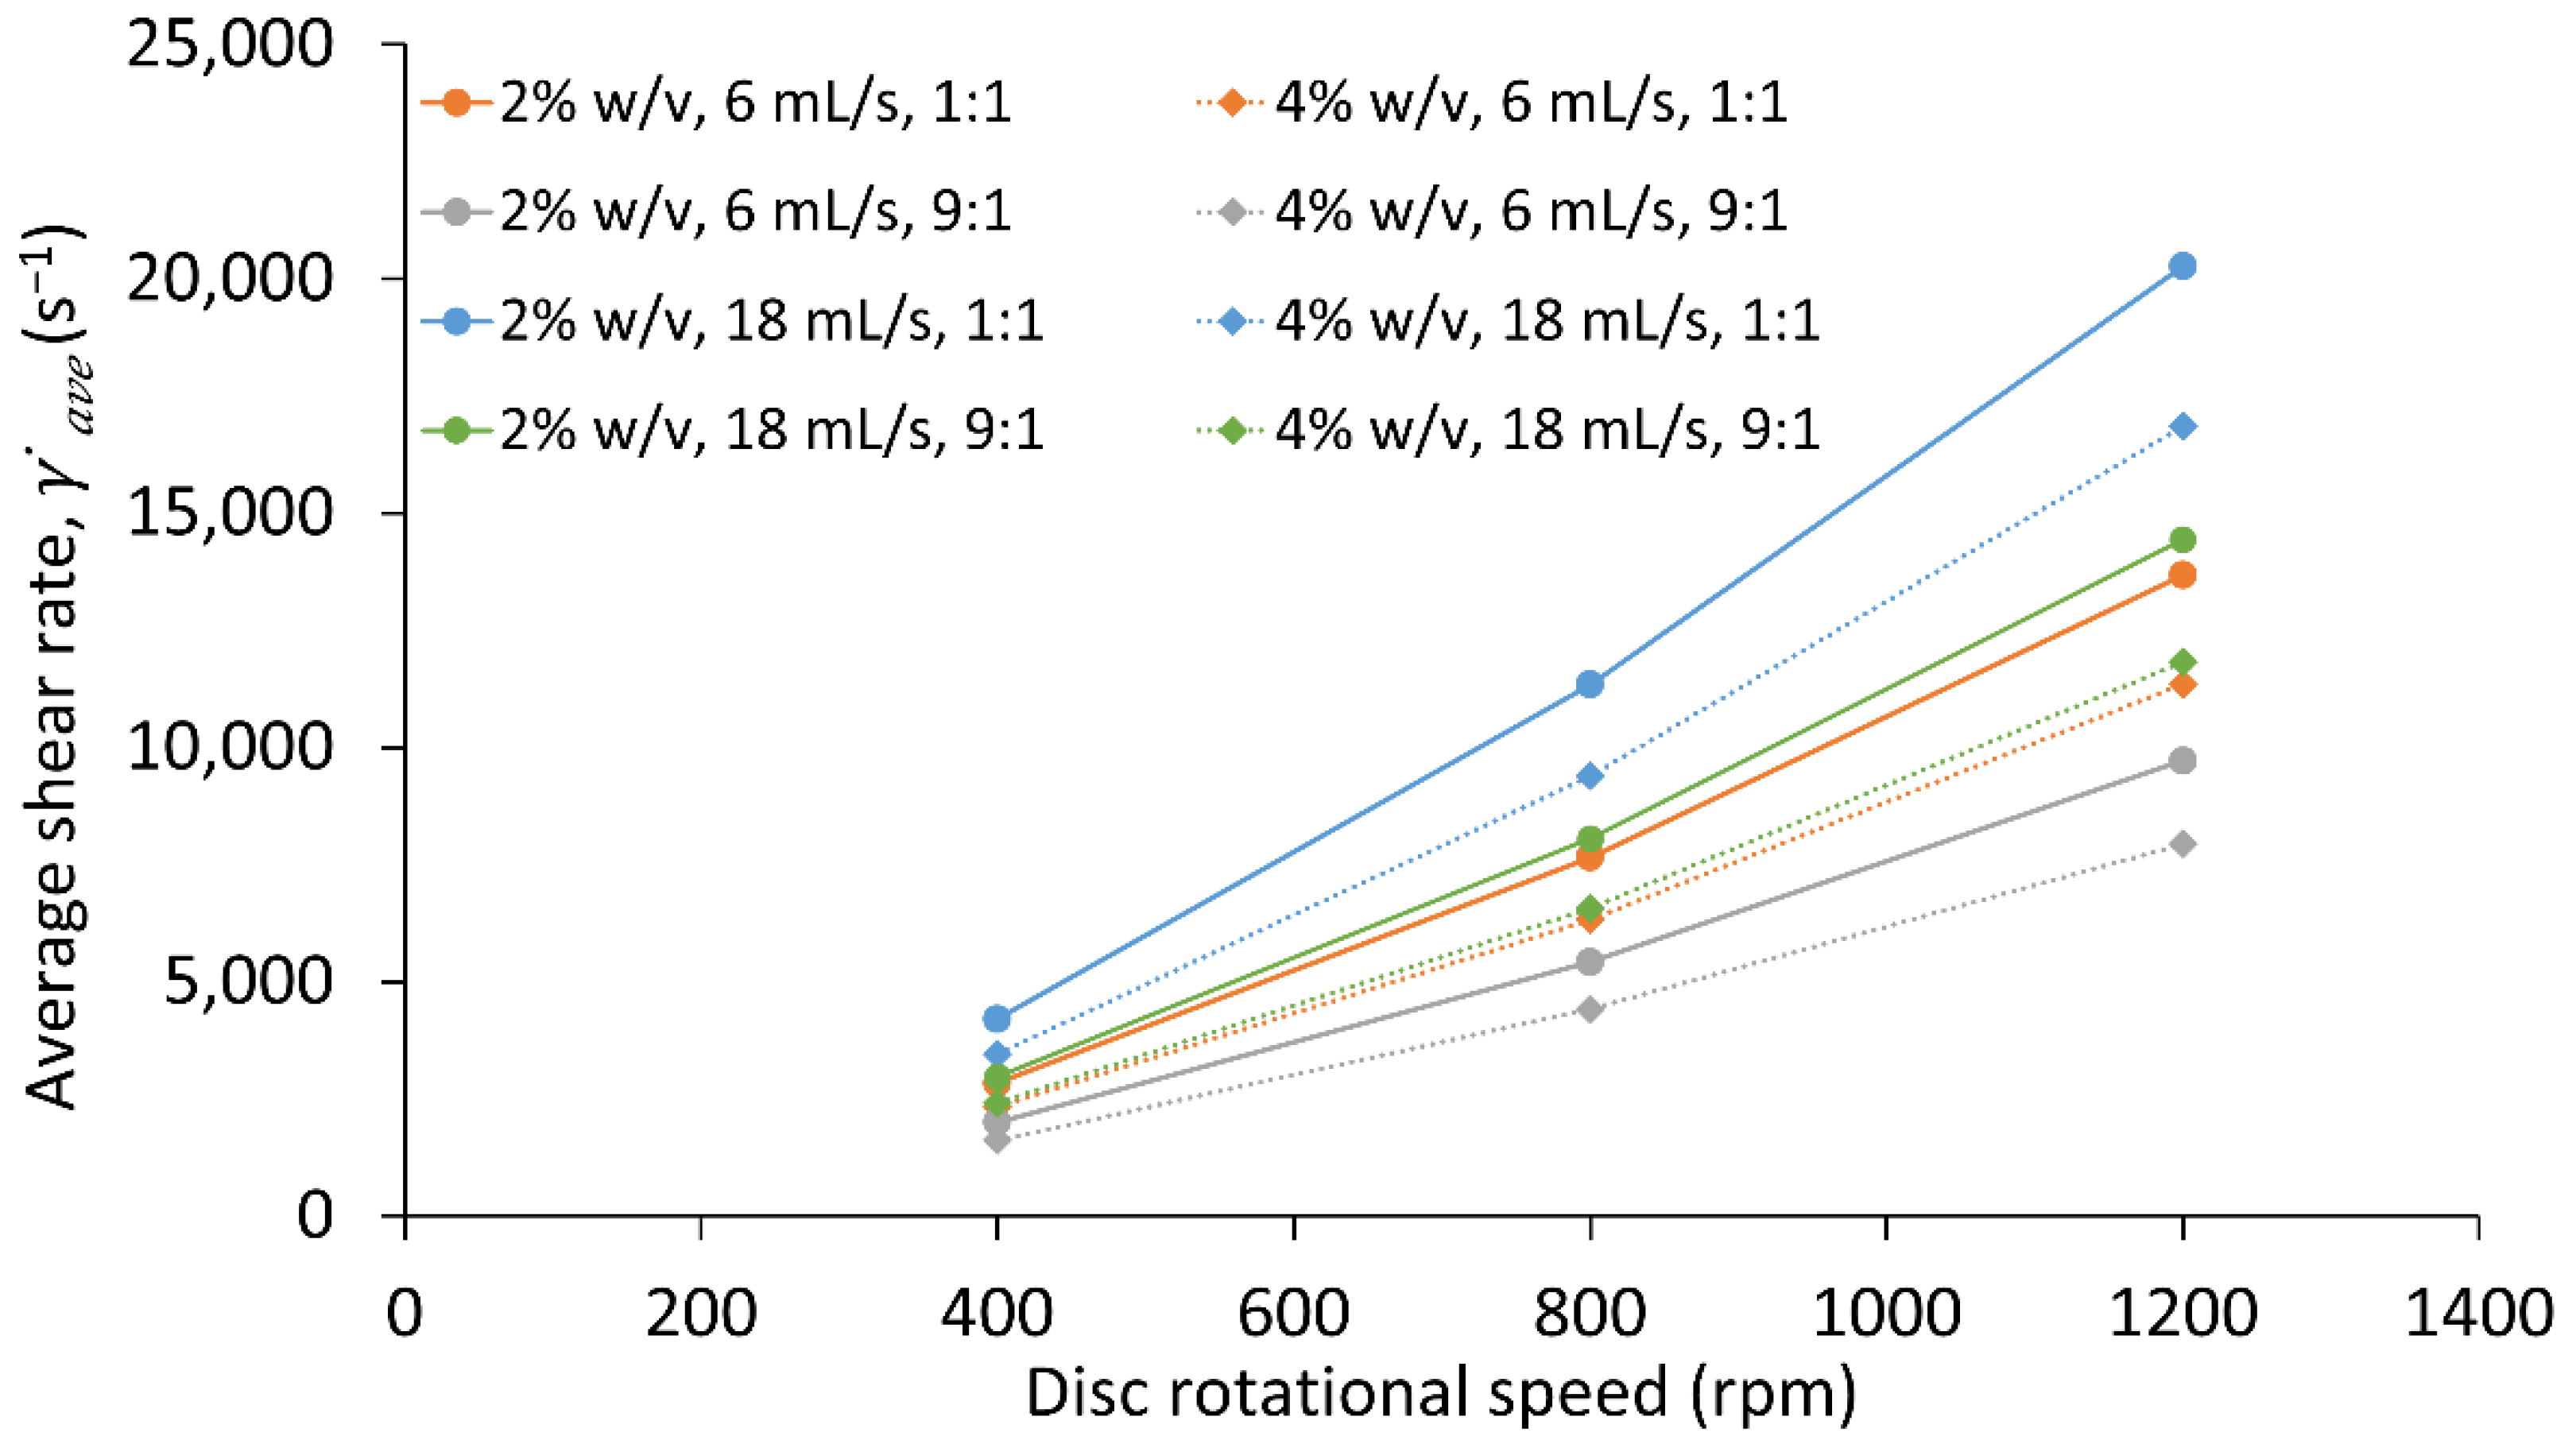
3.2. Rheological Characterisation of Starch

The effect of increasing shear on the viscosity of starch solutions at 2% w/v and 4% w/v is shown in Figure 4. Interestingly, the viscosity for 2% w/v begins at 13.84 mPa s at a shear rate of 66.67 s−1, whereas the viscosity measured for 2% w/v starch solution using an Ostwald viscometer without the exertion of intense shear was lower at 6 mPa s. This is not the case for 4% w/v, for which the viscosity using an Ostwald viscometer was found to be 59.7 mPa s, higher than the viscosities measured under the influence of shear. This points towards a possible shear thickening behaviour at low shear rates for low starch concentrations. As this research was mainly concerned with the effect of shear at high shear rates, further deliberation on this shall not be made; the shear-thinning behaviour shown in Figure 4 was analysed further.
The SDR operates at shear rates beyond the range of the viscometer, and the graph in Figure 4 does not give enough insight into the rheological behaviour of starch at higher shear rates. This means further evidence is required to confirm the shear-thinning behaviour of starch. Further evaluation was carried out by looking into the literature. A particular study by Shin et al. (2012) presents data for 14% v/v starch, equivalent to 21% w/v, at lower and higher shear rates, collected at 24 °C [40]. These data together with the data obtained experimentally for 2% and 4% w/v starch are shown in Figure 5. A similar trend can be seen in this plot, confirming shear-thinning behaviour of starch at 2% w/v and 4% w/v.
From the plot in Figure 5, a power law expression can be obtained, relating the dynamic viscosity, η, to shear rate, γ ˙ , as shown in Equation (1):
η = k γ ˙ n 1
The values for the consistency index, k and the power law index, n are presented in Table 1 for 2% w/v and 4% w/v concentrations of starch, as well as for 21% w/v. As expected, the consistency index of the starch solution increased as concentration increased, as to some extent it is analogous to apparent viscosity. The power law index on the other hand is virtually similar for the three concentrations. It represents the behaviour of the fluid under shear application, and a value of n < 1 signifies shear-thinning behaviour. It has been stated in an earlier study to be independent of starch concentration and temperature [41]. An earlier study done on tapioca starch (1% wt.) revealed similar shear-thinning characteristics, with power law parameters of k = 15.2 mPa s and n = 0.858 [42].
The film thickness equation for a spinning disc reactor [39] can be modified to incorporate the power law model for the flow of non-Newtonian liquids on the spinning disc reactor [43]. The modified film thickness can be expressed as in Equation (2):
δ = ( 1 + 2 n 2 π n ) n 1 + 2 n ( Q r [ k ρ ω 2 r ] 1 n ) n 1 + 2 n
The shear rate, γ ˙ , has been calculated using the expression below for maximum shear at the surface of the disc (z = 0):
γ ˙ = ω 2 r ν ( δ z )
For z = 0:
γ ˙ = δ ω 2 r ν
The effect of radial position on shear rate is displayed in Figure 6 for a range of experimental conditions in the SDR. An increase in shear rate is apparent as the radial position moves away from the centre of the disc and towards the edge. To account for the variation of shear rate along the disc radius, an average shear rate was estimated across the whole disc surface by taking an integral of Equation (4) with respect to radius, r. Table 2 summarises the average shear rates at the conditions plotted in Figure 6.
At the conditions studied, for the 2% w/v starch solution, the average shear rate in the SDR ranged from 2000 s−1 to 20,200 s−1 and viscosity at these shear rates lay between 11 mPa s and 9 mPa s, as is displayed in Figure 7. Similarly, Figure 7 also shows that for a 4% w/v concentration, the viscosity ranged from 14 mPa s to 11 mPa s for average shear rates of 1600 s−1 and 16,800 s−1, respectively.
These shear rates represent a wide range of operating conditions, some of which are displayed in Figure 8. Despite the high viscosity at rest, the 4% w/v solution falls drastically with increasing shear, which would mean that a more concentrated solution of starch is affected more strongly by increasing shear. However, these conclusions are based on the validation of the power law model obtained through extrapolation of the experimental data. The data from Shin et al. (2012) through which this model was established, shows a downward trend of viscosity at increasing shear rates. However, there are other factors that need to be considered that may also influence the model. Whilst the data from Shin et al. (2012) were obtained at a temperature of 24 °C for starch dissolved in water, our study involved experiments carried out at 25 °C, with starch dissolved in a solution of 0.5 M sodium hydroxide. A 1 °C difference is considered acceptable and just within the standard deviation for the experiments carried out throughout this research. In addition, as mentioned earlier, the power law index, n, is not affected by temperature. Other than this, starch is known to dissolve better in solutions of sodium hydroxide as the degree of swelling in NaOH solutions is far greater than it is in water [44]. For this reason, the intrinsic viscosity of the starch solution is reduced in the alkali solution. However, as mentioned earlier, the shear-thinning behaviour, expressed by the constant power law index, is not affected [41]. If the 21% w/v dissolution were to be carried out in a solution of sodium hydroxide rather than water, we anticipate the literature data in Figure 5 would be positioned lower in the plot for shear rate against viscosity. However, it is to be noted that the concentration of sodium hydroxide used in the present study is very low and may not have quite as significant an impact.

3.3. Effect of Starch Concentration on Nanoparticle Precipitation

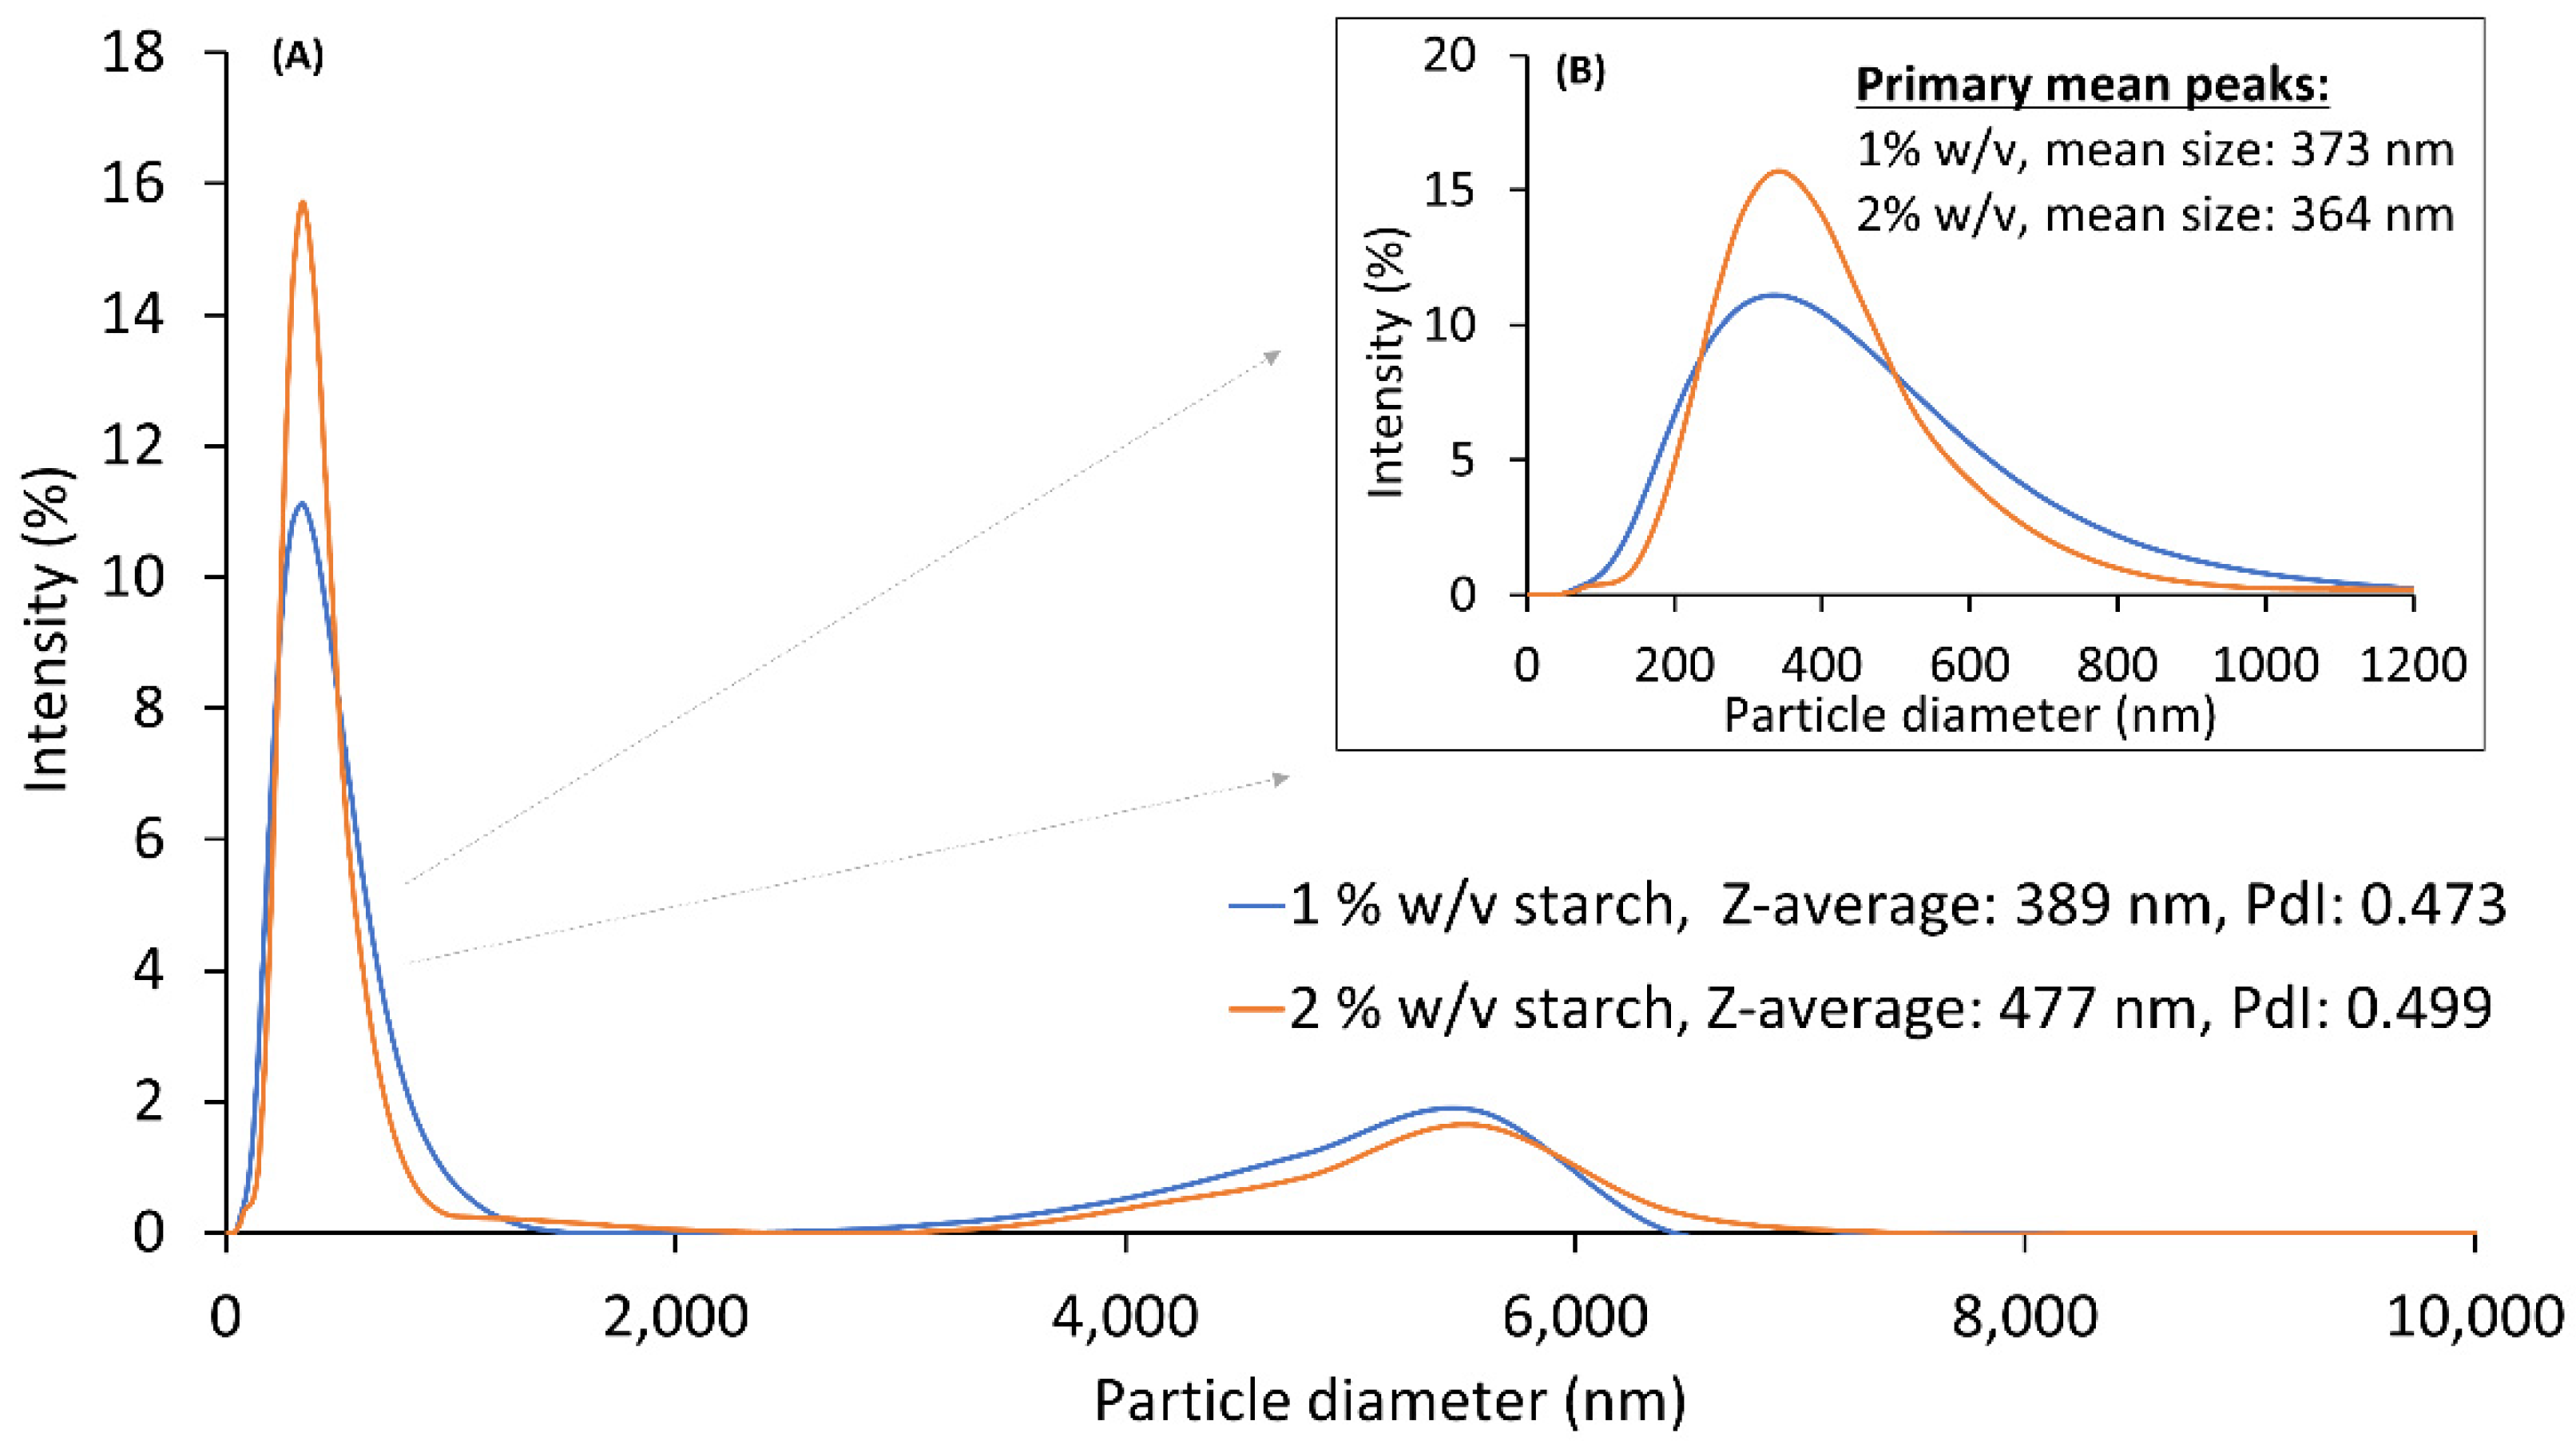
3.3.1. Semi-Batch Reactor

The effect of starch concentration in a semi-batch set-up can be seen in the particle size distributions presented in Figure 9. Figure 9A displays the Z-averages of the size distributions as well as the overall PdI. The Z-average is the intensity-weighted mean hydrodynamic size of the particles, and the associated PdI quantifies the overall width of the size distribution, which is constituted of a primary peak and a secondary agglomeration peak. The primary peaks, with mean sizes of 373 nm and 364 nm for 1% w/v starch and 2% w/v starch, respectively, are shown in insert Figure 9B without the secondary agglomeration peaks. An increase in concentration does not show a significant impact on the PSD, as there does not appear to be much of a difference between the primary peaks. However, there is a difference in the Z-averages, which are computed by taking the primary and the agglomerated peak into account. Although the size difference is not significant, it is evident from Figure 9B that lower sized particles were produced at the higher concentrations. This could be because a higher concentration results in greater supersaturation, leading to faster nucleation and the formation of nanoparticles. As the smaller particles are more likely to agglomerate, the particles produced at 2% w/v have a slightly larger tendency to agglomerate and thus increase the Z-average. The PdI values support this theory as the overall PdI for both peaks is higher for 2% w/v starch, indicating a broad size distribution that could be attributed to the agglomeration of particles.
It is to be noted that when conducting solvent–antisolvent precipitation experiments in a semi-batch set-up using concentrations of 4% w/v starch or greater, the viscosity is too high, impeding penetration of ethanol into the starch-NaOH mixture. The resulting product was a thick colloidal mass. The shear rate generated in this case was calculated through Equation (5). Using a marine impeller at a speed of 13.33 rev/s, the shear rate is approximately 134 s−1 [45].
γ ˙ = ( 1 k ) ( P V ) 1 1 + n
where P/V is the specific power input for the stirred reactor.
The spinning disc reactor, on the other hand, generates shear rates up to a hundred times greater than that of the stirred reactor. The previous section established a shear-thinning effect on the viscosity of starch solutions in the SDR as a result of the high shear.

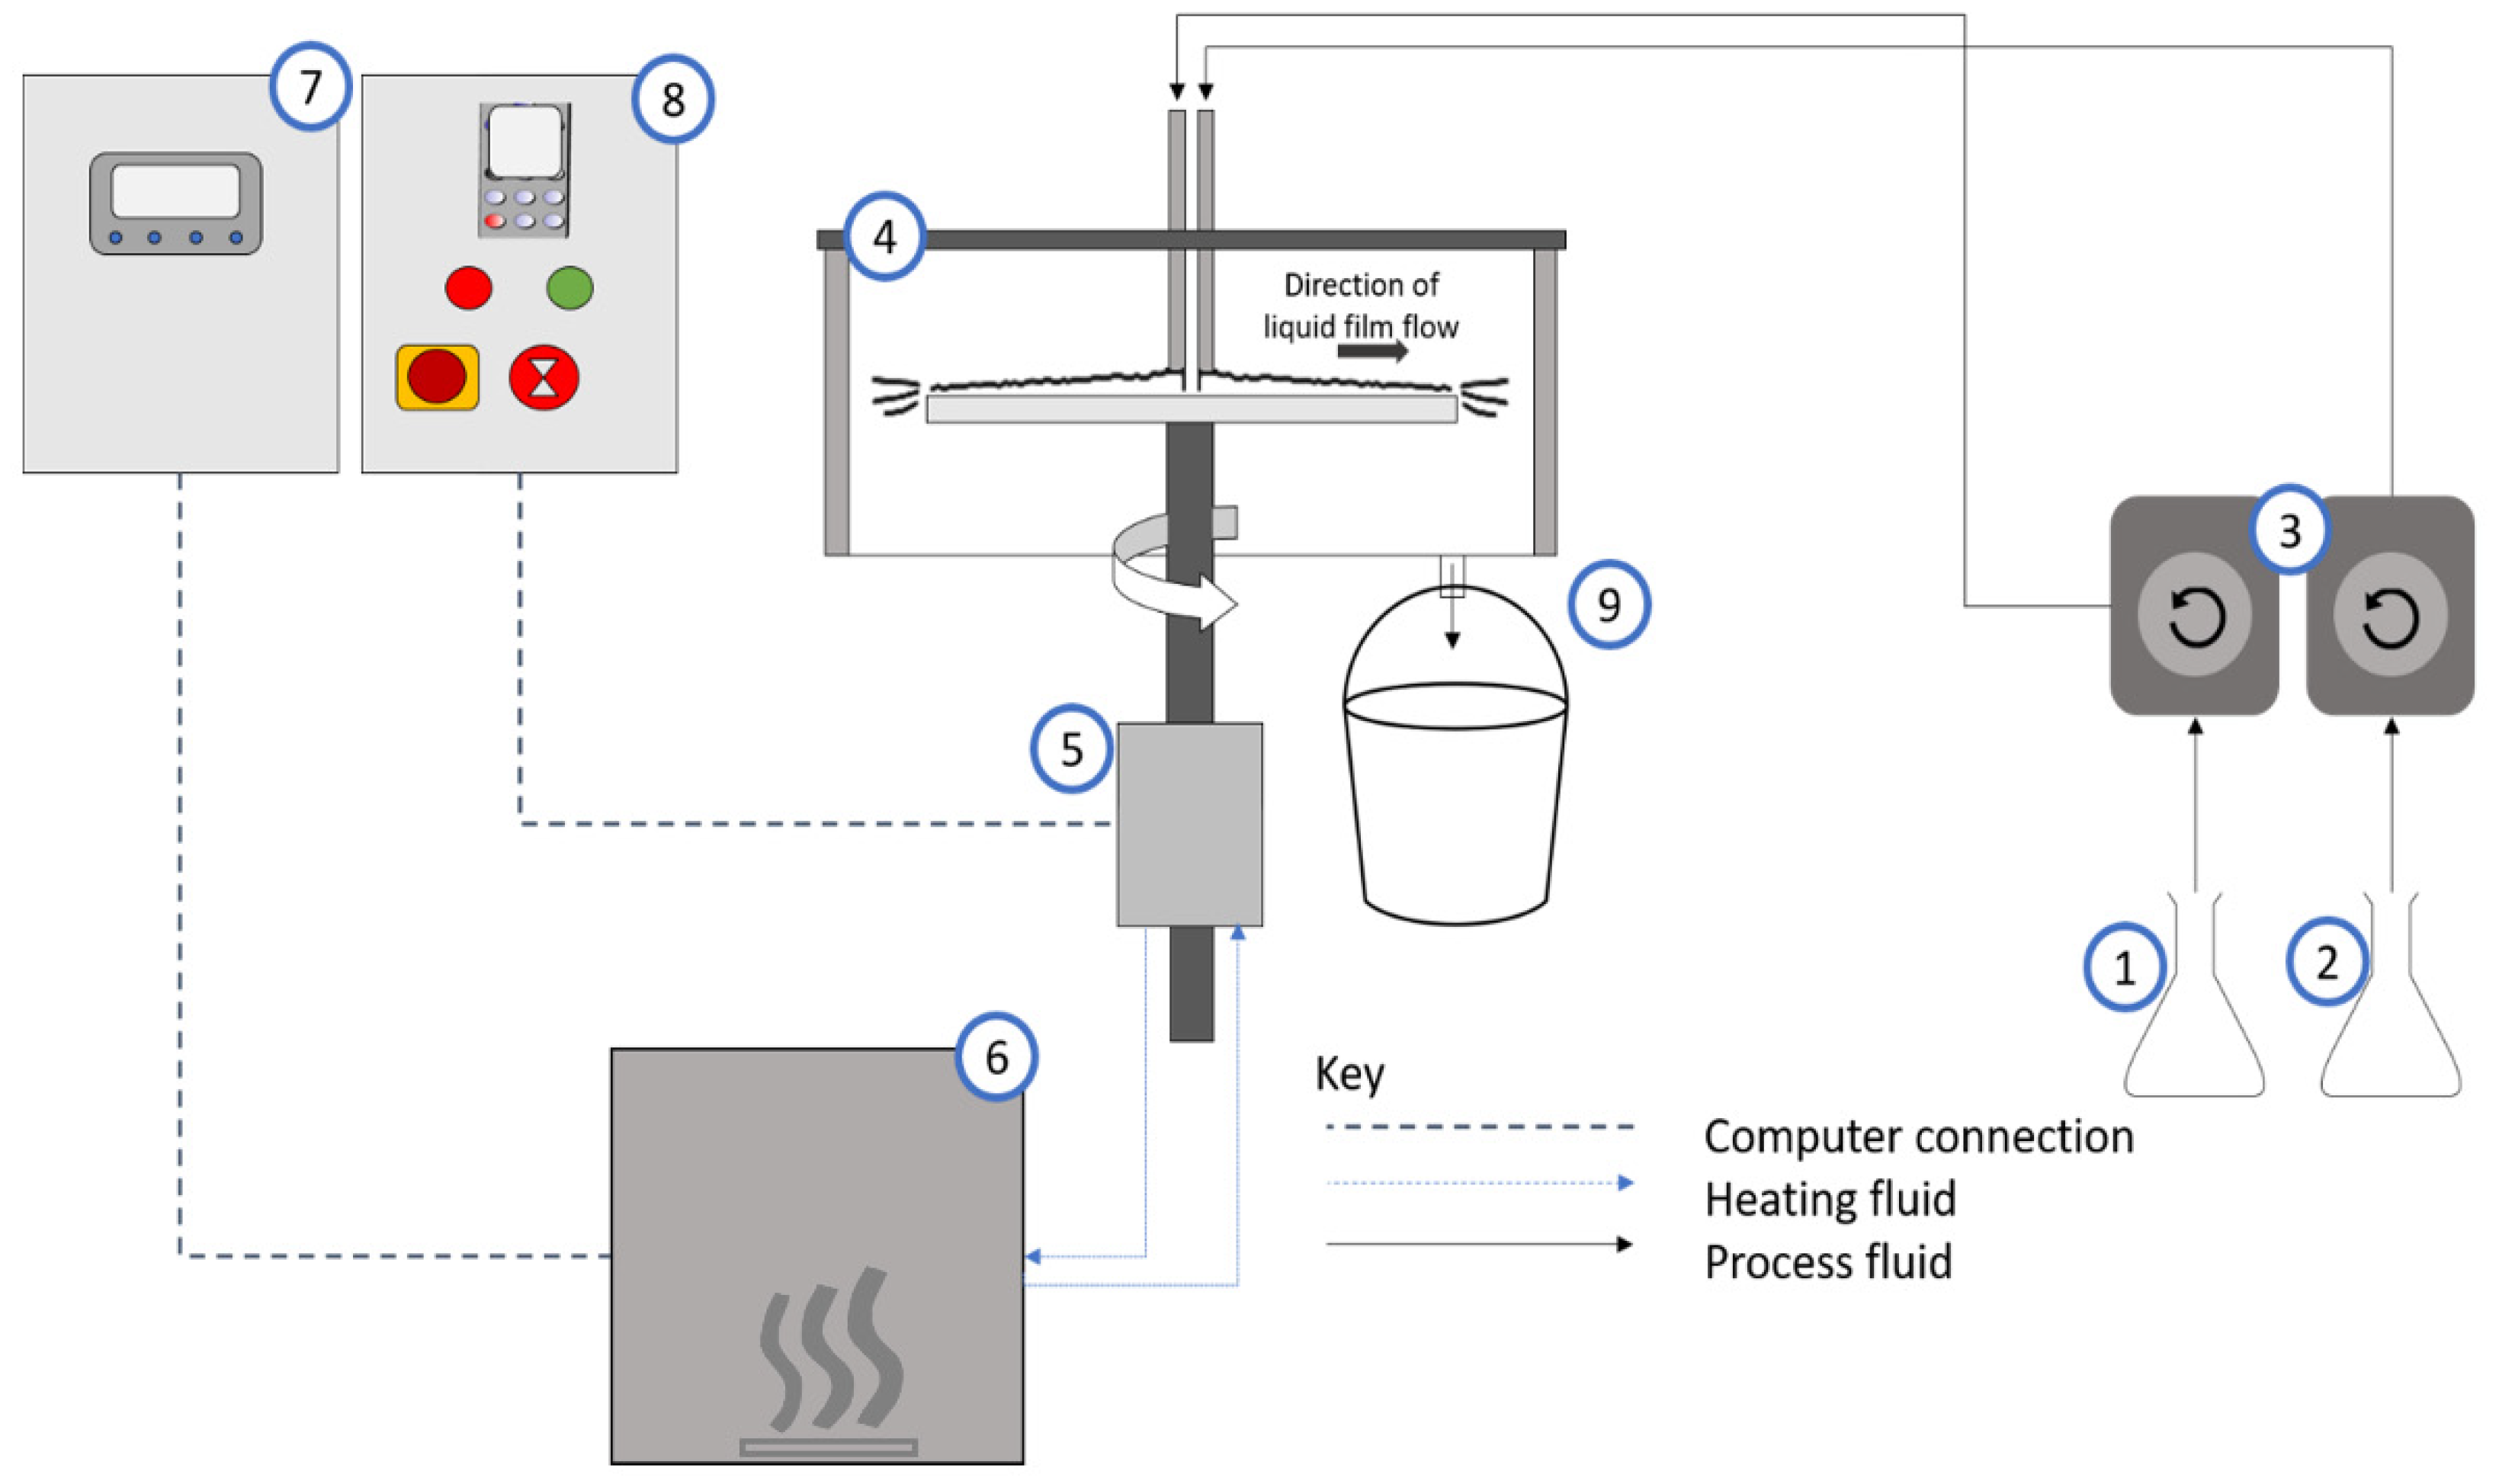
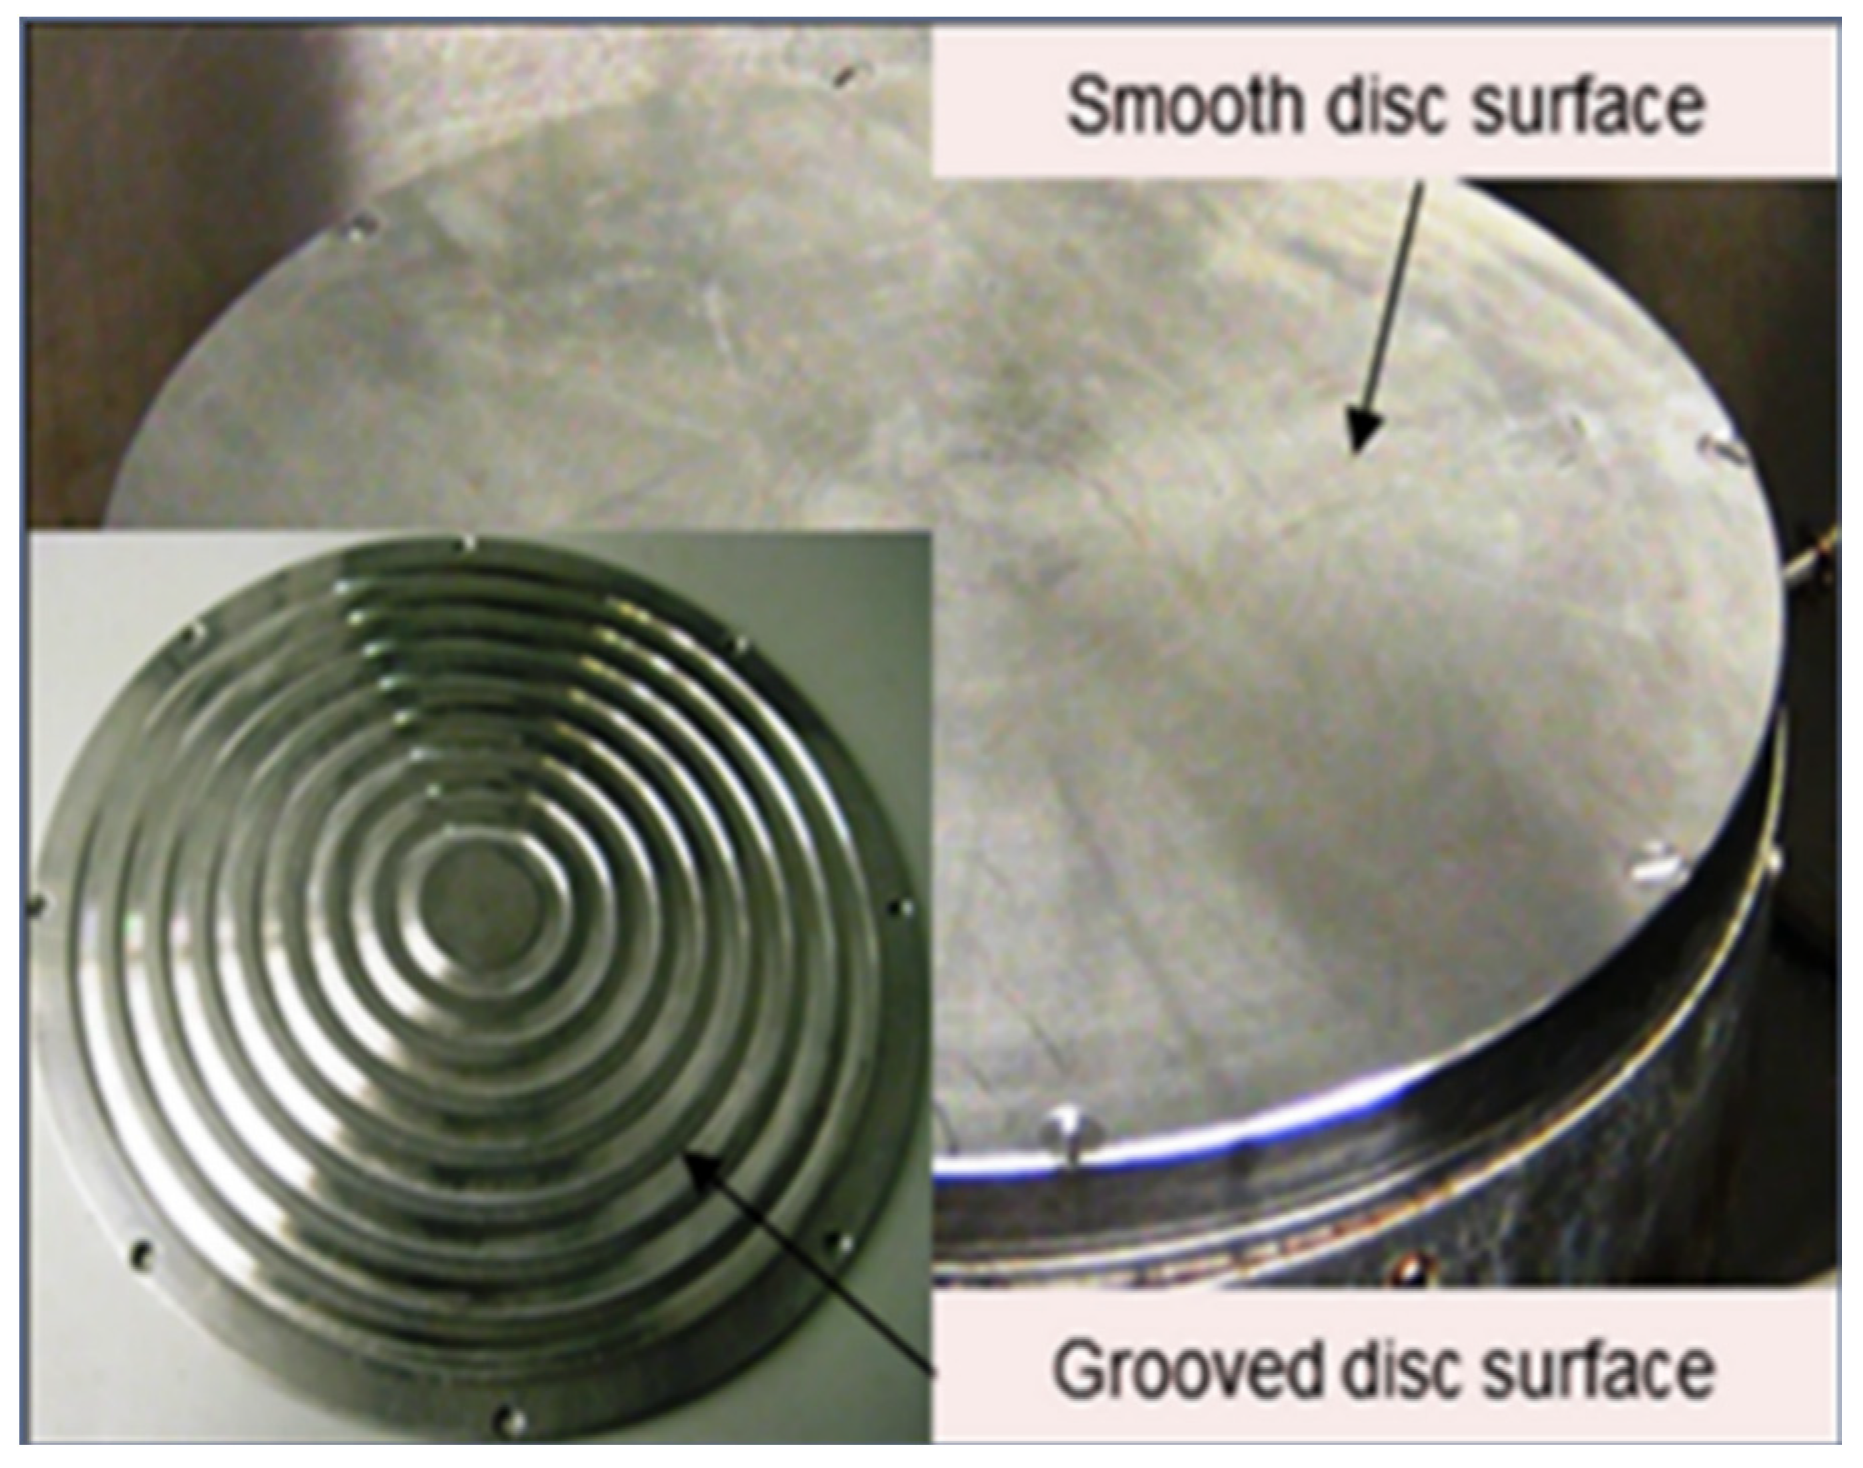
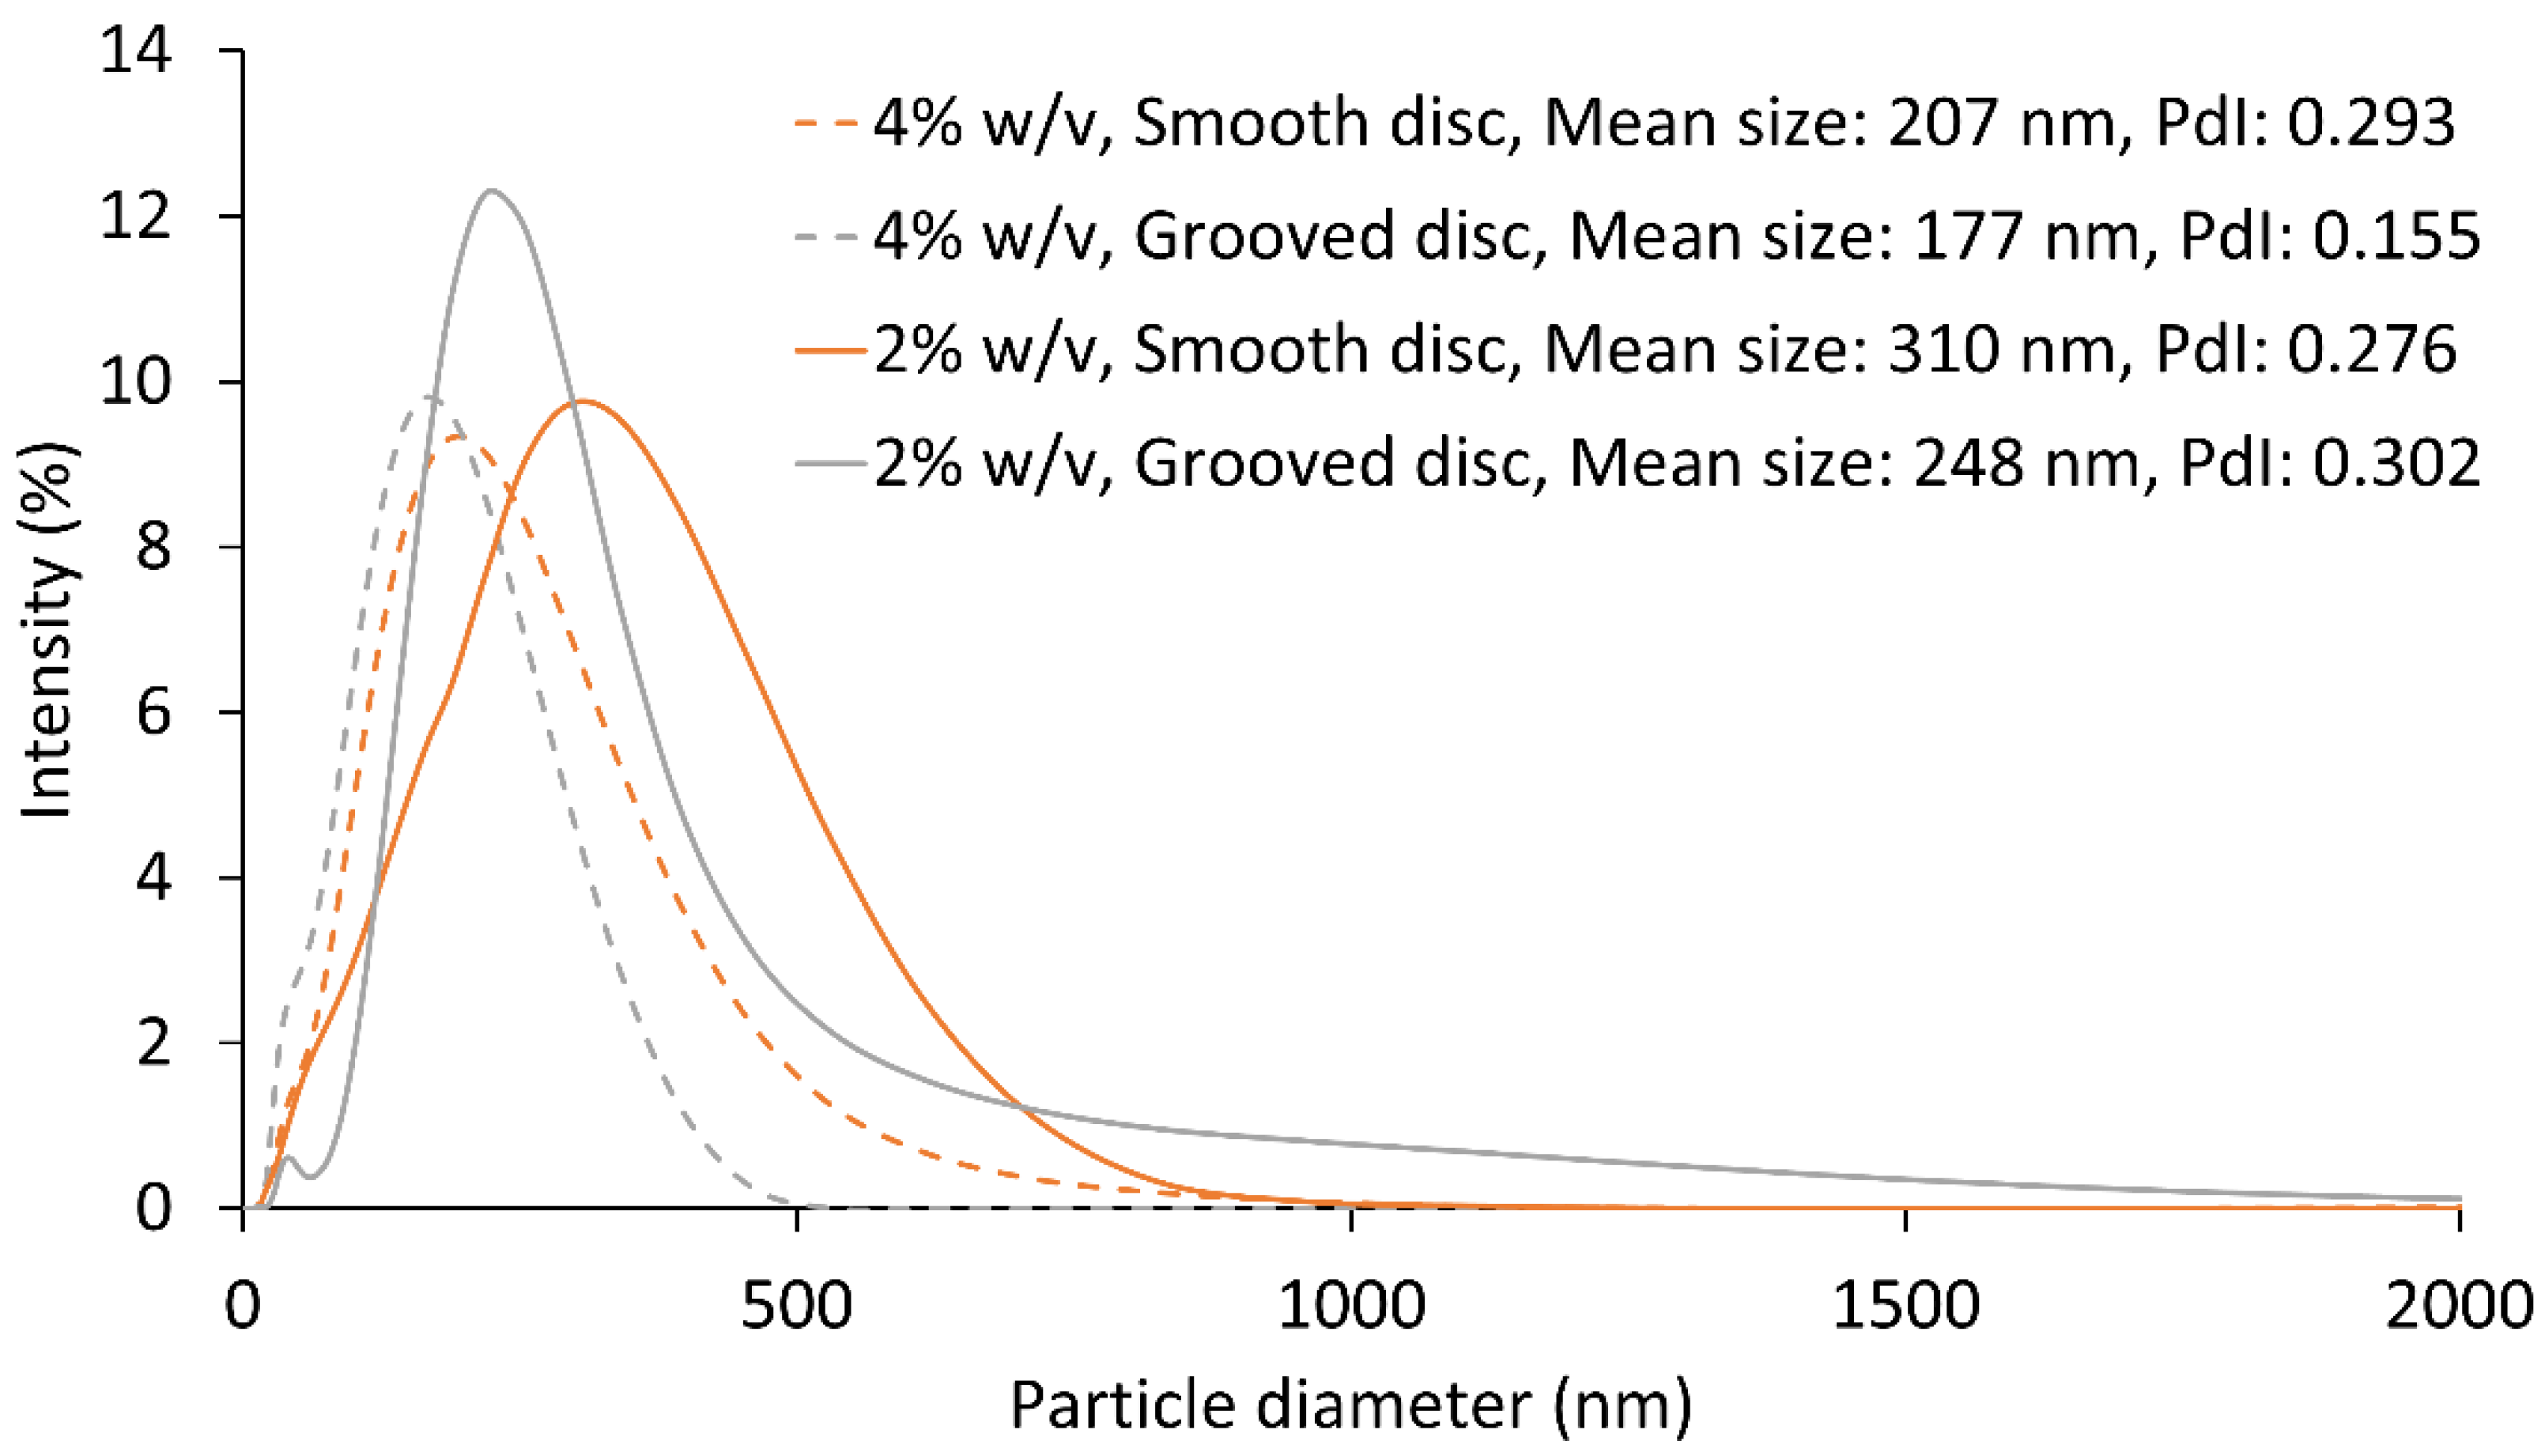
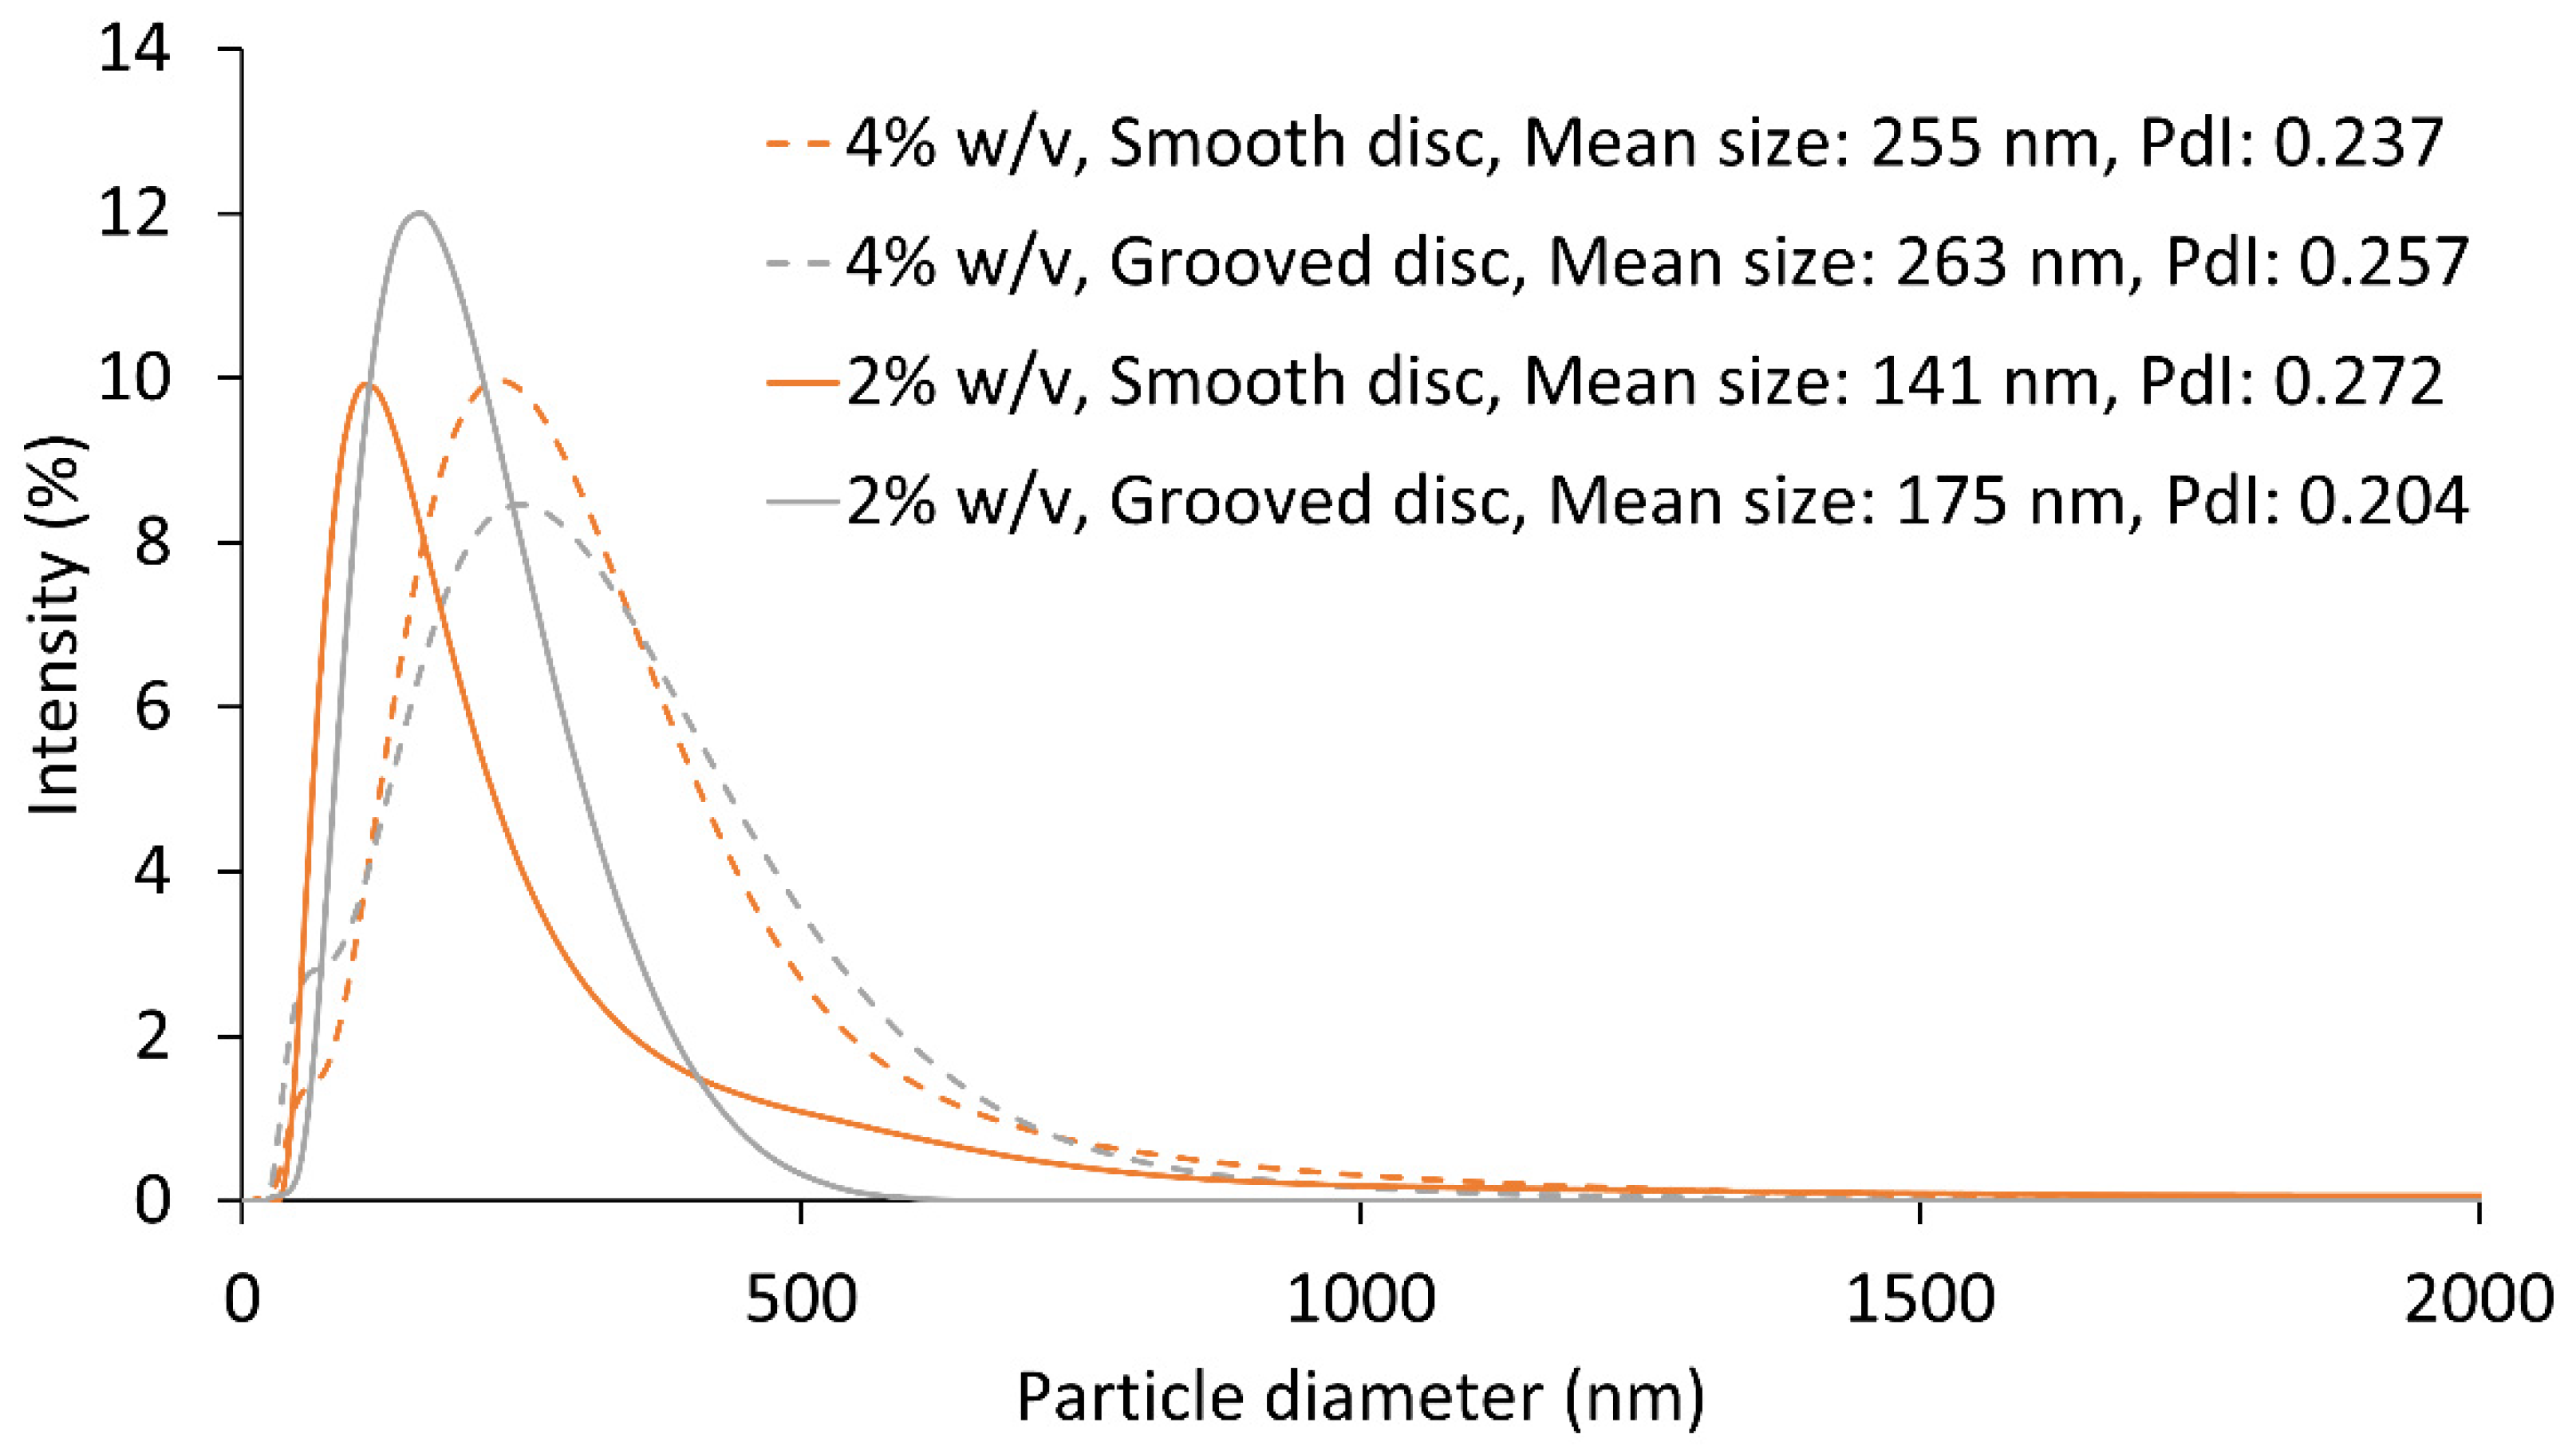
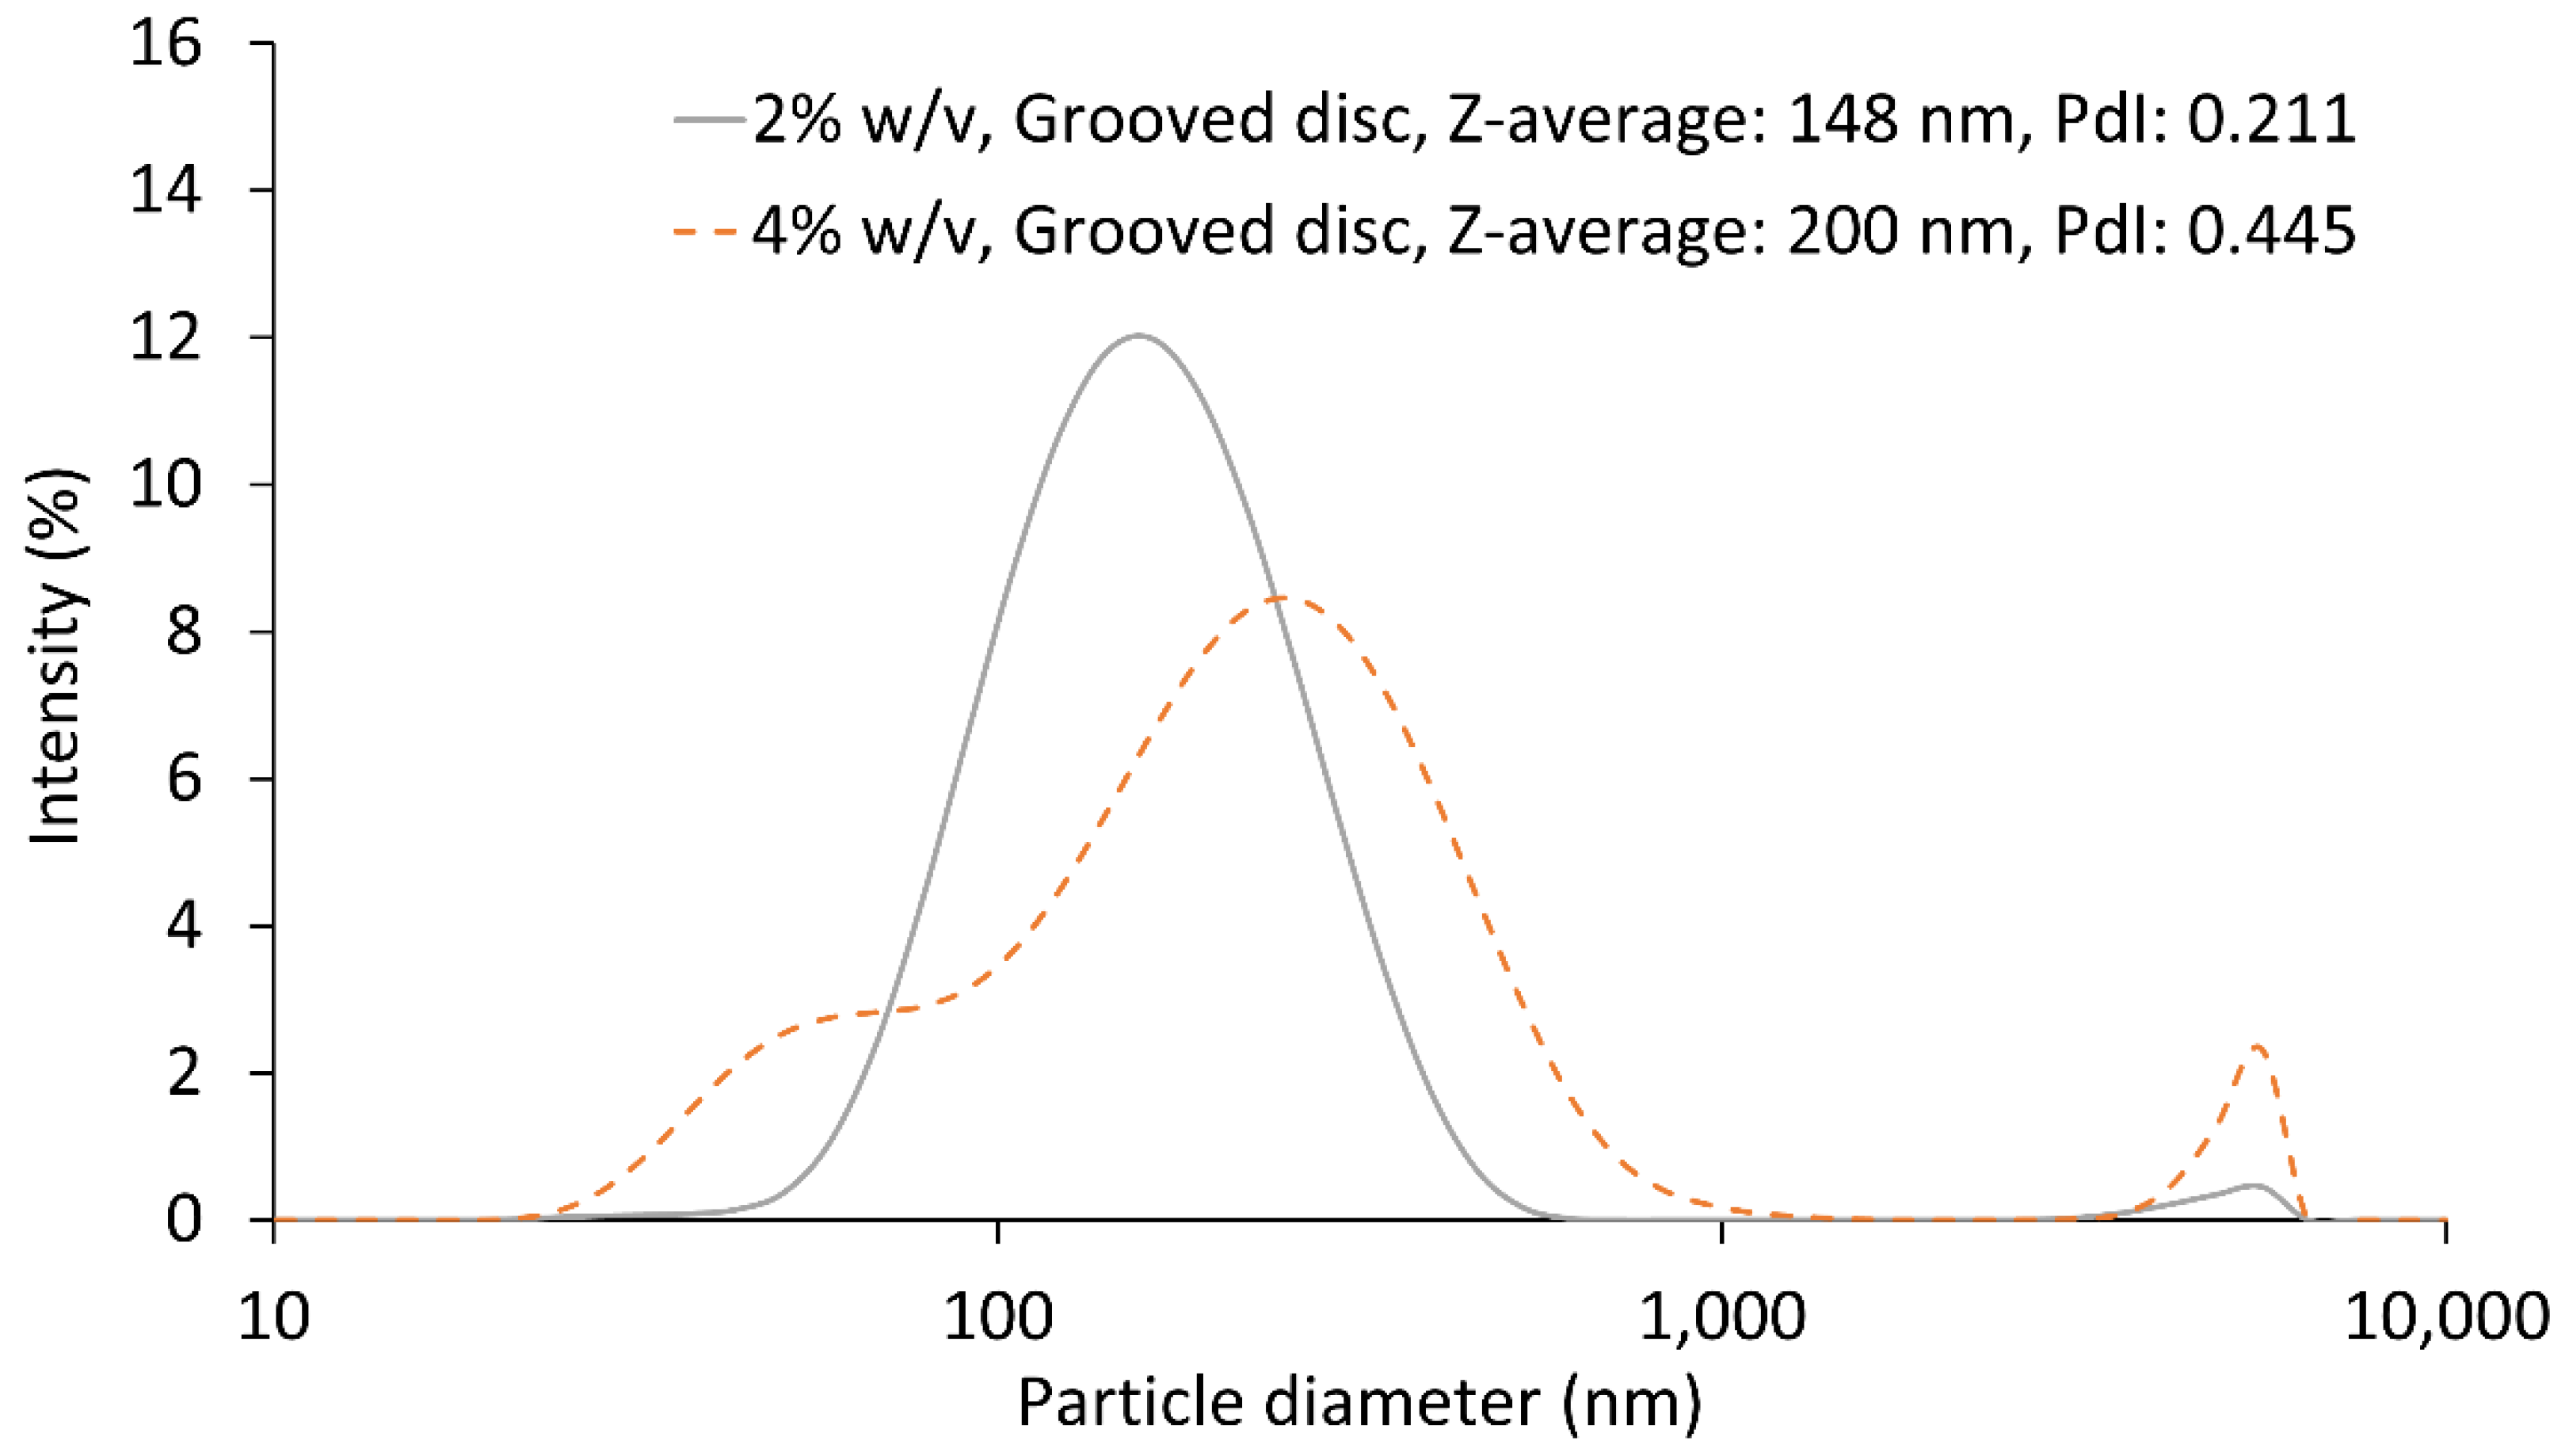
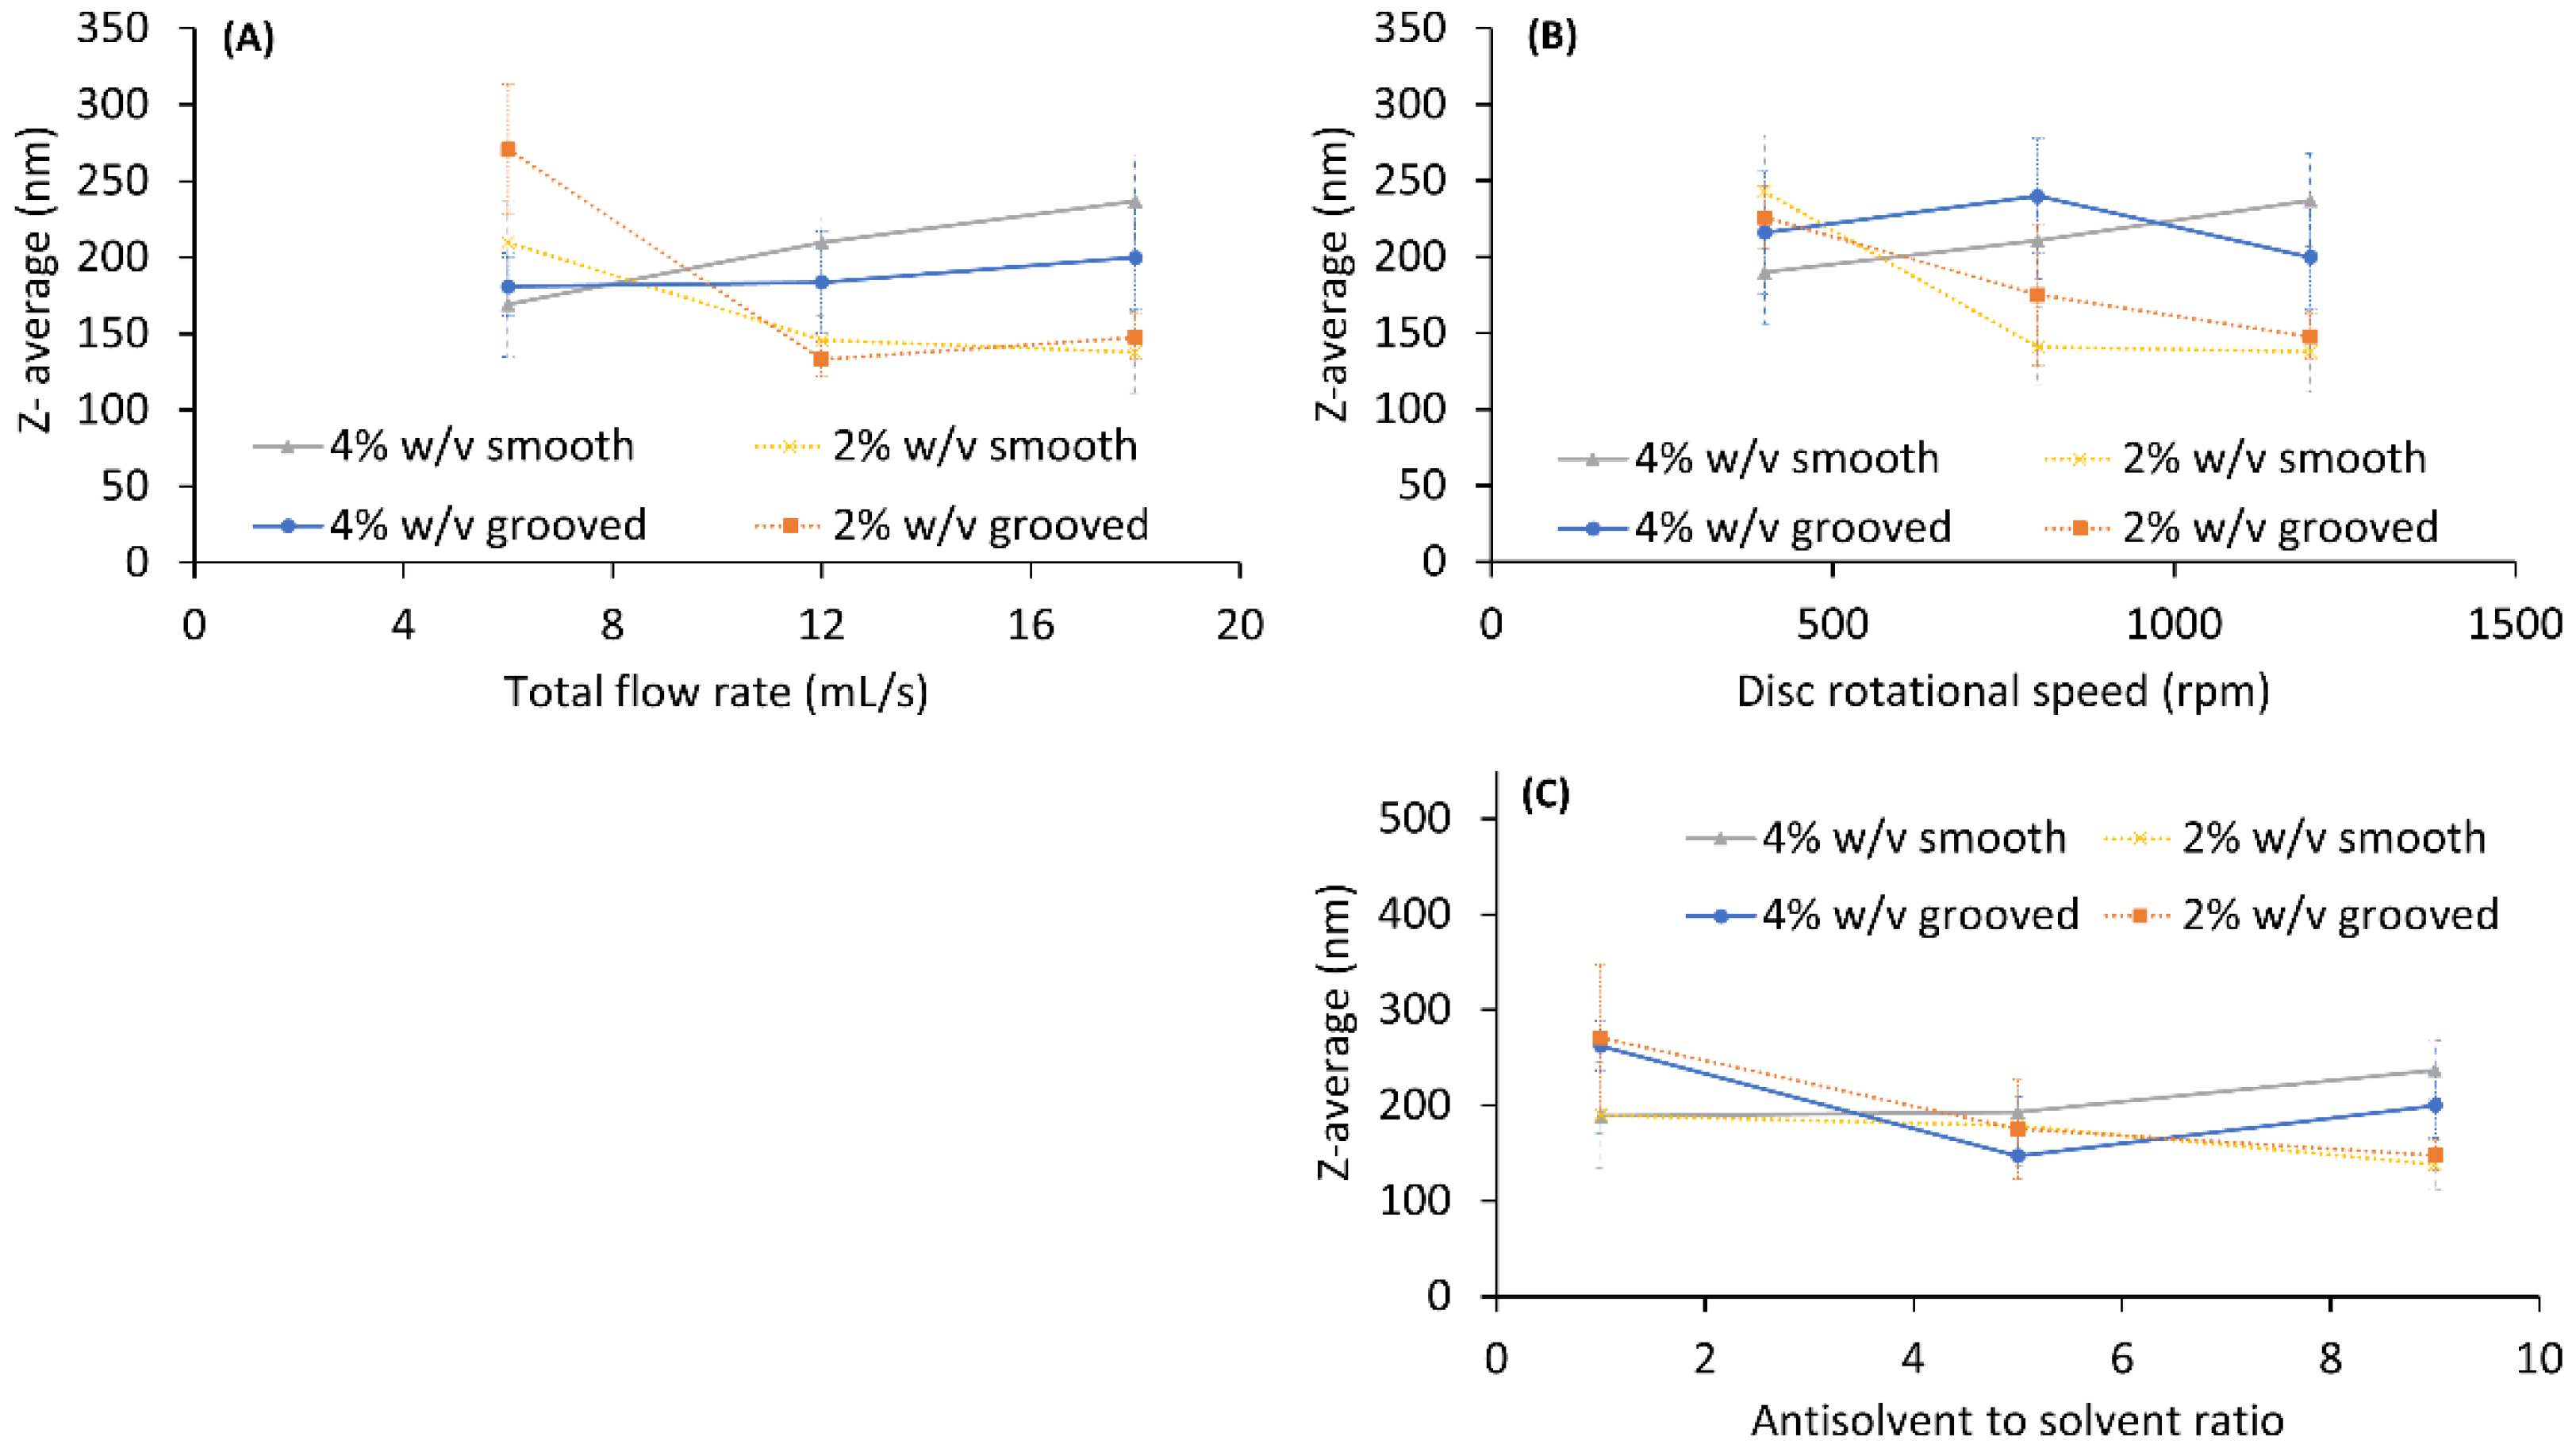
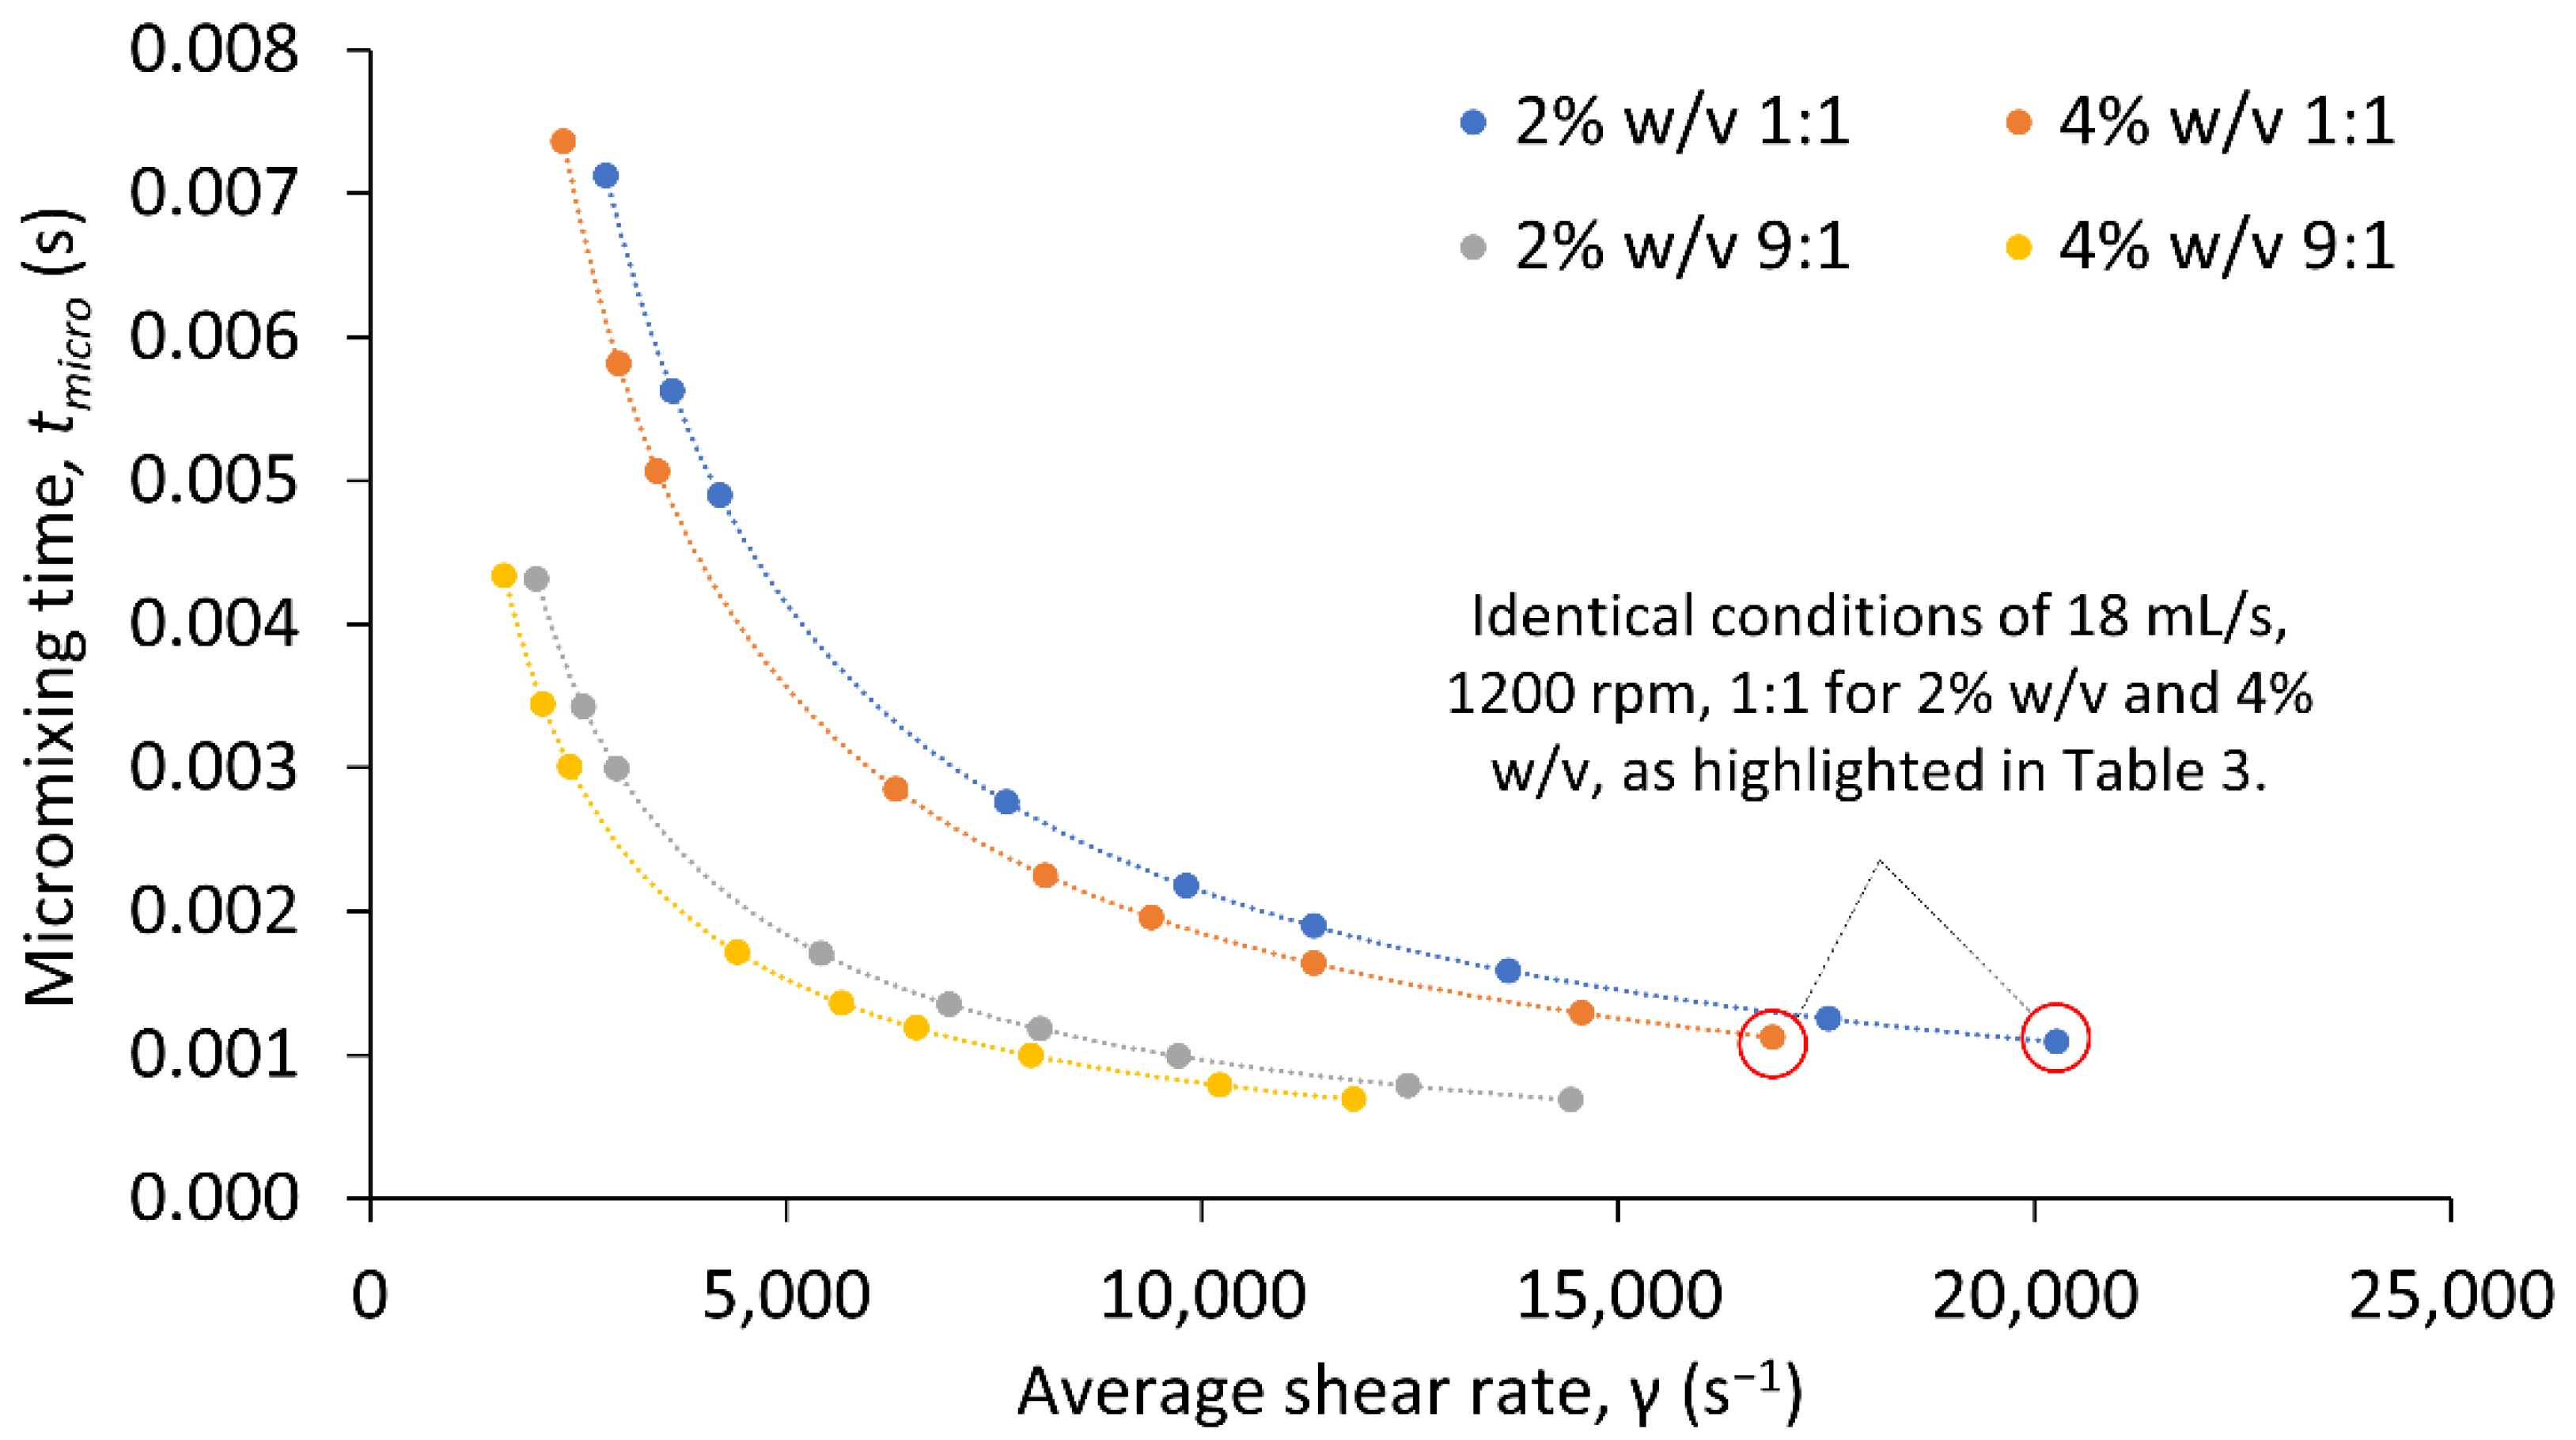
3.3.2. Spinning Disc Reactor

Figure 10 presents the size distributions for 2% w/v and 4% w/v starch on both grooved and smooth disc surfaces at 6 mL/s, 1200 rpm, and 9:1 ratio. The PSDs indicate the precipitation of smaller sized particles at a 4% w/v concentration. In comparison, Figure 11, which displays the PSDs at conditions of a higher flowrate of 18 mL/s with all other conditions being identical, shows smaller sized particles produced at 2% w/v. An increase in particle size at 4% w/v was observed as flow rate increased. Additionally, at the lower flow rate, for both 2% w/v and 4% w/v, nanoparticles produced on the grooved disc were smaller than those on the smooth disc (Figure 10), whereas the opposite was true at the higher flow rate of 18 mL/s (Figure 11).
In contrast to semi-batch processes described earlier and reported in [9,12,15], due to the high shear in the SDR and the shear-thinning behaviour exhibited by the starch solutions at the high shear rates, the viscosity had less of an impact at high starch concentrations. For instance, for the conditions of 18 mL/s, 9:1 ratio, and 1200 rpm, the average viscosities were approximately 9 mPa s and 12 mPa s for 2% w/v and 4% w/v starch, respectively, whereas at a shear rate of 135 s−1, the viscosity in a semi-batch reactor was 14 mPa s (2% w/v) and 20 mPa s (4% w/v). At such lower viscosities in the SDR, mass transfer of molecules from the solution to the solid particle would be less inhibited compared to that of the SBR. Furthermore, an increase in solute concentration results in greater supersaturation, promoting nucleation and thus the production of smaller sized particles in sparingly soluble systems such as the starch system [46,47,48,49,50,51]. This explains the resultant smaller sized starch nanoparticles at 4% w/v concentrations shown in Figure 10.
Figure 11 can be explained with the aid of Figure 12, which focuses on the entire PSD, including the agglomeration peak for the conditions of 18 mL/s, 1200 rpm, and 9:1 ratio, on the grooved disc. The PSD shows a sharper agglomeration peak at the 4% w/v concentration, indicating the possibility of smaller sized particles being produced at 4% w/v, agglomerating to a larger extent, and shifting the peak towards the right side of the PSD. This would be a result of the greater supersaturation generated at the high solute concentration as well as the intense shear generated at the high flow rate, heightening micromixing between the solute/solvent and antisolvent. Agglomeration as a result of smaller particles being generated at a high concentration has been reported previously for various precipitation systems [47,48]. Dong et al. (2011) described a rise in spironolactone nanoparticle size at higher drug concentrations, concluding that agglomeration played a significant role in the size of the resultant nanoparticles [52]. Kakran et al. (2012) also recognised that increasing concentration led to larger curcumin nanoparticles, stating that agglomeration dominated over nucleation at increased concentrations [53]. Furthermore, a large concentration of smaller nucleated particles would suggest a higher surface area for the surfactant to cover. Because the concentration of surfactant was kept constant regardless of starch concentration used in the experiments, it is likely that this would have resulted in reduced surface coverage of the large number of smaller, originally formed nanoparticles at 4% w/v starch concentration, thus promoting their agglomeration. In addition, Figure 12 displays a narrower size distribution at the concentration of 2% w/v, accompanied with a low PdI value. Other than increased agglomeration occurring at 4% w/v, this could be attributed to a greater likelihood of plug flow occurring as a result of the slightly lower viscosity at 2% w/v, giving the molecules a similar processing experience and hence a narrower size distribution [21].
A similar effect as that of flow rate on particles produced with 4% w/v starch was observed as disc rotational speed and antisolvent to solvent ratio were increased. Figure 13 summarises the influence of the experimental conditions on the overall Z-average sizes. Opposite trends in particle size were observed for the 4% w/v concentration in comparison to that of 2% w/v, regardless of disc texture. That is, as any one of the hydrodynamic parameters increased, larger sized particles (primary and agglomerated particles combined) were ultimately formed at 4% w/v starch concentrations than those at 2% w/v concentration.
It is to be noted that shear rate was larger at concentrations of 2% w/v than at 4% w/v, with the difference increasing with flow rate and disc speed (Figure 8). A greater shear rate is responsible for the formation of waves and ripples on the surface of the liquid film and for generating instabilities within the film. The greater the instabilities, the more intense the micromixing between the two liquids and the faster the generation of particles [23,30,54]. This would suggest that at 2% w/v nucleation is faster as a result of the high shear causing molecular collisions to a larger extent, without taking into consideration the impact of initial supersaturation on nucleation. However, it is unclear which of the two, shear rate or supersaturation, is more significant in the process of nucleation, and very little has been published on this matter, particularly on a molecular level.
To further demonstrate shear rate as a measure of mixing capability in the SDR, micromixing time was calculated through Equation (6), where ν , the kinematic viscosity, is a function of the shear rate according to Equation (1) and parameters in Table 1. Equation (6) assumes that micromixing is governed through the process of engulfment, valid when the Schmidt number (Sc = ν/D) Sc < 4000 [22,23,33,55]. The molecular diffusion coefficient, D, for the current system was estimated to be approximately 10−10 m2/s from the Stokes–Einstein equation ( D = k T 6 π μ r ) , where r is the hydrodynamic radius of the solute [22]. Taking the non-Newtonian effect of shear rate on viscosity into consideration, Sc values ranged from 700 to 3600 for the operating parameters studied. Hence, confirming the validation of Equation (6).
t m i c r o = 17.2 ( ν ε ) 0.5
where ε is specific power dissipation, and for the SDR it can be obtained through the equation below [22,33]:
ε = 1 2 t r e s ( ( r 2 ω 2 + u 2 ) o ( r 2 ω 2 + u 2 ) i )
t r e s = ( 81 π 2 ν 16 ω 2 Q 2 ) 1 / 3 ( r 0 4 / 3 r i 4 / 3 )
Figure 14 shows a plot of micromixing time against average shear rate for experiments conducted at 1:1 and 9:1 antisolvent to solvent ratios, with varying flow rates and disc speeds. The plot shows a decline in micromixing time as shear rate is increased. The greater proportion of antisolvent (9:1) leads to a reduction in viscosity and a lower micromixing time according to Equation (6). The trend in Figure 14 demonstrates that slightly lower micromixing times are obtained at 4% w/v for a given shear rate, a result of the relatively larger residence time. However, at similar experimental conditions of flow rate and disc speed, the shear rate at 2% w/v is larger than that at 4% w/v due to the lower liquid viscosity, which consequently reduces micromixing time. This is highlighted in Figure 14 as well as in Table 3 for two sets of experimental conditions at both 2% w/v and 4% w/v starch. A lower micromixing time would allow mixing to occur at a faster rate, thus creating a homogeneous solvent/solute and antisolvent mixture with reduced local supersaturation. This in turn would lead to spontaneous precipitation of smaller sized particles. However, micromixing time is very similar for the two concentrations (Table 3) and therefore is unlikely to have influenced the difference in particle size at these concentrations. Instead, the kinetics of the precipitation process would appear to have a more significant impact on particle characteristics, through the generation of greater supersaturation at 4% w/v. Furthermore, micromixing time is roughly an order of magnitude lower than nucleation time, estimated visually from a high-speed camera to be roughly 10−2 s for the conditions studied at a concentration of 2% w/v [56]. The significant difference between the micromixing time and nucleation time points towards a well-mixed system, indicating little impact of micromixing time on starch nanoparticle size. Although nucleation time was not determined for 4% w/v, it is probable that nucleation time would be of a similar magnitude as that for 2% w/v.

4. Conclusions

The effects of high shear rates generated by the spinning disc on the precipitation of starch nanoparticles through the solvent–antisolvent method were examined. Concentrations of 2% w/v and 4% w/v starch in 0.5M NaOH solutions demonstrated shear-thinning behaviour at high shear rates in the SDR, which helped to mitigate mass transfer limitations typically encountered in conventional agitated vessels. Power law relationships for the two concentrations studied were established, with the consistency index k and power law index n broadly in line with expectations based on the published literature for starch solutions. Finally, an investigation into the effect of starch concentration on the characteristics of starch nanoparticles formed in the SDR highlights that with reduced mixing and mass transfer limitations between the solvent/solute and antisolvent at high shear rates in the SDR, an increase in starch concentration leads to smaller sized primary particles as a result of the greater supersaturation generated. However, the smaller particles initially produced are likely to undergo agglomeration at greater flow rates and disc rotational speeds, ultimately resulting in starch nanoparticles with overall increased sizes or Z-averages and PSDs at the higher starch concentration. The control of nanoparticle size at higher solute concentrations in the SDR may therefore necessitate judicious selection of hydrodynamic parameters of the SDR as well as the use of appropriate surfactant concentrations to prevent agglomeration.

Author Contributions

Conceptualization, methodology, data curation, and writing—review and editing, S.S., V.Z., and K.B: investigation and formal analysis, S.S.; writing—original draft preparation, S.S.; resources, supervision, and project administration, K.B. and V.Z.; funding acquisition, K.B. All authors have read and agreed to the published version of the manuscript.

Funding

This research was funded by an EPSRC Doctoral Training Award made available to SS. The APC was funded by Newcastle University.

Conflicts of Interest

The authors declare no conflict of interest. The funders had no role in the design of the study; in the collection, analyses, or interpretation of data; in the writing of the manuscript, or in the decision to publish the results.

Nomenclature

n Power law index (-)
k Consistency index (mPa)
r Radial position (m)
Q Flow rate (m3 s−1)
t m i c r o Micromixing time (s)
t r e s Residence time (s)
z Vertical distance from disc surface (along z-axis) (m)
Greek symbols
γ ˙ Local shear rate at a given radial position (s−1)
γ ˙ a v e Average shear rate across whole disc (s−1)
ρ Liquid density (kg m−3)
δ Film thickness (m)
ε Specific dissipation rate (W kg−1)
ω Angular velocity (rad s−1)
η Dynamic viscosity (Pa s or mPa s)
ν Kinematic viscosity (m2 s−1)

References

  1. Dufresne, A. Starch and nanoparticle. Polysaccharides 2014, 1–28. [Google Scholar] [CrossRef]
  2. Le Corre, D.; Bras, J.; Dufresne, A. Starch nanoparticles: A review. Biomacromolecules 2010, 11, 1139–1153. [Google Scholar] [CrossRef] [PubMed]
  3. Singh, A.V.; Nath, L.K.; Singh, A. Pharmaceutical, food and non-food applications of modified starches: A critical review. Electron. J. Environ. Agric. Food Chem. 2010, 9, 1214–1221. [Google Scholar]
  4. Ahmad, M.; Gani, A.; Hassan, I.; Huang, Q.; Shabbir, H. Production and characterization of starch nanoparticles by mild alkali hydrolysis and ultra-sonication process. Sci. Rep. 2020, 10, 3533. [Google Scholar] [CrossRef]
  5. Kaur, J.; Kaur, G.; Sharma, S.; Jeet, K. Cereal starch nanoparticles—A prospective food additive: A review. Crit. Rev. Food. Sci Nutr. 2017, 58, 1097–1107. [Google Scholar] [CrossRef]
  6. Le Corre, D.; Angellier-Coussy, H. Preparation and application of starch nanoparticles for nanocomposites: A review. React. Funct. Polym. 2014, 85, 97–120. [Google Scholar] [CrossRef]
  7. Sandhu, K.S.; Nain, V. Starch nanoparticles: Their preparation and applications. In Plant Biotechnology: Recent Advancements and Developments; Gahlawat, S.K., Salar, R.K., Siwach, P., Duhan, J.S., Kumar, S., Kaur, P., Eds.; Springer: Singapore, 2017; pp. 213–232. [Google Scholar] [CrossRef]
  8. Sun, Q.; Li, G.; Dai, L.; Ji, N.; Xiong, L. Green preparation and characterisation of waxy maize starch nanoparticles through enzymolysis and recrystallisation. Food Chem. 2014, 162, 223–228. [Google Scholar] [CrossRef]
  9. Hebeish, A.; El-Rafie, M.; EL-Sheikh, M.; El-Naggar, M. Ultra-fine characteristics of starch nanoparticles prepared using native starch with and without surfactant. J. Inorg. Organomet. Polym. Mater. 2014, 24, 515–524. [Google Scholar] [CrossRef]
  10. Kim, H.; Park, S.S.; Lim, S. Preparation, characterization and utilization of starch nanoparticles. Colloids Surf. B Biointerfaces 2015, 126, 607–620. [Google Scholar] [CrossRef]
  11. Bel Haaj, S.; Thielemans, W.; Magnin, A.; Boufi, S. Starch nanocrystals and starch nanoparticles from waxy maize as nanoreinforcement: A comparative study. Carbohydr. Polym. 2016, 143, 310–317. [Google Scholar] [CrossRef]
  12. Wu, X.; Chang, Y.; Fu, Y.; Ren, L.; Tong, J.; Zhou, J. Effects of non-solvent and starch solution on formation of starch nanoparticles by nanoprecipitation. Starch Stärke 2016, 68, 258–263. [Google Scholar] [CrossRef]
  13. Chin, S.F.; Azman, A.; Pang, S.C. Size Controlled synthesis of starch nanoparticles by a microemulsion method. J. Nanomater. 2014, 2014, 7. [Google Scholar] [CrossRef] [Green Version]
  14. Sana, S.; Boodhoo, K.; Zivkovic, V. Production of starch nanoparticles through solvent-antisolvent precipitation in a spinning disc reactor. Green Process. Synth. 2019, 8, 507–515. [Google Scholar] [CrossRef]
  15. Hedayati, S.; Niakousari, M.; Mohsenpour, Z. Production of tapioca starch nanoparticles by nanoprecipitation-sonication treatment. Int. J. Biol. Macromol. 2020, 143, 136–142. [Google Scholar] [CrossRef]
  16. Tan, Y.; Xu, K.; Li, L.; Liu, C.; Song, C.; Wang, P. Fabrication of size-controlled starch-based nanospheres by nanoprecipitation. Acs Appl. Mater. Interfaces 2009, 1, 956–959. [Google Scholar] [CrossRef]
  17. Ma, X.; Jian, R.; Chang, P.R.; Yu, J. Fabrication and characterization of citric acid-modified starch nanoparticles/plasticized-starch composites. Biomacromolecules 2008, 9, 3314–3320. [Google Scholar] [CrossRef]
  18. Qin, Y.; Liu, C.; Jiang, S.; Xiong, L.; Sun, Q. Characterization of starch nanoparticles prepared by nanoprecipitation: Influence of amylose content and starch type. Ind. Crops Prod. 2016, 87, 182–190. [Google Scholar] [CrossRef]
  19. Dalvi, S.V.; Dave, R.N. Controlling particle size of a poorly water-soluble drug using ultrasound and stabilizers in antisolvent precipitation. Ind. Eng. Chem. Res. 2009, 48, 7581–7593. [Google Scholar] [CrossRef]
  20. Boodhoo, K. Spinning disc reactor for green processing and synthesis. In Process Intensification for Green Chemistry; Boodhoo, K., Harvey, A., Eds.; John Wiley & Sons, Ltd.: Hoboken, NJ, USA, 2013; pp. 59–90. [Google Scholar]
  21. Mohammadi, S.; Boodhoo, K.V.K. Online conductivity measurement of residence time distribution of thin film flow in the spinning disc reactor. Chem. Eng. J. 2012, 207, 885–894. [Google Scholar] [CrossRef] [Green Version]
  22. Mohammadi, S.; Harvey, A.; Boodhoo, K.V.K. Synthesis of TiO2 nanoparticles in a spinning disc reactor. Chem. Eng. J. 2014, 258, 171–184. [Google Scholar] [CrossRef] [Green Version]
  23. Cafiero, L.M.; Baffi, G.; Chianese, A.; Jachuck, R.J.J. Process intensification: Precipitation of barium sulfate using a spinning disk reactor. Ind. Eng. Chem. Res. 2002, 41, 5240–5246. [Google Scholar] [CrossRef]
  24. Tai, C.Y.; Tai, C.; Chang, M.; Liu, H. Synthesis of magnesium hydroxide and oxide nanoparticles using a spinning disk reactor. Ind. Eng. Chem. Res. 2007, 46, 5536–5541. [Google Scholar] [CrossRef]
  25. Chin, S.F.; Iyer, K.S.; Raston, C.L.; Saunders, M. Size selective synthesis of superparamagnetic nanoparticles in thin fluids under continuous flow conditions. Adv. Funct. Mater. 2008, 18, 922–927. [Google Scholar] [CrossRef]
  26. Ahoba-Sam, C.; Boodhoo, K.V.K.; Olsbye, U.; Jens, K. Tailoring Cu nanoparticle catalyst for methanol synthesis using the spinning disk reactor. Materials 2018, 11, 154. [Google Scholar] [CrossRef] [PubMed] [Green Version]
  27. D’Intino, A.F.; de Caprariis, B.; Santarelli, M.L.; Verdone, N.; Chianese, A. Best operating conditions to produce hydroxyapatite nanoparticles by means of a spinning disc reactor. Front. Chem. Sci. Eng. 2014, 8, 156–160. [Google Scholar] [CrossRef]
  28. Moharir, R.G.; Gogate, P.R.; Rathod, V.K. Process intensification of synthesis of magnetite using spinning disc reactor. Can. J. Chem. Eng. 2012, 90, 996–1005. [Google Scholar] [CrossRef]
  29. Khan, W.H.; Rathod, V.K. Process intensification approach for preparation of curcumin nanoparticles via solvent–nonsolvent nanoprecipitation using spinning disc reactor. Chem. Eng. Process. Process Intensif. 2014, 80, 1–10. [Google Scholar] [CrossRef]
  30. Oxley, P.; Brechtelsbauer, C.; Ricard, F.; Lewis, N.; Ramshaw, C. Evaluation of spinning disk reactor technology for the manufacture of pharmaceuticals. Ind. Eng. Chem. Res. 2000, 39, 2175–2182. [Google Scholar] [CrossRef]
  31. Rathod, W.R.; Rathod, V.K. Continuous preparation of nimesulide nanoparticles by liquid antisolvent precipitation using spinning disc reactor. J. Chem. Technol. Biotechnol. 2019, 94, 919–926. [Google Scholar] [CrossRef]
  32. Vicevic, M.; Boodhoo, K.V.K.; Scott, K. Catalytic isomerisation of α-pinene oxide to campholenic aldehyde using silica-supported zinc triflate catalysts. Chem. Eng. J. 2007, 133, 43–57. [Google Scholar] [CrossRef]
  33. Ghiasy, D.; Tham, M.T.; Boodhoo, K.V.K. Control of a spinning disc reactor: An experimental study. Ind. Eng. Chem. Res. 2013, 52, 16832–16841. [Google Scholar] [CrossRef]
  34. Boodhoo, K.V.K.; Jachuck, R.J. Process intensification: Spinning disk reactor for styrene polymerisation. Appl. Therm. Eng. 2000, 20, 1127–1146. [Google Scholar] [CrossRef]
  35. Boodhoo, K.V.K.; Jachuck, R.J. Process intensification: Spinning disc reactor for condensation polymerisation. Green Chem. 2000, 2, 235–244. [Google Scholar] [CrossRef]
  36. Dobie, C.G.; Vicevic, M.; Boodhoo, K.V.K. An evaluation of the effectiveness of continuous thin film processing in a spinning disc reactor for bulk free-radical photo-copolymerisation. Chem. Eng. Process. Process Intensif. 2013, 71, 97–106. [Google Scholar] [CrossRef] [Green Version]
  37. Boodhoo, K.V.K. Chapter 11. Higee technologies and their applications to green intensified processing. Altern. Energy Sources Green Chem. 2016, 339–359. [Google Scholar] [CrossRef]
  38. Boodhoo, K.V.K.; Dunk, W.A.E.; Jachuck, R.J. Influence of centrifugal field on free-radical polymerization kinetics. J. Appl. Polym. Sci. 2002, 85, 2283–2286. [Google Scholar] [CrossRef]
  39. Sana, S.; Zivkovic, V.; Boodhoo, K. Empirical modelling of hydrodynamic effects on starch nanoparticles precipitation in a spinning disc reactor. Nanomaterials 2020, 10, 2202. [Google Scholar] [CrossRef]
  40. Shin, J.; Jones, N.; Ik Lee, D.; Fleming, P.; Joyce, M.; Dejong, R.; Bloembergen, S. Rheological properties of starch latex dispersions and starch latex-containing coating colors. In Technical Association of the Pulp and Paper Industry, Proceedings of the Papercon 2012 Conference Proceedings, New Orleans, LA, USA, 22–25 April 2012; TAPPI Press: Peachtree Corners, GA, USA, 2012; pp. 382–406. [Google Scholar]
  41. Roberts, S.A.; Cameron, R.E. The effects of concentration and sodium hydroxide on the rheological properties of potato starch gelatinisation. Carbohydr. Polym. 2002, 50, 133–143. [Google Scholar] [CrossRef]
  42. Che, L.; Li, D.; Wang, L.; Özkan, N.; Chen, X.D.; Mao, Z. Rheological properties of dilute aqueous solutions of cassava starch. Carbohydr. Polym. 2008, 74, 385–389. [Google Scholar] [CrossRef]
  43. Boodhoo, K. Process Intensification: Spinning Disc Reactor for the Polymerisation of Styrene. Ph.D. Thesis, Newcastle University, Newcastle upon Tyne, UK, 1999. [Google Scholar]
  44. Hu, J.; Cheng, F.; Lin, Y.; Zhao, K.; Zhu, P. Dissolution of starch in urea/NaOH aqueous solutions. J. Appl. Polym. Sci. 2016, 133. [Google Scholar] [CrossRef]
  45. Sánchez Pérez, J.A.; Rodríguez Porcel, E.M.; Casas López, J.L.; Fernández Sevilla, J.M.; Chisti, Y. Shear rate in stirred tank and bubble column bioreactors. Chem. Eng. J. 2006, 124, 1–5. [Google Scholar] [CrossRef]
  46. Mersmann, A. Crystallization and precipitation. Chem. Eng. Process. Process Intensif. 1999, 38, 345–353. [Google Scholar] [CrossRef]
  47. Matteucci, M.E.; Hotze, M.A.; Johnston, K.P.; Williams, R.O. Drug nanoparticles by antisolvent precipitation: Mixing energy versus surfactant stabilization. Langmuir 2006, 22, 8951–8959. [Google Scholar] [CrossRef] [PubMed]
  48. Dong, Y.; Ng, W.K.; Hu, J.; Shen, S.; Tan, R.B.H. A continuous and highly effective static mixing process for antisolvent precipitation of nanoparticles of poorly water-soluble drugs. Int. J. Pharm. 2010, 386, 256–261. [Google Scholar] [CrossRef]
  49. D’Addio, S.M.; Prud’homme, R.K. Controlling drug nanoparticle formation by rapid precipitation. Adv. Drug Deliv. Rev. 2011, 63, 417–426. [Google Scholar] [CrossRef]
  50. Valente, I.; Celasco, E.; Marchisio, D.L.; Barresi, A.A. Nanoprecipitation in confined impinging jets mixers: Production, characterization and scale-up of pegylated nanospheres and nanocapsules for pharmaceutical use. Chem. Eng. Sci. 2012, 77, 217–227. [Google Scholar] [CrossRef]
  51. Zhang, Z.; Xie, M.; Kuang, Y.; Wang, J.; Le, Y.; Zeng, X.; Chen, J. Preparation of amorphous drug nanoparticles by high-gravity reactive precipitation technique. Chem. Eng. Process. Process Intensif. 2016, 104, 253–261. [Google Scholar] [CrossRef]
  52. Dong, Y.; Ng, W.K.; Shen, S.; Kim, S.; Tan, R.B.H. Controlled antisolvent precipitation of spironolactone nanoparticles by impingement mixing. Int. J. Pharm. 2011, 410, 175–179. [Google Scholar] [CrossRef]
  53. Kakran, M.; Sahoo, N.G.; Tan, I.; Li, L. Preparation of nanoparticles of poorly water-soluble antioxidant curcumin by antisolvent precipitation methods. J. Nanopart. Res. 2012, 14. [Google Scholar] [CrossRef]
  54. Ozar, B.; Cetegen, B.M.; Faghri, A. Experiments on the flow of a thin liquid film over a horizontal stationary and rotating disk surface. Exp. Fluids 2003, 34, 556–565. [Google Scholar] [CrossRef]
  55. Baldyga, J.; Podgórska, W.; Pohorecki, R. Mixing-precipitation model with application to double feed semibatch precipitation. Chem. Eng. Sci. 1995, 50, 1281–1300. [Google Scholar] [CrossRef]
  56. Sana, S. Experimental and Modelling Studies of Process Intensification for the Solvent-Antisolvent Precipitation of Nanoparticles in a Spinning Disc Reactor. Ph.D. Thesis, Newcastle University, Newcastle upon Tyne, UK, 2020. [Google Scholar]
Figure 1. Schematic of experimental set-up for spinning disc reactor (SDR). (1) solute/ solvent feed, (2) antisolvent feed, (3) peristaltic pumps, (4) SDR, (5) motor, (6) temperature-controlled water tank, (7) temperature control unit, (8) SDR rotational control unit, and (9) product outlet and receiver. Reproduced from [39], MDPI, 2020.
Processes 08 01622 g001
Figure 2. Grooved and smooth disc surfaces. Reproduced from [14], De Gruyter, 2019.
Processes 08 01622 g002
Figure 3. Effect of starch concentration on zero shear viscosity.
Processes 08 01622 g003
Figure 4. Shear rate against viscosity at 2% w/v starch and 4% w/v starch, measured by Bohlin viscometer, and viscosities at zero shear (η0) measured through Ostwald viscometer.
Processes 08 01622 g004
Figure 5. Comparison of viscosity vs. shear rate plots with published data for power law model determination at 2% w/v and 4% w/v starch concentration.
Processes 08 01622 g005
Figure 6. Local shear rate along the radial distance of the SDR.
Processes 08 01622 g006
Figure 7. Average estimated viscosities of 2% w/v and 4% w/v starch solutions at varying conditions in the SDR from the power law model for starch using the expression given in Equation (1).
Processes 08 01622 g007
Figure 8. Effect of disc rotational speed on shear rate at various experimental conditions.
Processes 08 01622 g008
Figure 9. Particle size distribution (PSD) for the effect of starch concentration in the semi-batch reactor (SBR) set-up at 800 rpm agitation and 1 mL/s ethanol addition. (A) Z-average and polydispersity index (PdI) values calculated for combined primary and agglomerated peaks. (B) Focused image of primary peaks for 1% w/v and 2% w/v starch.
Processes 08 01622 g009
Figure 10. Effect of concentration on PSD at 6 mL/s, 1200 rpm, and 9:1 ratio for both grooved and smooth disc surfaces.
Processes 08 01622 g010
Figure 11. Effect of concentration on PSD at 18 mL/s, 1200 rpm, and 9:1 ratio for both grooved and smooth disc surfaces.
Processes 08 01622 g011
Figure 12. Overall PSD showing effect of concentration at 18 mL/s, 1200 rpm, and 9:1 ratio on the grooved disc.
Processes 08 01622 g012
Figure 13. Z-average sizes for 2% w/v and 4% w/v starch highlighting the effect of (A) flow rate at 9:1 ratio and 1200 rpm, (B) disc speed at 9:1 ratio and 18 mL/s, and (C) antisolvent to solvent ratio at 18 mL/s and 1200 rpm.
Processes 08 01622 g013
Figure 14. Micromixing time against shear rate for 2% w/v and 4% w/v starch.
Processes 08 01622 g014
Table 1. Power law parameters for starch at various concentrations.
Starch Concentration (% w/v)Consistency Index, k (mPa)Power Law Index, nSource
221.8 ± 2.40.911 ± 0.010This work
431.5 ± 1.20.897 ± 0.006This work
21102.60.852[40]
1 (tapioca starch)15.20.858[42]
Table 2. Average shear rates across the disc, γ ˙ a v e (s−1), to 2 significant figures, at selected conditions displayed in Figure 6.
Flow Rate (mL/s)Rotational Speed (rpm)Antisolvent to Solvent Ratio γ ˙ a v e at 2% w/v (s−1) γ ˙ a v e at 4% w/v (s−1)
6400920001600
18400930002400
181200914,00012,000
181200120,00017,000
Table 3. Variation of micromixing time with average shear rate at 2% w/v and 4% w/v.
Flow Rate (mL/s)Rotational Speed (rpm)Antisolvent to Solvent RatioConcentration (% w/v)Average Shear Rate, γ ˙ a v e (s−1)Micromixing Time (s)
6400122000 4.31 × 10 3
64009:141600 4.34 × 10 3
1812001:1220,000 1.09 × 10 3
1812001:1417,000 1.12 × 10 3
Publisher’s Note: MDPI stays neutral with regard to jurisdictional claims in published maps and institutional affiliations.

