Article

Design of a Separation Process for Natural 2-Phenylethanol with Economic and Safety Considerations

by
Luis E. Puga-Córdova
1,
Zahira A. Pérez-Sánchez
1,
Antíoco López-Molina
1,
Laura Conde-Báez
2,
Arturo Jiménez-Gutiérrez
3 and
Carolina Conde-Mejía
1,*
1
División Académica Multidisciplinaria de Jalpa de Méndez, Universidad Juárez Autónoma de Tabasco, Carretera Estatal Libre Villahermosa—Comalcalco Km 27 s/n, Ranchería Ribera Alta, Jalpa de Méndez 86205, Tabasco, Mexico
2
Ingeniería en Biotecnología, Universidad Politécnica de Pachuca, Carretera Ciudad Sahagún-Pachuca Km 20, Ex-Hacienda de Santa Bárbara, Zempoala 43830, Hidalgo, Mexico
3
Instituto Tecnológico de Celaya, Tecnológico Nacional de México, García Cubas Pte 600 esq, Avenida Tecnológico, Celaya 38010, Guanajuato, Mexico
*
Author to whom correspondence should be addressed.
Processes 2020, 8(12), 1570; https://doi.org/10.3390/pr8121570
Submission received: 4 November 2020 / Revised: 25 November 2020 / Accepted: 26 November 2020 / Published: 28 November 2020
(This article belongs to the Special Issue Advanced Modeling of Biomanufacturing Processes)

Abstract

:
The present work aimed to design a separation process for 2-phenylethanol (2-PEA) produced by whey fermentation and to evaluate its economic potential. The separation sequence consisted of a liquid–liquid extraction column followed by two distillation columns for 2-PEA purification and solvent recovery. In addition, the use of ethyl acetate as a solvent for the extraction process was analyzed. The results, aided by the Aspen Plus v.10 process simulator, showed that 2-PEA can be separated with a purity of 96% by weight. The operating cost of the process, estimated at USD 22.70 per kilogram, shows that the separation alternative developed in this work has a high economic potential. The use of ethyl acetate as a solvent was found to efficiently remove 2-PEA from the fermentation mixture. From a process safety analysis point of view, the use of a bioprocess safety index developed in this work identified the separation process sections that could require special attention as part of the safety engineering stage of the process implementation.

1. Introduction

Chemical compounds such as flavors have long been used in everyday life, whether provided from natural sources or artificially produced. The odors present in everyday life produce feelings of comfort, satisfaction, and security. This is why it is important to produce different compounds with special odor characteristics. The chemical 2-phenylethanol (2-PEA), characterized by its rose smell, is in high demand in the food, cosmetic, and pharmaceutical industries because of its use in perfumes, soaps, detergents, deodorant formulations, and even as a food additive [1]. The consumer preference for natural products has increased the use of natural 2-PEA within these industries [2]. The largest natural production of 2-PEA comes from the extraction of rose petals, which has an estimated price of USD 1000 per kilogram [3]. However, the demand for natural 2-PEA is not being sufficiently met; therefore, other production alternatives have been considered, one of those being fermentation [4]. Several works have reported the production of 2-PEA experimentally from various substrates [3,4,5,6,7]. An alternative raw material for fermentation is whey, which is an abundant waste product from the cheese industry, rich in lactose and other nutrients [8]. In several countries, including Mexico, a significant amount of the whey produced is not used. For example, in the Tulancingo Valley of Mexico, which is an important cheese producer, an estimated 164.25 MM liters of whey are produced annually, of which 80,000 L per day are dumped into farmland and water bodies without any treatment [9], causing serious environmental problems. It has been estimated that whey leads to chemical oxygen demand (COD) values of 60–80 g L−1 and biochemical oxygen demand (BOD) values of 30–50 g L−1, which exceed the limits established by environmental regulations [10]. The production of a rose aroma from different types of whey (acidic and sweet) has been demonstrated experimentally by Conde-Báez et al. [5,6] as part of efforts to revalue this waste stream from the cheese industry. The difficulty for producing 2-PEA by this route is that 2-PEA is very diluted in water. According to experimental data, the concentration at the end of fermentation of 2-PEA can vary in a range from 0.7 to 5.6 g L−1 [3,5].
Another relevant aspect in the design of a 2-PEA purification process is that related to safety. This aspect has become a priority for governments and companies, since safe designs bring many benefits, such as savings in insurance payments, fewer unplanned shutdowns, continuity of production, compensation, and fines, among others [11]. For the fermentation processes such as the one considered in this work, the challenge lies in the correct assessment of the streams with low concentrations of hazardous substances, which may be considered as safe. However, it has been shown that diluted flammable substances still represent a hazard, even at concentrations lower than 2% (mole basis) [12,13]. Therefore, it is necessary to develop methods for the risk evaluation of these types of emerging processes.
No design has been reported for the purification of 2-PEA from a fermentation source. Therefore, the objective of this work was to design a separation process for 2-PEA produced by whey fermentation. Synthesis of a separation flowchart was developed, followed by process simulations with outcomes that included economic and safety aspects. This work contributes to the development of a sustainable process for the production of 2-PEA, since it allows the revaluation of a waste from the cheese industry, preventing polluting emissions and yielding benefits to the agricultural sector of developing countries.

2. Methodology

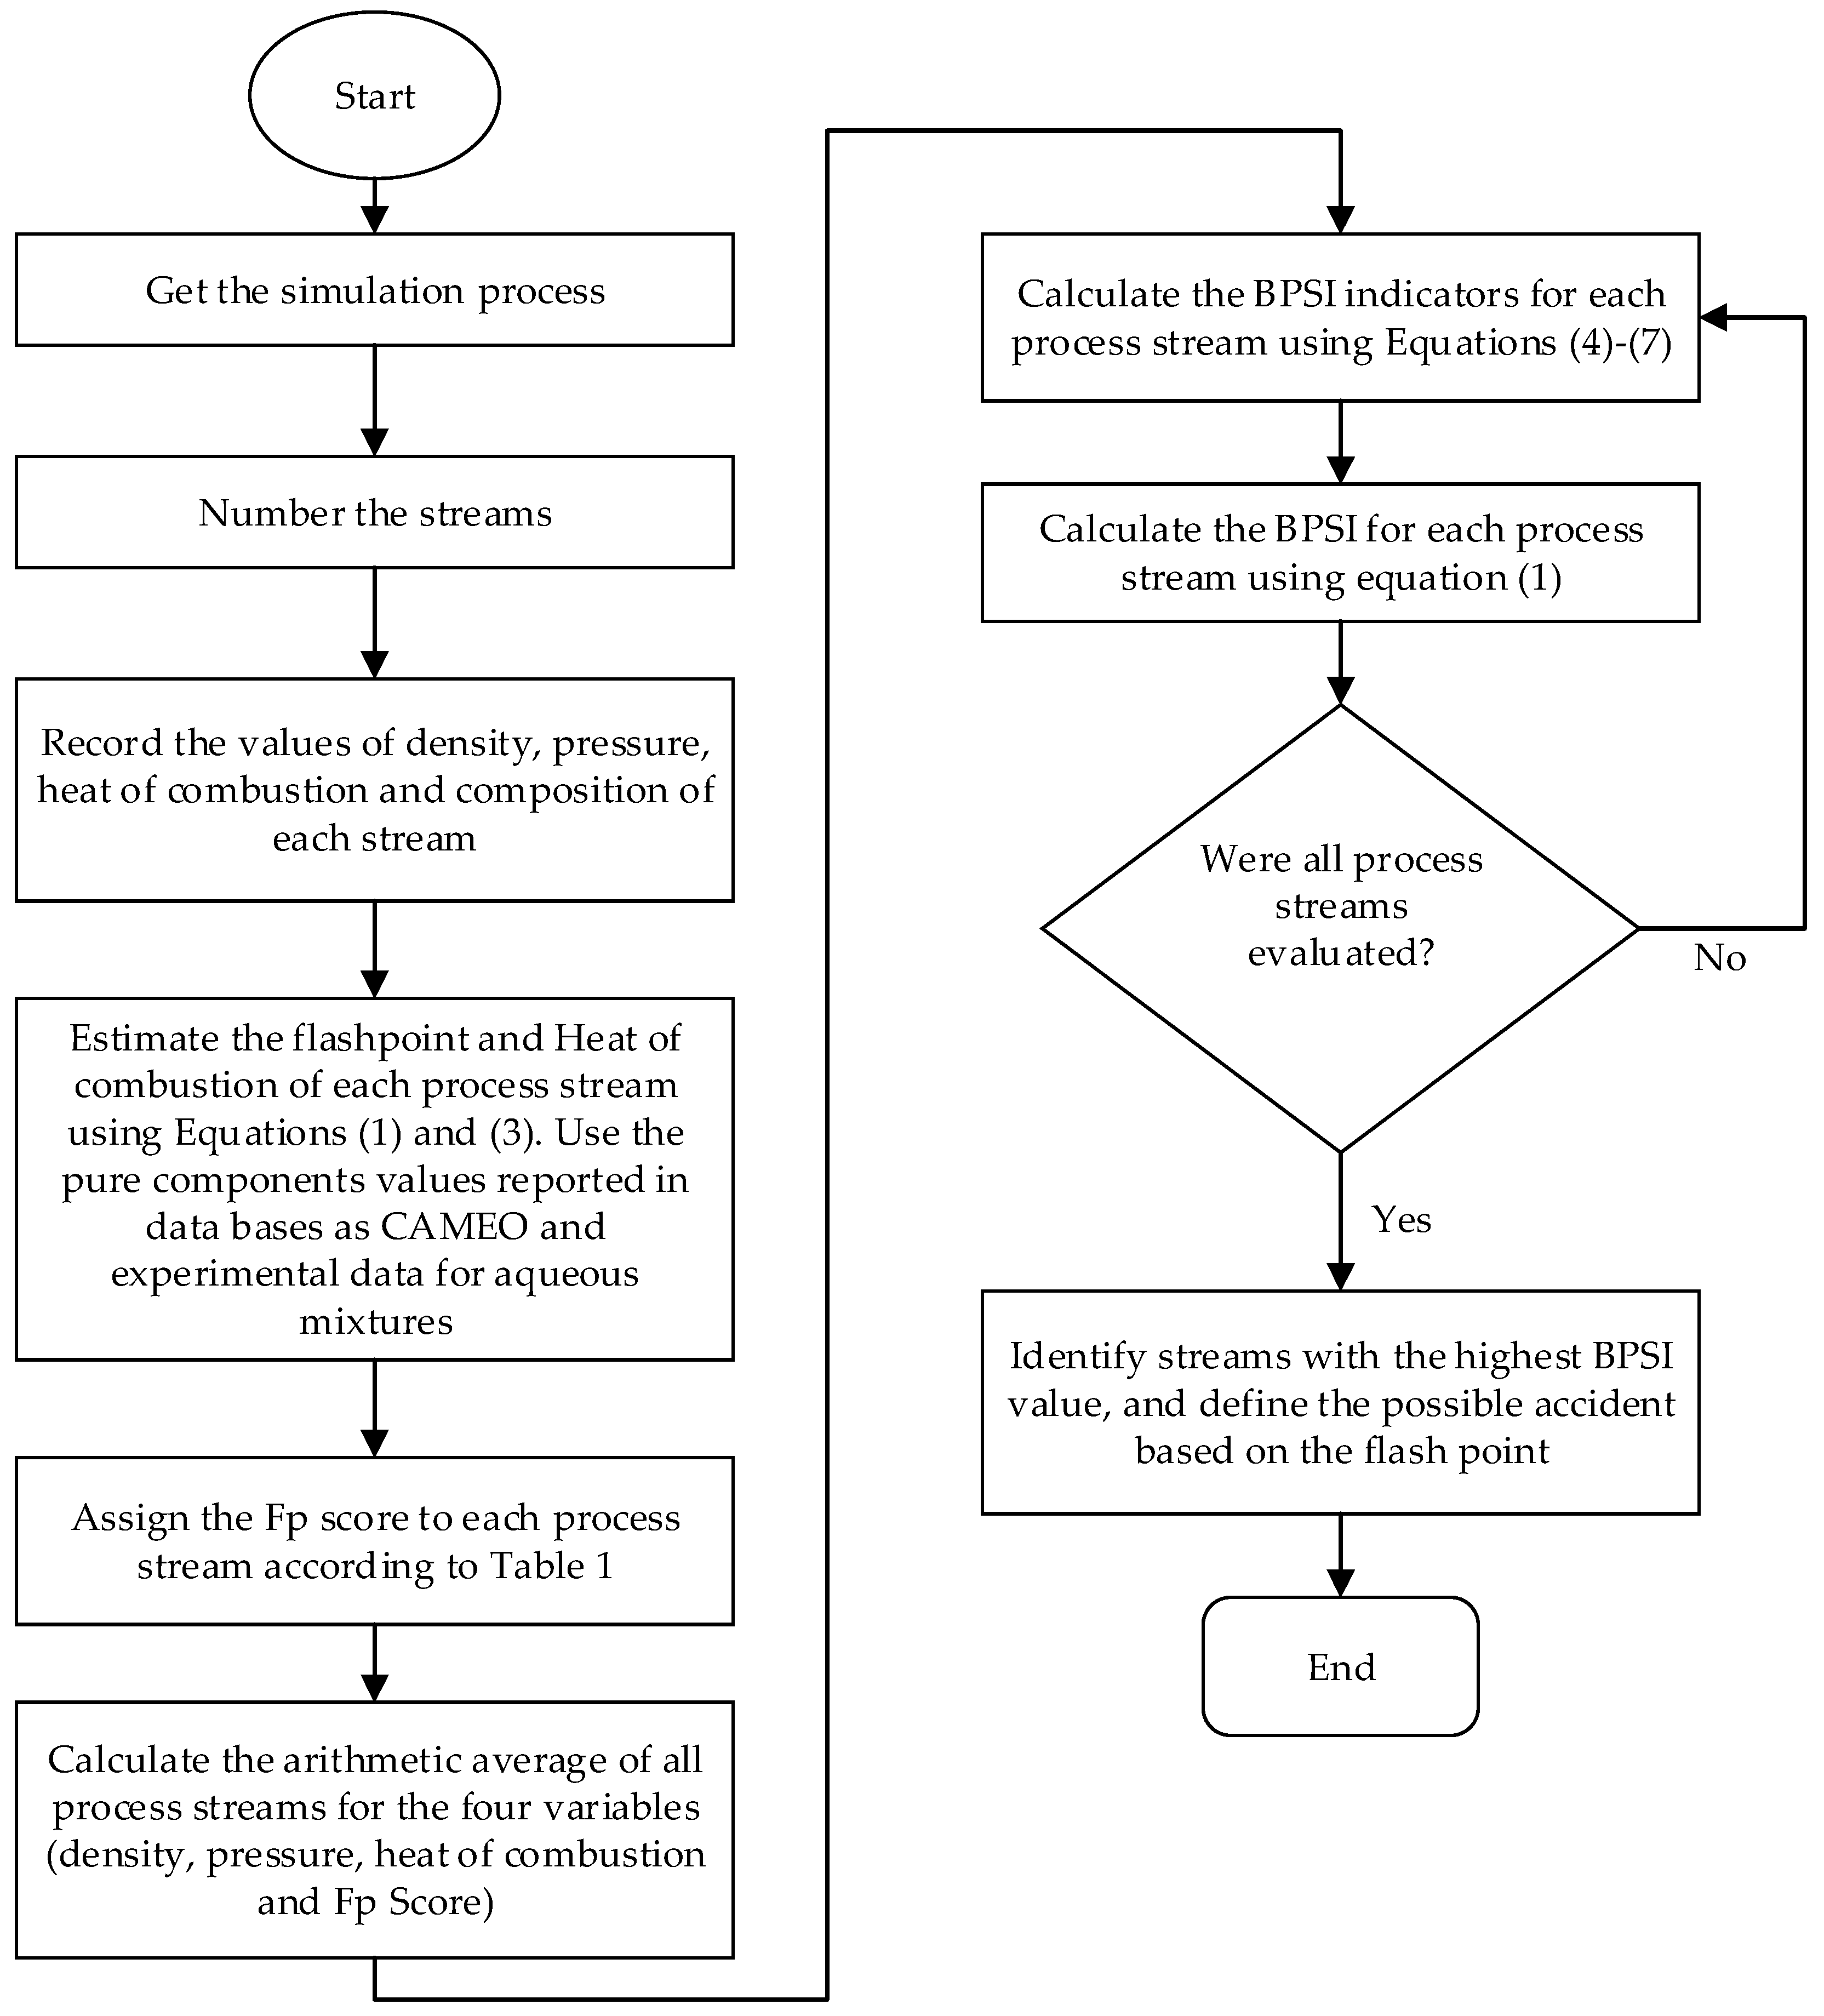
2.1. Safety Assessment

A major part of this work was the safety assessment of the bioprocess, for which a modification of the process stream index (PSI) proposed by Shariff et al. [14] was developed. This index is used to identify the most hazardous streams in chemical processes and is calculated from four parameters, namely, density, pressure, heat energy, and explosiveness of the mixture. Its application allows rapid identification of the streams with the highest risk of explosion. However, bioprocesses have different characteristics to chemical processes. Their main difference lies in the type of raw material and in the presence of many aqueous streams. For these cases, an adjustment is proposed herein for two parameters of the PSI index. Heat energy is substituted by combustion heat, and the explosiveness is substituted by mixture combustibility. The justification is as follows. The heat energy is related to the amount of heat of a stream, and heat as such is not associated with the hazardous nature of a given mixture. It is possible to have streams with high thermal energy that are not hazardous, and there may be streams with low thermal energy that are hazardous. In contrast, the heat of combustion directly represents the amount of energy released when a substance burns, which is why explosion and fire consequence models use this value. For this proposed change, the heat of combustion value of mixtures in process streams is approximated by Equation (1).
∆Hcmix = ∑xi∙∆Hci,
where:
∆Hcmix is the heat of combustion of the process streams, ∆Hci is the heat of combustion of pure flammable components, and xi is the mass fraction of each component of the stream.
The second parameter to be substituted is the process stream explosiveness, which for the PSI is estimated by the difference of the stream flammability limits. However, this parameter cannot be calculated for dilute streams or for streams with combustible substances, e.g., vegetable oils. Flammability limits are only reported for highly flammable substances, and they cannot be calculated for the case of aqueous mixtures. Therefore, the modification used in this work consists of replacing the explosion factor by a flammability factor, which is based on the flash point, a property reported for all flammable and combustible substances. This property is a measure of the ease of burning of substances, which means that the probability of burning or explosion is inversely proportional to this value, i.e., at low values of flash point (Fp), there is a high risk of explosions and fires. To include this parameter into the calculation of the index, a classification of the hazard of mixtures is used, as reported by the NFPA-30 standard (see Table 1).
Through these substitutions to the PSI, a bioprocess stream index (BPSI) was developed, with which one can evaluate the hazard of bioprocess streams according to Equation (2).
BPSI=IP∙Iρ∙IHc∙IFp,
where:
IP is the pressure indicator, Iρ is the density indicator, IHc is the combustion energy indicator, and IFp is the combustibility indicator.
For the calculation of the combustibility indicator, the flash point values of pure substances are needed. To approximate the flash point in flammable mixtures, a simple mixing rule was used.
Fpmix=∑xi∙Fpi,
where:
Fpmix is the flash point of the mixture, Fpi is the flash point of the pure components, and xi is the mass fraction of each component in the exit stream.
Once the Fp value of all of the process streams has been estimated, their hazard level is assigned using the flash point score given in Table 1, and the average of this parameter is calculated considering all streams. Finally, the combustibility indicator (IFp) is calculated using Equation (4). The other indicators are estimated in a similar way using Equations (5)–(7). With this strategy, the most hazardous process flows can be identified, and potential accidents can be assessed. Figure 1 shows schematically the steps for the calculation of the BPSI index.
IFp = flash point score of individual stream/average flash point score of all streams,
IP = pressure value of individual stream/average pressure of all streams,
Iρ = density value of individual stream/average density of all streams,
IHC = heat of combustion of individual stream/average heat of combustion of all streams.
The streams with higher BPSI values are the most hazardous; the greater the number of streams with high index values, the less safe the process is. The index makes it possible to identify the most unsafe streams in the process, especially when the project is in the early design stages.

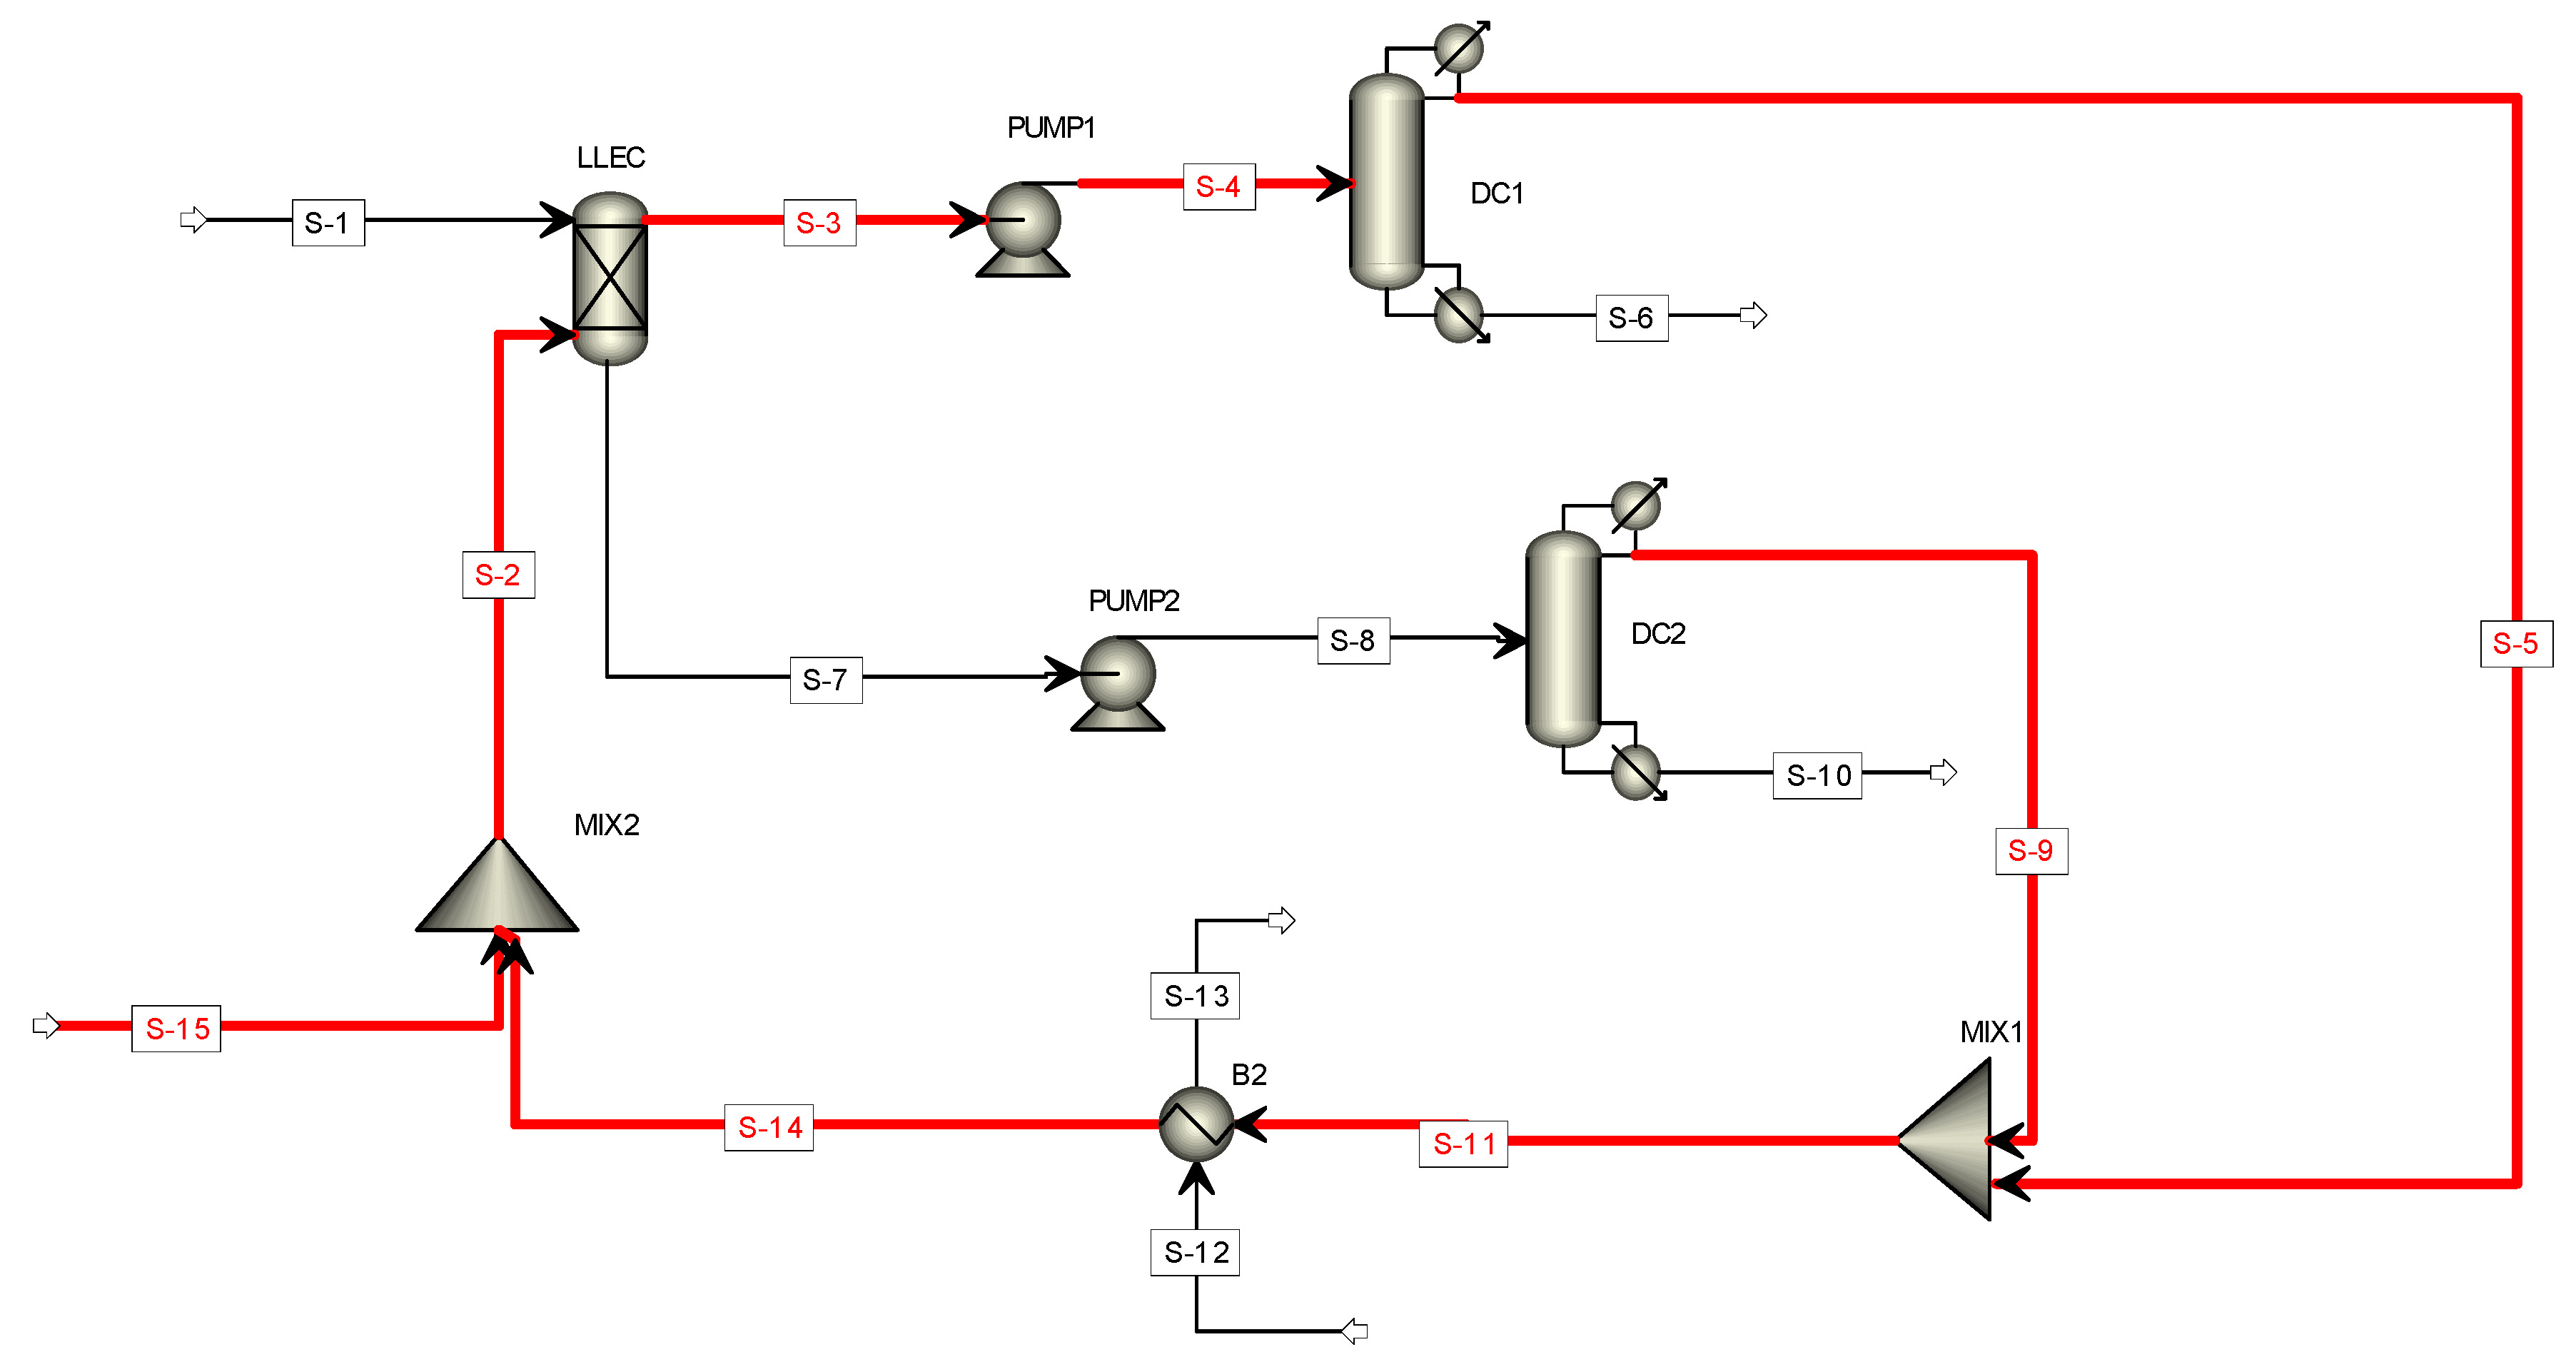
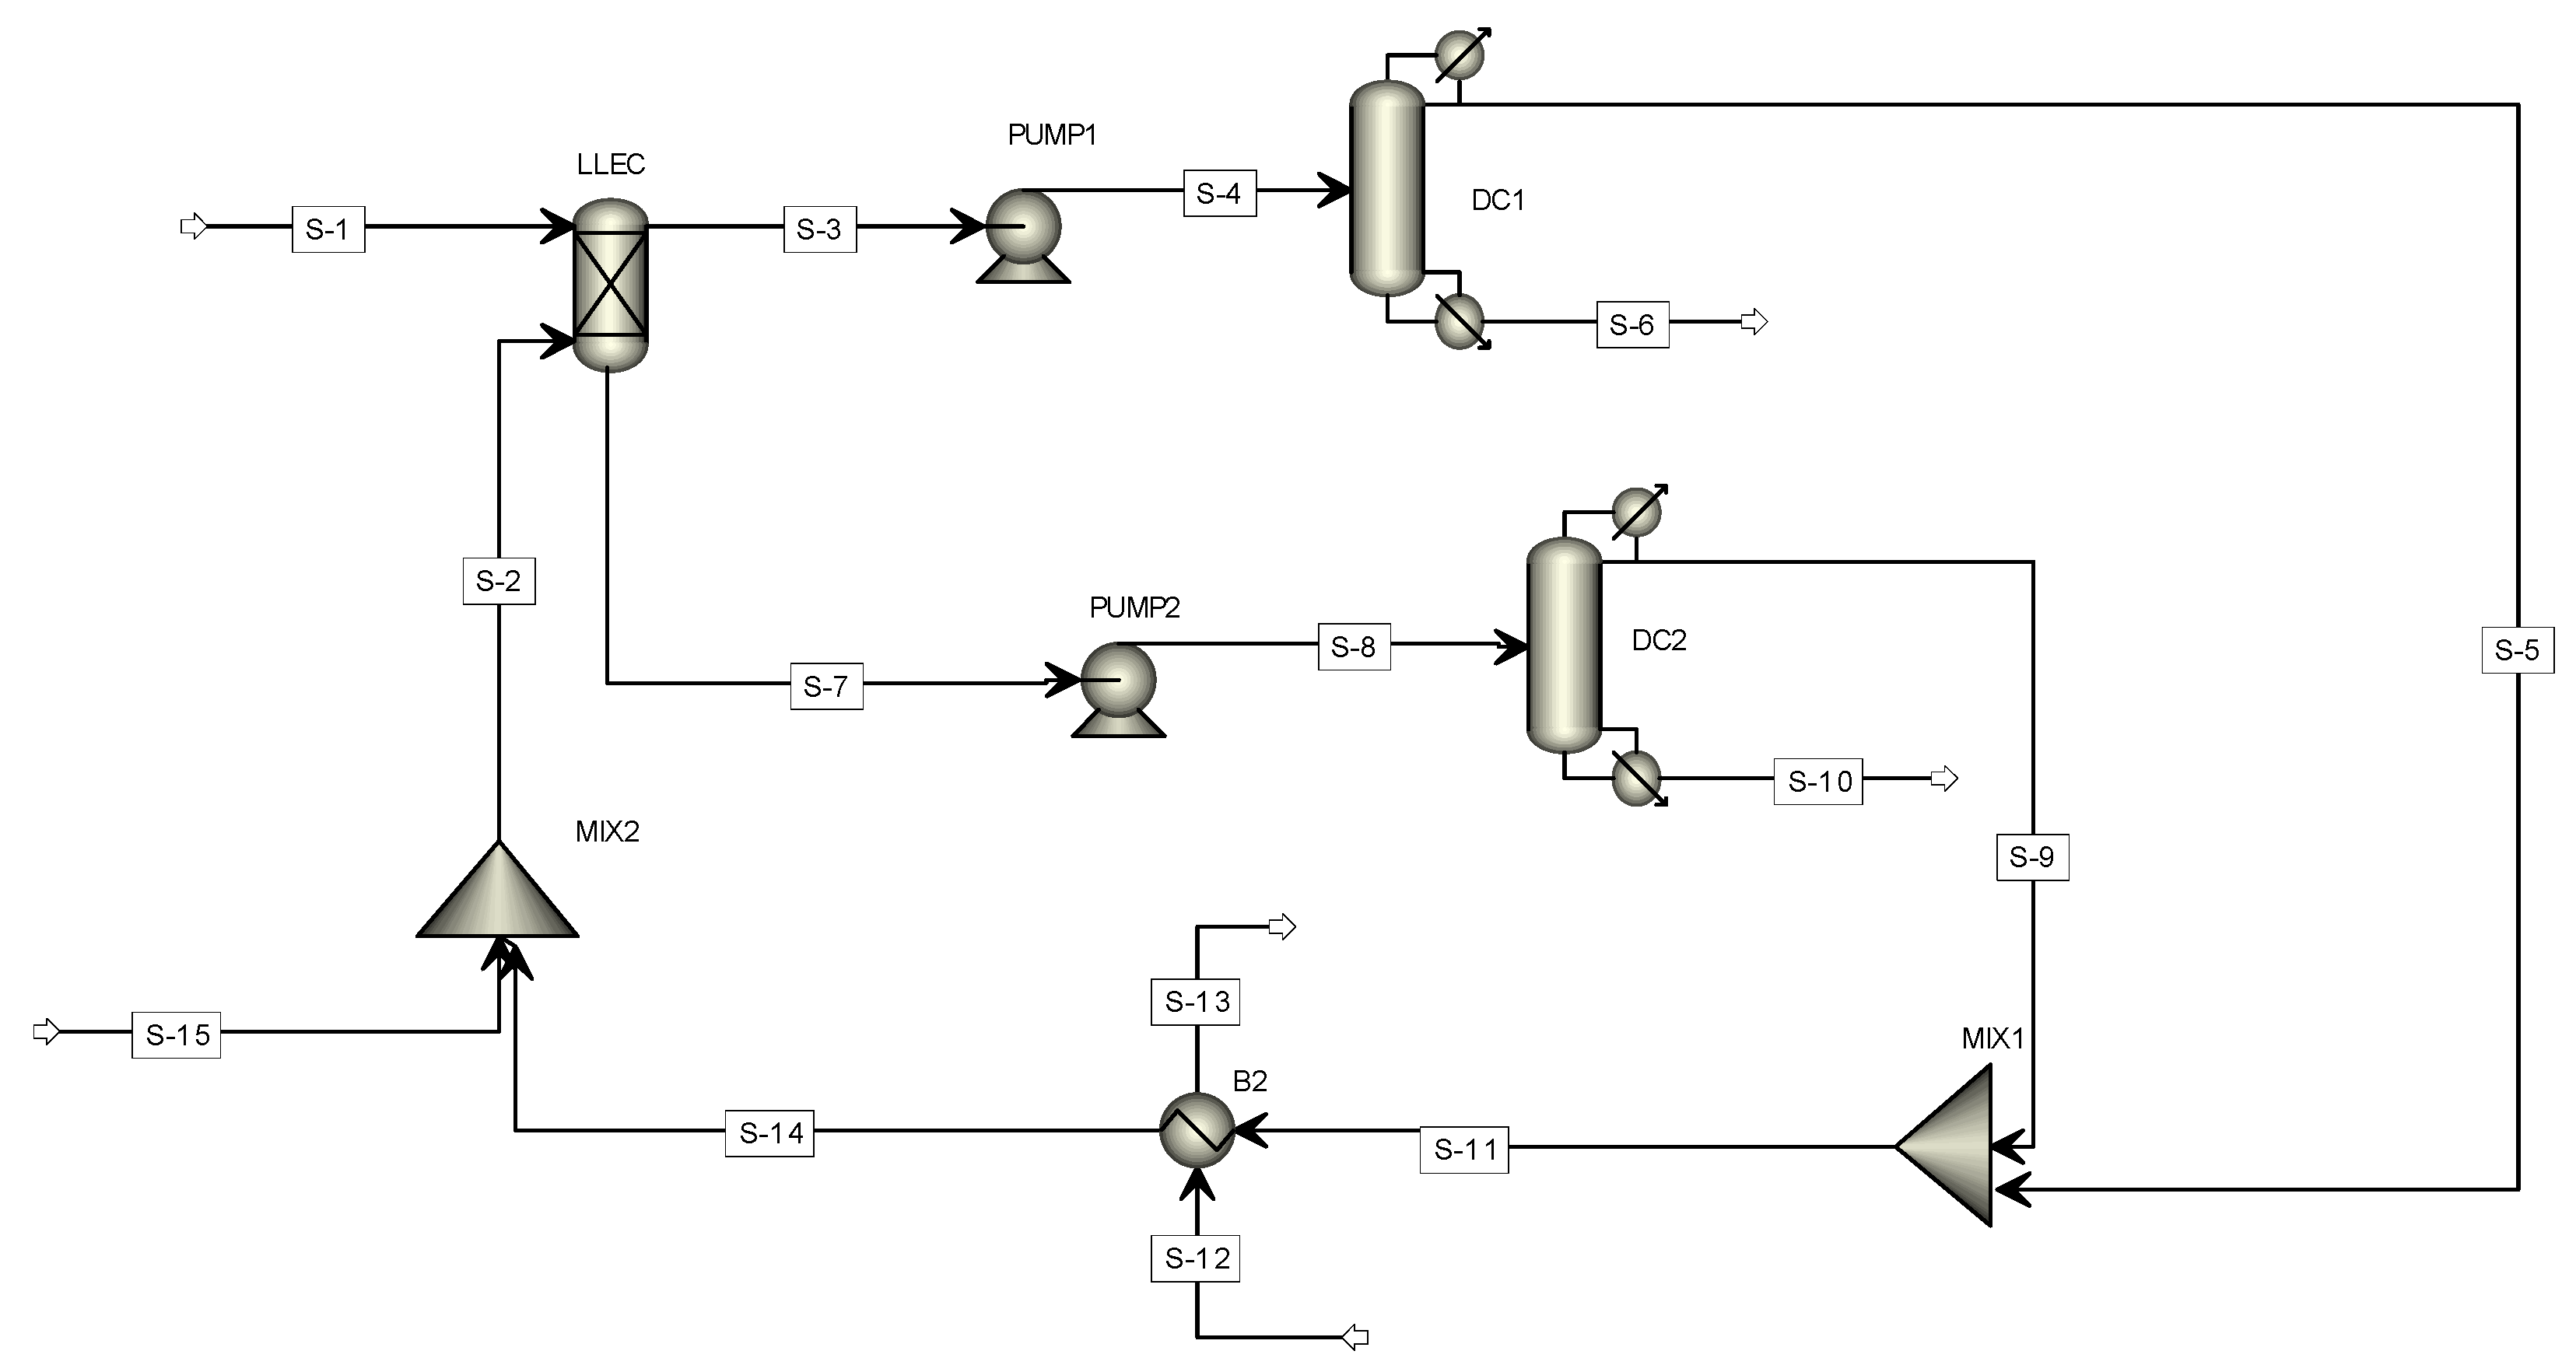
2.2. Design of the Separation Process

The mixture considered in this work was obtained from a sweet whey fermentation process, whose composition was taken as 0.08% of the weight of 2-PEA and 2.27% of the weight of ethanol in an aqueous solution, based on the reports by Conde-Báez et al. [16]. Feed conditions were 30 °C and 1 atm. Given the low concentration of 2-PEA in the mixture, liquid–liquid extraction was selected as the initial stage for the design of the separation process. A review was made of the experimental work about solvents for 2-PEA extraction, taking into account that the solvent should not modify the natural characteristics of 2-PEA. The results found in the literature were that ethyl acetate [4] and oleic acid [17] provide suitable choices. We selected the use of ethyl acetate and evaluated aspects such as its 2-PEA removal efficiency, the recovery fraction for recirculation to the extraction stage, and the impact on the process safety. The extraction column was operated at 30 °C and 1 atm. After extraction, a distillation column, operating at an atmospheric pressure, was required to process the extract stream and separate 2-PEA from the solvent. Some solvent came out in the raffinate stream, for which a second distillation column was used to recover this additional amount of ethyl acetate.
The components present in the process (i.e., 2-PEA, ethanol, water, and ethyl acetate) formed a non-ideal quaternary mixture, for which no experimental data for liquid–liquid equilibrium are available. However, there are experimental data reported for the ternary mixture ethanol–ethyl acetate–water [18]. Aided by these data, a thermodynamic model was explored, and it was found that the universal quasichemical (UNIQUAC) model reproduced these experimental data satisfactorily; therefore, this the type of model was selected to be used for the quaternary mixture.
For the design of the extraction column, the minimum solvent flowrate was obtained through a sensitivity analysis by varying the solvent mass flow to identify the minimum value that provided 99% recovery of 2-PEA. The Fenske–Underwood–Gilliland shortcut method was used to obtain initial designs for the distillation columns [19], which were then validated with the Aspen Plus process simulator using the Radfrac model assuming 70% stage efficiency and a reflux ratio of 1.2 times the minimum value. Each distillation column was designed aiming to minimize the energy consumption. The purity and recovery values for the 2-PEA and ethyl acetate components were set as design specifications in both columns.
To evaluate the economic potential of the process, the separation cost per kilogram of 2-PEA was calculated by relating the annual operating cost required for separation to the annual mass flow of 2-PEA, as shown in Equation (8). Utility costs were taken from the database of the Aspen Plus v.10. process simulator, while for ethyl acetate, the reported cost up-to-date of USD 4.29 kg−1 was used [20].
Unit cost of 2-PEA = operating cost (USD year−1)/annual flow rate (kg year−1)

3. Results and Discussion

The flowsheet of the separation and purification process of 2-PEA, as implemented in the Aspen Plus process simulator, is shown in Figure 2. The feed (S-1) to the extraction column (LLEC) comes from the fermentation of whey [16]. The extract (S-3), containing mostly ethyl acetate and 2-PEA, is obtained, after which a pump is used to increase its inlet pressure to the distillation column.
In the first distillation tower (DC1), 2-PEA is obtained as a bottom product (S-6) with a purity of 96% by weight, while the raffinate stream (S-7) is fed to the second distillation tower (DC2) to recover the ethyl acetate solvent from water. The streams S-5 and S-9 contain mostly ethyl acetate, and they are mixed. A heat exchanger is used to adjust the temperature to 30 °C. The cooled stream (S-14) is mixed with a fresh solvent stream (S-15), and the resulting stream (S-2) is fed to the extraction process. The process stream properties are shown in Table 2.
The design variables for the process equipment units are given in Table 3. For the liquid–liquid extraction column (LLEC), 35 stages and 1000 kg h−1 of solvent were required to carry out the removal of 99.90% of the 2-PEA from the aqueous mixture. For DC1, eight stages and a reflux ratio of 1.08 were required to obtain 2-PEA with a purity of 96.90% and a recovery of 99.99%. For DC2, 19 stages with a reflux ratio of 4.80 were required to separate the solvent with a recovery of 95.00% and a purity of 88.09%.
From the simulation results, a production rate of 2-PEA of 21.43 tons/year−1 was obtained, with an operating cost of USD 486,449 year−1. Conde-Báez et al. [16] presented an analysis of the economic potential of 2-PEA production from a whey fermentation plant (not including separation); their reported production cost amounts to USD 121.76 kg−1. With this result and the cost obtained in this study for the separation stage, an estimation of the total production cost of 2-PEA from whey yields a value of USD 144.46 per kilogram. Since the reported market price of 2-PEA from natural sources is USD 1000 kg−1, a promising economic potential for this process could be expected.
The European Food Safety Authority (EFSA) reported a list of required specifications for flavoring substances, and in particular, the minimum purity of 2-phenyethanol was specified as 95% (weight basis) [21]. The separation process designed in this work achieves 96.90% weight purity, which complies with the established regulation.
As for the use of ethyl acetate as a solvent, it was found that it efficiently removes 2-PEA from the fermentation mixture, reaching a 99.90% removal by weight. However, an amount equivalent to 23.05% by weight of the feed to the extraction column exits in the raffinate stream, which consists of a highly nonideal ethyl acetate–ethanol–water mixture. Figure 3 shows a residue curve diagram for this system at 1 atm. Given the DC2 feed composition, the column would operate on the left-side region of the diagram. After the design was carried out, a mass composition of ethyl acetate in the distillate of 0.8809 (0.6141 mole) was obtained. After the recirculation of the distillate streams of the DC1 and DC2 columns, the fresh ethyl acetate feed represents only 1.16% by weight of the solvent needed in the extraction column. Therefore, the proposed design of the distillation columns shows an efficient solvent recovery.
For the safety analysis, it should be taken into account that the feed comes from a fermentation process. Therefore, some streams contain dilute flammable substances, such as ethanol, in molar concentration from 0.71% to 1.26%. In addition, the solvent (ethyl acetate) is slightly miscible in water, reaching volumetric concentrations in aqueous streams between 0.45% and 7.81%. Apparently, these low concentrations would not be considered as hazardous. However, as reported by Martinez et al. [12] and Astbury et al. [13], these mixtures remain flammable. Table 4 shows the flash point variations of ethanol–water and methyl acetate–water mixtures with respect to the solvent concentration. It should be mentioned that no experimental data were found for ethyl acetate, the solvent for this process; however, given the similarity of chemical structure with methyl acetate, the data for this chemical were used as a suitable approximation.
With the process information reported in Table 2 and the additional information of Table 4, the methodology described in Figure 1 was applied to obtain the BPSI value of each stream. The results are reported in Table 5. It can be seen that 8 out of the 15 streams have a BPSI value higher than 2. Figure 4 highlights the streams identified as less safe. The properties that contribute the most to the hazard nature of these streams are the heat of combustion and the flash point (note the values of the indicators and the flash point score). Such streams contain ethyl acetate (the solvent), which has a flash point of −4.5 °C; therefore, the most likely accidents associated with these streams, in case of leakage, are explosion or fire. This suggests that particular attention, as part of the safety engineering stage of the process, should be centered in these sections.

4. Conclusions

A design was developed for a separation process of 2-PEA contained as part of the outlet of a whey fermentation process. The development of this process would provide two important contributions, namely, a positive impact on the value chain of the dairy industry, and a reduction of the environmental impact due to the disposal of whey waste. It has been shown that the designed separation scheme can provide a purity of 2-PEA of 96%, with a recovery equivalent to 99.98%. An economic estimation for a complete 2-PEA production process showed the promising economic potential for this process. As far as the safety analysis, a new inherent safety index was developed, and its application detected the parts of the separation process that could require special protection layers to prevent incidents associated with potential leaking accidents.

Author Contributions

Conceptualization, L.E.P.-C., Z.A.P.-S., A.J.-G., and C.C.-M.; investigation, L.E.P.-C., Z.A.P.-S., and L.C.-B.; methodology, L.E.P.-C., Z.A.P.-S., A.L.-M., and C.C.-M.; supervision, C.C.-M.; writing—original draft, A.L.-M., L.C.-B., and C.C.-M.; writing—review and editing, A.J.-G. All authors read and agreed to the published version of the manuscript.

Funding

The research received no external funding.

Acknowledgments

The authors thank Universidad Juárez Autónoma de Tabasco for the support through project No. 790.

Conflicts of Interest

The authors declare no conflict of interest.

References

  1. Etschmann, M.; Bluemke, W.; Sell, D.; Schrader, J. Biotechnological production of 2-phenylethanol. Appl. Microbiol. Biotechnol. 2002, 59, 1–8. [Google Scholar] [PubMed]
  2. SF&WB. Kemin Shares Highlights of Consumer Shopping Study. Available online: https://www.snackandbakery.com/articles/91042 (accessed on 25 November 2020).
  3. Hua, D.; Xu, P. Recent advances in biotechnological production of 2-phenylethanol. Biotechnol. Adv. 2011, 29, 654–660. [Google Scholar] [CrossRef]
  4. Chreptowicz, K.; Wielechowska, M.; Główczyk-Zubek, J.; Rybak, E.; Mierzejewska, J. Production of natural 2-phenylethanol: From biotransformation to purified product. Food Bioprod. Process. 2016, 100, 275–281. [Google Scholar] [CrossRef]
  5. Conde-Báez, L.; Castro-Rosas, J.; Páez-Lerma, J.B.; Villagómez-Ibarra, J.R.; Gómez-Aldapa, C.A. Uso de lactosuero ácido para la producción sustentable de aroma a rosas (2-feniletanol) con Kluyveromyces marxianus. ReIbCi 2017, 3, 91–97. [Google Scholar]
  6. Conde-Báez, L.; Castro-Rosas, J.; Villagómez-Ibarra, J.R.; Páez-Lerma, J.B.; Gómez-Aldapa, C.A. Evaluación de desechos de la industria quesera para la producción de 2-fenil etanol. Acta Univ. 2017, 27, 57–64. [Google Scholar] [CrossRef]
  7. Velasco-Bucheli, R.; Gil, J.H.; García, C.M.; Durango, D.L. Production of 2-phenylethanol in the biotransformation of cinnamyl alcohol by the plant pathogenic fungus Colletotrichum acutatum. Vitae 2010, 17, 272–280. [Google Scholar]
  8. Carvalho, F.; Prazeres, A.R.; Rivas, J. Cheese whey wastewater: Characterization and treatment. Sci. Total Environ. 2013, 445–446, 385–396. [Google Scholar] [CrossRef]
  9. Pretenden Mejorar el Uso de Lactosuero. Available online: https://www.semanticscholar.org/paper/FLASH-POINT-DETERMINATION-OF-BINARY-MIXTURES-OF-%2C-Martinez-Rus/d1c1ed658a11b7746432a566df582d0d79304b4c (accessed on 25 November 2020).
  10. Prazeres, A.R.; Carvalho, F.; Rivas, J. Cheese whey management: A review. J. Environ. Manag. 2012, 110, 48–68. [Google Scholar] [CrossRef]
  11. CCPS. Guidelines for Engineering Design for Process Safety, 2nd ed.; Wiley: Hoboken, NJ, USA, 2012. [Google Scholar]
  12. Martínez, P.J.; Rus, E.; Compaña, J.M. Flash point determination of binary mixtures of alcohols, ketones and water. Univ. Málaga. 2005, 1–8. [Google Scholar]
  13. Astbury, G.R.; Bugand-Bugandet, J.; Grollet, E.; Stell, K.M. Flash points of aqueous solutions of flammable solvents. Inst. Chem. Eng. Symp. Ser. 2004, 150, 1–18. [Google Scholar]
  14. Shariff, A.M.; Leong, C.T.; Zaini, D. Using process stream index (PSI) to assess inherent safety level during preliminary design stage. Saf. Sci. 2012, 50, 1098–1103. [Google Scholar] [CrossRef]
  15. National Fire Protection Association. NFPA 30: Flammable and Combustible Liquids Code; National Fire Protection Association: Quincy, MA, USA, 2008. [Google Scholar]
  16. Conde-Báez, L.; López-Molina, A.; Gómez-Aldapa, C.A.; Pineda-Muñoz, C.; Conde-Mejía, C. Economic projection of 2-phenylethanol production from whey. Food Bioprod. Process. 2019, 115, 10–16. [Google Scholar] [CrossRef]
  17. Stark, D.; Münch, T.; Sonnleitner, B.; Marison, I.W.; von Stockar, U. Extractive bioconversion of 2-phenylethanol from L-phenylalanine by Saccharomyces cerevisiae. Biotechnol. Prog. 2002, 18, 514–523. [Google Scholar] [CrossRef] [PubMed]
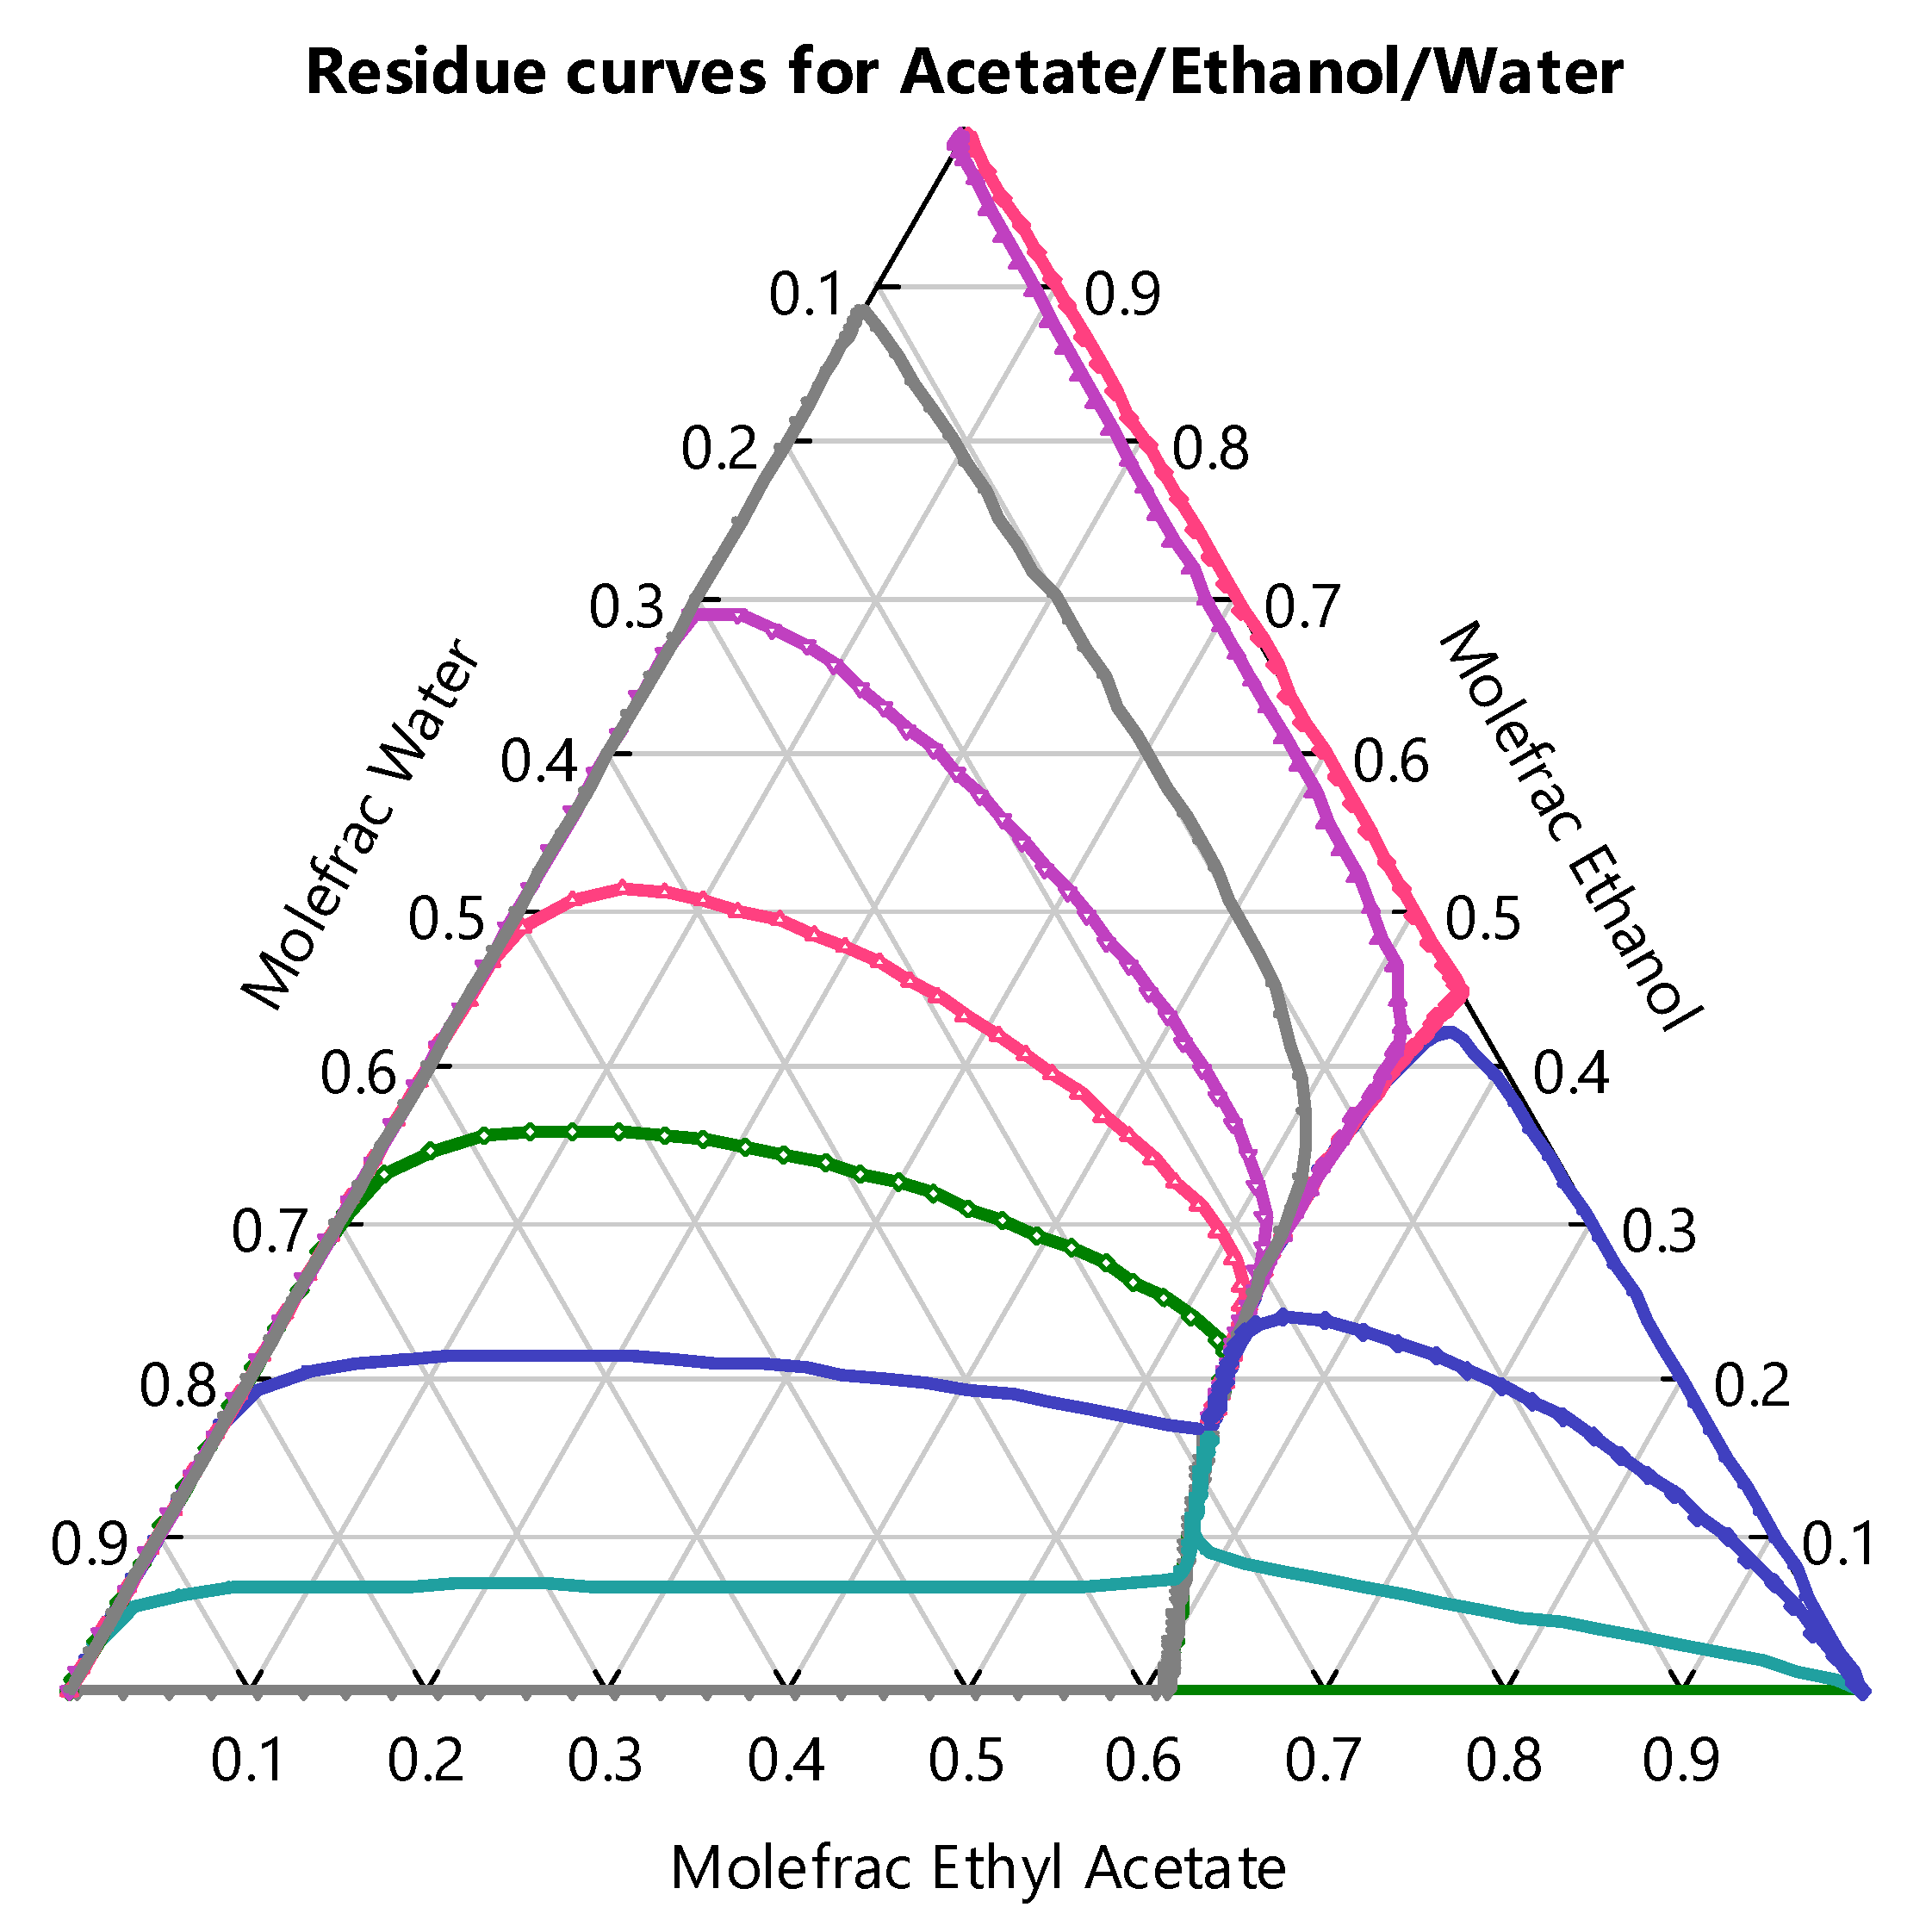
  18. Trofimova, M.; Toikka, M.; Toikka, A. Solubility, liquid–liquid equilibrium and critical states for the quaternary system acetic acid–ethanol–ethyl acetate–water at 293.15 K. Fluid Phase Equilibria 2012, 313, 46–51. [Google Scholar] [CrossRef]
  19. Seader, E.J.; Henley, J.D. Separation Process Principles, 2nd ed.; Wiley: New York, NY, USA, 1998. [Google Scholar]
  20. VadeQuímica. Productos Químicos: Acetato de Etilo. Available online: https://www.vadequimica.com/acetato-de-etilo-25litros.html (accessed on 2 July 2020).
  21. Official Journal of the European Union. Available online: https://eur-lex.europa.eu/legal-content/EN/TXT/?uri=CELEX:32012R0872 (accessed on 18 November 2020).
Figure 1. Methodology to assess the bioprocess stream index (BPSI).
Processes 08 01570 g001
Figure 2. Flowsheet for the 2-phenylethanol (2-PEA) separation process.
Processes 08 01570 g002
Figure 3. Residue curve map for the ethyl acetate–ethanol–water ternary system.
Processes 08 01570 g003
Figure 4. Hazard process streams identified with the BPSI.
Processes 08 01570 g004
Table 1. Score of flash point indicator based on NFPA-30.
ConditionFlammable NatureFlash Point Score
Fp < 23 °CExtremely flammable5
23 °C ≤ Fp < 38 °CVery flammable4
38 °C ≤ Fp < 60 °CEasy flammable3
60 °C ≤ Fp < 93 °CFlammable liquid2
Fp ≥ 93 °CCombustible1
Flash point not definedNon-flammable0
Adapted from [15].
Table 2. Properties of the process streams.
StreamS-1S-2S-3S-4S-5S-6S-7S-8
Temperature (°C)30.029.931.231.272.1201.631.231.3
Pressure (atm)1.01.01.01.51.01.51.01.5
Mass flow (kg h−1)2908.91065.6807.9807.9805.42.53166.53166.5
Density (kg m−3)985.0904.2899.3899.2845.3842.3978.0930.8
Heat of combustion (cal mol−1)6176464,356474,140474,140472,548982,44544,50840,960
Flash point (°C)98.41.2−0.2−0.2−0.598.77.012.0
ComponentMass percent (%)
Water98.115.353.693.693.690.0490.9890.98
2-PEA0.080.000.300.300.0096.890.000.00
Ethanol1.810.810.760.760.770.001.741.74
Ethyl acetate0.0093.8595.2595.2595.543.057.287.28
StreamS-9S-10S-11S-12S-13S-14S-15
Temperature (°C)70.9106.671.22529.830.030.0
Pressure (atm)1.01.51.01.01.01.01.0
Mass flow (kg h−1)248.62917.91053.93778.63778.61053.911.6
Density (kg m−3)859.7906.0850.2993.9989.3904.2890.8
Heat of combustion (cal mol−1)436,5047265464,0470.00.00464,047492,261
Flash point (°C)7.185.01.30.00.001.3−4.5
ComponentMass percent (%)
Water10.9497.805.41100.00100.005.410.00
2-PEA0.000.000.000.000.000.000.00
Ethanol0.971.800.810.000.000.810.00
Ethyl acetate88.090.3993.780.000.0093.78100.0
Table 3. Design variables for equipment units.
ColumnOverhead Pressure /Pressure Drop [atm]Number of StagesMinimum Solvent Flow [kg h−1]/Reflux ratioFeed StageRemoval [%]/
Recovery [%]–Purity [%]
LLEC1/0351000 --99.90
DC11/0.581.08799.99—96.89
DC21/0.5194.80595.00—88.09
Table 4. Flash point values for ethanol and methyl acetate dilute mixtures.
Ethanol 1
Flash point (°C)84.564.051.539.532.025.832.019.819.015.812.5
Mole fraction0.0100.0200.03050.060.0910.19860.35410.49870.64780.79911
Methyl Acetate 2
Flash point (°C)NF634630221613117−18
% v/v0.40.51.02.03.04.05.06.08.0100
1 Adapted from [12]. 2 Adapted from [13].
Table 5. Indicators to calculate BPSI in the 2-PEA separation process.
StreamFp ScoreIρIPIHcIFpBPSIStreamFp ScoreIρIPIHcIFpBPSI
S-101.11.010.00.00.0S-950.91.011.51.62.0
S-251.01.011.61.62.2S-1021.01.520.00.60.0
S-351.01.011.61.62.2S-1150.91.011.61.62.1
S-451.01.501.61.63.3S-1201.11.010.00.00.0
S-550.91.011.61.62.1S-1301.11.010.00.00.0
S-610.91.523.40.31.3S-1450.91.011.61.62.1
S-751.11.010.21.60.2S-1551.01.011.71.62.3
S-851.01.500.11.60.3
Publisher’s Note: MDPI stays neutral with regard to jurisdictional claims in published maps and institutional affiliations.

