Article

Quantifying the Effect of COD to TN Ratio, DO Concentration and Temperature on Filamentous Microorganisms’ Population and Trans-Membrane Pressure (TMP) in Membrane Bio-Reactors (MBR)

by
Petros Gkotsis
1,
Giannis Lemonidis
1,
Manassis Mitrakas
2,
Alexandros Pentedimos
1,
Margaritis Kostoglou
1,* and
Anastasios Zouboulis
1,*
1
Laboratory of Chemical and Environmental Technology, Department of Chemistry, Aristotle University of Thessaloniki, 54124 Thessaloniki, Greece
2
Analytic Chemistry Laboratory, Department of Chemical Engineering, School of Engineering, Aristotle University of Thessaloniki, 54124 Thessaloniki, Greece
*
Authors to whom correspondence should be addressed.
Processes 2020, 8(11), 1514; https://doi.org/10.3390/pr8111514
Submission received: 29 October 2020 / Revised: 16 November 2020 / Accepted: 19 November 2020 / Published: 21 November 2020
(This article belongs to the Special Issue Wastewater Treatment Processes)

Abstract

:
Using moderate populations of filaments in the biomass of Membrane Bio-Reactors (MBRs) is a biological anti-fouling method which has been increasingly applied over the last few years. This study aims to quantify the effect of COD to TN ratio, Dissolved Oxygen (DO) concentration and temperature on filaments’ population and Trans-Membrane Pressure (TMP) in a pilot-scale MBR, with a view to reducing membrane fouling. The novelty of the present work concerns the development of a mathematical equation that correlates fouling rate (dTMP/dt) with the population of filamentous microorganisms, assessed by the Filament Index (FI), and with the concentration of the carbohydrate fraction of Soluble Microbial Products (SMPc). Apart from TMP and SMPc, other fouling-related biomass characteristics, such as sludge filterability and settleability, were also examined. It was shown that at high COD to TN ratio (10:1), low DO concentration in the filaments’ tank (0.5 ± 0.3 mg/L) and high temperature (24–30 °C), a moderate population of filaments is developed (FI = 1–2), which delays the TMP rise. Under these conditions, sludge filterability and settleability were also enhanced. Finally, TMP data analysis showed that the fouling rate is affected by FI and SMPc concentration mainly in the long-term fouling stage and increases exponentially with their increase.

1. Introduction

The Membrane Bio-Reactor (MBR) is a state-of-the-art technology which has been increasingly employed in the field of wastewater treatment over the last decade, due to its significant advantages over the conventional Activated Sludge Process (ASP), such as high quality of treated water, low space requirement and small footprint. In addition, deterioration of the sedimentation process due to the presence of filamentous microorganisms (also known as filaments) is avoided, since sedimentation is replaced by membrane filtration in the sedimentation stage. However, membrane fouling, which is the undesirable deposition of suspended solids, colloids and/or soluble substances onto the membrane surface or inside its pores, is regarded as the main drawback of the MBR technology, limiting the widespread application of membrane bioreactors [1,2,3,4,5].
Biological methods for fouling control in MBRs are usually classified into the following two groups: (i) inhibition and structure optimization of the bio-cake layer that is formed on the membrane surface, which mainly aim at preventing cell–cell or membrane–cell interactions or at decreasing cell activity without killing the deposited cells, and (ii) enzymatic or bacterial degradation of biopolymers, which employ enzymes or bacteria in order to achieve efficient degradation of foulants, such as Extracellular Polymeric Substances (EPS) or Soluble Microbial Products (SMP) [6,7]. Another biological method for fouling mitigation in MBRs is the utilization of filamentous microorganisms at moderate concentrations in the mixed liquor, which improves biomass properties and prolongs membrane lifetime. Filamentous microorganisms, which mainly consist of bacteria, are long, thread-shaped microorganisms that are widely reported to cause bulking and foaming problems during wastewater treatment. Excessive growth of filamentous strains can be triggered by the operating conditions which are applied in the wastewater treatment plants (WWTP), such as Solids Retention Time (SRT), temperature, pH, dissolved oxygen (DO), etc., and/or by the influent wastewater characteristics, such as feed flow rate, COD to TN ratio (i.e., Chemical Oxygen Demand to Total Nitrogen ratio), etc. [8]. In the ASP, high concentrations of filamentous bacteria can result in loose floc structure of the activated sludge, inability to form stable and dense flocs, decrease in the sludge sedimentation rate and poor sludge compressibility. To date, more than 30 different filamentous bacterial strains have been identified based on their morphology in various WWTPs [8,9].
In MBRs, however, the role of filamentous microorganisms is not necessarily detrimental to the overall system operation, since sedimentation is replaced by sludge separation through filtration. Although it is widely reported that filaments are undesirable in MBRs at high concentrations because they participate in the formation of an intense, non-porous cake layer on the membrane surface [10,11,12,13], several research studies claim that moderate populations of filamentous bacteria in the mixed liquor can enhance sludge filterability and, thus, mitigate membrane fouling. This is mainly attributed to the filaments’ structure which can function as the backbone of sludge flocs promoting their adhesion and size increase [14,15]. In other words, filaments can partly act as polyelectrolytes and promote sludge bio-flocculation. Wang et al. [16] operated two identical MBR systems, one with normal and one with bulking sludge, and found that the system with the bulking sludge showed better filtration characteristics and reduced reversible membrane fouling, despite the abundance of filamentous bacteria. Hao et al. [17] examined membrane fouling in a lab-scale submerged MBR and found that the presence of a small quantity of filamentous microorganisms increased flocs’ size and improved membrane performance. Banti et al. [18] also adjusted the filamentous bacterial population in the mixed liquor of a lab-scale MBR, by modifying the system’s configuration and regulating its operating conditions, and managed to reduce Trans-Membrane Pressure (TMP) and SMP concentration.
The behaviour of filamentous microorganisms in MBR systems still remains a controversial issue that needs to be further examined. The notion that filaments favour fouling mitigation at moderate concentrations is being increasingly adopted, however, the influence of various operating parameters, such as DO, temperature, etc., mixed liquor properties, such as SMP, Suspended Solids (SS), etc., and wastewater characteristics, such as C to N ratio, wastewater type, etc., has not been thoroughly investigated. In addition, mathematical models which are employed in order to describe fouling in MBRs do not consider the population of filamentous microorganisms. Aiming towards the development of an integrated methodology for fouling reduction in MBRs, the present work quantifies the effect of the COD to TN ratio, DO concentration and temperature on filamentous microorganisms’ population and TMP in a fully automated pilot-scale membrane bioreactor; a mathematical equation which correlates fouling rate (dTMP/dt) with the population of filaments in the mixed liquor is developed for the first time.

2. Materials and Methods

2.1. Pilot-Scale MBR Operation and Examined Parameters

The experimental pilot-scale set-up (Figure 1) consists of five main tanks: (a) wastewater feed tank, (b) denitrification tank, (c) filaments’ tank, (d) (submerged membrane) bioreactor, which is divided into an aeration chamber and a membrane chamber, and (e) permeate collection tank. The system also includes an additive tank (which is denoted as AT in Figure 1 and was not operated in the present study) that allows for the in-line, continuous addition of additive suspensions (coagulants, polyelectrolytes, adsorbing agents etc.) directly to the bioreactor.
The denitrification tank, the filaments’ tank and the bioreactor were initially inoculated with activated sludge, which was received from the recirculation channel of the urban wastewater treatment plant of Thessaloniki city (located in the area of Sindos). Synthetic wastewater was added to the pilot unit by means of a peristaltic pump (Qin = 1.5 L/h). Synthetic wastewater consisted of 500 g/m3 glucose, 500 g/m3 corn starch, 200 g/m3 NH4Cl, 56 g/m3 peptone, 53 g/m3 KH2PO4, 18 g/m3 MgSO4·7H2O, 7.3 g/m3 MnSO4·H2O and 1.1 g/m3 FeSO4·7H2O [19], resulting in a COD to TN ratio of 10:1 (Phases A and B, Table 1). In order to achieve a lower COD to TN ratio (5:1), glucose and corn starch concentrations were then reduced to 300 g/m3 (Phases C and D, Table 1). Mixed liquor was also recycled (Qrec = 4.5 L/h) from the bioreactor to the denitrification tank by means of a second peristaltic pump. Subsequently, mixed liquor was naturally driven—by gravity—to the filaments’ tank, which communicates with the aeration tank and the latter with the membrane tank of the MBR at the bottom. Finally, the permeate was withdrawn from the upper part of the membrane by a third peristaltic pump (Qout = 1.5 L/h) resulting in an operating flux of J = 13.6 L∙m2∙h, which was much lower than the critical flux of the membrane (~30 L∙m2∙h). A high-resolution pressure transducer was placed in the outlet of the membrane in order to record the TMP. The permeate collection unit was the final recipient of the produced permeate. The MLSS concentration was kept constant at 5.5 ± 0.5 g/L, while the concentration of the dissolved oxygen (DO) in the filaments’ tank and aeration chamber of the bioreactor was controlled by DO-meters. The operation of all pumps, DO-meters and level sensors was fully automated by means of a Programmable Logic Controller (PLC). The air needed for the biomass aeration (and bio-oxidation of pollutants) and for the cleaning of the applied membrane was supplied by an air compressor, the pressure of which was appropriately reduced to the desired value by means of an air pressure reducer. Gas and liquid flow rates were measured by gas and liquid flow meters, respectively, while level sensors were used in order to control the level of the mixed liquor in the membrane tank. A flat sheet, microfiltration membrane with a pore size of 0.4 μm and an effective area of 0.11 m2 was employed, while one-minute relaxation steps were regularly performed for every 9 min of filtration.
The examined parameters as concerns their influence on the growth of filamentous microorganisms were the following:
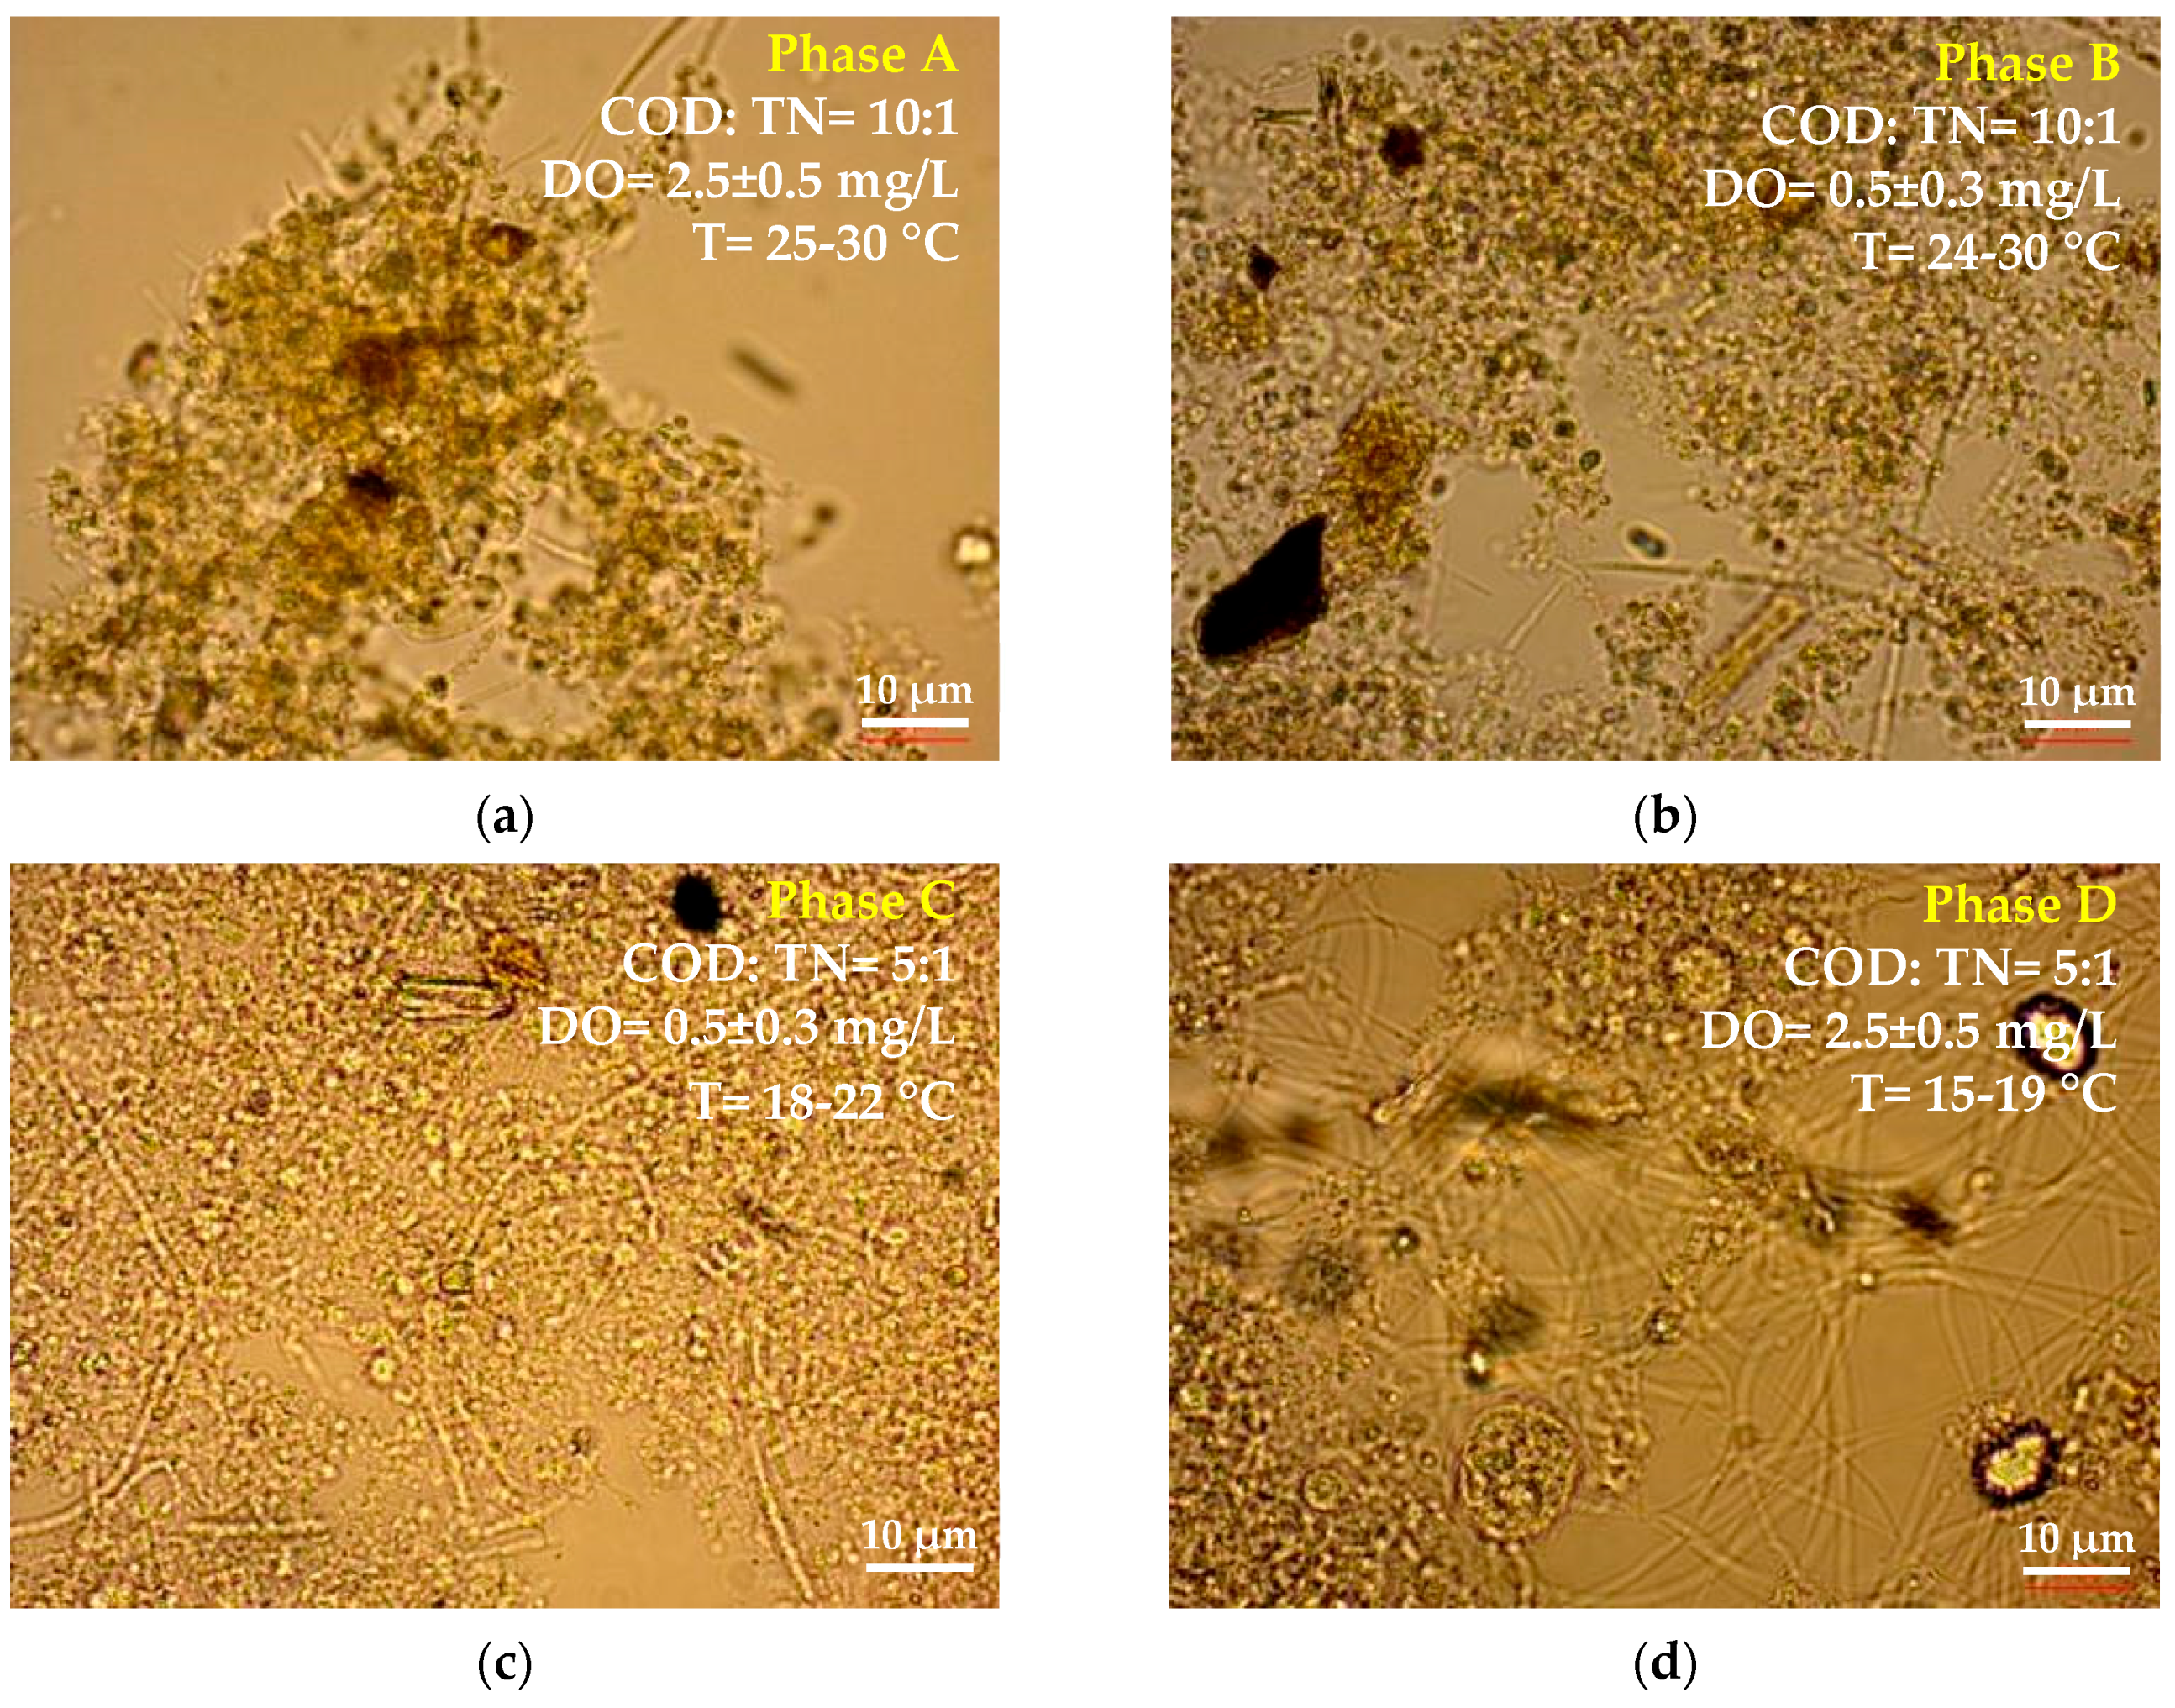
  • The influent COD to TN ratio (10:1 and 5:1), which was adjusted by using different concentrations of the employed synthetic wastewater components.
  • The DO concentration (2.5 ± 0.5 and 0.5 ± 0.3 mg/L) in the filaments’ tank, which operated as a “regulator” for adjusting the population of filamentous microorganisms. On the contrary, DO concentration was constant in the denitrification tank (<0.1 mg/L) and in the aeration tank of the bioreactor (2.5 ± 0.5 mg/L).
  • Mixed liquor temperature followed the seasonal temperature change and, consequently, temperature was also investigated as a system parameter.
The effect of the aforementioned parameters on fouling indices, such as TMP and SMP concentration, and on fouling-related biomass properties, such as sludge filterability and settleability, was also examined. The overall operating period of the pilot-scale MBR (8 months) was divided into four Phases, each of which lasted approximately 2 months (Table 1). In the beginning of each Phase, the system was inoculated with a new sludge sample and a new flat sheet membrane module. In order to achieve steady-state conditions in the bioreactor, which were assessed by the obtained high and stable COD removal rate (>95%), sludge was initially acclimatized to the synthetic wastewater and the applied operating conditions for approximately a month. Then, the system was operated according to the procedure described previously.

2.2. Analytical Techniques and Protocols

2.2.1. Estimation of Filaments’ Population with the Determination of Filament Index (FI)

The FI was determined according to the method proposed by Eikelboom (2000) [20] (please see also Appendix A). The Axio Lab.A1 light microscope (Carl Zeiss, Oberkochen, Germany), equipped with a microscopy camera (AxioCam ERc 5s Rev.2), was used to determine the filament index (FI) of the mixed liquor samples. Analysis of the obtained images was conducted using the ZEN lite software. Following the sludge acclimatization period and the achievement of steady-state conditions in the bioreactor, more than 20 sludge images were obtained and examined for each operating phase. In this study, the most representative images were selected and presented. The examination of the obtained images and estimation of FI was conducted by a group of experts with previous experience in sludge image analysis.

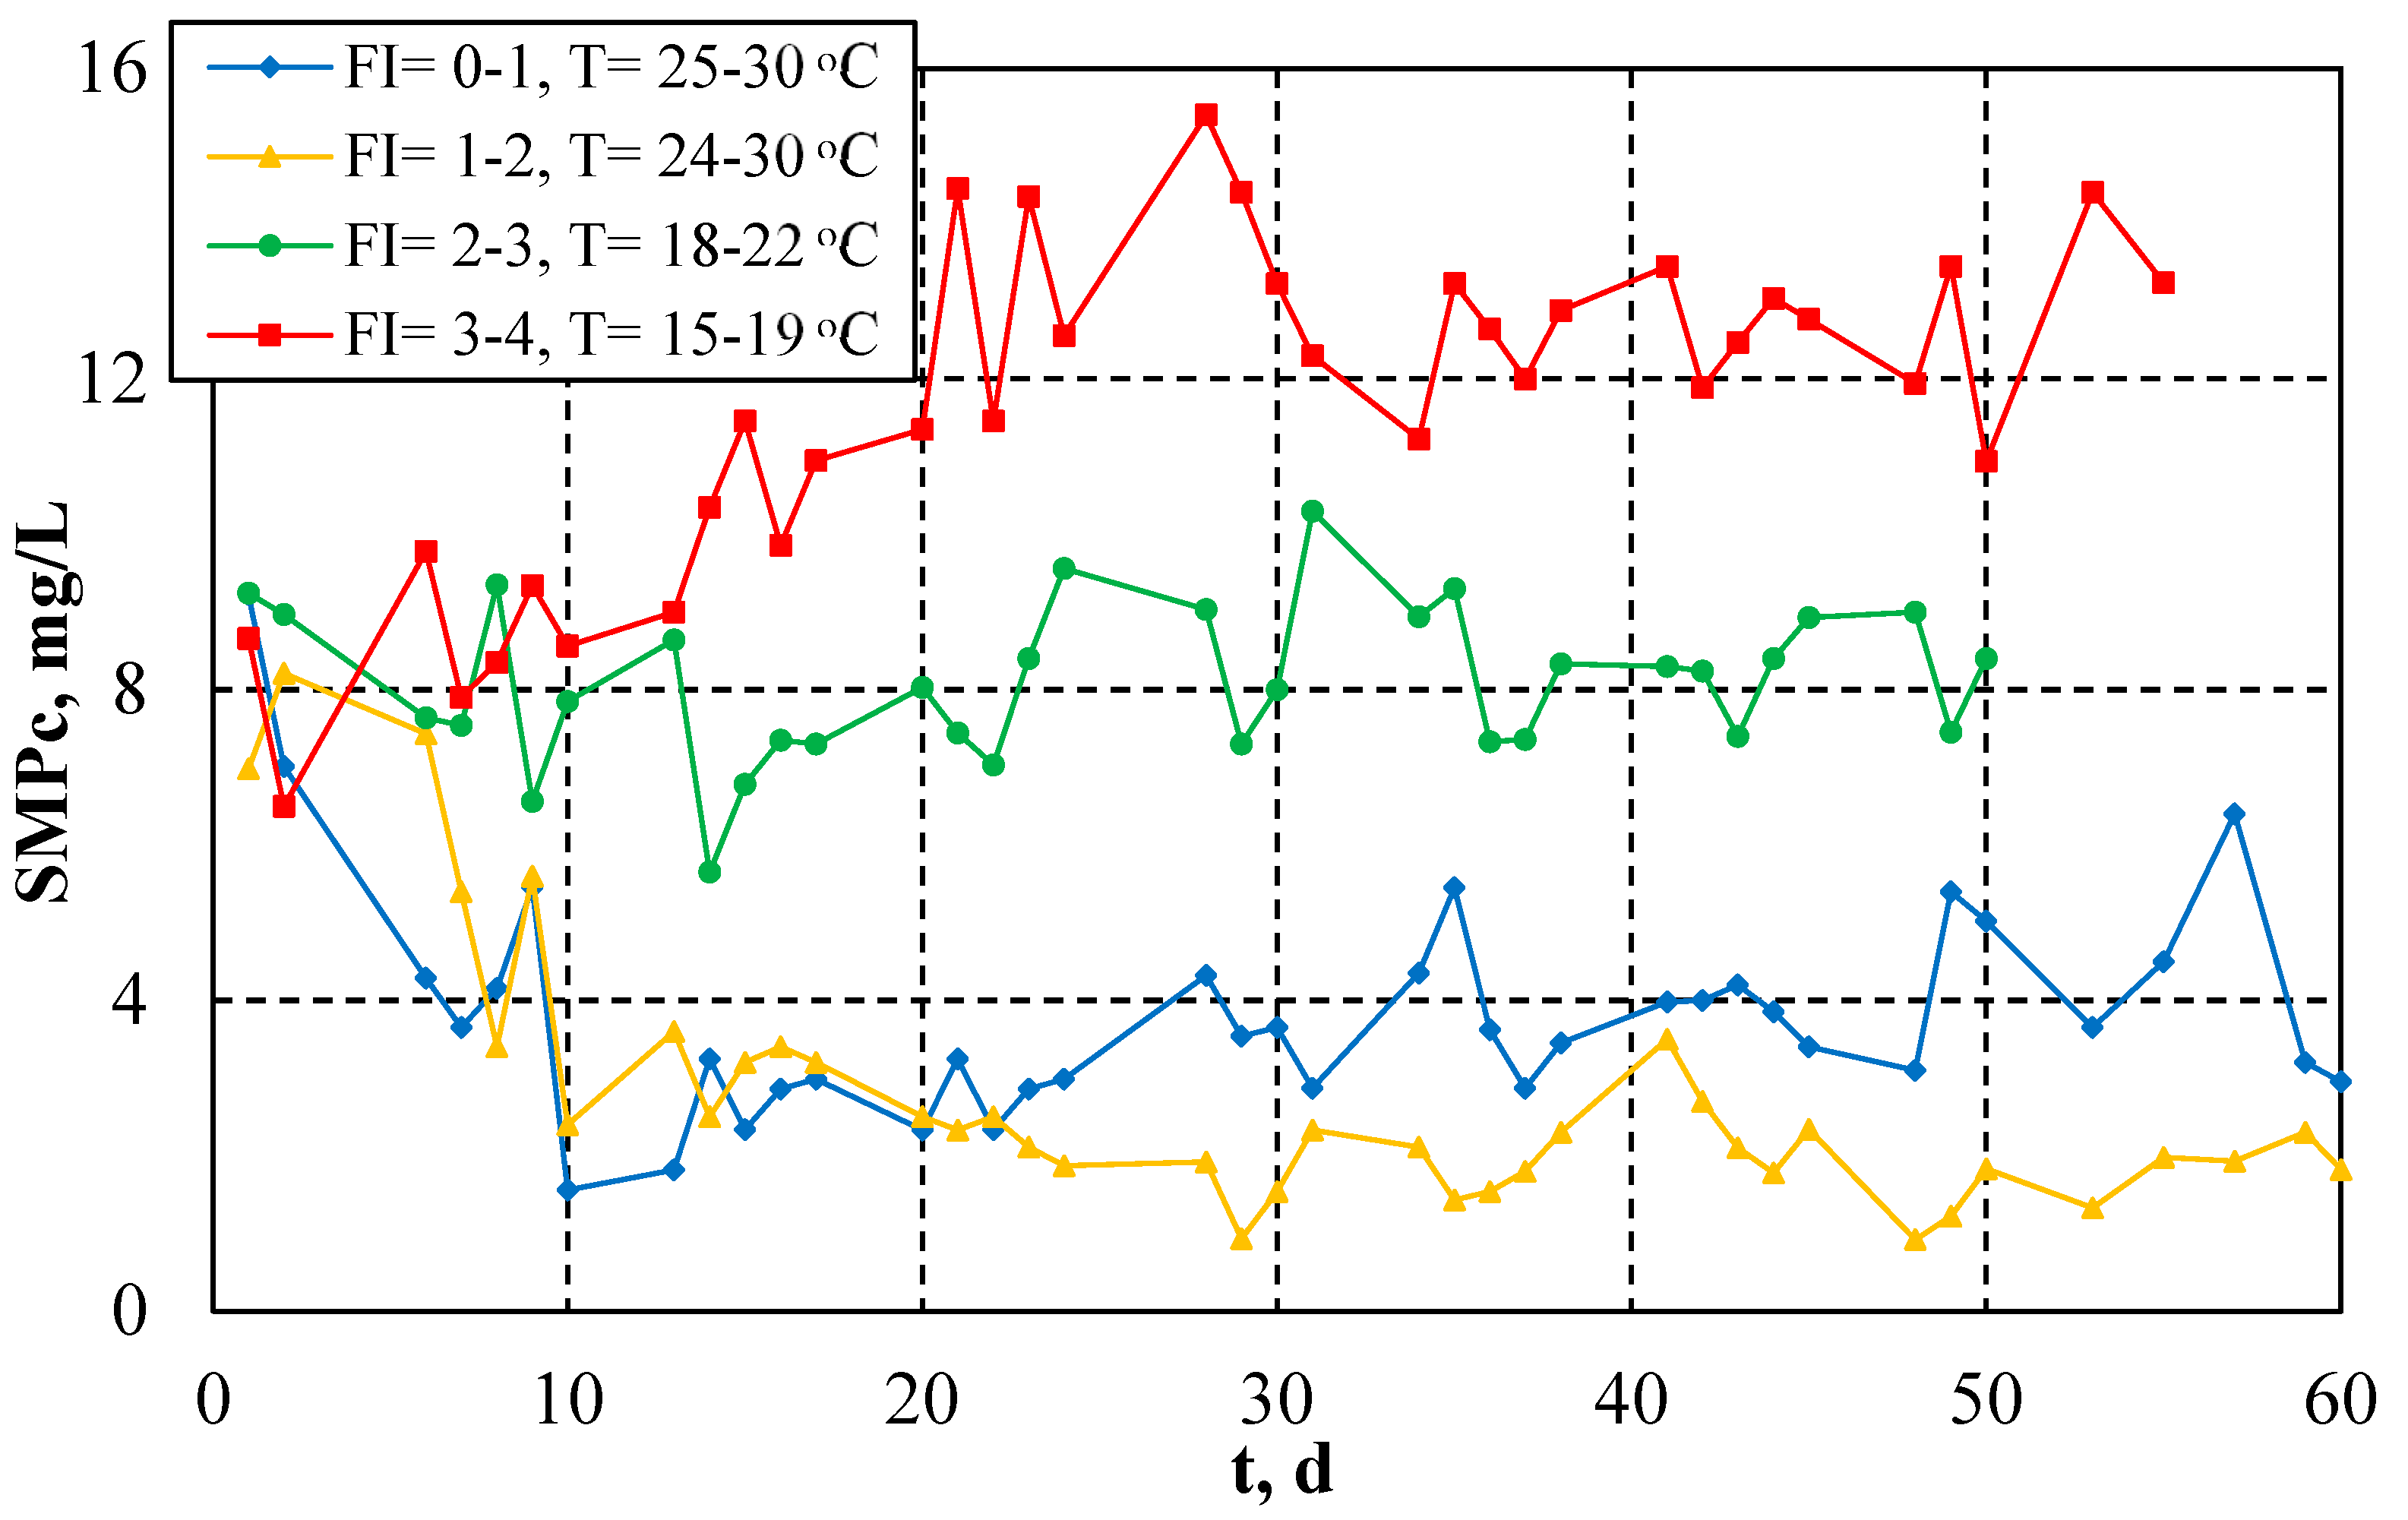
2.2.2. Measurement of SMPc Concentration

Although the role of protein compounds in fouling has not been yet fully elucidated, the carbohydrate fraction of SMP (SMPc) has been often cited as the most significant constituent causing fouling in MBRs [3,21] and was measured in the present study. SMPc was extracted by the following procedure: mixed liquor samples were obtained daily from the bioreactor and centrifuged in order to separate the solid biomass. Then, the phenol-sulfuric acid method [22], which is the most widely used colorimetric method for the determination of carbohydrate concentration in aqueous solutions, was applied in the supernatant for determination of the carbohydrate fraction of SMPs (please see also Appendix B). A Hach Lange (DR 3900) UV/Vis double-beam spectrophotometer was used for these measurements.

2.2.3. Estimation of Sludge Filterability with the TTF Method

Sludge filterability was estimated by applying the Time-To-Filter (TTF) method [23,24]. During this method, a 90-mm Buchner funnel is used with Whatman #1, #2, or equivalent filter papers. After pouring 200 mL of mixed liquor on the Buchner funnel, the time (seconds) required to obtain 100 mL of filtrate was recorded at the vacuum pressure of 510 mbar (designated as TTF). Low TTF values indicate high sludge filterability, whereas high TTF values indicate low sludge filterability.

2.2.4. Estimation of Sludge Settleability with the Determination of SVI (mL/g MLSS)
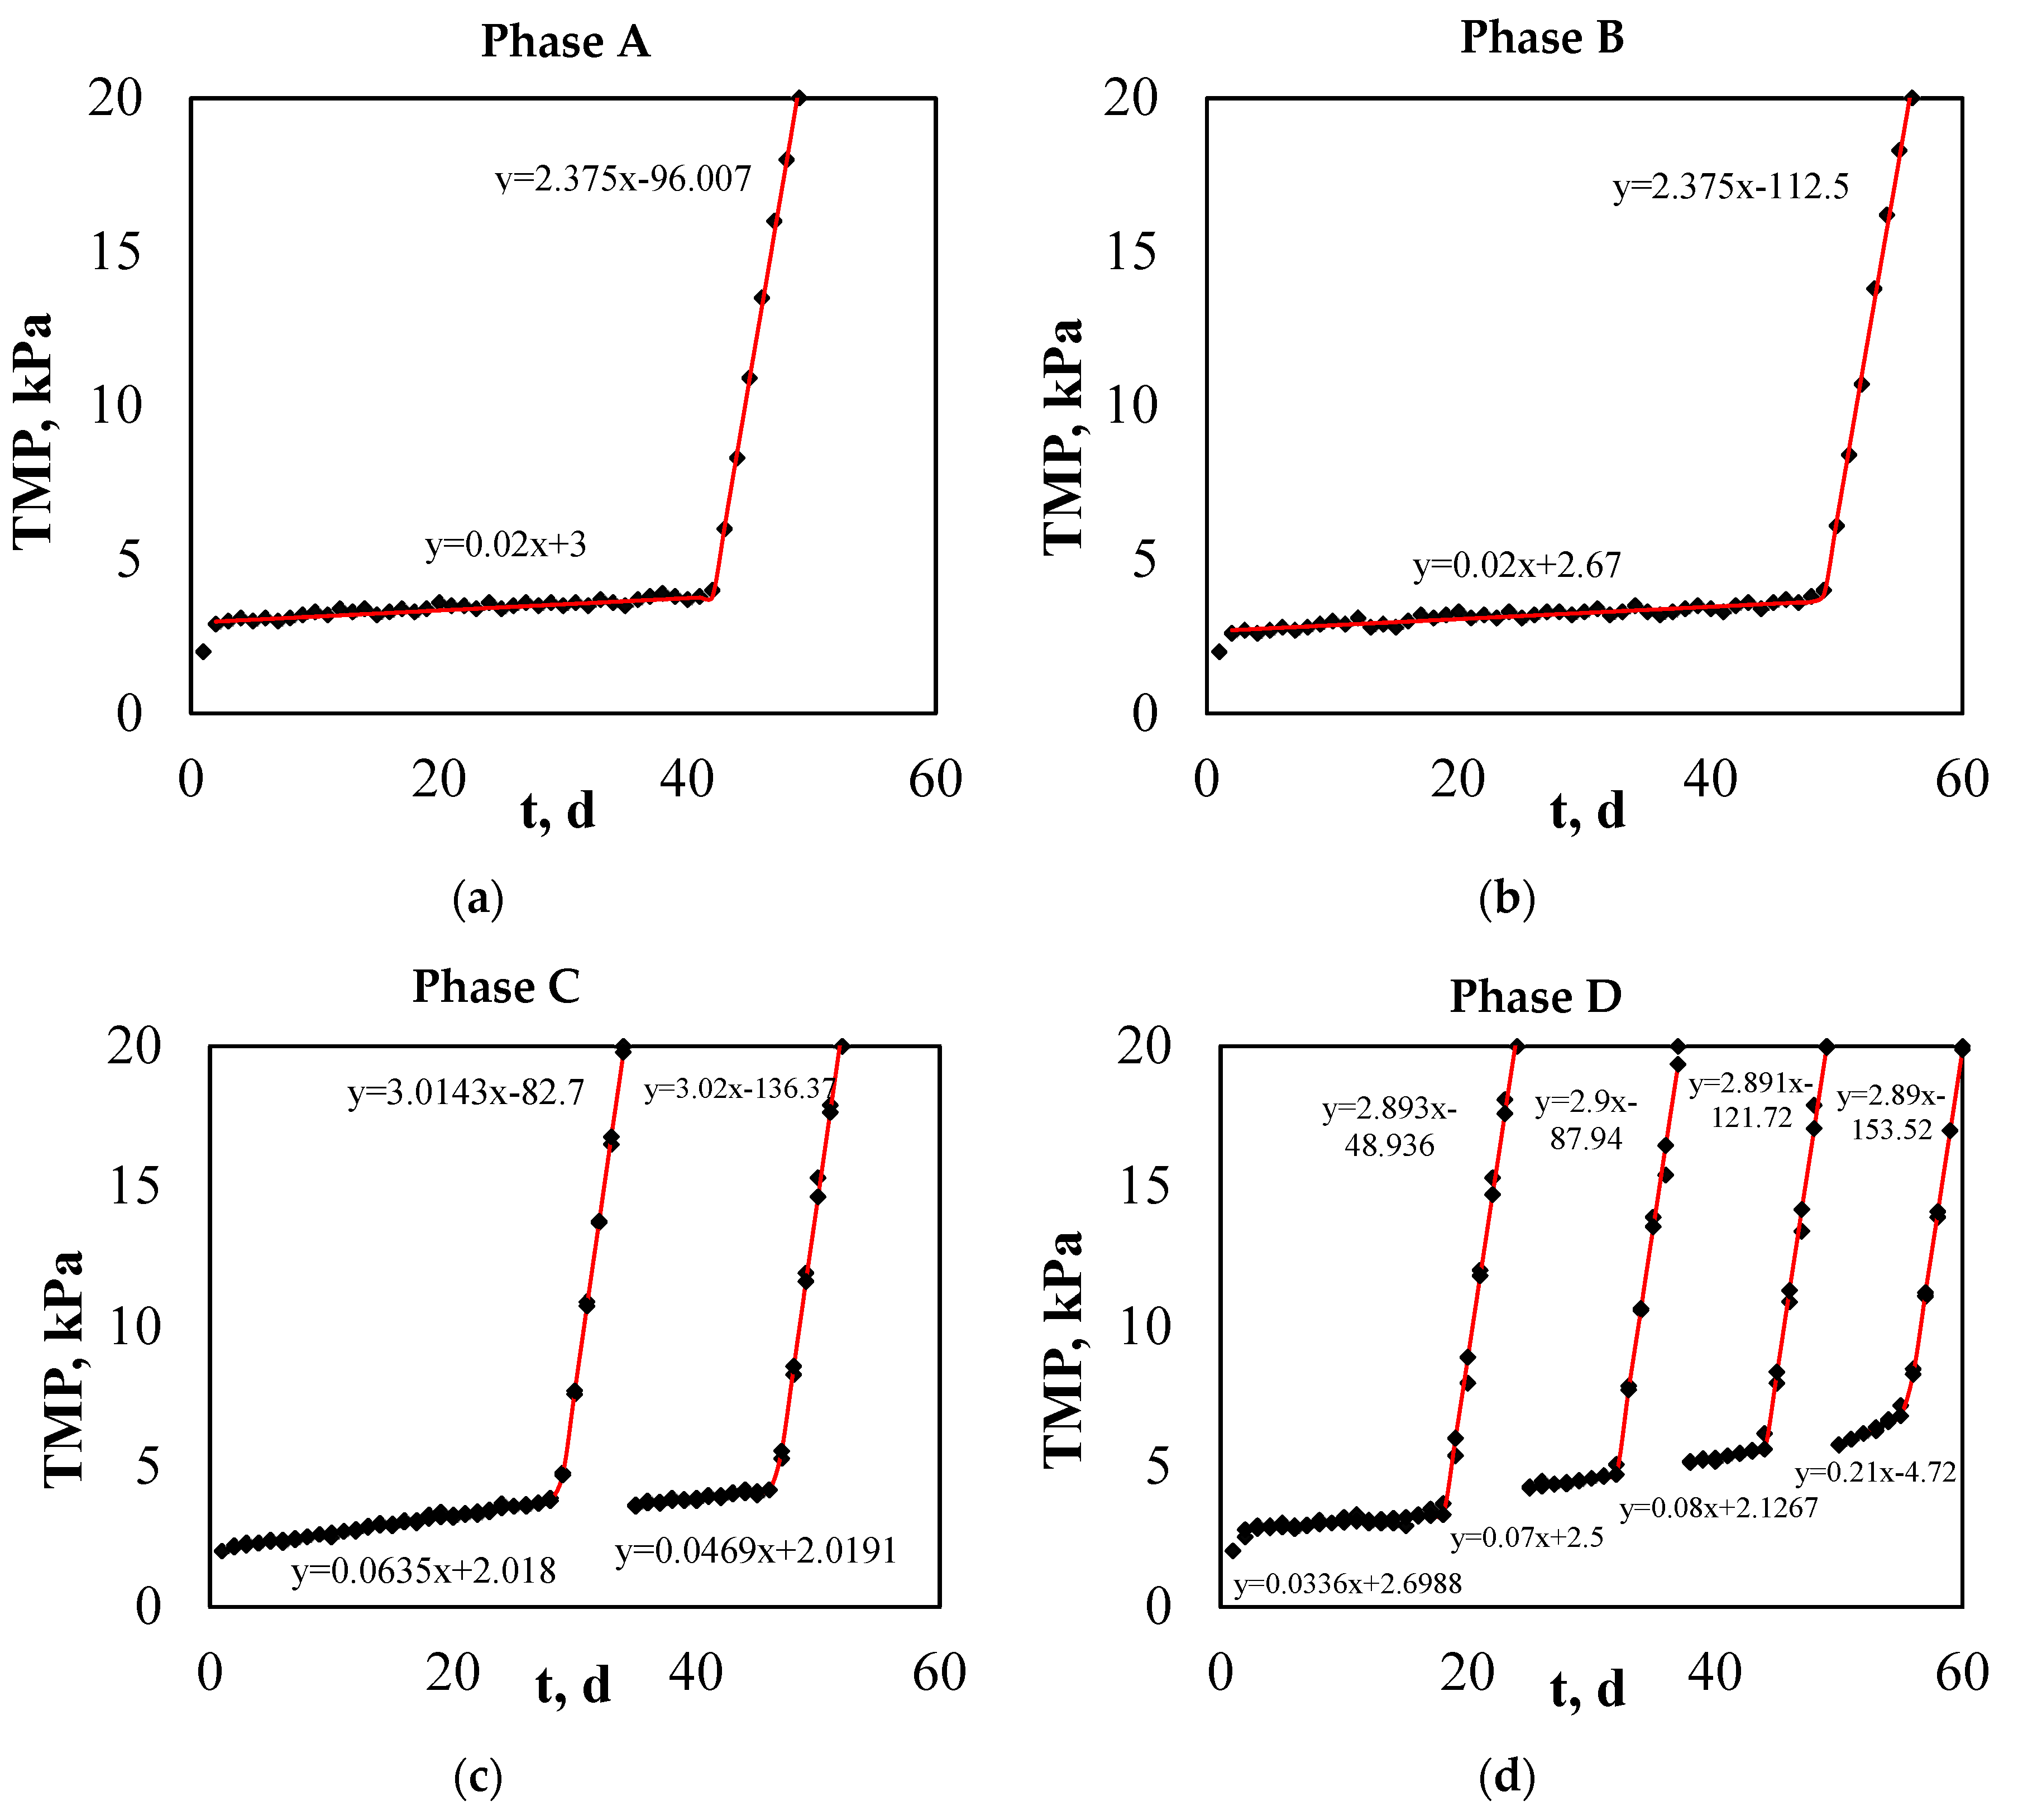
Sludge Volume Index (SVI) is the most widely employed index for assessing sludge settleability in ASP systems. It is also indicative of the presence of filamentous microorganisms in the activated sludge: low SVI values imply low concentrations of filaments in the sludge, while high SVI values are typical of sludges that contain high concentrations of filaments and, thus, of poor sludge settleability. For the determination of SVI 1 L of mixed liquor is obtained from the aeration chamber of the bioreactor and is settled for 30 min in an Imhoff cone. SVI is calculated by dividing the volume of the settled sludge with the MLSS concentration.

2.2.5. TMP Fitting

In order to accurately predict fouling phenomena in real world scenarios, the development of mathematical fouling models are necessary. The common pore-flow model, which describes the flux across a membrane, is based on Darcy’s law:
J = ΔP/η (RM + RC)
where ΔP is the Trans-Membrane Pressure (Pa), η is the solution viscosity (Pa∙s), RM is the hydrodynamic resistance of the clean membrane (m−1) and RC is the resistance of the concentration polarization layer (m−1). Based on Equation (1), Hermia [25] developed a generalized, empirical fouling model for constant dead-end filtration:
d 2 t d V 2 = K ( d t d V ) n
where t is the filtration time (s), V is the volume that is filtered through the membrane (m3), n is an exponent that depends on the fouling model and K is a fouling-model constant. Four classical fouling models, which derive from Equation (2), are commonly applied in order to describe the physics during membrane fouling:
(a)
Cake blocking, which occurs when particles accumulate on the surface of a membrane in a permeable cake of increasing thickness that adds resistance to flow.
(b)
Complete blocking, which assumes that particles seal off the membrane pores and prevent flow.
(c)
Standard blocking, which occurs when particles accumulate inside the membranes on the walls of straight cylindrical pores. As particles are increasingly deposited, the pores become constricted and membrane permeability decreases.
(d)
Intermediate blocking, which is similar to complete blocking, but assumes that some particles seal off the membrane pores while the rest accumulate on top of other deposited particles.
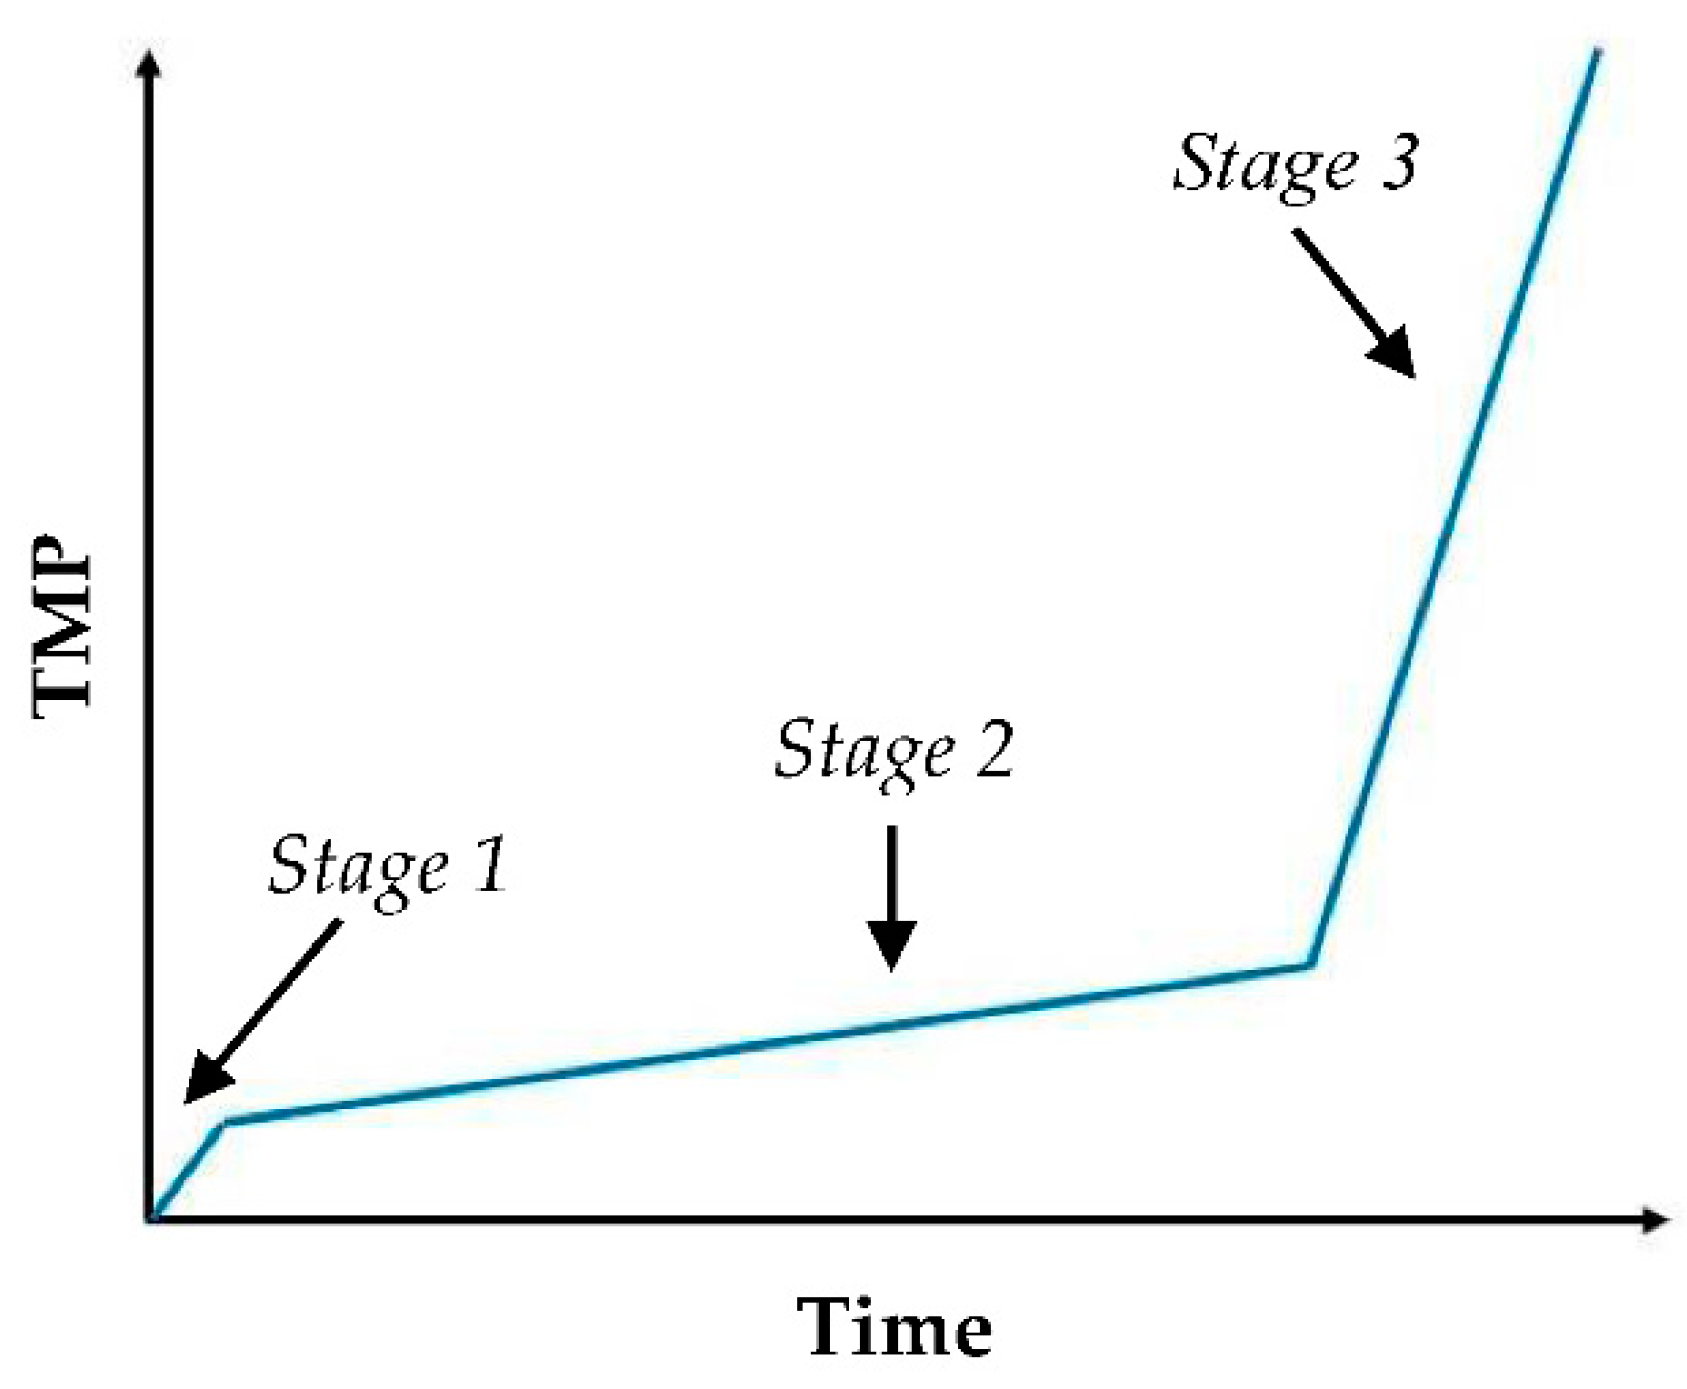
Hlavacek and Bouchet [26] modified Hermia’s equations in order to generate models for constant flow rate conditions. These were further modified by Bolton et al. [27], who generated five new fouling models that account for the combined effects of basic fouling mechanisms. Both basic and combined models are presented in Table 2.
Following the fitting of experimental TMP data with all basic and combined models in order to determine those which best describe the evolution of TMP, an effort was made to develop a mathematical equation that correlates the evolution of TMP with the examined parameters of the present study. Under constant flow rate conditions, the evolution of TMP in a membrane bioreactor is a three-stage process (Figure 2):
(a)
Stage 1 (or conditioning fouling), when the initial adsorption of substances (usually organics, such as EPS and SMP) takes place immediately after the immersion of the membrane in the biomass.
(b)
Stage 2 (or long-term fouling), which is characterized by further adsorption and deposition of organics, colloids and bio-flocs on the membrane surface.
(c)
Stage 3 (or TMP jump), when TMP suddenly rises until it reaches the maximum limit (according to the membrane specifications). During this stage, there are regions of the membrane which are more fouled than others and are characterized by low permeability. As a result, permeability is promoted in less fouled areas, exceeding a critical flux in these locations. Under such conditions, fouling rate increases rapidly and almost exponentially with the flux [3].
It is understood that Stage 2 (especially) and Stage 3 are the most crucial stages to the extent of fouling in MBR systems. Therefore, most research studies which investigate fouling mitigation aim at prolonging the duration of Stage 2. In the present study, experimental TMP values from Stages 2 and 3 (of all Phases) were initially fitted with the basic models and the R-squared coefficients of the produced equations were calculated in order to determine which basic model best describes the increase in TMP in the pilot-scale MBR. Fitting with the combined models was conducted with the GRG (Generalized Reduced Gradient) solving method which is one of the most popular methods to solve problems of nonlinear optimization. In this case, fitting was estimated by index SSR (Sum of Squared Residuals), i.e., the sum of squared differences between the experimental TMP values and the theoretical TMP values which are obtained after the application of the GRG method.

3. Results and Discussion

3.1. Influence of COD to TN Ratio and Temperature on Filaments’ Growth

Figure 3 shows typical sludge images from each Phase, which were obtained by the optical microscope with the procedure described in Section 2.2.1. As shown, the reduction in the COD to TN ratio from 10:1 to 5:1 (comparison of Figure 3a with Figure 3d and Figure 3b with Figure 3c) increases the population of filamentous microorganisms for both DO concentrations (2.5 ± 0.5 and 0.5 ± 0.3 mg/L). However, the decrease in temperature should be also considered, since it is known that low temperatures favour the development of filaments [28,29]. The crucial role of temperature is more evident when studying the effect of DO concentration (comparison of Figure 3a with Figure 3b and Figure 3c with Figure 3d). As shown, the decrease in DO concentration slightly increases the population of filaments when temperature remains relatively constant (Figure 3a,b). However, the decrease in DO concentration decreases the population of filaments when temperature increases (Figure 3c,d). Therefore, it is likely that temperature is predominant over DO concentration in terms of filaments’ growth. In conclusion, we focused on these four scenarios of the FI for modelling the effect of filamentous microorganisms on membrane fouling.

3.2. Effect of Filament Index (FI) and Temperature on TMP and SMPc

Figure 4 and Figure 5 show the effect of Filament Index (FI) and temperature on the evolution of TMP and SMPc concentration, respectively. It should be mentioned that TMP in Figure 4 refers to the measured experimental TMP values and the respective trendlines. During Phase A (Figure 4a), when the FI is low (0–1) and the temperature is high (25–30 °C), TMP is maintained at low levels for a relatively long period of time and the TMP jump is observed on the 43rd day. The evolution of TMP is prolonged during Phase B (Figure 4b) and this is attributed to the increase in FI (1–2), since temperature practically remains the same (24–30 °C). It is, therefore, shown that a low number of filaments alleviates membrane fouling and increases membrane’s operating time. This is in accordance with Banti et al. [18] who also observed that the development of a low population of filaments reduced fouling, although the measured FI range was different (2–3). However, as FI is increased to 2–3 during Phase C (Figure 4c), the membrane’s operating time is significantly reduced and two chemical cleanings are required during the examined time period (2 months). A further increase in FI during Phase D (Figure 4d) results in even more rapid rise of TMP, necessitating the conducting of four chemical cleanings. During the last two phases, rapid TMP increase is also enhanced by the decrease in temperature, which is known to favour fouling in MBRs, mainly due to the increase in sludge viscosity and the production of more SMP [30,31,32,33]. Similarly, SMPc concentration increases with the increase in FI and the decrease in temperature in the present study (Figure 5).

3.3. Effect of Filament Index (FI) and Temperature on Sludge Filterability and Settleability

Figure 6 and Figure 7 present the effect of Filament Index (FI) and temperature on sludge filterability (TTF) and settleability (SVI), respectively. As shown in Figure 6, the increase in FI increases the measured TTF times. As the population of filamentous microorganisms increases, the excreted SMPc also increase, resulting in the deterioration of sludge filterability. This is particularly observed at high FI numbers (>2) and low temperatures (<22 °C), i.e., when the number of filaments is significantly increased. Similarly, sludge settleability is deteriorated at high FI numbers and low temperatures (Figure 7).

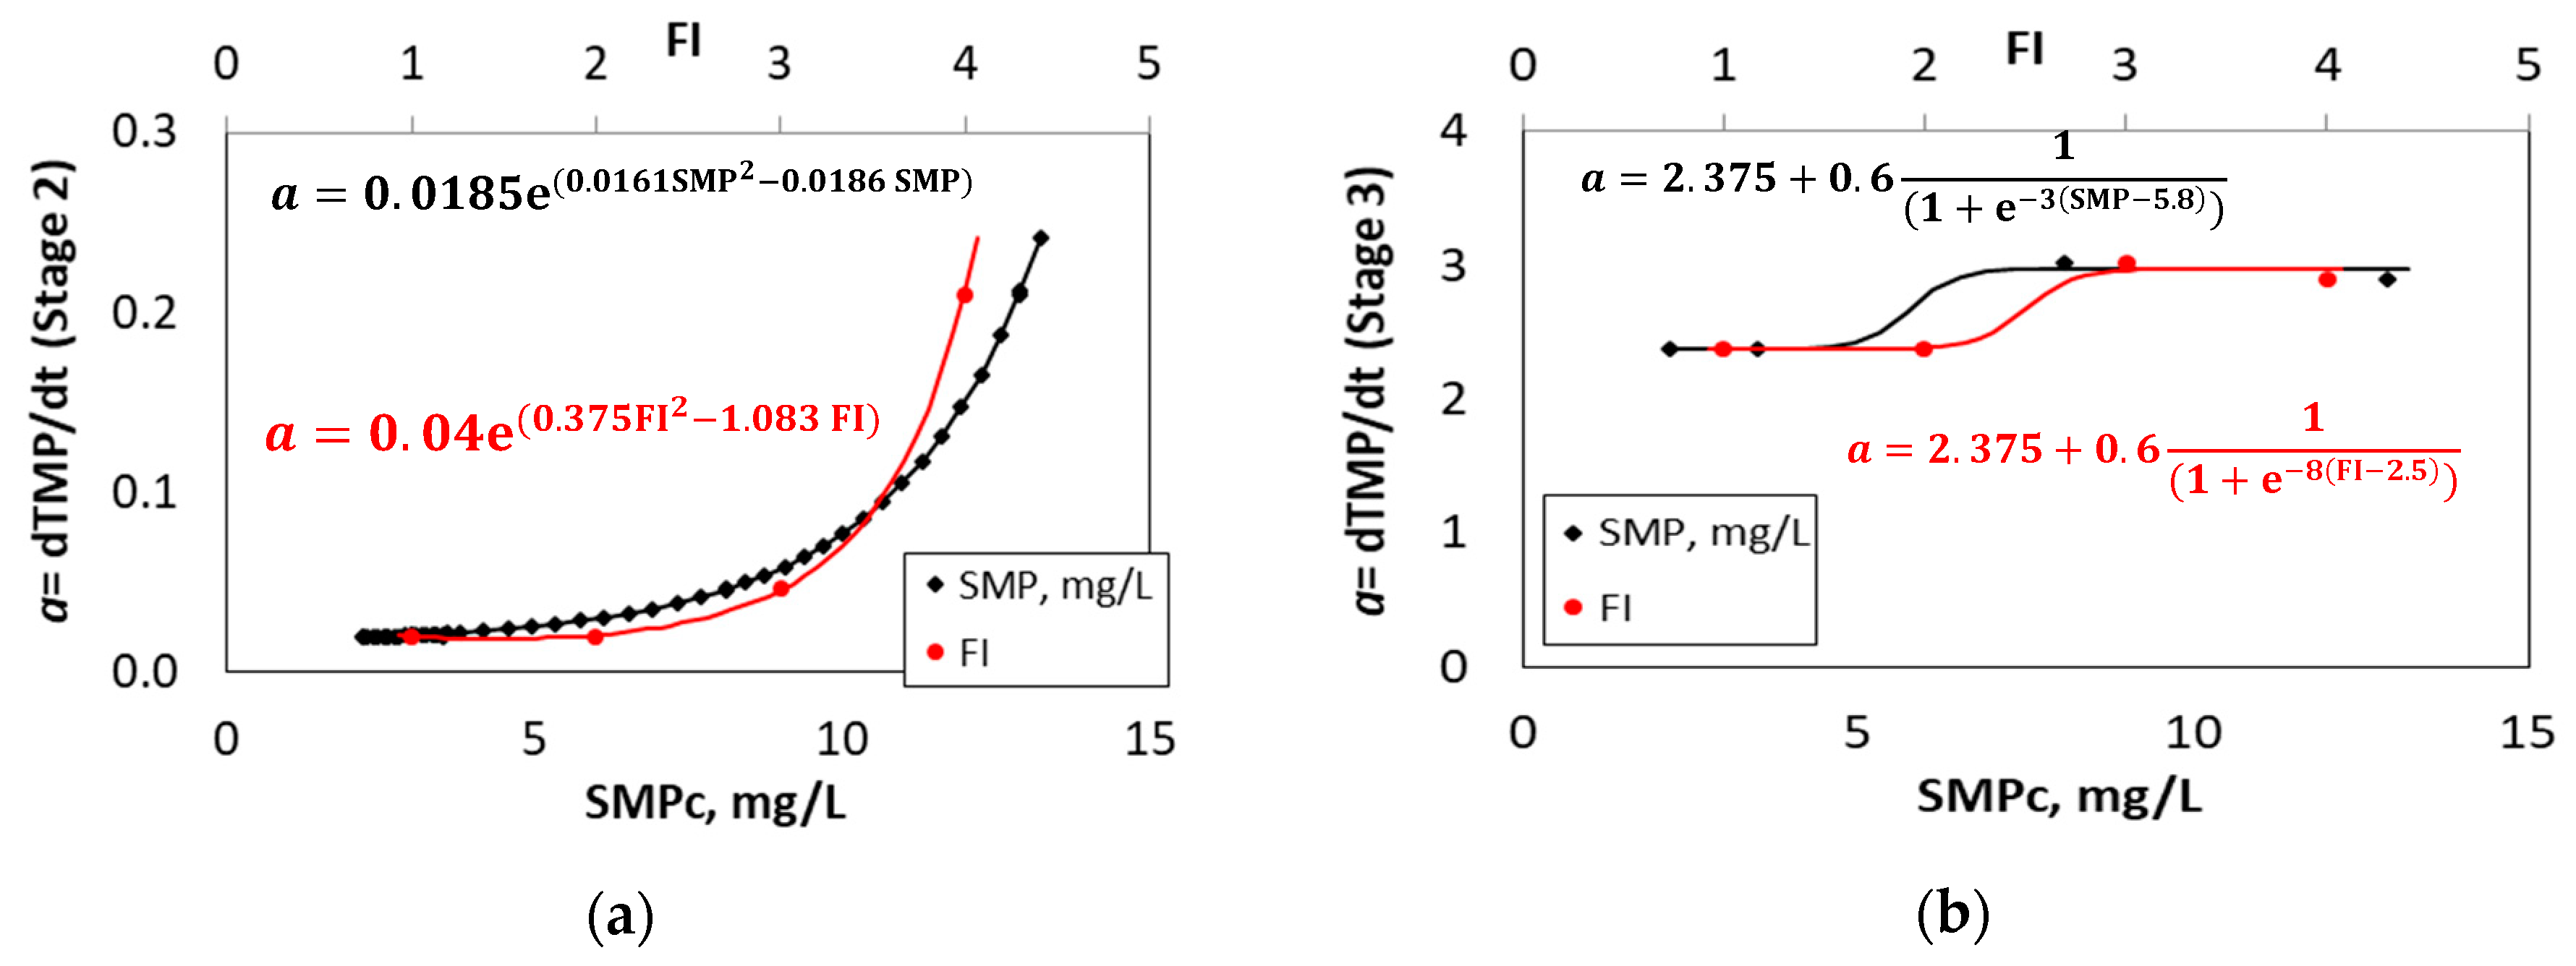
3.4. TMP Fitting Results and Development of a Novel Mathematical Equation

Fitting of the experimental TMP data with the basic models and calculation of R-squared coefficients of the produced equations showed that in most Phases the evolution of TMP is best described by the model of cake blocking. Regarding the combined models, this depends on the operating Phase and the stage of the TMP evolution (long-term fouling or TMP rise) and there is no combined model that generally describes the evolution of TMP adequately.
Figure 8 shows the experimental and theoretical TMP for Stages 2 and 3 of all the examined Phases, A, B, C and D. As shown, each stage can be described by the equation y = ax + b. Slope a, i.e., the TMP increase rate (dTMP/dt), is indicative of the influence of the examined parameters on each stage and, therefore, on membrane fouling. The comparison of Figure 8a,b reveals that the reduction in DO from 2.5 ± 0.5 mg/L to 0.5 ± 0.3 mg/L does not influence fouling rate, since slope a remains 0.02 kPa/d and 2.375 kPa/d during Stage 2 and Stage 3, respectively. During these Phases (A and B), both SMPc concentration and filaments’ population (FI) are low. On the contrary, the increase in SMPc concentration and FI in Phase C, due to low COD to TN ratio and temperature, is reflected in the evolution of TMP (Figure 8c). During Phase C, two chemical cleanings are required to remove membrane fouling, i.e., Stages 2 and 3 are observed two times. Slope a of Stage 3 is relatively constant (approximately 3 kPa/d), while slope a of Stage 2 changes from 0.0635 kPa/d to 0.0469 kPa/d. During Phase D (Figure 8d), four chemical cleanings are required to remove membrane fouling, i.e., Stages 2 and 3 are observed four times. Again, slope a of Stage 3 is relatively constant (approximately 2.9 kPa/d), while slope a of Stage 2 increases gradually (0.0336-0.07-0.08-0.21 kPa/d). During these Phases (C and D), SMPc concentration and filaments’ population are higher. These observations suggest that SMPc and FI mainly affect membrane fouling during the second stage of TMP evolution, i.e., during long-term fouling. It is also noticed that slope a in the beginning of Phase D (0.0336 kPa/d) is lower than slope a in the beginning of Phase C (0.0635 kPa/d). This is particularly indicative of the stochastic nature of the conducted experiments, i.e., the experimental conditions are not completely controlled: as stated in Section 2.1, the system is inoculated with a new sludge sample in the beginning of each Phase. It is understood that the slightest difference in biomass characteristics (EPS, SMP, colloids, etc.) affects their interactions with the membrane surface differently during the initial adsorption process (Stage 1) and, consequently, also Stage 2 and Stage 3.
Figure 9 presents slope a (dTMP/dt) as a function of FI and SMPc concentration for Stage 2 and Stage 3 of TMP evolution, i.e., for the long-term fouling and TMP jump, respectively, for all Phases. As shown, during long term fouling (Stage 2) (Figure 9a), the TMP rate is strongly affected by FI and SMPc concentration and increases exponentially with their increase. Regarding their influence on TMP jump (Stage 3) (Figure 9b), there is a critical value for FI and SMPc concentration which significantly influences the behaviour of the TMP rate. Critical values are FI = 2.5 and SMPc = 5.8 mg/L. There is no a better estimation from the obtained data. Therefore, TMP rate is constant at low FI and SMPc values, increases after the critical FI and SMPc value, and then it is stabilized again. Correlations for slope α with respect to FI and SMPc also appear in Figure 9. It is important to understand that these correlations are not of a predictive but of a descriptive nature. The TMP evolution may depend on many other parameters. In fact it is not clear whether FI or SMPc primarily affects slope. The correlations can actually be seen as an organization of the information acquired by the present limited experiments. An extensive experimental campaign with several sets of input parameters is needed for derivation of predictive correlations. It is well understood that this is a cumbersome and time-consuming task. The present work suggests a method of data handling when proceeding in such a task.

3.5. Effluent Quality

Although the primary objective of the present study concerns fouling investigation, effluent quality was also examined in terms of organics and nitrogen removal. Table 3 shows the effluent quality parameters for all phases in the pilot-scale MBR. Organic matter content was assessed in terms of COD removal and nitrogen content was assessed in terms of Total Nitrogen (TN), ammonium (NH4+-N) and nitrate (NO3-N) removal. As shown in Table 3, COD removal is high for all FI values and for both COD to TN ratios. This is in accordance with most research studies which support that COD removal is independent of COD to TN ratio in the influent wastewater [34,35]. However, effluent COD is slightly higher during Phases C and D, which can be attributed to the increased concentration of SMPc (as shown in Figure 5) and possibly of other components, such as proteins, humics, etc., in the mixed liquor during these phases. On the contrary, nitrogen removal depends on the influent COD to TN ratio. Therefore, TN removal is lower for Phases C and D, obviously due to excess nitrogen conditions (COD to TN = 5 to 1) compared to Phases A and B (COD to TN = 10 to 1). Furthermore, lower nitrogen removal in these conditions is likely to be enhanced by the growth of different populations of microorganisms that do not favour the denitrification process, since higher concentrations of nitrate are observed in the effluent. The development of different strains of microorganisms when different COD to TN ratios are applied, has been also reported by Mannina et al. [36]. Finally, although ammonium removal is generally high (>98%), ammonium concentration in the effluent is higher for Phases C and D, probably due to the low temperature, which reduces the nitrification rate.

4. Conclusions

The present work aims to quantify the effect of the COD to TN ratio, DO concentration and temperature on the population of filamentous microorganisms and TMP in a fully-automated pilot-scale MBR that treated synthetic municipal wastewater. At high COD to TN ratio (10:1), low DO concentration in the filaments’ tank (0.5 ± 0.3 mg/L) and high temperature (24–30 °C), a moderate population of filaments was produced (FI = 1–2), which prolonged the membrane’s operating time. Under these conditions, an increase in sludge filterability and settleability was also favoured. The filaments’ population, however, did not remain constant but rapidly increased when the COD to TN ratio changed to 5:1 and the temperature decreased to 18–22 °C (FI = 2–3) or 15–19 °C (FI = 3–4). Fitting of TMP data with the most commonly applied basic and combined fouling models showed that the formation of cake layer is the prevalent fouling mechanism in most operating conditions. Further TMP data analysis from the stages of long-term fouling (Stage 2) and TMP jump (Stage 3) showed that the TMP rate is affected by FI and SMPc concentration mainly during Stage 2 and increases exponentially with their increase, according to the following descriptive equations:
dTMP / dt = 0.04 e ( 0.375 FI 2     1.083   FI )
dTMP / dt = 0.0185 e ( 0.0161 SMPc 2     0.0186   SMPc )

Author Contributions

Conceptualization, M.M., A.Z. and P.G.; methodology, G.L., P.G. and A.P.; software, P.G., M.K. and A.P.; validation, P.G., M.M., M.K. and A.Z.; formal analysis, P.G., A.P. and M.K.; investigation, P.G., G.L. and A.P.; resources, A.Z.; data curation, P.G. and M.K.; writing—original draft preparation, P.G.; writing—review and editing, P.G., M.M., M.K. and A.Z.; visualization, P.G., M.M. and M.K.; supervision, M.M., A.Z. and M.K.; project administration, A.Z. and M.M.; funding acquisition, A.Z. All authors have read and agreed to the published version of the manuscript.

Funding

This research received no external funding.

Acknowledgments

This research has been co-financed by the European Union and Greek national funds through the Operational Program Competitiveness, Entrepreneurship and Innovation, under the call RESEARCH-CREATE-INNOVATE (project code: T1EDK-04370).

Conflicts of Interest

The authors declare no conflict of interest.

Appendix A

Description of the Eikelboom Method for the Estimation of Filaments’ Population

According to Eikelboom (2000) [20], a scale of 0–5 is used from none to infinite filaments. Between the consecutive FI classes, there is a difference of approximately a factor of 10. The FI is determined by comparing the microscopic images of the sludge, at a low magnification, with a series of reference photos of the various FI classes. The mixed liquor receives the FI value of the photo which best corresponds to the number of filamentous microorganisms in the microscopic image. When FI = 1 or 2, the effect of filamentous microorganisms on the settling velocity of the sludge is slight. When FI = 3, the settling properties are often significantly deteriorated, and when FI > 3 bulking usually occurs.

Appendix B

Description of the Phenol-Sulfuric Acid Method for the Determination of SMPc

The principle of this method is that carbohydrates, when dehydrated by reaction with concentrated sulfuric acid, produce furfural derivatives. Further reaction between furfural derivatives and phenol develops a detectible colour. A short description of the standard procedure is the following: 1 mL of a carbohydrate solution was mixed with 1 mL of wt. 5% aqueous solution of phenol in a test tube. Subsequently, 5 mL of concentrated H2SO4 were added rapidly to the mixture. After allowing the test tubes to stand for 10 min, they were vortexed for 30 s and placed for 20 min in a water bath at room temperature for colour development. Then, light absorption at 480 nm was recorded on a spectrophotometer. Reference solutions were prepared in identical manner as aforementioned, except that the 1 mL of carbohydrate was replaced by glucose.

References

  1. Yoon, S.-H. Membrane Bioreactor Processes: Principles and Applications; CRC Press: Boca Raton, FL, USA, 2016. [Google Scholar]
  2. Gkotsis, P.K.; Zouboulis, A.I.; Mitrakas, M.M. Using Additives for Fouling Control in a Lab-Scale MBR.; Comparing the Anti-Fouling Potential of Coagulants, PAC and Bio-Film Carriers. Membranes 2020, 10, 42. [Google Scholar] [CrossRef] [PubMed] [Green Version]
  3. Judd, S. The MBR book: Principles and Applications of Membrane Bioreactors for Water and Wastewater Treatment, 2nd ed.; Elsevier: Oxford, UK, 2011. [Google Scholar]
  4. Gkotsis, P.K.; Mitrakas, M.M.; Tolkou, A.K.; Zouboulis, A.I. Batch and continuous dosing of conventional and composite coagulation agents for fouling control in a pilot-scale MBR. Chem. Eng. J. 2017, 311, 255–264. [Google Scholar] [CrossRef]
  5. Gkotsis, P.K.; Banti, D.C.; Peleka, E.N.; Zouboulis, A.I.; Samaras, P.E. Fouling issues in membrane bioreactors (MBRs) for wastewater treatment: Major mechanisms, prevention and control strategies. Processes 2014, 2, 795–866. [Google Scholar] [CrossRef]
  6. Meng, F.; Zhang, S.; Oh, Y.; Zhou, Z.; Shin, H.-S.; Chae, S.-R. Fouling in membrane bioreactors: An updated review. Water Res. 2017, 114, 151–180. [Google Scholar] [CrossRef] [PubMed]
  7. Gkotsis, P.K.; Zouboulis, A.I. Biomass Characteristics and Their Effect on Membrane Bioreactor Fouling. Molecules 2019, 24, 2867. [Google Scholar] [CrossRef] [Green Version]
  8. Liu, J.; Li, J.; Xie, K.; Sellamuthu, B. Role of adding dried sludge micropowder in aerobic granular sludge reactor with extended filamentous bacteria. Bioresour. Technol. Rep. 2019, 5, 51–58. [Google Scholar] [CrossRef]
  9. Li, W.-M.; Liao, X.-W.; Guo, J.-S.; Zhang, Y.-X.; Chen, Y.-P.; Fan, F.; Yan, P. New insights into filamentous sludge bulking: The potential role of extracellular polymeric substances in sludge bulking in the activated sludge process. Chemosphere 2020, 248, 126012. [Google Scholar] [CrossRef]
  10. Meng, F.; Zhang, H.; Yang, F.; Li, Y.; Xiao, J.; Zhang, X. Effect of filamentous bacteria on membrane fouling in submerged membrane bioreactor. J. Membr. Sci. 2006, 272, 161–168. [Google Scholar] [CrossRef]
  11. Meng, F.; Yang, F.; Xiao, J.; Zhang, J.; Gong, Z. A new insight into membrane fouling mechanism during membrane filtration of bulking and normal sludge suspension. J. Membr. Sci. 2006, 285, 159–165. [Google Scholar] [CrossRef]
  12. Meng, F.; Yang, F. Fouling mechanisms of deflocculated sludge, normal sludge, and bulking sludge in membrane bioreactor. J. Membr. Sci. 2007, 305, 48–56. [Google Scholar] [CrossRef]
  13. Li, J.; Li, Y.; Ohandja, D.G.; Yang, F.; Wong, F.S.; Chua, H.C. Impact of filamentous bacteria on properties of activated sludge and membrane-fouling rate in a submerged MBR. Sep. Purif. Technol. 2008, 59, 238–243. [Google Scholar] [CrossRef]
  14. Ma, C.; Jin, R.C.; Yang, G.F.; Yu, J.J.; Xing, B.S.; Zhang, Q.Q. Impacts of transient salinity shock loads on Anammox process performance. Bioresour. Technol. 2012, 112, 124–130. [Google Scholar] [CrossRef] [PubMed]
  15. Tay, J.H.; Liu, Q.S.; Liu, Y. Microscopic observation of aerobic granulation in sequential aerobic sludge blanket reactor. J. Appl. Microbiol. 2001, 91, 168–175. [Google Scholar] [CrossRef] [PubMed]
  16. Wang, Z.; Wang, P.; Wang, Q.; Wu, Z.; Zhou, Q.; Yang, D. Effective control of membrane fouling by filamentous bacteria in a submerged membrane bioreactor. Chem. Eng. J. 2010, 158, 608–615. [Google Scholar] [CrossRef]
  17. Hao, L.; Liss, S.N.; Liao, B.Q. Influence of COD: N ratio on sludge properties and their role in membrane fouling of a submerged membrane bioreactor. Water Res. 2016, 89, 132–141. [Google Scholar] [CrossRef] [PubMed]
  18. Banti, D.C.; Karayannakidis, P.D.; Samaras, P.; Mitrakas, M.G. An innovative bioreactor set-up that reduces membrane fouling by adjusting the filamentous bacterial population. J. Membr. Sci. 2017, 542, 430–438. [Google Scholar] [CrossRef]
  19. Zhou, L.; Zhang, Z.; Meng, X.; Fan, J.; Xia, S. New insight into the effects of Ca(II) on cake layer structure in submerged membrane bioreactors. Biofouling 2014, 30, 571–578. [Google Scholar] [CrossRef]
  20. Eikelboom, D.H. Process Control of Activated Sludge Plants by Microscopic Investigation, 1st ed.; IWA Publishing: Zutphen, The Netherlands, 2000. [Google Scholar]
  21. Le-Clech, P.; Chen, V.; Fane, T.A.G. Fouling in membrane bioreactors used in wastewater treatment. J. Membr. Sci. 2006, 284, 17–53. [Google Scholar] [CrossRef]
  22. DuBois, M.; Gilles, K.; Hamilton, J.; Rebers, P.; Smith, F. Colorimetric method for determination of sugars and related substances. Anal. Chem. 1956, 28, 350–356. [Google Scholar] [CrossRef]
  23. De la Torre, T.; Lesjean, B.; Drews, A.; Kraume, M. Monitoring of transparent exopolymer particles (TEP) in a membrane bioreactor (MBR) and correlation with other fouling indicators. Water Sci. Technol. 2008, 58, 1903–1909. [Google Scholar] [CrossRef]
  24. Rosenberger, S.; Kraume, M. Filterability of activated sludge in membrane bioreactors. Desalination 2002, 151, 195–200. [Google Scholar] [CrossRef]
  25. Hermia, J. Constant pressure blocking filtration laws—Application to power-law non-Newtonian fluids. Trans Istit. Chem. Eng. 1982, 60, 183–187. [Google Scholar]
  26. Hlavacek, M.; Bouchet, F. Constant flowrate blocking laws and an example of their application to deadend microfiltration of protein solutions. J. Membr. Sci. 1993, 82, 285–295. [Google Scholar] [CrossRef]
  27. Bolton, G.; LaCasse, D.; Kuriyel, R. Combined models of membrane fouling: Development and application to microfiltration and ultrafiltration of biological fluids. J. Membr. Sci. 2005, 277, 75–84. [Google Scholar] [CrossRef]
  28. Pajdak-Stós, A.; Fiałkowska, E. The influence of temperature on the effectiveness of filamentous bacteria removal from activated sludge by rotifers. Water Environ. Res. 2012, 84, 619–625. [Google Scholar] [CrossRef]
  29. Knoop, S.; Kunst, S. Influence of temperature and sludge loading on activated sludge settling, especially on Microthrix parvicella. Water Sci. Technol. 1998, 37, 27–35. [Google Scholar] [CrossRef]
  30. Krzeminski, P.; Iglesias-Obelleiro, A.; Madebo, G.; Garrido, J.M.; van dr Graaf, J.H.J.M.; van Lier, J.B. Impact of temperature on raw wastewater composition and activated sludge filterability in full-scale MBR systems for municipal sewage treatment. J. Membr. Sci. 2012, 423–424, 348–361. [Google Scholar] [CrossRef]
  31. Ma, C.; Yu, S.; Shi, W.; Heijman, S.G.J.; Rietveld, L.C. Effect of different temperatures on performance and membrane fouling in high concentration PAC-MBR system treating micro-polluted surface water. Bioresour. Technol. 2013, 141, 19–24. [Google Scholar] [CrossRef]
  32. Ma, Z.; Wen, X.; Zhao, F.; Xia, Y.; Huang, X.; Waite, D.; Guan, J. Effect of temperature variation on membrane fouling and microbial community structure in membrane bioreactor. Bioresour. Technol. 2013, 133, 462–468. [Google Scholar] [CrossRef]
  33. Van den Brink, P.; Satpradit, O.-A.; van Bentem, A.; Zwijnenburg, A.; Temmink, H.; van Loosdrecht, M. Effect of temperature shocks on membrane fouling in membrane bioreactors. Water Res. 2011, 45, 4491–4500. [Google Scholar] [CrossRef]
  34. Fu, Z.; Yang, F.; Zhou, F.; Xue, Y. Control of COD/N ratio for nutrient removal in a modified membrane bioreactor (MBR) treating high strength wastewater. Bioresour. Technol. 2009, 100, 136–141. [Google Scholar] [CrossRef] [PubMed]
  35. Hao, L.; Liao, B.Q. Effect of organic matter to nitrogen ratio on membrane bioreactor performance. Environ. Technol. 2015, 36, 2674–2680. [Google Scholar] [CrossRef] [PubMed]
  36. Mannina, G.; Ekama, G.A.; Capodici, M.; Cosenza, A.; Di Trapani, D.; Ødegaard, H. Moving bed membrane bioreactors for carbon and nutrient removal: The effect of C/N variation. Biochem. Eng. J. 2017, 125, 31–40. [Google Scholar] [CrossRef]
Figure 1. Schematic of pilot-scale MBR setup.
Processes 08 01514 g001
Figure 2. Evolution of Trans-Membrane Pressure (TMP) during filtration under constant flow rate conditions in MBRs.
Processes 08 01514 g002
Figure 3. Typical optical microscopy images from: (a) Phase A (FI = 0–1, T = 25–30 °C); (b) Phase B (FI = 1–2, T= 24–30 °C); (c) Phase C (FI = 2–3, T = 18–22 °C); (d) Phase D (FI = 3–4, T = 15–19 °C).
Processes 08 01514 g003
Figure 4. Effect of Filament Index (FI) and temperature on TMP during: (a) Phase A; (b) Phase B; (c) Phase C; (d) Phase D.
Processes 08 01514 g004
Figure 5. Effect of FI and temperature on SMPc concentration.
Processes 08 01514 g005
Figure 6. Effect of FI and temperature on sludge filterability (TTF).
Processes 08 01514 g006
Figure 7. Effect of FI and temperature on sludge settleability (SVI).
Processes 08 01514 g007
Figure 8. Experimental and theoretical TMP evolution during: (a) Phase A; (b) Phase B; (c) Phase C; (d) Phase D.
Processes 08 01514 g008
Figure 9. Correlation of dTMP/dt with FI and SMPc concentration for: (a) Stage 2 (long-term fouling) and (b) Stage 3 (TMP jump).
Processes 08 01514 g009
Table 1. Examined parameters in the pilot-scale Membrane Bio-Reactor (MBR).
PhaseCOD to TN RatioDO Concentration 1, mg/LT, °C
A~10:1
COD = 587.1 ± 77.1 mg/L
TN = 58.6 ± 6.6 mg/L
2.5 ± 0.525–30
B~10:1
COD = 587.1 ± 77.1 mg/L
TN = 58.6 ± 6.6 mg/L
0.5 ± 0.324–30
C~5:1
COD = 267.9 ± 34.3 mg/L
TN = 52.5 ± 5.7 mg/L
0.5 ± 0.318–22
D~5:1
COD = 267.9 ± 34.3 mg/L
TN = 52.5 ± 5.7 mg/L
2.5 ± 0.515–19
1 In the filaments’ tank.
Table 2. Basic and combined models for membrane fouling description.
Basic Models—Hlavacek and Bouchet [26]
ModelEquation
Cake blockingTMP = TMP0 + kc2 J 0 2 TMP0t
Complete blocking 1 T M P = 1 T M P 0 k b 2 T M P 0 t
Standard blocking 1 T M P 2 = 1 T M P 0 2 k s 2 J 0 t 2 T M P 0 2
Intermediate blockingln T M P = ln T M P 0 + ki2 J0 t
Combined models—Bolton et al. [27]
ModelEquation
Cake-intermediate blocking T M P = T M P o   e K i J o t ( 1 + K c J o K i ( e K i J o t 1 ) )
Cake-complete blocking T M P = T M P o 1 K b t ( 1 K c J o 2 K b ln ( 1 K b t ) )
Complete-standard blocking T M P = T M P o ( 1 K b t ) ( 1 + K s J o 2 K b ln ( 1 K b t ) 2
Intermediate-standard blocking T M P = T M P o   e K i J o t ( 1 K s 2 K i ( e K i J o t 1 ) 2
Cake-standard blocking T M P = T M P o ( ( 1 K s J o t 2 ) 2 + K c J o 2 t )
Table 3. Effluent quality parameters for all phases in the pilot-scale MBR.
Sampling SitePhase A (FI = 0–1)
COD, mg/LTN, mg/LNH4+-N, mg/LNO3-N, mg/L
MBR inlet587.0658.5742.771.02
DEN. tank21.4518.9311.322.13
FIL. tank17.2417.390.167.54
MBR outlet16.2113.810.1112.22
Sampling SitePhase B (FI = 1–2)
COD, mg/LTN, mg/LNH4+-N, mg/LNO3-N, mg/L
MBR inlet587.0658.5742.771.02
DEN. tank24.6716.4612.841.83
FIL. tank17.8313.850.185.56
MBR outlet15.4412.390.1011.10
Sampling SitePhase C (FI = 2–3)
COD, mg/LTN, mg/LNH4+-N, mg/LNO3-N, mg/L
MBR inlet267.9352.5036.731.28
DEN. tank23.4025.4317.655.03
FIL. tank20.3022.652.038.35
MBR outlet19.7318.790.5415.39
Sampling SitePhase D (FI = 3–4)
COD, mg/LTN, mg/LNH4+-N, mg/LNO3-N, mg/L
MBR inlet267.9352.5036.731.28
DEN. tank29.3530.4520.106.76
FIL. tank24.7626.343.7412.35
MBR outlet22.6021.700.7616.60
Publisher’s Note: MDPI stays neutral with regard to jurisdictional claims in published maps and institutional affiliations.

