1. Introduction
Recently, as the problem of environmental pollution due to the use of fossil fuels has emerged, interest in solar heat systems as a renewable energy source is increasing. A solar air heater (SAH) is a device that heats air flowing over an absorber plate by using solar energy. It is used for space heating, drying of agricultural products, and dehydration of industrial products [
1].
Compared to liquid solar heaters, SAHs have a disadvantage of low heat transfer rate, because the density of air is lower than that of a liquid. The heat transfer performance of an SAH is determined by various factors such as the velocity of the flow, the length and depth of the heater, and the shape of the heat absorber plate. The ratio between the area of the actual heat absorber and the absorber area normal to the solar radiation, which is called the absorber shape factor, is an important parameter in the design of SAHs.
Obstacles attached to the heat absorber plate are generally known to increase the heat transfer by enlarging the heat transfer area and enhancing turbulence intensity. However, as the area of the obstacles attached to the heat absorber plate increases, the pressure drop through the SAH also increases. Therefore, many studies have been conducted on the shape of the obstacles to enhance the overall heat transfer performance by increasing the heat transfer while minimizing the pressure drop [
2,
3,
4,
5,
6,
7,
8,
9,
10,
11,
12,
13,
14].
Kabeel and Mecarik [
2] studied the effect of the shape of the heat absorber plate on the performance of an SAH. It was confirmed that the heat transfer performance of the SAH with triangular obstacles was higher than that with longitudinal pins. Moummi et al. [
3] performed an energy analysis of an SAH with rectangular plate fins. The results for the heat transfer coefficient were compared with the results obtained for the SAH without obstacles. The collector efficiency factor of the SAH with plate pins increased by 30% compared to the case without obstacles. Essen [
4] performed energy and exergy analysis through experiments on obstacles of various shapes attached to an SAH. He concluded that the heat and exergy efficiencies of the SAH with obstacles increased as compared to the SAH without obstacles and the collector efficiency factor depended on the shape, area, orientation, and arrangements of the obstacles. Saini and Saini [
5] conducted an experimental study on the effect of the rib shape on the heat transfer performance of an SAH with arc-shaped ribs. They developed correlations for the Nusselt number and friction factor in terms of Reynolds number (Re), relative roughness height, and arc angle of ribs.
Ozgen et al. [
6] conducted an efficiency evaluation of an SAH with the flows flowing over the upper and lower surfaces of a heat absorber plate where aluminum cans were attached. Depaiwa et al. [
7] experimentally studied the forced convective heat transfer and friction loss for the turbulent flow in an SAH with rectangular winglet vortex generators. They tested an SAH with 20 winglet vortex generators at Reynolds numbers ranging from 5000 to 23,000. The heat transfer rates in this SAH were 174% to 182% higher than that of the SAH with a smooth absorber plate. Bekele et al. [
8] performed an experimental and numerical analysis on the effects of the height and longitudinal pitch of triangular obstacles on the heat transfer in an SAH. Through the analysis of the internal flow of the SAH, it was reported that recirculating flows occurring around the triangular obstacles effectively increased the turbulence intensity, thereby increasing the heat transfer rate by 3.6 times compared to the SAH without obstacles. Yadav et al. [
9] conducted an experimental study on the heat transfer performance and friction factor of the turbulent flow over a heat absorber plate with circular protrusions arranged in angular arc. The Nusselt number and friction factor were found to be 2.89 times and 2.93 times higher than those of the unobstructed SAH, respectively.
Kulkarni and Kim [
10] performed a numerical analysis to find the optimal shape of obstacles attached to an SAH. Numerical analysis was performed for four different shapes and three different arrangements of the obstacles. The Nusselt number and friction coefficient were greatly influenced by the shape and arrangement of the obstacles, and pentagonal obstacles showed the highest performance factor among the tested shapes. Alam and Kim [
11] performed a numerical analysis to predict the heat transfer performance of an SAH with conical protrusion ribs. The maximum thermal efficiency of the collector was reported to be 69.8%. They developed correlations for the Nusselt number and friction factor in terms of Reynolds number, relative roughness height, and relative rib pitch. Compared with the results of numerical analysis, the correlations for the Nusselt numbers and friction factor showed average absolute standard deviations of 2.78% and 5.25%, respectively. In addition, studies on SAHs with various types of obstacles such as V-shaped ribs, diamond-shaped ribs, and arc-shaped ribs have been also conducted to date [
12,
13,
14].
In this study, T-shaped ribs are newly proposed to further improve the performance of an SAH by considering both the heat transfer and pressure drop. The heat transfer and pressure drop characteristics of the SAH with ribs were analyzed using three-dimensional Reynolds-averaged Navier–Stokes (RANS) equations. A parametric study was conducted to confirm the effects of geometric parameters of the T-shaped ribs on the heat transfer and pressure drop in the SAH. The performance of the SAH with the proposed ribs was compared to SAHs with previously developed obstacles.
3. Numerical Methods
In this study, ANSYS-CFX 15.0 [
16], a commercial code which employs an unstructured grid, was used to analyze the flow and heat transfer using RANS equations. The shear stress transport (SST) [
17] model was used for the analysis of turbulence. The SST model was designed to take advantage of the k-ε and k-ω models by combining these two models using a weighting function so that the k-ω model is applied near the wall and the k-ε model is applied in the other area. The SST model is known to be effective in predicting the flow recirculation due to separation.
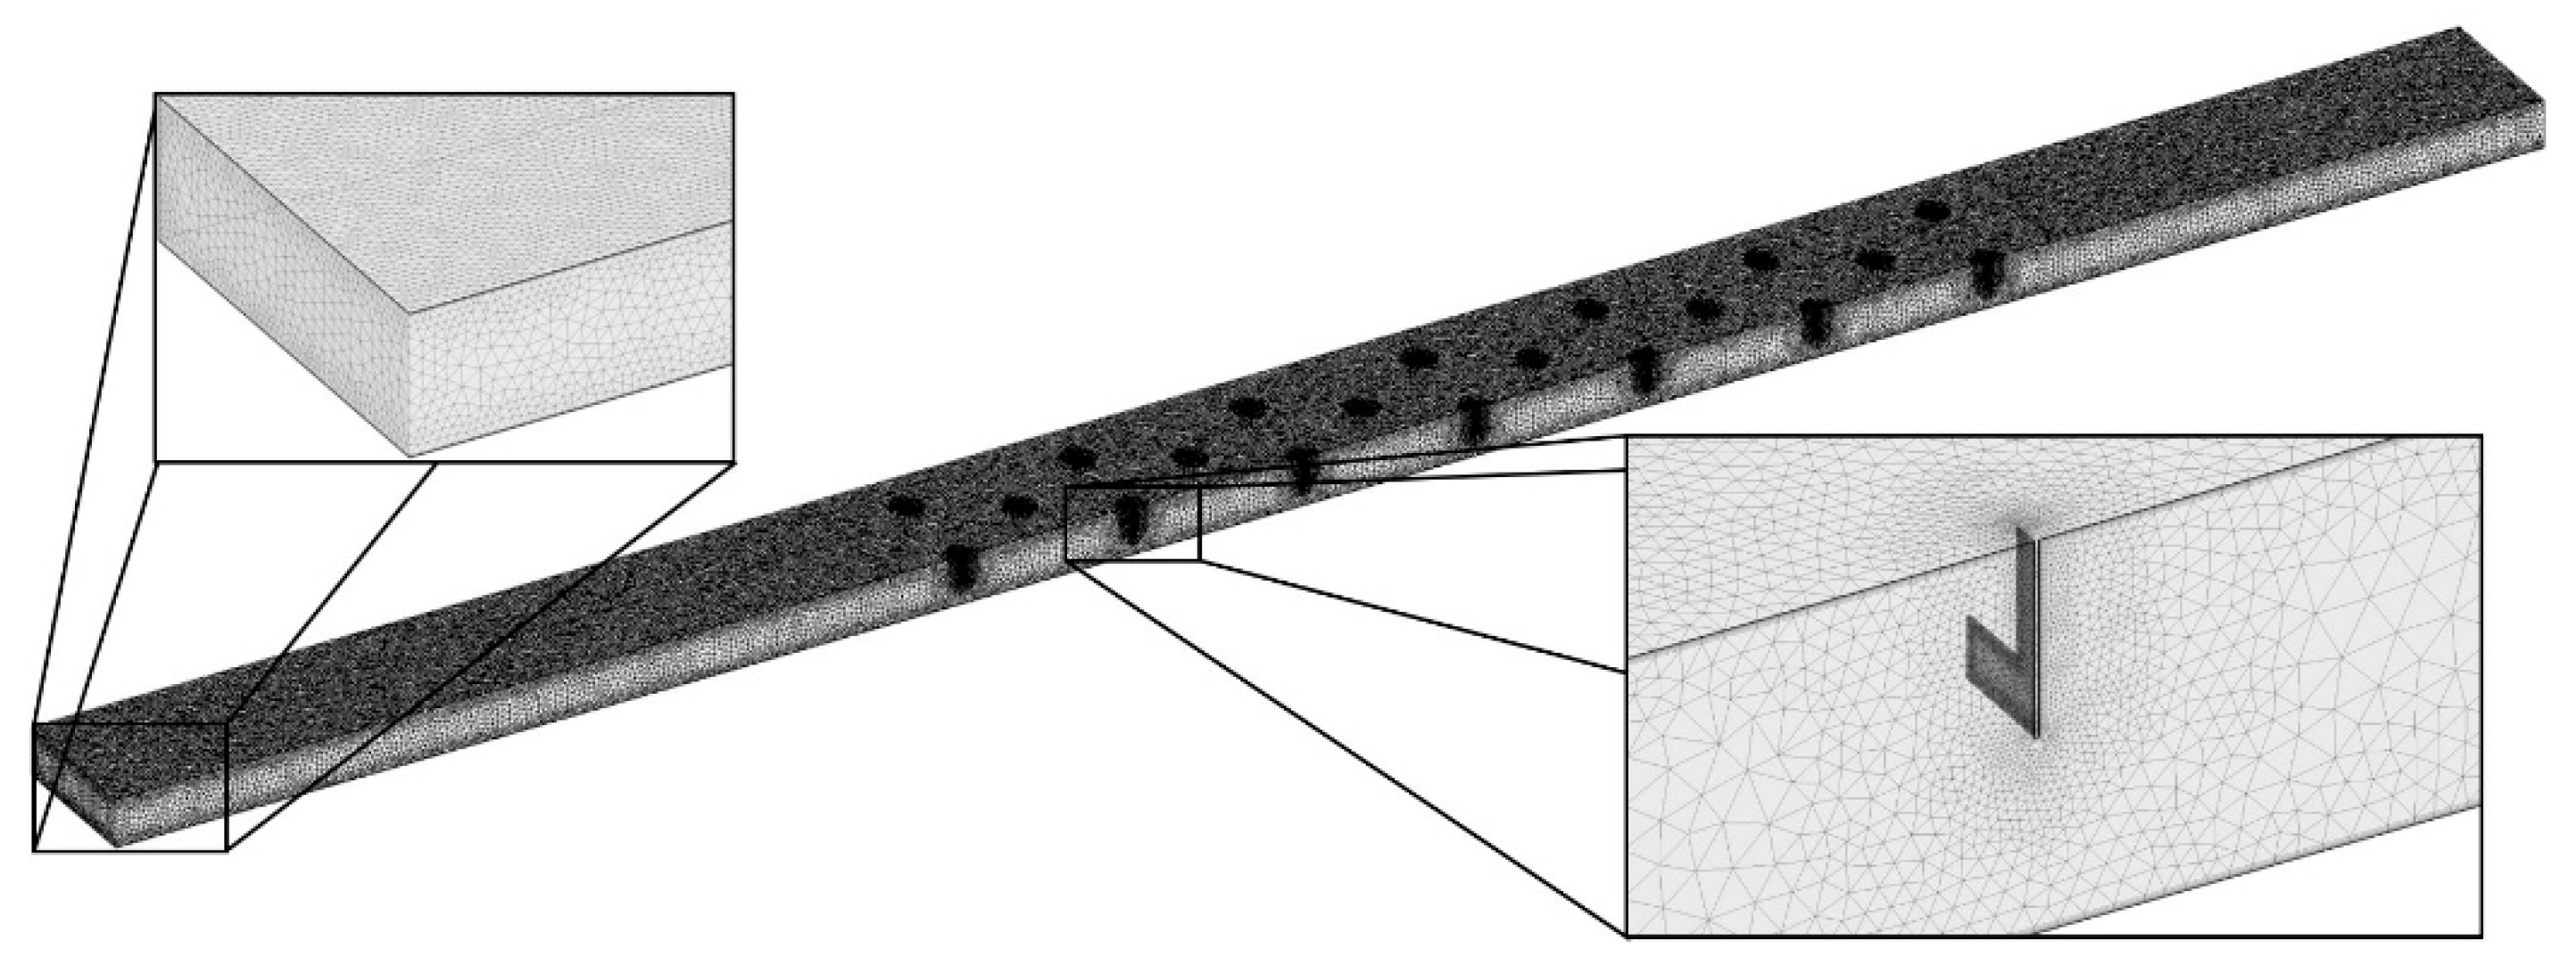
Air at 25 °C was used as the working fluid, and velocity and static pressure conditions were assigned to the inlet and outlet boundaries, respectively. A constant heat flux condition of 815 W/m2 was applied to the surface of the heat absorber plate, and the other solid surfaces were assumed to be adiabatic. The symmetric conditions were used at the symmetric plane of the computational domain, and a no-slip condition was used at the wall boundaries. An unstructured tetrahedral grid system was constructed in most of the computational domain, but prism meshes were placed near the wall to resolve the laminar sublayer. In order to use low-Re modeling for near-wall turbulence, the y+ values of the first grid points from the wall were kept at less than 1.0.
To find the grid dependency of the numerical solution, a test was performed according to the procedure proposed by Roache [
18] and Celik and Karatekin [
19]. This test analyzes the grid convergence index (GCI), which represents numerical uncertainty through the estimation of discretization error based on Richardson extrapolation.
Table 1 shows the results of the GCI analysis where the grid refinement factor (r) was set to 1.3 for three different grid systems (N
1, N
2, and N
3). This test was performed on the SAH with the reference ribs described in
Table 2. As the number of grid nodes increases, the Nusselt number tends to converge gradually. When N
2 is used, the extrapolated relative error (
) is 0.0015% and the relative error is 0.0019%, which confirms a relatively small numerical uncertainty. Therefore, based on this result, the optimum grid system is selected as N
2, which is shown in
Figure 2.
In order to determine the convergence of the numerical solution, the root mean square residual was reduced to 10−6 or less, and about 1200 iterations were performed. The computational time required for a single analysis was about 14 h when a personal computer with an Intel Core i7 3.41 GHz CPU was used for the computations.
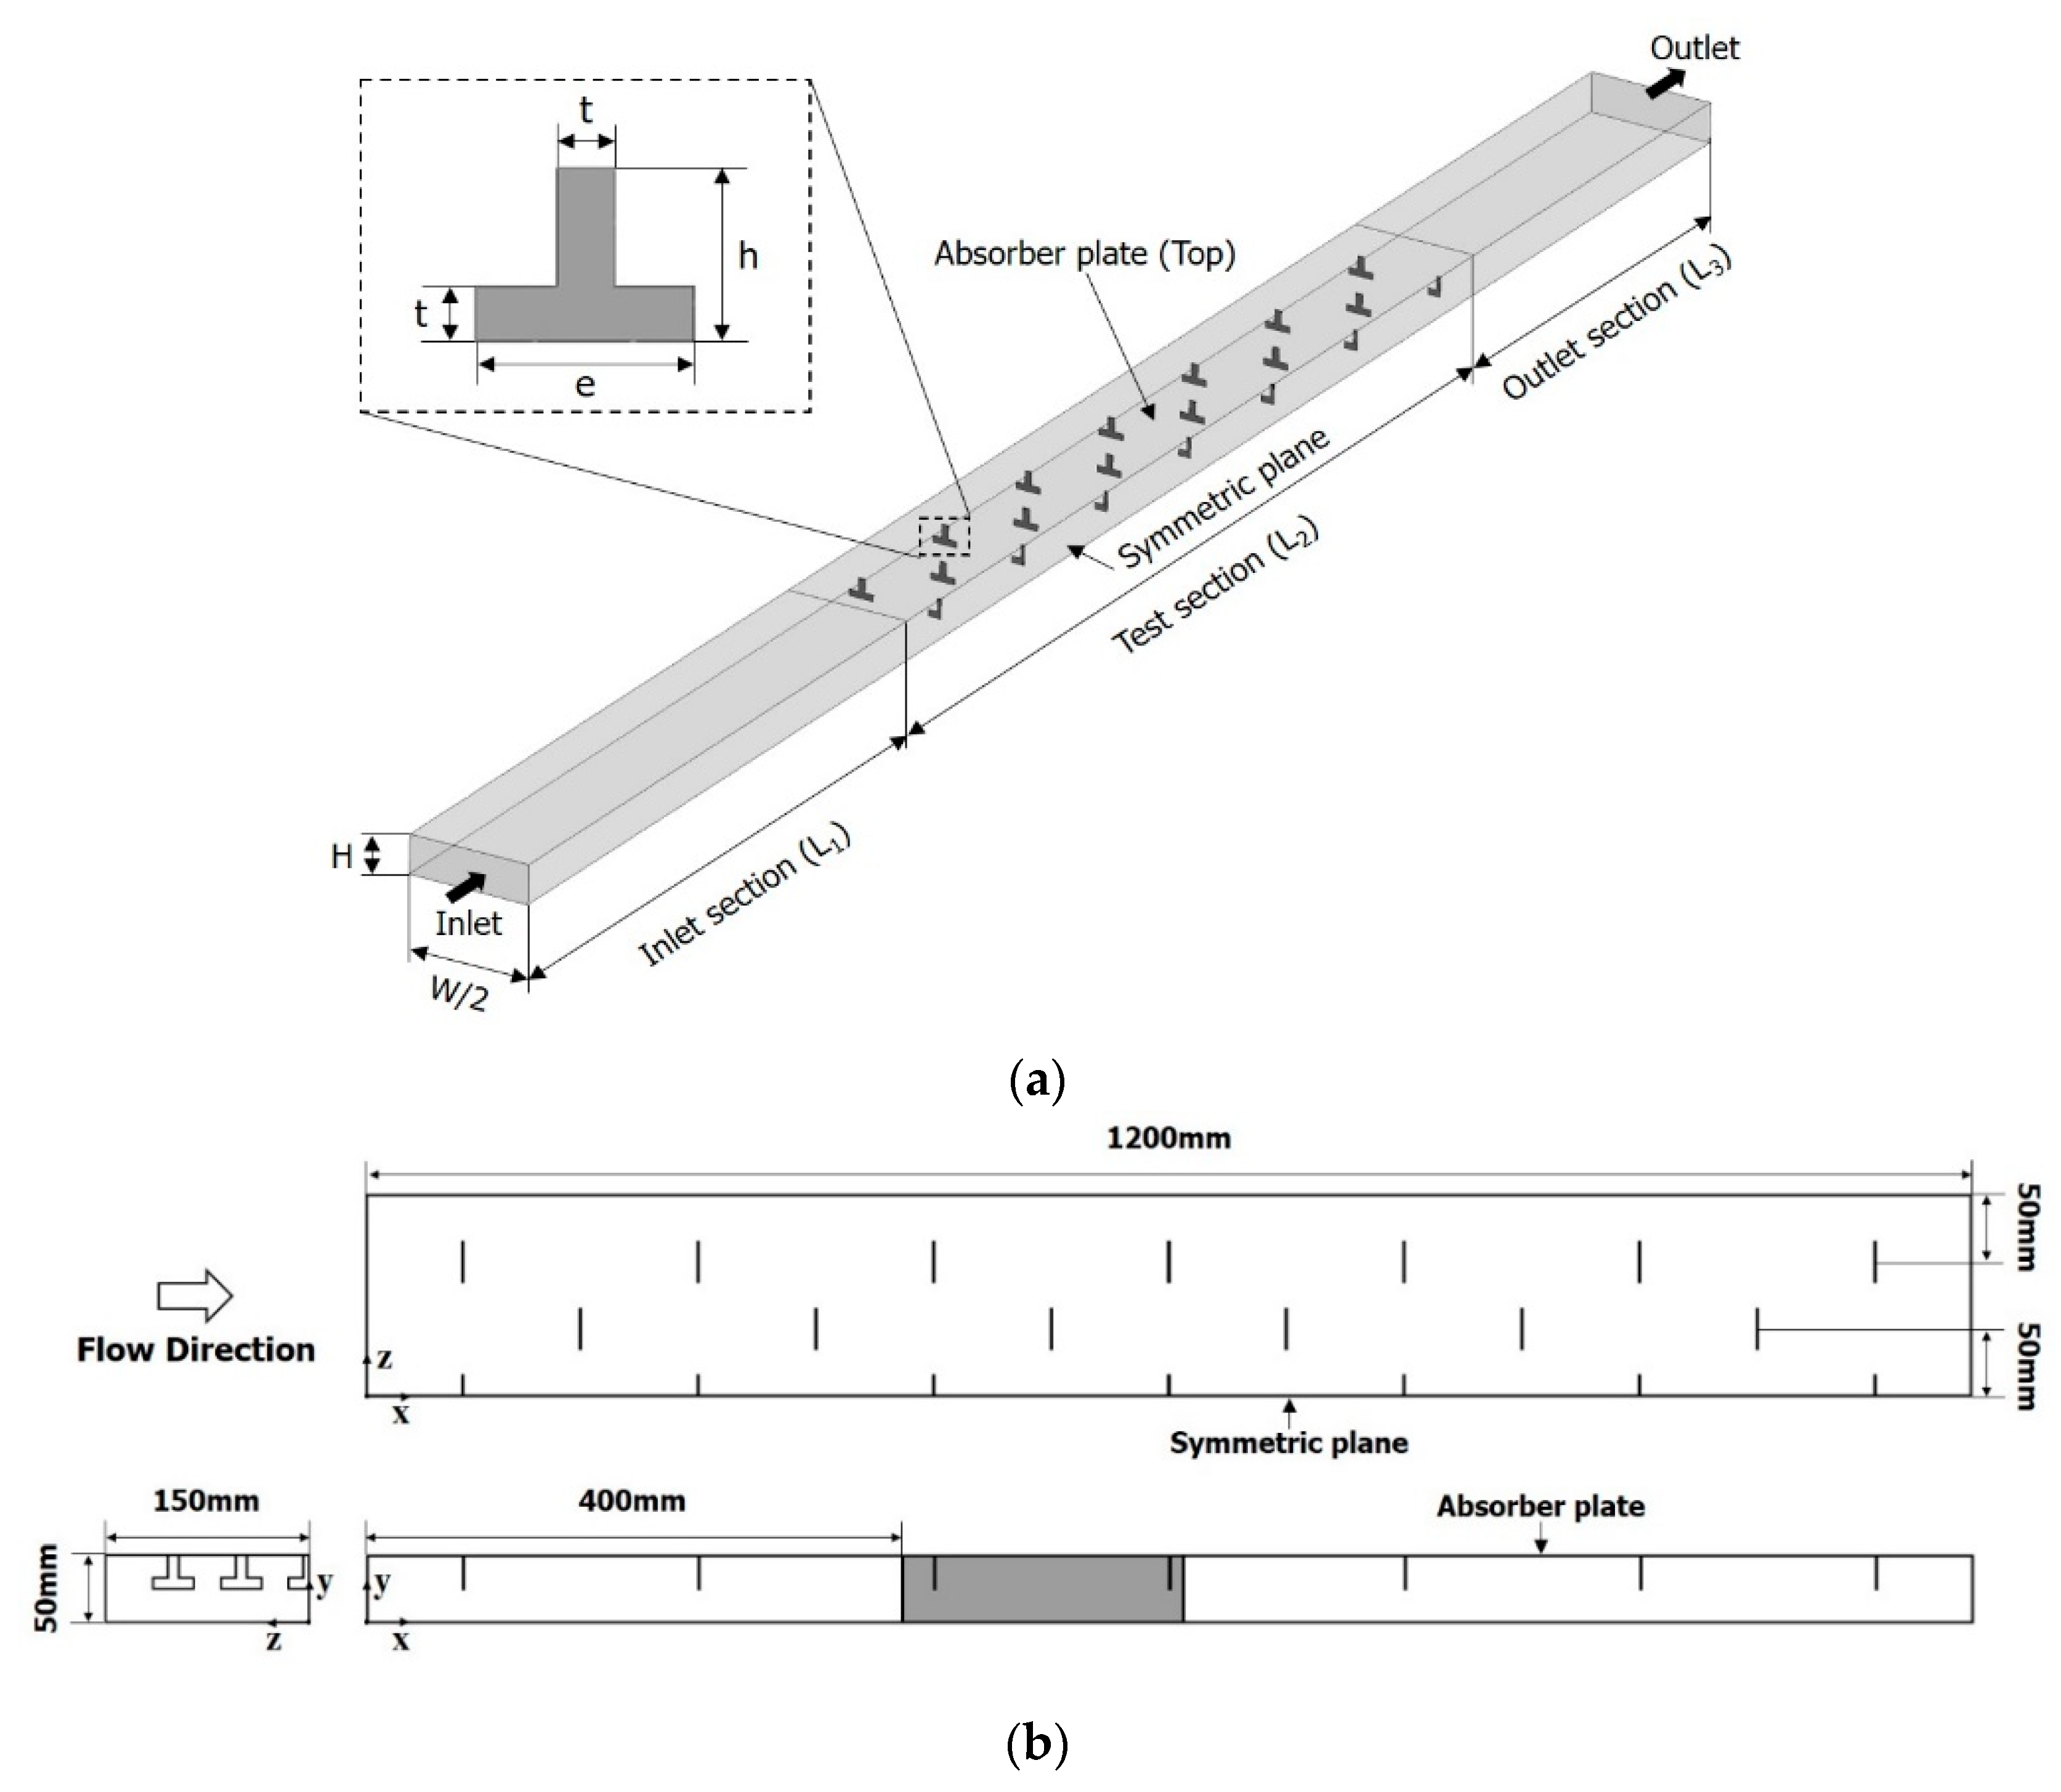
4. Geometric and Performance Parameters
In order to examine the effects of the rib shape shown in
Figure 1 on the heat transfer performance and pressure drop, three dimensionless parameters were selected; the ratios of the rib height to the channel height (h/H), the rib width to the channel width (e/W), and the rib height to the rib width (h/e). The ranges and reference values of these parameters are shown in
Table 2.
Three performance parameters are defined to evaluate the heat transfer and pressure drop in the SAH. The performance parameter related to the heat transfer is defined as follows:
Nuo is the area-averaged Nusselt number on the heat transfer surface.
where
Tp is the average temperature at the surface of the heat absorber plate including the obstacles,
Ts is the bulk temperature of the working fluid,
ka is the thermal conductivity of the fluid,
qo is the heat flux at the heat absorber plate,
Dh is the hydraulic diameter of the flow channel, and
Nus is the Nusselt number for a fully developed flow in a smooth channel without obstacles, which is calculated from the following Dittus–Boelter equation.
where Reynolds number,
Re, is defined using a hydraulic diameter, and
Pr indicates the Prandtl number.
The definition of the performance parameter related to the pressure drop is as follows:
Here,
fo is the friction factor in the flow channel with obstacles.
where ∆
p is the pressure drop in the test section,
ρ is the density of the working fluid,
U is the average velocity of the flow,
L is the length of the flow channel (test section), and
fs is the friction factor for the fully developed flow in the smooth channel, which is calculated from the following modified Blasius equation.
The performance factor,
PF [
20], for evaluating the performance of an SAH considering both the heat transfer performance and pressure drop at the same time, is defined as follows:
5. Results and Discussion
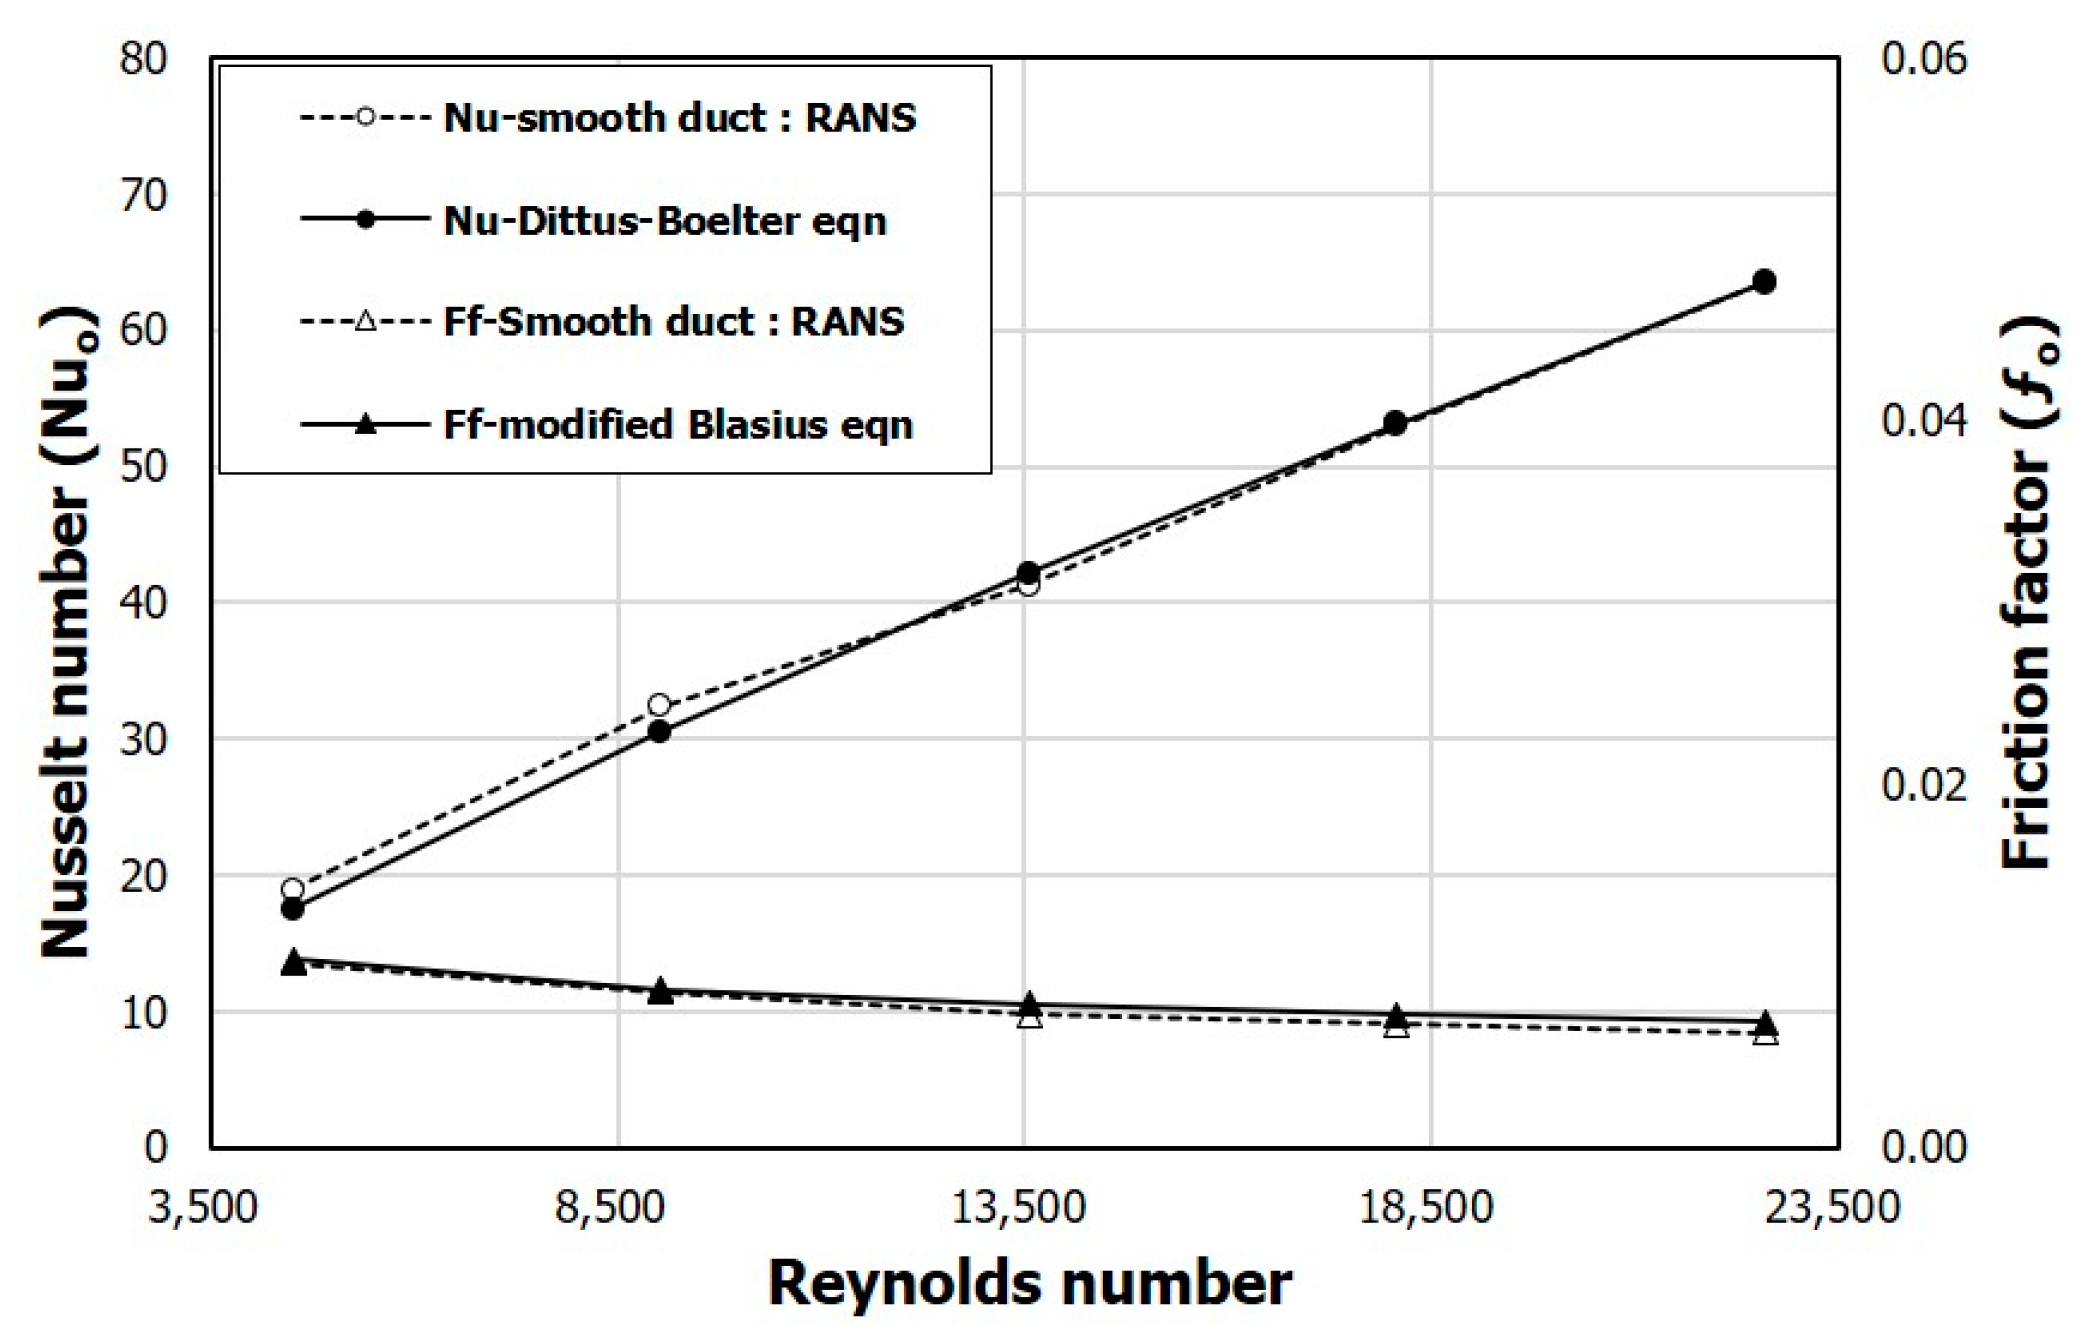
To prove the validity of the numerical analysis, the numerical results for the Nusselt number, Nu
o, and friction factor,
fo, are compared with corresponding empirical formulas for different Reynolds numbers in the flow channel without obstacles, as shown in
Figure 3. The numerical results show good overall agreement with the empirical formulas. As Reynolds number increases, the relative error tends to decrease in the case of Nu
o. Compared with the experimental data, the average relative error of the computed Nusselt numbers within the tested Reynolds number range is less than 3.29%, and it is less than 2.71% for the friction factor.
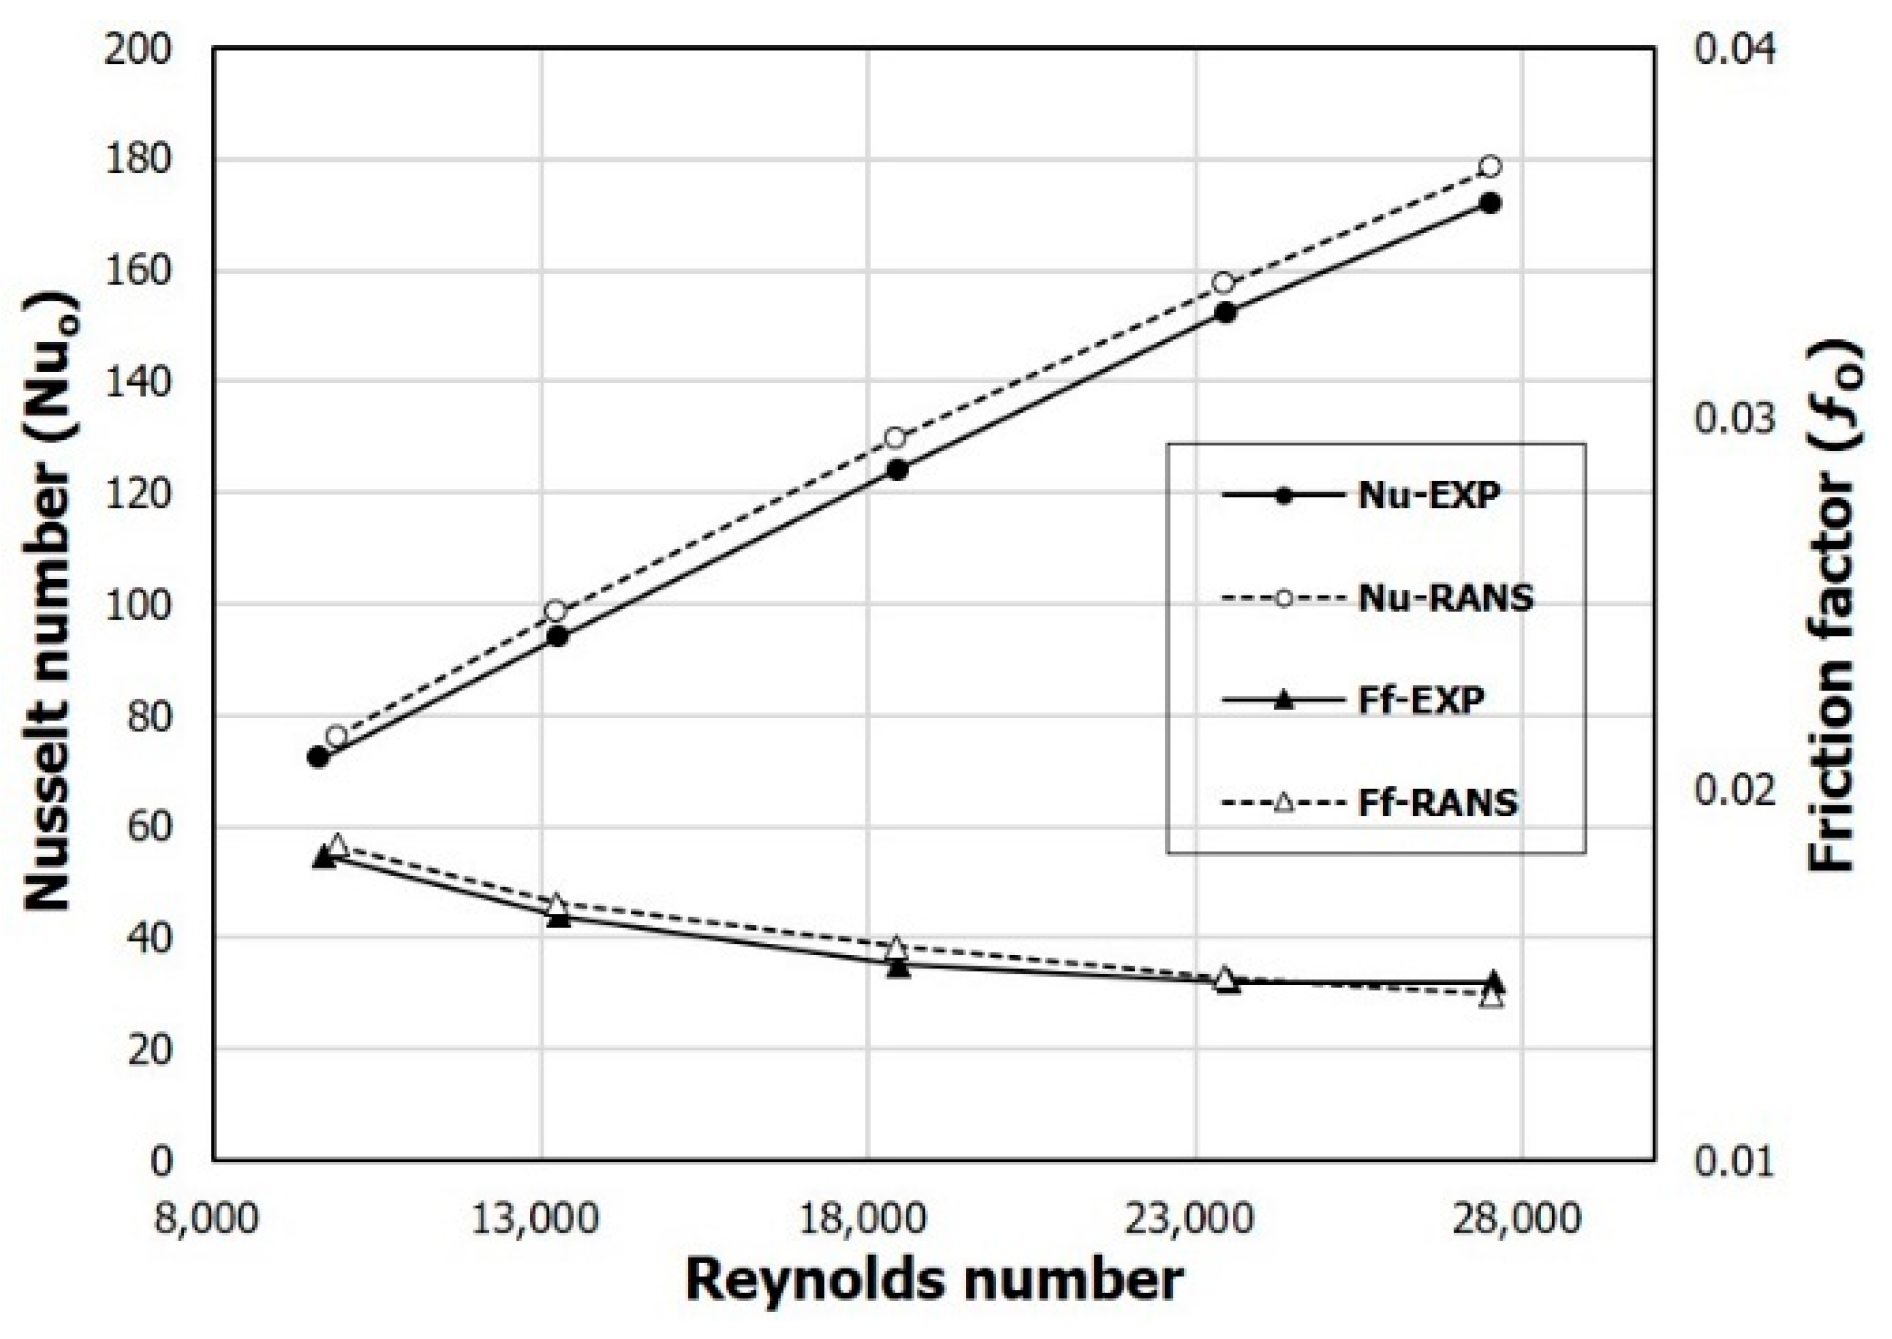
In addition, the validation test was also performed for the case with obstacles. The numerical results are compared with the experimental data obtained by Bekele et al. [
8] for the SAH with triangular obstacles under the same boundary conditions, as shown in
Figure 4. The numerical results agree well qualitatively with the experimental data. In the results for the Nusselt number, the computational and empirical slopes according to the Reynolds number are exactly the same but, quantitatively, they show a small difference unlike the case without obstacles. The average relative error for the Nusselt number compared to the experimental data within the tested Reynolds number range is less than 4.43%, and that for the friction factor is less than 1.94%, which indicates that the accuracy of the numerical analysis results is acceptable for further calculations.
The three dimensionless geometric parameters of the SAH with proposed T-shaped ribs presented in
Table 2 were used to find the effects of the rib shape on the performance parameters, i.e., F
Nu, F
f, and PF. The parametric study was performed at a Reynolds number of 22,600. In the case of two variables, h/H and e/W, the reference value in
Table 2 was applied to the parameter that was not changed, and the area of the rib was changed accordingly during the parametric study. However, in the case of h/e, the test was conducted with the rib area fixed at 375 mm
2. Therefore, in this case, both the absolute values of h and e changed to keep the area constant according to the change of h/e. In all cases, the size of t was kept constant.
The results of the parametric study for the ratio of the rib height to the channel height (h/H) are shown in
Figure 5,
Figure 6,
Figure 7,
Figure 8 and
Figure 9.
Figure 5 and
Figure 6 show the changes in the performance parameters, F
Nu and F
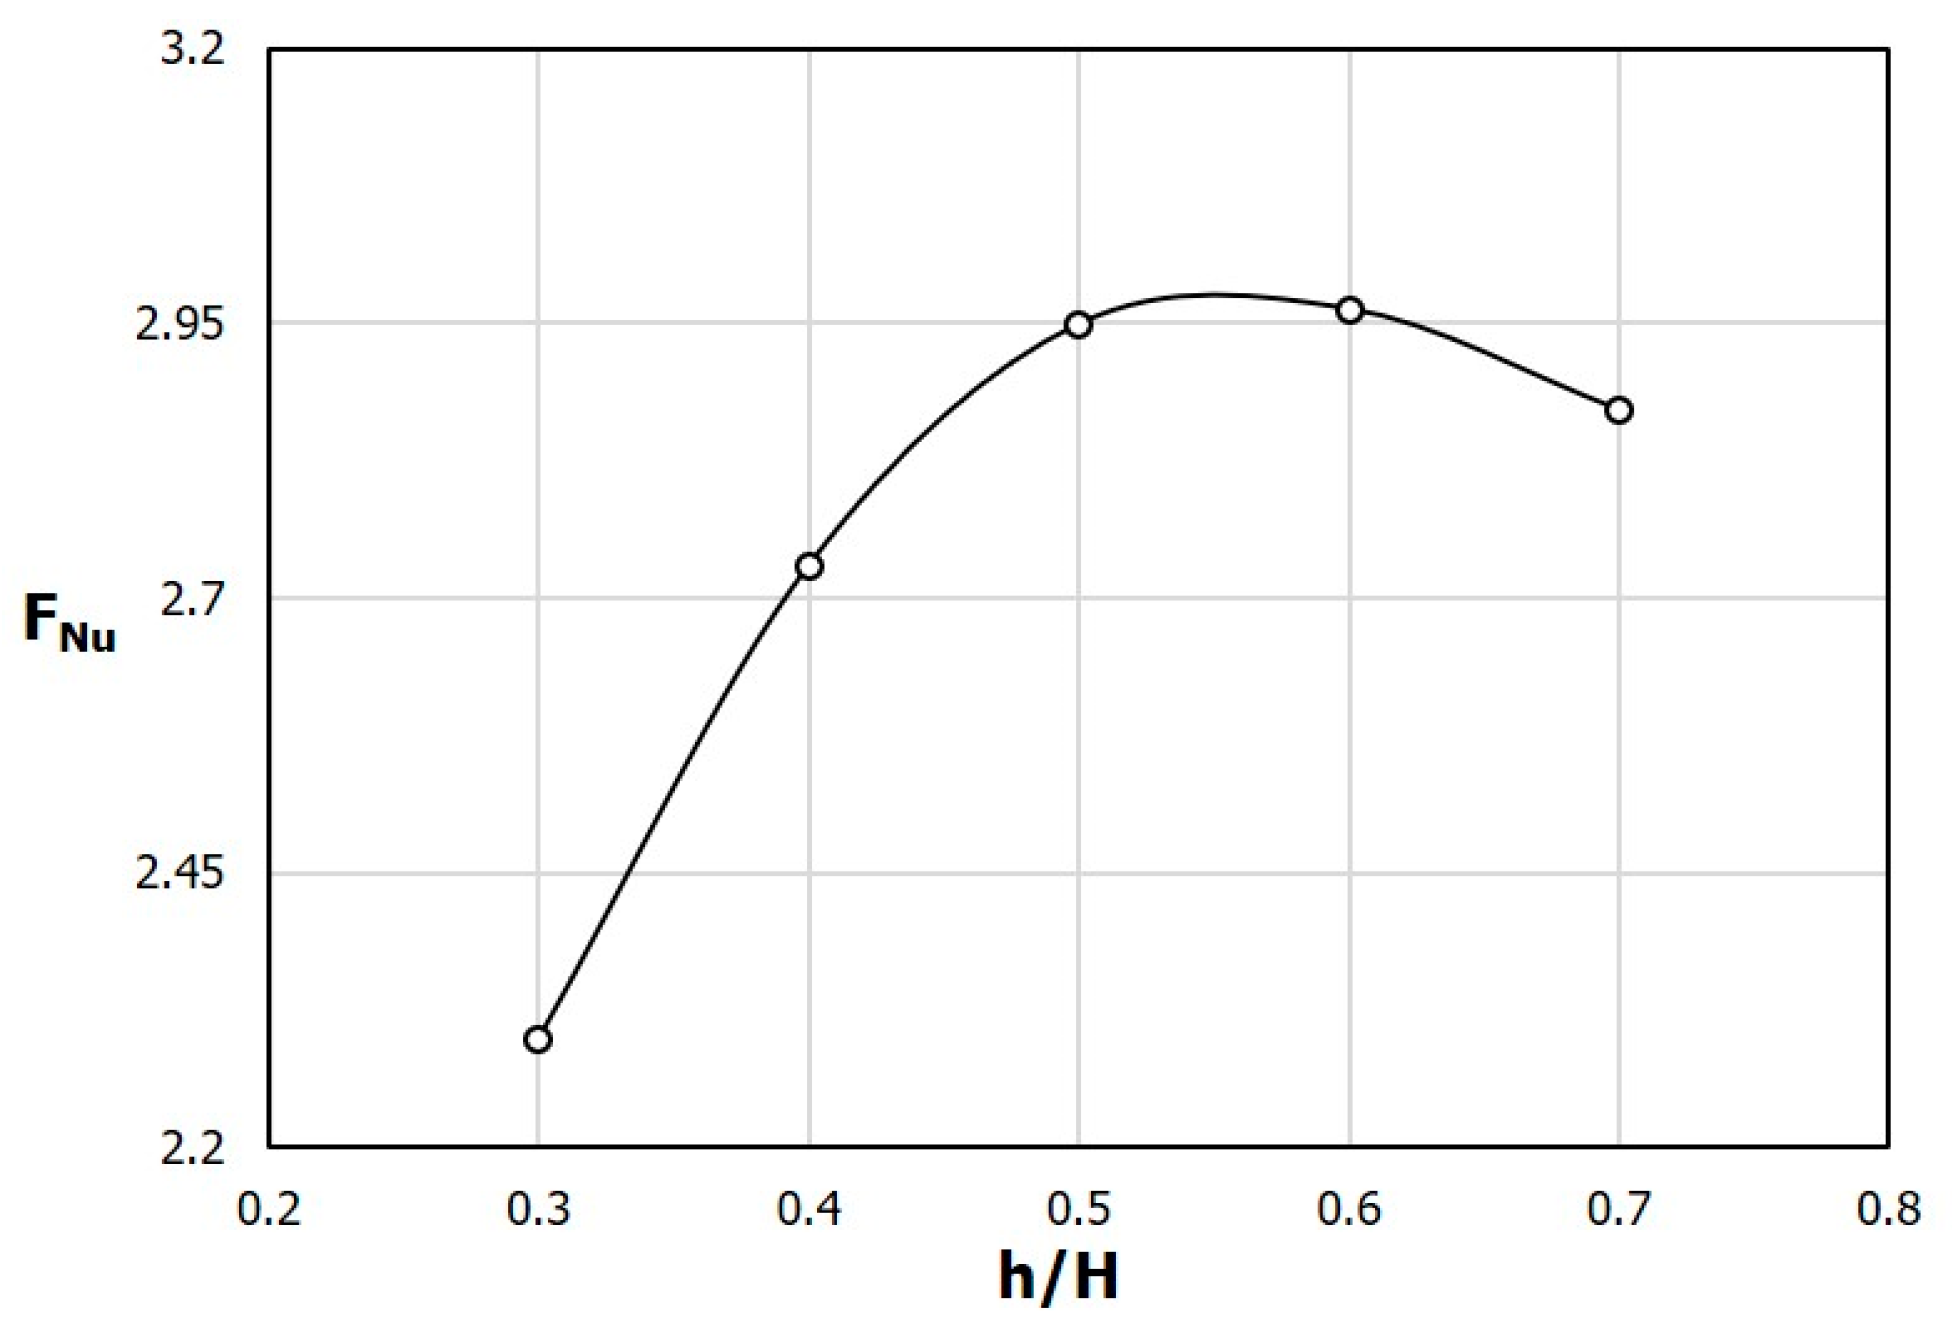
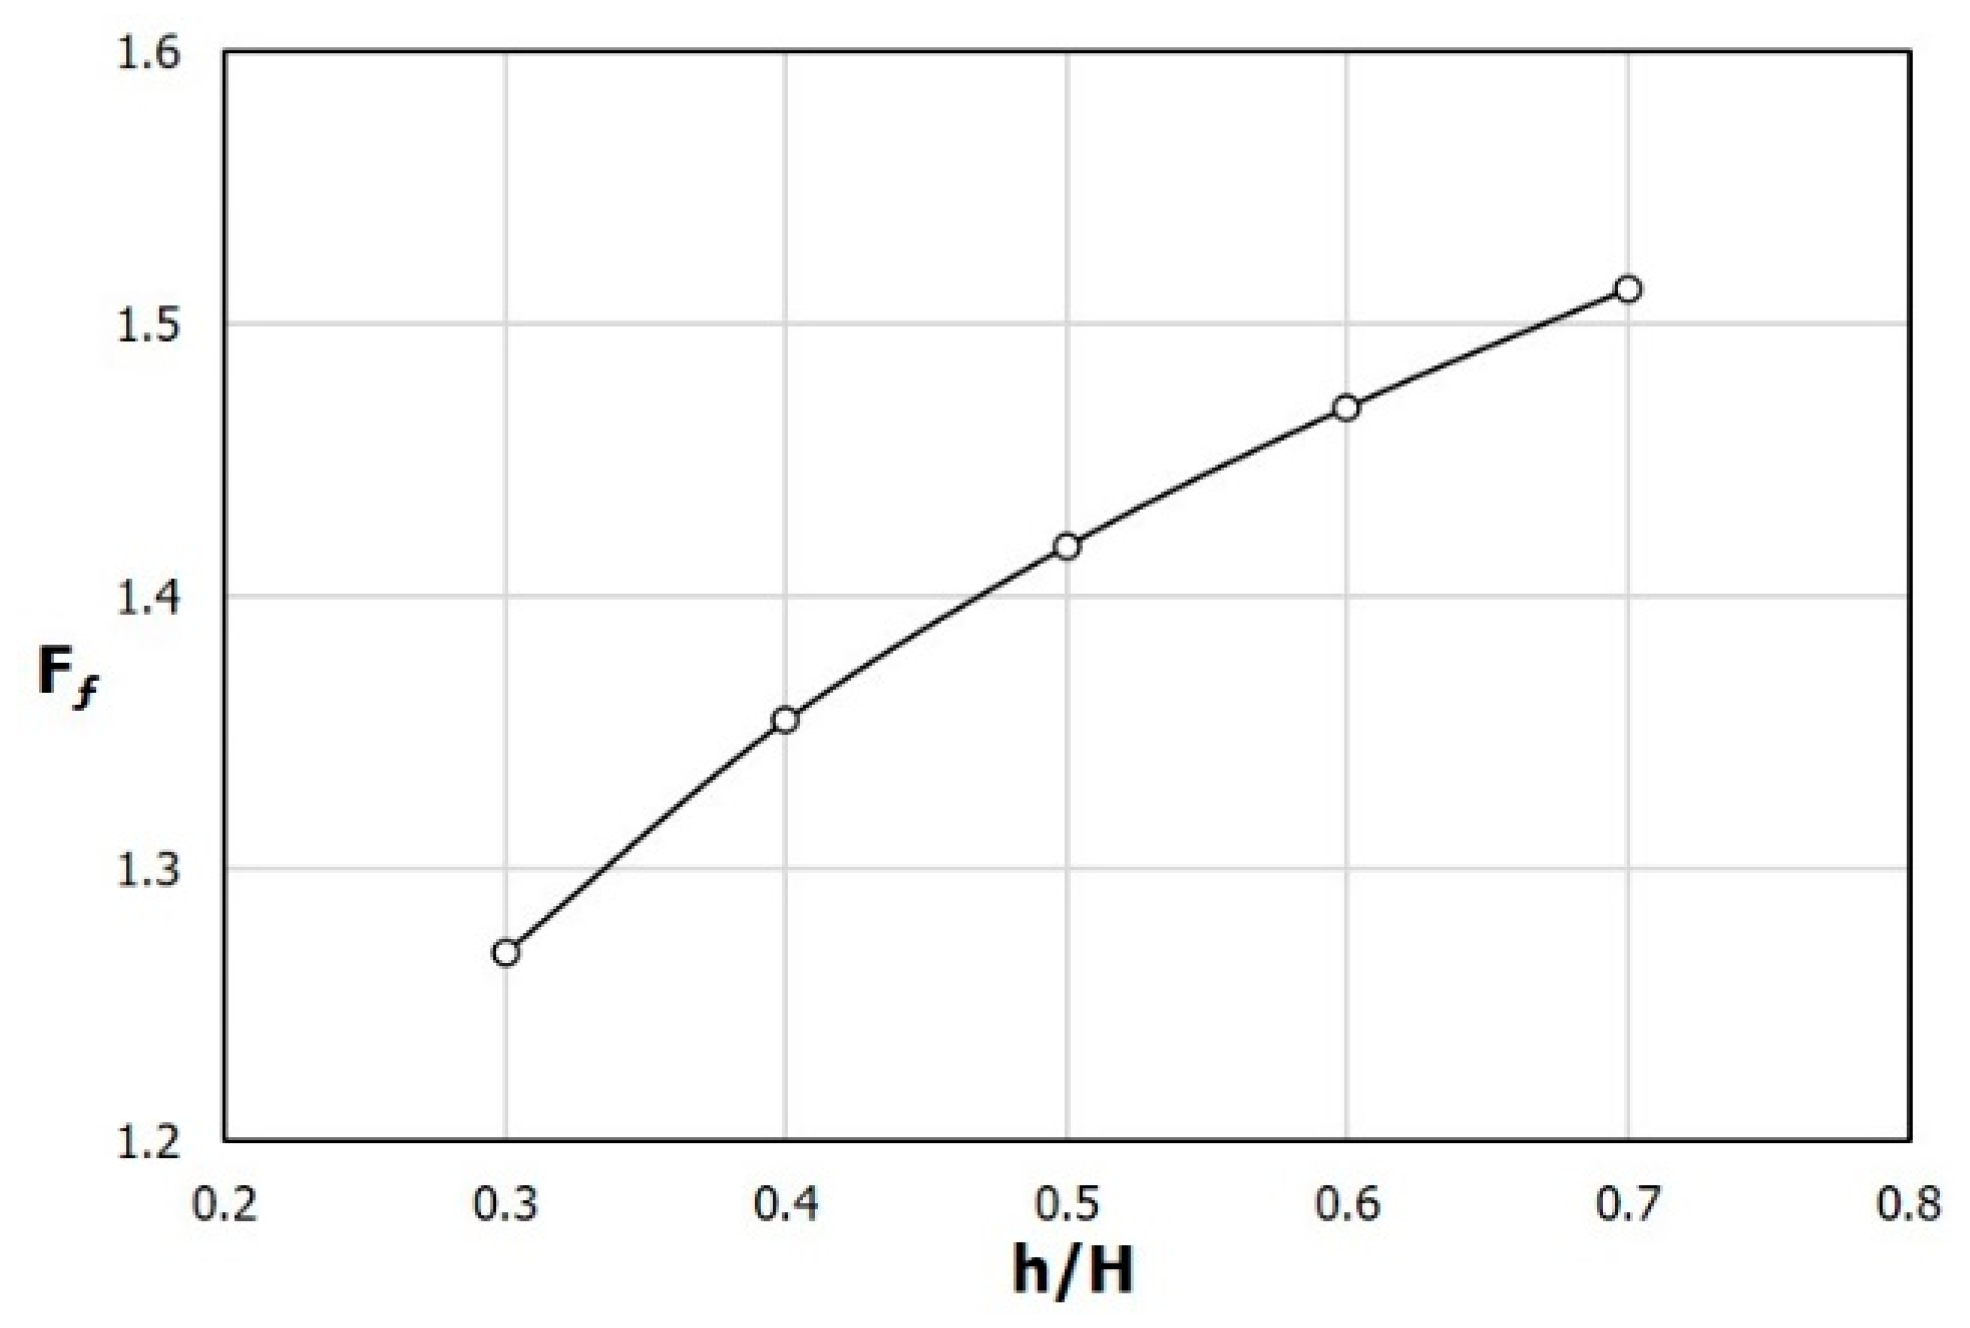
f, defined by Equations (1) and (2), respectively, in a range of 0.3 ≤ h/H ≤ 0.7. The computational values are presented at five points indicated by circular symbols, and the line is a curve fit of the values at these points. It can be seen that F
Nu has the maximum value between h/H = 0.5 and 0.6 and it gradually decreases after that (
Figure 5). On the other hand, F
f continues to increase as h/H increases, as shown in
Figure 6. Therefore, as the rib height increases with the fixed rib width, there exists the maximum value in the heat transfer rate, but the pressure drop increases continuously. Similar heat transfer performances are found at h/H = 0.5 and 0.6 (
Figure 5), but the pressure drop is lower at the lower rib height (h/H = 0.5), as shown in
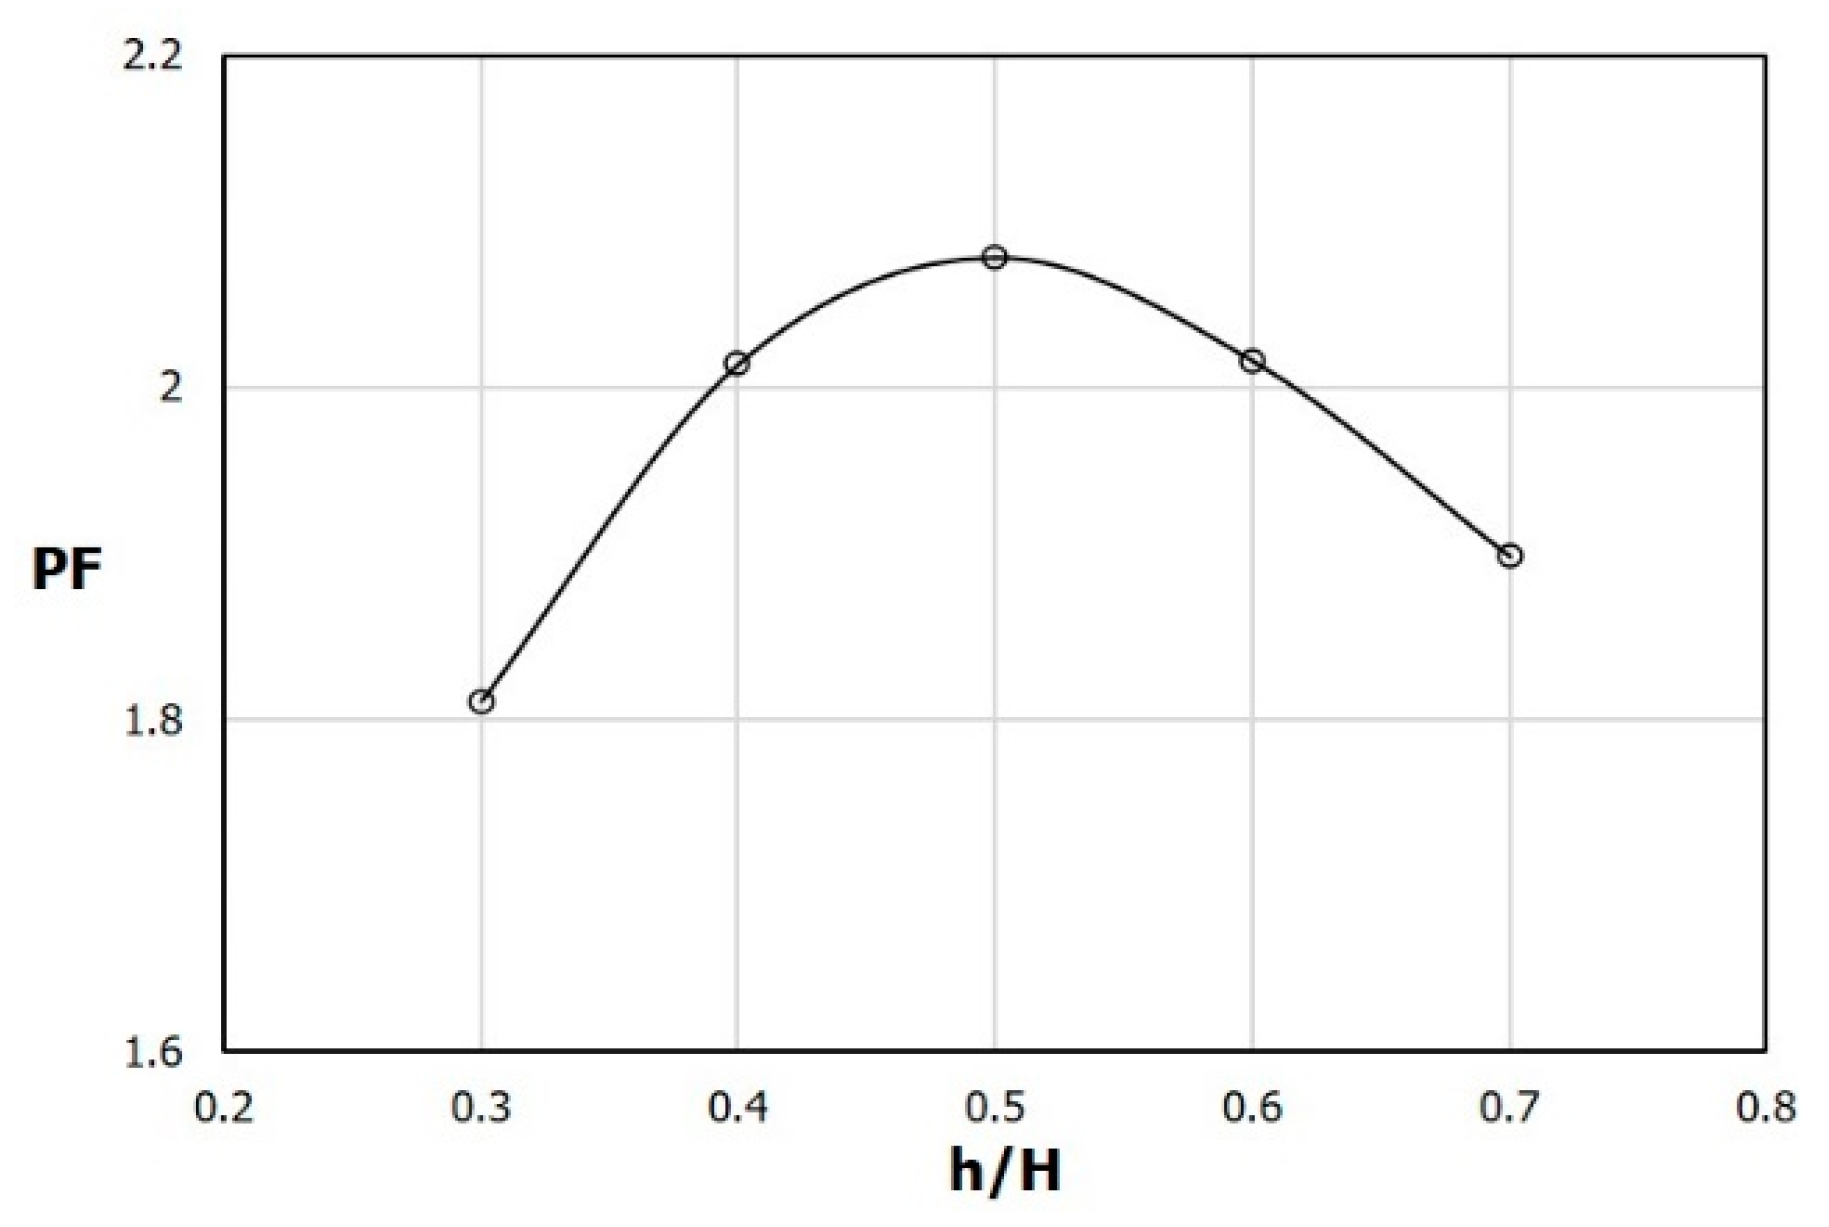
Figure 6. Therefore, in the PF distribution shown in
Figure 7, the maximum performance factor appears at h/H = 0.5.
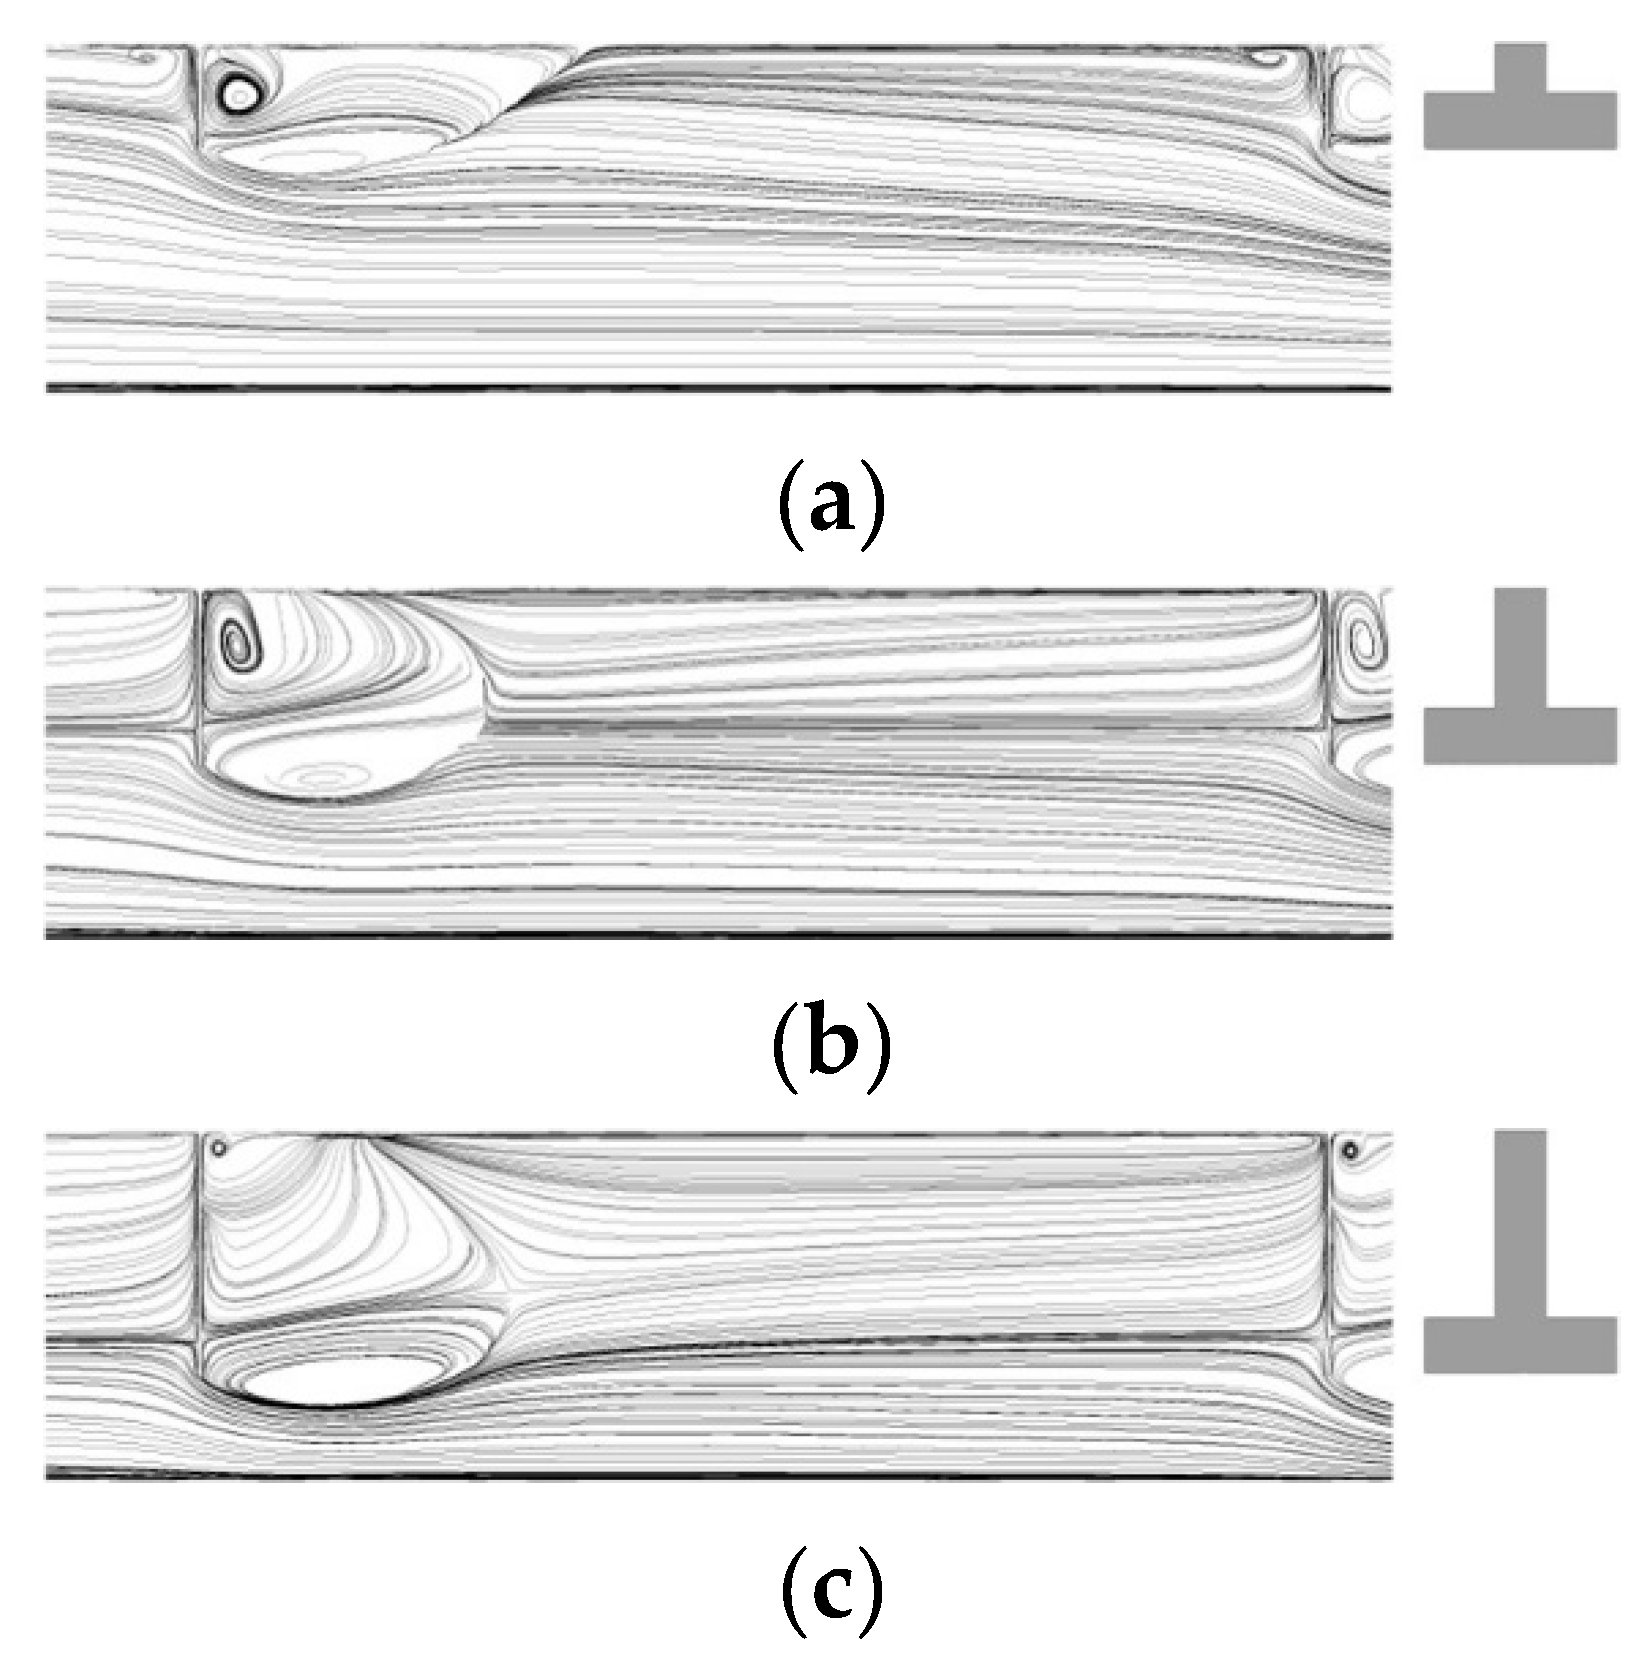
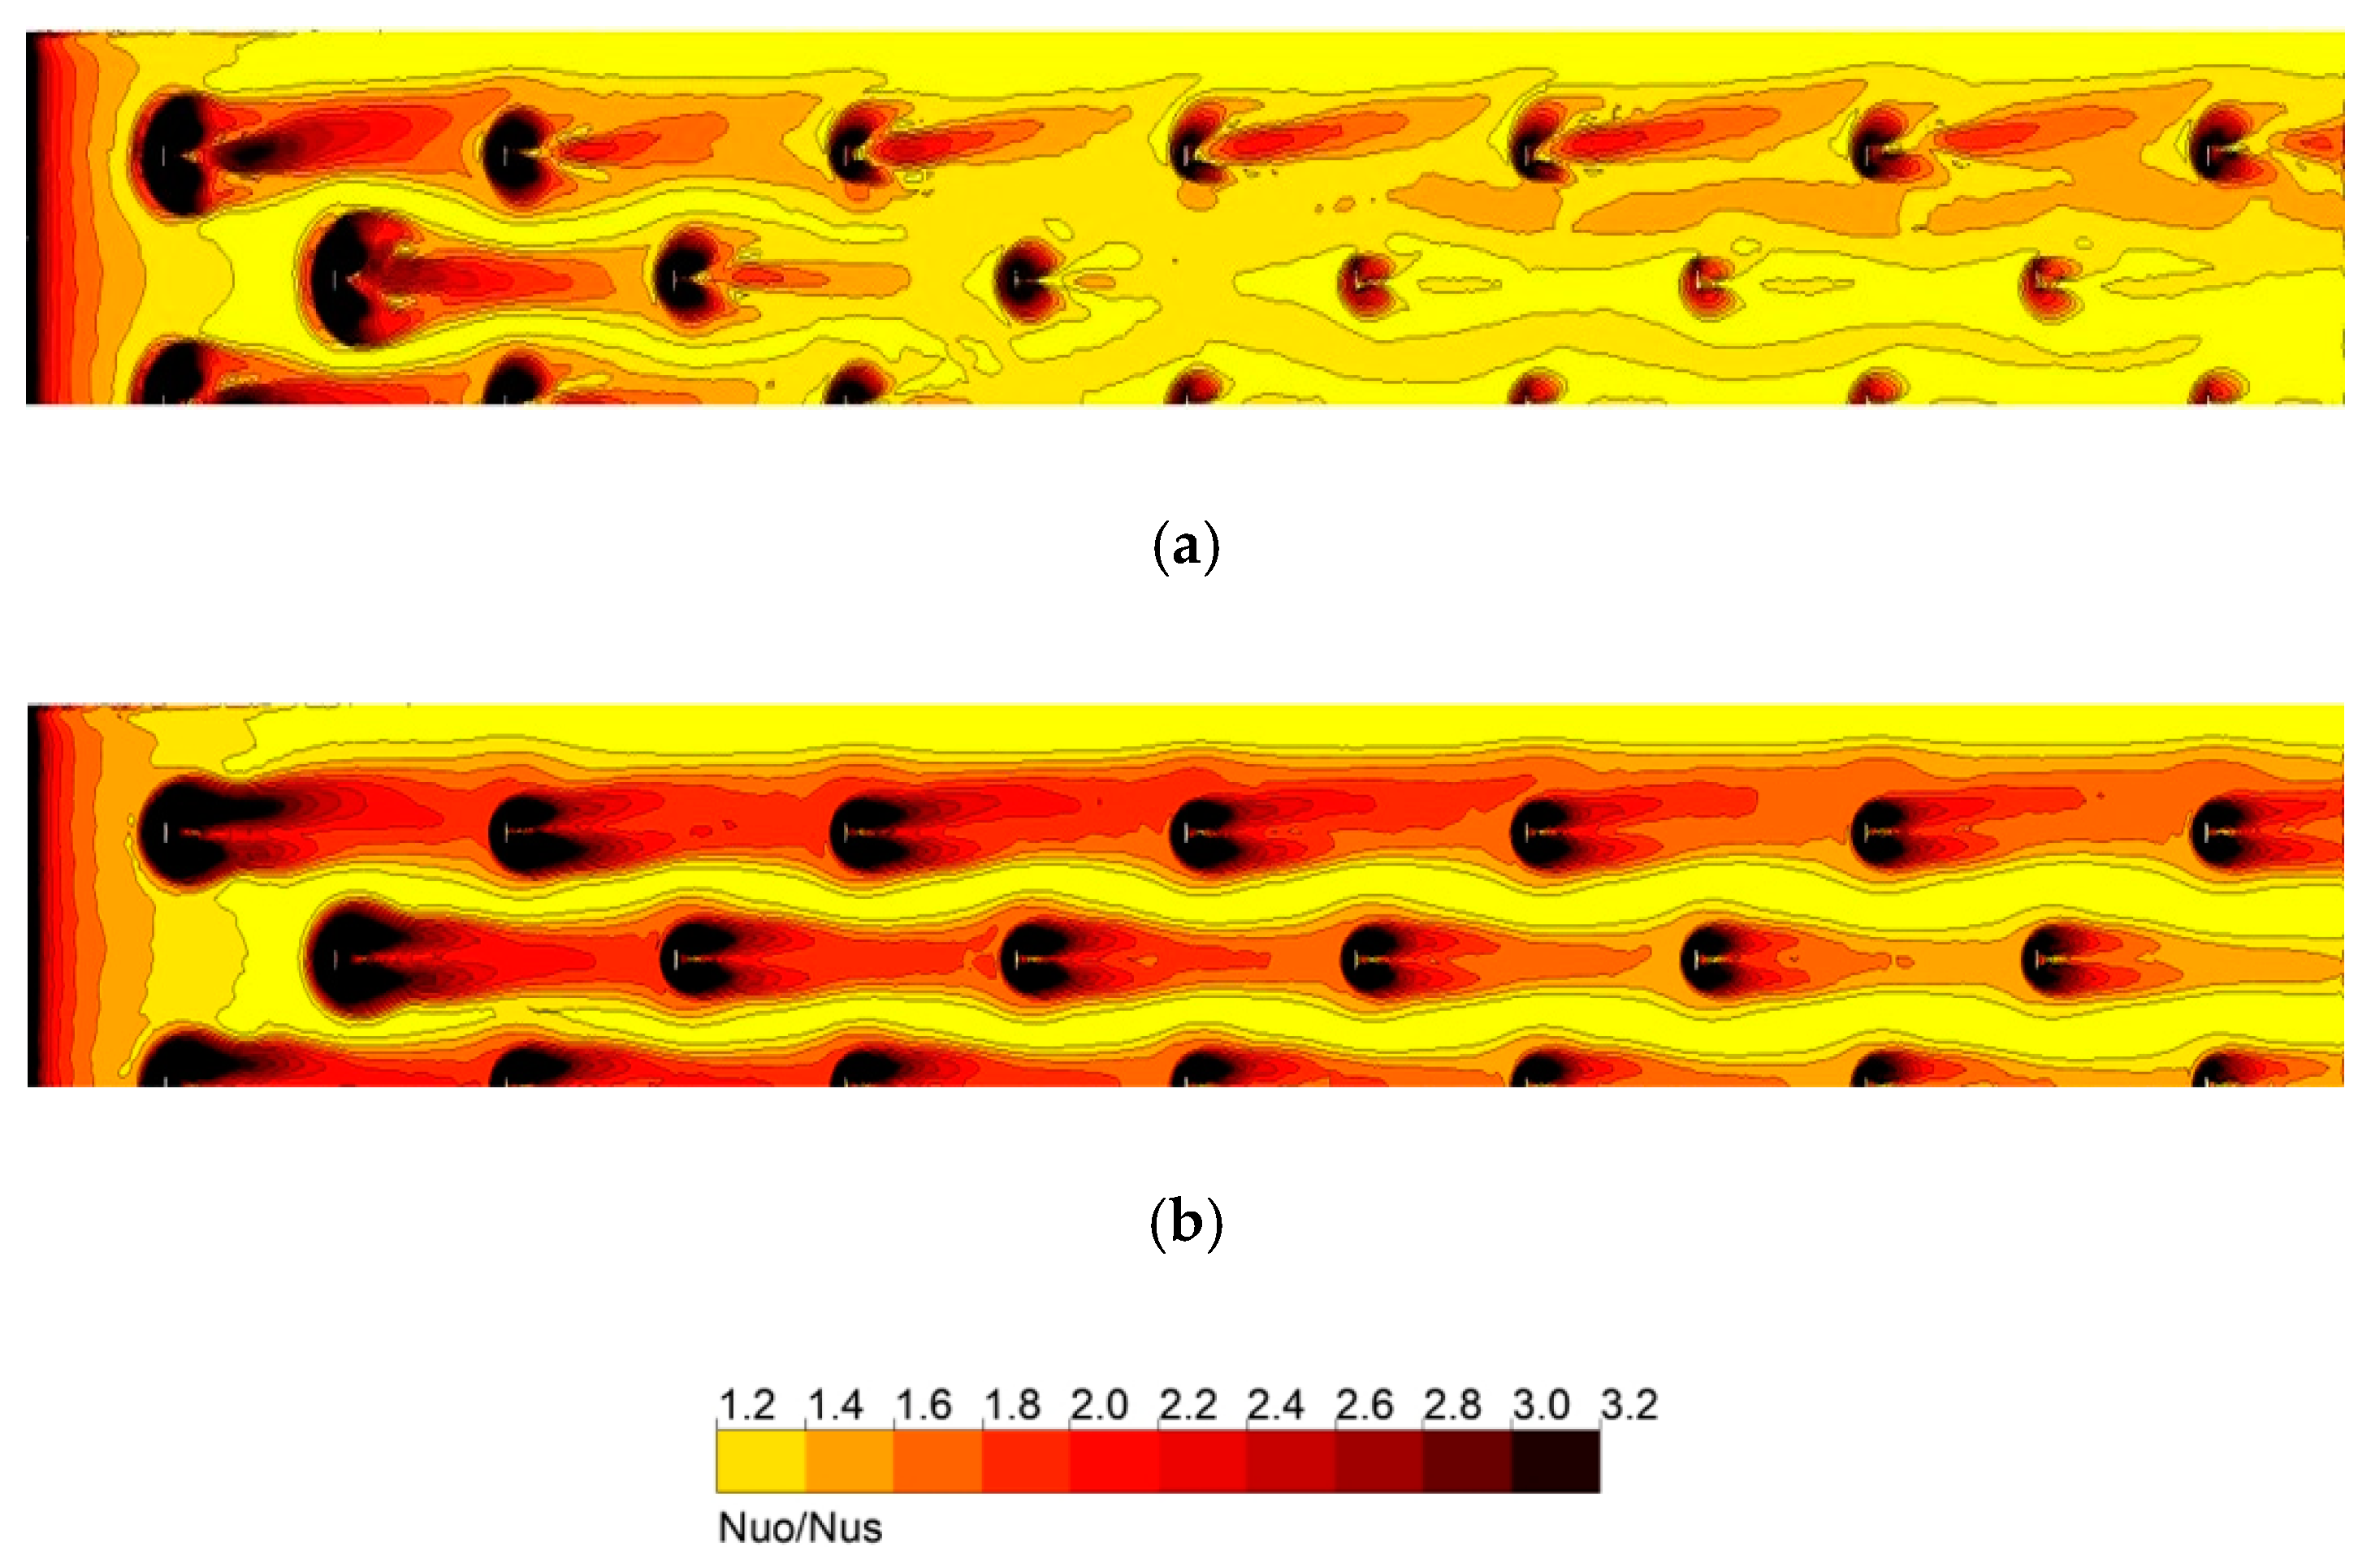
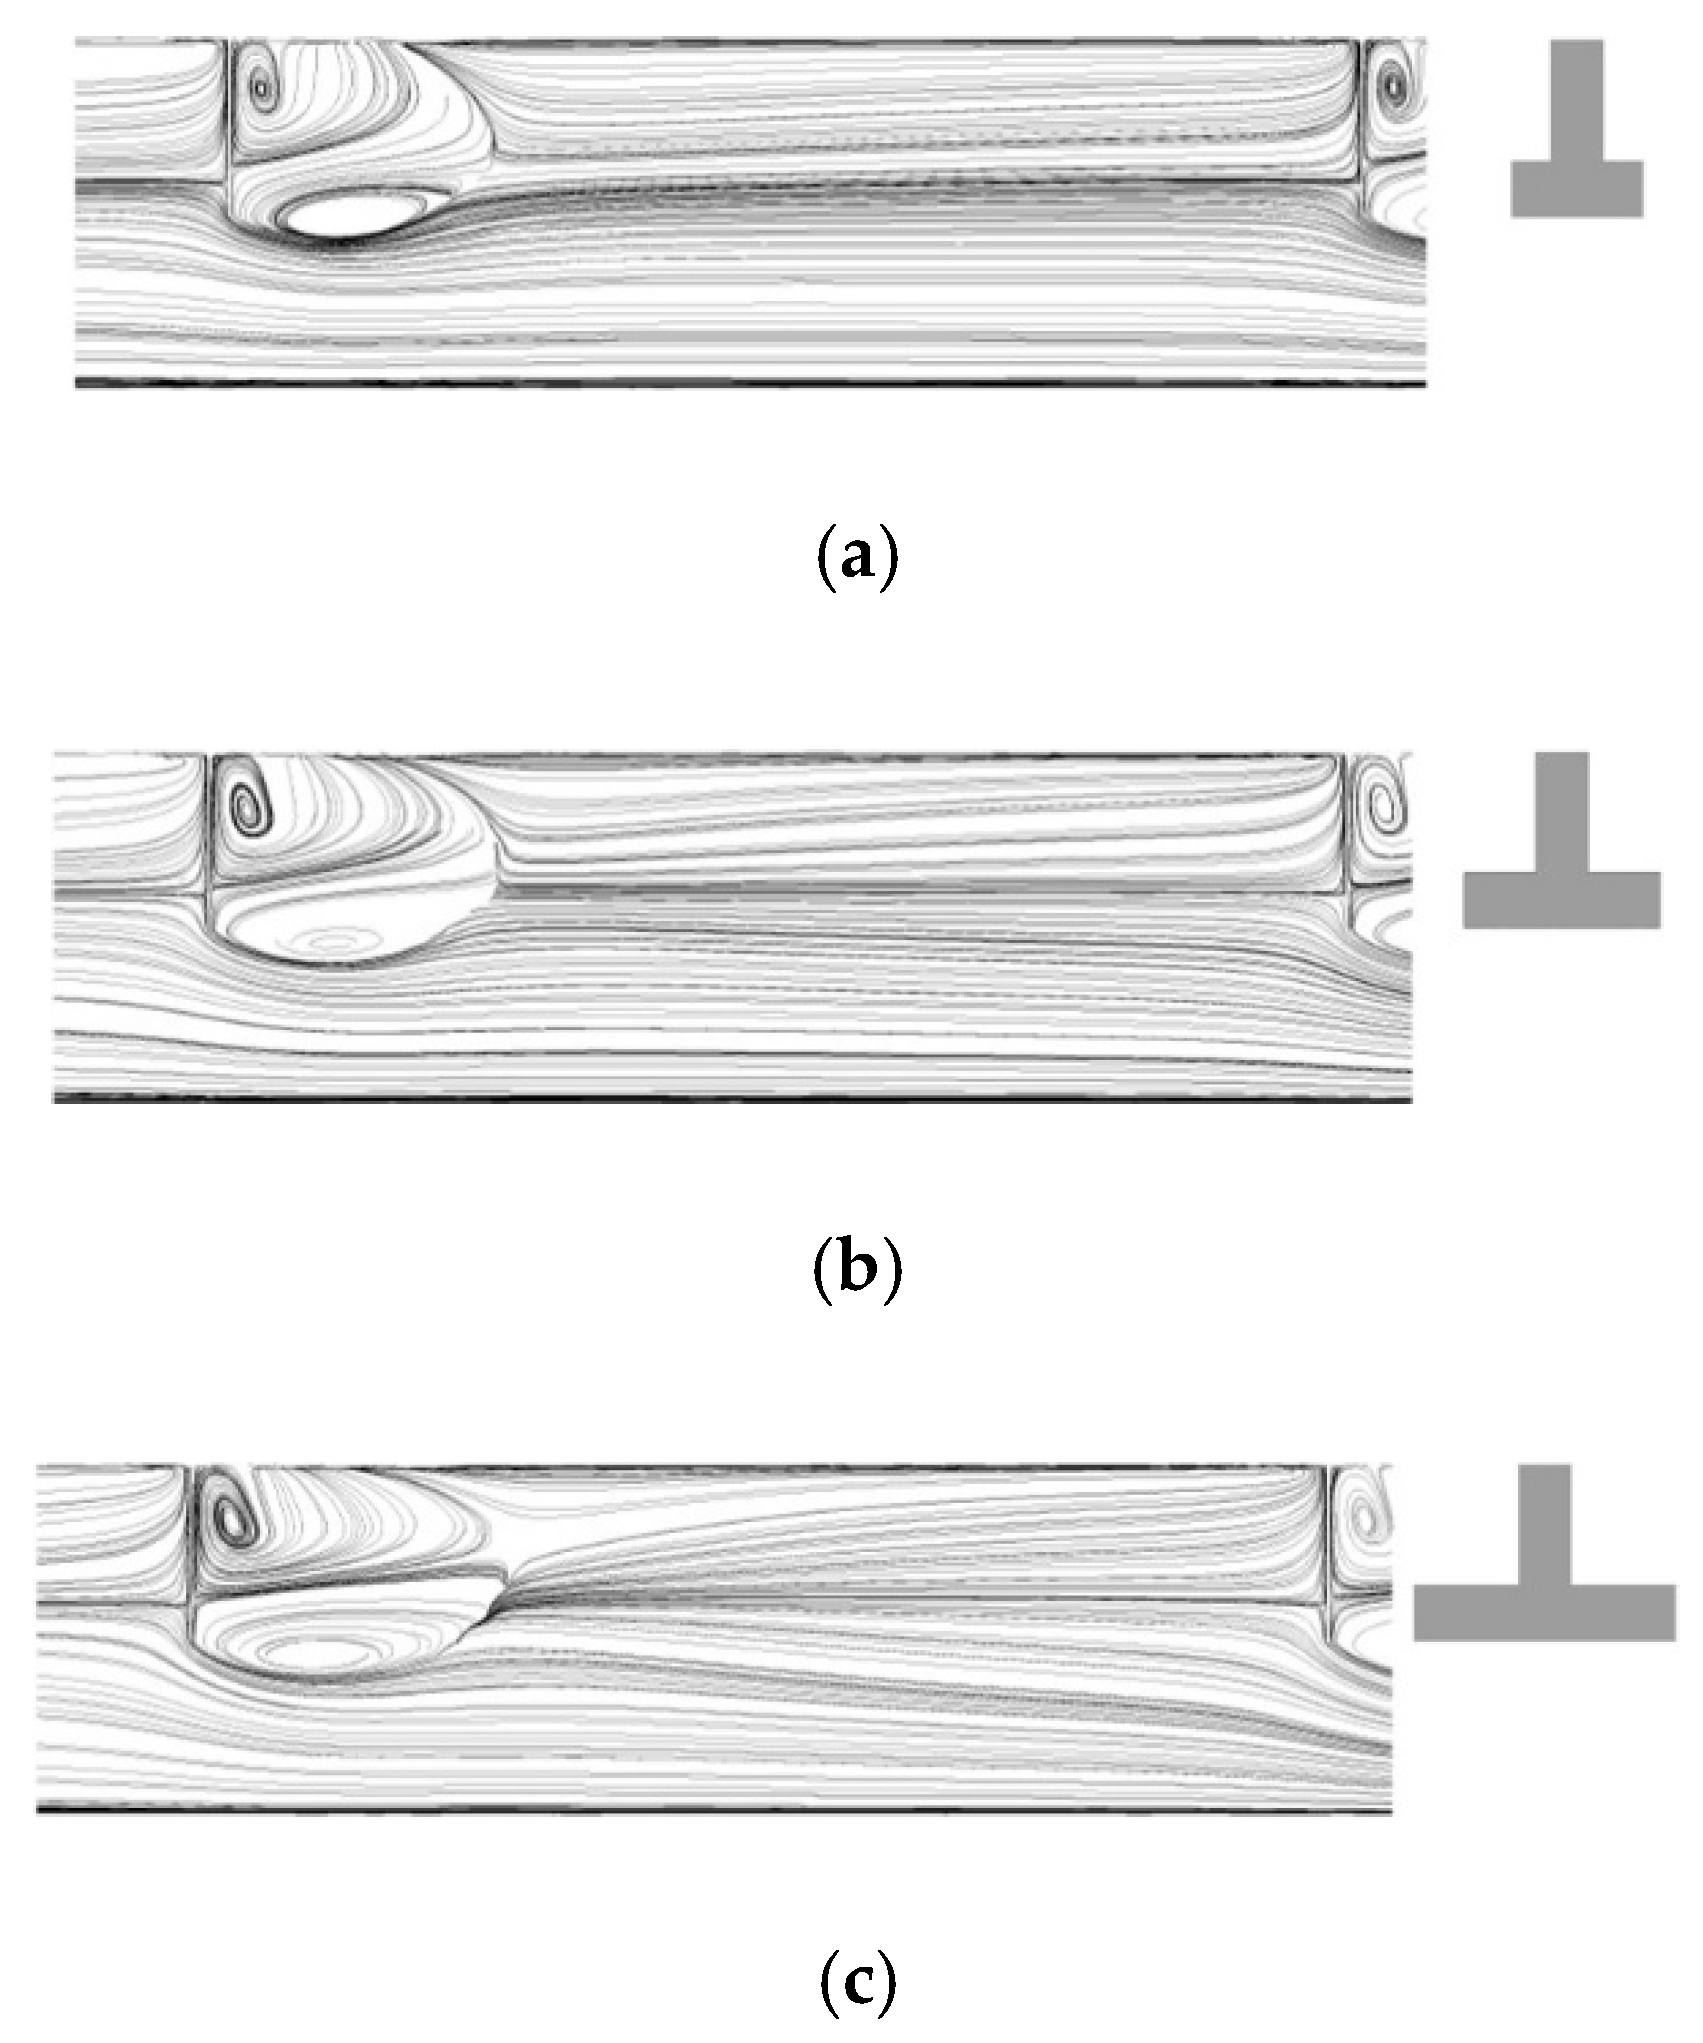
Figure 8 shows the streamlines between the 5th and 7th ribs (indicated by a dark region in
Figure 1b) at the symmetric plane (i.e., x-y plane at z = 0) for different h/H. Due to the geometric shape of the rib, two recirculation regions are formed in the direction of the rib height. As h/H increases, the size of the recirculation region near the upper wall increases. Additionally, as h/H increases from 0.3 to 0.5, the reattachment distance rapidly decreases. This rapid reduction in the reattachment distance in this h/H range greatly enhances the heat transfer, as shown in
Figure 5, due to early re-development of the thermal boundary layer. In
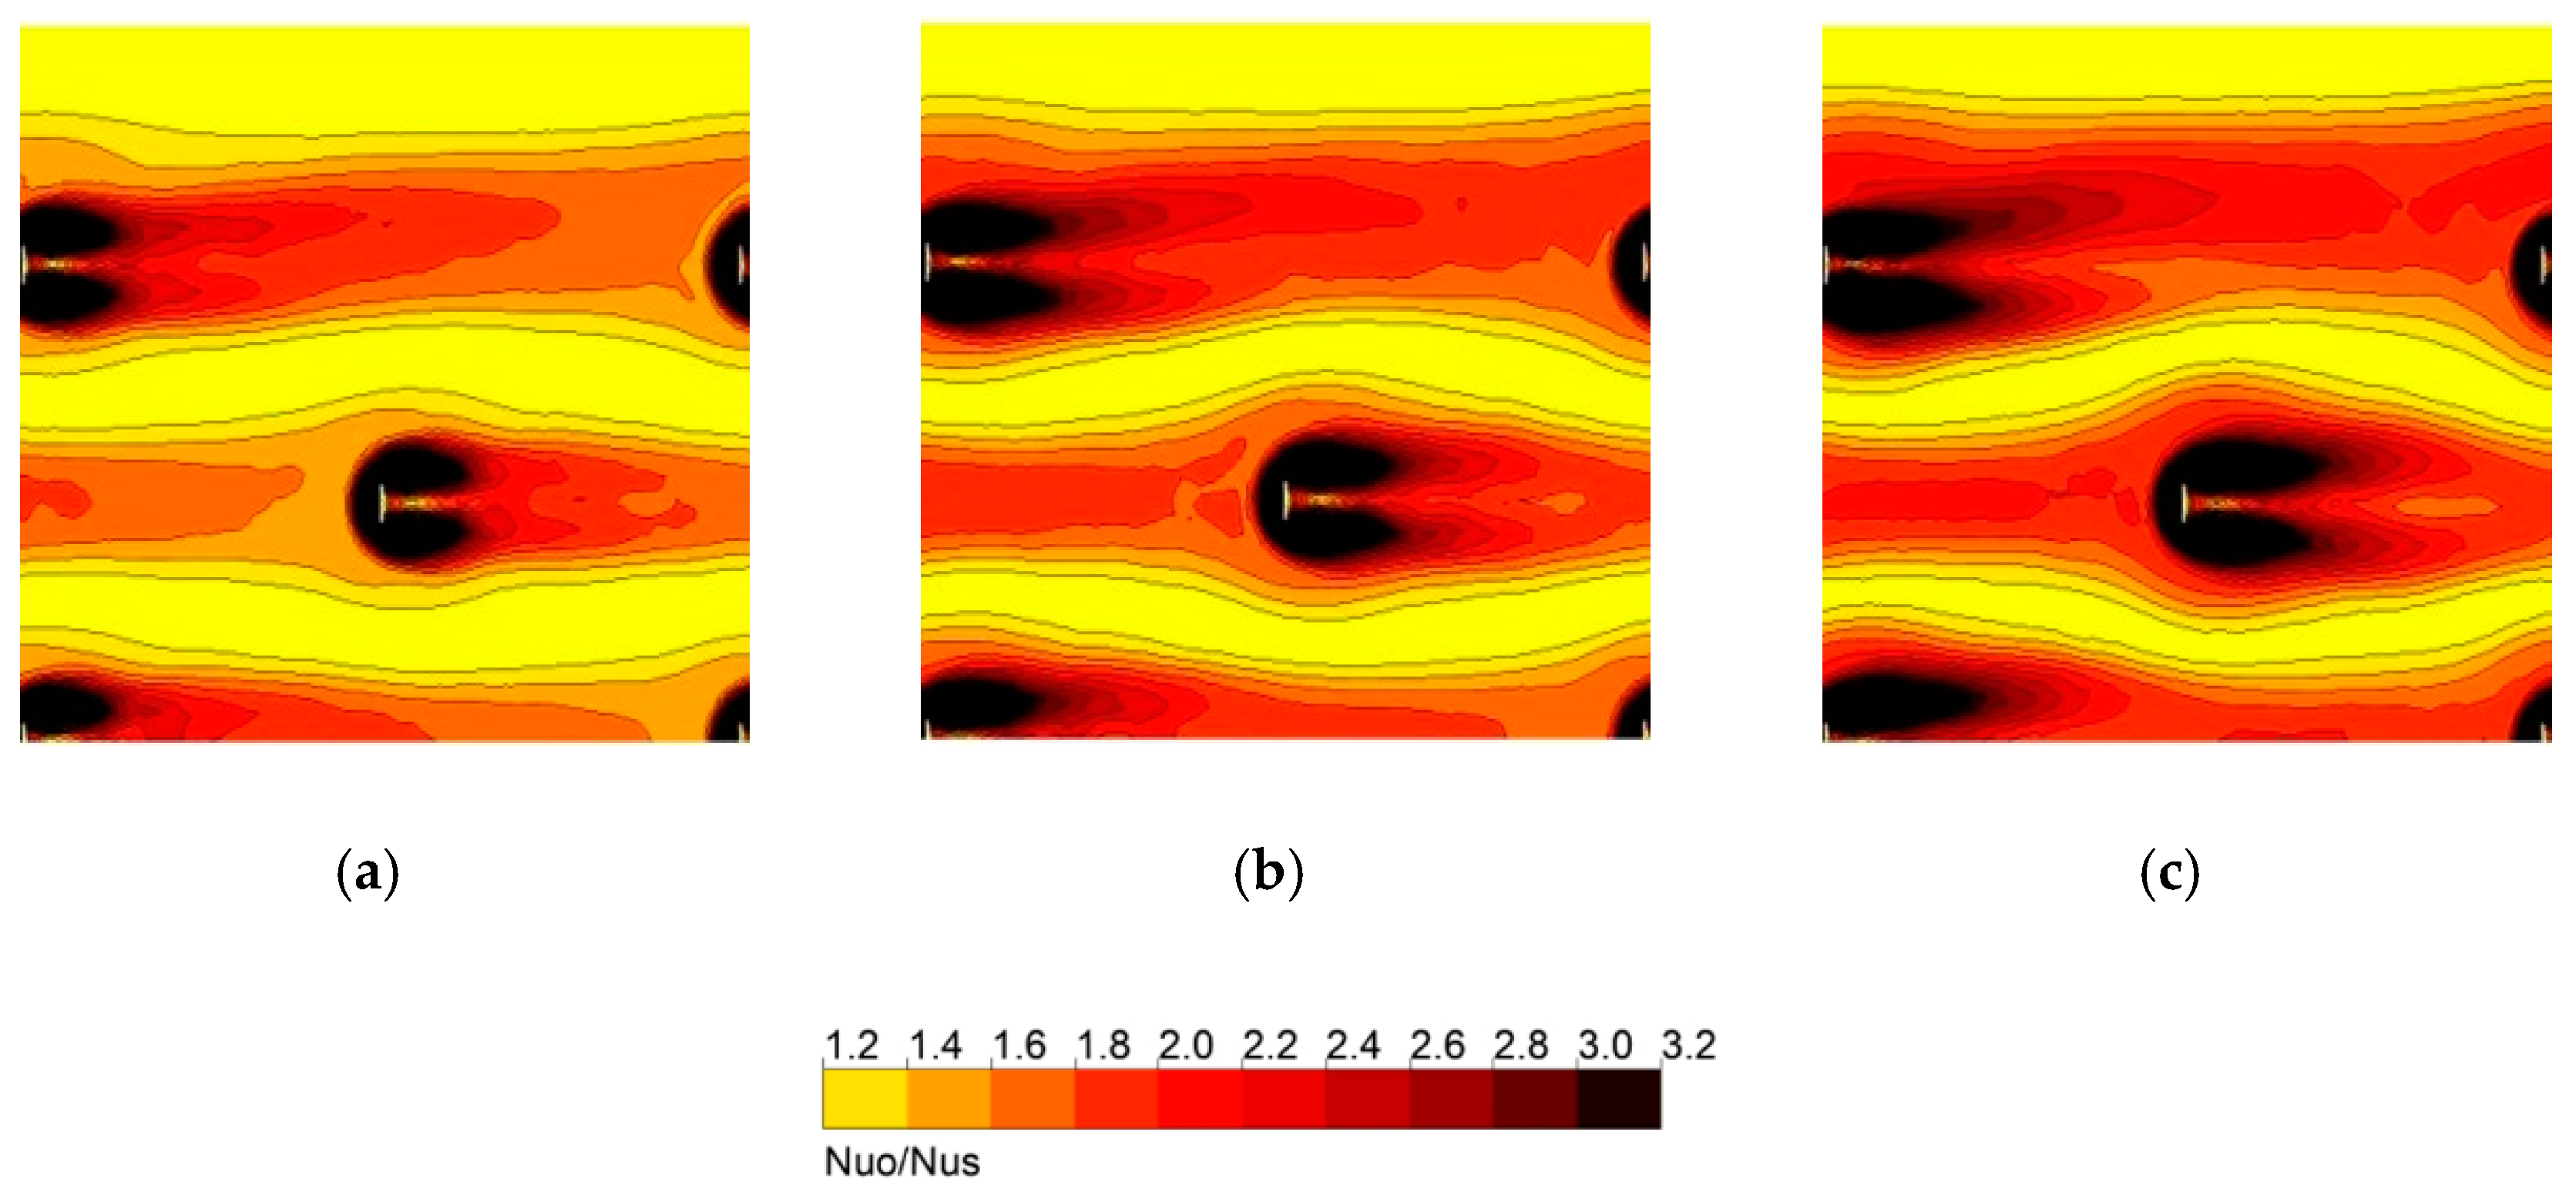
Figure 9, the local Nusselt number distributions on the heat transfer surface for h/H = 0.3 and 0.5 are different. In the case of h/H = 0.5, the Nusselt number level appears to be higher around and downstream of each rib compared to the case of h/H = 0.3.
Figure 10,
Figure 11,
Figure 12,
Figure 13 and
Figure 14 show the effects of the ratio of the rib width to the channel width (e/W) on the performance of the SAH.
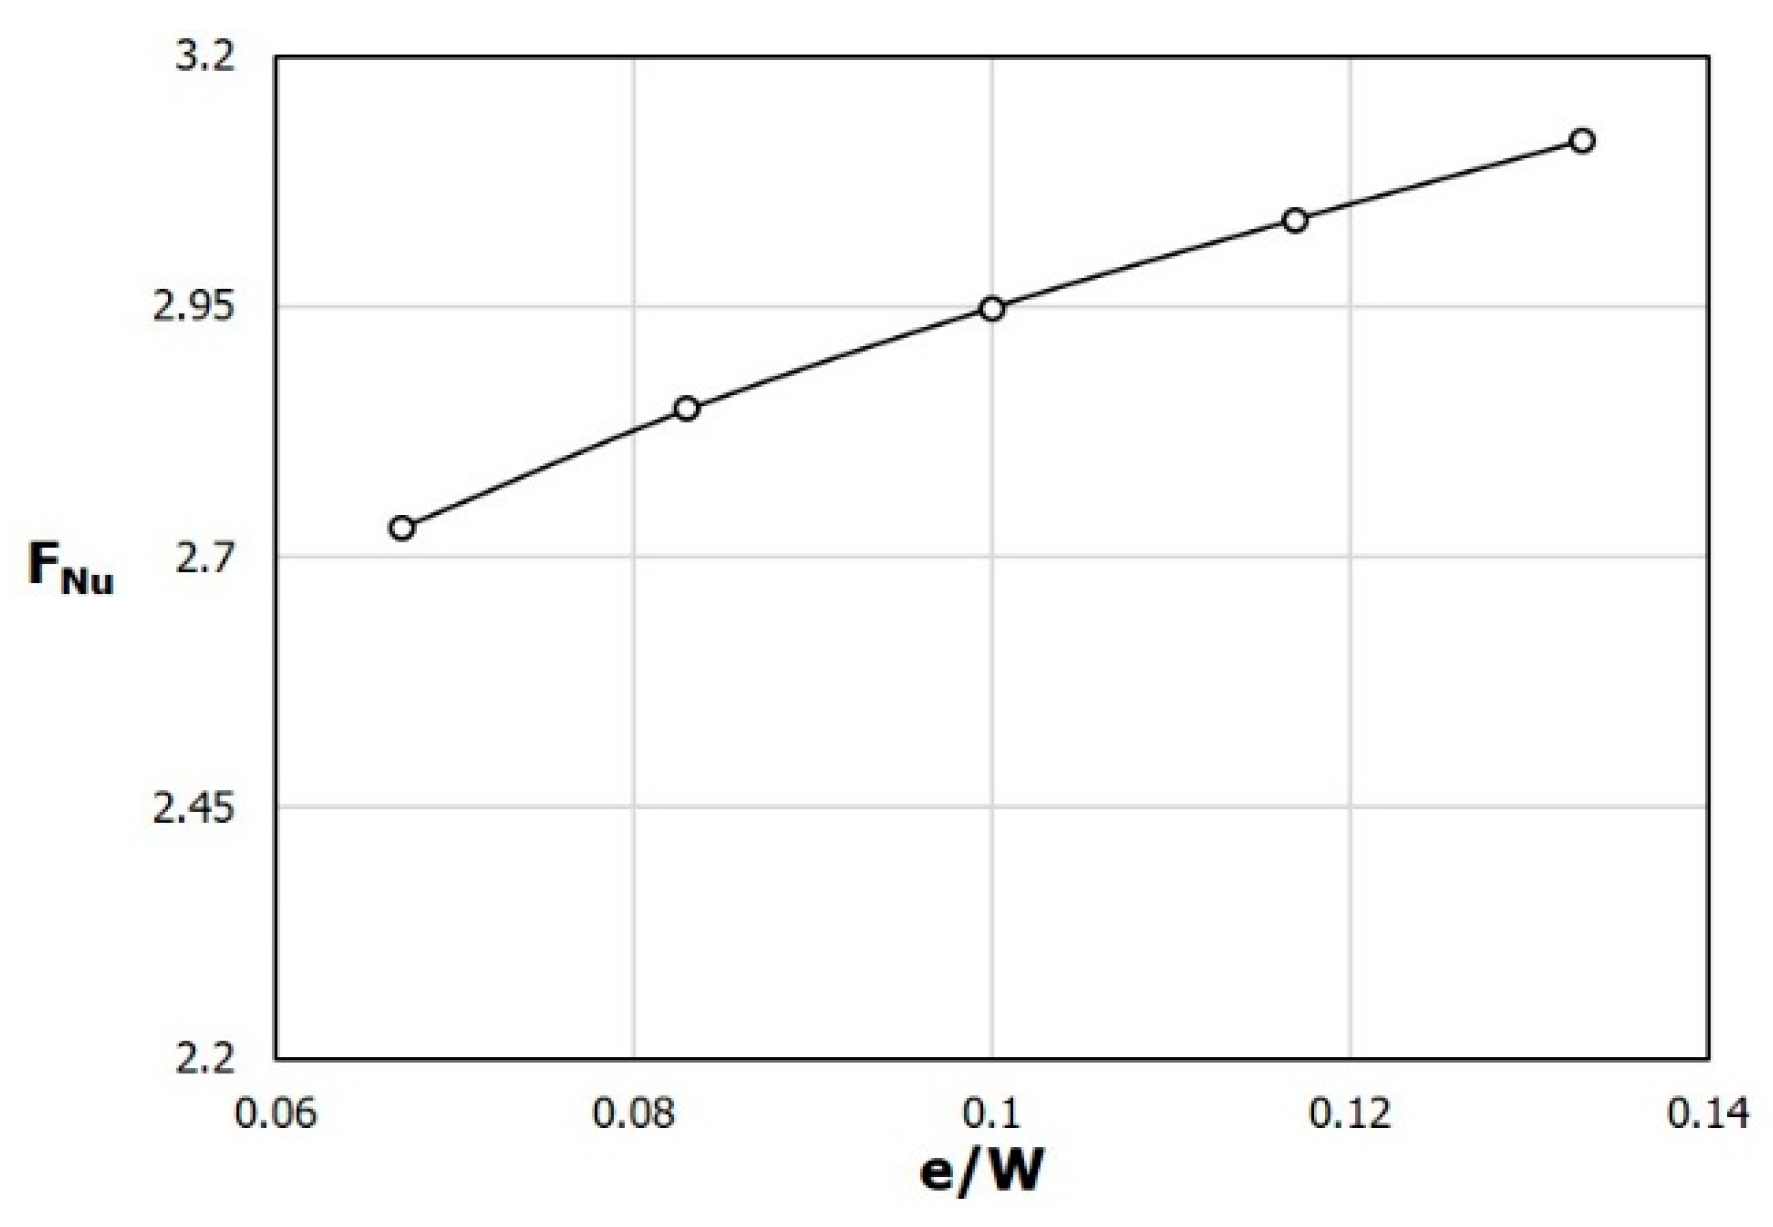
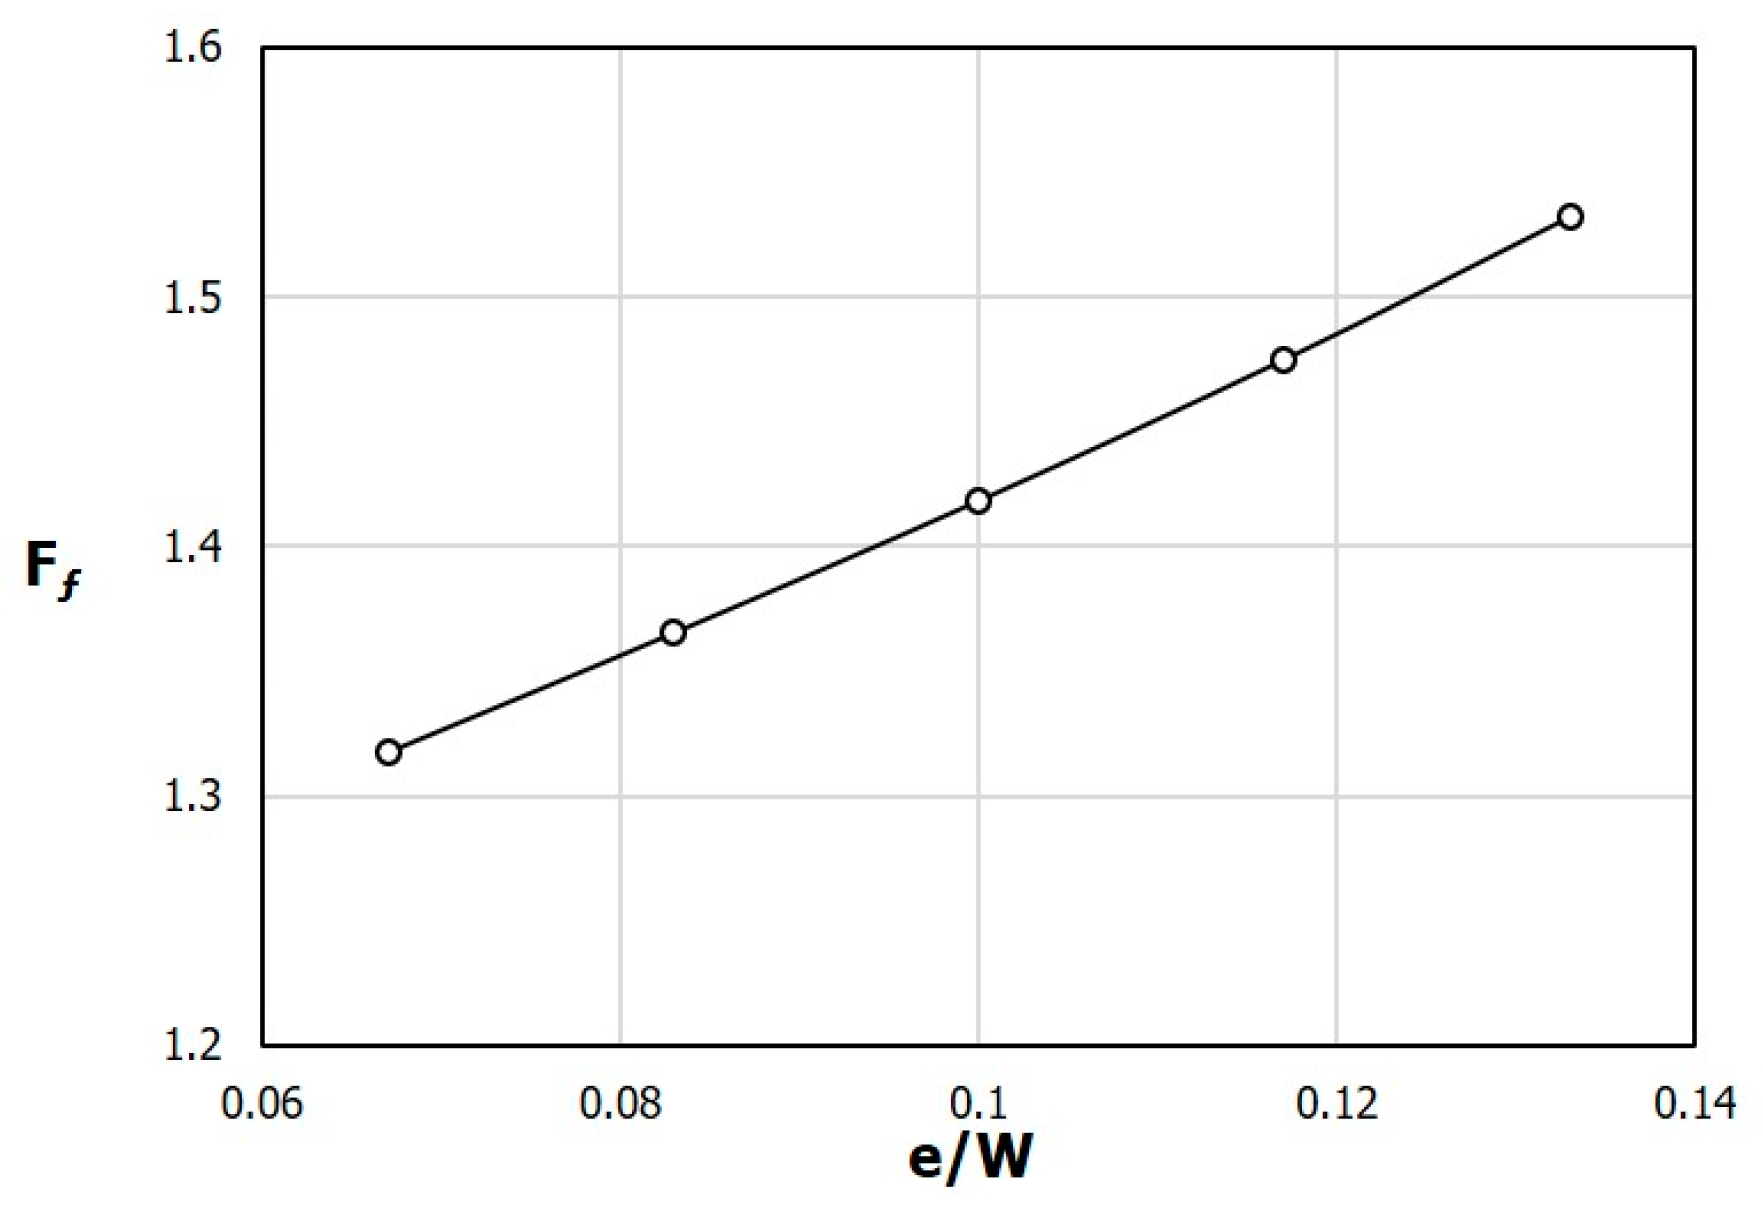
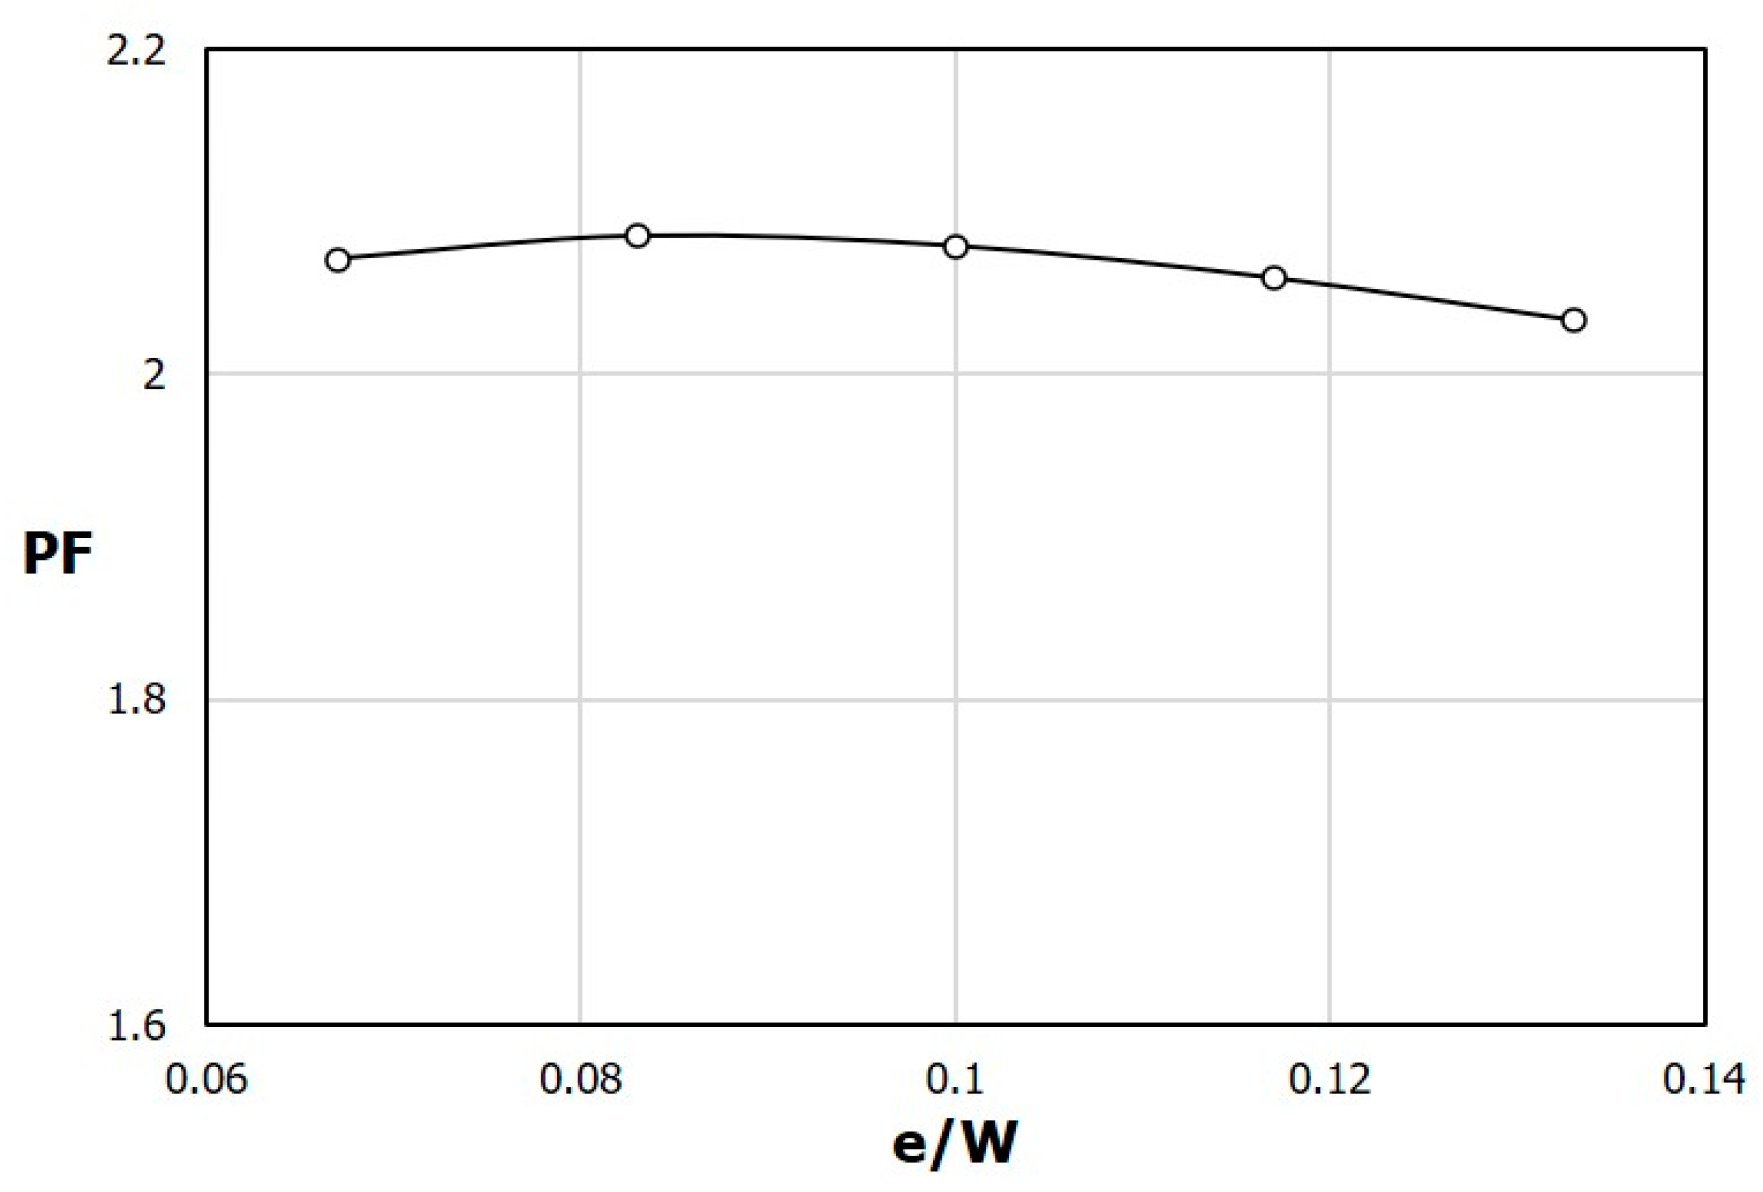
Figure 10 and
Figure 11 show the variations of the two performance parameters, F
Nu and F
f, respectively, with e/W, in a range of 0.067 ≤ e/W ≤ 0.133. As e/W increases, both F
Nu and F
f increase almost linearly. This is presumed to be a phenomenon that occurs because both the turbulence intensity and pressure loss increase due to the increase in the area of the obstacles as e increases while the height h is kept constant. In the PF distribution shown in
Figure 12, the maximum value is found around e/W = 0.08, but the overall variation with e/W is very small compared to that in
Figure 7 for h/H.
Figure 13 shows the streamlines between the 5th and 7th ribs at the symmetric plane for different h/H. It can be seen that as e/W increases, the recirculation region located near the top of the rib increases. Since the reattachment distance does not change with e/W, the heat transfer enhancement according to the change in e/W does not seem to be related to the reattachment distance.
Figure 14 shows the distributions of the Nusselt number on the heat transfer surface between the 5th and 7th ribs. As e/W increases, the increased width of the rib increases the width of the high Nusselt number area in the lateral direction, thereby increasing the overall Nusselt number.
The variation of F
Nu with the ratio of the rib height to the rib width (h/e) keeping the rib area constant is shown in
Figure 15. At h/e = 0.83, the heat transfer is maximized. This variation of F
Nu is similar to the variation with h/H shown in
Figure 5. However, unlike
Figure 5, the variation curve of F
Nu shown in
Figure 15 is more symmetrical as the area of the rib is kept constant in this case. The variation of F
f with h/e shown in
Figure 16 is very small compared to the variations with h/H and e/W shown in
Figure 6 and
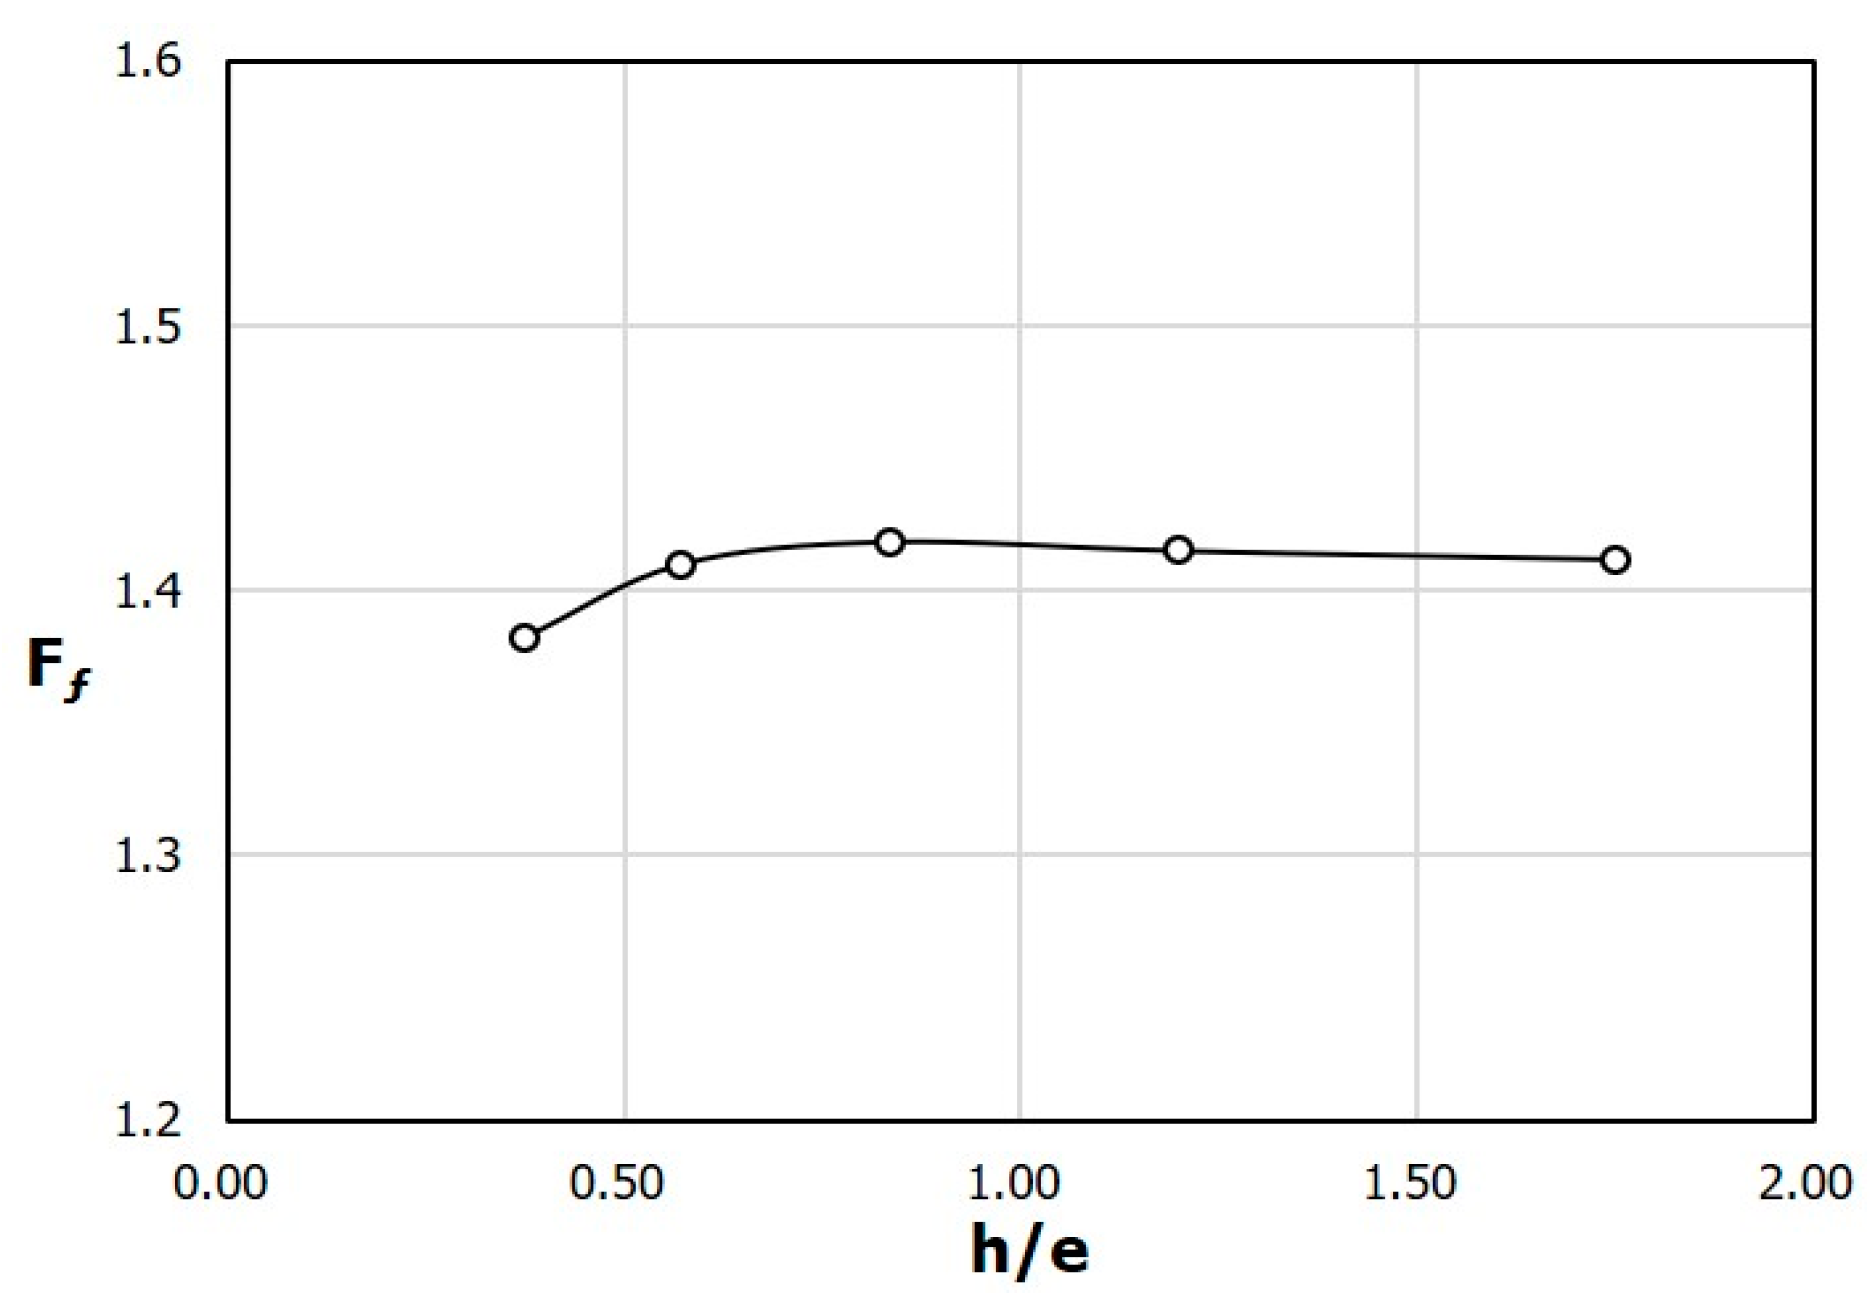
Figure 11, respectively. In the cases with h/H and e/W, the area of the rib changes, but in this case with h/e, the area of the rib remains constant. Accordingly, it can be seen that the pressure drop is greatly influenced by the area of the rib rather than the aspect ratio of the rib.
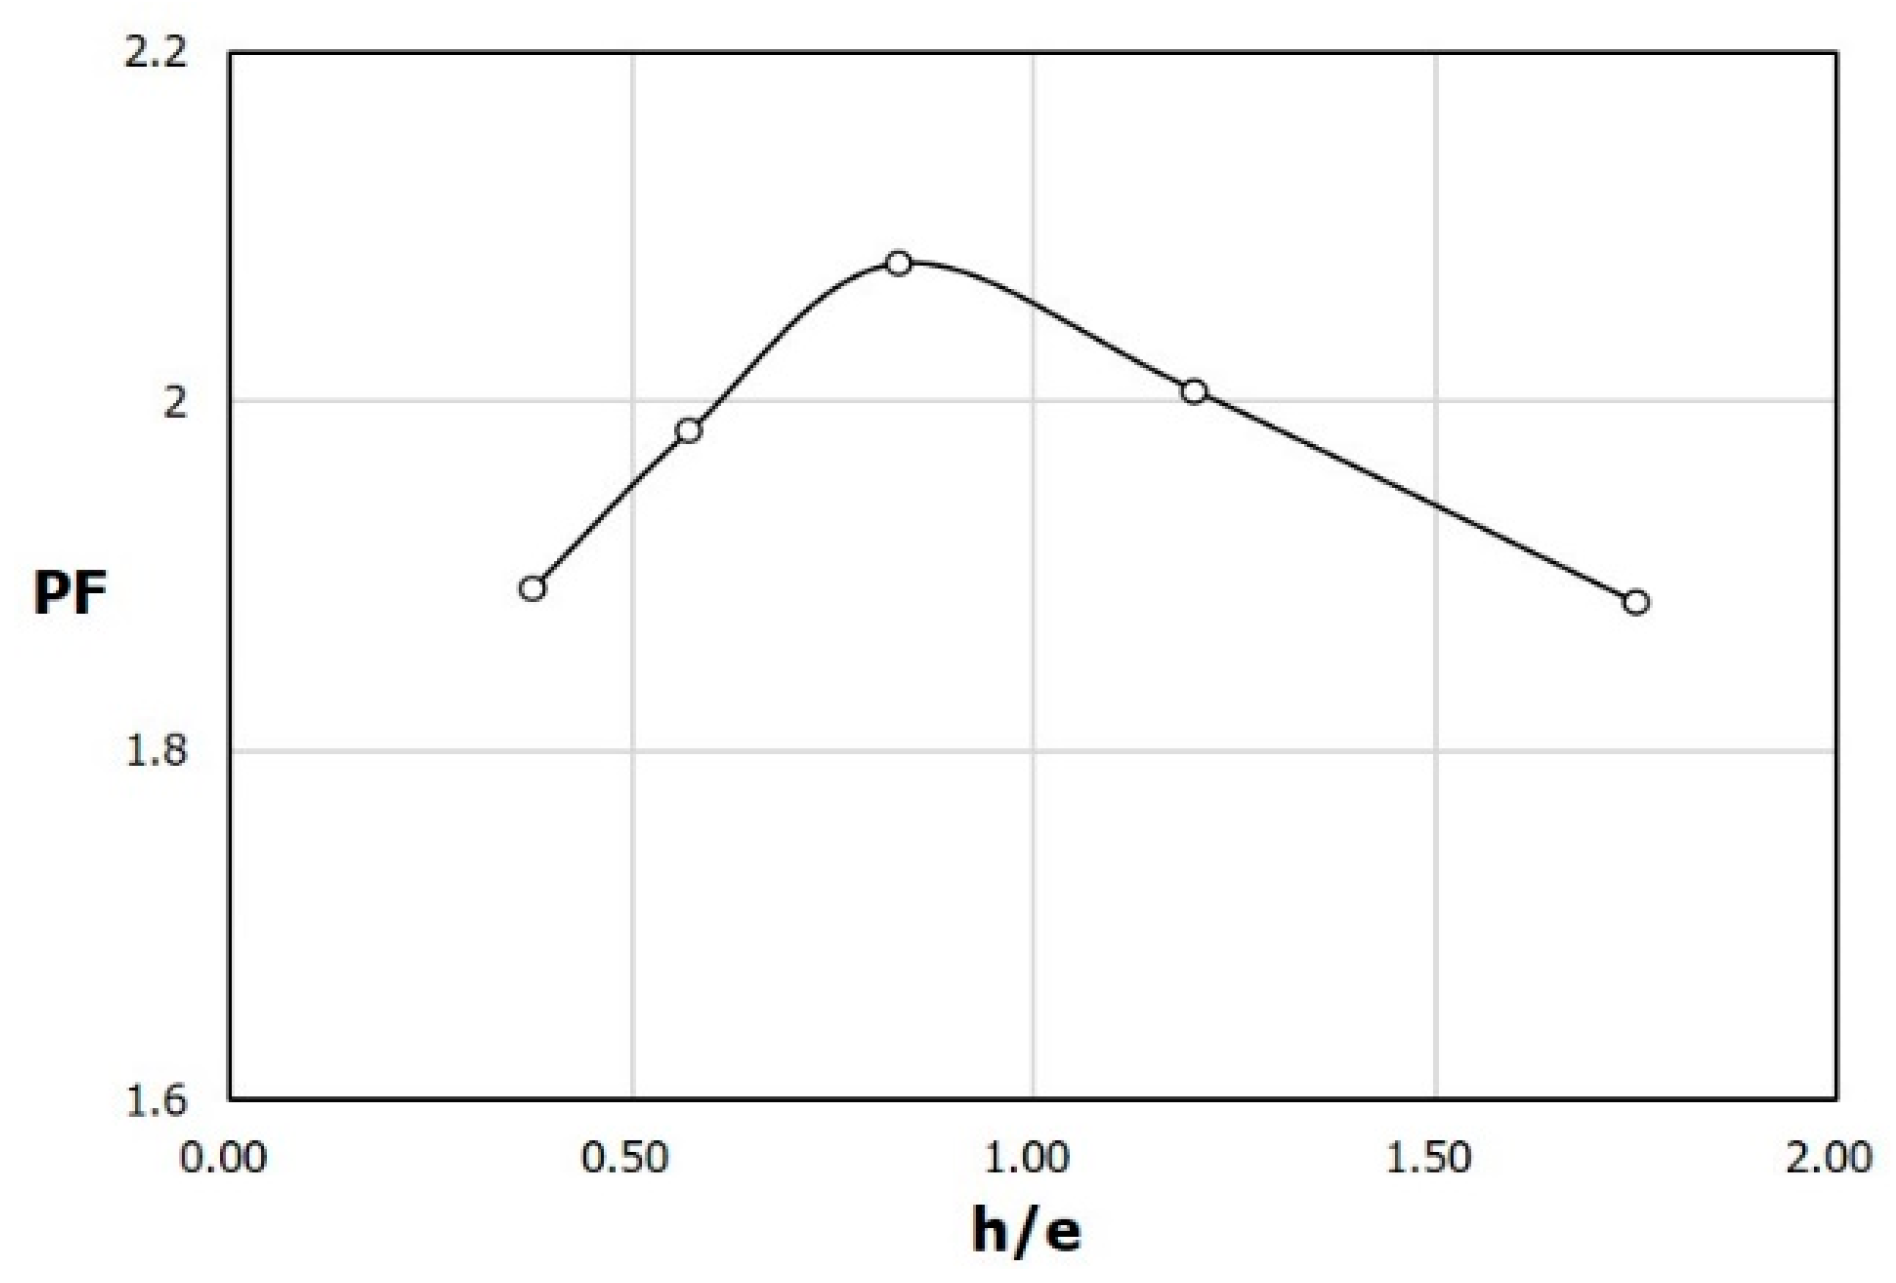
Since the change in the pressure drop appears small over the entire range of h/e, the variation of the performance factor PF with h/e, shown in
Figure 17, shows a qualitatively similar variation to that of F
Nu (
Figure 15). The maximum value of PF also appears at h/e = 0.83.
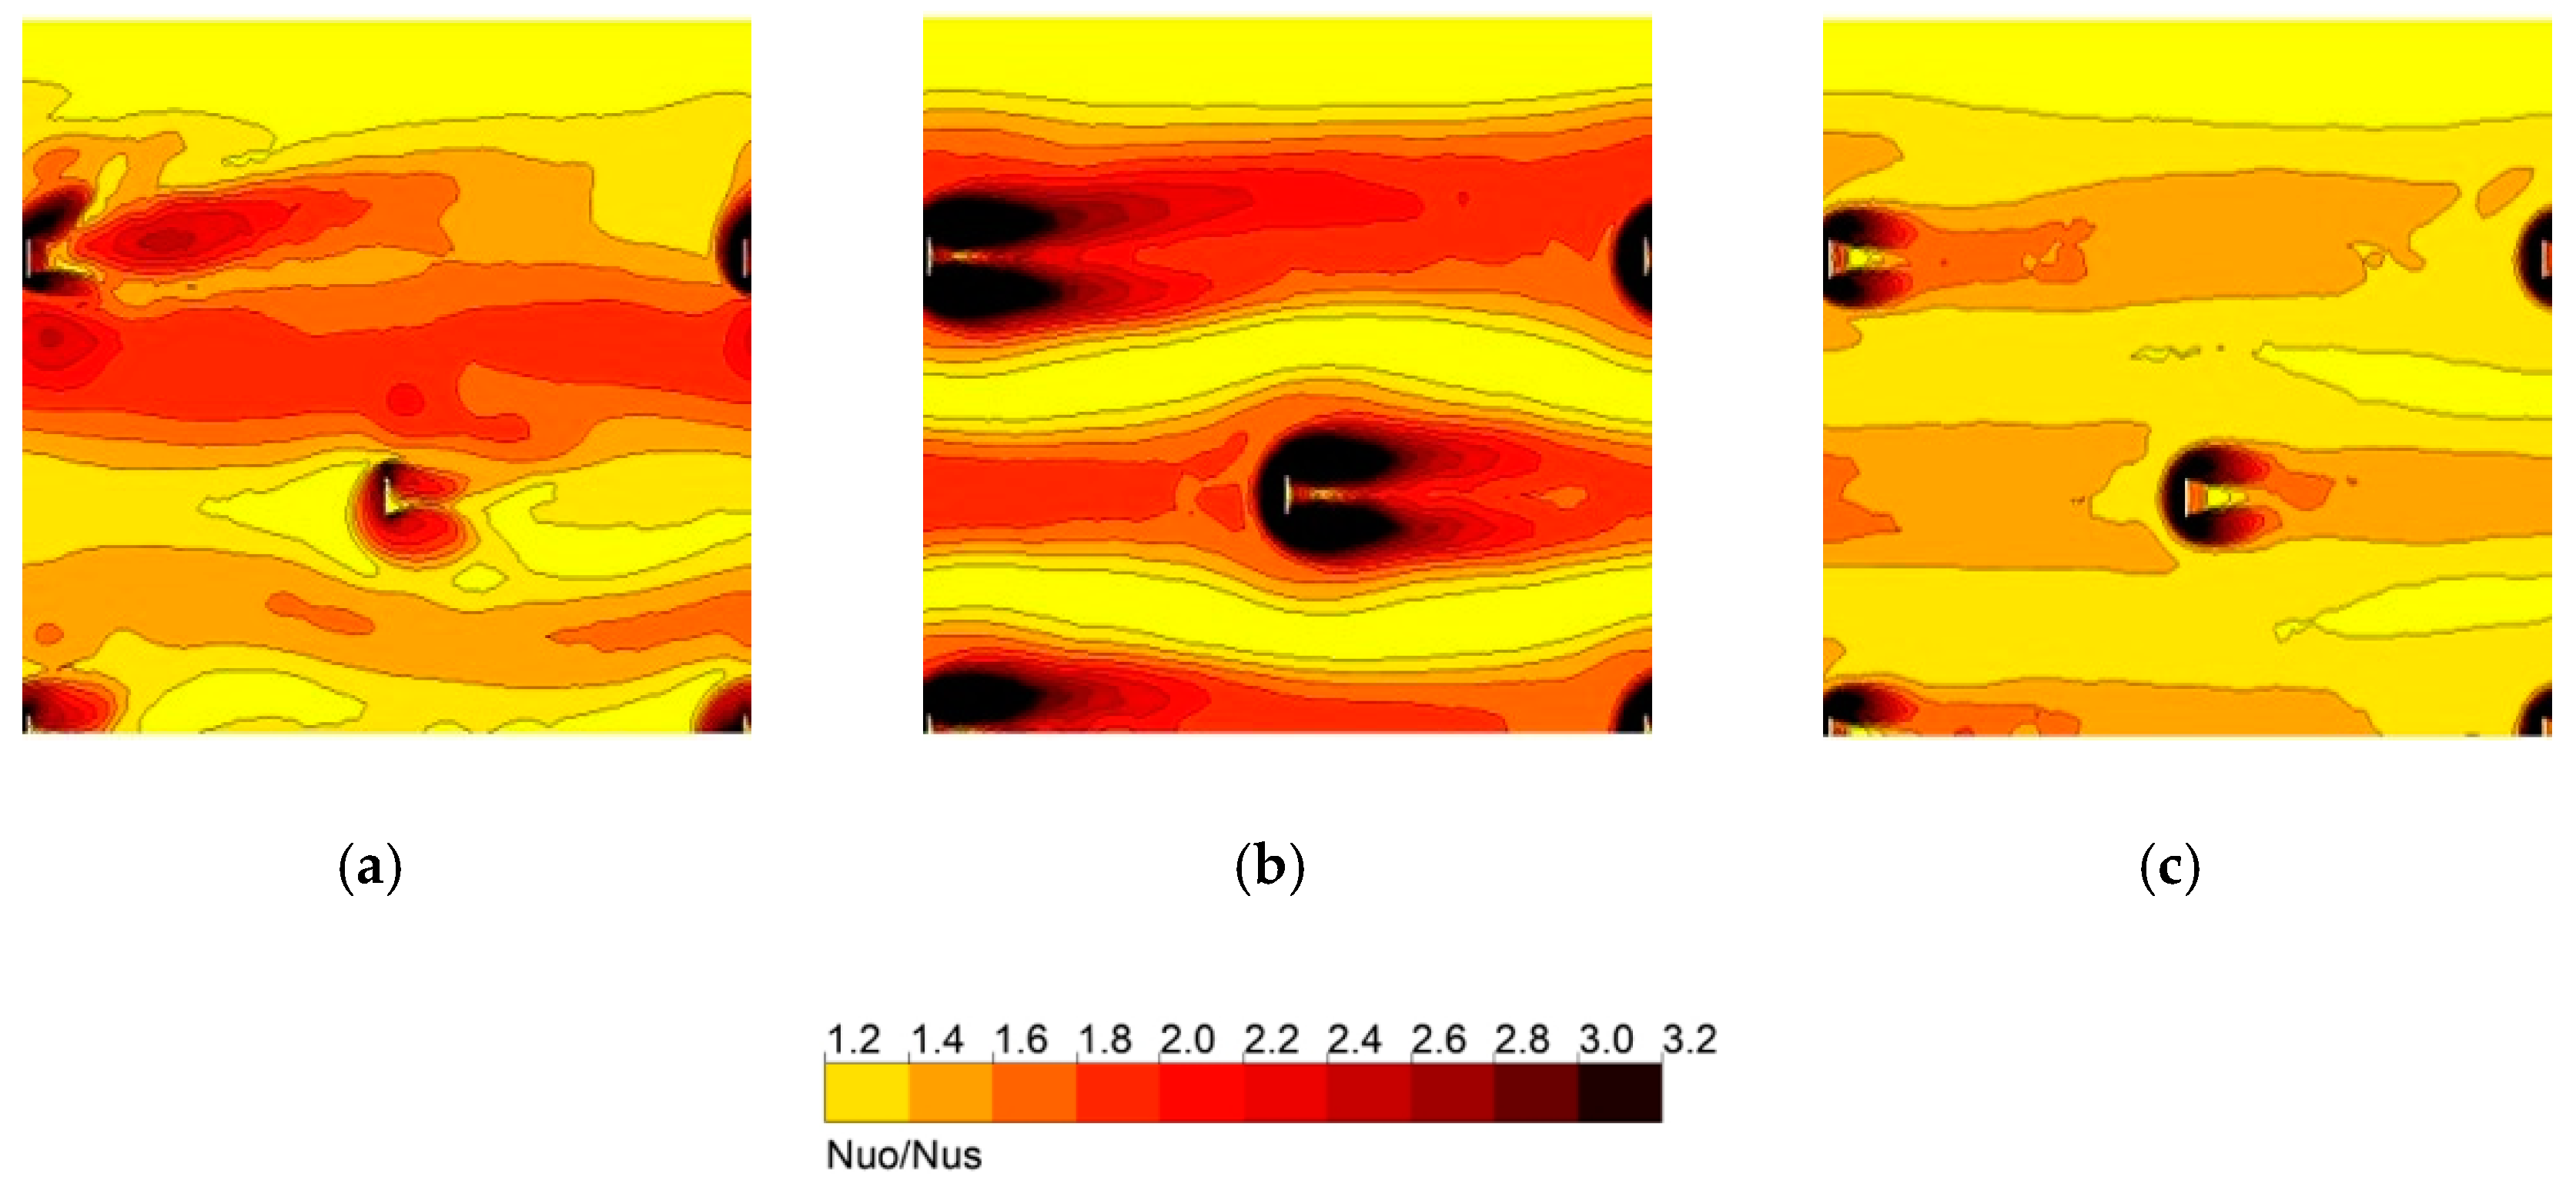
Figure 18 shows the Nusselt number distributions on the heat transfer surface between the 5th and 7th rib rows. At h/e = 0.83, where the highest heat transfer occurs, the area of the high Nusselt number region is the largest. This indicates that the heat transfer enhancement due to the production of turbulent kinetic energy becomes most effective when h and e have similar sizes while keeping the rib area constant.
To demonstrate the superiority of the heat transfer performance of the SAH with T-shaped ribs proposed in this study, the performance parameters are compared with the experimental data for the SAH with triangular ribs measured by Bekele et al. [
8], as shown in
Figure 19 and
Figure 20. The comparison was performed for the same cross-sectional area of the ribs and the same spacing between the ribs. The T-shaped rib used for the comparison is the reference rib presented in
Table 2.
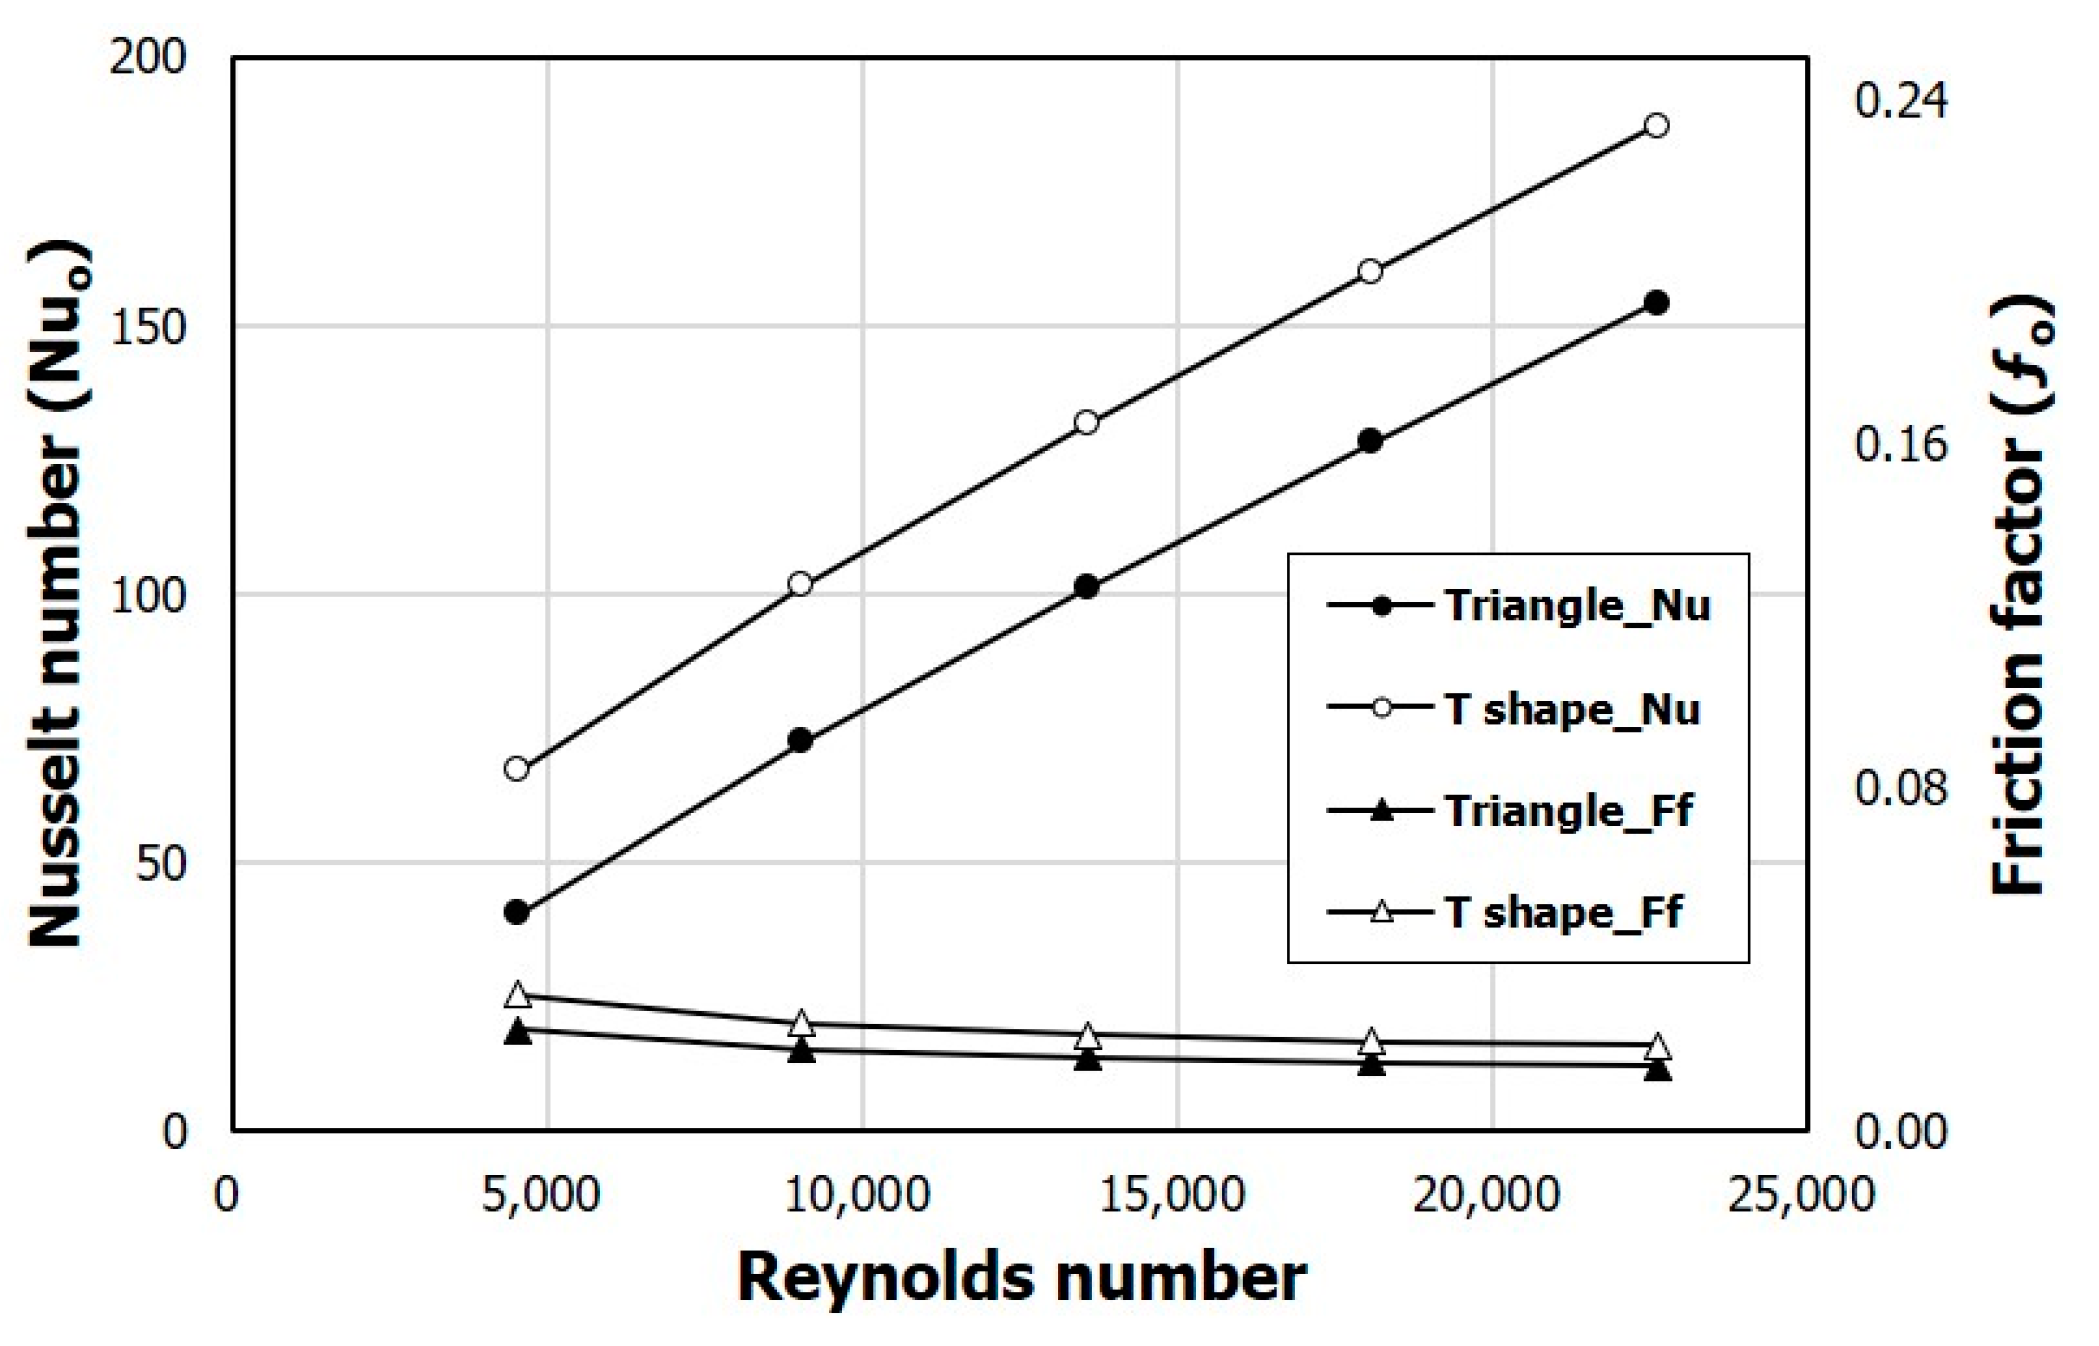
Figure 19 shows the variations of the Nusselt number (Nu
o) and friction factor (
fo) with Reynolds number. In the case of the friction factor, the T-shaped ribs show a slightly larger value than that with the triangular ribs in the entire Reynolds number range. However, the Nusselt number shows a large uniform improvement at all Reynolds numbers. Compared to the triangular ribs, the T-shaped ribs show Nusselt numbers that are 65% higher at Re = 4510 and 21.5% higher at Re = 22,600. On the other hand, a 35% higher pressure drop occurs at Re = 4510 and a 31% higher pressure drop occurs at Re = 22,600 than for the triangular ribs.
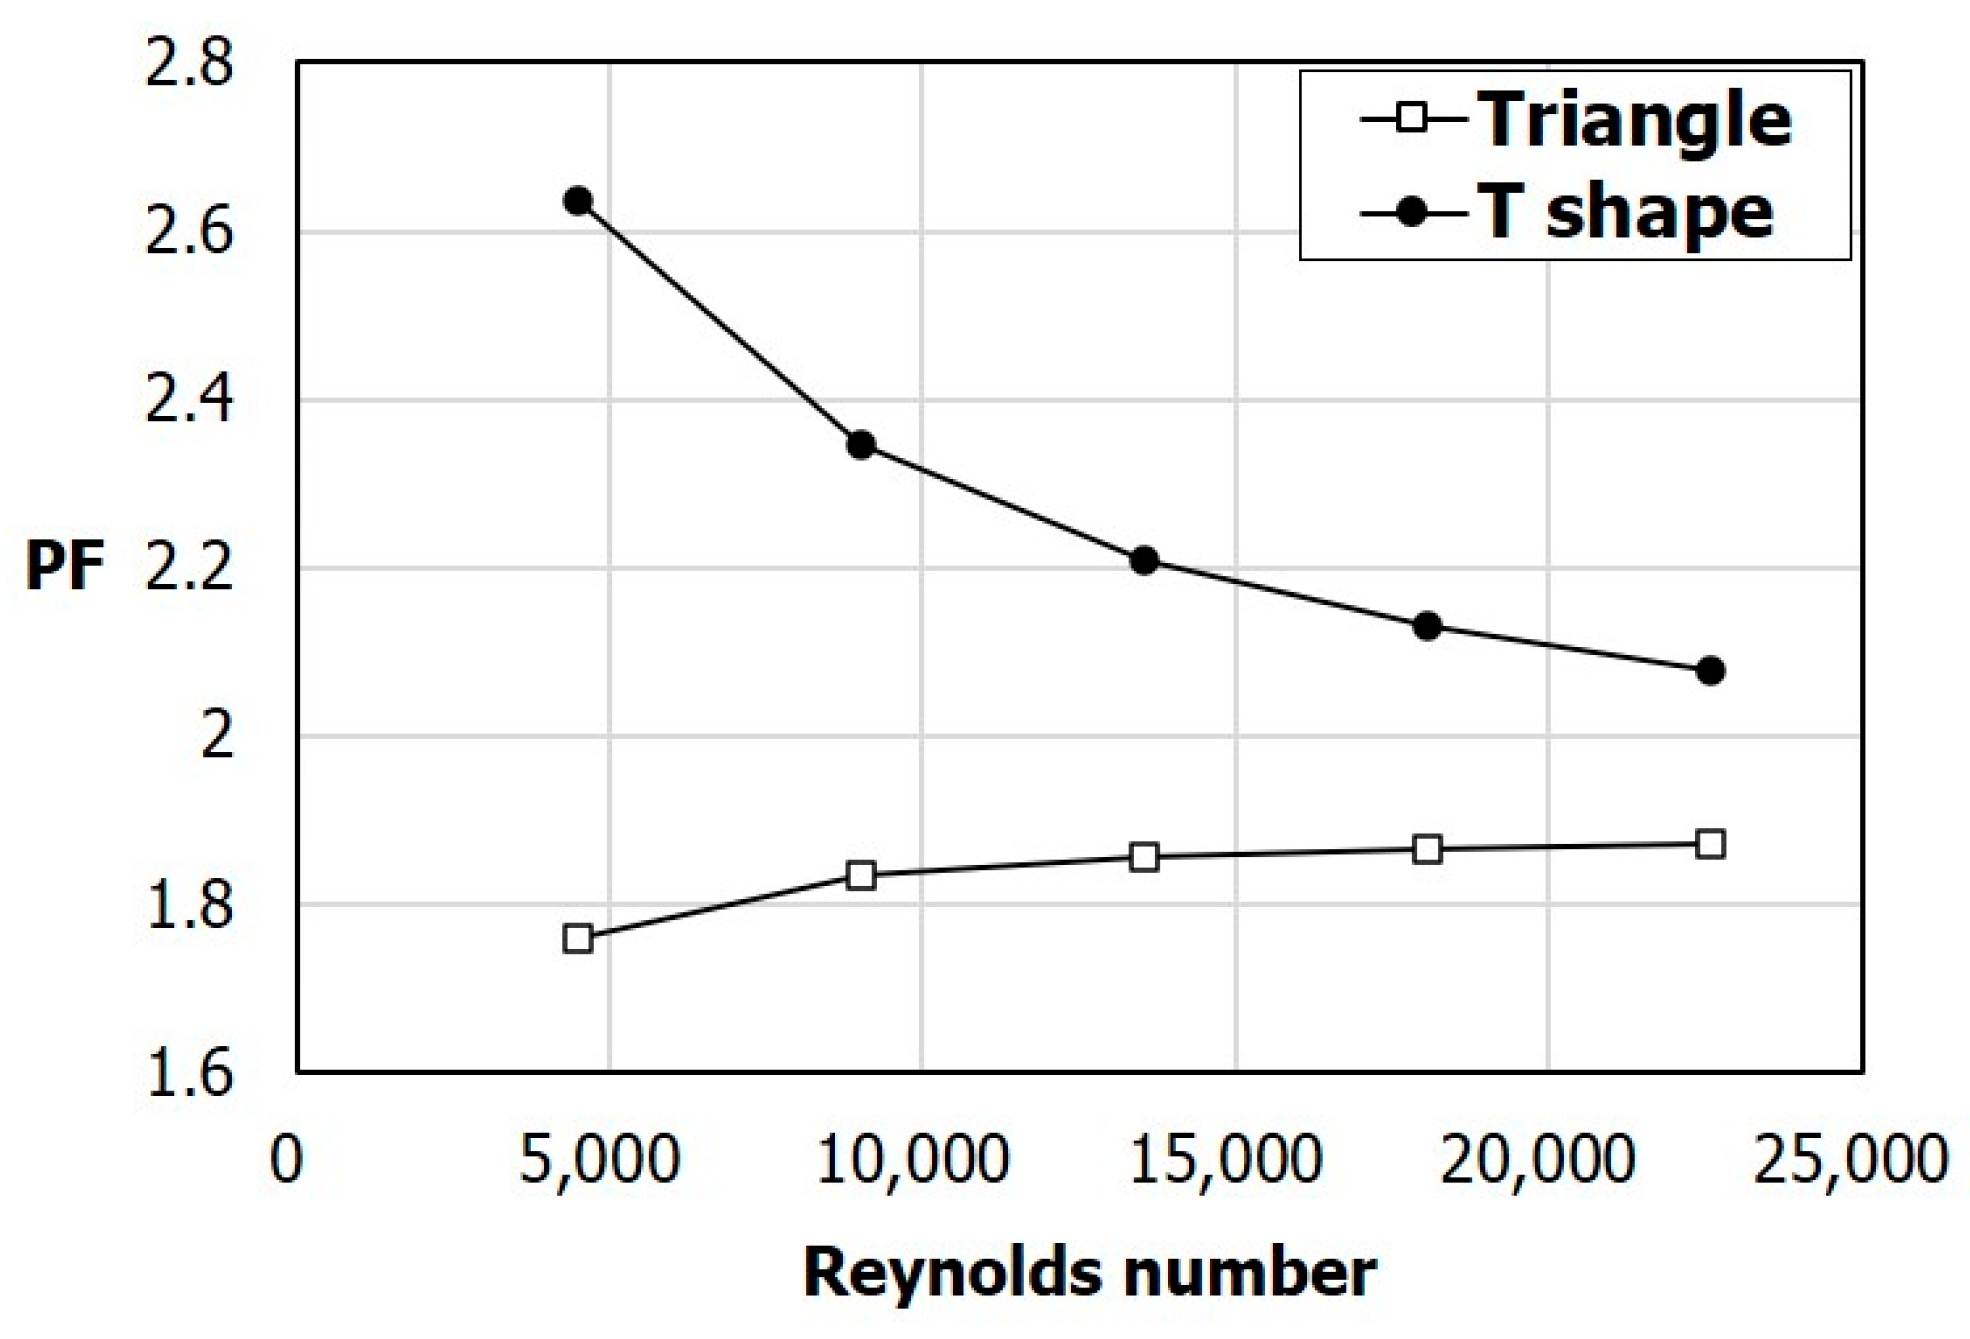
Figure 20 shows the comparison of the performance factor PF between the two different ribs. The PF of the T-shaped ribs is 49.7% higher at Re = 4510, and 11% higher at Re = 22,600 than for the triangular ribs.
Table 3 shows a comparison of PF ranges among various obstacle shapes developed to date. These obstacles were tested by previous experimental or numerical studies using the parameters of longitudinal pitch (P
l/e), relative obstacle height (e/H), relative roughness height (e/D), relative roughness pitch (P/e), relative longitudinal pitch between the rows of winglets (P/H), and number of waves on the delta winglet (ϕ). The T-shaped ribs proposed in this study cause two recirculation regions formed in the height direction, as shown in
Figure 8 and
Figure 13, due to their unique geometric shape. These multiple recirculation zones are expected to promote the production of turbulent kinetic energy and thus further enhance the turbulent heat transfer compared to the other obstacles in
Table 3.


