Article

Decision-Making of Port Enterprise Safety Investment Based on System Dynamics

School of Transportation, Wuhan University of Technology (WUT), Wuhan 430000, China
*
Author to whom correspondence should be addressed.
Processes 2020, 8(10), 1235; https://doi.org/10.3390/pr8101235
Submission received: 10 August 2020 / Revised: 23 September 2020 / Accepted: 27 September 2020 / Published: 2 October 2020
(This article belongs to the Special Issue Dynamic Modeling and Control in Chemical and Energy Processes)

Abstract

:
Safety is the premise of efficiency and effectiveness in the port operation. Safety investment is becoming a vital part of port operation in current era in order to overcome different types of hazards the port operation exposed to. This paper aims to improve the safety level of port operation through analyzing its influencing factors and exploring the interactions between the safety investment and system risk level. By analyzing the key factors affecting the port operation and their mutual relationship within a man–machine–environment–management system, a decision-making model of safety investment in port enterprise was established by system dynamics (SD). An illustration example and a sensitivity analysis were carried out to justify and validate the proposed model. The results show that increasing the total safety investment of port enterprises, improving the safety management investment on personnel, and strengthening the implementation effect of investment can improve the degree of port security to a certain extent. The strength of the proposed work is its practical application in current scenarios using real time data and the ability to provide a baseline approach for port enterprises to formulate safety investment strategy.

1. Introduction

The big explosion that occurred in Tianjin port in 2015 has prompted great concern about port operation safety domestic and abroad. Port operation safety is the basic premium for efficient and effective port operation. Nevertheless, port operation is a complicated system that is susceptible to be affected by one or more internal and external factors. With the intensification of market competition, port enterprise usually has more incentives to seek the maximum profit than to invest in safety on the port operation, especially in the situation of port depression. However, the port operation is characterized by huge infrastructure, critical resources, and some dynamic situations like numerous vessels in and out of through the waterway in the port, and is also exposed to several types of risks and failure modes [1]. The port operation activities are engaged in such a dynamic environment that leads to many failures; for instance, a person injured due to human errors and a vessel collision with the dock owing to human errors coupled with bad sea conditions. Therefore, it is necessary to implement the risk identification to guarantee better control of port operation and decrease the occurrence of failures. Consequently, the interaction between the safety investment and port operation risk should be explored systematically in order to make the port enterprise manage, monitor, and control the highly ranked hazards clearly, and to use limited safety investment to make the risk level of ports operation as low as reasonably practicable to ensure port operation reliability.
Furthermore, in order to guarantee the operation of port, safety is a core subject for the stakeholders. To manage undesired events, a large number of studies devoted to extending current knowledge and application in risk and safety management in ports. It is important to credit the previous publications that have developed various conceptual or analytical models to investigate relationship between the risk and safety investment. Literature review has disclosed that some studies in port operation safety focus on port risk assessment analysis [2,3,4,5], port traffic risk identification [6], and port safety management [7]. Some researchers are interested in port safety and human factors and occupational accidents [8].
As for the papers exploring the relationship between the port safety investment and decision-making, Hou and Zhao [9] built a structure optimization model of safety investment by combining the Cobb–Douglas production function with the Fault Tree Analysis (FTA) probability model based on the definition of risks. Yang et al. [10] proposed an evidential reasoning approach to synthesize the risk reduction data as inputs on the decision-making model applied to the analysis of port climate change adaptation measures in situations where data uncertainty is high. Kwesi-Buor et al. [11] uses system dynamics to analyze scenario and disaster preparedness for port and maritime logistics risk management, which highlights the extreme event. Li et al. [12] adopt SD to explore the complex interactions and dynamic feedback effects, which can significantly affect the reliability of risk management outcomes.
However, port operation safety should be implemented in daily work. Port operation is dynamic, but safety investment on port operation should be to the point and kept concerned consistently. So, the relationship between safety investment and system risk level is dynamic, since the safety of port operation is affected by multiple factors such as workforce, machinery, management, and others [3]. Conducting an effective safety investment on port operation with limited fund is challenging. A rational decision analysis is essential to properly represent and use uncertain information in the influencing factors to enhance port operation safety. The effective and optimized investment structure on port operation depends on the decision-making in a dynamic environment.
Therefore, several questions arise. What factors influence the port safety operation? Or, what are the risk factors in the port operation? How can the dynamic interaction between the safety investment and system risk level be explored? How can the limited safety investment on different influencing factors be allocated? Furthermore, exploring the dynamic interaction between safety investment and system risk level and allocate limited investment are important to put forward the practical risk control measures in port enterprises.
This paper attempts to answer these questions and meet the following research objectives:
  • To identify the risk factors influencing port safety operation.
  • To develop a system dynamic model to explore the relationship between safety investment and system risk level.
  • To verify the rationality and feasibility of the proposed model.
We proposed these hypotheses:
Hypothesis 1 (H1).
It systemically identifies the risk factors relating to port safety operation from a systematic perspective involving human, equipment and facility, management, and environment risks.
Hypothesis 2 (H2).
The causal diagram between investment on the risk factors and system risk level is beneficial to better understanding and modelling of risks in port safety operation.
Hypothesis 3 (H3).
Safety investment on human and management subsystems could make the system risk level decrease rapidly and produce better effects than the other two subsystems.
System Dynamics (SD) is a broad method that could be used as a quantitative method to study the internal feedback and dynamic behavior of complex systems [13], and has been widely used in logistics and engineering construction in recent years [14,15]. It is employed to model the strategies within dynamic environments, which can provide a basis of decision-making of port enterprise [16]. Not only can SD be employed to demonstrate the interdependence of the assumed interactions between the variables within the system boundaries, but the precision of parameters required is not high.
The rest of the paper is organized as follows. The risk factors identified and interaction analysis between the safety investment and risk level of the system are presented in Section 2. Section 3 gives a clear description of decision-making model involved with application of system dynamics (SD) and analytic hierarchy process (AHP). The feasibility of the proposed method is demonstrated through a case study of a port alongside the Yangtz River in Section 4. Finally, this work is concluded in Section 5.

2. Interaction Analysis between the Risk and Safety Investment of Port Operation

Risk Factors Affecting the Port Operation Analysis

Port operation is a complex and systematic engineering, which has the characteristics of diversity, complex, man–machine interaction, and round the clock uninterrupted works. Effective organization and coordination hold the premise and guarantee for the safety operation of port production activities. International Shipping Federation issued a report in 2011 stated that the contributing factors identified to influence the port safety operation were: Lack of an effective safety culture, inadequate risk assessment and operations management, inadequate operating procedures, lack of training and awareness, bigger and faster port equipment, bigger ships, increased port throughputs, faster ship turnarounds, and more extreme weather conditions [16]. C. Mabrouki et al. argued that the operational risk should be analyzed from unloading and storage, unloading and direct delivery, delivery of stored vehicle, loading directly, plantification, and preparation [1]. From the viewpoint of the system considering human factors, equipment factors, environmental factors, and management factors, the paper is to analyze and identify the risk factors that affect port safety operation by in-depth interviews with experienced practitioners and researchers interested in port operation and management, and by referring to the ideas and theories in some related document [5,17,18,19]. The analyzing structure of port operation safety is shown in Figure 1.
  • Human factor
For port operation, the human factor is the crucial part. It is reported that more than 80% accidents are caused by human errors, either directly or indirectly [19]. The human errors in the port operation are mainly caused by lower safety awareness [16], insufficient skill and experience, and physical and psychological states based on the experience and knowledge of experts working in ports for more than 15 years. The staff in port operation could not follow the safety operation rules and regulations, equipped with proper protective devices and neglect the safety culture in the port reflect the lower safety awareness. Safety awareness is regarded as one of the key factors in the human behavior in the port operation. If it failed, the likelihood of an accidental event occurred would be increased. It should be noted that the automation of the equipment has achieved a great improvement, and today’s port operation with modern technology requires contemporary professional expertise, and so human is still the core part of the system. The woes of inept skills, experiences, and lack of technology training makes it hard to maintain the port operation smoothly. Physical and psychological states reflect the working condition, responsibility, and capability of the staff to response the emergency. If the staff were in the state of fatigue, it would result in delaying responses, misjudging the emergency situation, and increasing the operation errors. The occurrence of accidental events will be increased.
Safety culture and safety awareness promote each other. Adequate education and training of safety culture can help improve safety awareness. As safety culture develops more mature and staff view the changes positively, it will result in greater trust, accountability, free and open reporting, and transparency [20]. Some researchers just gave a safety culture training course, with the main goal to develop awareness of the importance of each individual’s personal contribution to safety culture improvement among workers and managers [21].
2.
Equipment factor
The factor of equipment and facilities refers to the unsafe conditions of objects, such as unreasonable design, defects in equipment and facilities, and operation under obvious malfunction [9], which can be divided into two main types. One type is related to port production directly, such as port crane and some mobile equipment; the other is the auxiliary production system that ensures the normal port production, such as fire-fighting equipment, monitoring system, some safety protection equipment, repair, and maintaining works. If the port production equipment and auxiliary equipment go wrong, it could decrease the port operation efficiency and even increase the probability of human injuries. There is an increasing trend in the number of accidents resulted by port machinery. Also, there is an increasing trend in the number of accidents resulted by port machinery, which have resulted in serious injuries and fatalities [22].
3.
Environment factor
It is undeniable that ports and docks can be particularly dangerous and hazardous environment [18]. Any changes in ports and docks’ environment could make an indelible impact on port operation and navigation. The higher the density of vessels traffic flow, the more vulnerable they are towards accidents and mishaps. Especially, the inbound and outbound channel should be maintained in enough depth to ensure the full-load vessels travelling in and out of port have decreased risk of running aground [11]. Poor and complex hydrological conditions in the port would make the vessel hard to pull alongside the berth, which increase the probability of collision with the dock. Also, extreme weather could increase the risk of overtopping [2] to damage the production equipment and disrupt the port operation further.
Some researchers analyzed the relationship between environmental factors of major domestic ports and the number of ship accidents, concluding that the navigation condition plays a greater role in avoiding traffic accidents [23].
4.
Management factor
From the perspective of port management, it is important to build a safety culture and gradually develop a safety atmosphere so that port staff can comply with safety instructions at work. A lack of adequate safety culture could result in organizational, cultural, and managerial issues [19]. Although there is no single definition of safety culture, the purpose of safety culture in an enterprise is to form an atmosphere of safety awareness that permeates all aspects of the work environment. If a safety management system has no real commitment or culture towards safety, then the management system will not be effective, as decisions will not prioritize safety [24].
The absence of safety culture in the port would result a disorganized work ethic, which increases the probability of accidents. The port is a complicated system, which needs coordination and cooperation among the subsystem. In some ports, some unimportant business is outsourced. This increases the risk of control and manage the outsourcing company. To make matters even more vague, the information sharing is insufficient, which makes it ever harder to manage. Emergency management reflects the level of port to prepare, plan, and respond to the emergencies. Therefore, the lower the emergency management level is, the higher the risk of serious loss when the accident occurs. Bauk et al. stressed examples of how ports can benefit from improved Information and Communication Technology (ICT), to support such co-ordination, which is especially important for ports that are still developing [25,26]. S. Corrigan et al., in an investigation towards port authority, show that effective and tailored communications are very important to help incident response and feedback [18].
The above risk factors analysis is from the view of system that includes human, equipment and facility, management, and environment, and the analysis relates to hypothesis H1.

3. Decision-Making Model of Safety Investment on Port Operation Based on SD

Safety is the basis of port operation. Nevertheless, port operation is a complicated system where routine operation is susceptible to be affected by many factors such as labor, machinery, management, and the complex environment of port water area. Also, the dynamics of port system, like the flow of personnel, use of equipment, and in-and-out of port ships, and the interaction between these, makes it constantly exposed to several types of risks and failure modes. Involving efficient and effective port operation, safety has therefore become an important theme for stakeholders. Effectively reducing the risk level of port operations through limited safety investment will be an inevitable problem to be solved.
Based on that, the study aims to give an effective decision-making model for port enterprises to help determine safety investment by analyzing the factors affecting port operation safety and the interaction of factors in port operation system. Exploring the relationship between safety investment and port operation risks from a systematic perspective helps port companies clearly manage, monitor, and control the high risks of port operation, and use limited safety investment to reduce port operation risks to a certain extent. It can be seen that the decision model will be the core of the research, and the selection of a reasonable and effective modeling method will have an important impact on the accuracy and intuitiveness of the research results. Taking into account the dynamics and uncertainties of the port operation system, the study selects the SD model for modeling to show the interdependence of the assumed interactions between the variables within the system boundaries.
System Dynamics (SD) is a common method used to study the relationship between the feedback structure and its dynamic behavior. SD is a broad concept that includes “system” and “dynamics”. The “system” represents the structure of the system and the concept of feedback effect, while “dynamics” reflects the changes in the behavior of the system components over time. In a developed causal loop diagram, the assumed interactions between the variables are formalized to demonstrate the interdependence within the system boundaries. A closed chain of causal relations is defined as the feedback loop, which could be positive or negative [27]. The positive loop is unstable and oscillated, which triggers systems to grow, evolve, and collapse, while the change of negative loop towards a stable situation [12].
SD is concerned with the qualitative and quantitative analysis of the dynamic performance in large-scale systems, both retrospectively and prospectively. The safety investment system of port enterprises is a complex and dynamic system composed of various risk factors and risk control inputs. There is an inherent causal relationship among these factors. Therefore, the decision-making model of port enterprise safety investment based on SD can effectively reflect the relationship between the safety investment and risk level, furthermore, to identify the best decision-making program to balance the risk level and the investment.
The stepwise of decision-making model is as follows:
Step 1:
Analyze the interaction between the port operation risk factors and safety investment represented by causal loop diagram of risk-safety investment among the four subsystems of human, equipment, environment, and management within each subsystem.
Step 2:
Explore the feedback mechanism among the factors.
Step 3:
Build the functional relationship among the factors based on the above analysis to complete the construction of SD model.
Step 4:
Conduct the sensitivity analysis to validate the model.

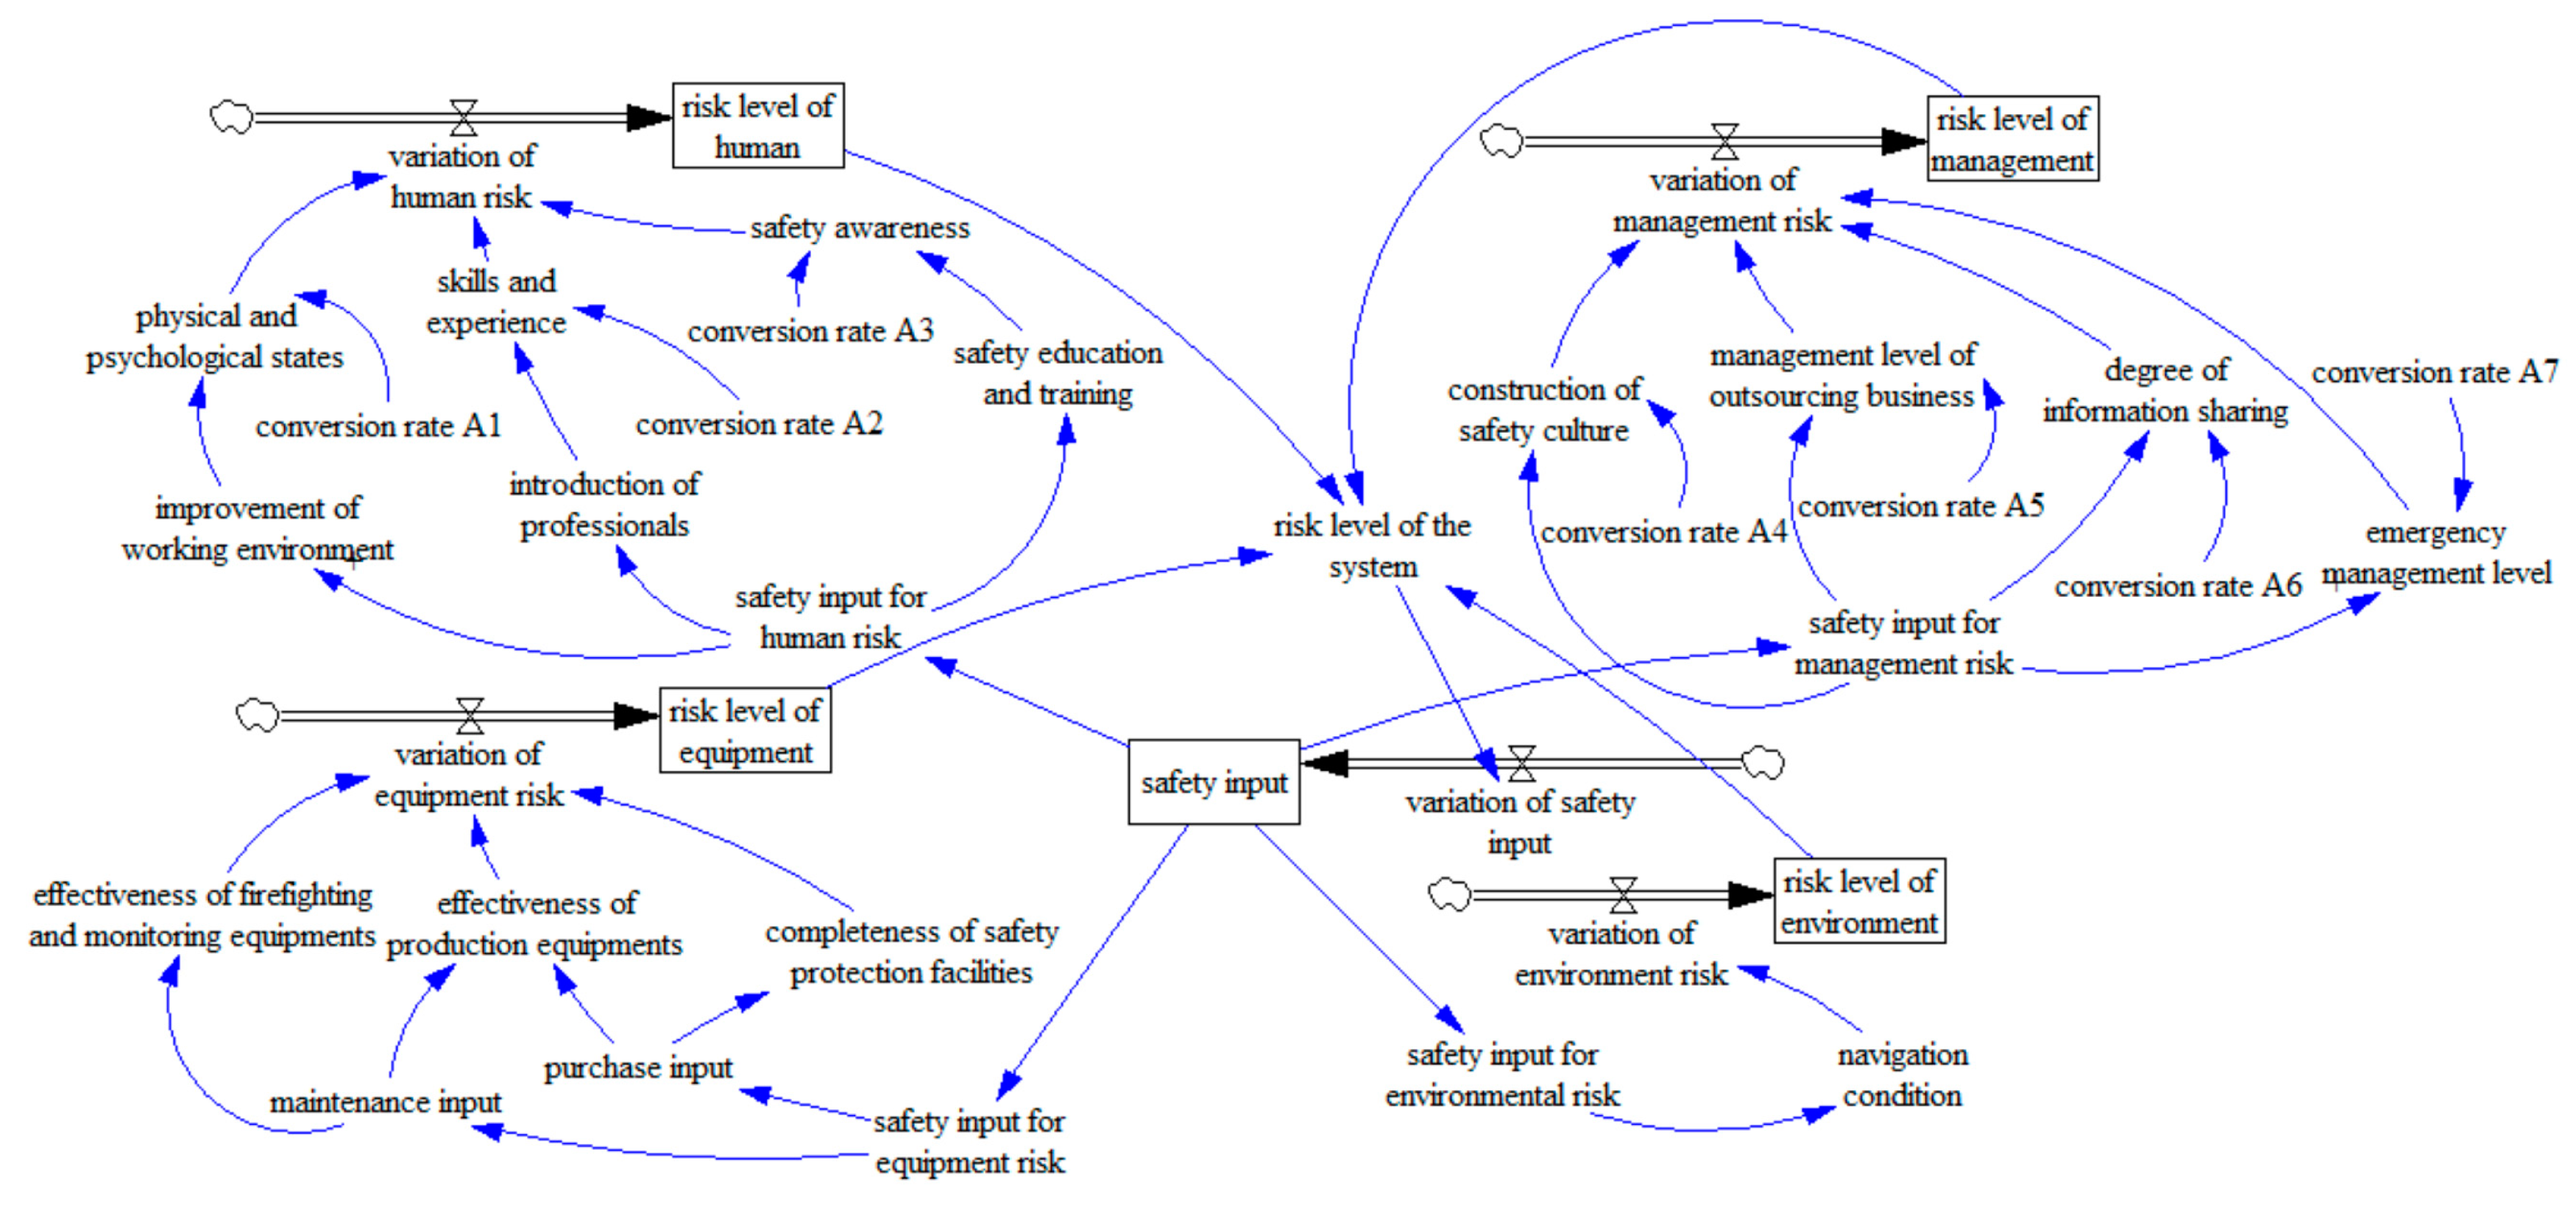
3.1. Interaction Analysis of Port Operation Risk and Safety Investment

Safety investment refers to the total of all human, material, financial, and other resources invested by port enterprises in order to achieve their anticipated safety level. The decision-making of safety investment is to determine the type and amount of resources investment according to the risk factors identified, the requirements of laws and regulations, and the social responsibility that enterprises should afford.
Risk factors are identified regarding human, facility and equipment, management, and environment factors, and each of them constitutes a subsystem affecting the overall risk level of the system. Introducing various risk control measures establishes the relationship between safety investment and system risk level to quantify the effect of safety investment on the overall risk level of the system. The causal loop diagrams of the system constructed with Vensim software is shown in Figure 2. From Figure 2, we can easily see the causal relationship between investment on the risk factors and system risk level, whether positive or negative feedback, is beneficial to better understanding and modelling the risks in port safety operation and making a basis to analyze their relationship quantitatively. The analysis relates to hypothesis H2.
There are three loops in the human risk subsystem in the system as follows:
  • Loop (1): Safety awareness → risk level of human → risk level of the system → safety input → safety input for human risk → safety education and training → safety awareness.
  • Loop (2): Skills and experience → risk level of human → risk level of the system → safety input → safety input for human risk → introduction of professionals → skills and experience.
  • Loop (3): Physical and psychological states → risk level of human → system risk level → safety input → safety input for human risk → improvement of working environment → physical and psychological states.
In the loop (1), the poor safety awareness of port staff leads to the increase of human risk level; furthermore, it affects the change of the overall risk level of the system. Increasing the input on education and training will result in a lower number of unsafe behaviors of personnel, the safety awareness of port staff is increased, and so the loop is a negative feedback loop. The feedback mechanisms of the loop (2) and (3) are similar to that of the loop, and all of them are negative feedback loops.
Similarly, there are four loops in the management risk subsystem in the system as follows, and all of them are negative feedback loops.
  • Loop (4): Risk level of management → risk level of the system → safety input → safety input for management risk → construction of safety culture → risk level of management.
  • Loop (5): Risk level of management → risk level of the system → safety input → safety input for management risk → management level of outsourcing business → risk level of management.
  • Loop (6): Risk level of management → risk level of the system → safety input → safety input for management risk → degree of information sharing → risk level of management.
  • Loop (7): Risk level of management → risk level of the system → safety input → safety input for management risk → emergency management level → risk level of management.
Three loops in the facility and equipment subsystem are as follows, and they are negative feedback loops.
  • Loop (8): Risk level of facility → risk level of the system → safety input → safety input for facility risk → maintenance input → effectiveness of firefighting and monitoring equipment → risk level of facility.
  • Loop (9): Risk level of facility → risk level of the system → safety input → safety input for facility risk → purchase input → effectiveness of production equipment → risk level of facility.
  • Loop (10): Risk level of facility → risk level of the system → safety input → safety input for facility risk → purchase input → completeness of safety protection facilities → risk level of facility.
One loop is in the environment subsystem:
  • Loop (11): Risk level of environment → risk level of the system → safety input → safety input for environment risk → navigation condition → risk level of environment.

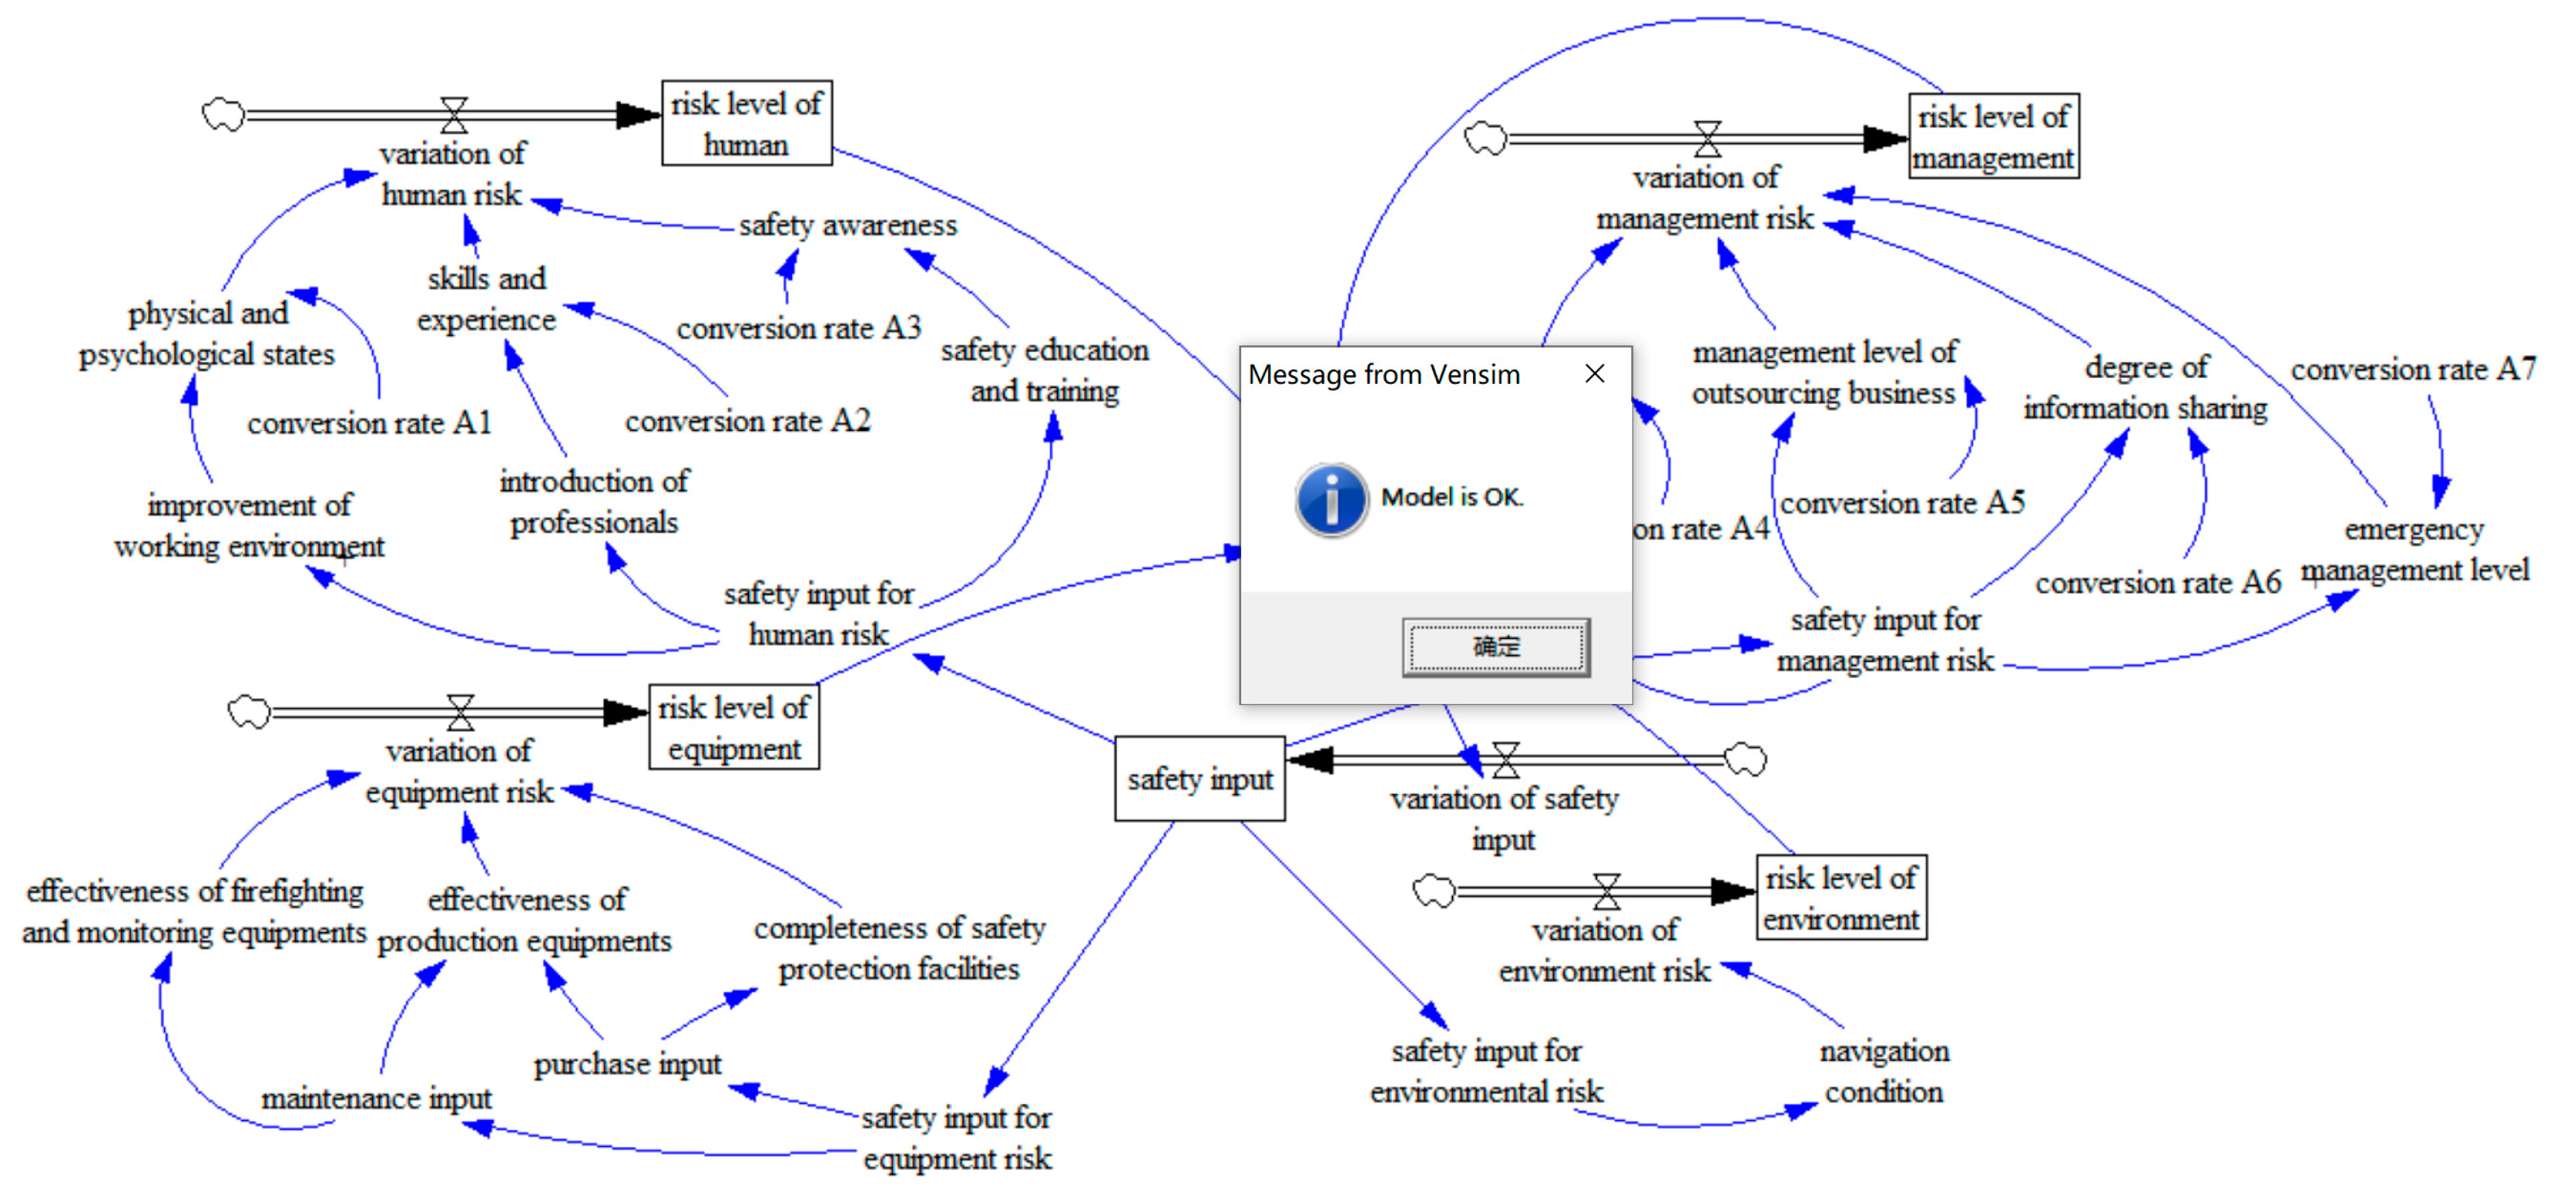
3.2. Establishment of SD Model for Safety Investment and System Risk Level

According to the theory of SD, system variables include speed variables, state variables, auxiliary variables, and constants. By analyzing the above risk factors and safety investment factors, the risk level of human, management, equipment, and environment factors are state variables; the changes of personnel risk level, management risk level, equipment risk level, and environmental risk level are speed variables; and various risk factors are known as auxiliary variables. In addition, because the effect of some investment on risk factors is not a simple linear relationship, we introduce ‘conversion rate’ to express it. A flowchart of the overall risk level of the port operation system—the safety investment constructed is shown in Figure 3.

3.3. Determination of Parameters and Functional Relations

3.3.1. Definition of Functional Relations of Variables

Based on the principle of SD, the following system dynamics equations established are shown in Table 1.

3.3.2. Determination of Parameters

  • Initial value of level variables
The results of the system dynamics model mainly depend on the setting of the model structure, rather than the size of the parameters, so the accuracy of the parameters is not required. The estimation of parameter depends on the specific system type and accuracy of model. The parameters of this model consist of three categories: Initial value, corresponding weight, and conversion rate.
In this paper, the value of risk level is set in interval (0,1), where (0,0.4) represents a lower risk level; (0.4,0.8) represents a middle risk level; (0.8,1) represents a very high-risk level; that is, the greater the value, the higher the risk level. The risk level is less than 0.8, which could be thought of as ALARP. According to the above rules, a survey was carried out on 20 professionals including port managers, port enterprise executives, and experts who are engaged in the research in port operation safety and risk management. Consequently, the initial value of the risk level of human, equipment, management, and environment factors as level variables were determined by the experts’ judgements based on the situation of human resources, handling technology, facilities and equipment, and navigation environment in the target port operation.
The questionnaires were distributed to two groups; academic/researcher group and the port operator group, where the valid response rates for the academic/researcher group was 62.5% and for the other was 50%. The data were collected and weighted average treatment to get the initial value of each level variables; that is, the initial risk level of human, equipment, management, and environment was 0.554, 0.201, 0.486, and 0.198, correspondingly.
2.
Initial value of safety investment
The initial value of safety investment is extract by 2% of the company’s annual output value according to the ‘Measures for the Extraction and Use of Safety Expense of Enterprises’ (No. 16, 2012).
3.
Corresponding weight of each criteria
Due to the lack of relevant data, the effect of various safety investment on the subsystem could be analyzed by Analytic Hierarchy Process (AHP), which is based on expert’s experience and domain knowledge. It establishes the judgment matrix by comparing two indexes of the same level with the 9-scale method, and then obtains the corresponding weight. The detailed steps are as follows:
Step 1:
Construct a hierarchy structure (Figure 1).
Step 2:
Build a comparison matrix Aij based on the judgement of experts (see Table 2). The relative importance scale between two criteria as suggested by Saaty [28] is the most widely used. Attributing values that vary from 1 to 9, the scale determines the relative importance of one criterion when compared with another criterion.
Step 3:
Normalization, calculation of λmax, and consistency test CI and CR.
λ m a x = 1 n i = 1 n ( A W ) i w i ,
According to the comparison matrix, λmax = 4.043.
In order to eliminate the errors of subjective judgement, a consistency test is a must.
CI   =   λ m a x n n 1
The result of CI is 0.0144.
CR   =   CI RI ,
The result of CR = 0.0144/0.9 = 0.016, which is less than 0.1. The judgement matrix is consistent.
Step 4:
Weight calculation.
Bases on the above calculation, the relative weights of human, equipment, management, and environment to the risk level of the system are seen in Table 3.
4.
Initial value of conversion rate
In the above SD model, the effect of safety investment on risk factors is not a simple linear relationship, and it is difficult to express with formula. Therefore, the factor of ‘conversion rate’ is introduced to quantify the relationship between the two factors, which means the change of risk level caused by unit safety investment. With the change of time and the difference of execution, the increase and decrease range of each factor in different unit step is different, so the conversion rate is defined as a table function. After evaluating the risk level of each factor in the unit step, the conversion rate in the unit step can be obtained through dividing its increment by the safety investment within that time.

4. Demonstration

The proposed port safety investment SD model is applied to an inland port along the Yangtze River, which is a particular coal port in central China with a coal transfer capacity of 20 million tons per year and a coal storage capacity of 2 million tons. Safety investment of this port enterprise is about 100,000 RMB per month. The initial value of safety investment ratio for human–management–equipment–environment is 4:3:2:1, respectively, based on the initial risk level of port operation evaluated by the port enterprise. Based on the current risk level and safety resource allocation of the port enterprise, the change of risk level in the next 24 months is simulated. The proposed model is analyzed under the following assumptions:
  • The idea of modelling is based on the current risk level of the system under the given condition, introducing the input of risk management and control to explore the interaction between the economic input and risk level of the system.
  • The effects of scenarios analysis to the risk level of system are based on the view of safety investment. Any investment could be in a form of economic input, which means using economic input to quantify the input of risk management and control.
  • The initial values of all variables are from the investigation and questionnaire towards the two groups—academic/researcher group and the port operator group. In order to express the interaction between the variables, corresponding weights were introduced.
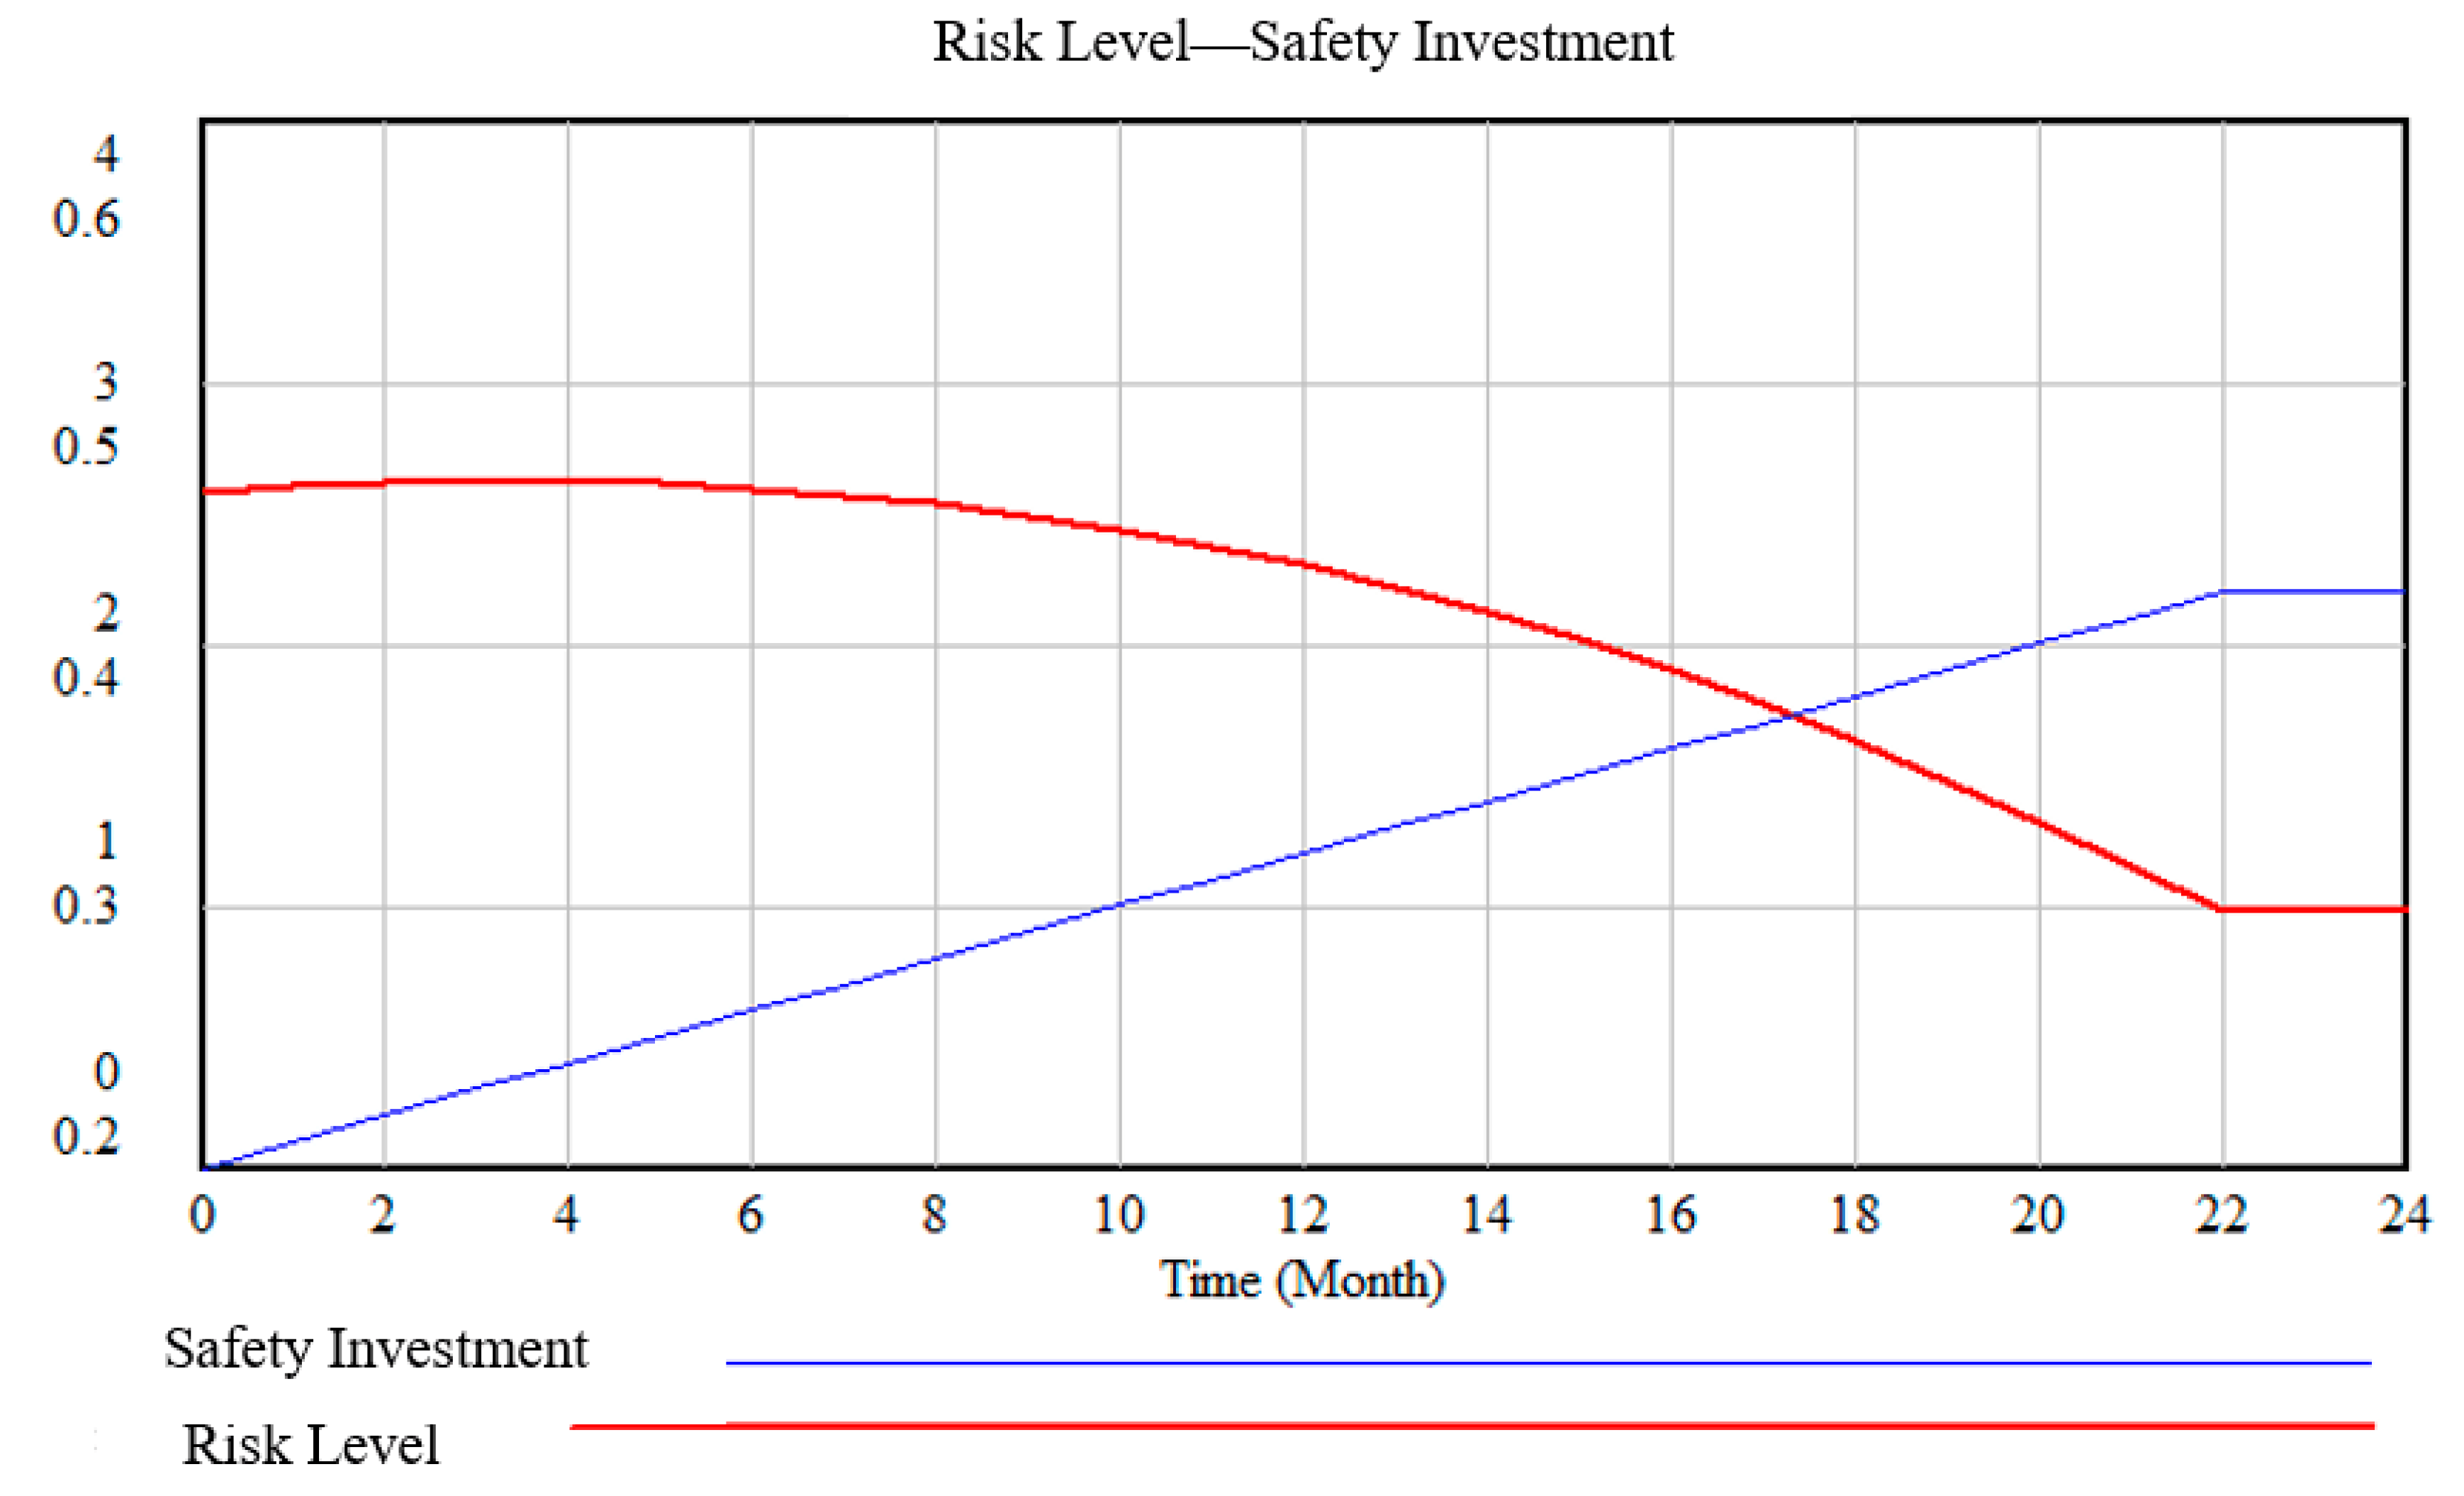
4.1. Model Test

The basic model check includes a running check, a dimension consistency test, and an extremum test. The running check and dimension consistency check are used to verify the reasonableness of the causality, the accuracy of the equation, and the consistency of the dimension (see Figure 4). Through the function of the running check and dimension consistency check of Vensim software, it is concluded that the SD model works well. The extremum test is to determine whether the model is reliable by setting important variables or constants to extreme values and observing whether the results of the model still follow the reality. This paper mainly considers the test of safety investment in extreme circumstances i.e., setting the value of safety investment to 0; running the model, it can be seen that risk level of the system increases with time and gradually tends to 1. The simulation is basically consistent with the reality, indicating that the model has passed the extremum test.

4.2. Simulation and Analysis

The initial data for this study are collected through questionnaires. By sorting out the questionnaires, the assignment of the undetermined coefficients that the system has achieved, and as an input to the SD model, the trend of overall risk level and the safety investment of the system is shown in Figure 5.
The blue line indicates the safety investment with time. The red line shows the tendency of the risk level of the system under the safety investment. Under the given conditions, the initial value of risk level of the system is about 0.48. With the effect of safety investment on the risk level of each subsystem, the overall risk level of the system shows a downward trend, and then accelerates after eight months. The main reason is that the safety investment is put into use while there is a delayed effect of control measures on risk factors. Risk factors such as the safety awareness and skilled expertise need a certain amount of time to change. The risk level of the system remained unchanged until it reached the target safety level in the 22nd month. There is a causal relationship between risk level and safety investment; when the risk level reduced to the target safety level, the safety investment was maintained at the current level, indicating that the current safety investment could maintain the favorable risk level of the system within the target safety level.

4.3. Contrastive Analysis of Adjustment Schemes

  • Adjustment of total safety investment
In order to dig out the feedback between risk level of the system and safety investment, the initial value of safety investment increased and decreased by 10% and 20%, respectively. The change of overall system risk level under the four schemes is as shown in Figure 6. Figure 6 shows that after reducing the monthly safety investment, the overall change of the trend of the system risk level slows down, and the target safety level has not been reached before the end of the simulation (line 1 and line 2). When the monthly safety input is increased, the system will reduce to the target safety level in advance (line 4). Furthermore, by increasing monthly safety input, the system risk level will decline rapidly (line 3). The results show that increasing safety investment can effectively reduce the risk level of system, but the risk level of system will not decrease unrestrictedly with the increase of investment (line 3). Meanwhile, reducing safety investment will increase the insecurity of the system. Therefore, we argued that the enterprises should seek a balance between the risk level and the amount of investment when determining the total amount of investment for the port safety operation. Too low investment cannot meet the requirements of safety management, and too high investment also causes waste of resources, which is not favorable to the healthy development of enterprises.
2.
Adjustment of safety investment for subsystem
In order to further explore the role of each subsystem in the overall risk level of the system, safety investment for four subsystems should be changed. The initial proportion of human, management, equipment, and environmental subsystems is 4:3:2:1, respectively. This investment scheme is defined as the original scheme, and the total risk investment increases by 20%. Assuming that the investment of human, management, and equipment subsystems remains unchanged, 20% of the increase will be invested in the environmental subsystem. The other three adjustment schemes add the same input to equipment, human, and management subsystems, respectively. The change of system risk level after adjustment is shown in Figure 7. Figure 7 shows that the overall risk level of the system under the four adjustment schemes can reach the target safety level ahead of schedule compared with the original scheme due to the increase of security investment. However, the change of the risk level under each adjustment scheme is different, which indicates that the effect of the same investment to different subsystems on the risk level is different. Among them, investment in the human subsystem can cause the risk level to decrease rapidly and produce the most apparent effect (line 3), followed by the management subsystem (line 4). Through the simulation results, we concluded that for the target port, when the total amount of safety investment is fixed, the investment scheme can choose to increase the amount of human safety investment appropriately to achieve the best control effect. The above analysis relates to H3, which means safety investment on human and management subsystems could cause the system risk level to decrease rapidly and produce better effects than the other two subsystems. According to the adjustment of safety investment into the subsystem, the safety investment in corporate management presents a larger growth rate in improving the safety level of the system, which is consistent with previous accident investigation results as well as enterprise reality [9].
3.
Adjustment of the conversion rate
From the above simulation results, it can be seen that the safety input of human and management subsystem is the most effective to reduce the risk level of system. In order to further analyze the effect of different control measures on the risk level of the above subsystems, the conversion rate of human and management subsystems is adjusted separately. That is, each conversion rate increased by 20% in turn while other variables remain unchanged, and the change of the overall risk level of the system under several adjustment schemes is shown in Figure 8. It can be seen that the improvement of conversion rate can reduce the risk level of system to some extent, but the effect on risk level of the system is different. Among them, the improvement of the conversion rate of education and training can cause the system to reach the target safety level first (line 7), and the timeliness of reducing the risk level is the most obvious. Meanwhile, the improvement of the conversion rate of safety culture construction can cause the system to reach the lowest risk level, and the effect of reducing risk is the best (line 4). The simulation results show that the management for the port should not only consider the amount and proportion of investment, but also pay attention to the conversion rate of investment and strengthen the implementation effect of investment when formulating security investment strategy. Improving the conversion rate of human risk and implementing all control measures in place can achieve proper results in the shortest time. It is crucial that enterprises should supervise when they carry out risk management. In addition, risk management is a work that needs to be persisted long term, operators should take long-term consideration to establish safety documents of enterprises and strengthen the safety management of production activities. Therefore, investment on the staff safety education and training to improve the conversion rate of safety education and training to safety awareness play a crucial role in reducing the risk level of system. The above analysis gave support to H3.

5. Conclusions

Based on the identification of risk factors in port operation and interaction exploration between safety investment and risk level of the system, a decision-making model of safety investment by using SD is established to control and manage the risk level of the system. The model is verified and validated by an illustration. In this paper, the results indicated that the hypotheses HI, H2, and H3 have been confirmed.
  • Risk factors influencing the port safety operation were identified from human, facility and equipment, management, and environment by in-depth interviews with experienced practitioners and researchers interested in port operation and management, and by referring to the ideas and theories in some related document, which was the basis of exploring the relationship between the influencing factors. H1 was confirmed, systemically identifying the risk factors relating to port safety operation from a systematic perspective.
  • A risk management and control model of port safety operation was built with SD based on the causal diagram of influencing factors established. By observing the development tendency and evolution process of risk level in the port operation, it revealed the feedback mechanism between the risk level of port operation system and safety input. H2 was confirmed, establishing that the causal diagram between investment on the risk factors and system risk level is easy to understand and modelling the risks in port safety operation.
  • By sensitivity analysis, it was revealed that investment on the human subsystem can cause the risk level to decrease rapidly and produce the best effect, followed by the management subsystem, while adjusting the safety investment for subsystem, safety input distribution ratio, and improving the conversion rate. Specifically, the safety investment should be expanded in human and management, especially in safety education and training and safety culture construction, which could contribute more to the reduction of risk level of the port operation. H3 was confirmed, i.e., investment on human and management subsystems could make the system risk level decrease rapidly and produce the better effects than the other two subsystems.
  • The SD method is implemented to simulate the safety investment strategy of port enterprises, and the information feedback mechanism between the safety investment and the level of system risk is clarified. It can provide a new methodology for port enterprises to carry out risk management and decision-making. However, safety in production is dynamic in port operation. Even if the same investment policy may have different effects, this depends on the effectiveness of implementation. Hence, how to make use of safety investment is still an issue that needs to be discussed further.

Author Contributions

Conceptualization, H.W.; methodology, J.S.; validation, J.S.; formal analysis, J.S.; data curation, J.C.; writing—original draft preparation, J.S.; writing—review and editing, H.W. and J.C.; funding acquisition, H.W. All authors have read and agreed to the published version of the manuscript.

Funding

The research was funded by National Office for Philosophy and Social Sciences, grant number 14GBL133.

Conflicts of Interest

The authors declare no conflict of interest.

References

  1. Mabrouki, C.; Bentaleb, F.; Mousrij, A. A decision support methodology for risk management within a port terminal. Saf. Sci. 2014, 63, 124–132. [Google Scholar] [CrossRef]
  2. Alises, A.; Molina, R.; Gómez, R.; Pery, P.; Castillo, C. Overtopping hazards to port activities: Application of a new methodology to risk management (Port Risk Management Tool). Reliab. Eng. Syst. Saf. 2014, 123, 8–20. [Google Scholar] [CrossRef]
  3. Alyami, H.; Yang, Z.; Riahi, R.; Bonsall, S.; Wang, J. Advanced uncertainty modelling for container port risk analysis. Accid. Anal. Prev. 2019, 123, 411–421. [Google Scholar] [CrossRef]
  4. John, A.; Paraskevadakis, D.; Bury, A.; Yang, Z.; Riahi, R.; Wang, J. An integrated fuzzy risk assessment for seaport operations. Saf. Sci. 2014, 68, 180–194. [Google Scholar] [CrossRef] [Green Version]
  5. Ozbas, B. Safety Risk Analysis of Maritime Transportation: Review of the Literature. Transp. Res. Rec. 2013, 2326, 32–38. [Google Scholar] [CrossRef]
  6. Yip, T.L. Port traffic risks—A study of accidents in Hong Kong waters. Transp. Res. Part E Logist. Transp. Rev. 2008, 44, 921–931. [Google Scholar] [CrossRef]
  7. Wachter, J.K.; Yorio, P.L. A system of safety management practices and worker engagement for reducing and preventing accidents: An empirical and theoretical investigation. Accid. Anal. Prev. 2014, 68, 117–130. [Google Scholar] [CrossRef] [Green Version]
  8. Fabiano, B.; Currò, F.; Reverberi, A.P.; Pastorino, R. Port safety and the container revolution: A statistical study on human factor and occupational accidents over the long period. Saf. Sci. 2010, 48, 980–990. [Google Scholar] [CrossRef]
  9. Hou, Z.; Zhao, P. Structure Optimization of Safety Investment of Petrochemical Port Enterprises. Math. Probl. Eng. 2017, 2017, 1–5. [Google Scholar] [CrossRef] [Green Version]
  10. Yang, Z.; Ng, A.K.Y.; Lee, P.T.-W.; Wang, T.; Qu, Z.; Sanchez Rodrigues, V.; Lau, Y.-Y. Risk and cost evaluation of port adaptation measures to climate change impacts. Transp. Res. Part D Transp. Environ. 2018, 61, 444–458. [Google Scholar] [CrossRef]
  11. Kwesi-Buor, J.; Menachof, D.A.; Talas, R. Scenario analysis and disaster preparedness for port and maritime logistics risk management. Accid. Anal. Prev. 2019, 123, 433–447. [Google Scholar] [CrossRef] [PubMed]
  12. Li, C.; Ren, J.; Wang, H. A system dynamics simulation model of chemical supply chain transportation risk management systems. Comput. Chem. Eng. 2016, 89, 71–83. [Google Scholar] [CrossRef]
  13. Richardson, G.P. Reflections on the foundations of system dynamics. Syst. Dyn. Rev. 2011, 27, 219–243. [Google Scholar] [CrossRef]
  14. Liu, P.; Liu, C.; Du, J.; Mu, D. A system dynamics model for emissions projection of hinterland transportation. J. Clean. Prod. 2019, 218, 591–600. [Google Scholar] [CrossRef]
  15. Torres, J.P.; Kunc, M.; O’Brien, F. Supporting strategy using system dynamics. Eur. J. Oper. Res. 2017, 260, 1081–1094. [Google Scholar] [CrossRef]
  16. International Shipping Federation. Safety Culture Is Enlightened Self- Interest; Maritime International Secretariat Services Ltd.: London, UK, 2011. [Google Scholar]
  17. International Maritime Organization. MSC77/17—Role of the Human Element; IMO: London, UK, 2003. [Google Scholar]
  18. Corrigan, S.; Kay, A.; Ryan, M.; Ward, M.E.; Brazil, B. Human factors and safety culture: Challenges and opportunities for the port environment. Saf. Sci. 2019, 119, 252–265. [Google Scholar] [CrossRef]
  19. Berg, H.P. Human Factors and Safety Culture in Maritime Safety (revised). Trans. Nav. Int. J. Mar. Navig. Saf. Sea Transp. 2013, 7, 343–352. [Google Scholar] [CrossRef]
  20. Weick, K.E.; Sutcliffe, K.M. Managing the Unexpected: Assuring High Performance in an Age of Complexity; JosseyBass, a John Wiley & Sons. Inc. Company: San Francisco, CA, USA, 2001. [Google Scholar] [CrossRef] [Green Version]
  21. Rusconi, C. Interactive Training, a Methodology for Improving Safety Culture. In Proceedings of the International Experts’ Meeting on Human and Organizational Factors in Nuclear Safety in the Light of the Accident at the Fukushima Daiichi Nuclear Power Plant, Vienna, Austria, 21–24 May 2013. [Google Scholar]
  22. Darbra, R.M.; Crawford, J.F.E.; Haley, C.W.; Morrison, R.J. Safety culture and hazard risk perception of Australian and New Zealand maritime pilots. Mar. Policy 2007, 31, 736–745. [Google Scholar] [CrossRef] [Green Version]
  23. Zheng, Z.Y.; Huang, Z.G.; Wu, Z.L. Relationship Analysis of Port Traffic Accidents and Port Environment Factors. J. Traffic Transp. Eng. 2006, 1. [Google Scholar] [CrossRef]
  24. Gordon, R.; Kirwan, B.; Perrin, E. Measuring safety culture in a research and development centre: A comparison of two methods in the Air Traffic Management domain. Saf. Sci. 2007, 45, 669–695. [Google Scholar] [CrossRef]
  25. Bauk, S.; Schmeink, A.; Colomer, J. An RFID model for improving workers’ safety at the seaport in transitional environment. Transport 2018, 33, 353–363. [Google Scholar] [CrossRef] [Green Version]
  26. Bauk, S.; Schmeink, A.; Colomer, J. Employing wireless networks in enhancing occupational safety at the developing seaport–two proposals. Pol. Marit. Res. 2017, 24, 115–124. [Google Scholar] [CrossRef] [Green Version]
  27. Lertpattarapong, C. Applying System Dynamics Approach to the Supply Chain Management Problems. Master’s Thesis, Massachusetts Institute of Technology, Cambridge, MA, USA, 2002. [Google Scholar]
  28. Saaty, T.L. Decision making with the analytic hierarchy process. Int. J. Serv. Sci. 2008, 1, 83–98. [Google Scholar] [CrossRef] [Green Version]
Figure 1. Hierarchical decomposition of port operation safety analysis.
Processes 08 01235 g001
Figure 2. Causal loop diagram of the system.
Processes 08 01235 g002
Figure 3. Flowchart of the system.
Processes 08 01235 g003
Figure 4. Diagram of model test.
Processes 08 01235 g004
Figure 5. Change of risk level–safety investment.
Processes 08 01235 g005
Figure 6. Contrast diagram of risk level under change of safety investment.
Processes 08 01235 g006
Figure 7. Contrast diagram of risk level under change of distribution ratio.
Processes 08 01235 g007
Figure 8. Contrast diagram of risk level under change of conversion rate.
Processes 08 01235 g008
Table 1. Main variables and functions.
VariableFunction
safety inputINTEG (variation of safety input, initial value)
variation of safety inputIF THEN ELSE (risk level of the system > target safety level, monthly input,0)
risk level of the systemhuman risk level × QZ1 + management risk level × QZ2+equipment risk level × QZ3+environmental risk level × QZ4
risk level of humanINTEG (variation of human risk level, initial value)
variation of human risk levelSafety awareness × QZ5 + skills and experience × QZ6 + physical and psychological states × QZ7
safety awarenesssafety education and training × conversion rate A3
skills and experienceintroduction of professionals × conversion rate A2
physical and psychological statesimprovement of working environment × conversion rate A1
risk level of equipment INTEG (variation of equipment risk level, initial value)
variation of equipment risk leveleffectiveness of production equipment × QZ8 + reliability of fire-fighting and monitoring equipment × QZ9 + completeness of safety protection facilities × QZ10
effectiveness of production equipmentSMOOTHI (investment in maintenance × QZ11 + investments in purchase × QZ12,1,0)
reliability of firefighting and monitoring equipmentSMOOTHI (investment in maintenance × QZ13,1,0)
completeness of safety protection facilitiesSMOOTHI (investments in purchase × QZ14,1,0)
risk level of managementINTEG (variation of management risk level, initial value)
variation of management risk levelconstruction of safety culture × QZ15 + management level of outsourcing business × QZ16 + degree of information sharing × QZ17 + emergency management level × QZ18
construction of safety cultureSafety input for management risk◊QZ15◊conversion rate A4
management level of outsourcing businessSafety input for management risk◊QZ16◊conversion rate A5
degree of information sharingSafety input for management risk◊QZ17◊conversion rate A6
emergency management levelSafety input for management risk◊QZ18◊conversion rate A7
risk level of environmentINTEG(variation of environment risk level, initial value)
Note: QZi represents the corresponding weight in the formula.
Table 2. Comparison matrix of risk level of system.
AijHumanEquipmentManagementEnvironment
Human1246
Equipment1/411/33/2
Management1/2315
Environment1/61/52/31
Table 3. Corresponding weights of factors and variables.
FactorsVariablesCorresponding Weight
Human (0.486)Safety awareness0.407
Skills and experience0.357
Physical and psychological states0.236
Equipment (0.115)Effectiveness of production equipment0.411
Reliability of firefighting and monitoring equipment0.306
Completeness of safety protection equipment0.283
Management (0.320)Construction of safety culture0.334
Degree of information sharing0.243
Management level of outsourcing business0.316
Emergency management level0.107
Environment (0.078)Maintenance of waterway1
Note: Port investment could be put into maintenance of waterway to improve the navigation condition. Other criteria, including high density of vessel traffic flow, poor hydrological conditions, and extreme weather in the environment, are not sensitive to the time. In order to simplify the model, those criteria not sensitive to time are the constant in this paper.

