Article

Synergistic Effect on the Non-Oxygenated Fraction of Bio-Oil in Thermal Co-Pyrolysis of Biomass and Polypropylene at Low Heating Rate

by
Dijan Supramono
,
Adithya Fernando Sitorus
and
Mohammad Nasikin
*
Department of Chemical Engineering, Universitas Indonesia, Depok, Jawa Barat 16424, Indonesia
*
Author to whom correspondence should be addressed.
Processes 2020, 8(1), 57; https://doi.org/10.3390/pr8010057
Submission received: 29 November 2019 / Revised: 30 December 2019 / Accepted: 31 December 2019 / Published: 2 January 2020
(This article belongs to the Special Issue Processes for Bioenergy and Resources Recovery from Biowaste)

Abstract

:
Biomass pyrolysis and polypropylene (PP) pyrolysis in a stirred tank reactor exhibited different heat transfer phenomena whereby heat transfer in biomass pyrolysis was driven predominantly by heat radiation and PP pyrolysis by heat convection. Therefore, co-pyrolysis could exhibit be expected to display various heat transfer phenomena depending on the feed composition. The objective of the present work was to determine how heat transfer, which was affected by feed composition, affected the yield and composition of the non-polar fraction. Analysis of heat transfer phenomena was based on the existence of two regimes in the previous research in which in regime 1 (the range of PP composition in the feeds is 0–40%), mass ejection from biomass particles occurred without biomass particle swelling, while in regime 2 (the range of PP composition in the feeds is 40–100%), mass ejection was preceded by biomass particle swelling. The co-pyrolysis was carried out in a stirred tank reactor with heating rate of 5 °C/min until 500 °C and using N2 gas as carrier gas. Temperature measurement was applied to pyrolysis fluid at the lower part of the reactor and small biomass spheres of 6 mm diameter to simulate heat transfer to biomass particles. The results indicate that in regime 1 convective and radiative heat transfers sparingly occurred and synergistic effect on the yield of non-oxygenated phase increased with increasing convective heat transfer at increasing %PP in feed. On the other hand, in regime 2, convective heat transfer was predominant with decreasing synergistic effect at increasing %PP in feed. The optimum PP composition in feed to reach maximum synergistic effect was 50%. Non-oxygenated phase portion in the reactor leading to the wax formation acted as donor of methyl and hydrogen radicals in the removal of oxygen to improve synergistic effect. Non-oxygenated fraction of bio-oil contained mostly methyl comprising about 53% by mole fraction, while commercial diesel contained mostly methylene comprising about 59% by mole fraction

1. Introduction

Biomass can be treated via pyrolysis to form bio-oil which may be used as an alternative fuel with some modifications. High oxygen content in the bio-oil is a major constraint for its application as a fuel because it leads to bio-oil instability, strong tendency to re-polymerize and low heating value [1,2]. Co-pyrolysis of biomass and polypropylene (PP) plastic can be applied to synthesize bio-oil with lower oxygen content. PP as an olefinic plastic which has high H/C mole ratio, can be a potential hydrogen source for oxygen removal and saturation of alkenes in bio-oil [3]. If co-pyrolysis were to produce bio-oil with viscosity in the same order of magnitude as those of commercial fuels and the non-oxygenated fraction in the bio-oil could easily be separated from the oxygenated fraction, the co-pyrolysis would expedite the utilization of the non-oxygenated fraction from biomass as biofuel. Other applications of biomass are the manufacture of metal-matrix composites (MMC). Some biomass materials such as rice husk, bagasse, ramie, and rattan can be used as reinforcements for MMCs, while rice husk ash, maize stalk ash and palm oil fuel ash can be used as both matrices and reinforcements for MMCs [4]. The utilization of biomass as reinforcements is possible due to the high cellulose composition of the biomass.
The term of ‘synergistic effect’ has been commonly used to describe how thermal co-pyrolysis improves the yield of bio-oil, not the yield of non-polar fraction of bio-oil. Abnisa and wan Daud [3] in their review on co-pyrolysis of biomass noted that the synergistic effect gives two benefits: the first, there is an increase of the liquid yield obtained from co-pyrolysis of equal-mass feeds compared that obtained from pyrolysis of biomass alone, and the second, the calorific value of the co-pyrolysis bio-oil is higher than that obtained from pyrolysis of biomass alone. Thermal co-pyrolysis of biomass and PP leads to higher bio-oil yield due to the free radical interaction of both feed charges [3]. The hydrogen transfer from PP as a hydrogen donor to biomass as hydrogen acceptor reduces the presence of oxygenated compounds in bio-oil via dehydration, decarboxylation and decarbonylation by expelling oxygen in the forms of water, CO2 and CO gases [5,6]. However, all research works under their review which are undertaken at low heating rate do not study how much the non-polar fraction portion is increased as a result of the synergistic effect of co-pyrolysis. Synergistic effect to acquire the highest conversion from polar fraction to non-polar fraction is expectedly affected by heat transfer and composition of plastics as hydrogen donor to the co-pyrolysis of biomass and plastics.
Supramono et al. [7] have produced bio-oil with separated non-oxygenated and oxygenated compound fractions as a result of thermal co-pyrolysis using corn cobs and PP in a stirred tank reactor at a low heating rate. This separation allows calculating how much portion of the bio-oil is separated into non-oxygenated and oxygenated fractions and allows chemical analysis to be conducted on each fraction. The separation was suspected to occur due to low formation of polyaromatic hydrocarbons and low molecular weight compounds [8]. Oxygenated and non-oxygenated compounds tend to separate [9]. With low molecular weight and consequently low average viscosity of the fluid, phase separation occurs easily [10]. Rapid cooling (quenching) during condensation of vapor pyrolysis product accelerated the phase separation [11]. Phase separation was not encountered in other co-pyrolysis works both at low heating rate conducted in fixed bed reactor [12,13,14] and in an auger reactor [15,16,17] and at high heating experiments conducted in a fluidized bed [18,19].
The synergistic effect depends on the extent of the contact between materials and is more likely to occur when pyrolysis is carried out in a fixed-bed reactor than in a fluidized-bed reactor [20]. The co-pyrolysis work by Supramono [7] in a stirred tank reactor allows intimate contact between biomass and PP. To improve the synergy between biomass and PP in co-pyrolysis, the formation of secondary pyrolysis reaction products of biomass which contains mostly low molecular weight compounds derived from lignin [21,22] is required, as implied by the work of Zhou et al. [23]. More secondary pyrolysis reactions occur in pyrolysis undertaken at low heating rate which provide sufficient residence time for further pyrolysis [24].
Heat transfer in co-pyrolysis at low heating rate should provide intense interactions between the low molecular weight compounds of the biomass and plastic pyrolysis products to reach synergy. During pyrolysis, cellulose undergoes swelling due to the interaction between cellulose and softening lignin [25]. At low heating rate softening of lignin occurs over large span of temperature from 150 to 450 °C [26]. In a condition where biomass particles are enclosed with plastic melt in co-pyrolysis of biomass-plastic, mass transfer of biomass pyrolysis products to plastic melt is inhibited. This limited mass transfer extends the pyrolysis reactions toward secondary reaction including dehydration, decarboxylation and decarbonylation and repolymerisation [24]. As the temperature increases during slow pyrolysis, products of biomass pyrolysis are ejected to melting plastics in which high ejection results in high interaction of biomass and plastic pyrolysis products favoring synergy. Serio et al. [27]) suggested that lignin softening is hindered by crosslinking before bridge breaking of lignin which affects the ejection.
In co-pyrolysis conducted in a stirred tank reactor, heat transfer is driven by radiation and convection. In two extreme conditions, i.e., biomass pyrolysis and plastic pyrolysis, the former is more affected by heat radiation due to the presence of moderate emissivity of biomass and the later by heat convection because plastic melt induces high heat convection during its friction on the reactor hot wall [28]. Therefore, co-pyrolysis involves both heat radiation and heat convection with different proportions depending on the compositions of biomass-plastic feeds of the reactor.
It also has been found that before 300 °C there are two regimes in terms of mass ejection in which co-pyrolysis using feed with PP content less than 50% (regime 1), biomass particles transport their pyrolytic products to the surrounding plastic melt with slight mass ejection through large pores during particle contraction, and that with PP content equal and more than 50% (regime 2) in which particle swelling occurs before particle contraction where pyrolysis fluid comes out of biomass particles as jets through small pores supposedly at high velocity [29]. According to Zonta and Soldati [30], expansion of the fluid bulk enhances convective heat transfer. In the case of regime 2, the expansion occurs due to biomass particle swelling and high velocity mass ejection. The ejection of mass must be preceded by the cracking of biomass and influenced by heat transfer during co-pyrolysis to allow cracking of biomass components. Baliga et al. [31] found that at low heating rate, lignin and xylan form melting residue during early time of pyrolysis. Some researchers agreed that volatile formed during pyrolysis pushes the melting material so that the material is swelling [32].
In authors’ best knowledge, no publication has addressed how feed composition influencing heat transfer affects the yield and composition of non-polar fraction of bio-oil produced by co-pyrolysis of biomass and PP at low heating rate. In order to analyze the effect of heat transfer and PP composition in feed during co-pyrolysis, the presence of two separate fractions i.e., non-oxygenated (non-polar) and oxygenated (polar) fractions is important to observe how much the portion of oxygenated fraction is converted to non-oxygenated fraction as a result of co-pyrolysis compared to the portion of oxygenated fraction as a result of biomass pyrolysis. The aim of the present research on synergistic effect to improve the portion of non-polar bio-oil in co-pyrolysis of biomass-plastics is to investigate how heat transfer affected by feed composition determines the hydrogen transfer from plastic to biomass pyrolysis products to produce more non-polar fraction. The present work would be beneficial for other biomass in herbaceous biomass group where they contain arabinoxylans as major polysaccharide in hemicellulose, comprise similar composition of cellulose and contain all three phenylpropane units in lignin, i.e., hydroxyphenyl, syringyl, and guaiacyl.

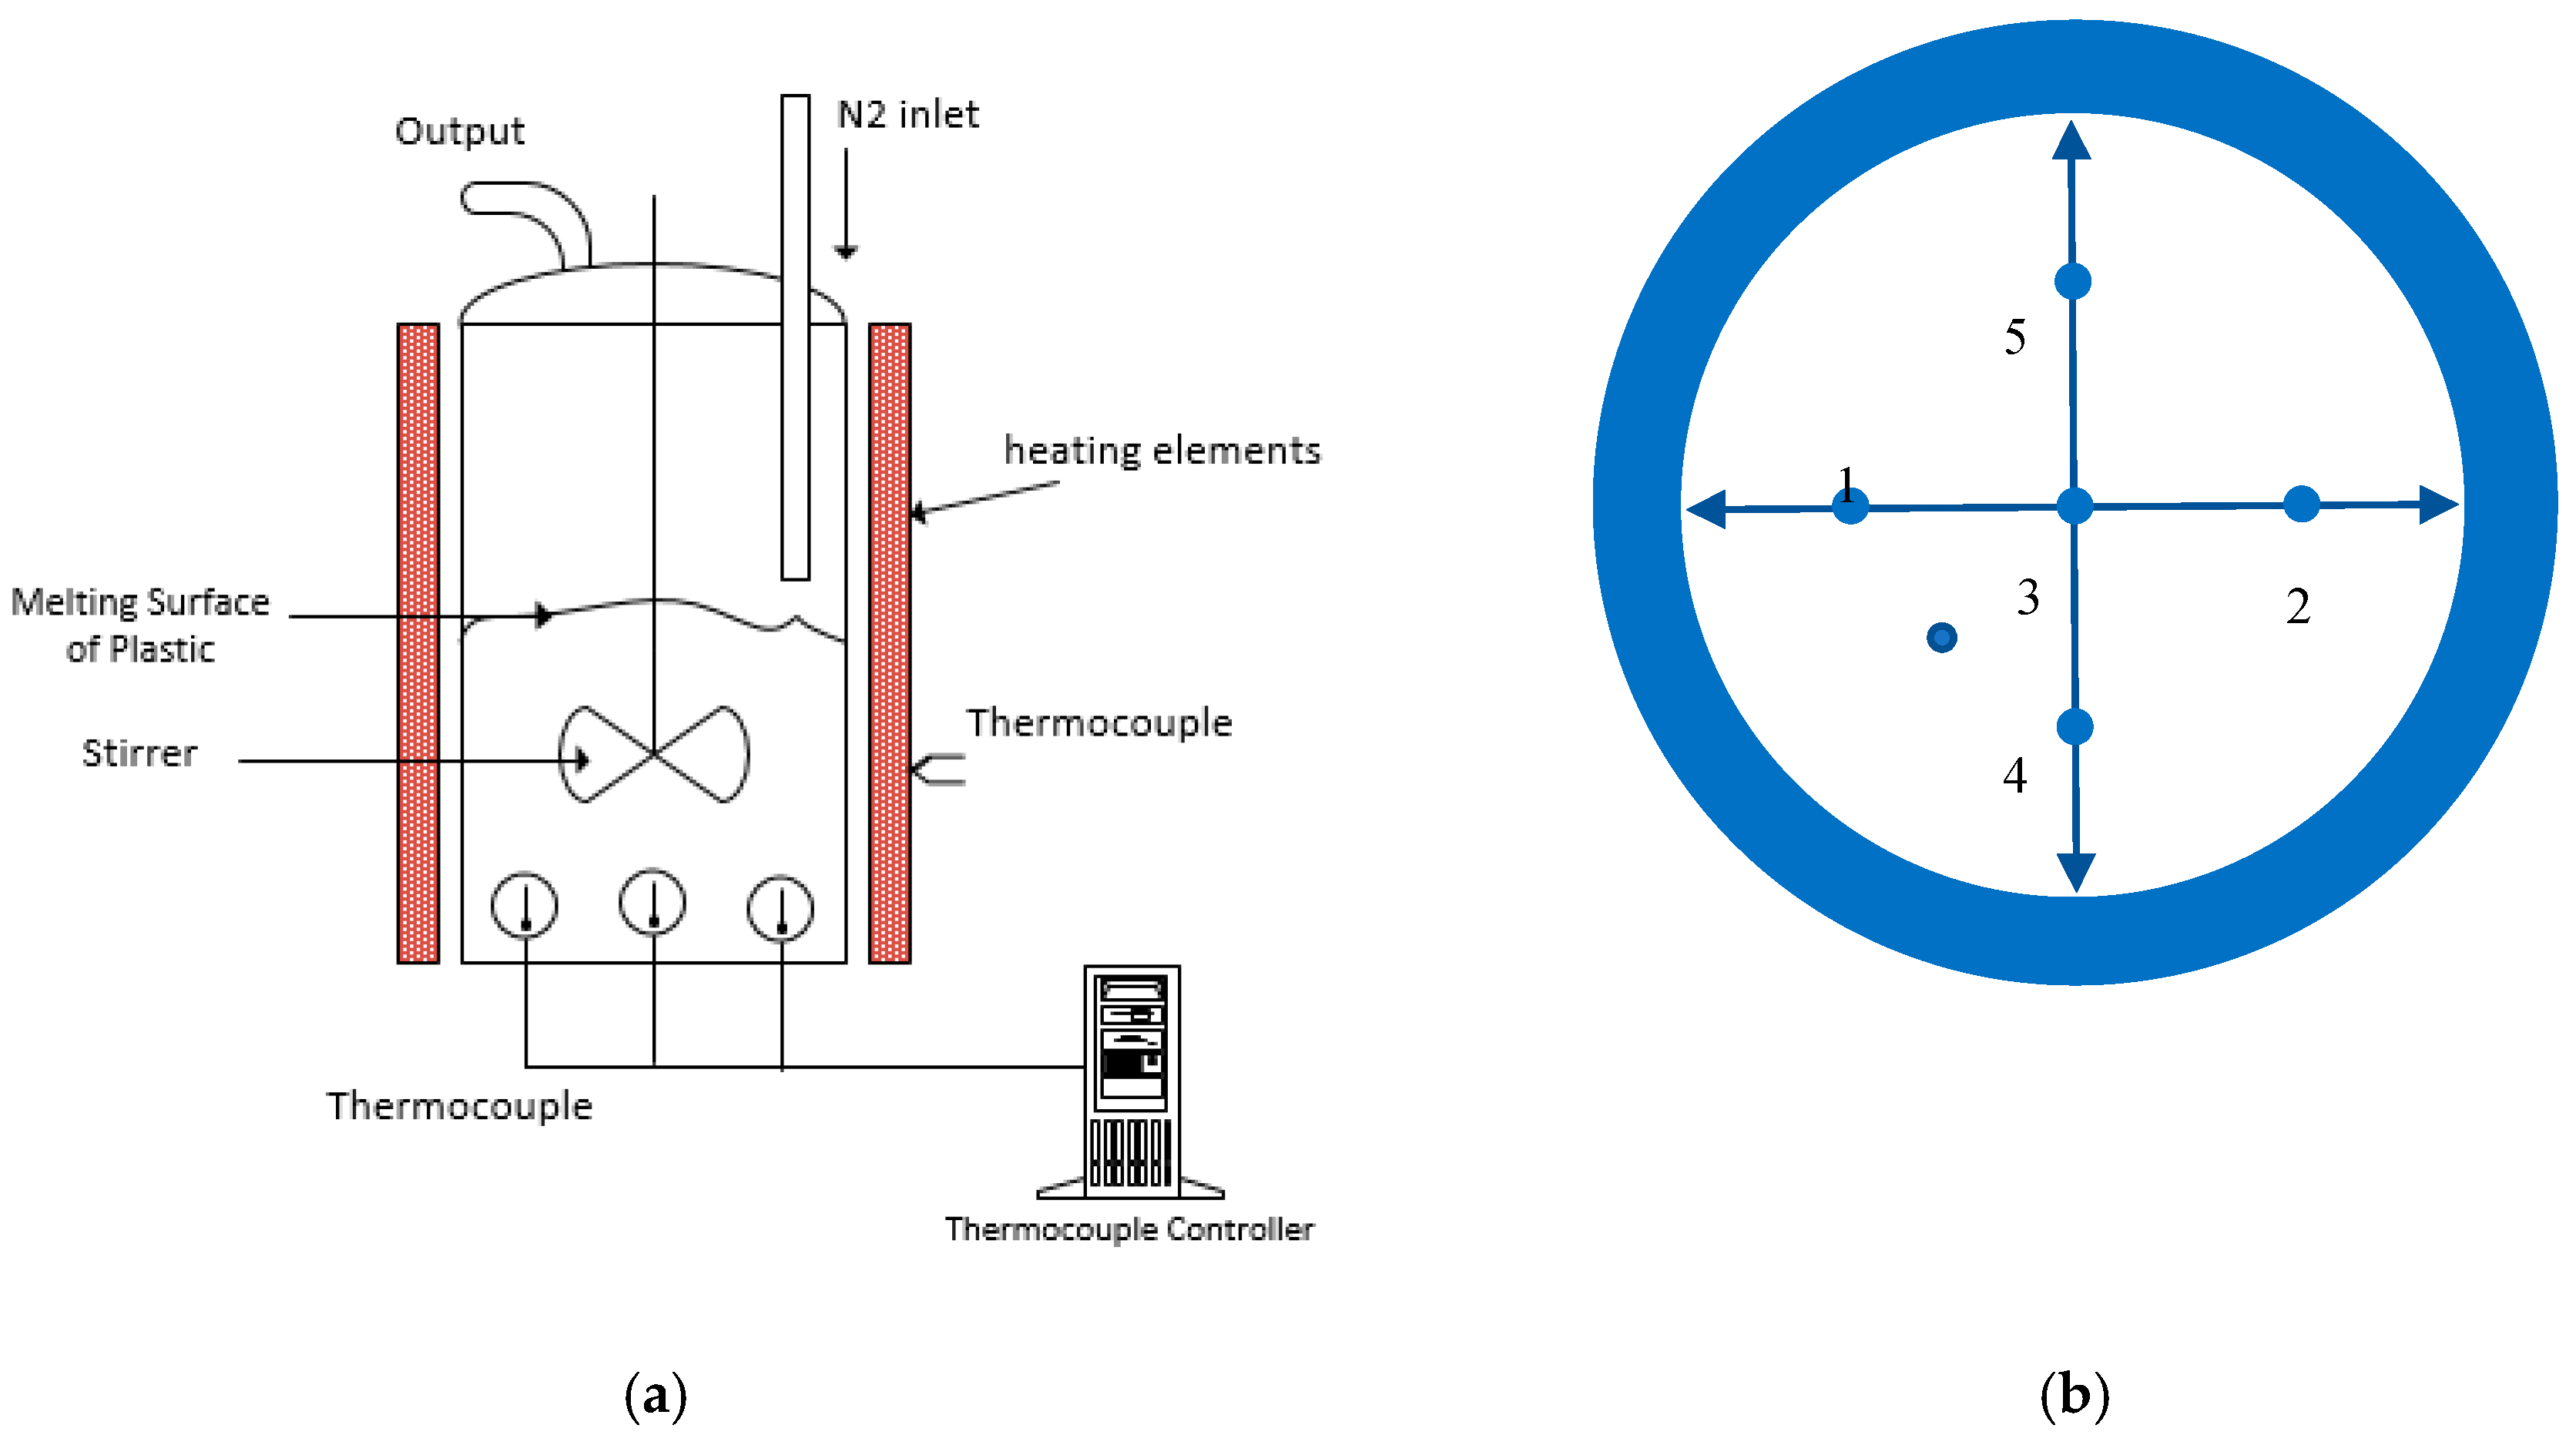
2. Material and Method

In each run, five thermocouples were inserted to the bottom of the reactor (see Figure 1a), three of which can be used to measure temperatures of small biomass spheres pierced by the tip of the thermocouples as well as to measure temperatures of pyrolysis fluid by exposing the tip of the thermocouples to the pyrolysis fluid. Figure 1b shows the numbering of thermocouple positions. Before being used, all thermocouples were calibrated to a thermocouple calibrator based on ASTM standard E220-1986.
Corn cob particles of 8–50 mesh (300–2380 microns) were used as biomass feedstock, while PP granules of 2.0 mm average size were of virgin PP type and used as plastic feedstock. Moisture content of biomass feed for the experiment was adjusted to be between 9 to 10% dry basis.
In the present work, a stirred tank reactor was used to carry out co-pyrolysis reactions equipped with a carrier gas of N2 and a stirrer. The reactions proceeded under conditions that heating rate was 5 °C /min from ambient temperature to 500 °C, holding time at maximum temperature was 10 min, impeller stirring rotation was 100 rpm and flow of N2 was kept at 750 mL/min. The reactor of a vertical cylindrical shape has height of 200 mm and inside diameter of 100 mm. On the outer sides of cylindrical reactor wall and bottom of the reactor, a furnace with heating elements were installed. Temperature of pyrolysis material was sensed by a temperature controller to control power supply to the reactor furnace. The tip of N2 gas pipe was positioned downward near the bottom of the reactor. Condensable vapor and non-condensable gases flowed out of the reactor lid towards two condensers installed in series where the condensable vapor was condensed to a bio-oil container, while the non-condensable gas was allowed to go out to open air. Experiment has been carried out triplicate at feed compositions of 0%, 50%, and 100%PP to verify the consistence of bio-oil yield. The standard deviations of bio-oil yields derived from co-pyrolysis involving 0%, 50% and 100%PP in feeds respectively were 6.82%, 5.65% and 1.53%.
The present work involved bio-oil composition analysis using H-NMR spectroscopy. It was used to analyze chemical bond compositions in non-oxygenated bio-oil and wax samples taken from biomass pyrolysis and co-pyrolysis involving feed containing 12.5%, 25%, 50%, 75%, and 100%PP. The H-NMR spectrometer manufactured by Agilent Technology worked at frequency of 500 MHz for the non-oxygenated bio-oil and wax. Chloroform was used as solvent for non-oxygenated samples. The 1H-NMR data of the non-oxygenated fraction can be used to determine branching index (BI) calculated using formula proposed by Yan et al. [33] as shown in Equation (1):
B I = [ ( 1 3 ) S C H 3 ] ( 1 2 S C H 2 + S C H )
where S C H 3 S C H 2 and SCH are % amount of protons in CH3, CH2 and CH, respectively

3. Results and Discussion

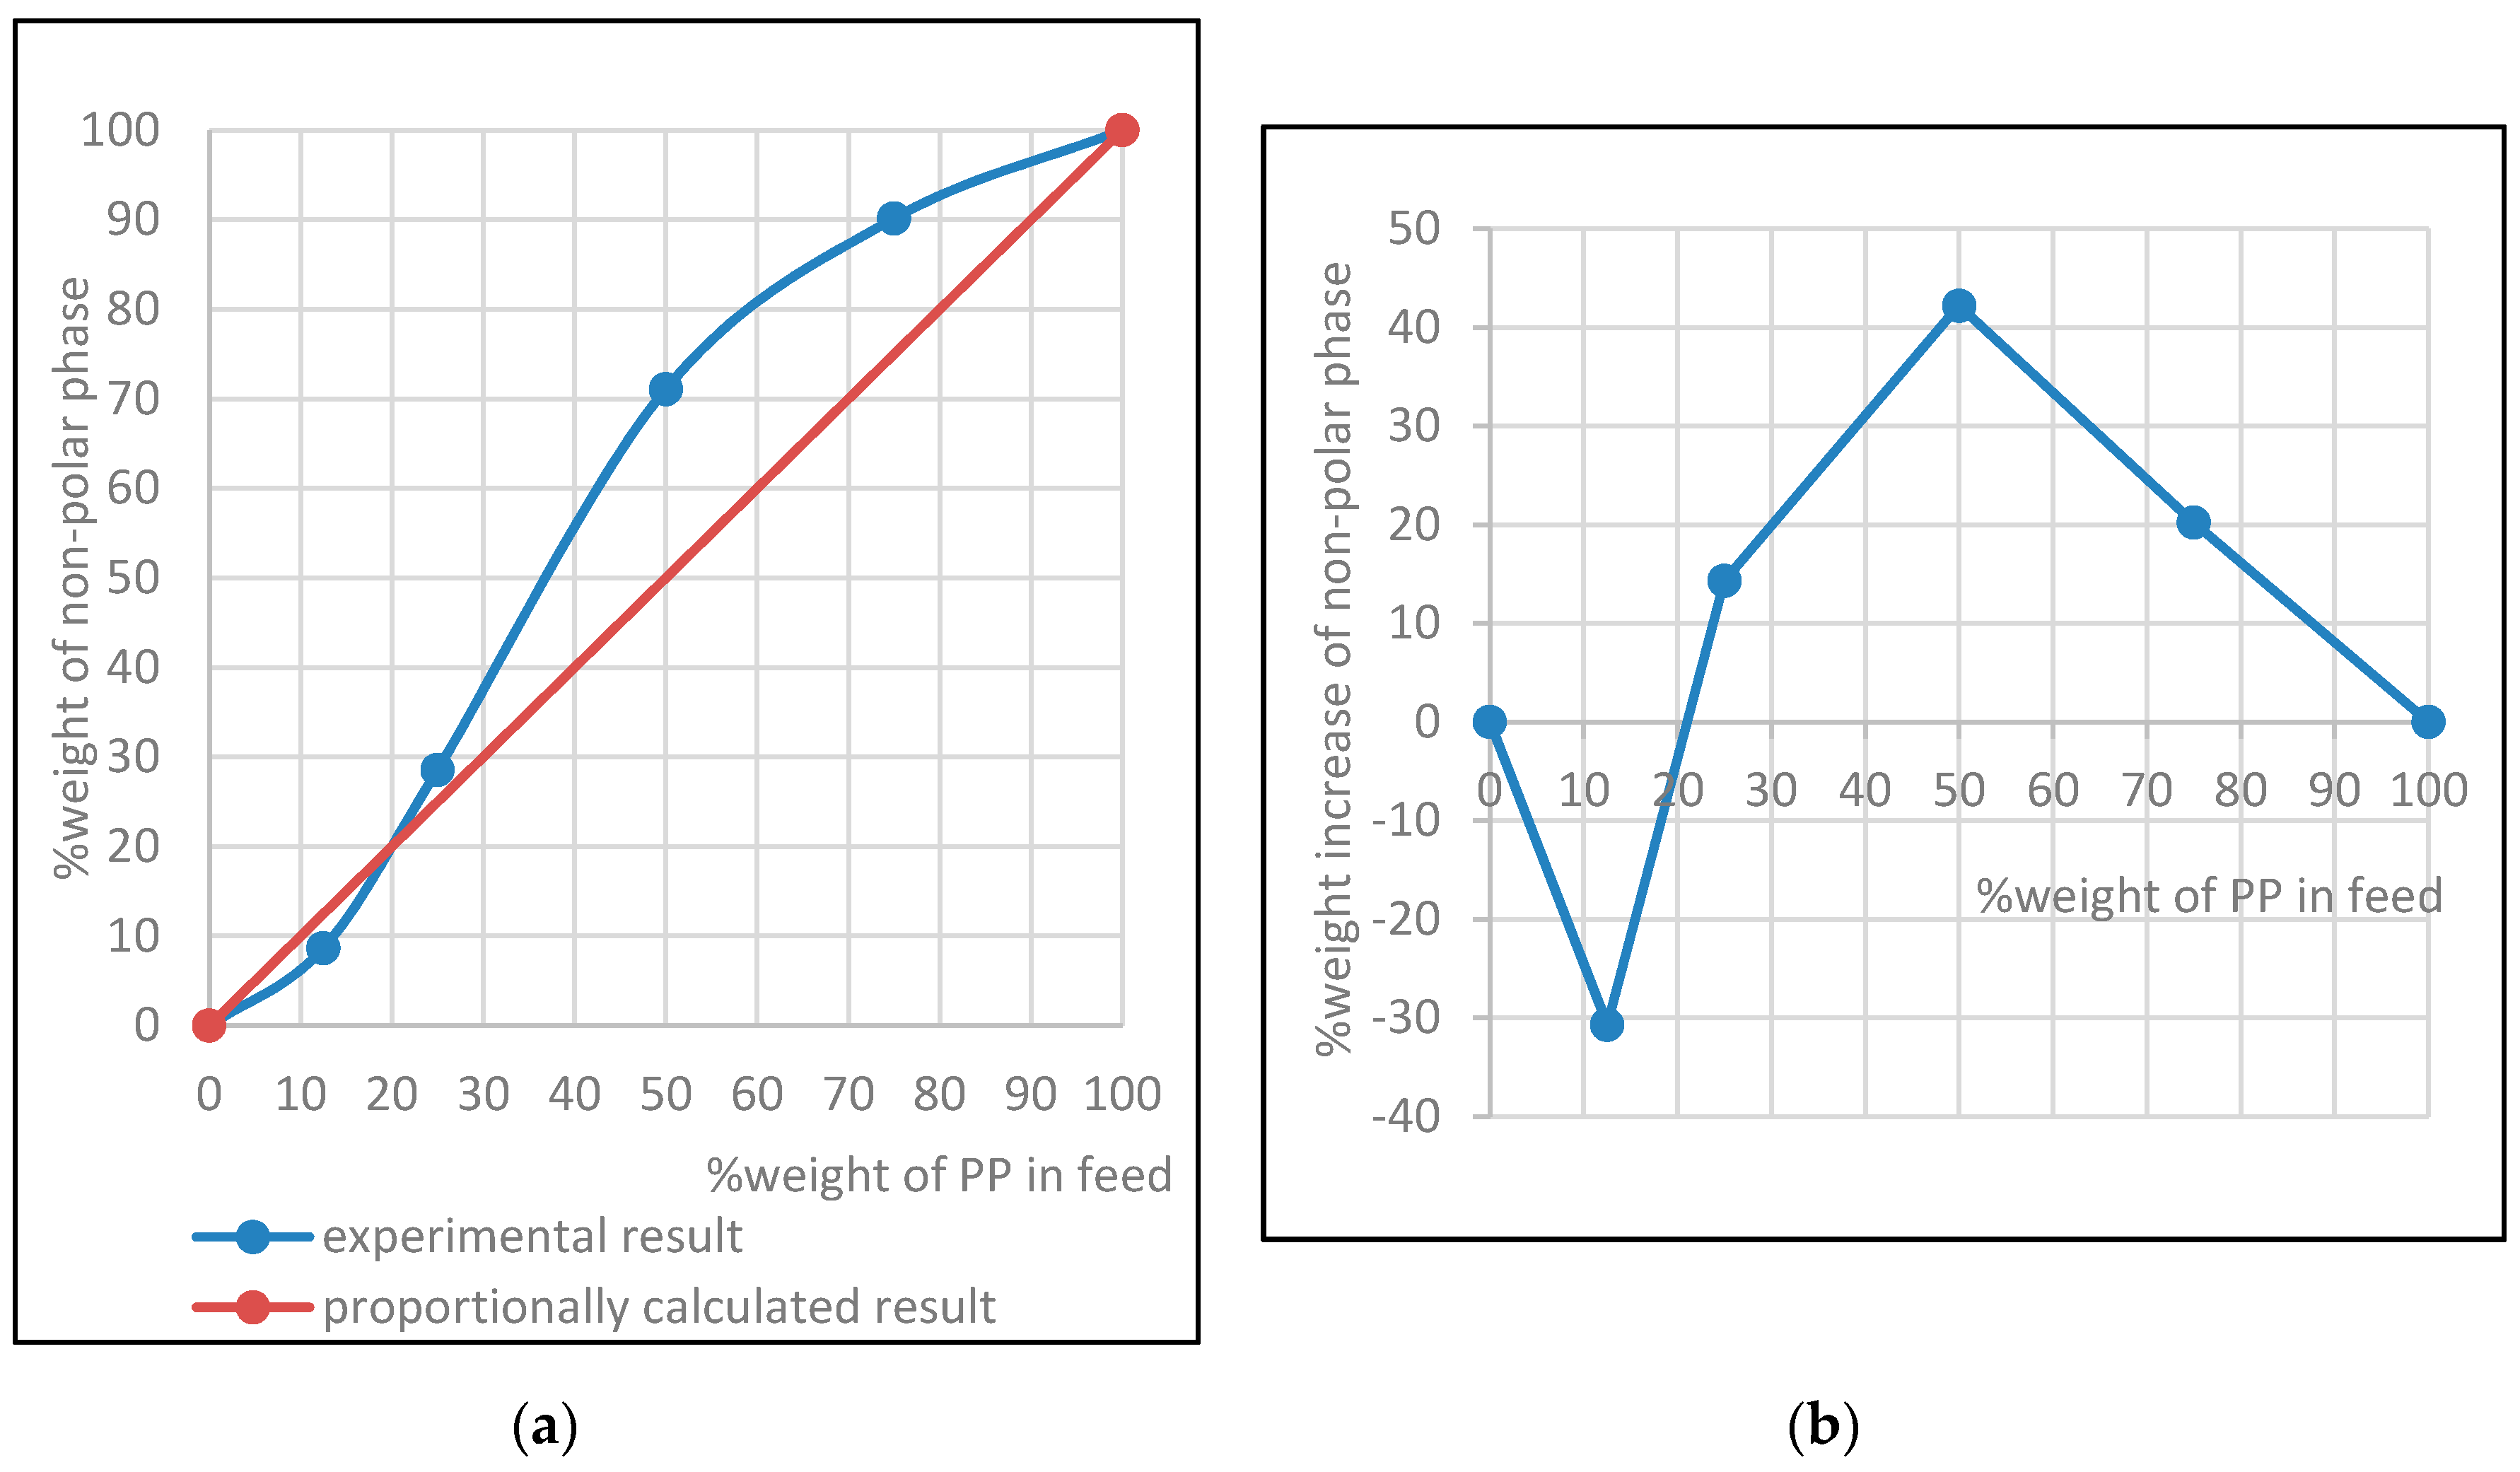
3.1. Non-Oxygenated Fraction in Bio-Oil

Figure 2a shows the portions of non-polar phase in bio-oil as the composition of PP in the feedstock was increased. By increasing the composition of PP, the portion of non-polar phase was also increased. Figure 2b, constructed based on data in Figure 2a, demonstrates the synergistic effect of co-pyrolysis on the portion of non-polar phase, where at the composition of PP in the feed more than 22%, the experimental portions of non-polar in the bio-oil were above the portions obtained proportionally between portions of the non-polar phase obtained from pyrolysis of pure biomass and pure PP (proportionally-calculated portion). Co-pyrolysis undertaken using feedstock with 50%PP attained the highest conversion of polar phase into non-polar phase.
Figure 2b also shows that when the composition of PP was less than about 22%, the co-pyrolysis adversely reduced the portion of non-polar phase below proportionally-calculated portion of the non-polar phase based on non-polar portions obtained from pure biomass and plastic pyrolysis. Therefore, some portion of non-polar phase was converted into the polar phase. Figure 2b implies that in terms of chemistry there may be three regimes in the co-pyrolysis as the PP composition in the feed was varied, i.e., regime 1 covering %PP range from 0 to 22%, regime 2 from 22% to 50%, and regime 3 within %PP range from 50% to 75%.
Negative synergy at co-pyrolysis involving 12.5% PP may have occurred due to the presence of high amounts of hydroxyl radicals as a result of cellulose pyrolysis in which the radicals behaved as strong oxidizers [34]. In the oxidative environment in regime 1, the activation energy of PP pyrolysis is significantly reduced [35] and its pyrolysis produces more non-condensable gas yield [36] and consequently less yield of non-polar phase as indicated in Figure 2a,b. It seems that oxidative pyrolysis of PP induces end-chain scission to produce small molecule compounds. By comparison, for co-pyrolysis with equal portion of feed charges, Xue et al. [18] found that at high heating rate co-pyrolysis between each of cellulose, xylan and lignin with polyethylene (PE) using fluidized beds results in positive synergy on the yields of olefin and alkanes with the highest synergy occurring in co-pyrolysis of PE and lignin. In this case, catalyst of HZSM5 is used to improve pyrolysis vapor. Therefore, the existence of high composition of hydroxyl in co-pyrolysis involving biomass-rich feed inhibits positive synergy to convert biomass into non-oxygenated compounds.

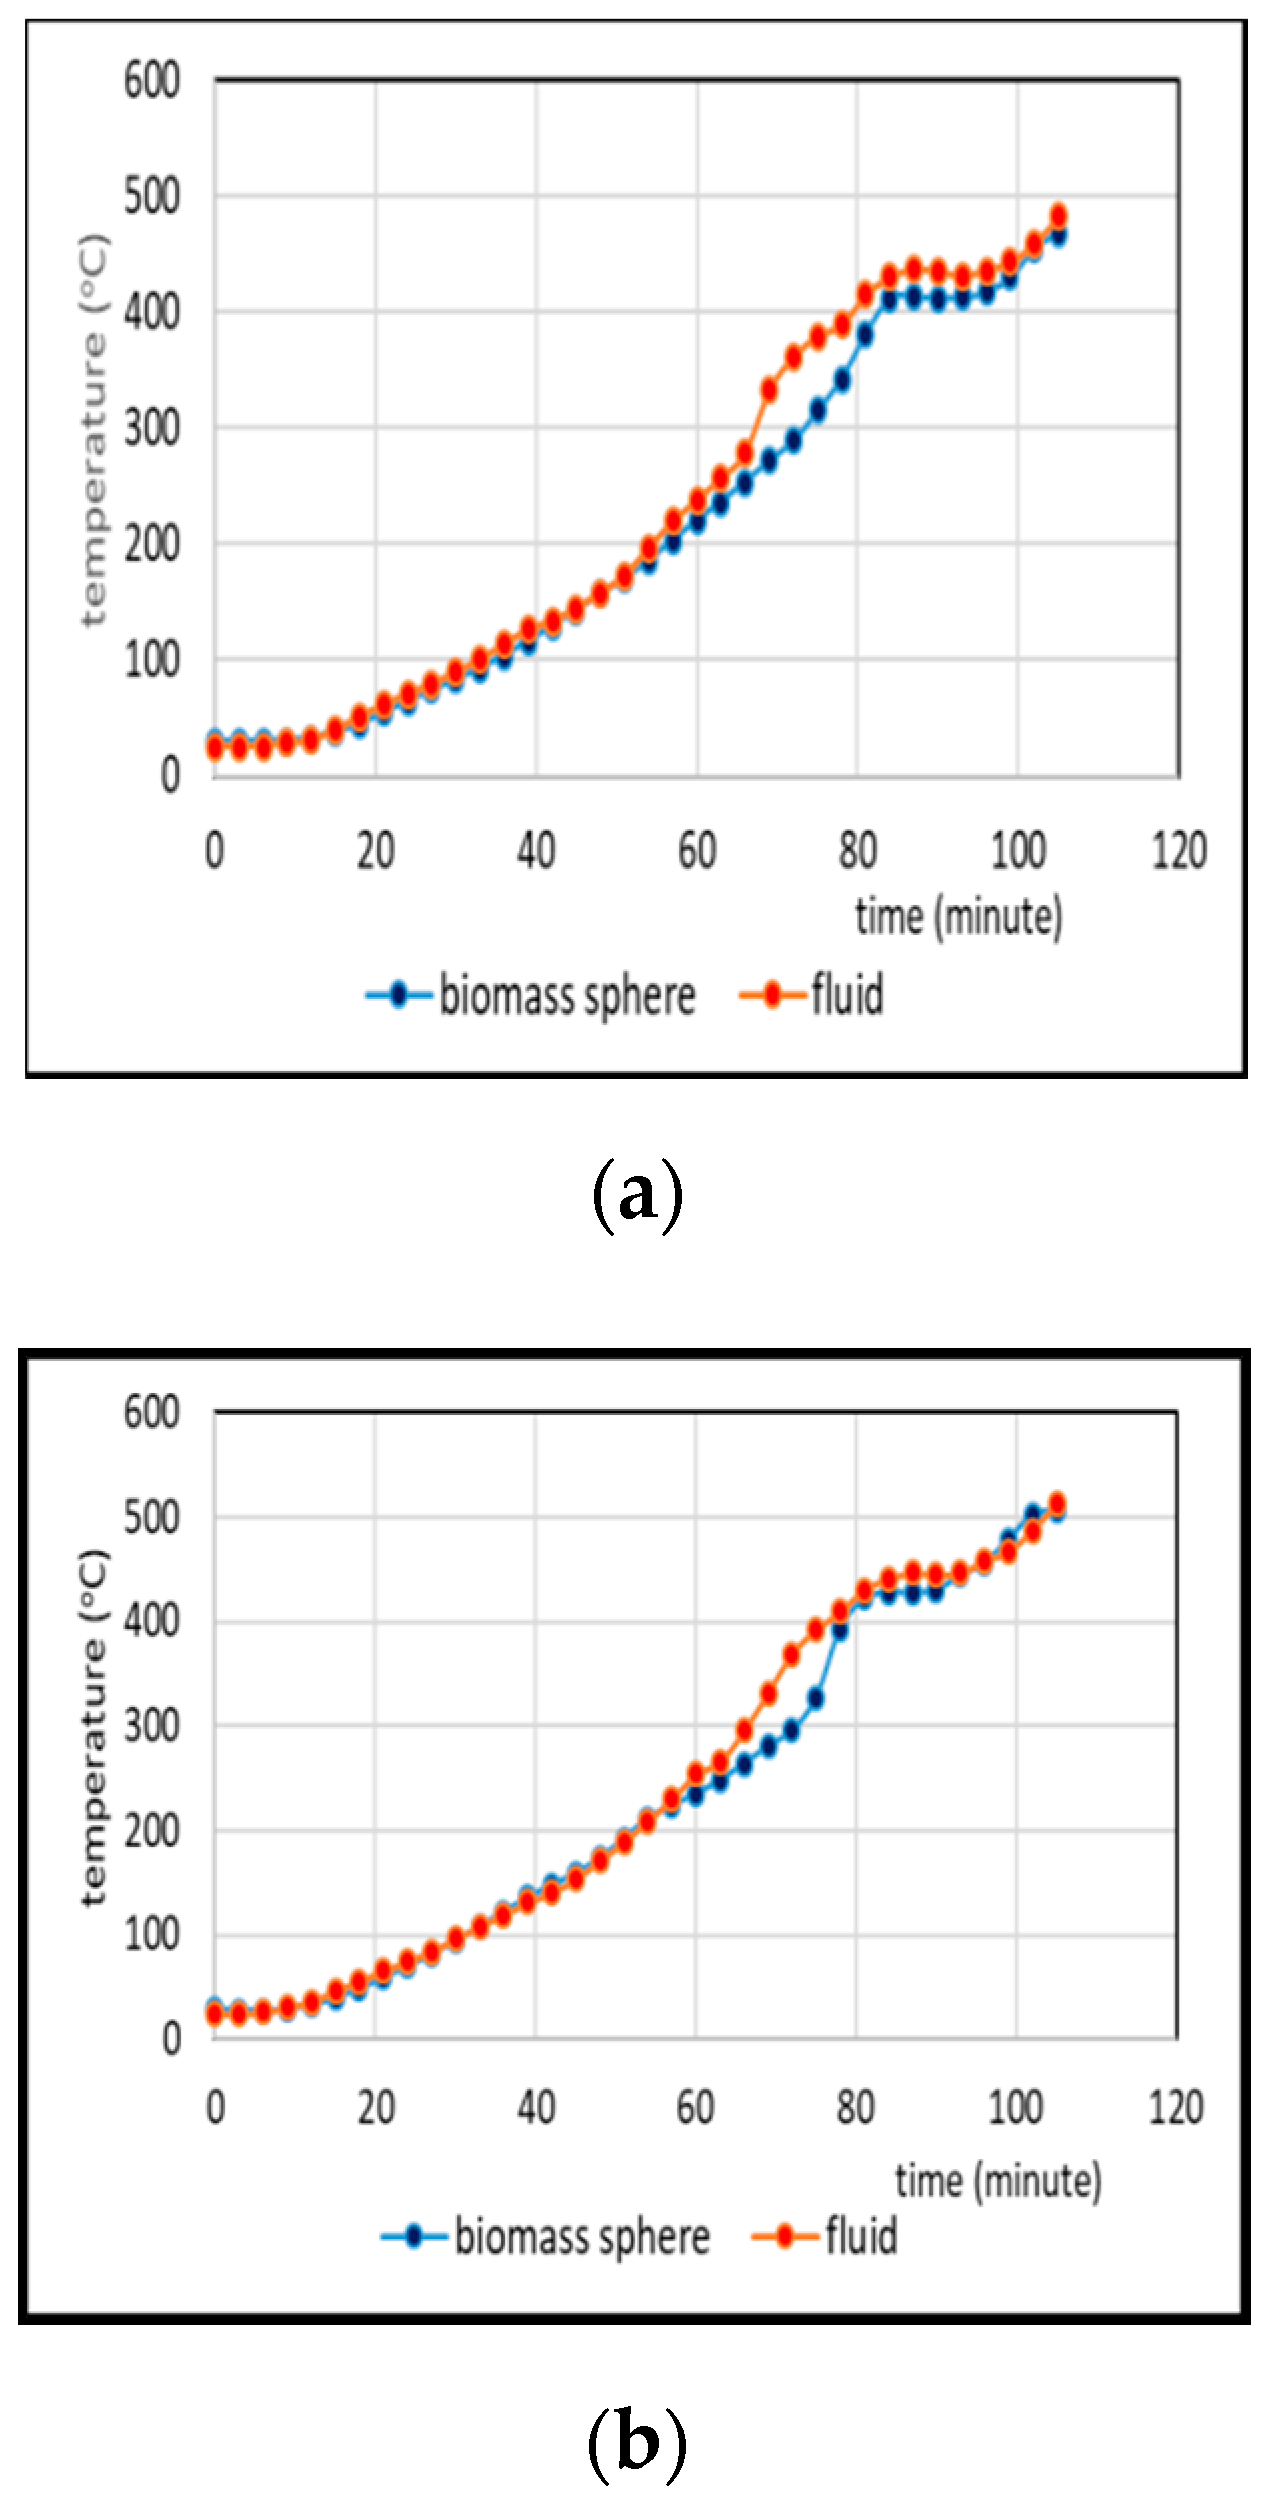
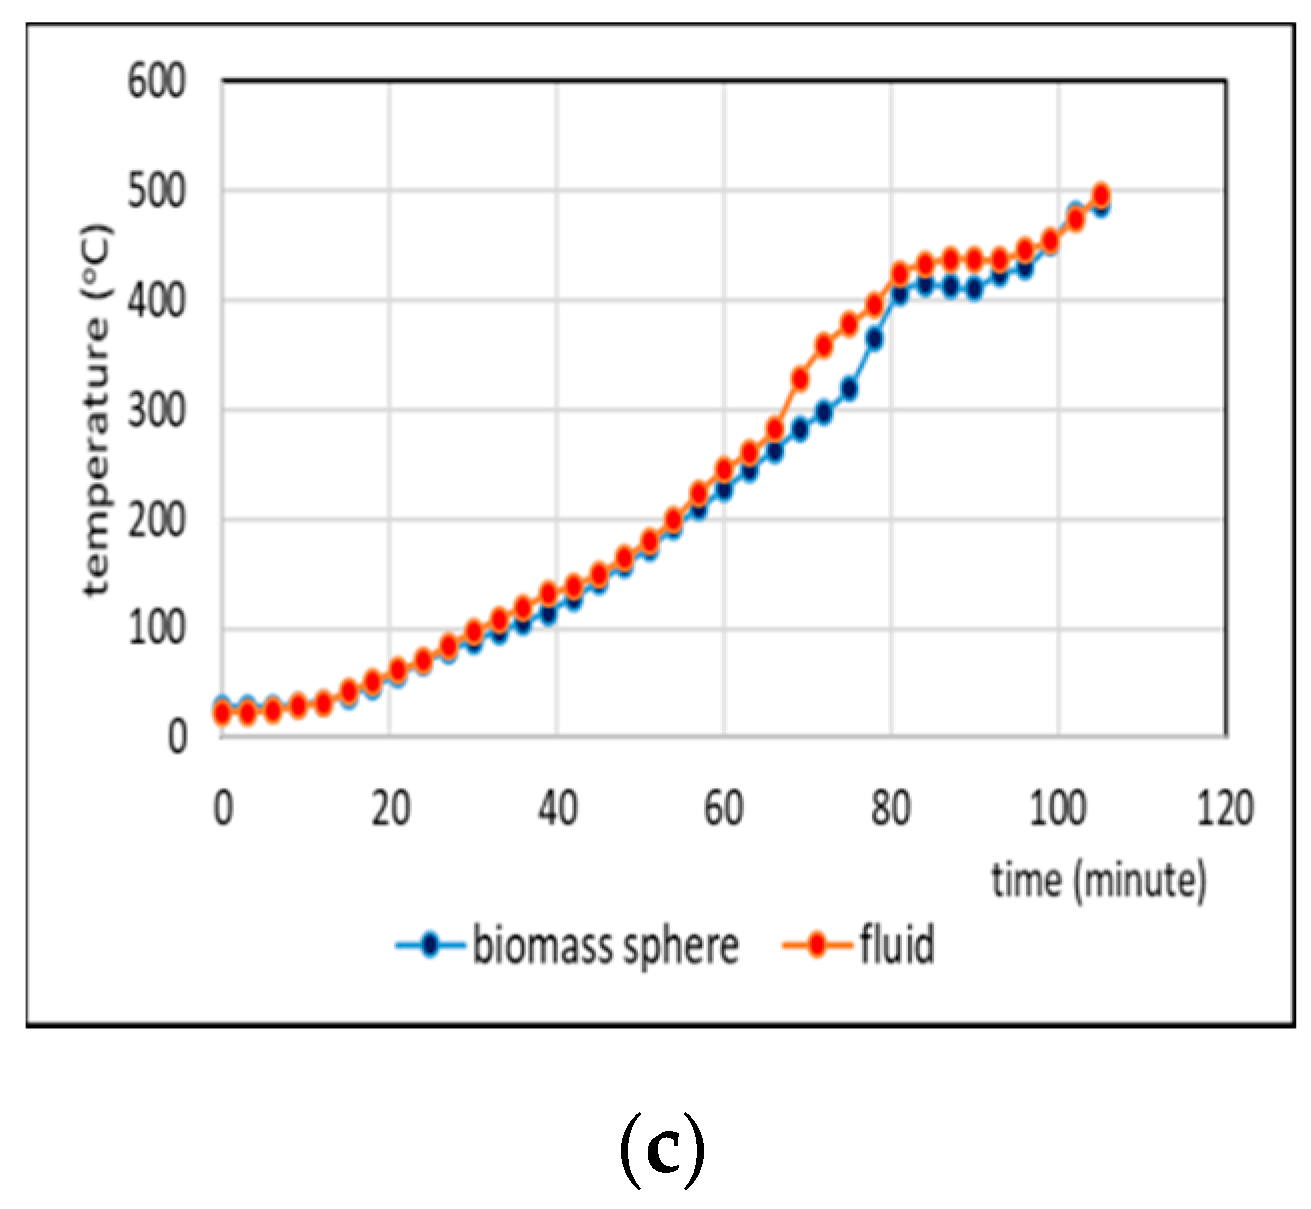
3.2. Comparison of Temperatures of Biomass Spheres and Pyrolysis Fluid

In order to relate the two distinct mass ejection phenomena already addressed elsewhere [29] to the present work, the discussion of the present work is divided into two regimes of mass ejection.

3.2.1. Co-Pyrolysis Using Feeds Containing 0 and 25% Weight of PP

In biomass pyrolysis, temperatures of biomass particles were very similar to that of biomass vapor originating from biomass pyrolysis (see Figure 3). However, there were differences between temperatures of biomass spheres and those of pyrolysis fluid for co-pyrolysis (see Figure 4). With small proportion of PP in the feed in regime 1, the melting PP coated partly the biomass particle surface with thin melting PP film to form fragments and the rest formed flocks with thick melting PP (see Figure 5a,b). This possibly occurred when PP was melting in which by gravity biomass particles in the lower part of reactor were immersed in melting PP and the rest were coated with melting PP.
In case of biomass pyrolysis described by Figure 3, heat radiation was predominant over heat conduction because thermal conductivities of both biomass particles and melting PP were very small [37]. Biomass particles were directly exposed to transparent N2 carrier gas and they possibly underwent radiative heat transfer. Convective heat transfer was unlikely to occur considering that average velocity of N2 gas was 1.6 mm/s. This value was much smaller than the fluidization velocity (Umf) of 120 mm/s to obtain appreciable convective heat transfer [38]. Therefore, heat transfer in biomass pyrolysis was dominated by heat radiation and pyrolysis fluid, which originated from biomass pyrolysis, exhibited similar temperatures as that of biomass particles.
Referring to the case shown by Figure 4, because the thin film of melting PP in upper part of biomass bed was transparent to heat radiation [39] from the reactor wall, the radiative heat went through the film to directly heat the biomass particles. Therefore, melting-PP coated biomass particles were directly exposed to N2 carrier gas and they possibly underwent radiative heat transfer.
Convective heat transfer may have occurred in lower part of bed where biomass particles immersed in melting PP. With stirrer rotation speed of 100 rpm and the reactor radius of 50 mm in the present work, the tangential velocity on the inner wall of the reactor was estimated 520 mm/s. According to Sato et al. [28], the minimum velocity of melting PP on a hot solid surface to induce convective heat transfer on melting PP at temperatures between 200 to 250 °C is 0.078 mm/s. In comparison, the tangential velocity in the present work, i.e., 520 mm/s, was much higher than 0.078 mm/s. Sato et al. [28] noted that with this high tangential velocity, the convective heat transfer coefficient was predominant.
In Figure 3 and Figure 4, there is a downward concave temperature curve starting from ambient temperature indicating there was heat absorption from biomass particles by water evaporation in biomass particles and dehydration [40]. In addition to that, in co-pyrolysis, the drop of temperature occurred in part due to heat absorption by PP melting. Brzozowska-Stanuch et al. [41] found that polypropylene has a melting point of 163 °C and it requires heat for melting.
Figure 4 shows that there was a large curve bump within the range of about 200–350 °C on biomass spheres. Within this range, high mass loss rates of hemicellulose and cellulose occurred [42] with secondary char may have concurrently formed. In biomass pyrolysis at low heating rate, the secondary char is mostly formed by repolymerization of lignin and hemicellulose pyrolysis products [43]. The secondary char formation is always followed by emanating exothermic heat [44]. The phenomenon of increase of biomass particles which were blanketed by melting PP film was similar to that found by Anca-Couce and Scharler [44] who performed biomass pyrolysis experiments at low heating rate using a micro TGA-DSC with a lid to increase the residence time of the pyrolysis vapor. They found that this experimental arrangement results in enhancing secondary reactions and promoting exothermic secondary charring. Exothermic heat during char formation was responsible for a large increase of temperature in the curve bump. The presence of the large curve bump whose temperatures were measured at the base of the reactor indicates that char was trapped by melting PP film and secondary char emanated exothermic heat within the melting PP film because of low mass ejection from biomass particles before PP underwent high mass decomposition above 400 °C. This finding supported the finding by Supramono et al. [29] that in this regime, mass ejection from biomass pores is not strong. Because the biomass spheres in co-pyrolysis involving 25% weight of PP were installed near the base of the reactor where the convective heat was predominant, then the biomass pyrolysis in lower part of feedstock most likely was driven by heat convection in addition to radiation, while in upper part by heat radiation. Additionally, secondary char in co-pyrolysis gave more heat to pyrolysis fluid and improved the fluid temperature as seen by comparing fluid temperatures in Figure 3 and Figure 4 which was favorable in PP pyrolysis to supply more hydrogen radicals.

3.2.2. Co-Pyrolysis Using Feeds Containing 50%, and 75% Weight of PP in Regime 2

Samples of co-pyrolysis using feeds containing 50% and 75% weight of PP taken from a swelling-contraction reactor [29] exhibited big flocks of biomass particles in melting PP with no fragments of biomass particles (see Figure 6a,b). This suggested that all biomass particles were immersed in melting PP in the stirred tank reactor and convective heat transfer was predominant. For co-pyrolysis involving feed containing 50% weight of PP, Figure 7 shows that at temperature less than 400 °C, temperature of biomass particles was very similar to that of pyrolysis fluid. Additionally, Figure 7 exhibits a curve bump starting around 300 °C and reached the highest bump at about 400 °C. The temperature of 300 °C was the end of biomass swelling where biomass pyrolysis vapor started to release [29] and that of 400 °C was the starting temperature of high mass decomposition of melting PP pyrolysis in short time [45]. Jouhara et al. [46] concluded that most of biomass pyrolysis occurs above 300 °C, which is the end of the biomass particle swelling, where large release of depolymerisation and cracking of biomass in co-pyrolysis in vapor phase started to occur in melting PP. Attinger et al. [47] suggested that the phase change of fluid improved convective heat transfer. Consequently, it also improved heat flux from the hot reactor wall to the melting PP resulting in higher pyrolysis fluid temperature as described by the presence of a curve bump.
The temperature profiles of pyrolysis fluid and biomass particles in co-pyrolysis involving 50% weight of PP in feed shown in Figure 7 are similar to those involving 75% weight of PP in feed described by Figure 8. The difference is that in Figure 8, there was noticeable difference between these profiles within a temperature range of about 275–420 °C with the pyrolysis fluid exhibiting large bump. This indicates that convective heat transfer from the hot reactor wall to the melting PP was larger than in the case of co-pyrolysis involving 75% weight of PP in feed and as a result the formation of biomass and PP pyrolysis vapor was larger compared to those in the case of co-pyrolysis involving 50% weight of PP in feed. This argument is accordance with the fact that that in regime 2 the higher the PP composition in the feed, the higher is the bio-oil yield [3]. In both cases, in the mixture of biomass particle-melting PP with thicker melting PP, the radiative heat to the biomass particles was attenuated, and heat is more absorbed by biomass particles by heat convection through the melting PP [43]. Figure 8 also indicates in comparison to Figure 4 that the secondary char on the biomass particles was absent which means that mass ejection from biomass particles occurred at high velocity as suggested by Supramono et al. [29].
Elucidation of both cases in this section suggests that higher composition of PP induced more formation of pyrolysis vapor as well as promoted higher convective heat transfer as indicated by the presence of large bump of pyrolysis liquid temperature profile. Results in Section 3.1 and Section 3.2 indicate that convective heat transfer, which was predominant in regime 2 rather than in regime 1, possibly improved heat flux which produced more pyrolysis vapor.

3.3. Comparison of Temperatures of Pyrolysis Fluid at Different Feed Compositions in Regime 2

All pyrolysis fluid temperature profiles in Figure 9 show that co-pyrolysis using feed containing PP 87.5% exhibited higher fluid temperature than those using less PP in the feeds. Temperature profiles measured using thermocouples 1 and 3 can represent the profiles in all thermocouple positions because they had very similar curve fashions. Experiment on swelling-contraction in this regime using the same feed composition at low heating rate suggested that co-pyrolysis using PP of 87.5% posed the highest swelling among other co-pyrolysis using less PP in the feed [29]. The swelling started from 200 °C and the maximum swelling was reached at around 300 °C. Therefore, within the temperature range 200–300 °C, co-pyrolysis received high heat flux because particle swelling making the whole bed in the stirred tank reactor expanding and as the stirring was maintained at 100 rpm, the expansion allowed higher friction between melting PP and the hot reactor wall to induce higher convective heat flux to the reactor feedstock. This phenomenon was similar to that found by Zonta and Soldati [30] who worked on fluid thermal expansion to improve convective heat transfer.
Within the fluid temperature range 300–420 °C, primary biomass pyrolysis products existed in the mixture with melting PP after the accomplishment of biomass particle swelling at about 300 °C. The next stage above 300 °C was dependent on composition of PP in the feed in which higher PP composition in the feedstock induced enhanced convective heat and produced more bio-oil. At lower compositions of PP in feeds of co-pyrolysis, the increase of temperatures was not as large as the increase at co-pyrolysis using 87.5% PP. According to the work by Supramono et al. [29], co-pyrolysis using less PP in the feed posed less biomass particle swelling, which reduced pyrolysis vapor produced. Consequently, the heat flux received by co-pyrolysis using feed containing PP less than 87.5% was less than that by co-pyrolysis using feed containing 87.5% PP. The closeness among temperature profiles attributed to co-pyrolysis using 75%, 67.5% and 50% PP was more likely due to combined effects of convective heat flux from the reactor wall to melting PP and exothermic heat by char formation. It has been explained that co-pyrolysis involving higher PP composition in feed was attributed to higher heat flux and lower exothermic heat due to less char formation (see Figure 10). Similarity of summed heat flux and exothermic heat may have resulted in similarity in temperature profile curves within the range of 300–420 °C. Therefore, higher composition of PP in feed was favorable for PP pyrolysis to produce more hydrogen radicals.

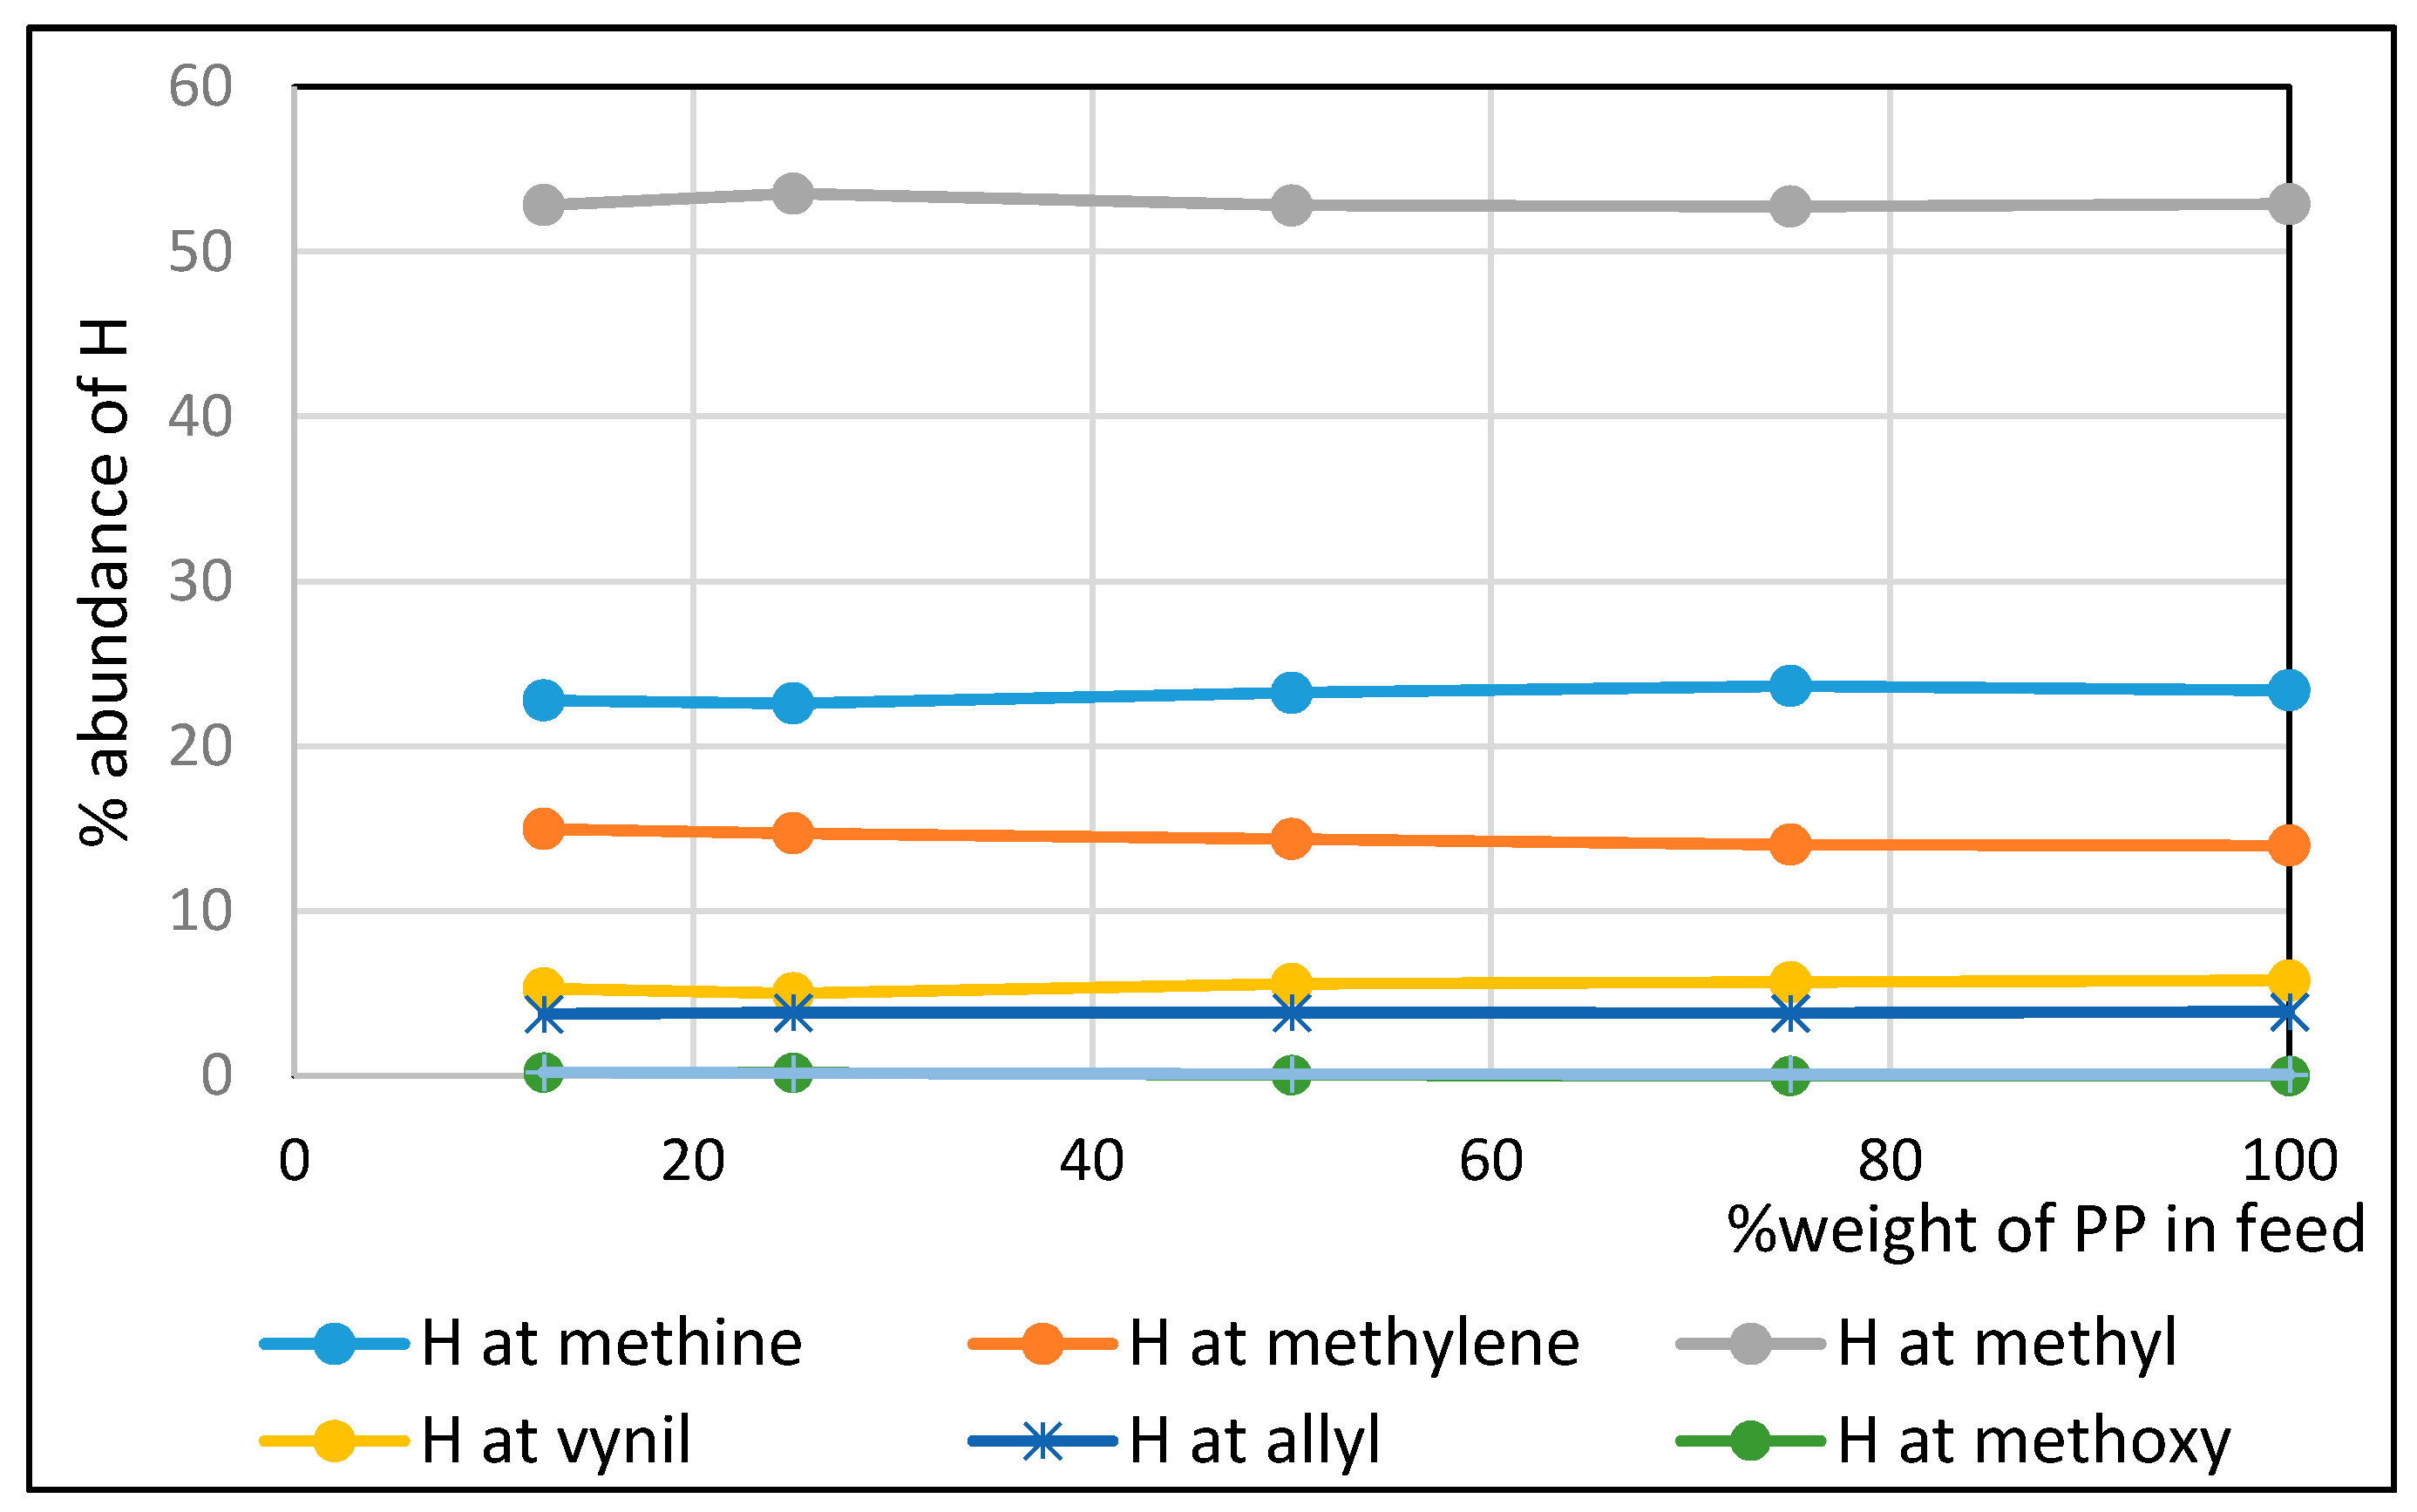
3.4. H-NMR of Non-Oxygenated Fraction of Bio-Oil and Wax

Figure 11 shows that %abundance of H attributed to chemical bonds produced by co-pyrolysis of PP at different feed compositions was nearly irrespective of the feed composition. In hydrogen balance perspective, this indicates that volatiles generating wax of PP rather than those generating non-polar bio-oil behaved as a hydrogen source. Therefore, the hydrogen transfer attributed to Figure 2 was not analyzed via pyrolysis attributed to the non-polar phase.
Figure 11 also shows that composition of H attributed to methyl groups was larger than those attributed to methylenes and methines, which indicates that carbon chains in the non-polar phase contained large amounts of branching [45]. The result was in accordance to that obtained by Sojak et al. [45] who found that PP pyrolysis produces mostly branched carbon-chain hydrocarbon structure. However, their structures contained highly unsaturated carbon chains in contrast to the structure obtained by the present work which contained only about 6% unsaturated carbons. This low unsaturated carbon composition may have been satisfied by donation of hydrogen not only by PP pyrolysis, but also by pyrolysis of lignin and cellulose. Kawamoto [48] suggested that the conversion of monolignols derived from lignin pyrolysis may involve dehydrogenation which releases hydrogen. Cleavage of weak ether bonds during lignin pyrolysis forms either of three monolignols of lignin, i.e., synapil, coniferyl or p-coumaryl alcohols, respectively, derived from three major aromatic ring substituents (units) differing in the degrees of methoxylation of their carbon rings, i.e., S (syringyl)-, G (guaiacyl)- and H (p-hydroxyphenyl)-units [48,49]. Sinapyl, coniferyl and p-coumaryl alcohols respectively contains 2, 1 and no methoxy moieties. The proportions of S-, G- and H-units in feed depend on type of biomass origin, whether hardwood, softwood or herbaceous biomass [48,50]. Corncobs as an herbaceous biomass used as the feedstock in the present work contains mainly S-unit which less susceptible to undergo condensation and repolymerisation [50]. Another source of hydrogen is the dehydrogenation reaction of alcohols to aldehydes and ketones [51] in which the alcohols are obtained by reaction between PP and hydroxyl radicals from cellulose pyrolysis.
In co-pyrolysis, reactions are dominated by hydrogen, hydroxyl and methyl abstractions, in which biomass pyrolysis abstracts hydrogen and methyl from PP pyrolysis [19]. Figure 12 shows that as the composition in the feed was increased from 12.5% to 25% PP in feed in regime 1, H abundance bound to allyl increased and that bound to methyl content in wax decreased. Hydrogen donation provided by wax through the formation of more allyl in wax was possible because H at α position to the double bond has the lowest bond dissociation energy (BDE) to cleave to form H radicals [52].
Figure 12 shows that increasing PP composition from 50 to 75%PP in feed in regime 2 reduced the H abundance attributed to allylic C in wax and increased H abundance bound to methyl in wax. In this regime, it is expected that there was excess of H and methyl radicals from wax due to smaller proportion of biomass in feed composition as %PP in feed was increased. This excess reached equilibrium between H and methyl abstractions from wax in radical recombination [53], which can be achieved in pyrolysis undertaken at low heating rate in the present work [54].

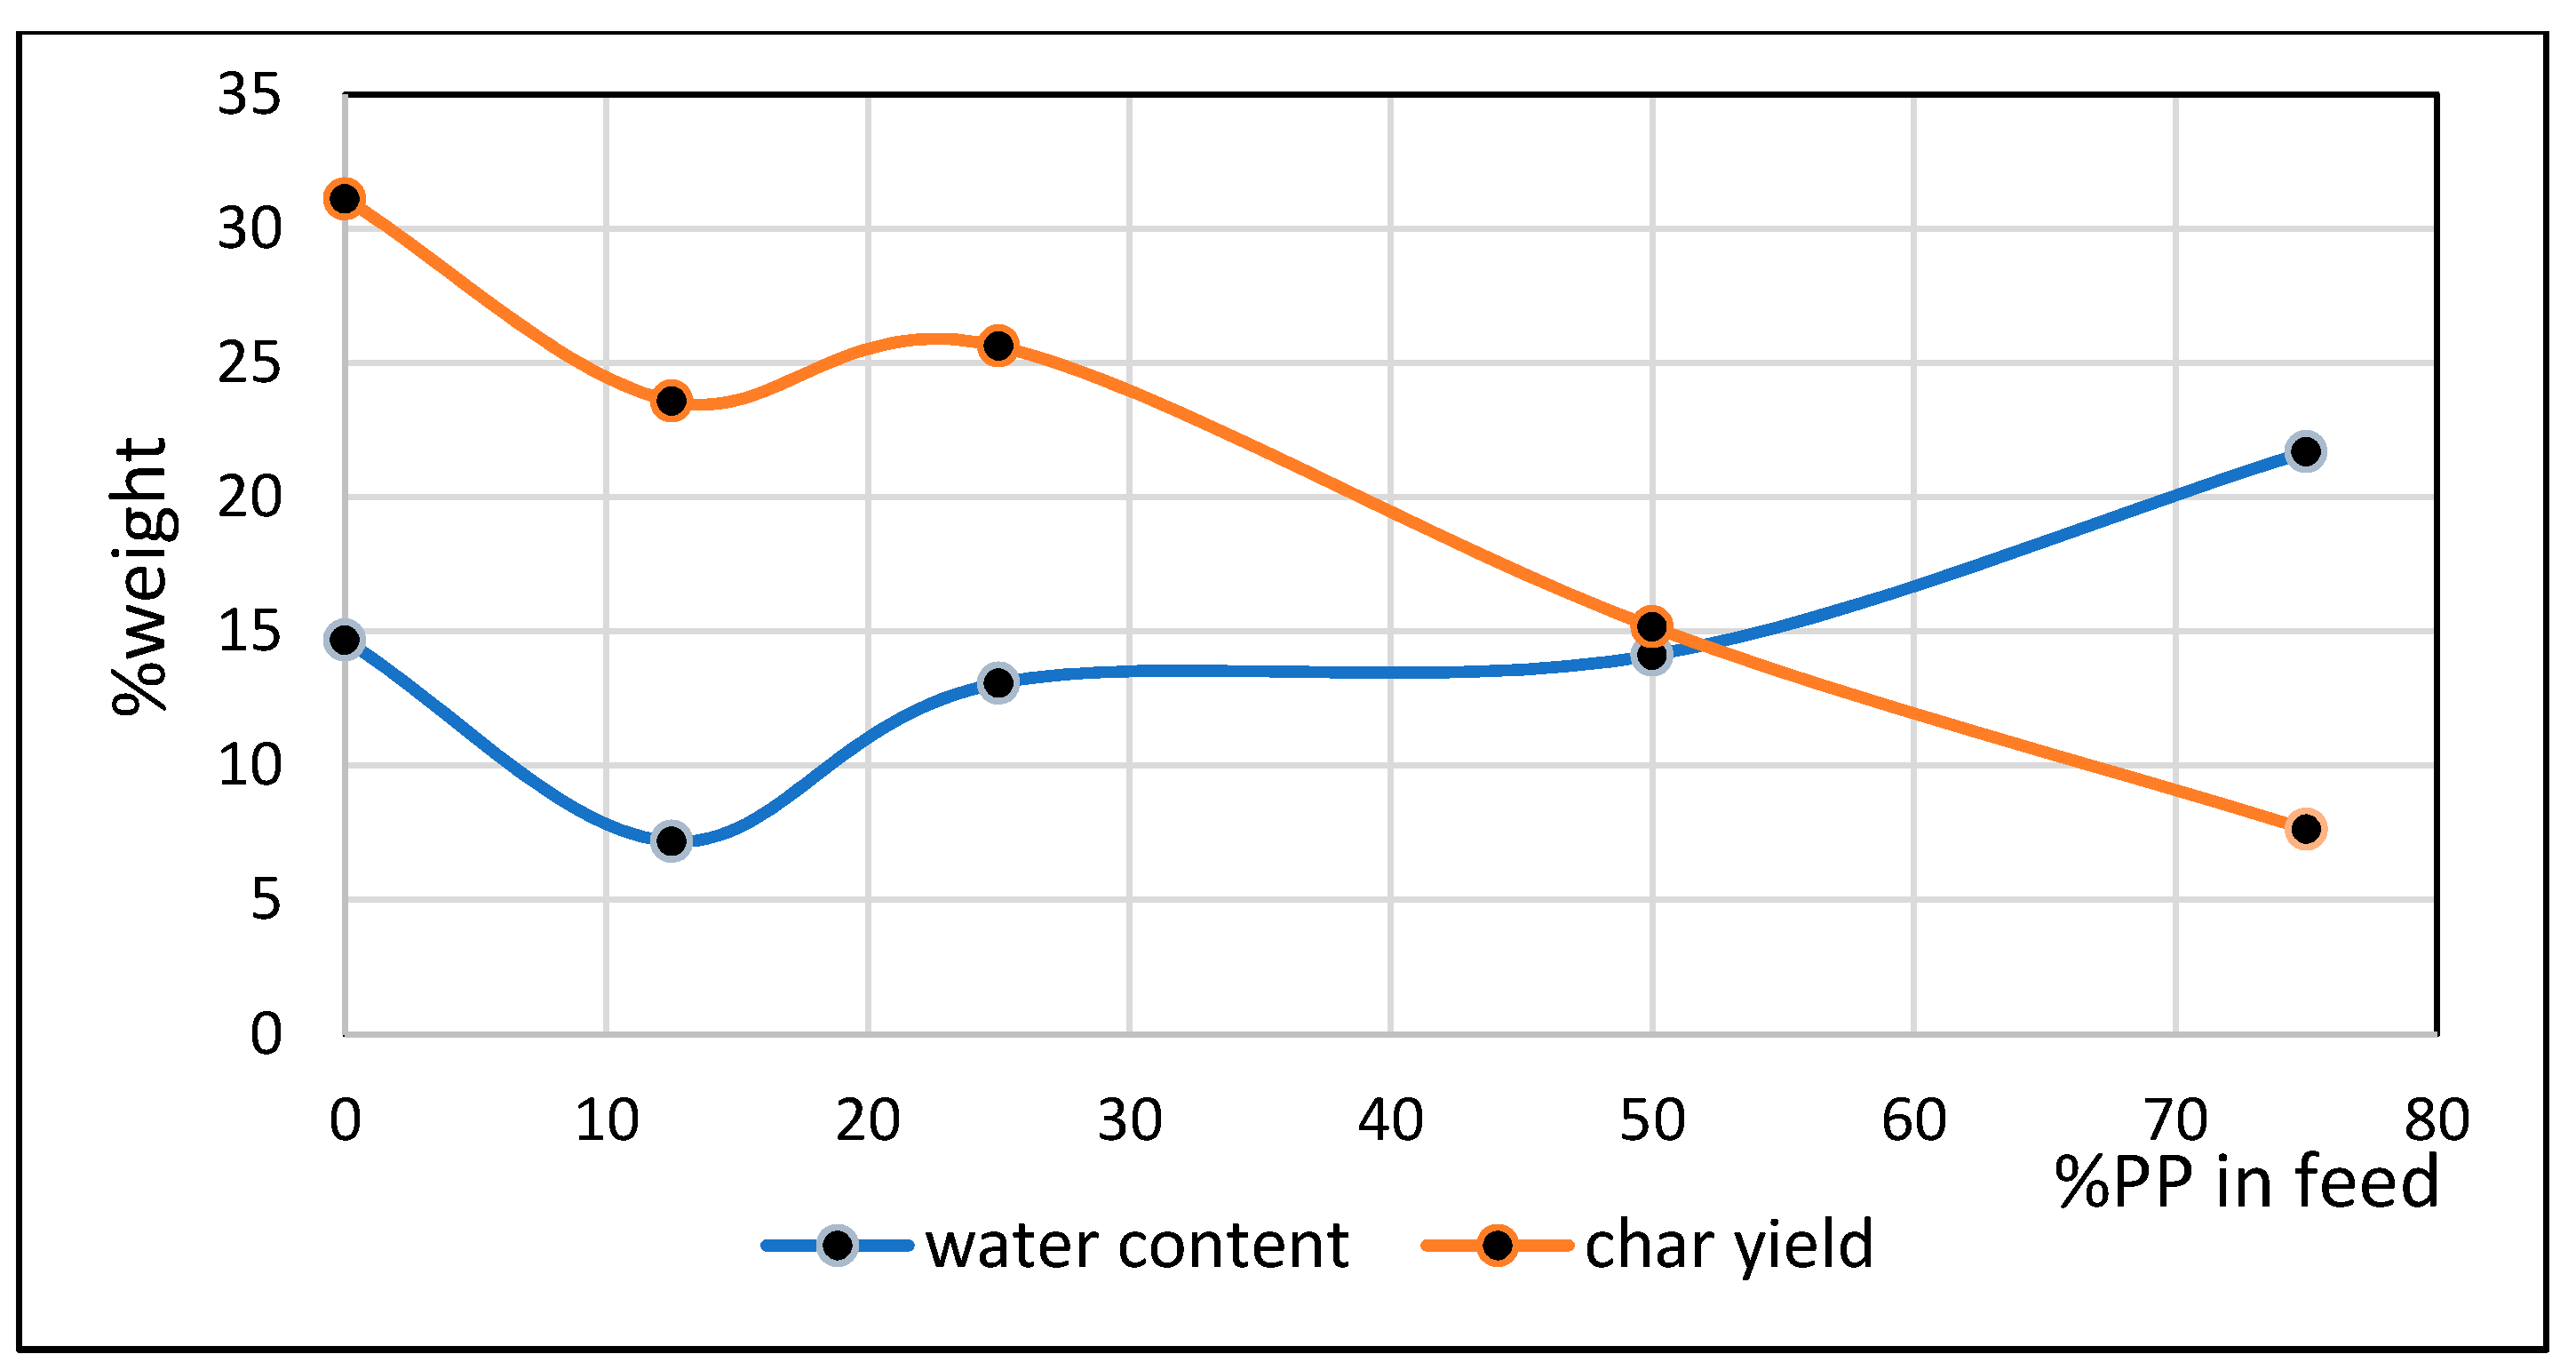
3.5. Water Content in Oxygenated Fraction of Bio-Oil

Figure 10 shows the effect of PP composition in feed on water content in oxygenated fraction of bio-oil. According to Antal and Gronli [55] and Scheirs et al. [56], in biomass pyrolysis there are two dehydration reactions in cellulose pyrolysis, i.e., intramolecular formation of anhydrocellulose and intermolecular formation of glucose cross-link toward the char formation. Lignin is more difficult to dehydrate than cellulose and hemicellulose, whereas most of char is contributed by repolymerisation of lignin [22]. Water may also be released as a result of interaction between cellulose and PP in co-pyrolysis. Sharypov et al. [57] found that the presence of olefinic polymer promotes hydrogen abstraction reaction between long chain polymer species and free radicals produced from biomass intermediates. Olefinic polymer decomposes via a cascade of free radical reactions [58]. More specifically, Ojha and Vinu [59] found that reaction between hydroxyl radical abstracted from cellulose with propylene trimer to represent long carbon chain PP readily forms propylene trimer radical with the liberation of water. The Arrhenius activation energy of this reaction is low, i.e., in the range of 11–14 kcal/mol. Propylene trimer radicals readily react with water to form alcohols with an Arrhenius activation energy of 10–14 kcal/mol. This later reaction competes with the reaction between propylene trimer with hydroxyl radicals with much lower Arrhenius activation energy. However, the presence of hydroxyl radicals is restricted by high activation energy for their abstraction from cellulose. They concluded that the plausible pathway to form long-chain alcohols is the reaction between PP radicals with water formed by cellulose dehydration.
Comparing the water content in polar fraction of bio-oil resulting from co-pyrolysis in regimes 1 and 2, it seems that co-pyrolysis in regime 1, which occurred in hydroxyl-rich environment, preferred reaction between PP radicals and water to produce long-chain alcohols and consequently bio-oil contained less water. On the other hands, co-pyrolysis in regime 2, which occurred in hydrogen-rich environment, preferred reaction between PP radicals and hydroxyl radicals with the excess of hydrogen reacting with hydroxyl radicals to form water. The abstraction of hydroxyl radicals from cellulose during cellulose dehydration is mediated by free radicals in β-position of tertiary carbon in any of first to fifth position in the cellulose structure [19]. Zhou et al. [60] found that the presence of hydrogen radicals obtained from PP pyrolysis, which is concomitant to condition in regime 2, induces hydroxyl radical formation. As a result, water composition in bio-oil obtained from co-pyrolysis in regime 2 was larger than that in regime 1 as indicated by Figure 10. Higher water production in co-pyrolysis with increasing PP composition in feed (see Figure 10) occurred due to promotion of hydroxyl radicals which incurred the less yield of non-oxygenated fraction as described by Figure 2b.

3.6. Chemical Properties of the Non-Polar Fraction of Bio-Oil and Diesel Fuel

Table 1 shows that in general there were similarities in branching indices (BIs), compositions of methyl, methylene, methine, allylic C and vinylic C among non-oxygenation fractions of bio-oil obtained from co-pyrolysis with different feed compositions. Diesel fuel has BI of only 0.4, while non-polar fractions between 0.57 to 0.60. The indices were calculated using Equation (1) based on the data given in Figure 11. To upgrade the bio-oil into biofuel, it needs to modify its chemical structure to have lower branching. The introduction of acetylene in PP pyrolysis may be an option to adjust between carbon chain scission and crosslinking to achieve a certain BI [61]. To be used as diesel fuel, the vinyl content in non-polar phase should be reduced because double bonds are not favorable during combustion as it affects ignition delay time and combustion emission [62]. Methyl composition was predominant chemical bond in non-oxygenated fractions and comprised about 53% by mole fraction and methine was the second most chemical bond. By comparison, commercial diesel contained mostly methylene and methyl comprising about 35% and 59% by mole fractions, respectively.

4. Conclusions

Some conclusions arising from the present work are as follows
(1)
Comparison of temperatures of pyrolysis fluid and biomass spheres indicates that in regime 1 convective and radiative heat transfers sparingly occurred and synergistic effect on the yield of non-oxygenated phase increased with increasing convective heat transfer at increasing %PP in feed, while in regime 2, convective heat transfer was predominant with the synergistic effect reducing at increasing %PP in feed. In the later regime the reduction of synergistic effect occurred at increasing %PP composition in the feed due to more disappearance of H radicals to form water. The optimum PP composition in the feed to reach maximum synergistic effect was 50%.
(2)
In co-pyrolysis, non-oxygenated phase portion in the reactor leading to the wax formation acted as donor of methyl and hydrogen radicals in the removal of oxygen in the synergistic effect. Maximum donation occurred at optimum PP composition in the feed.
(3)
The non-oxygenated fractions of bio-oil contained mostly methyl groups comprising about 53% by mole fraction irrespective of the PP composition employed in the co-pyrolysis. By comparison, commercial diesel contains mostly methylenes comprising about 59% by mole fraction. Non-oxygenated fractions exhibited branching indices about 50% higher than that of commercial diesel.

Author Contributions

D.S. conceived and designed the experiments, and wrote the paper, A.F.S. performed the experiments, M.N. conceived and supervised the experiments. All authors have read and agreed to the published version of the manuscript.

Acknowledgments

The authors acknowledge the financial support received from Directorate of Research and Community Service Universitas Indonesia under Q1Q2 International Journal Publication Grant 2019 with contract number: NKB-0311/UN2.R3.1/HKP.05.00/2019 for funding the present research.

Conflicts of Interest

The authors declare that there is no conflict of interest in the submission of this manuscript

References

  1. Khor, K.H.; Lim, K.O.; Zainal, Z.A. Characterization of bio-oil: A by-product from slow pyrolysis of oil palm empty fruit bunches. Am. J. Appl. Sci. 2009, 6, 1647–1652. [Google Scholar] [CrossRef] [Green Version]
  2. Si, Z.; Zhang, X.; Wang, C.; Ma, L.; Dong, R. An Overview on catalytic hydrodeoxygenation of pyrolysis oil and its model compounds. Catalysts 2017, 7, 169. [Google Scholar] [CrossRef] [Green Version]
  3. Abnisa, F.; Wan Daud, W.M.A. A Review on co-pyrolysis of biomass: An optional technique to obtain a high-grade pyrolysis oil. Energy Convers. Manag. 2014, 87, 71–85. [Google Scholar] [CrossRef]
  4. Bahrami, A.; Soltani, N.; Pech-Canul, M.I.; Gutiérrez, C.A. Development of metal-matrix composites from industrial/agricultural waste materials and their derivatives. Crit. Rev. Environ. Sci. Technol. 2016, 46, 143–208. [Google Scholar] [CrossRef]
  5. Hensen, E.J.M.; Poduval, D.G.; Degirmenci, V.; Ligthart, D.; Chen, W.B.; Mauge, F.; Rigutto, M.S.; van Veen, J.A.R. Acidity characterization of amorphous silica-alumina. J. Phys. Chem. C 2012, 116, 21416–21429. [Google Scholar] [CrossRef]
  6. Crepeau, G.; Montouillout, V.; Vimont, A.; Mariey, L.; Cseri, L.; Mauge, F. Nature, structure and strength of the acidic sites of amorphous silica alumina: An IR and NMR study. J. Phys. Chem. B 2006, 110, 15172–15185. [Google Scholar] [CrossRef]
  7. Supramono, D.; Setiadi, H.; Nasikin, M. Phase separation of bio-oil produced by co-pyrolysis of corn cobs and polypropylene. IOP Conf. Ser. Earth Environ. Sci. 2017, 93, 012072. [Google Scholar] [CrossRef]
  8. Zhou, H.; Wu, C.; Onwudili, J.A.; Meng, A.; Zhang, Y.; Williams, P.T. Polycyclic aromatic hydrocarbon formation from the pyrolysis/gasification of lignin at different reaction conditions. Energy Fuels 2014, 28, 6371–6379. [Google Scholar] [CrossRef]
  9. Ben, H.X.; Ragauskas, A.J. Comparison for the compositions of fast and slow pyrolysis oils by NMR characterization. Bioresour. Technol. 2013, 147, 577–584. [Google Scholar] [CrossRef]
  10. Vollmer, D. Thermodynamics and phase-separation kinetics of microemulsions in thermal behavior of dispersed systems. Surfactant Sci. Ser. 2000, 93, 23. [Google Scholar]
  11. Lamorgese, A.G.; Mauri, R. Effect of viscosity ratio on structure evolution during mixing/demixing of regular binary mixtures. Chem. Eng. Trans. 2017, 57, 1225–1230. [Google Scholar]
  12. Brebu, M.; Ucar, S.; Vasile, C.; Yanik, J. Co-pyrolysis of pine cone with synthetic polymers. Fuel 2010, 89, 1911–1918. [Google Scholar] [CrossRef]
  13. Onal, E.; Uzun, B.B.; Putun, A.E. Bio-oil production via co-pyrolysis of almond shell as biomass and high density polyethylene. Energy Convers. Manag. 2014, 78, 704–710. [Google Scholar] [CrossRef]
  14. Abnisa, F. Study on Pyrolysis of Oil Palm Solid Wastes and Co-Pyrolysis of Palm Shell with Plastic and Waste Tyre. Ph.D. Thesis, University of Malaya, Kuala Lumpur, Malaysia, 2015. [Google Scholar]
  15. Bhattacharya, P.; Steele, P.H.; Hassan, E.B.M.; Mitchell, B.; Ingram, L.; Pittman, C.U., Jr. Wood/plastic copyrolysis in an auger reactor: Chemical and physical analysis of the products. Fuel 2009, 88, 1251–1260. [Google Scholar] [CrossRef]
  16. Rotliwala, Y.C.; Shah, J.A.; Dhingra, N.; Parekh, D.B.; Parikh, P.A. Plastics/biomass copyrolysis in an auger reactor: Physico-chemical analysis of the products. In Proceedings of the 7th International Symposium on Feedstock Recycling of Polymeric Materials (7th ISFR), New Delhi, India, 23–26 October 2013. [Google Scholar]
  17. Martinez, J.D.; Veses, A.; Mastral, A.M.; Murillo, R.; Navarro, M.V.; Puy, N. Copyrolysis of biomass with waste tyres: Upgrading of liquid bio-fuel. Fuel Process. Technol. 2014, 119, 263–271. [Google Scholar] [CrossRef] [Green Version]
  18. Xue, Y.; Kelkar, A.; Bai, X. Catalytic co-pyrolysis of biomass and polyethylene in a tandem micropyrolyzer. Fuel 2016, 166, 227–236. [Google Scholar] [CrossRef]
  19. Ojha, D.K.; Vinu, R. Fast co-pyrolysis of cellulose and polypropylene using Py-GC/MS and Py-FT-IR. R. Soc. Chem. Adv. 2016, 5, 66861–66870. [Google Scholar] [CrossRef]
  20. Fei, J.; Zhang, J.; Wang, F.; Wang, J. Synergistic Effects on co-pyrolysis of lignite and high-sulfur swelling coal. J. Anal. Appl. Pyrolysis 2012, 95, 61–67. [Google Scholar] [CrossRef]
  21. Yang, H.; Appari, S.; Kudo, S.; Hayashi, J.; Kumagai, S.; Norinaga, K. Chemical structures and primary pyrolysis characteristics of lignins obtained from different preparation methods. J. Jpn. Inst. Energy 2014, 93, 986–994. [Google Scholar] [CrossRef] [Green Version]
  22. Brebu, M.; Vasile, C. Thermal degradation of lignin—A review. Cellul. Chem. Technol. 2010, 44, 353–363. [Google Scholar]
  23. Zhou, L.; Zhang, G.; Zhang, L.; Klinger, D.; Meyer, B. Effects of contact conditions between particles and volatiles during co-pyrolysis of brown coal and wheat straw in a thermos-gravimetric analyser and fixed-bed reactor. Processes 2019, 7, 179. [Google Scholar] [CrossRef] [Green Version]
  24. Xue, Y. Thermochemical Conversion of Organic and Plastic Waste Materials through Pyrolysis. Ph.D. Thesis, Iowa State University, Ames, IA, USA, 2017. [Google Scholar]
  25. Eriksson, I.; Haglind, I.; Lidbrandt, O.; Salmen, L. Fiber swelling favoured by lignin softening. Wood Sci. Technol. 1991, 25, 135–144. [Google Scholar] [CrossRef]
  26. Dufour, A.; Castro-Díaz, M.; Marchal, P.; Brosse, P.; Olcese, R.; Bouroukba, M.; Snape, C. In situ analysis of biomass pyrolysis by high temperature rheology in relations with 1H NMR. Energy Fuels 2012, 26, 6432–6441. [Google Scholar] [CrossRef]
  27. Serio, M.A.; Charpenay, S.; Bassilakis, R.; Solomon, P.R. Measurement and modeling of lignin pyrolysis. Biomass Bioenergy 1994, 7, 107–124. [Google Scholar] [CrossRef]
  28. Sato, S.; Oka, K.; Murakami, A. Heat transfer behavior of melting polymers in laminar flow field. Polym. Eng. Sci. 2004, 44, 423–432. [Google Scholar] [CrossRef]
  29. Supramono, D.; Nabil, M.A.; Nasikin, M. Effect of feed composition of co-pyrolysis of corncobs-polypropylene plastic on mass interaction between biomass particles and plastics. IOP Conf. Ser. Earth Environ. Sci. 2017, 105, 012049. [Google Scholar] [CrossRef]
  30. Zonta, F.; Soldati, A. Effect of temperature dependent fluid properties on heat transfer in turbulent mixed convection. J. Heat Transf. 2014, 136, 022501. [Google Scholar] [CrossRef]
  31. Baliga, V.; Sharma, R.; Miser, D.; McGrath, T.; Hajaligol, M.J. Physical characterization of pyrolyzed tobacco and tobacco components. Anal. Appl. Pyrolysis 2003, 66, 191–215. [Google Scholar] [CrossRef]
  32. Jarvis, M.W.; Haas, T.J.; Donohoe, B.S.; Daily, J.W.; Gaston, K.R.; Frederick, W.J.; Nimlos, M.R. Elucidation of biomass pyrolysis products using a laminar entrained flow reactor and char particle imaging. Energy Fuels 2011, 25, 324–336. [Google Scholar] [CrossRef]
  33. Yan, G.; Jing, X.; Wen, H.; Xiang, S. Thermal cracking of virgin and waste plastics of PP and LDPE in a semibatch reactor under atmospheric pressure. Energy Fuels 2015, 29, 2289. [Google Scholar] [CrossRef]
  34. Mazur, R.D. Where Does the Oxygen Go? Pathways and Partitioning in Autothermal Pyrolysis. Ph.D. Thesis, Iowa State University, Ames, IA, USA, 2017. [Google Scholar]
  35. Hayashi, J.; Nakahara, T.; Kusakabe, K.; Morooka, S. Pyrolysis of polypropylene in the presence of oxygen. Fuel Process. Technol. 1998, 55, 265–275. [Google Scholar] [CrossRef]
  36. Chien, J.C.W.; Kiang, J.K.Y. Pyrolysis and oxidative pyrolysis of polypropylene. In Stabilization and Degradation of Polymers; Advances in Chemistry; Allara, D., Ed.; American Chemical Society: Washington, DC, USA, 1978. [Google Scholar]
  37. Bruch, C.; Peters, B.; Nussbaumer, T. Modelling wood combustion under fixed bed conditions. Fuel 2003, 82, 729–738. [Google Scholar] [CrossRef]
  38. Bandara, J.C.; Eikeland, M.S.; Moldestad, B.M.E. Analyzing the effects of particle density, size and size distribution for minimum fluidization velocity with Eulerian-Lagrangian CFD simulation. In Proceedings of the 58th Conference on Simulation and Modelling, Reykjavik, Iceland, 25–27 September 2017. [Google Scholar]
  39. Tsilingiris, P.T. Comparative evaluation of the infrared transmission of polymer films. Energy Convers. Manag. 2003, 44, 2839–2856. [Google Scholar] [CrossRef]
  40. Baldwin, R.M.; Magrini-Bair, K.A.; Nimlos, M.R.; Pepiot, P.; Donohoe, B.S.; Hensley, J.E.; Phillips, S.D. Current research on thermochemical conversion of biomass at the national renewable energy laboratory. Appl. Catal. B Environ. 2012, 115, 320–329. [Google Scholar] [CrossRef]
  41. Brzozowska-Stanuch, A.; Rabiej, S.; Fabia, J.; Nowak, J. Changes in thermal properties of isotactic polypropylene with different additives during aging process. Polimery 2014, 59, 302–307. [Google Scholar] [CrossRef]
  42. Supramono, D.; Nasikin, M. Improving bio-oil quality through co-pyrolysis of corn cobs and polypropylene in a stirred tank reactor. Int. J. Technol. 2016, 11, 1381–1391. [Google Scholar] [CrossRef]
  43. Yang, H.; Yan, R.; Chen, H.; Lee, D.H.; Zheng, C. Characteristics of hemicellulose, cellulose and lignin pyrolysis. Fuel 2007, 86, 1781–1788. [Google Scholar] [CrossRef]
  44. Anca-Couce, A.; Scharler, R. Modelling heat of reaction in biomass pyrolysis with detailed reaction schemes. Fuel 2017. [Google Scholar] [CrossRef]
  45. Soják, L.; Kubineca, R.; Jurdákováa, H.; Hájekováb, E.; Bajus, M. GC-MS of polyethylene and polypropylene thermal cracking products. Pet. Coal 2006, 48, 1–14. [Google Scholar]
  46. Jouhara, H.; Ahmada, D.; van den Boogaerta, I.; Katsoua, E.; Simonsa, S.; Spencerb, N. Pyrolysis of domestic based feedstock at temperatures up to 300 °C. Ther. Sci. Eng. Prog. 2018, 5, 117–143. [Google Scholar] [CrossRef]
  47. Attinger, D.; Frankiewicz, C.; Betz, A.R.; Schutzius, T.M.; Ganguly, R.; Das, A.; Kim, C.J.; Megaridis, C.M. Surface engineering for phase change heat transfer: A Review. MRS Energy Sustain. 2014, 1, 1. [Google Scholar] [CrossRef] [Green Version]
  48. Kawamoto, H. Lignin pyrolysis reactions. J. Wood Sci. 2017, 63, 117–132. [Google Scholar] [CrossRef] [Green Version]
  49. Lin, F.; Waters, C.L.; Mallinson, R.G.; Lobban, L.L.; Bartley, L.E. Relationships between biomass composition and liquid products formed via pyrolysis. Front. Energy Res. 2015, 3, 45. [Google Scholar] [CrossRef] [Green Version]
  50. Kim, K.H.; Kim, C.S. Recent efforts to prevent undesirable reactions from fractionation to depolymerisation of lignin: Toward maximizing the value from lignin. Front. Energy Res. 2018, 6, 92. [Google Scholar] [CrossRef] [Green Version]
  51. Paulsen, A.D. Primary and Secondary Reactions of Cellulose Melt Pyrolysis. Ph.D. Thesis, University of Massachusetts Amherst, Amherst, MA, USA, 2014. [Google Scholar]
  52. Feng, Y.; Liu, L.; Wang, J.T.; Zhao, S.W.; Guo, Q.X. Homolytic C-H and N-H bond dissociation energies of strained organic compounds. J. Org. Chem. 2004, 69, 3129–3138. [Google Scholar] [CrossRef]
  53. Kruse, T.M.; Wong, H.W.; Broadbelt, L.J. Mechanistic modeling of polymer pyrolysis: Polypropylene. Macromolecules 2003, 36, 9594–9607. [Google Scholar] [CrossRef]
  54. Gunawardena, D.A. Deoxygenation of Biomass Oxygenates to Hydrocarbon Fuels Via Methane Intervention. Ph.D. Thesis, Texas A&M University, College Station, TX, USA, 2014. [Google Scholar]
  55. Antal, M.J., Jr.; Gronli, M. The Art, science and technology of charcoal production. Ind. Eng. Chem. Res. 2003, 42, 1619–1640. [Google Scholar] [CrossRef]
  56. Scheirs, J.; Camino, G.; Tumiatti, W. Overview of water evolution during the thermal degradation of cellulose. Eur. Polym. J. 2007, 37, 933–942. [Google Scholar] [CrossRef]
  57. Sharypov, V.I.; Beregovtsova, N.G.; Kuznetsov, B.N.; Membrado, L.; Cebolla, V.L.; Marin, N.; Weber, J.V. Co-pyrolysis of wood biomass and synthetic polymers mixtures. Part III: Characterisation of heavy products. J. Anal. Appl. Pyrolysis 2003, 67, 325–340. [Google Scholar] [CrossRef]
  58. Vinu, R.; Broadbelt, L.J. Unraveling reaction pathways and specifying reaction kinetics for complex systems. Annu. Rev. Chem. Biomol. Eng. 2012, 3, 29–54. [Google Scholar] [CrossRef]
  59. Ojha, D.K.; Shukla, S.; Sachin, R.S.; Vinu, R. Understanding the interactions between cellulose and polypropylene during fast co-pyrolysis via experiments and DFT calculations. Chem. Eng. Trans. 2016, 50, 67–72. [Google Scholar]
  60. Zhou, X.; Nolte, M.W.; Mayes, H.B.; Shanks, B.H.; Broadbelt, I.J. Experimental and mechanistic modeling of fast pyrolysis of neat glucose-based carbohydrates. 1. Experiments and development of a detailed mechanistic model. Ind. Eng. Chem. Res. 2014, 53, 13274–13289. [Google Scholar] [CrossRef] [Green Version]
  61. Yoshiga, A.; Otaguro, H.; Parra, D.F.; Lima, L.F.C.P.; Lugao, A.B. Controlled degradation and crosslinking of polypropylene induced by gamma radiation and acetylene. Polym. Bull. 2009, 63, 397–409. [Google Scholar] [CrossRef]
  62. Hellier, P.; Ladommatos, N.; Allan, R.; Rogerson, J. The importance of double bond position and cis-trans isomerisation in diesel combustion and emissions. Fuel 2013, 105, 477–489. [Google Scholar] [CrossRef]
Figure 1. Inner schematics of the co-pyrolysis reactor (a), thermocouple configuration at the base of reactor (b).
Processes 08 00057 g001
Figure 2. Experimental and theoretical fraction of non-oxygenated phase in bio-oil (a), the increase of non-polar fraction obtained experimentally compared to that obtained theoretically (b).
Processes 08 00057 g002
Figure 3. Comparison of temperatures of biomass spheres and biomass pyrolysis fluid taken at thermocouple #3 (a), thermocouple #4 (b), thermocouple #5 (c).
Processes 08 00057 g003
Figure 4. Comparison of temperatures of biomass spheres and co-pyrolysis fluid taken at thermocouple #3 (a), thermocouple #4 (b), thermocouple #5 (c). Co-pyrolysis used a feed containing 25% weight of PP.
Processes 08 00057 g004
Figure 5. Fragments of biomass particles in melting PP with feed containing 0% weight of PP (a), combined flocks and fragments of biomass particles in melting PP from a sample taken when co-pyrolysis with feed containing 25% weight of PP (b). Samples were taken when co-pyrolysis achieved 300°C.
Processes 08 00057 g005
Figure 6. Flock of biomass particles in melting PP in co-pyrolysis with feed containing 50% weight of PP (a) and 75% weight of PP (b). Samples were taken when co-pyrolysis achieved 300 °C.
Processes 08 00057 g006
Figure 7. Comparison of temperatures of biomass spheres and co-pyrolysis fluid. Co-pyrolysis used a feed containing 50% weight of PP: (a) Thermocouple #3, (b) Thermocouple #4, (c) Thermocouple #5.
Processes 08 00057 g007aProcesses 08 00057 g007b
Figure 8. Comparison of temperatures of biomass spheres and co-pyrolysis fluid. Co-pyrolysis used a feed containing 75% weight of PP: Thermocouple #3 (a), Thermocouple #4 (b), Thermocouple #5 (c).
Processes 08 00057 g008aProcesses 08 00057 g008b
Figure 9. Temperature profile of pyrolysis fluid in regime 2 measured by Thermocouple #1 (a), Thermocouple #3 (b).
Processes 08 00057 g009
Figure 10. Average water content in polar fractions of bio-oil.
Processes 08 00057 g010
Figure 11. Effect of % weight of PP in feed mixture on %amount of H in non-polar fraction of bio-oil.
Processes 08 00057 g011
Figure 12. H-NMR analysis of wax.
Processes 08 00057 g012
Table 1. H-NMR analysis results of non-polar fractions of bio-oil obtained from co-pyrolysis at various PP compositions.
25%PP in Feed50%PP in Feed75%PP in Feed100%PP in FeedDiesel Fuel
%H at methyl53.6152.8752.7952.9334.90
%H at methylene14.7314.3914.0413.9958.61
%H at methine22.6323.2623.6723.400
%H at allylic C3.843.853.823.810
% H at vinylic C5.015.585.685.870
% H at aromatic ring00001.93
%H at benzylic C00004.56
Branching Index (BI)0.600.570.570.580.40

