Article

Leaching Behaviors of Impurities in Titanium-Bearing Electric Furnace Slag in Sulfuric Acid

1
State Key Laboratory of Complex Nonferrous Metal Resources Clean Utilization, Faculty of Land Resource Engineering, Kunming University of Science and Technology, Kunming 650093, China
2
Department of Mathematics and Physics, West Yunnan University, Lincang 677000, China
*
Authors to whom correspondence should be addressed.
Processes 2020, 8(1), 56; https://doi.org/10.3390/pr8010056
Submission received: 3 September 2019 / Revised: 2 October 2019 / Accepted: 8 October 2019 / Published: 2 January 2020
(This article belongs to the Section Chemical Processes and Systems)

Abstract

:
Titanium-bearing electric furnace slag (TEFS) was prepared from vanadium titanomagnetite and leached with sulfuric acid. The Ti leaching rate of vanadium titanomagnetite TEFS is significantly lower than that of ilmenite TEFS. The impurity content in vanadium titanomagnetite TEFS is higher than that in ilmenite TEFS. This might be one of the main factors resulting in the low leaching rate of Ti, so the leaching behaviors of various impurities under different conditions (temperature, acid/solid weight ratio, particle size, and initial sulfuric acid concentration) were investigated. The following trends were observed under different leaching conditions: The leaching rate of Fe increased rapidly and reached equilibrium quickly, that of Si increased quickly in the early stage and then decreased in the later stage, that of Ca increased initially and reached equilibrium later, and the leaching rates of Mg and Al increased gradually until the equilibrium was reached. The leaching rate of Fe was too rapid to be able to investigate its leaching kinetics, and the insoluble leached products of Si and Ca interfered with their leaching. The effects of leaching parameters on the leaching of impurities were further analyzed by X-ray diffraction (XRD) and scanning electron microscopy analysis. XRD data indicated that spinel is the major Mg- and Al-bearing mineral in TEFS. Mg and Al showed similar leaching behaviors, and their leaching conformed to a new model based on interface transfer and diffusion across the product layer, both of which affect the leaching rate.

1. Introduction

The Panzhihua–Xichang region of China is rich in vanadium titanomagnetite resources with ore reserves of approximately 10 billion tons. The titanium reserves in the Panzhihua–Xichang region account for 90.5% of the total reserves in China and 35.17% of the world’s reserve [1]. Vanadium titanomagnetite concentrates obtained by mineral beneficiation methods contain approximately 52.0% of the titanium of the vanadium titanomagnetite ore [2]. Therefore, it is of great significance to develop effective methods to utilize the vanadium titanomagnetite concentrate, and many methods such as sodium salt roasting/direct reduction/electric furnace smelting, direct reduction/electric furnace smelting, and direct reduction/magnetic separation have been studied toward this goal [3,4,5]. Titanium-bearing electric furnace slag from the direct reduction/electric furnace smelting method has a high Ti grade of 48–60.68 wt% and is easier to extract than the products from other methods [2,6].
Although it is relatively easy to leach Ti from titanium-bearing electric furnace slag (TEFS) derived from ilmenite using sulfuric acid, it is difficult to extract Ti from TEFS produced from vanadium titanomagnetite [2,7,8]. The Ti content of TEFS produced from vanadium titanomagnetite is lower than that of TEFS produced from ilmenite [9,10,11]. Moreover, the content of impurities is higher, which aggravates the leaching rate of Ti during the leaching process and influences the subsequent concentration and hydrolysis of the titanium solution. To date, very few studies have focused on recovering titanium from low-grade TEFS, particularly from TEFS derived from vanadium titanomagnetite. Most of the studies focus on leaching titanium from modified TEFS, which requires more complex processes and incurs higher cost [4,12,13,14,15,16,17,18,19].
Apparently, leaching titanium from low-grade TEFS using sulfuric acid without any pretreatment has become exceptionally important and urgent. Under optimal conditions, the Ti leaching rate of vanadium titanomagnetite TEFS reaches only 84.29%—significantly lower than that of ilmenite TEFS, which could reach 98% [7,20]. CaO, SiO2, and Al2O3 depress the acidolysis of TEFS in sulfuric acid [21,22]. More concretely, CaO reacts with sulfuric acid to yield calcium sulfate precipitation, which is coated on TEFS particles. Excessive SiO2 results in a higher content of silicate glass in TEFS, which is covered on anosovite. TEFS derived from ilmenite is similar in phase composition to that derived from vanadium titanomagnetite but is different in content. Therefore, the low content of Ti and high contents of impurities might be one of the main factors resulting in the low leaching rate of Ti. However, there has been little research on the leaching behaviors of impurities in TEFS when treated with sulfuric acid. Therefore, it is necessary to investigate this aspect, and the findings will be useful for the potential utilization of vanadium titanomagnetite.
In this context, this study examined the leaching behaviors of impurities in low-grade TEFS using sulfuric acid under different conditions (temperature, acid/solid weight ratio, particle size, and initial sulfuric acid concentration).

2. Materials and Methods

2.1. Materials

The TEFS used in this study was prepared from Panzhihua titanomagnetite concentrate by reduction/melting/magnetic separation processing. The chemical compositions of the TEFS analyzed by EDTA titration and ICP analysis revealed that the TEFS contained 58.18 wt% TiO2, 1.34 wt% Fe (mainly existing in the form of metallic iron), 13.94 wt% Al2O3, 10.24 wt% SiO2, 5.43 wt% MgO, and 3.66 wt% CaO, indicating that the major impurities of the TEFS are Al, Si, Mg, Ca, and Fe. X-ray diffraction (XRD) analysis (Figure 1a) and scanning electron microscopy (SEM) imaging (Figure 1b) of the TEFS indicated the major phases of the TEFS to be anosovite (MxTi3−xO5, with 0 ≤ x ≤ 2, M = Ti, Mg, Al, among others), diopside, spinel, and Fe metal. All reagents used in the experiments were of analytical grade, and deionized water was used in all experiments. The water used for analysis was super-purified using a water super-purification machine (WP-2RO-WF-20S, Water purifier).

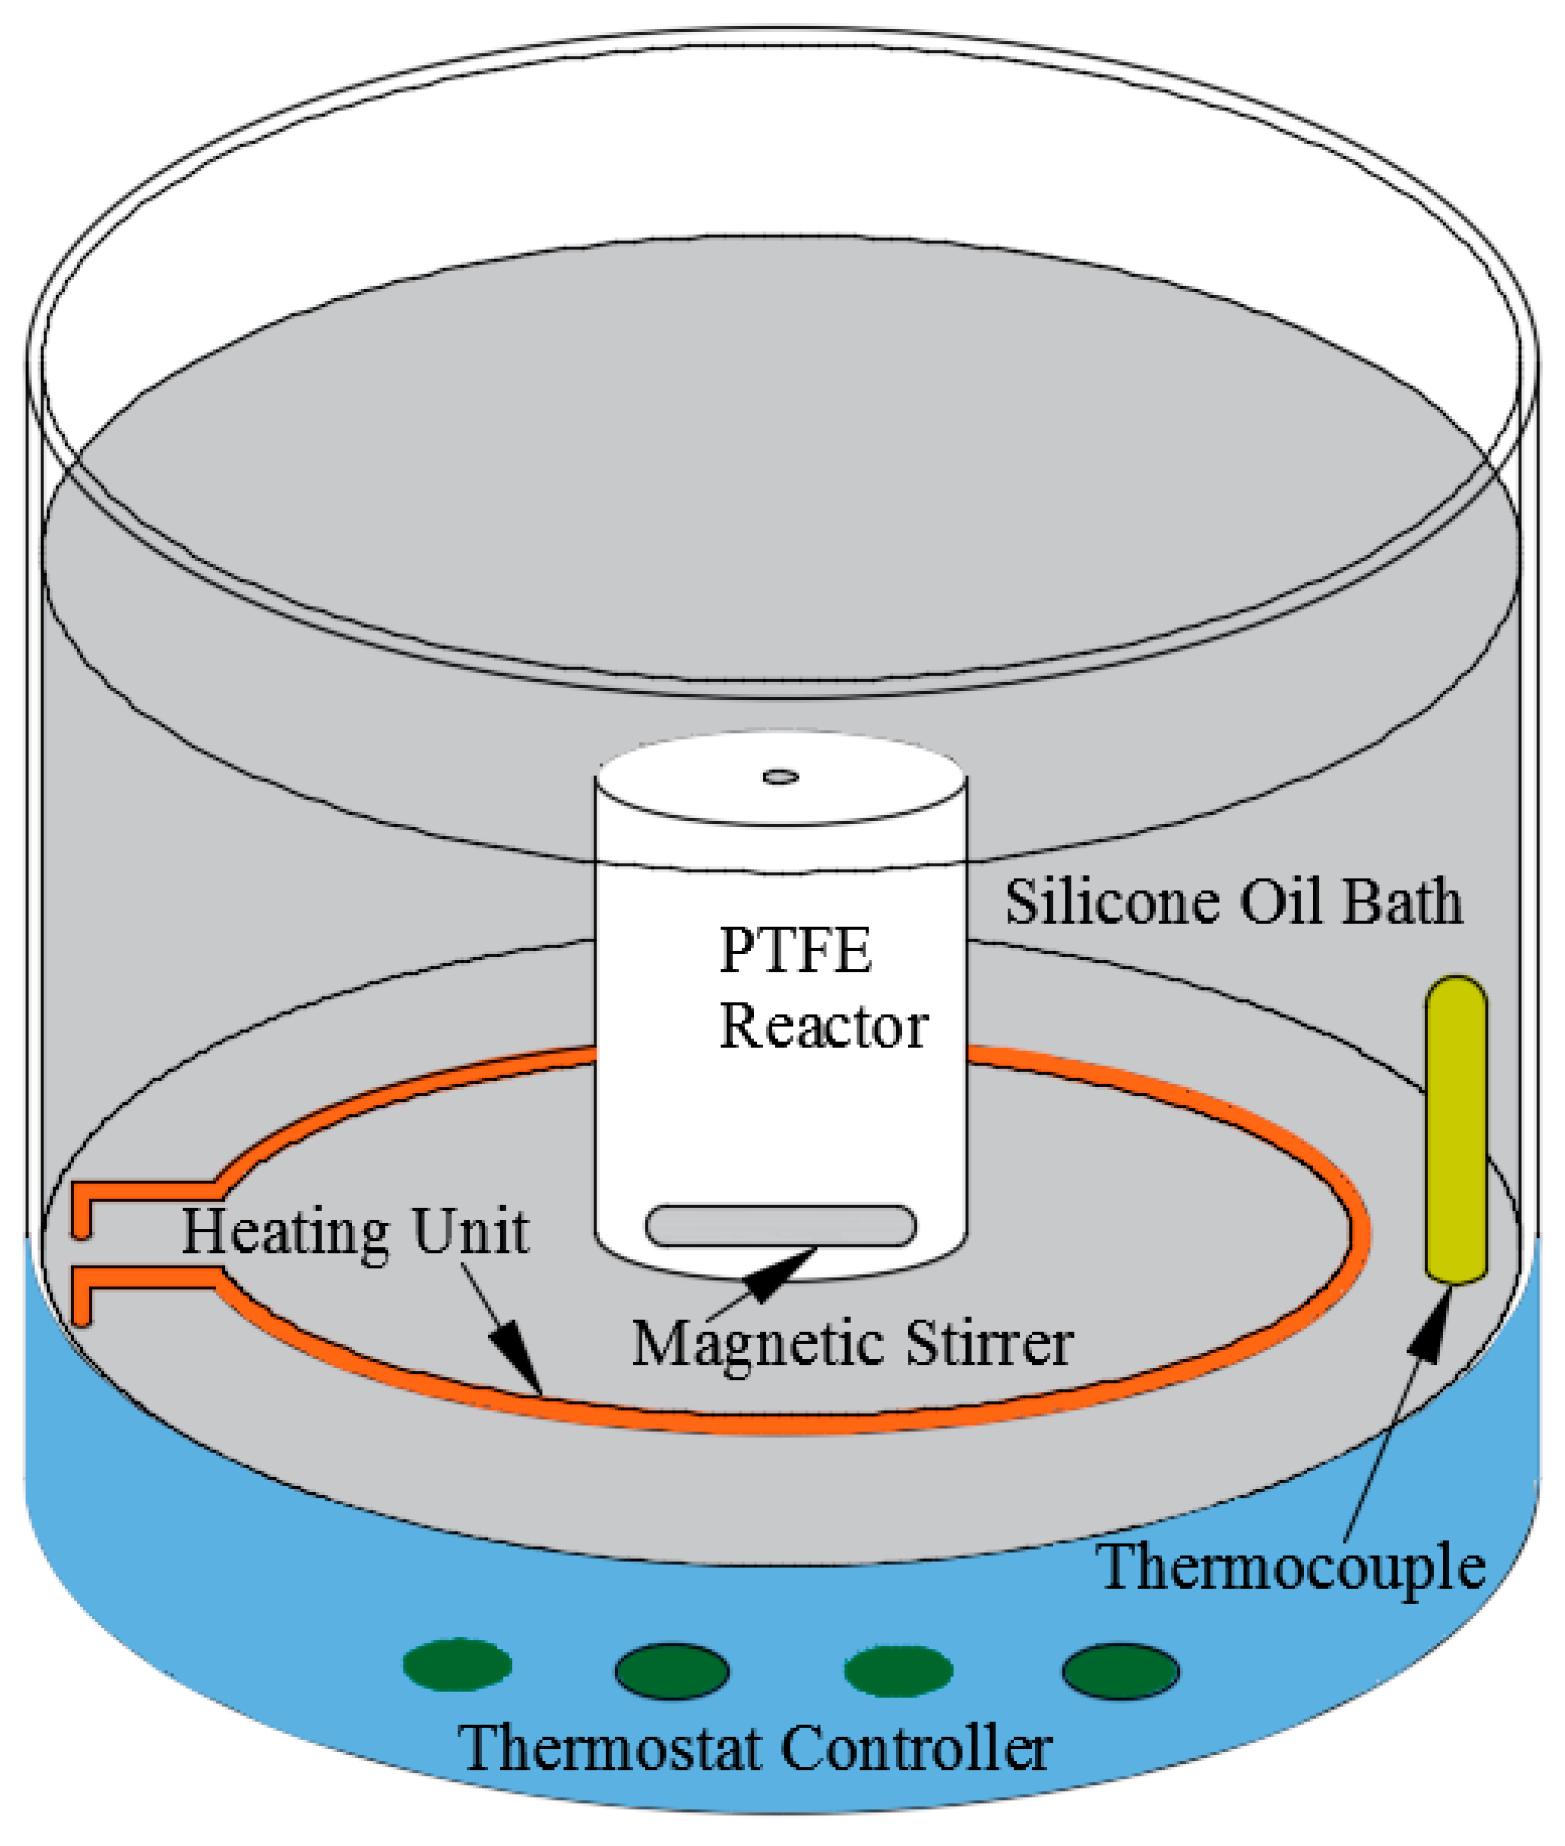
2.2. Apparatus and Procedure

A schematic of the leaching experimental apparatus used in the present work is shown in Figure 2. A cylindrical PTFE reactor, which was fitted with a Teflon-coated magnetic stirrer, was placed in a digitally controlled silicone oil bath used to maintain the required temperature, and every leaching experiment was conducted in it. In each experiment, a 20.00 g aliquot of TEFS was added to the reactor and stirred at 500 rpm. Then, the reactor with the TEFS and sulfuric acid was rapidly heated to the required temperature within 2 min. After 150 min of reaction, the acidolysis products were transferred into a flask and a certain quantity of water was added to cool and dissolve the curing material. Then, the flask was fitted with a reflux condenser for water balance control in a thermally controlled heated water bath and stirred at 500 rpm. Thereafter, the temperature of the flask was increased to 333.15 K and maintained there for 2 h. Finally, the slurry was filtered and washed with deionized water to obtain a solution and residue. The leach residue was subsequently dried in an oven at 373.15 K for 3 h. The chemical compositions of the Ti-bearing solution and residue were analyzed by EDTA titration and ICP analysis. The compositions of the TEFS and residue were also characterized by XRD (Cu Kα radiation, λ = 0.154056 nm, 40 kV, 250 mA, SCAN: 10.0/80.0/0.02/0.15 s, D/max 2200 PC; Rigaku, Japan). Morphological analysis of the samples was performed by field-emission SEM (FESEM, FEI Nova Nano SEM, Hillsboro, OR, USA). The leaching rates of the impurities in the TEFS were calculated according to the mass balance and defined as
ε i = ( 1 m i × e i m 0 × β 0 ) × 100 %
where εi is the leaching rate of the impurity in TEFS; mi and m0 are the mass of the leach residue and initial mass of the TEFS, respectively; and βi and β0 represent the weight fractions of the impurity in the leach residue and dry TEFS sample, respectively.

2.3. Principle

The reaction of TFES with sulfuric acid can be described as follows.
CaMSi2O6 (s) + 2H2SO4 (l) = CaSO4 (s) + MSO4 (s) + 2H2SiO3
MgAl2O4 (s) + 4H2SO4 (l) = MgSO4 (s) + Al2(SO4)3 (s) + 4H2O (g)
FeTiO3 (s) + 2H2SO4 (l) = TiOSO4 (s)+FeSO4 (s) + 2H2O (g)
Fe + H2SO4 (l) = FeSO4 (s) + H2 (g)
MxTi3−xO5 (s) + 5H2SO4 (l) = (3 − x)Ti(SO4)2 (s) + xMSO4 (s) + 5H2O (g)
MxTi3−xO5 (s) + 3H2SO4 (l) = (3 − x)TiOSO4 (s) + xMSO4 (s) + 3H2O (g)

3. Results and Discussion

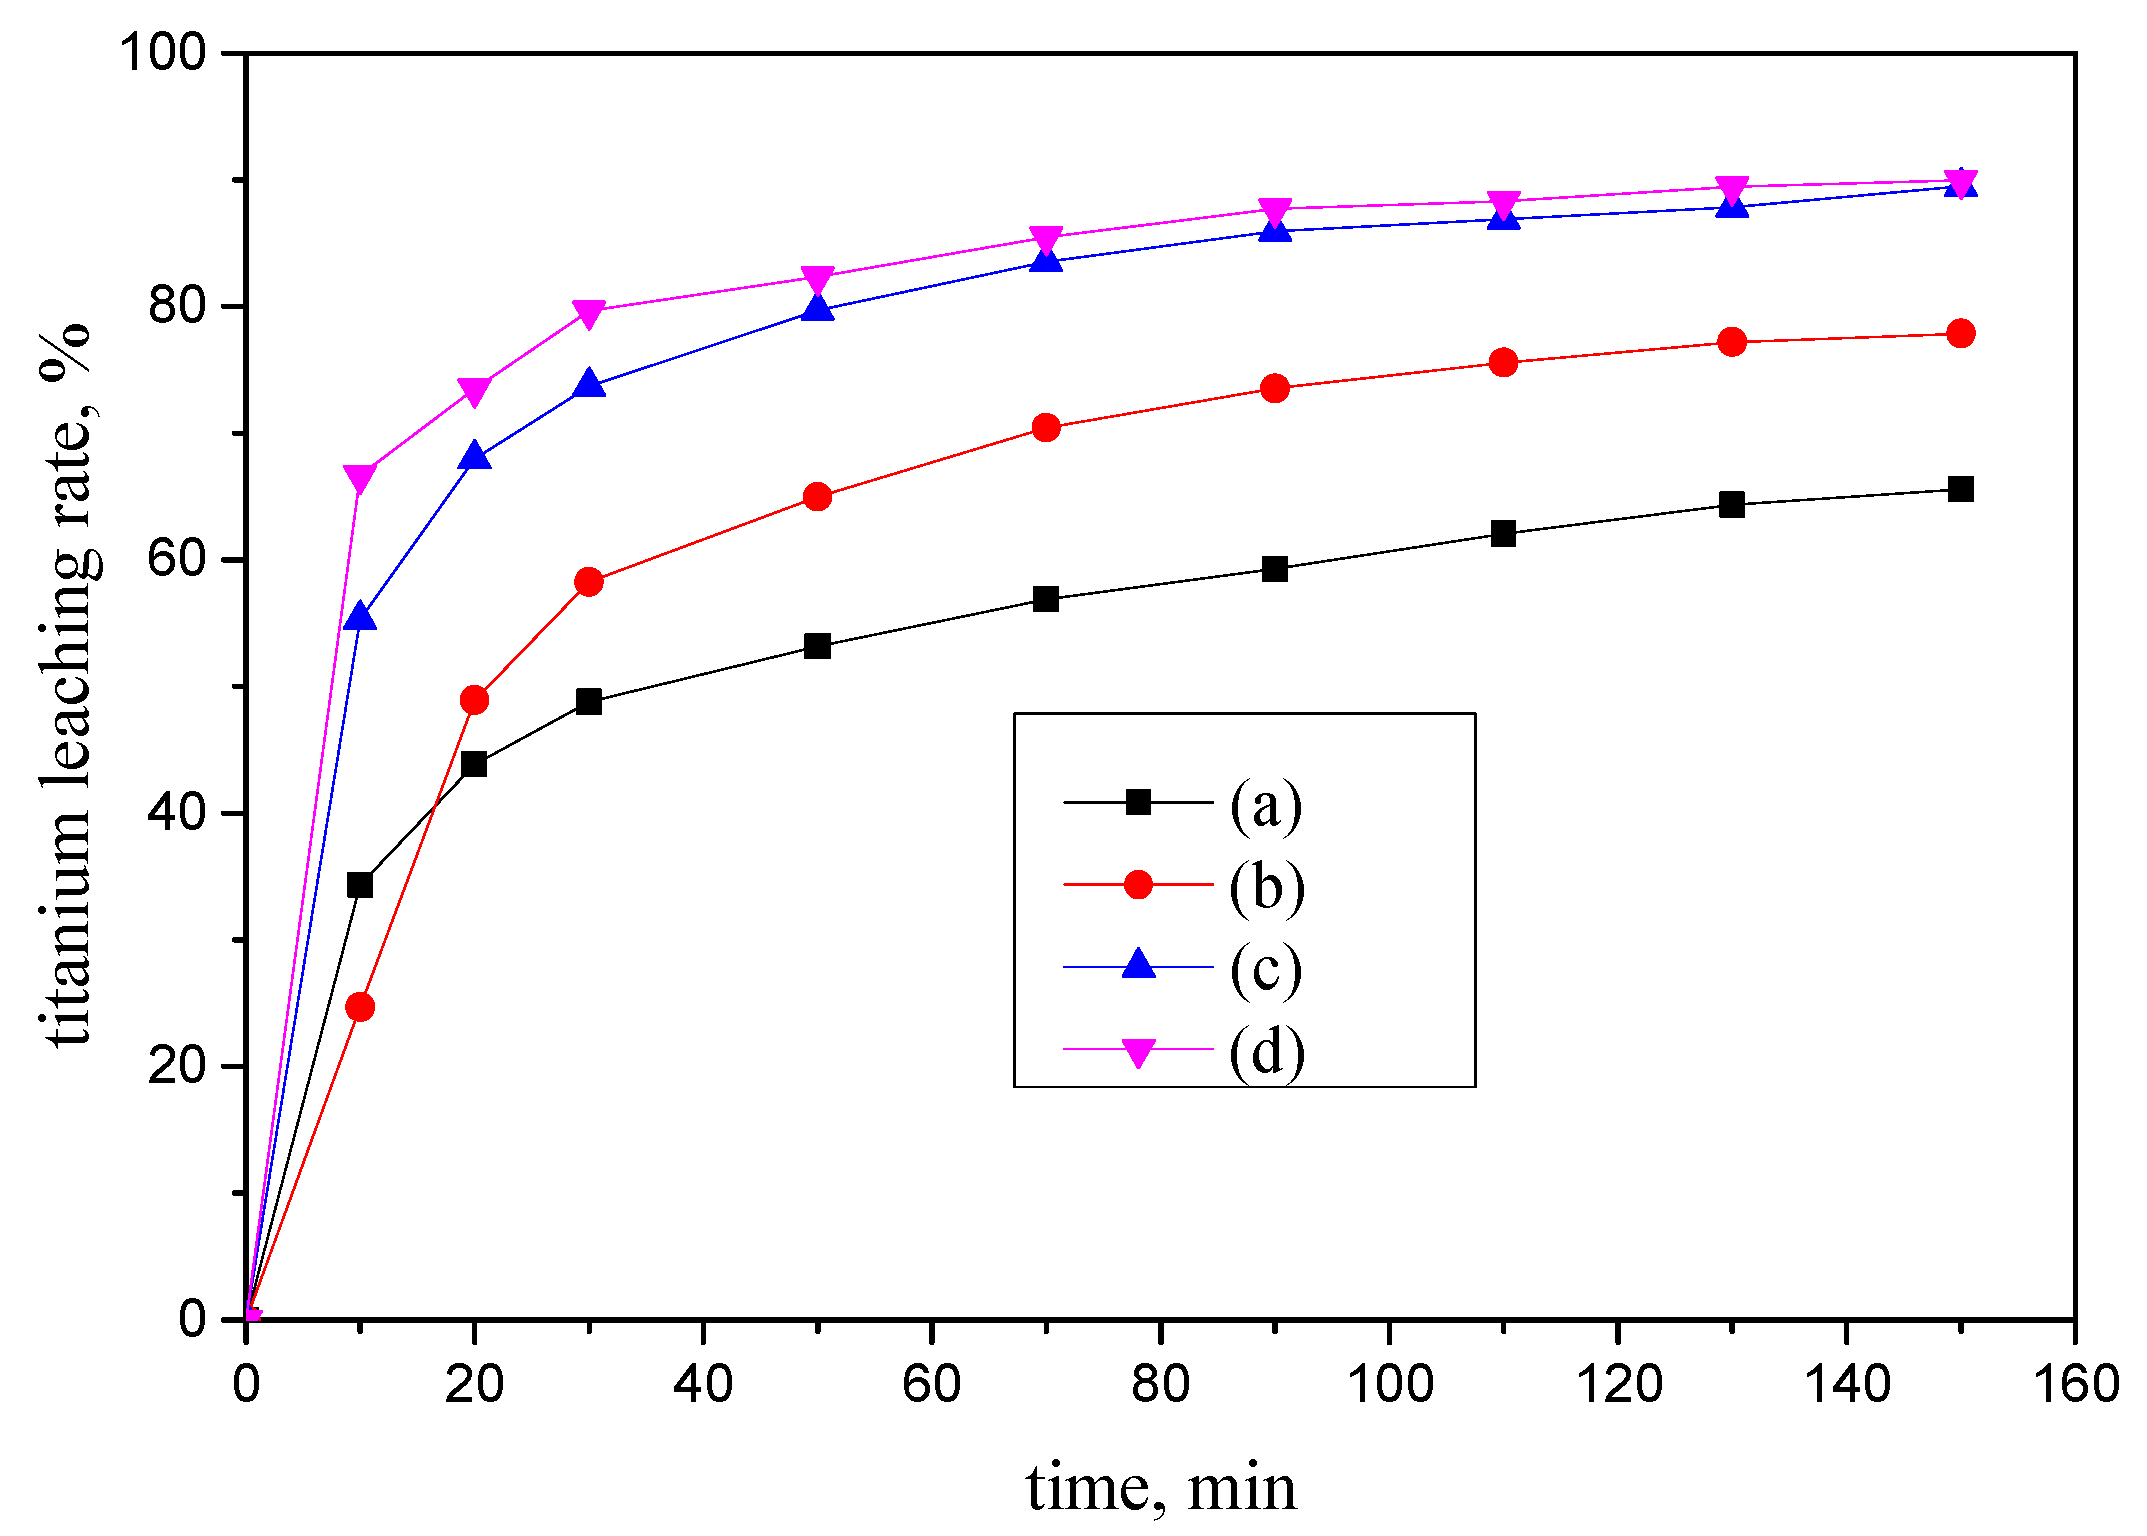
3.1. Ti Leaching Rates under Different Conditions

The Ti leaching rates in four different conditions were investigated. As shown in Figure 3, the comparison of Ti leaching rates in Conditions (a) and (c) shows that a larger average particle size led to a lower leaching rate of Ti. The comparison of Ti leaching rates in Conditions (b) and (c) shows that a lower acidolysis temperature is unfavorable to the Ti leaching rate. The comparison of Ti leaching rates in Conditions (d) and (c) shows that a higher reaction temperature is favorable to the leaching rate of Ti; however, the increase in the Ti leaching rate is marginal when the acidolysis temperature reaches 513.15 K. Under optimal conditions, the Ti leaching rate of vanadium titanomagnetite TEFS only reaches 89.98%, while the Ti extraction of ilmenite TEFS can reach the significantly higher level of 98% [22]. Research suggests that CaO, SiO2, and Al2O3 are unfavorable for the acidolysis of TEFS in sulfuric acid, especially CaO and SiO2. Besides this, the leaching rates of CaO and SiO2 are 16.1% and 0.3%, respectively, both of which are relatively low [23]. The impurity content in vanadium titanomagnetite TEFS is higher than that in ilmenite TEFS. This might be one of the main factors resulting in the low leaching rate of Ti. Thus, the leaching behaviors of various impurities under different conditions were investigated.

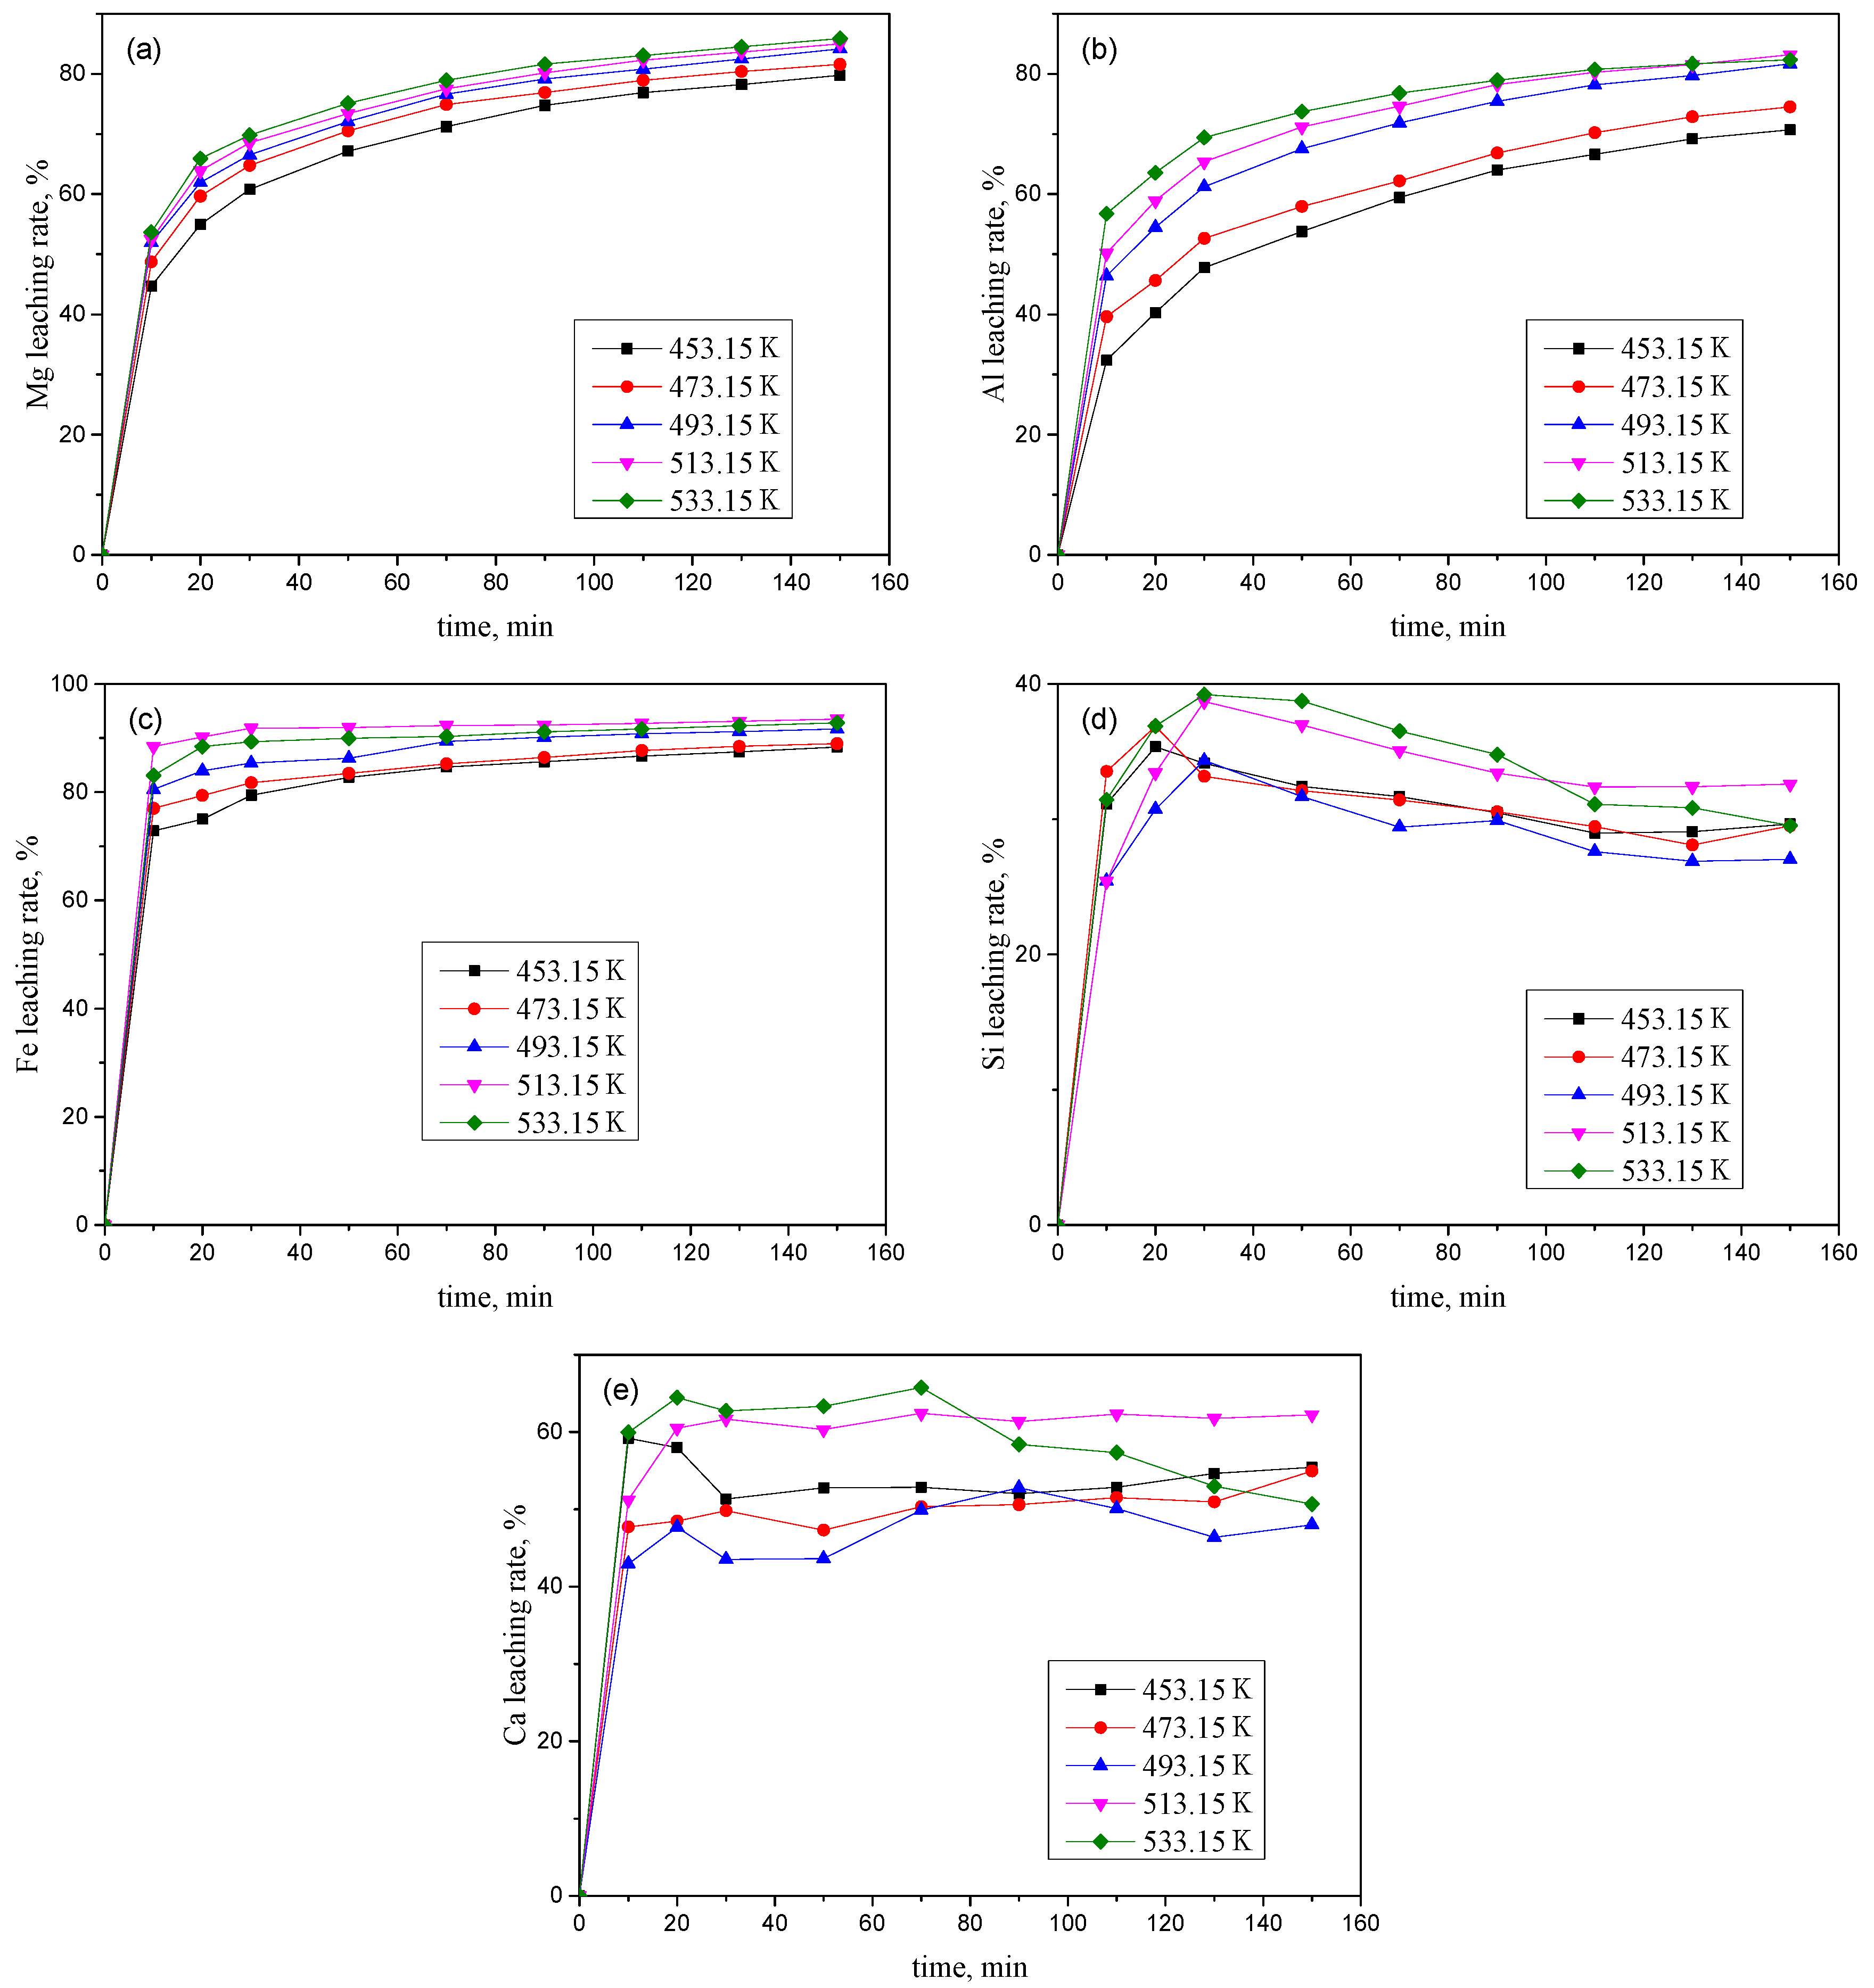
3.2. Effect of Temperature on the Leaching of Impurities

The effect of temperature on the leaching of impurities was investigated within the temperature range of 453.15–533.15 K at an acid/solid weight ratio of 2.0:1, average particle size of 31.5 µm, and initial acid concentration of 88.0 wt% H2SO4.
The Mg and Al leaching rates at different temperatures are shown in Figure 4a,b, respectively. The leaching rates of both Mg and Al increased with increasing temperature, particularly in the first 30 min. Further, with increasing reaction time, the leaching rate gradually reached equilibrium. The XRD pattern (Figure 1a) and FESEM image (Figure 1b) of the TEFS reveal that the major phases of Mg and Al are spinel. Therefore, both Mg and Al show similar leaching behaviors.
The Fe leaching rates at different temperatures shown in Figure 4c indicate that the Fe leaching rate increased as the temperature increased and rapidly reached equilibrium. The XRD pattern (Figure 1a) and FESEM image (Figure 1b) of the TEFS revealed that the major phase of Fe is Fe metal, which rapidly reacts with sulfuric acid, especially at high temperatures.
Figure 4d shows the Si leaching rates at different temperatures. The data indicate that there was no obvious relationship between the leaching rate and temperature. The leaching rate increased in the initial stage of the reaction and generally decreased at a later stage. The XRD pattern (Figure 1a) and FESEM image (Figure 1b) of the TEFS reveal that the major phase of Si is diopside, which could react with sulfuric acid to form H2SiO3, according to Equation (2). Although an increasing amount of Si was leached from the TEFS with the progression of the reaction, superfluous H2SiO3 in the system caused a substantial portion of Si in the solution to aggregate into a colloid, which has poor filterability. This is one of the reasons why the Si leaching rate is low and why it increased at first and then decreased.
The Ca leaching rates at different temperatures shown in Figure 4e also indicate that there was no obvious relationship between the leaching rate and temperature. The Ca leaching rate generally increased with the temperature in the initial stage and rapidly reached equilibrium. The XRD pattern (Figure 1a) and FESEM image (Figure 1b) of the TEFS revealed that the major phase of Ca is diopside, which could react with sulfuric acid to form CaSO4, according to Equation (1). However, CaSO4 is an insoluble product that partly dissolves in the reaction solution.

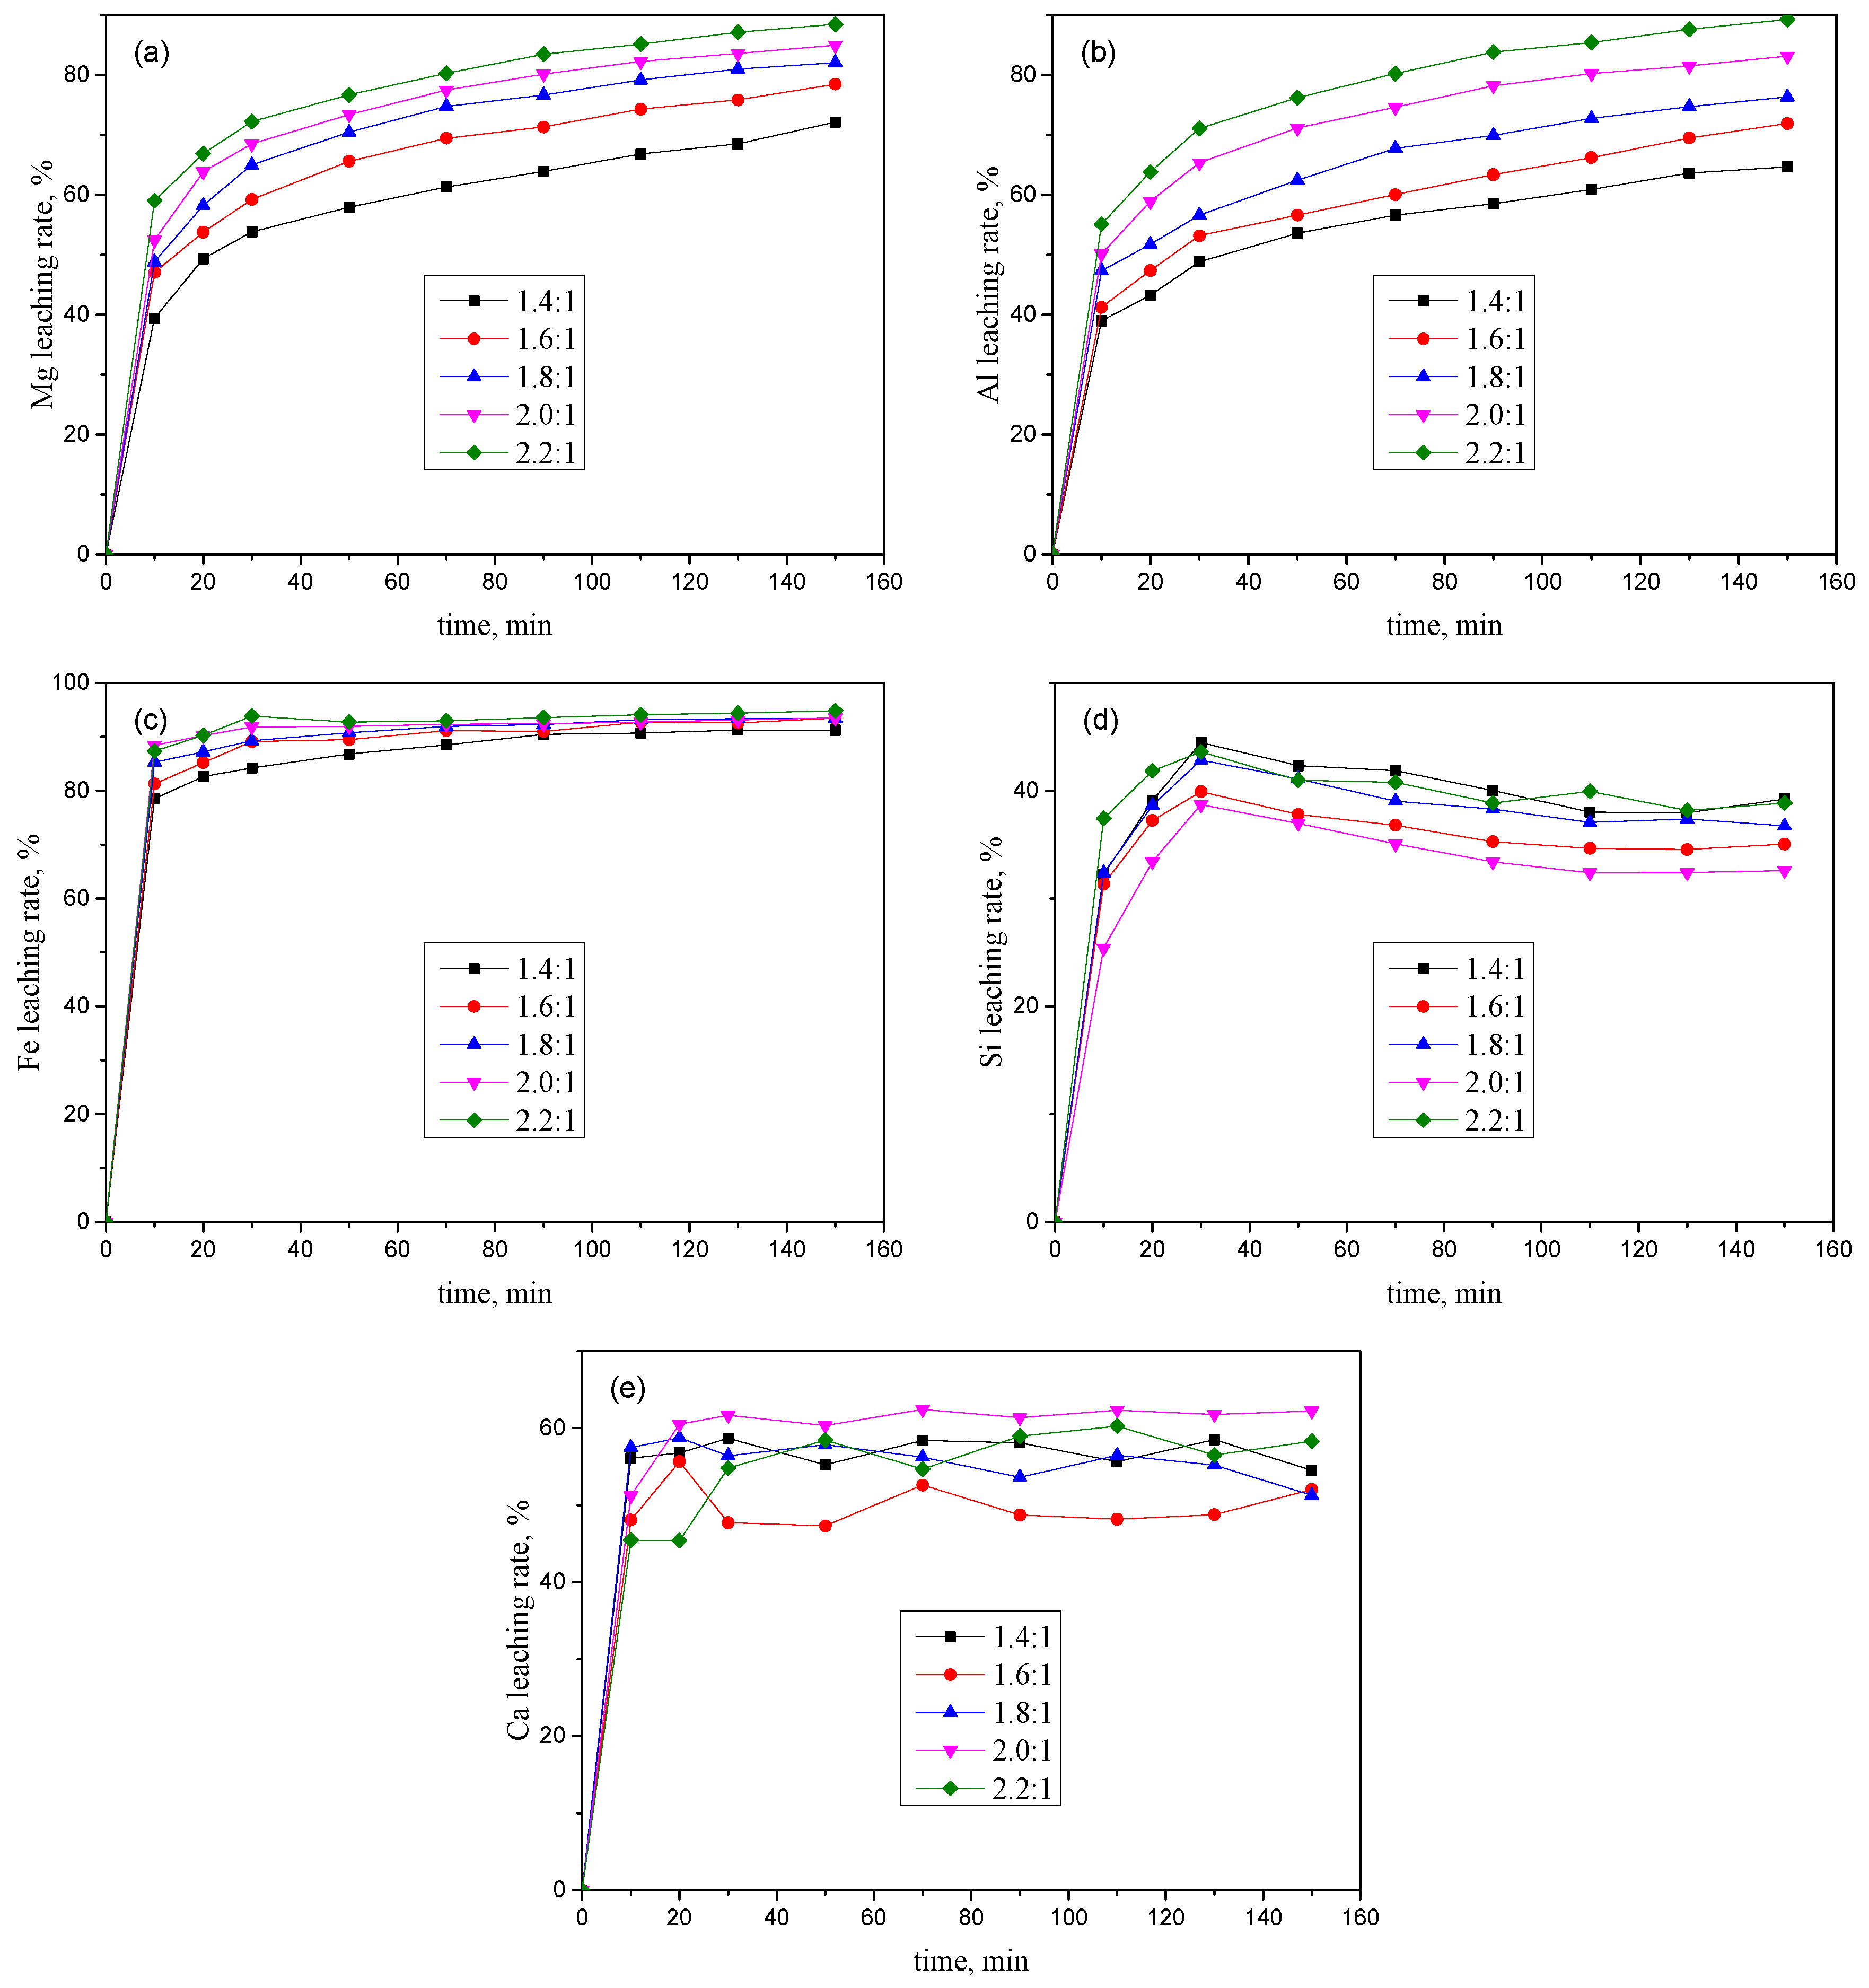
3.3. Effect of the Acid/Solid Weight Ratio on the Leaching of Impurities

A series of leaching experiments were performed in a sulfuric solution at a reaction temperature of 513.15 K, with an average particle size of 31.5 µm and an initial acid concentration of 88.0 wt%, by varying the acid/solid weight ratio.
As shown in Figure 5a,b, the Mg and Al leaching rates increased significantly with increasing acid/solid weight ratio. As the major phases of both Mg and Al are spinel, their leaching behaviors at different acid/solid weight ratios were the same.
As shown in Figure 5c, the Fe leaching rate increased as the acid/solid weight ratio increased and rapidly reached equilibrium. The increase in the Fe leaching rate with the increase in the acid/solid weight ratio was marginal, especially when the acid/solid weight ratio was above 1.4, which implies that the reaction between Fe metal and sulfuric acid proceeded rapidly and that an excess amount of sulfuric acid could only slightly improve the leaching rate of Fe.
As shown in Figure 5d, there was no obvious relationship between the leaching rate of Si and the acid/solid weight ratio. The leaching rate increased in the first 30 min and then generally decreased in the later stage.
Further, the Ca leaching rates at different acid/solid weight ratios (Figure 5e) also indicate that there was no obvious relationship between the leaching rate and acid/solid weight ratio. The Ca leaching rate increased rapidly in the initial stage and then reached equilibrium. As CaSO4 is an insoluble product, it partially dissolves in the sulfuric acid solution. Therefore, the solubility of CaSO4 in the solution determines its content in the solution and not the quantity leached from the TEFS.

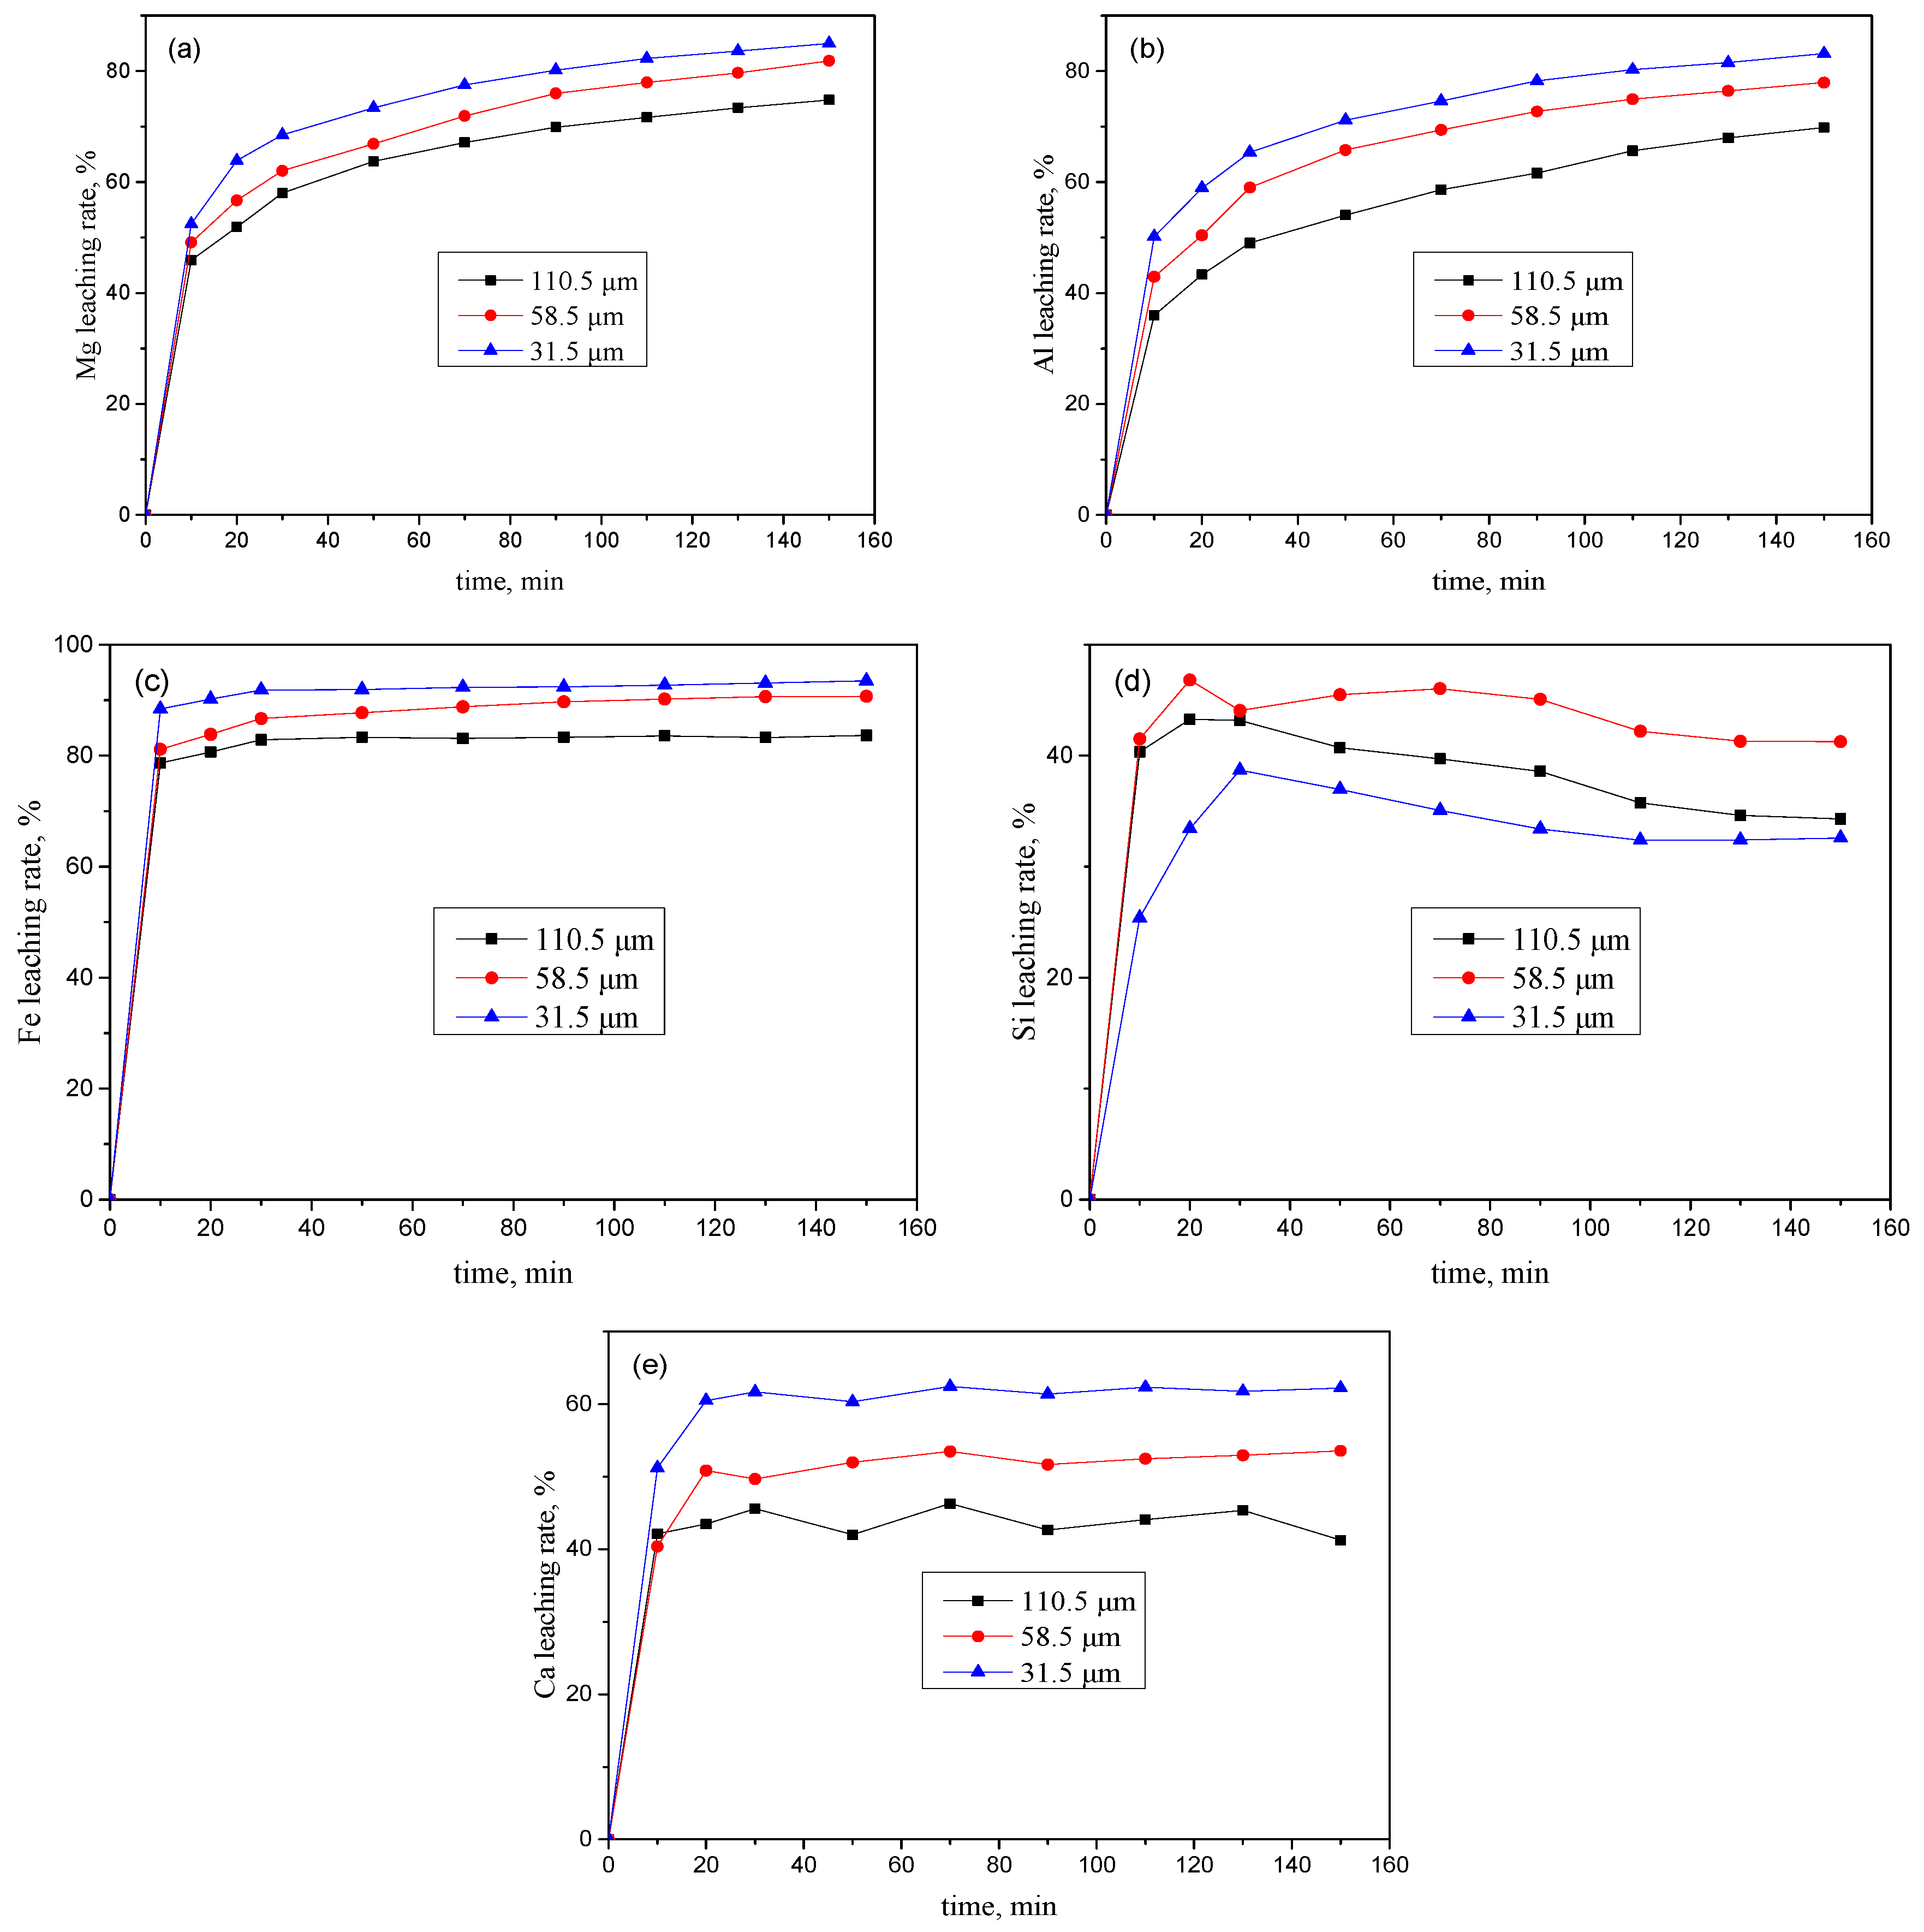
3.4. Effect of Particle Size on the Leaching of Impurities

The leaching experiments were performed in an 88.0 wt% H2SO4 solution at an acid/solid weight ratio of 2.0:1 and a reaction temperature of 513.15 K using TEFS samples with three different average particle sizes, viz., 110.5 µm, 58.5 µm, and 31.5 µm.
As shown in Figure 6a,b, the Mg and Al leaching rate increased with a decrease in the particle size. The interfacial reaction between sulfuric acid and TEFS particles was increased due to the larger specific surface area of the finer particles, and it effectively promoted the leaching reactions.
As shown in Figure 6c, the Fe leaching rate increased with a decrease in the particle size. The larger specific surface area of the finer particles increased the interface reaction and effectively promoted the leaching reactions.
Figure 6d shows the results of the Si leaching rates from TFES samples with different particle sizes. The Si leaching rate from 58.5 µm particles was higher than those from 110.5 µm and 31.5 µm particles. The colloidal coagulation and precipitation of H2SiO3 caused the increase in the leaching rate in the initial stage of the reaction and its decrease in the later stage.
The Ca leaching rates at different particle sizes shown in Figure 6e indicate that the Ca leaching rate increased as the particle size decreased.

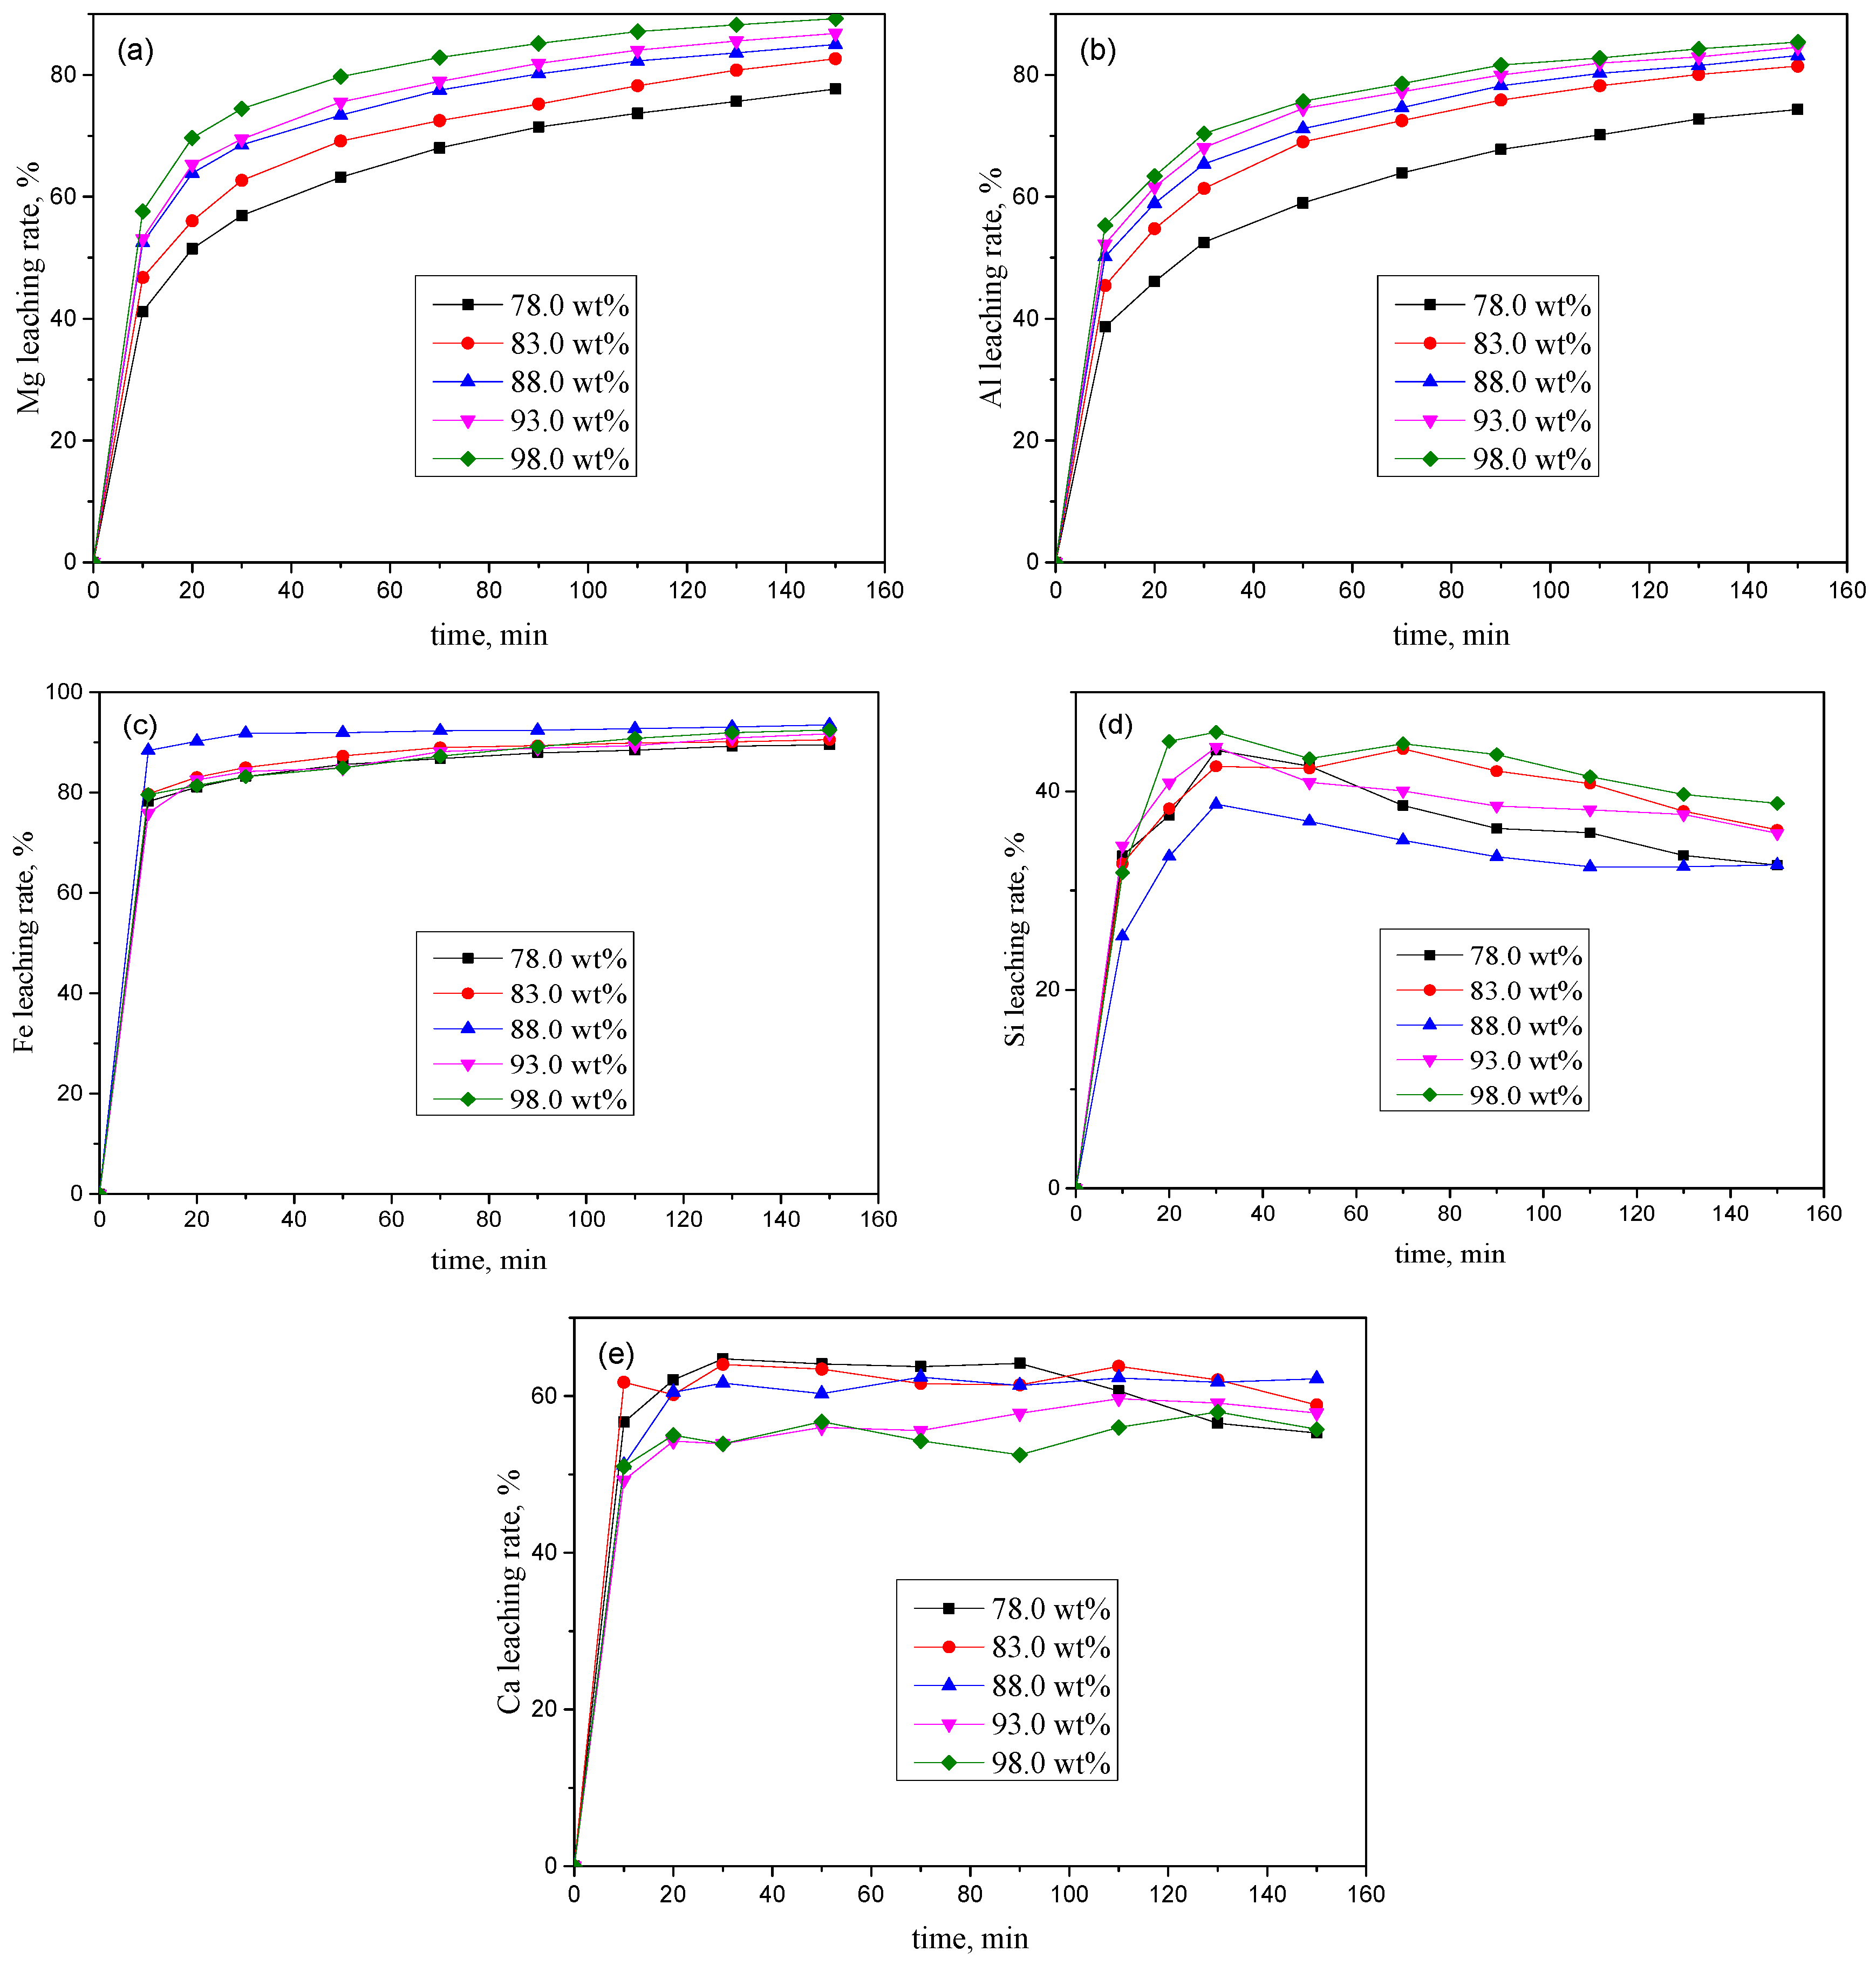
3.5. Effect of Initial Sulfuric Acid Concentration on the Leaching of Impurities

The effect of the initial sulfuric acid concentration on the leaching rate of the impurities was studied at the temperature of 513.15 K, an acid/solid weight ratio of 2.0:1, and an average particle size of 31.5 µm.
As shown in Figure 7a,b, increasing the sulfuric acid concentration generally led to an increase in the Mg and Al leaching rates.
Figure 7c shows that the Fe leaching rate generally decreased after the first increase. At the initial sulfuric acid concentration of 88.0 wt%, the Fe leaching rate was 91.84% after 30 min of leaching. However, when the sulfuric acid concentration was increased to 98.0 wt%, the Fe leaching rate was lower at 83.20% after 30 min of leaching.
As shown in Figure 7d,e, the leaching rates of Si and Ca at different initial sulfuric acid concentrations were somewhat different and did not show significant differences in the leaching rate over time. The leaching rate of Si increased in the early stage of the reaction but generally decreased in the later stage at all initial sulfuric acid concentrations. The Ca leaching rate generally decreased as the initial sulfuric acid concentration increased in the early stage and gradually reached equilibrium.

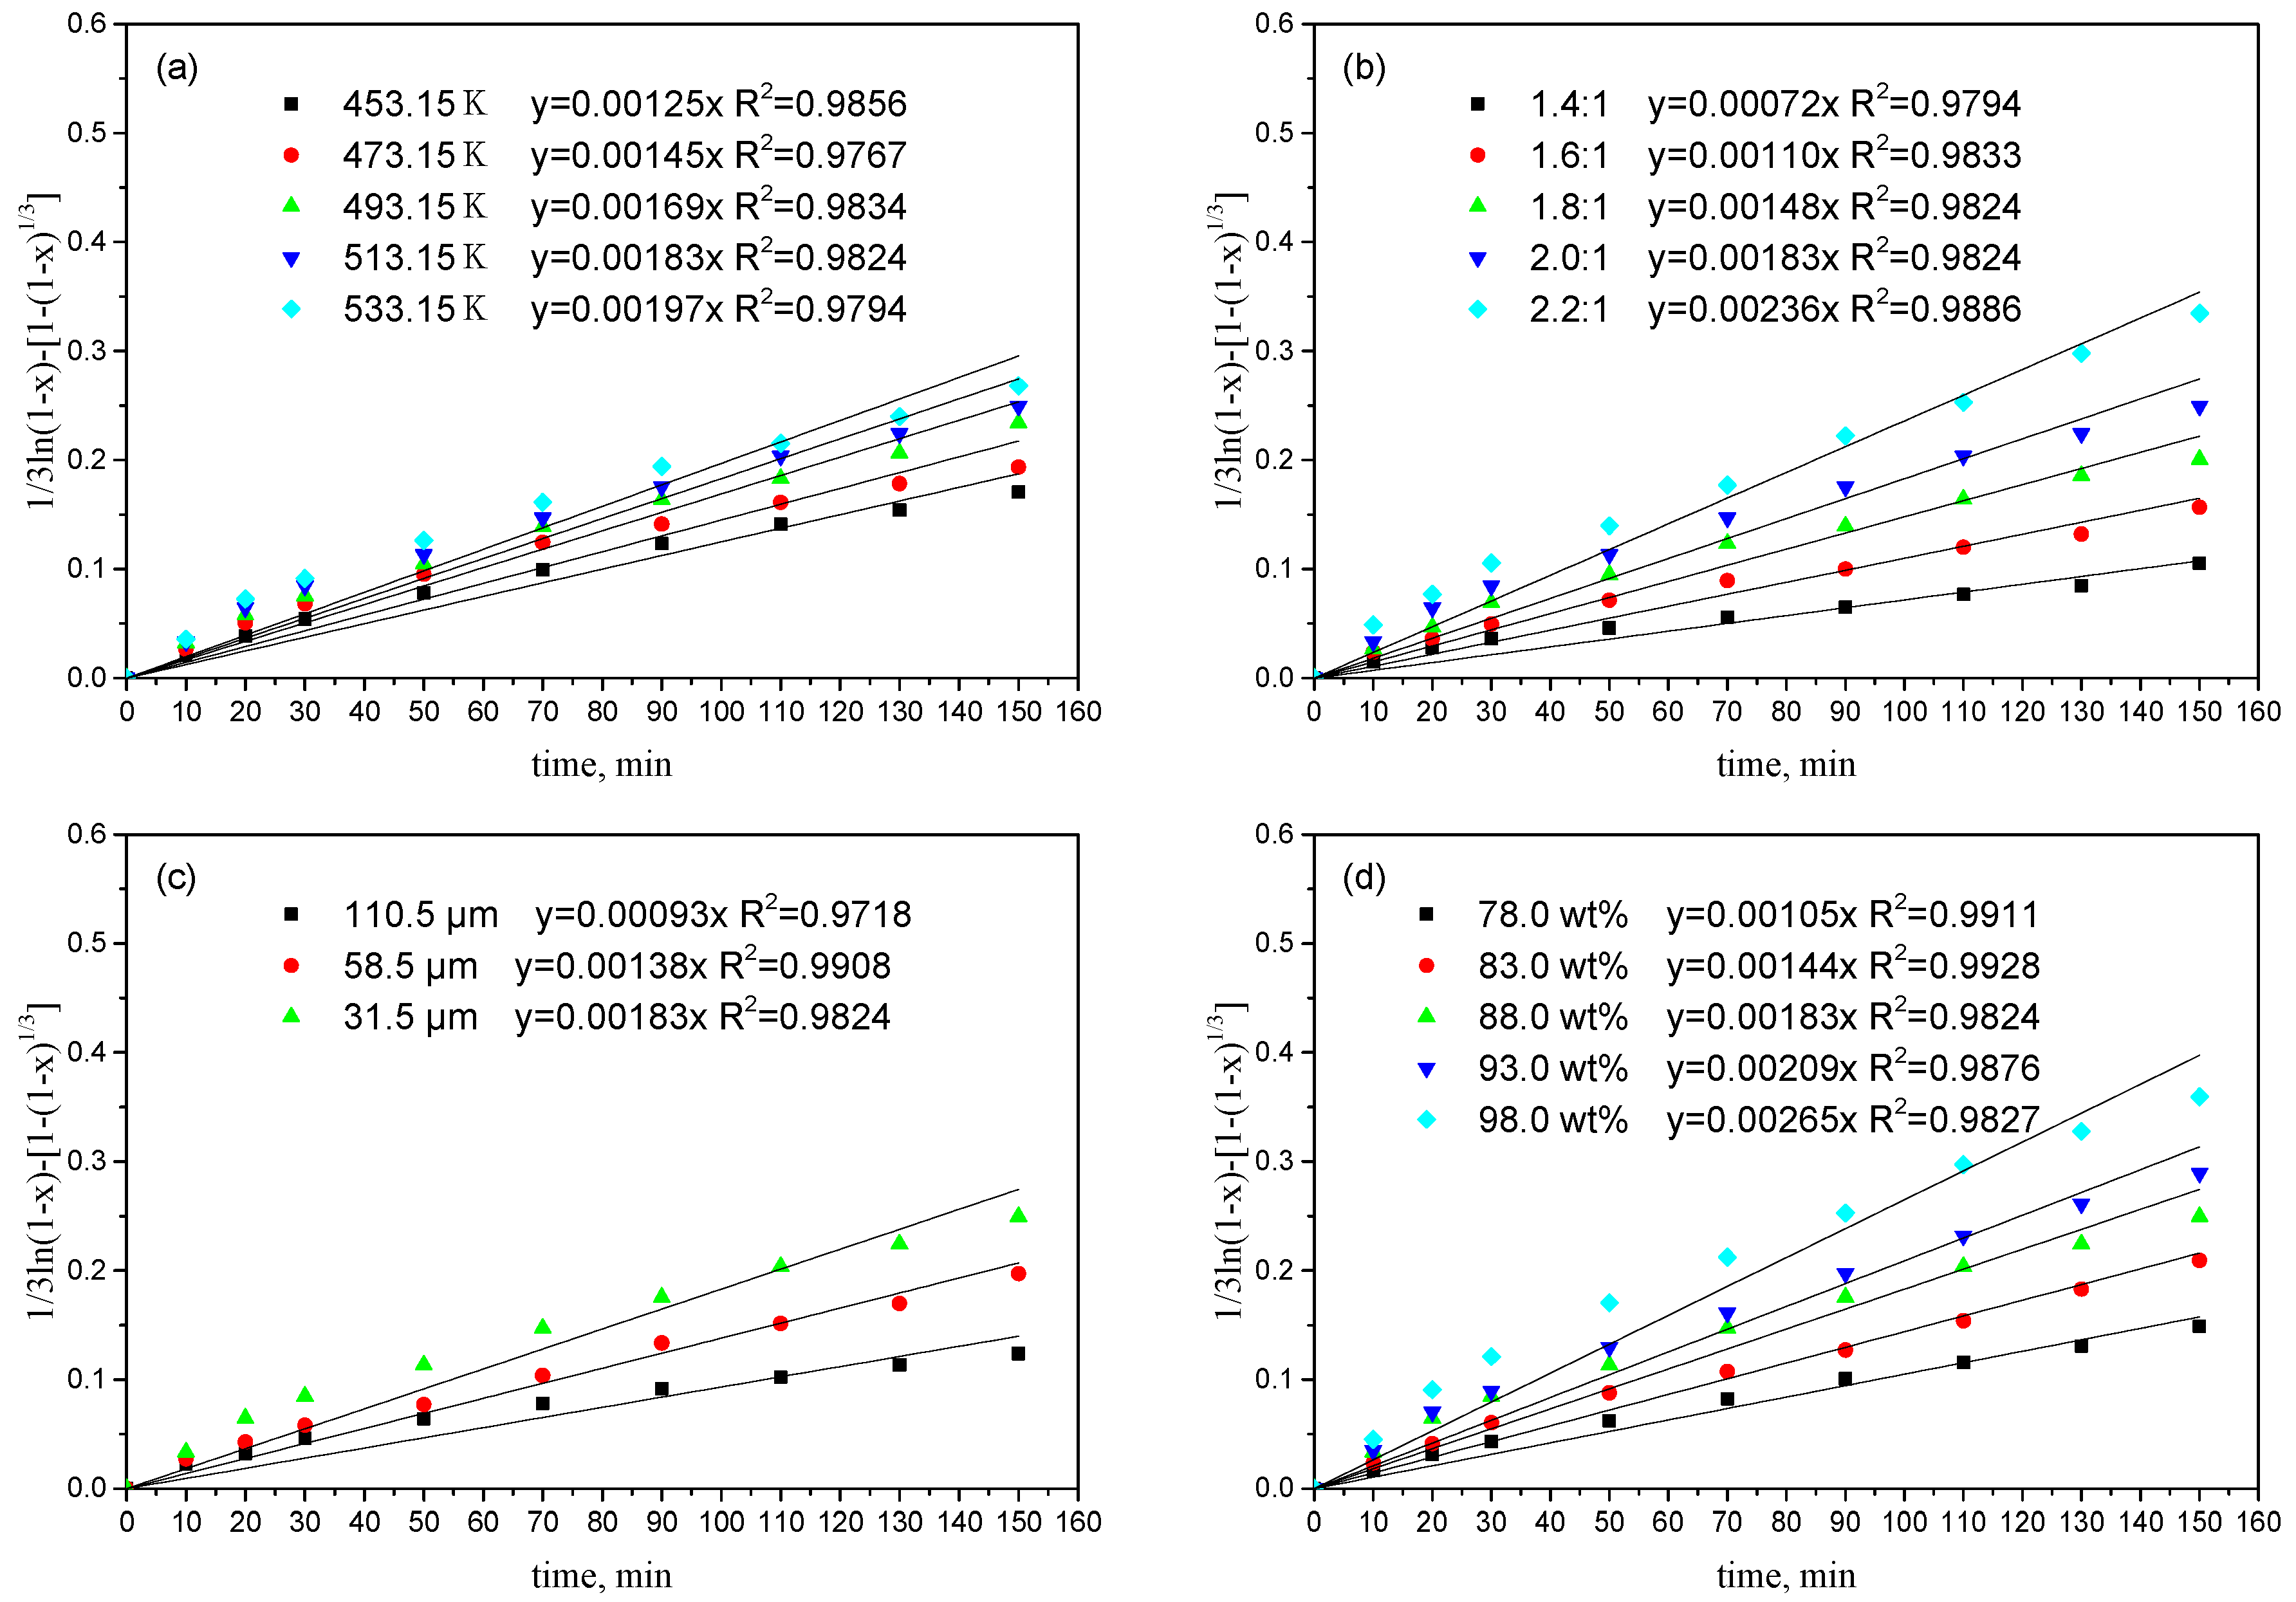
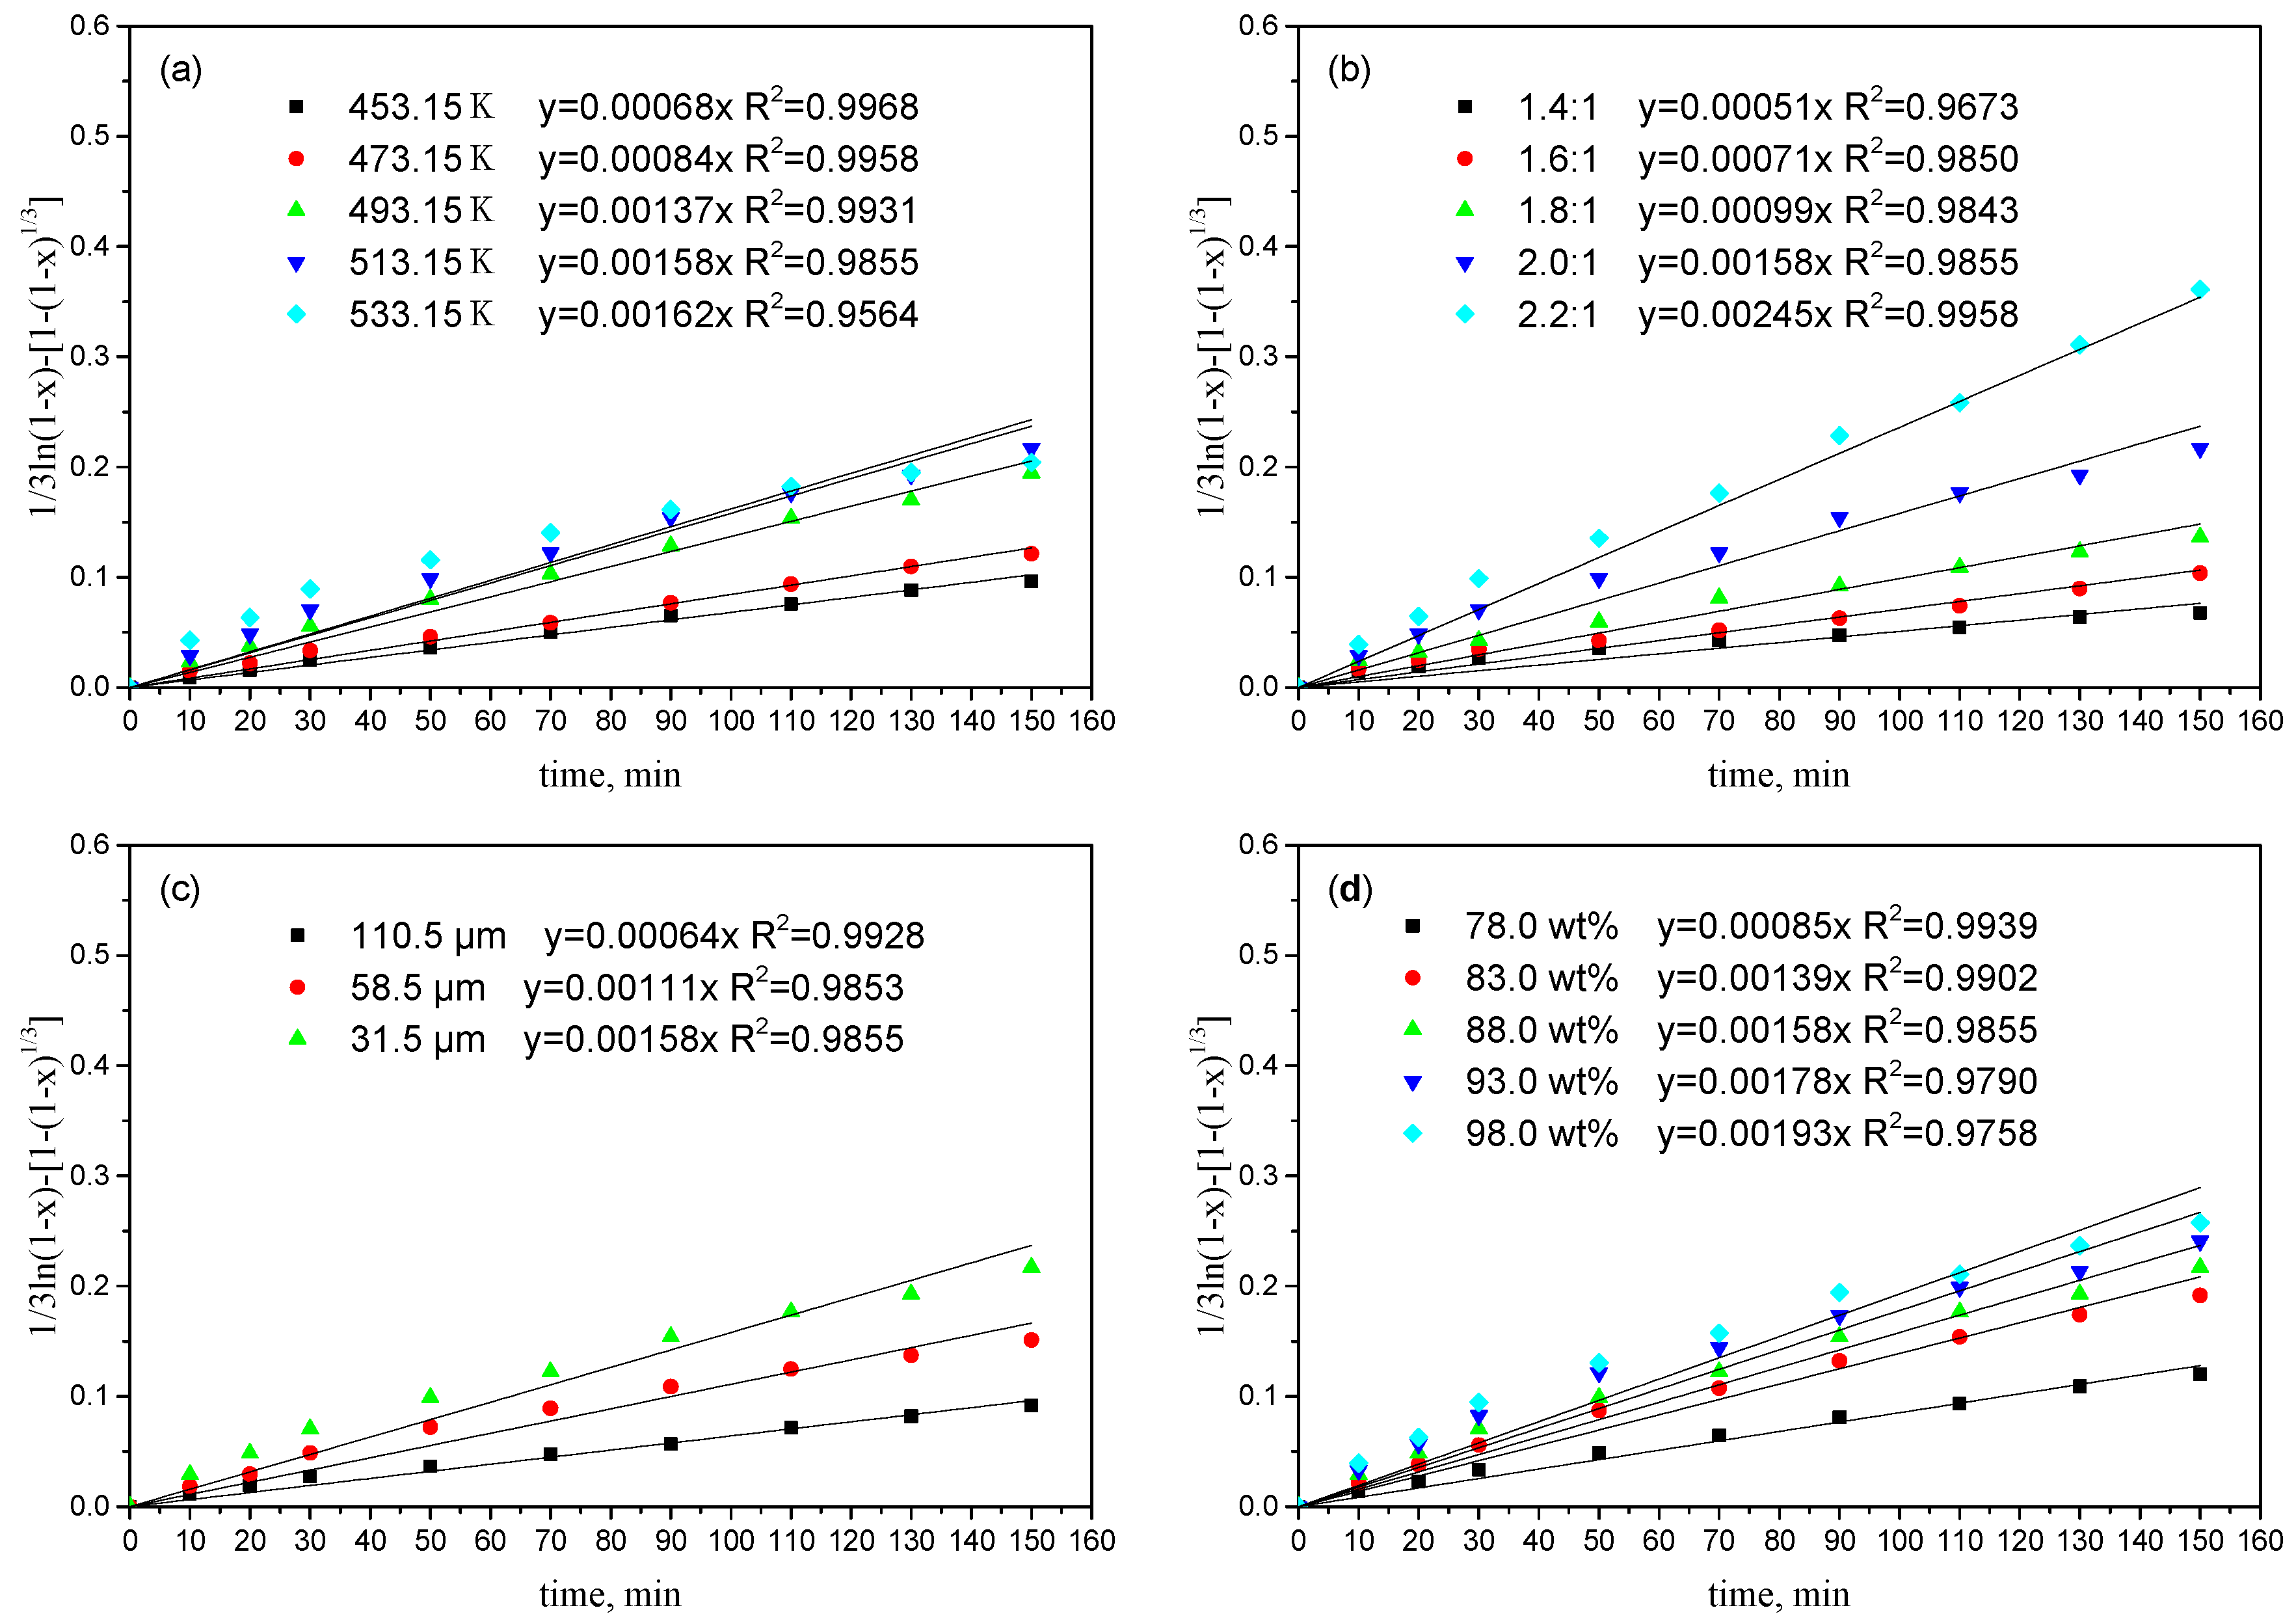
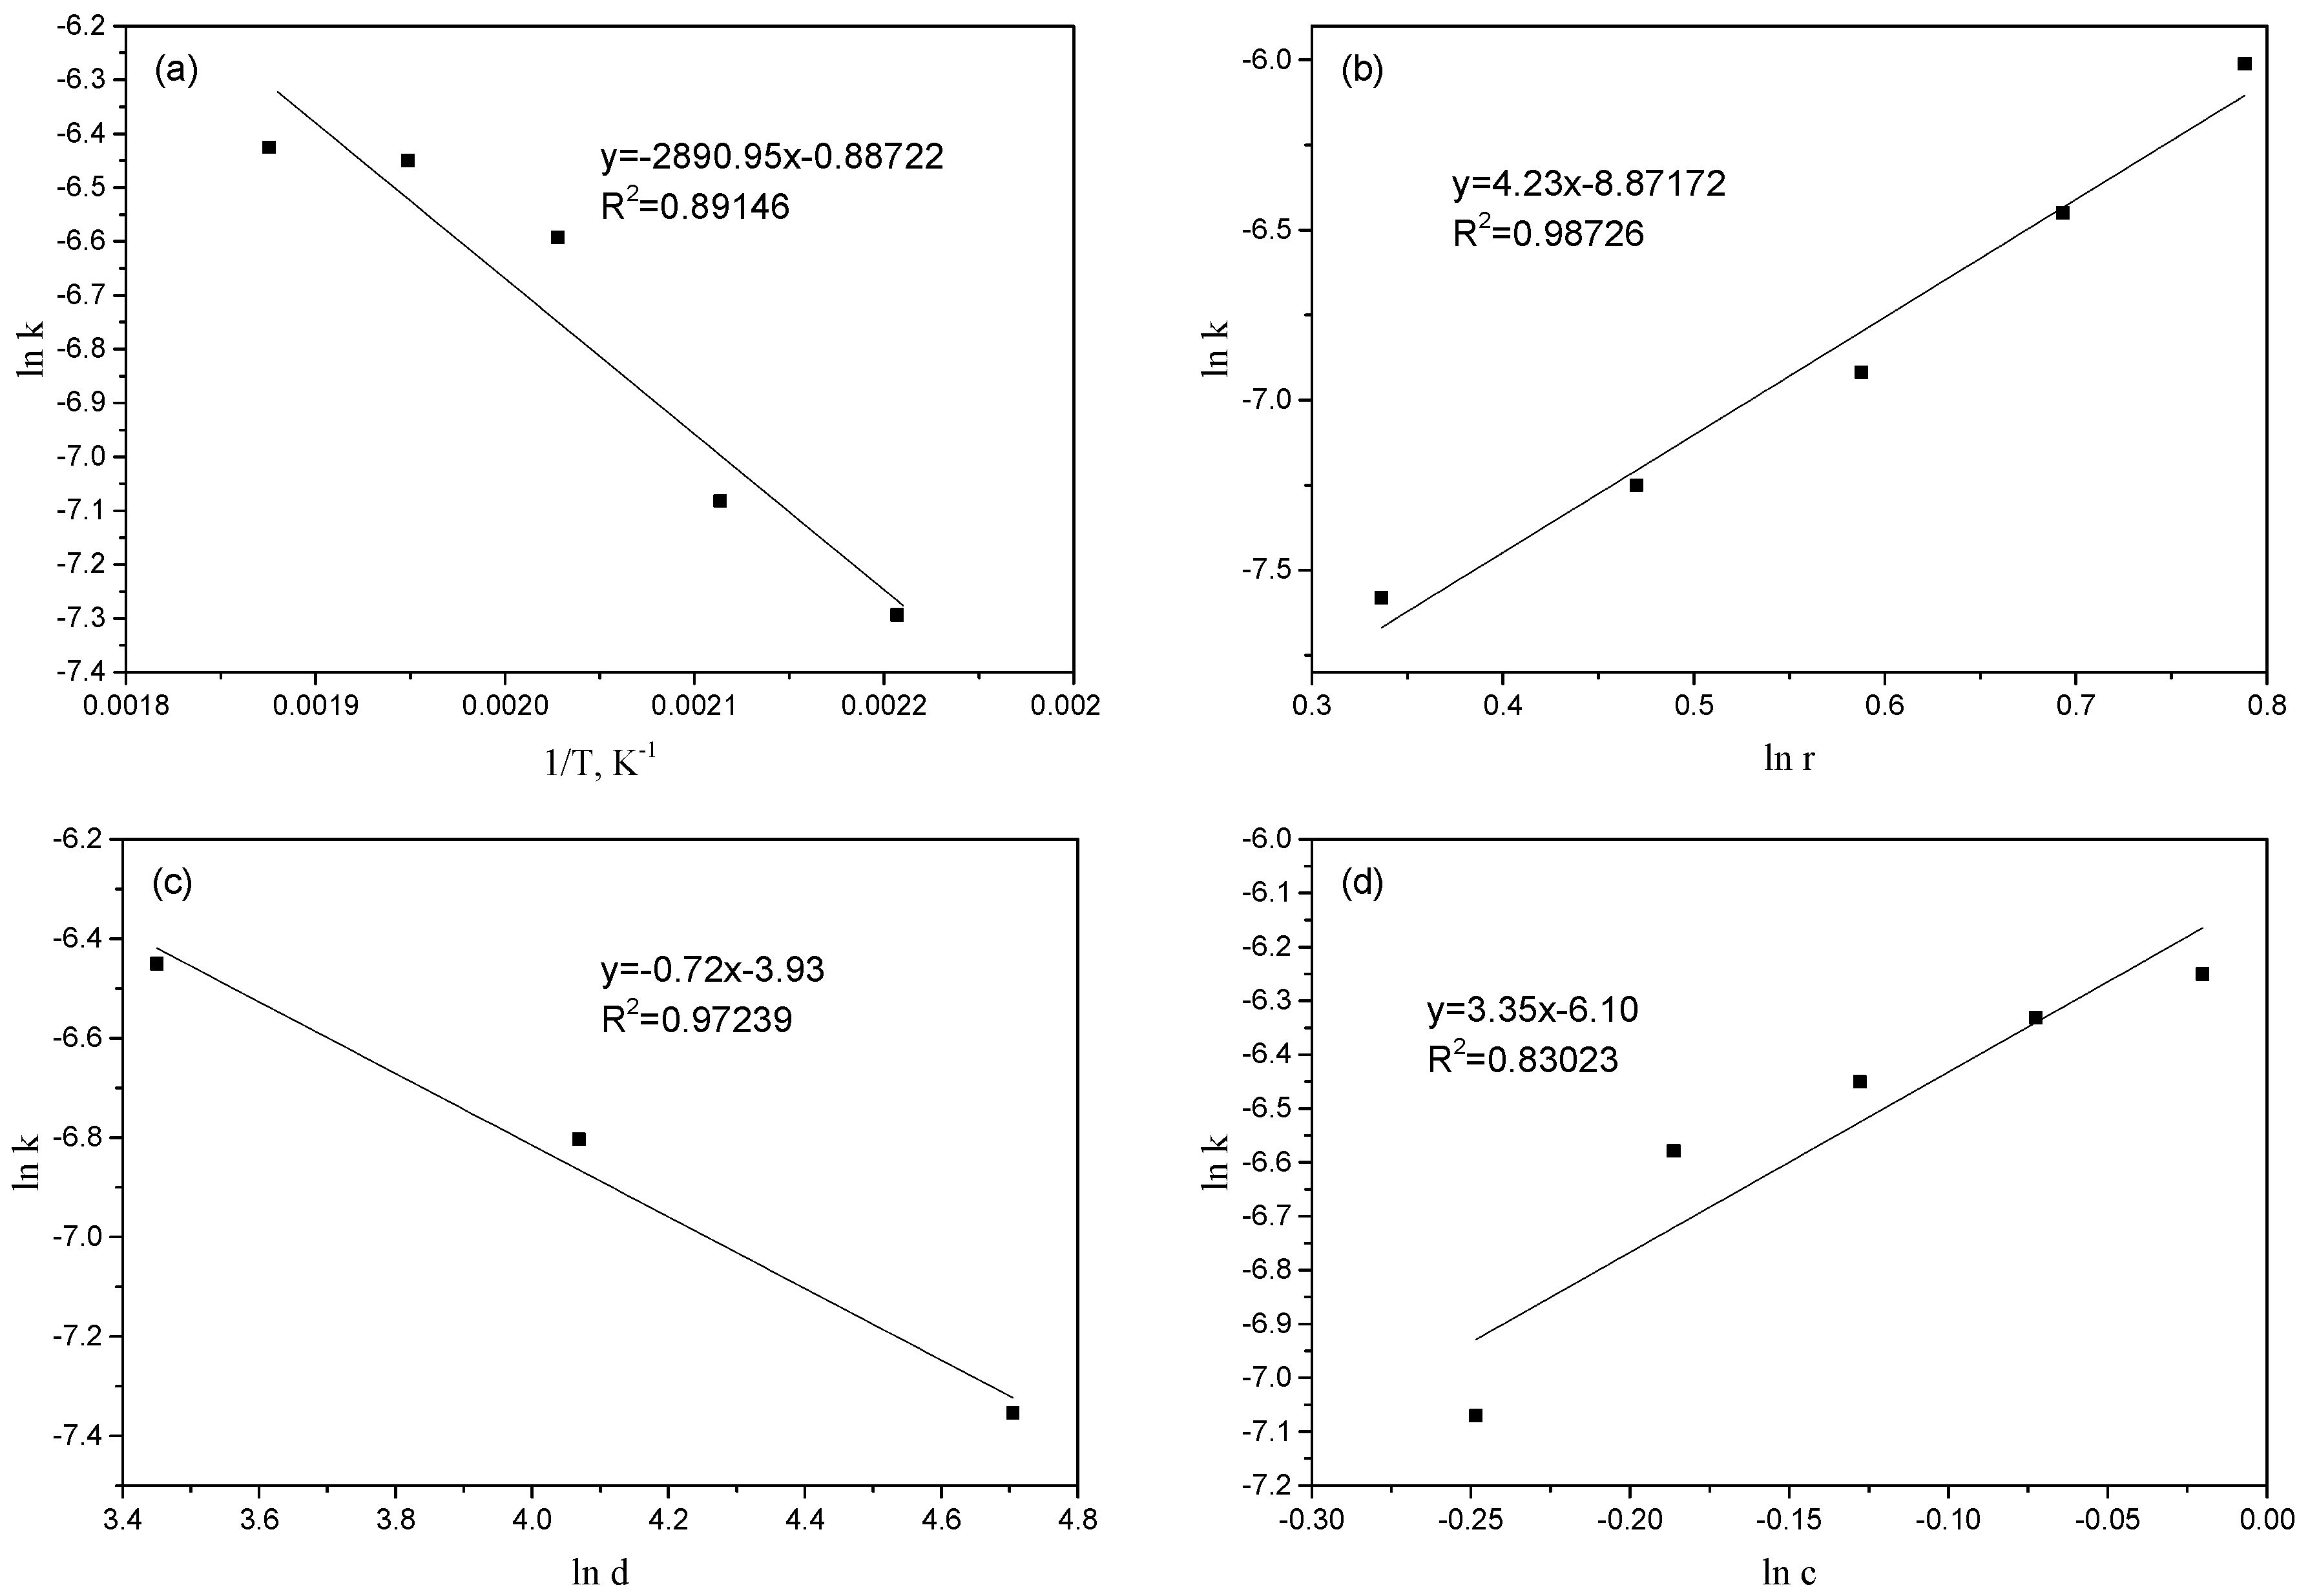
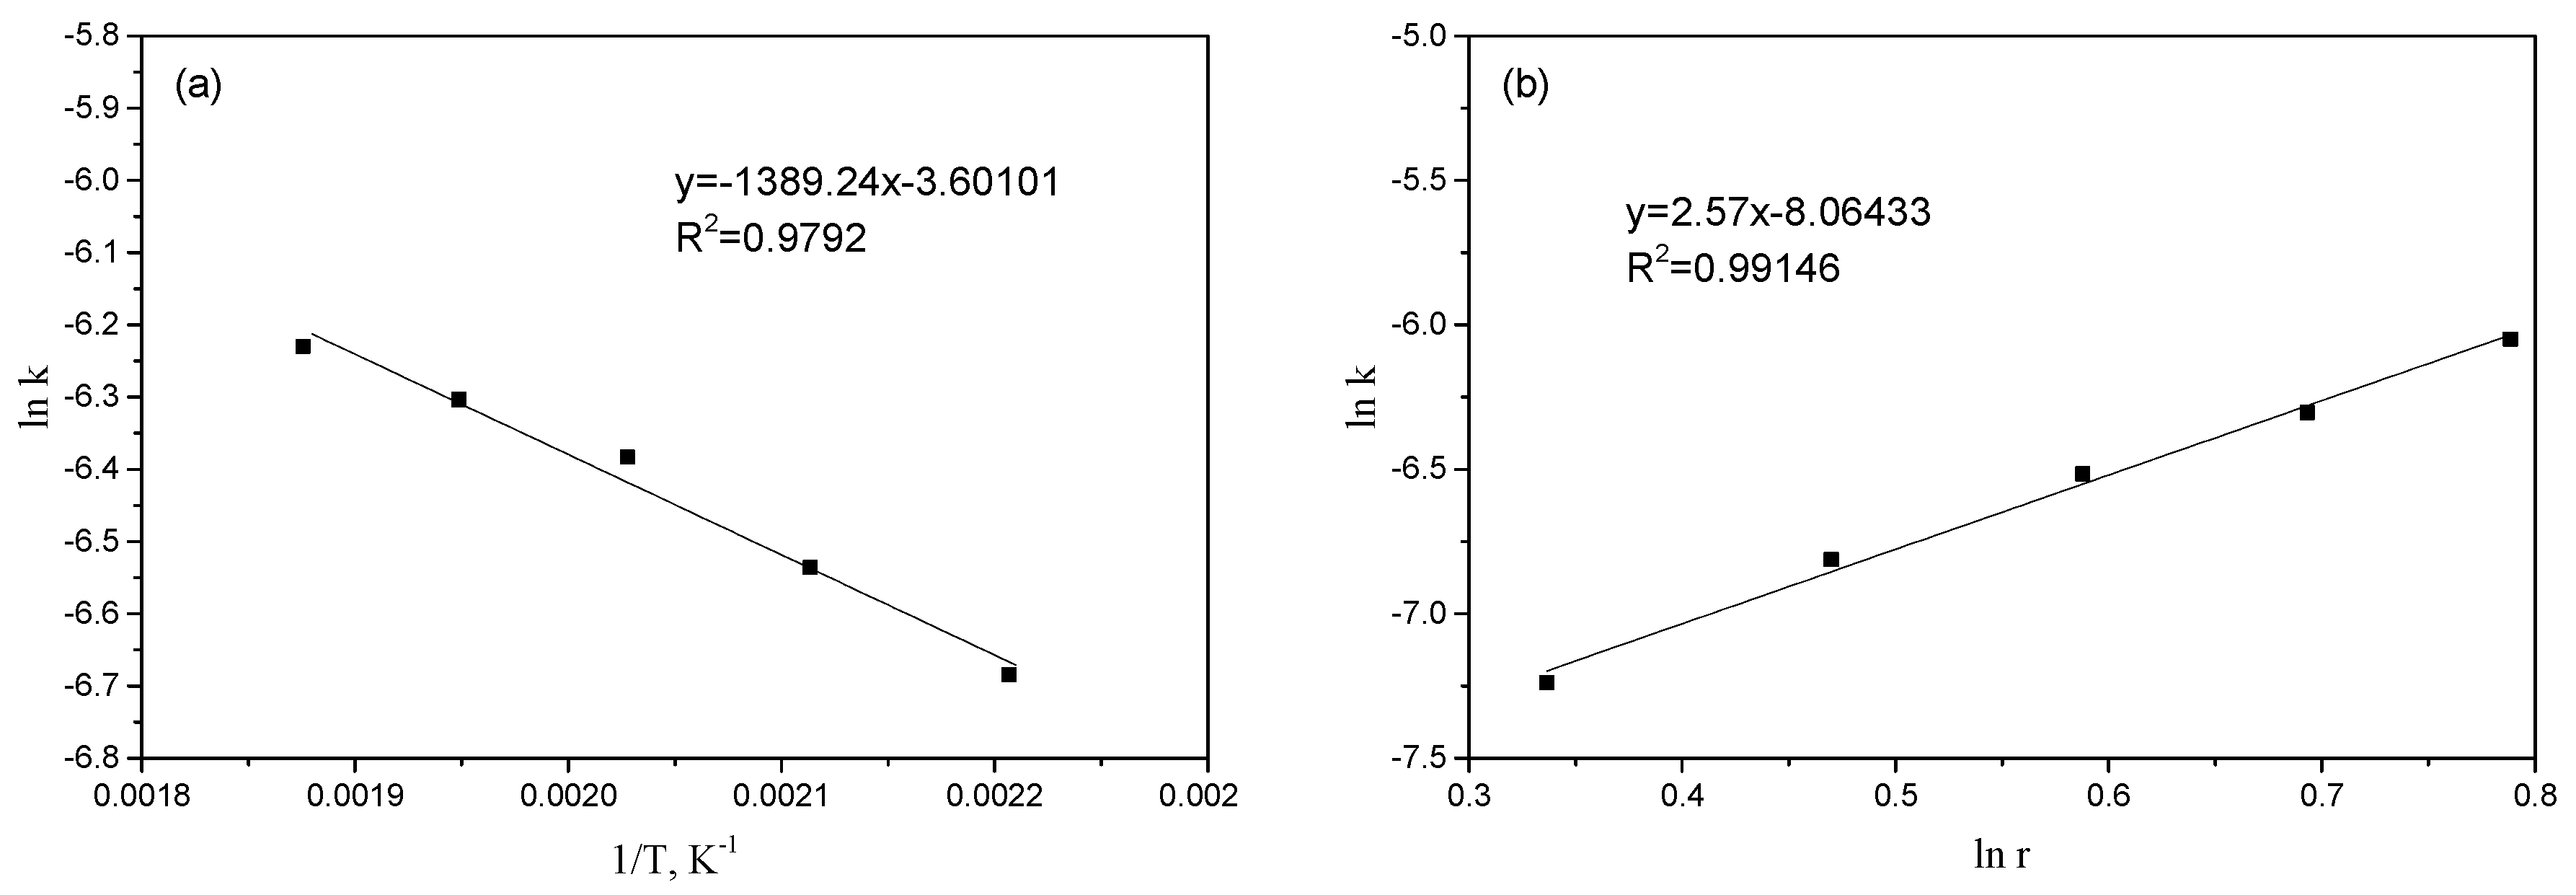
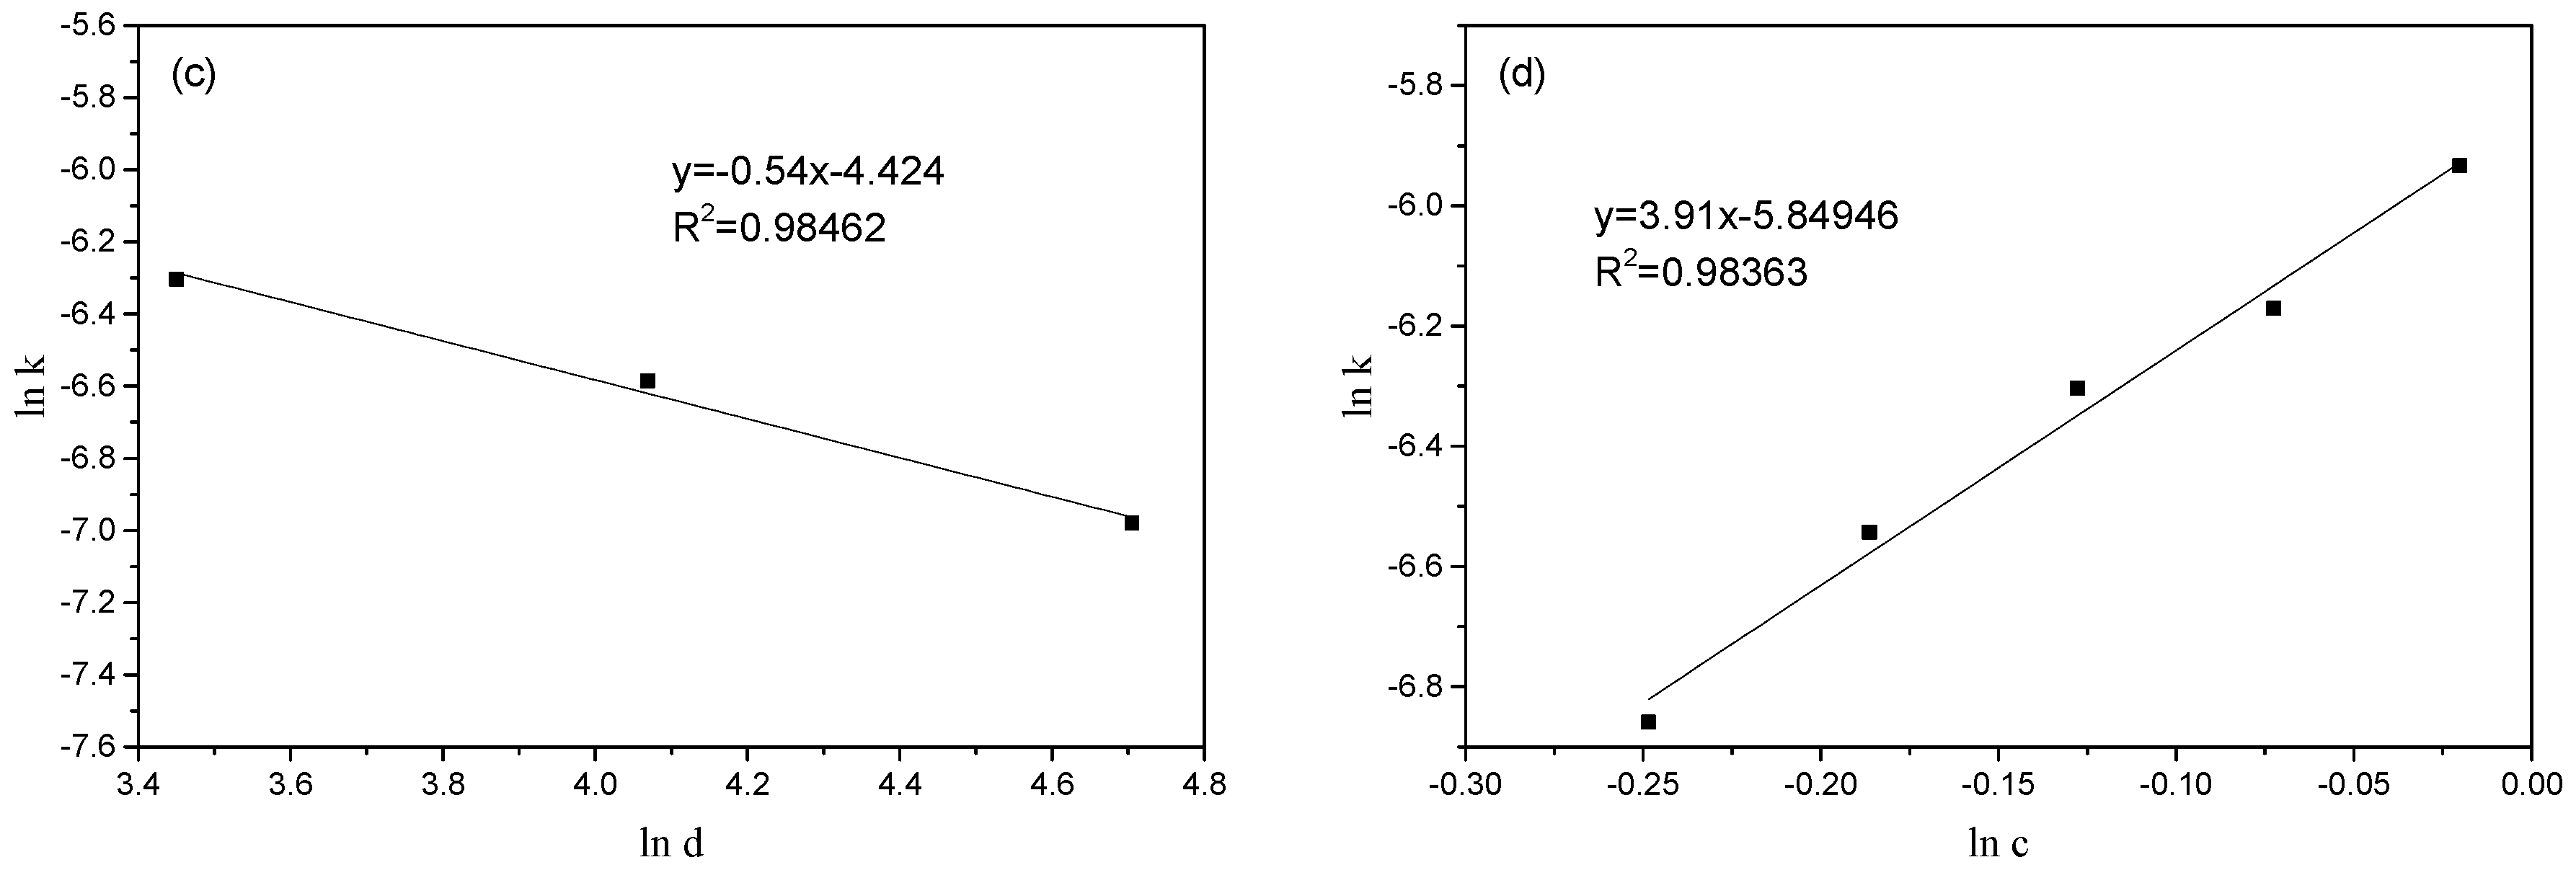
3.6. Kinetic Analysis

The TEFS particles gradually shrink during the reaction. Therefore, the most reasonable model for explaining their behaviors should be the shrinking core model, which has been noted to reasonably represent the experimental observations for a broad variety of minerals. The main steps during the reaction of TEFS with H2SO4 include the following: (1) H2SO4 diffuses through the liquid boundary layer to the particle surface; (2) H2SO4 diffuses from the particle surface to the reaction interface through the residue layer; and (3) the reaction occurs at the interface. Fluid–solid heterogeneous systems have many applications in hydrometallurgical processes, which involve three rate-controlling steps: surface chemical reaction, the diffusion of the materials, and diffusion through the ash/product, which are described by Equations (8)–(10) [24]. Wadsworth and Dickinson suggested a new model expressed by Equation (11), based on the hypothesis that both the interface transfer and diffusion across the product layer affect the leaching rate [25,26].
1 ( 1 X ) 1 3 = k 2 t
1 ( 1 X ) 1 F p = k 1 t
1 2 3 X ( 1 X ) 2 3 = k 3 t
1 3 ln ( 1 X )   [ 1 ( 1 X ) 1 3 ] = k 4 t
Here, X represents the leaching rate; t is the leaching time (min); k1, k2, k3, and k4 are the reaction rate constants; and Fp is the shape coefficient of the TEFS particles. Fp equals 3 if the TEFS particles are spherical; thus, in this case, Equations (8) and (9) are exactly the same. The experimental data were substituted into the above equations.
During the reaction of TEFS with sulfuric acid, the leaching of Si and Ca is affected by the colloidal coagulation and precipitation of H2SiO3 and CaSO4•2H2O, and the leaching process of Fe is too fast to analyze. Therefore, as it is difficult to effectively analyze the kinetics of Fe, Si, and Ca, we only investigated the kinetics of Mg and Al in this study.

3.6.1. Kinetic Analysis of Mg

The kinetic model that fits the experimental data with a coefficient closest to 1.0 was assumed to be the one controlling the leaching process. The values of the coefficients of determination (R2) of the data fitted with different models for sulfuric acid leaching experiments in the temperature range of 453.15–533.15 K at an acid/solid weight ratio of 2.0:1, initial H2SO4 concentration of 88.0 wt%, and average particle size of 31.5 µm are given in Table 1.
A comparison of the different experimental variables from kinetic evaluations (Table 1) indicates that the new model proposed by Wadsworth and Dickinson is effective for explaining the reactions, since the R2 values for this model are the closest to 1.0.
Plots of 1 3 ln ( 1 X ) [ 1 ( 1 X ) 1 3 ] versus time with the variation in the four different variables are presented in Figure 8. These plots indicate that the leaching of Mg correlated well with the new model. Both the diffusion of the material across the product layer and the interface transfer affect the decomposition of TEFS in the sulfuric acid system.
The relationship between k and the reaction temperature obeys the Arrhenius equation
ln k = E a R T + A 0
where k is the kinetic constant, Ea is the activation energy (kJ/mol), A0 is a constant, T is the temperature (K), and R is the gas constant (8.314 kJ/mol).
The Arrhenius plot in Figure 9a indicates the relationship between the apparent rate constant and temperature. The coefficient of determination for the fitted line in Figure 9a is 0.9792. The Ea calculated from the slope of the fitted line is 11.55 kJ/mol. The value of constant A0 was calculated to be −3.60. The relationship between k and T can be expressed as follows:
k = 0.027 1 e 1389.24 R T .
To determine the effects of the acid/solid weight ratio, particle size, and initial sulfuric acid concentration on Mg leaching, a semi-empirical model was established as follows:
1 3 ln ( 1 X )   [ 1 ( 1 X ) 1 3 ] = k 1 r α d β c γ 1 e E a R T
where X represents the leaching rate of Mg (%), k is the kinetic constant, c is the initial sulfuric acid concentration (wt%), d is the average particle size (µm), r is the acid/solid weight ratio, T is the temperature (K), t is the leaching time (min), and R is the gas constant (8.314 kJ/mol).
Ceteris paribus, and only changing the initial sulfuric acid concentration, Equation (14) can be expressed as
1 3 ln ( 1 X )   [ 1 ( 1 X ) 1 3 ] = k 2 c γ t
d   [ 1 3 ln ( 1 X ) 1 + ( 1 X ) 1 3 ] d t = k 2 c γ
ln [ d [ 1 3 ln ( 1 X ) 1 + ( 1 X ) 1 3 ] d t ] = ln k 2 + γ ln c .
The plot of 1 3 ln ( 1 X ) 1 + ( 1 X ) 1 3 versus time is shown in Figure 8d, and the slopes of the lines provide the values of d [ 1 3 ln ( 1 X ) 1 + ( 1 X ) 1 3 ] / dt at different initial sulfuric acid concentrations. Plots of 1 3 ln ( 1 X ) 1 + ( 1 X ) 1 3 versus time with different acid/solid weight ratios and average particle sizes are shown in Figure 8b,c, respectively. Similarly, the slopes of the lines provide the values of d [ 1 3 ln ( 1 X ) 1 + ( 1 X ) 1 3 ] / dt at different acid/solid weight ratios and average particle sizes. The scatter plots were drawn according to the value of ln   [ d [ 1 3 ln ( 1 X ) 1 + ( 1 X ) 1 3 ] / t ] with respect to ln c, ln r, and ln d in Figure 9b–d, respectively. The values of α, β, and γ, which were calculated from the slopes of the fit lines, are 2.57, −0.54, and 3.91, respectively.
The relationship between k and the three parameters was established by Equation (14), and thus, we substituted the values into Equation (14).
1 3 ln ( 1 X )   [ 1 ( 1 X ) 1 3 ] = k 2 r 2.57 1 d 0.54 c 3.91 1 e 1389.24 R T t
The Arrhenius equation obtained from Figure 8a is k = 0.027 1 e 1389.24 RT , and then, k 2 r 2.57 1 d 0.54 d 3.91 = 0.027 . Substituting r = 2.0, d = 31.5 µm, and c = 88.0 wt% gives  = 0.048. Therefore, the semi-empirical kinetic equation is
1 3 l n ( 1 X )   [ 1 ( 1 X ) 1 3 ] = 0.048 r 2.57 1 d 0.54 c 3.91 1 e 1389.24 R T t .
The semi-empirical kinetic equation shows that the effects of the variables on the Mg leaching rate in order of significance are reaction temperature, initial sulfuric acid concentration, acid/solid weight ratio, and particle size. The final semi-empirical kinetic equation for Mg leaching by sulfuric acid obtained in this study is given by Equation (19).

3.6.2. Kinetic Analysis of Al Leaching

A comparison of the kinetic evaluations of the different experimental variables (Table 2) indicated that the new model proposed by Wadsworth and Dickinson is reasonably able to explain the reactions, since the R2 values for this model are the closest to 1.0.
Plots of 1 3 ln ( 1 X ) [ 1 ( 1 X ) 1 3 ] versus time with the variation in the four different variables are presented in Figure 10. These plots indicate that the leaching of Al correlated well with the new model.
Figure 11a shows the Arrhenius plot, which indicates the relationship between the apparent rate constant and temperature. The coefficient of determination of the fitted line in Figure 11a is 0.8915. The Ea calculated from the slope of the fitted line is 24.04 kJ/mol. The value of constant A0 was calculated to be −0.89. The relationship between k and T can be expressed as follows:
k = 0.41 1 e 2890.95 R T .
The plot of 1 3 ln ( 1 X ) 1 + ( 1 X ) 1 3 versus time is shown in Figure 10c, the slopes of the lines are the values of d [ 1 3 ln ( 1 X ) 1 + ( 1 X ) 1 3 ] / dt at different average particle sizes. Plots of 1 3 ln ( 1 X ) 1 + ( 1 X ) 1 3 versus time with different acid/solid weight ratios and initial sulfuric acid concentrations are shown in Figure 10b,d, respectively. Similarly, the slopes of the lines give the values of d [ 1 3 ln ( 1 X ) 1 + ( 1 X ) 1 3 ] / dt at different acid/solid weight ratios and initial sulfuric acid concentrations. The scatter plots were drawn according to the values of ln   [ d [ 1 3 ln ( 1 X ) 1 + ( 1 X ) 1 3 ] / t ] with respect to ln c, ln r, and ln d in Figure 11b–d, respectively. The values of α, β, and γ, which were calculated from the slopes of the fit lines, are 4.23, −0.72, and 3.35, respectively.
The relationship between k and the three parameters was established in Equation (14), and thus we substituted the values into Equation (14).
1 3 ln ( 1 X )   [ 1 ( 1 X ) 1 3 ] = k 1 r 4.23 1 d 0.72 c 3.35 1 e 2890.95 R T t
The Arrhenius equation obtained from Figure 8a is k = 0.41 1 e 2890.95 R T , and then, k 1 r 4.23 1 d 0.72 c 3.35 = 0.41 . Substituting r = 2.0, d = 31.5 µm, and c = 88.0 wt% gives k 1 = 0.40. Therefore, the semi-empirical kinetic equation is
1 3 ln ( 1 X )   [ 1 ( 1 X ) 1 3 ] = 0.40 r 4.23 1 d 0.72 c 3.35 1 e 2890.95 R T t .
The semi-empirical kinetic equation shows that the effects of the variables on the Al leaching rate in order of significance are the reaction temperature, acid/solid weight ratio, initial sulfuric acid concentration, and particle size. The final semi-empirical kinetic equation for Al leaching by sulfuric acid obtained in this study is Equation (22).

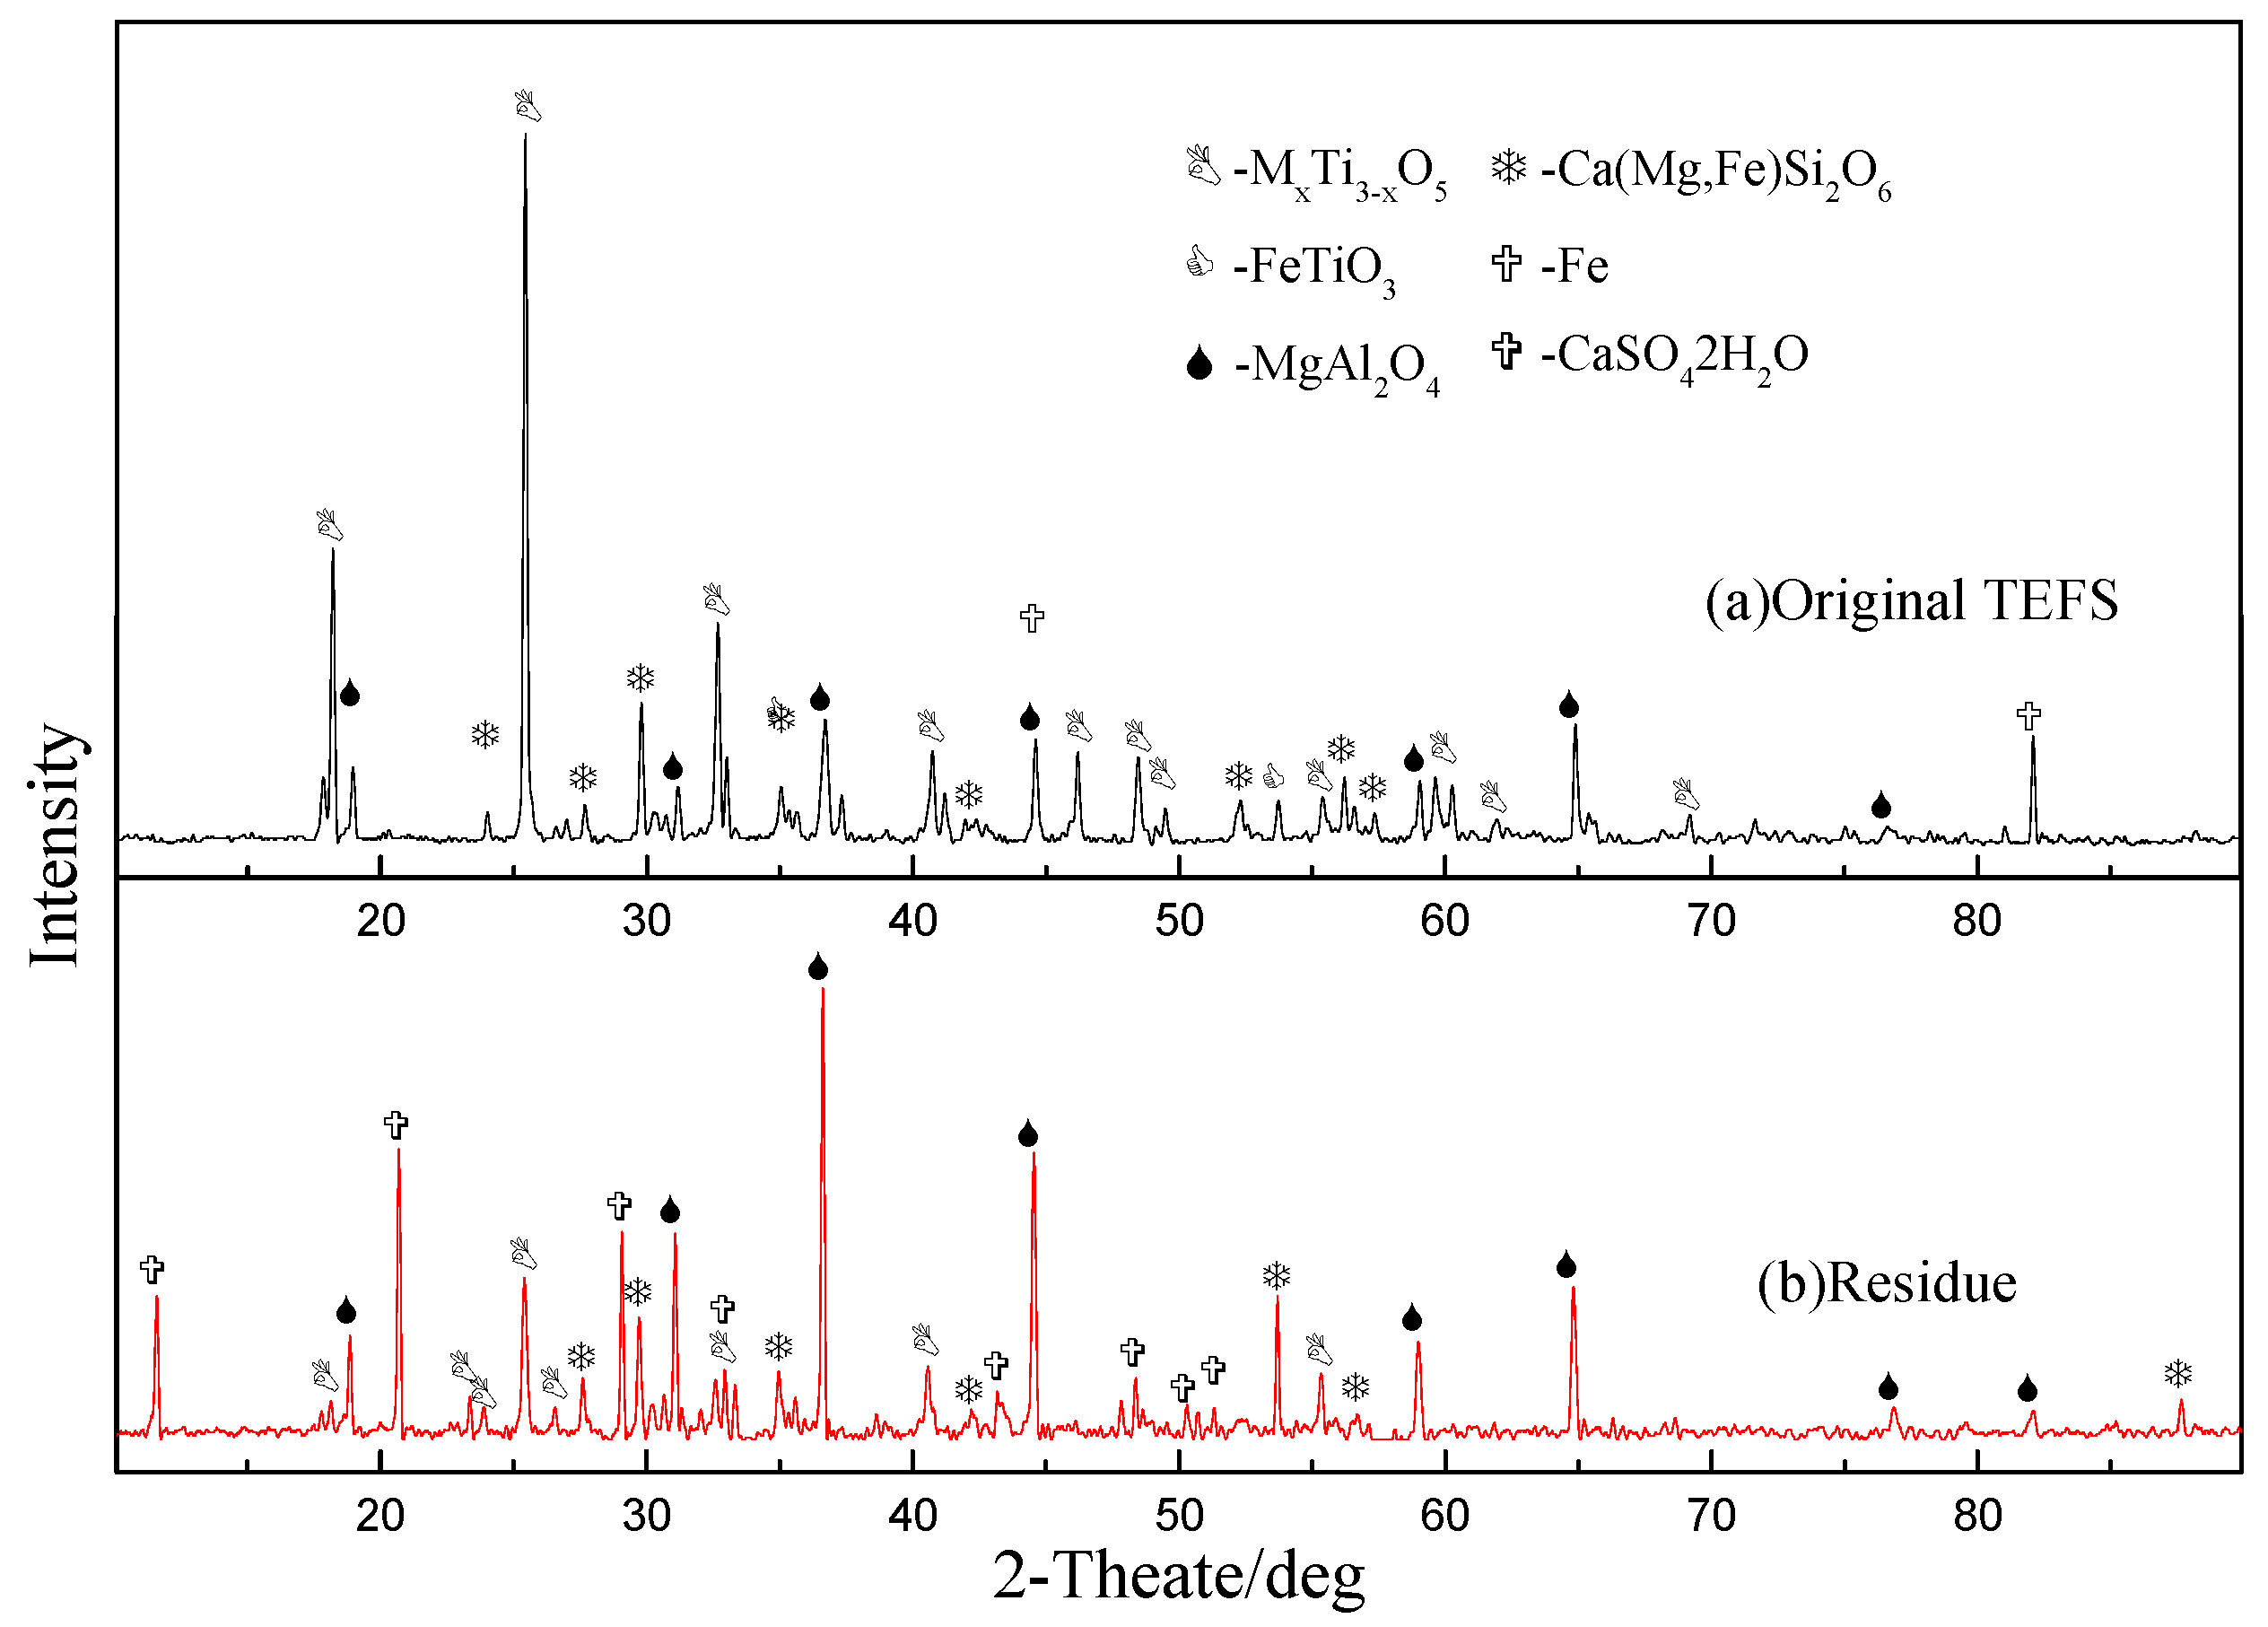
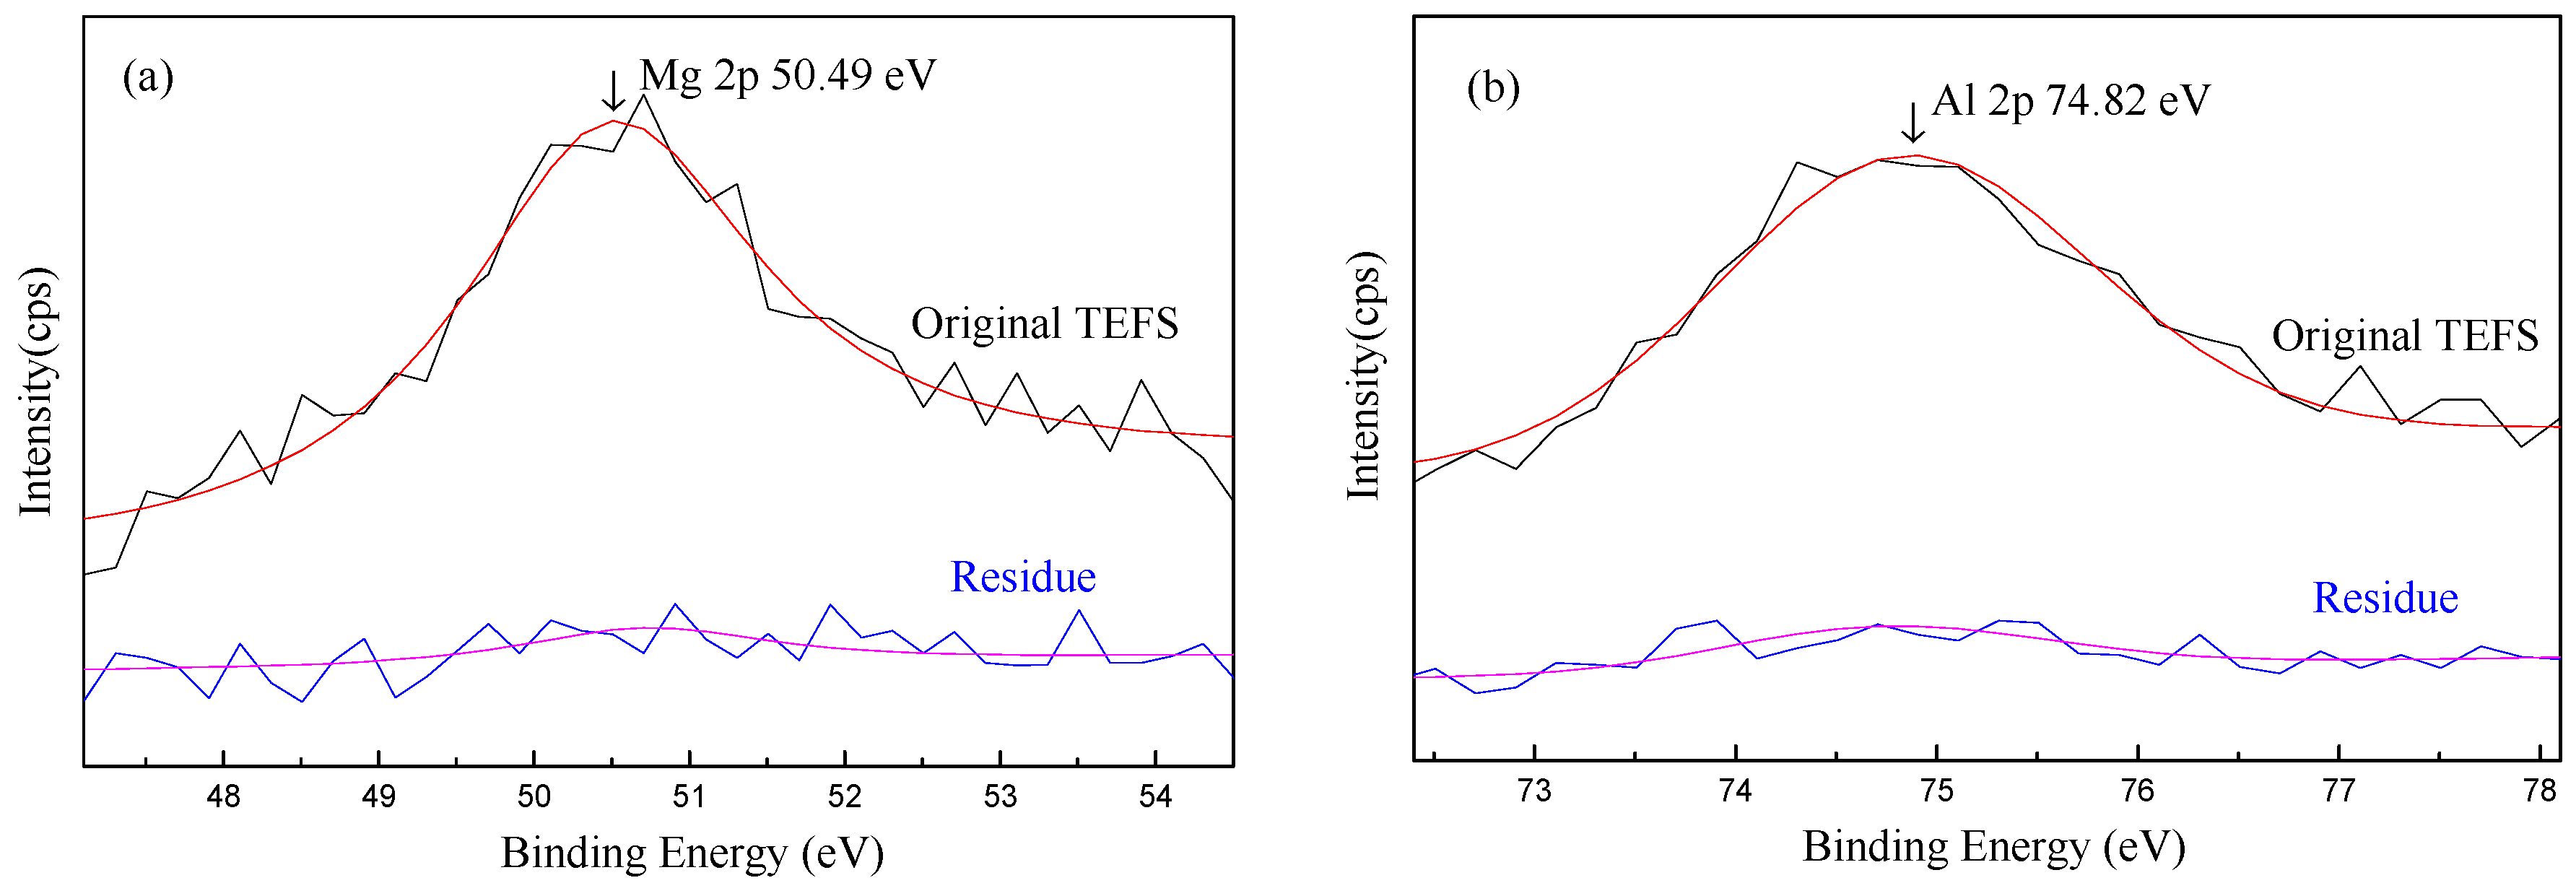
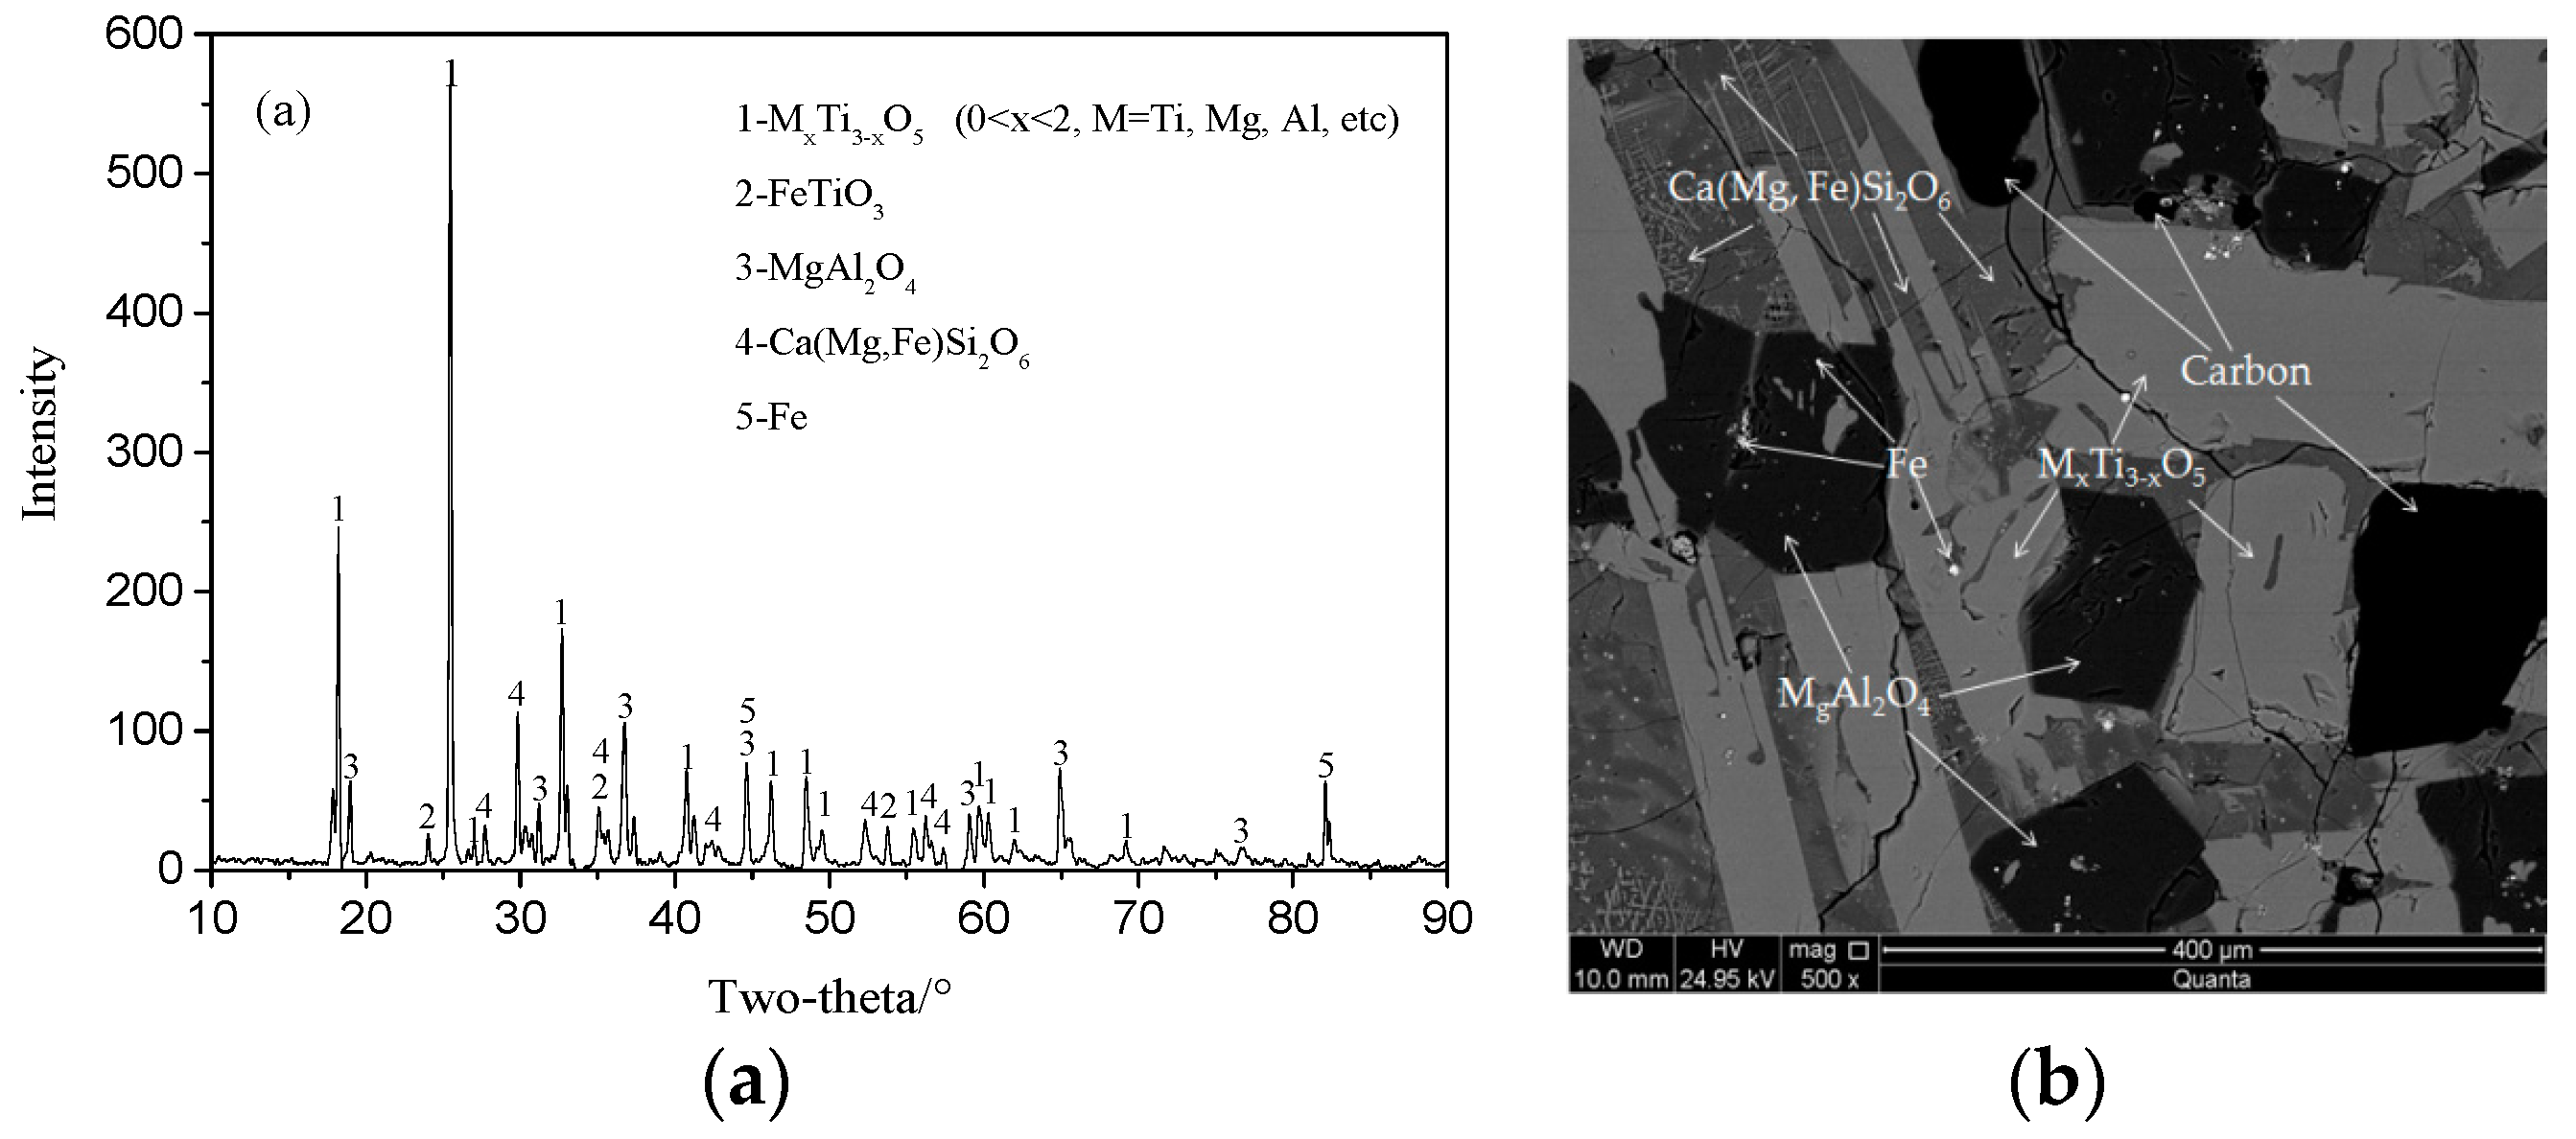
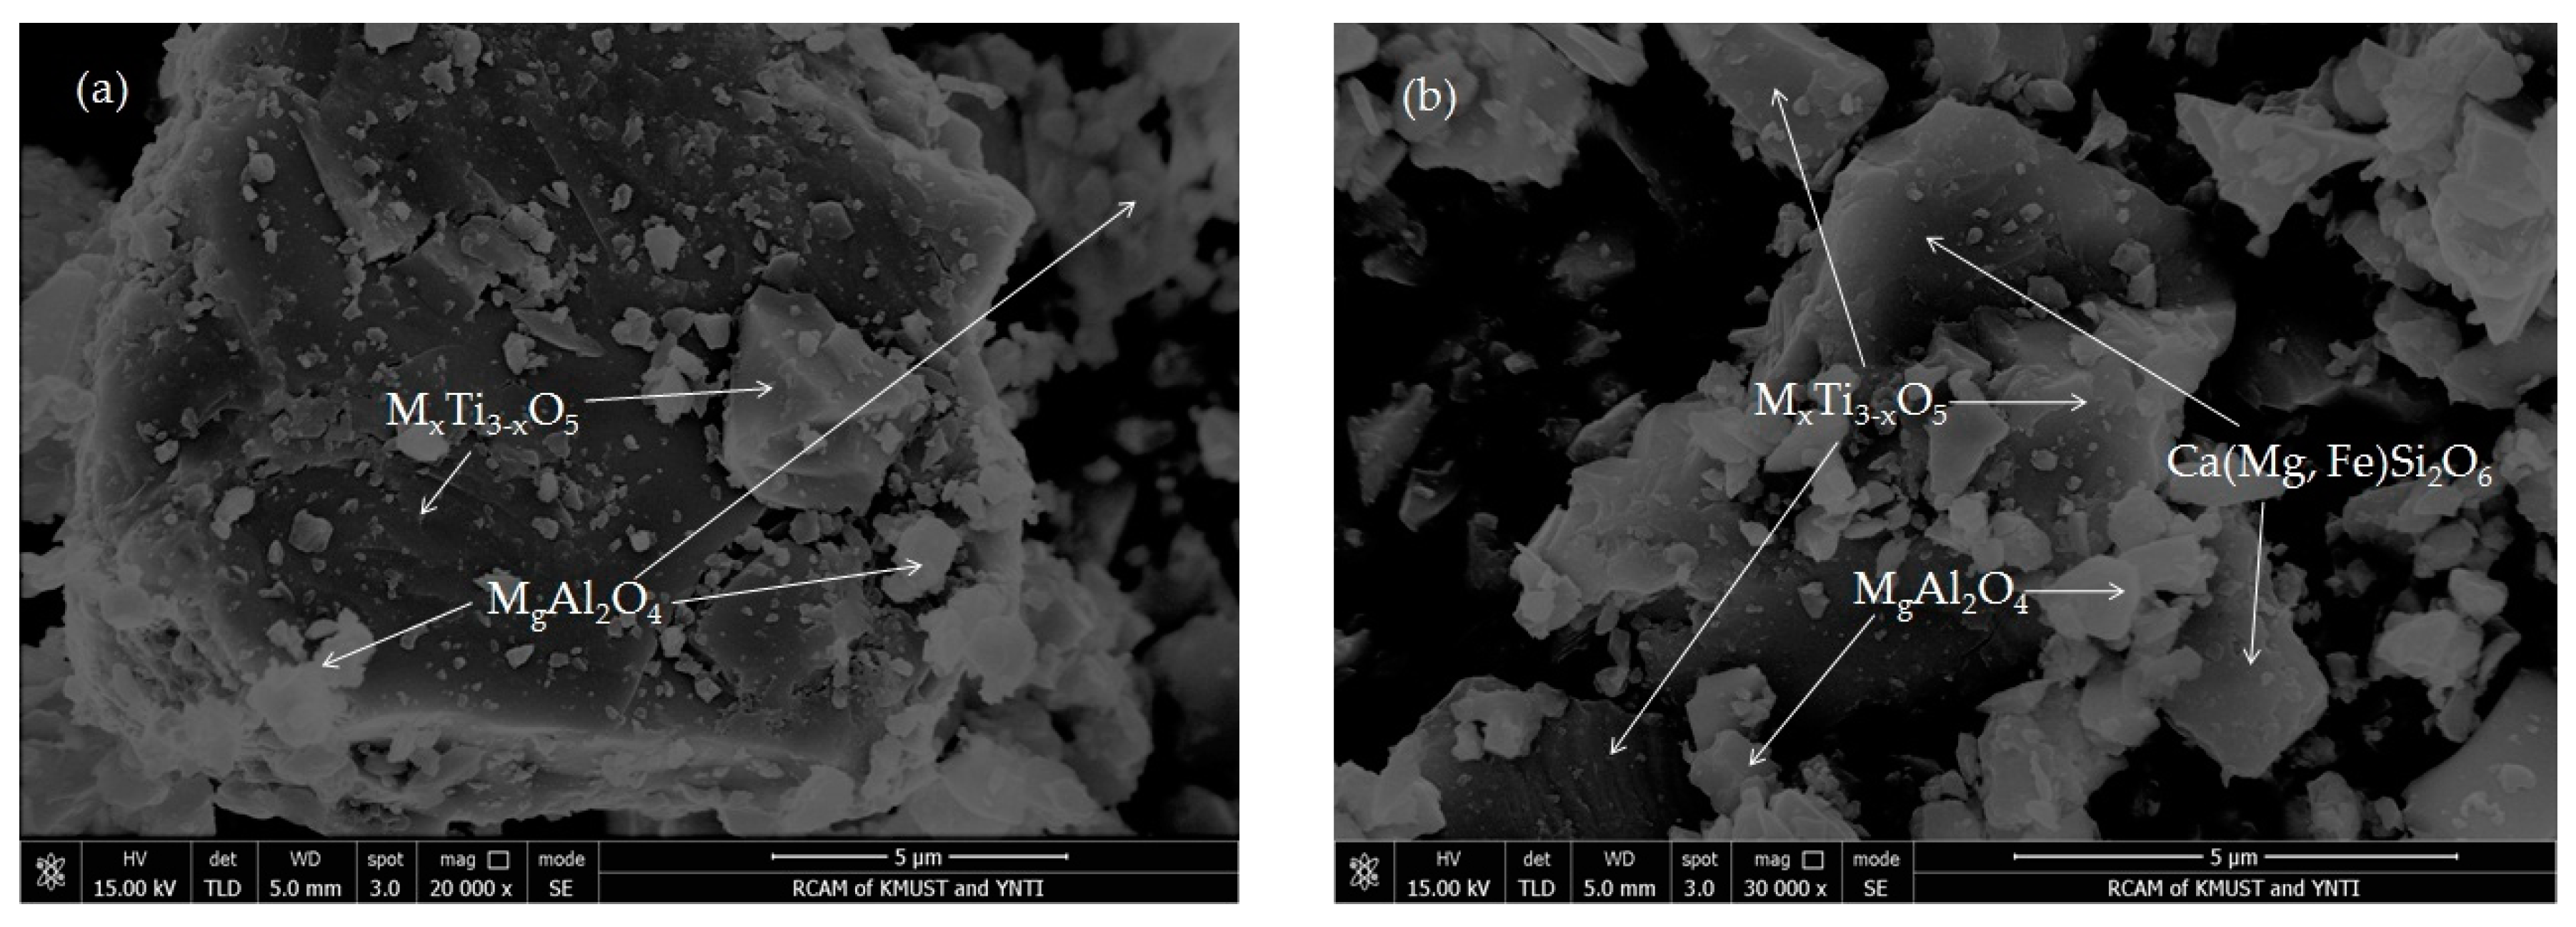
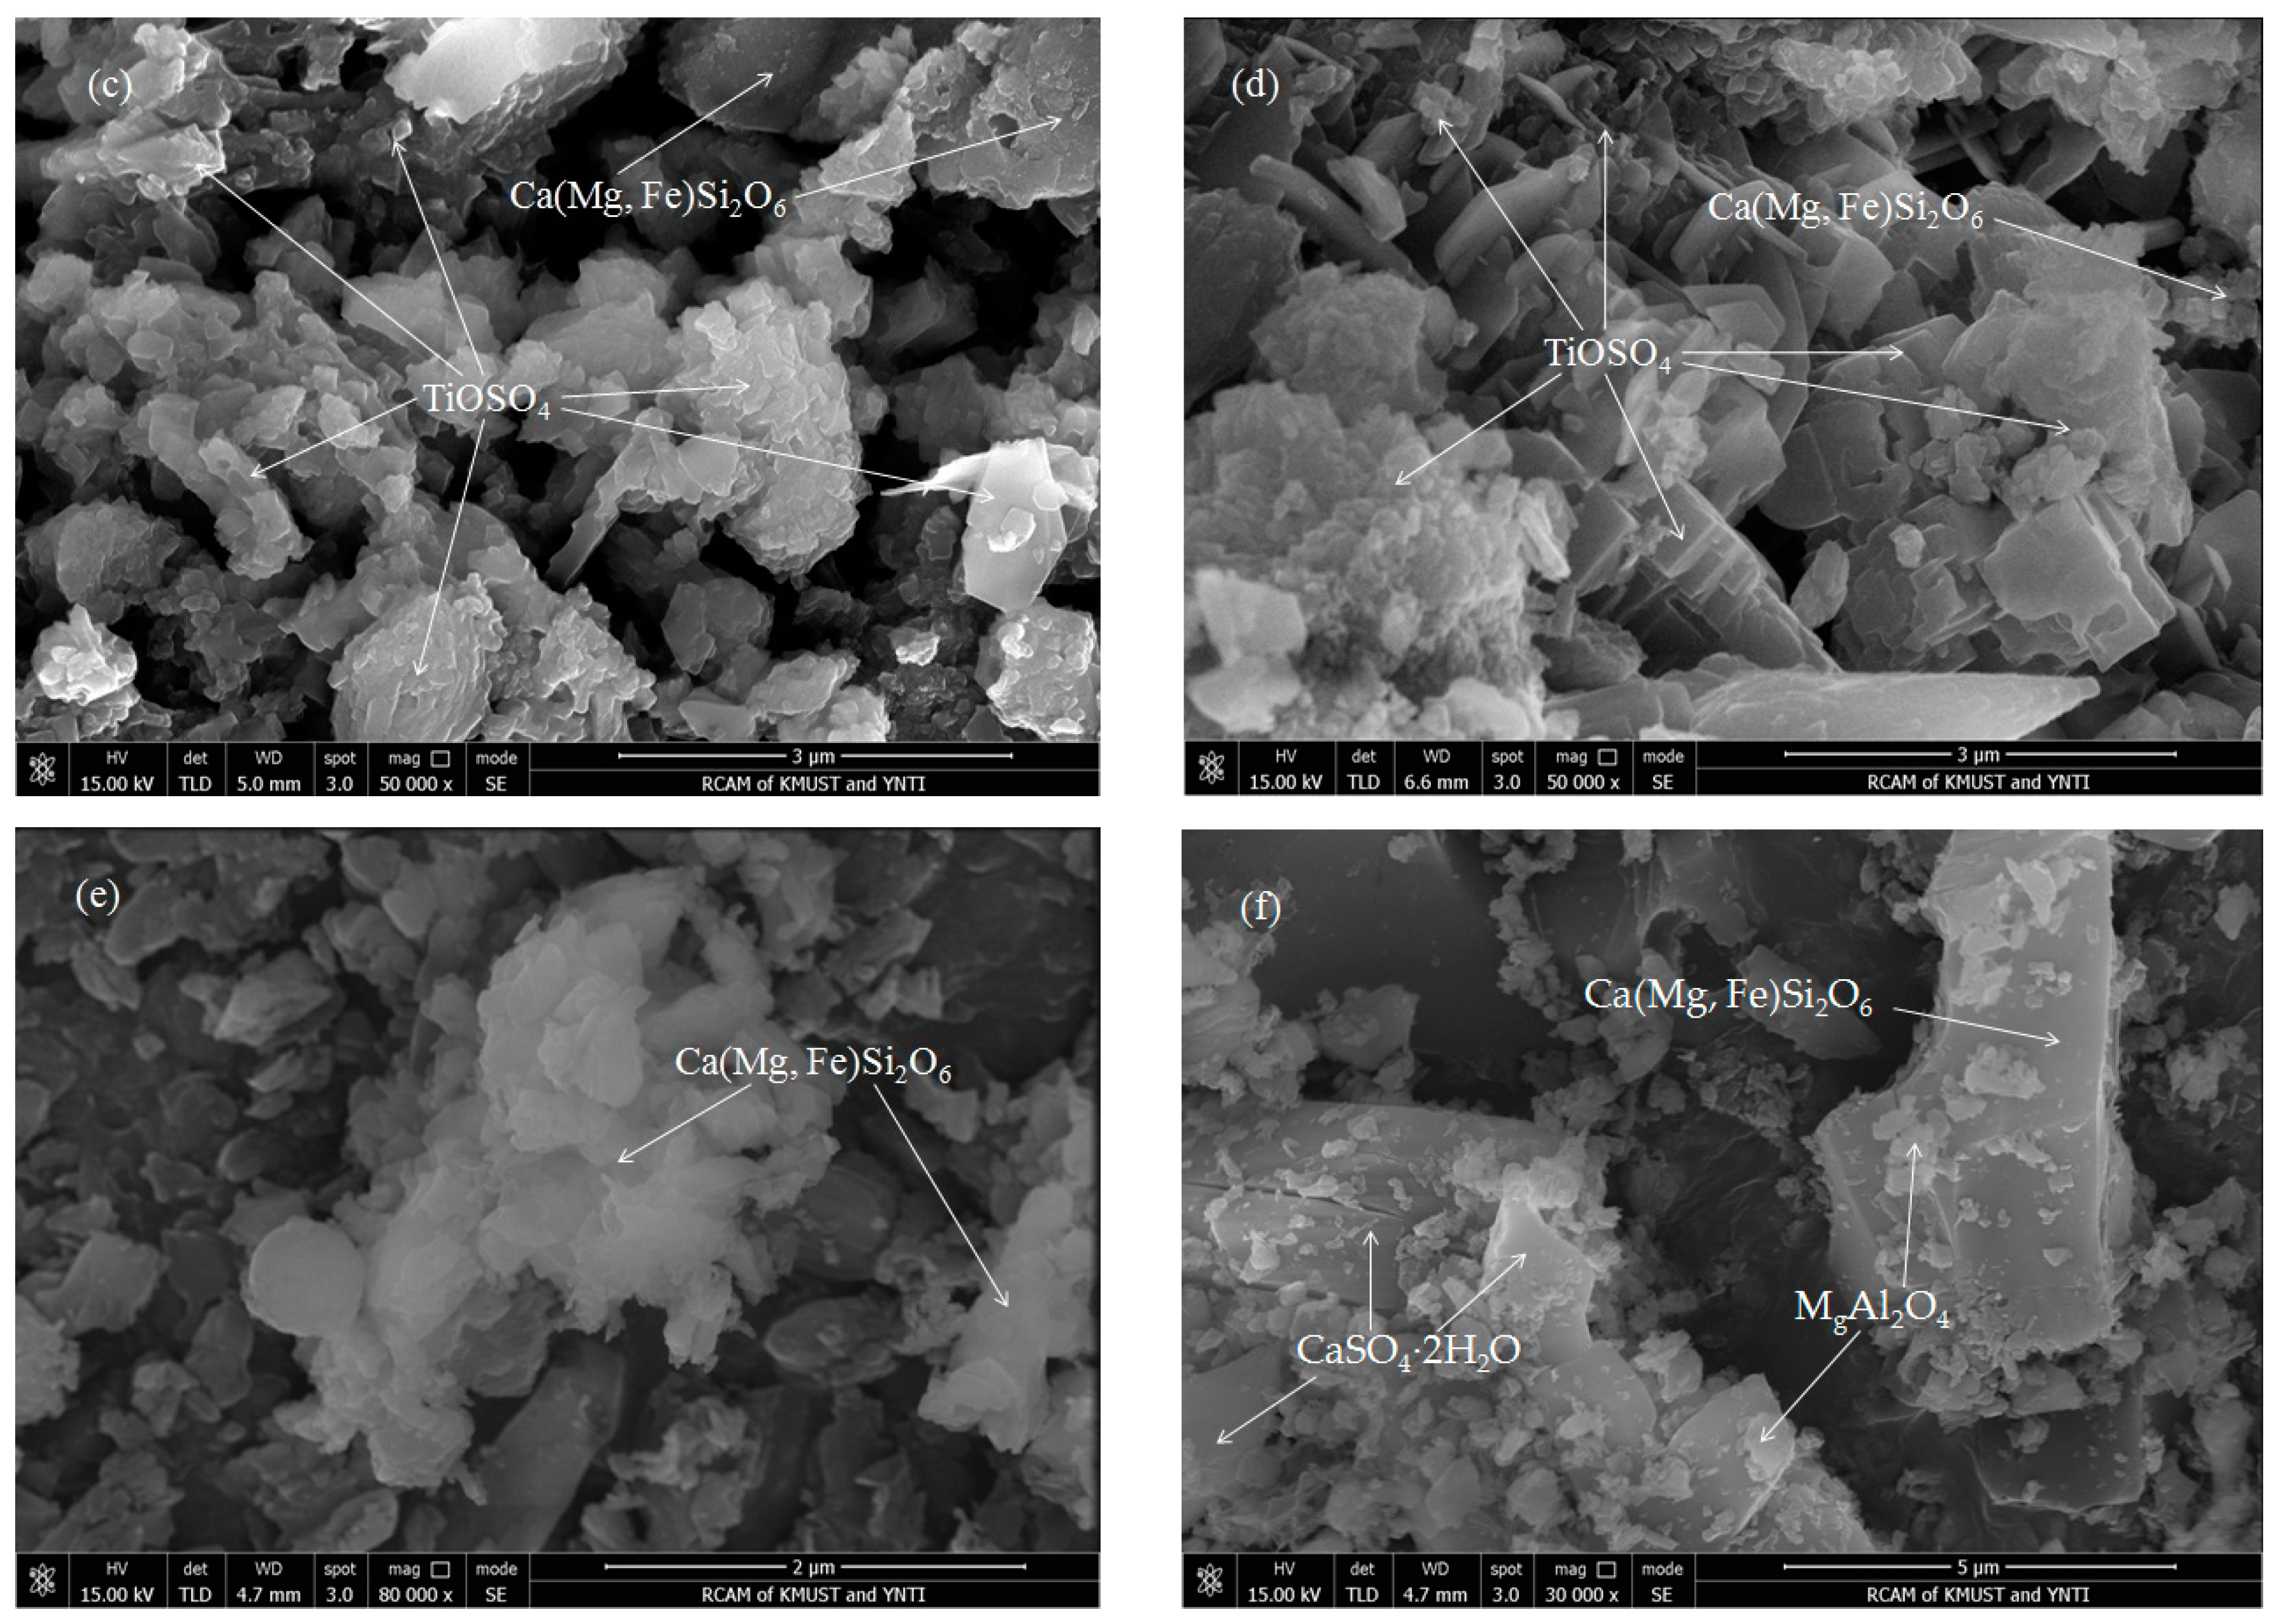
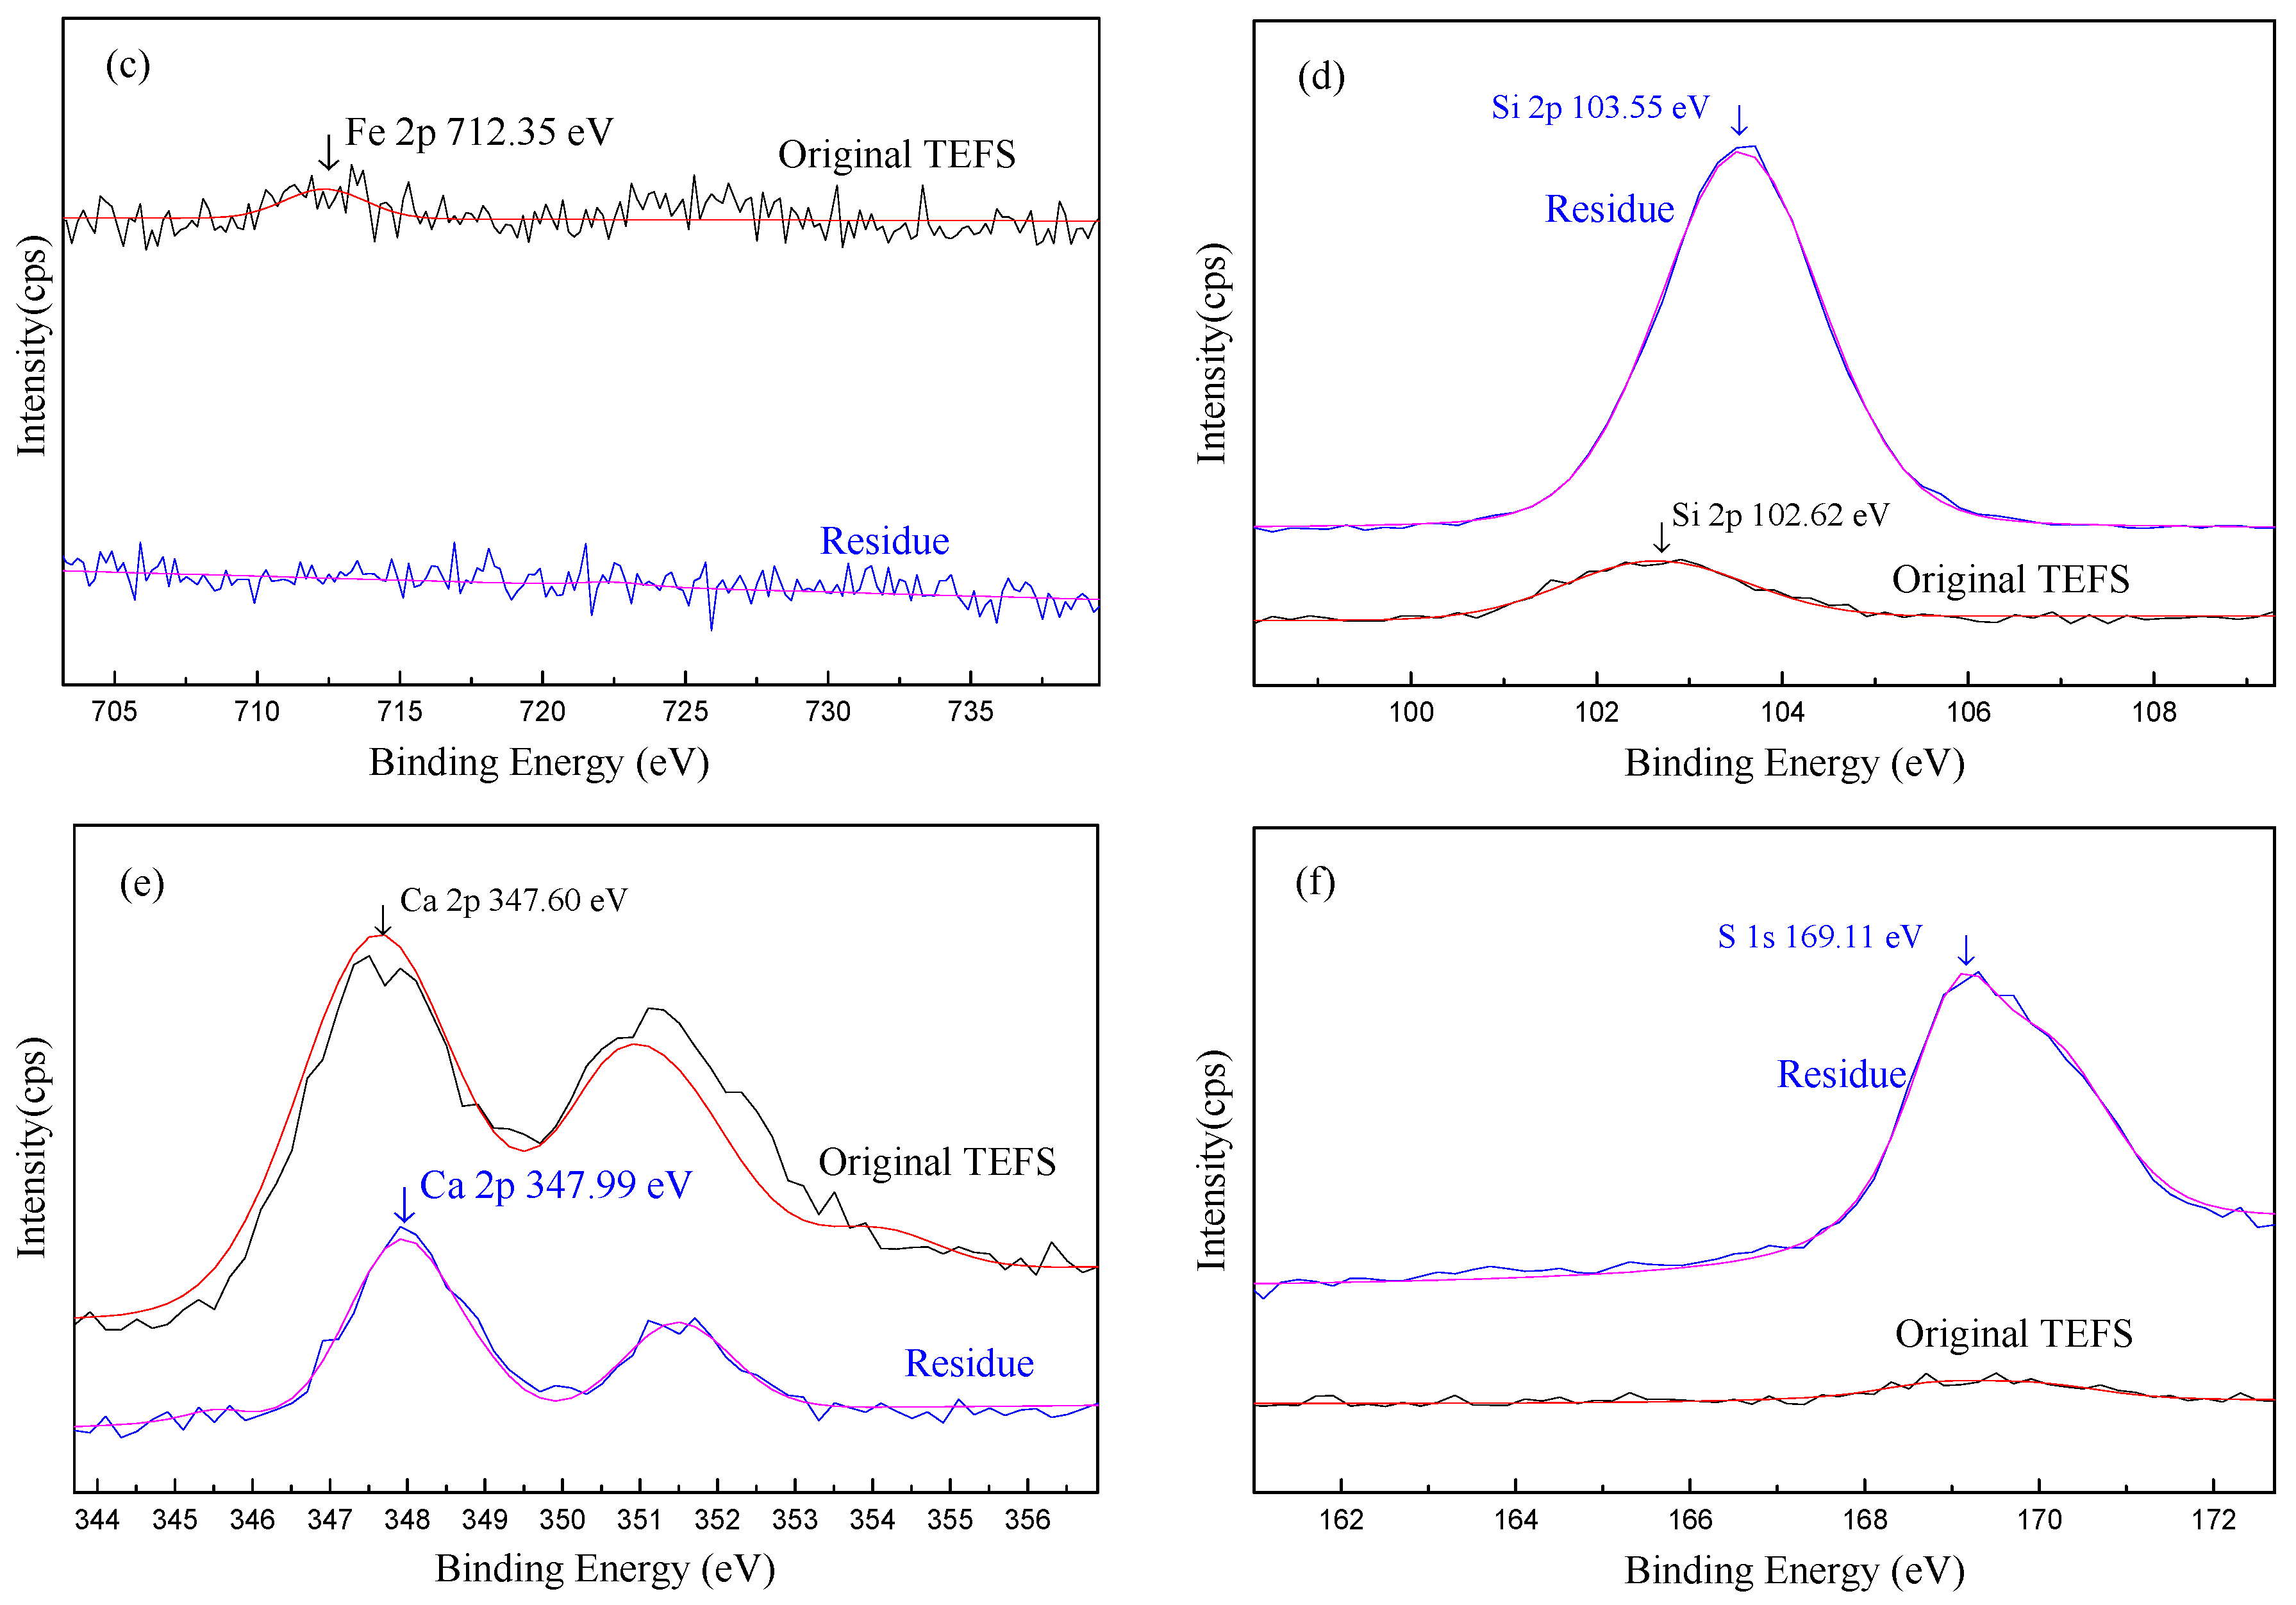
3.7. Characterization of Leach Residues

Modern testing technologies and analyses are useful to characterize the properties of targeted materials [27,28]. Figure 12 shows the XRD patterns of the leach residues and original TEFS. For comparison, the morphologies of the original TEFS, acidolysis products, and water leach residues are shown in Figure 13. The XPS spectra of the original TEFS and residue are shown in Figure 14.
The XRD pattern presented in Figure 12 indicates that most of the MxTi3-xO5 and MgAl2O4 reacted with sulfuric acid during the reaction, since the intensities of their characteristic peaks for the residue were reduced significantly as compared to those for the original TEFS. FeTiO3 and Fe metal reacted completely, as their characteristic peaks totally disappeared in the XRD pattern of the residue. The characteristic peaks of CaSO4·2H2O in the residue are obvious in the XRD pattern of the residue, indicating that a large quantity of gypsum was produced during the leaching process.
The FESEM images reveal that most of the MxTi3-xO5 phase reacted with sulfuric acid to produce a substantial amount of sheet-shaped TiOSO4, which leached into the solution during the subsequent water leaching process. Figure 13e,f reveals that much clastic CaSO4·2H2O and MgAl2O4 adsorbed on the surface of Ca(Mg, Fe)Si2O6.
The XPS spectra of the original TEFS and residue are shown in Figure 14. As shown in Figure 14a,b, the peak intensities of the Mg 2p and Al 2p signals of the original TEFS were much stronger than those of the residue, indicating that most Mg and Al was leached out in the leaching process. The peak intensity of the Fe 2p of the original TEFS was weak, while the Fe 2p peak of the residue was not observable, which implies that the iron content was low in the original TEFS and was near zero after the leaching process. Figure 14d shows that the Si 2p XPS spectrum of the residue had a stronger peak intensity compared to that in the spectrum of the original TFES, which could have resulted from numerous factors, including the relatively high content of Si and the exposure of Ca(Mg, Fe)Si2O6. Moreover, the binding energies of the Si 2p increased from 102.62 to 103.55 eV, implying that a new product, probably silica gel, was generated in the leaching process according to Equation (2). The silica gel is an amorphous substance and the XRD experimental pattern was corrected via background subtraction; thus, the XRD pattern in Figure 12 did not demonstrate peaks related to the metasilicilic acid. As shown in Figure 14e, the binding energies of the Ca 2p shifted from 347.60 to 347.99 eV. This peak shift to higher energies indicates differences in the electronic environment of the original TEFS and residue. The results may be attributed to the generation of CaSO4·2H2O. As shown in Figure 14f, an obvious peak of S 1s appeared in the XPS spectra of the residue, largely due to the generation of a large quantity of sulfate.

4. Conclusions

The leaching behaviors of impurities were studied under different conditions. Under the conditions used, the leaching rate of Fe increased rapidly and quickly reached equilibrium. The leaching rate of Si increased quickly in the early stage and decreased in the later stage, which may be attributed to the generation of superfluous H2SiO3 in the system, causing a substantial portion of the solution to aggregate to form a colloid, which has poor filterability. The leaching rate of Ca increased in the initial stage and reached equilibrium later, with the main reason being the formation of CaSO4·2H2O, which precipitates and thereby influences the leaching of Ca. Further, the leaching rate of Fe was extremely rapid, making it difficult to study its leaching kinetics. Meanwhile, the leached products of Si and Ca interfered with their leaching, because they were insoluble.
XRD analyses revealed that the major Mg- and Al-bearing mineral in TEFS is spinel, along with anosovite, which contains a small amount of Mg. This led to similar leaching behaviors of Mg and Al. A new shrinking core model, based on interface transfer and diffusion across the product layer, was proposed to explain the leaching of Mg and Al in the sulfuric acid solution. The leaching equations of Mg and Al for this model were derived with the activation energies of 11.55 and 24.04 kJ/mol, respectively, and are given by Equations (19) and (22), respectively.

Author Contributions

W.N. and S.W. conceived and designed the experiments; W.N., D.L. and Q.F. performed the experiments; Q.Z. and J.L. analyzed the data; W.N. wrote this paper and S.W. revised it. All authors have read and agreed to the published version of the manuscript.

Funding

The authors would like to acknowledge the Projects funded by Ten Thousand Talent Plans for Young Top-notch Talents of Yunnan Province (Grant No. YNWR-QNBJ-2018-051).

Conflicts of Interest

The authors declare no conflict of interest.

References

  1. Xi, G.; Hu, K.J. New Development of Recovery of Vanadium and Titanium from V-Ti-Bearing Magnetite at Pangang. Iron Steel Vanadium Titanium 1998, 19, 58–64. [Google Scholar]
  2. Zheng, F.; Chen, F.; Guo, Y.; Jiang, T.; Travyanov, A.Y.; Qiu, G. Kinetics of Hydrochloric Acid Leaching of Titanium from Titanium-Bearing Electric Furnace Slag. JOM 2016, 68, 1–9. [Google Scholar] [CrossRef]
  3. Yang, H.; Sun, X.; Liu, D.; Xue, X.X.; Du, G. Experimental study on iron recovery from iron tailings and titanium concentrate by direct reduction and magnetic separation. Trans. Mater. Heat Treat 2014, 35, 90–95. [Google Scholar]
  4. Zhang, Y.J.; Qi, T.; Zhang, Y. A novel preparation of titanium dioxide from titanium slag. Hydrometallurgy 2009, 96, 52–56. [Google Scholar] [CrossRef]
  5. Zhou, L.H.; Tao, D.P.; Fang, M.X.; Zeng, F.H.; Pu, X. Carbothermic Reduction of V-Ti Magnetite Ore. Rare Metals 2009, 33, 406–410. [Google Scholar]
  6. Lv, C.; Yang, K.; Wen, S.M.; Bai, S.J.; Feng, Q.C. A New Technique for Preparation of High-Grade Titanium Slag from Titanomagnetite Concentrate by Reduction–Melting–Magnetic Separation Processing. JOM 2017, 69, 1801–1805. [Google Scholar] [CrossRef]
  7. Qu, X.M.; Guo, Y.F.; Zheng, F.Q.; Jiang, T.; Qiu, G.Z. Performance of Sulfuric Acid Leaching of Titanium from Titanium-Bearing Electric Furnace Slag. J. Mater. Sci. Res. 2016, 5, 1–9. [Google Scholar] [CrossRef]
  8. Li, Y.; Yang, Y.; Guo, M.; Zhang, M. Influence of acid type and concentration on the synthesis of nanostructured titanium dioxide photocatalysts from titanium-bearing electric arc furnace molten slag. RSC Adv. 2015, 5, 13478–13487. [Google Scholar] [CrossRef]
  9. Wang, S.; Guo, Y.F.; Jiang, T.; Chen, F.; Zheng, F.Q.; Yang, L.Z. Melting Behavior of Titanium-Bearing Electric Furnace Slag for Effective Smelting of Vanadium Titanomagnetite. JOM 2019, 71, 1858–1865. [Google Scholar] [CrossRef]
  10. Huang, S.H.; Lei, T.; Han, F.X.; Zhou, L. Effect of Ilmenite Component and AIR on Element Distribution of Titanium Slag Smelted by DC Arc Furnace. Rare Metal Mat. Eng. 2013, 43, 2921–2926. [Google Scholar]
  11. Zhang, K.; Lv, X.W.; Huang, R.; Song, B.; Fei, X. Preparation of High-Grade Titania Slag from Ilmenite-Bearing High Ca and Mg by Vacuum Smelting Method. Metall. Mater. Trans. B 2014, 45, 923–928. [Google Scholar] [CrossRef]
  12. Tong, Q.J.; Qi, T.; Liu, Y.M.; Wang, L.N.; Zhang, Y. Preparation of Potassium Titanate Whiskers and Titanium Dioxide from Titaniferous Slag Using KOH Sub-molten Salt Method. Chin. J. Process Eng. 2007, 7, 85–89. [Google Scholar]
  13. Liu, Y.H.; Meng, F.C.; Fang, F.Q.; Wang, W.J.; Chu, J.L.; Qi, T. Preparation of rutile titanium dioxide pigment from low-grade titanium slag pretreated by the NaOH molten salt method. Dyes Pigments 2016, 125, 384–391. [Google Scholar]
  14. Wang, D.; Chu, J.L.; Liu, Y.H.; Li, J.; Xue, T.Y.; Wang, W.J.; Qi, T. Novel Process for Titanium Dioxide Production from Titanium Slag: NaOH-KOH Binary Molten Salt Roasting and Water Leaching. Ind. Eng. Chem. Res. 2013, 52, 15756–15762. [Google Scholar] [CrossRef]
  15. Dong, H.G.; Jiang, T.; Guo, Y.F.; Chen, J.L.; Fan, X.X. Upgrading a Ti-slag by a roast-leach process. Hydrometallurgy 2012, 113–114, 119–121. [Google Scholar] [CrossRef]
  16. Wang, Y.; Jie, L.; Wang, L.; Xue, T.; Tao, Q. Preparation of Rutile Titanium Dioxide White Pigment via Doping and Calcination of Metatitanic Acid Obtained by the NaOH Molten Salt Method. Ind. Eng. Chem. Res. 2010, 49, 7693–7696. [Google Scholar] [CrossRef]
  17. Han, Y.F.; Sun, T.C.; Li, J.; Qi, T.; Wang, L.N.; Qu, J.K. Preparation of titanium dioxide from titania-rich slag by molten NaOH method. Int. J. Miner. Metall. Mater. 2012, 19, 205–211. [Google Scholar] [CrossRef]
  18. Feng, Y.; Wang, J.G.; Wang, L.N.; Qi, T.; Xue, T.Y.; Chu, J.L. Decomposition of acid dissolved titanium slag from Australia by sodium hydroxide. Rare Metals 2009, 28, 564–569. [Google Scholar] [CrossRef]
  19. Sui, L.L.; Zhai, Y.C. Kinetics on reaction of roasting high titanium slag with ammonium bisulfate. Chin. J. Nonferrous Met. 2014, 24, 542–546. [Google Scholar] [CrossRef]
  20. Huang, Z.Q.; Wang, M.H.; Du, X.H.; Sui, Z.T. Recovery of Titanium from the Rich Titanium Slag by H2SO4 Method. J. Mater. Sci. Technol. 2003, 19, 191–192. [Google Scholar] [CrossRef]
  21. Wang, B.; Cheng, X.Z.; Han, K.X.; Qin, X.H.; Ma, Y. Research of Acidolysis Performance of Acid-soluble Titanium Slag. Iron Steel Vanadium Titanium 2009, 30, 6–11. [Google Scholar]
  22. Yang, S.L.; Sheng, J.F. The Technology of Melting Titanium Slag and Pig Iron from Ilmenite; Metallurgical Industry Press: Beijing, China, 2006. [Google Scholar]
  23. Yang, Y.C.; Chen, H.S.; Deng, G.Z.; Zhang, Y.Q. Study on Phase and Acidolysis Process of Titanium Slag from Iron Concentrate. Iron Steel Vanadium Titanium 1990, 11, 31–35. [Google Scholar]
  24. Zhukov, V.V.; Laari, A.; Lampinen, M.; Koiranen, T. A mechanistic kinetic model for direct pressure leaching of iron containing sphalerite concentrate. Chem. Eng. Res. Des. 2017, 118, 131–141. [Google Scholar] [CrossRef]
  25. Sohn, H.Y.; Wadsworth, M.E. Rate Processes of Extractive Metallurgy; Plenum Press: New York, NY, USA, 1979. [Google Scholar]
  26. Dickinson, C.F.; Heal, G.R. Solid–liquid diffusion controlled rate equations. Thermochim. Acta 1999, 340, 89–103. [Google Scholar] [CrossRef]
  27. Zhao, W.J.; Liu, D.W.; Feng, Q.C.; Wen, S.M.; Chang, W.H. DFT insights into the electronic properties and adsorption mechanism of HS on smithsonite (101) surface. Miner. Eng. 2019, 141, 105846. [Google Scholar] [CrossRef]
  28. Feng, Q.C.; Wen, S.M.; Bai, X.; Chang, W.H.; Cui, C.F.; Zhao, W.J. Surface modification of smithsonite with ammonia to enhance the formation of sulfidization products and its response to flotation. Miner. Eng. 2019, 137, 1–9. [Google Scholar] [CrossRef]
Figure 1. XRD pattern (a) and scanning electron micrograph (b) of the original titanium-bearing electric furnace slag (TEFS).
Processes 08 00056 g001
Figure 2. Schematic of the leaching experimental apparatus.
Processes 08 00056 g002
Figure 3. Ti leaching rates under four different conditions: (a) average particle size of 110.5 µm, reaction temperature of 513.15 K, and initial acid concentration of 88.0 wt%; (b) average particle size of 31.5 µm, reaction temperature of 453.15 K, and initial acid concentration of 88.0 wt%; (c) average particle size of 31.5 µm, reaction temperature of 513.15 K, and initial acid concentration of 88.0 wt%; (d) average particle size of 31.5 µm, reaction temperature of 513.15 K, and initial acid concentration of 98.0 wt%.
Processes 08 00056 g003
Figure 4. Effects of temperature on the leaching of impurities: (a) Mg; (b) Al; (c) Fe; (d) Si; (e) Ca.
Processes 08 00056 g004
Figure 5. Effects of acid/solid weight ratio on the leaching of impurities: (a) Mg; (b) Al; (c) Fe; (d) Si; (e) Ca.
Processes 08 00056 g005
Figure 6. Effects of particle size on the leaching of impurities: (a) Mg; (b) Al; (c) Fe; (d) Si; (e) Ca.
Processes 08 00056 g006
Figure 7. Effects of sulfuric acid concentration on the leaching of impurities: (a) Mg; (b) Al; (c) Fe; (d) Si; (e) Ca.
Processes 08 00056 g007
Figure 8. Plot of 1 3 ln ( 1 X ) [ 1 ( 1 X ) 1 3 ] versus time with variations in different parameters: (a) temperature; (b) acid/solid weight ratio; (c) particle size; (d) initial sulfuric acid concentration.
Processes 08 00056 g008
Figure 9. Relationship between ln k and 1/T, ln r, ln d, ln c: (a) the Arrhenius plot of the reaction; (b) relationship between ln k and ln r; (c) relationship between ln k and ln d; (d) relationship between ln k and ln c.
Processes 08 00056 g009aProcesses 08 00056 g009b
Figure 10. Plot of 1 3 ln ( 1 X )   [ 1 ( 1 X ) 1 3 ] versus time with the variation in different parameters: (a) temperature; (b) acid/solid weight ratio; (c) particle size; (d) initial sulfuric acid concentration.
Processes 08 00056 g010
Figure 11. Relationship between ln k and 1/T, ln r, ln d, ln c: (a) the Arrhenius plot of the reaction; (b) relationship between ln k and ln r; (c) relationship between ln k and ln d; (d) relationship between ln k and ln c.
Processes 08 00056 g011
Figure 12. XRD patterns of original TEFS and residue.
Processes 08 00056 g012
Figure 13. FESEM images showing the morphologies of original TEFS (a,b), acidolysis products (c,d), and water leaching residues (e,f).
Processes 08 00056 g013aProcesses 08 00056 g013b
Figure 14. XPS spectra of original TEFS and residue: (a) Mg 2p XPS spectra; (b) Al 2p XPS spectra; (c) Fe 2p XPS spectra; (d) Si 2p XPS spectra; (e) Ca 2p XPS spectra; (f) S 2p XPS spectra.
Processes 08 00056 g014aProcesses 08 00056 g014b
Table 1. R2 values of shrinking core kinetic models for 2.5 h of leaching at different temperatures.
R2 Values of Shrinking Core Kinetic Models
Temperature (K)1 − (1 − X)1/31 − 2X/2 − (1 − X)2/3[ln(1 − X)]/3 − [1 − (1 − X)1/3]
453.150.86490.93900.9856
473.150.84960.92110.9769
493.150.85160.92370.9834
513.150.84910.91940.9824
533.150.84460.91280.9794
Table 2. R2 values of shrinking core kinetic models for 2.5 h of leaching at different temperatures.
R2 Values of Shrinking Core Kinetic Models
Temperature (K)1 − (1 − X)1/31 − 2X/2 − (1 − X)2/3 [ln(1 − X)]/3 − [1 − (1 − X)1/3]
453.150.90040.97470.9968
473.150.88670.96660.9958
493.150.87310.94830.9931
513.150.85760.93040.9855
533.150.82310.89050.9564

