Abstract
Abandoned oil palm trunk (OPT) is among the most abundant left-over biomass in Malaysia and is allowed to decompose naturally in the field. However, the recycling of OPT is less considered although OPT is a bioresource that has a high potential for conversion into value-added products. In this study, waste OPT was rapidly converted by hydrolysis using subcritical water (sub-CW). This work is the first attempt to explore the utilization of waste OPT based on the differences in moisture, cellulose and hemicellulose contents in the top and bottom segments, and from various ages of the waste OPT. 21- and 35-year-old OPTs were divided into top and bottom sections. The OPTs was subjected to sub-CW at a heating rate of 3.8 °C/s at various temperatures and times. The 21-year-old OPT was superior to the 35-year-old OPT for conversion into sugar and organic acid. The yield of the total sugar was between 0.41 and 0.77 kg/kg-OPT in the bottom and top sections. The excellent correlation between the sugar yield and sub-CW ion product (Kw) signified that the sub-CW facilitated the hydrolysis of hemicellulose and cellulose in the OPT. In the bottom segment, fructose had a higher yield, while in the top part glucose was dominant. Sugar degradation from the sub-CW treatment of OPT produced 0.2 kg/kg-OPT organic acids. The treatment of OPT using sub-CW showed promising results in producing sugars and organic acids.
1. Introduction
Oil palm tree (Elaeis guineensis) is one of the most important commercial crops in Malaysia. The development of the oil palm industry has brought economic benefits to the country, making Malaysia the world’s top producers and exporters of palm oil [1,2,3,4,5,6]. However, the lifespan of the oil palm tree is about 20 years and requires replanting on a large scale. Since the palm oil consists of only about 10% of the total biomass produced in the plantation [7,8], the rest 90% remains as a primary biomass wastes in Malaysia. Thus, research on oil palm biomass residue is vital in minimizing wastes and increasing the economic return of the country [9,10,11,12].
At present, the waste oil palm trunks (OPT) are cut into pieces and stacked to be burnt for quick disposal. Some OPT is abandoned at the plantation ground to be naturally degraded by bacteria and fungi [13]. Part of the OPT outer section is used in the commercial manufacturing of plywood and veneers [14]. Similarly, paper or pulp production from OPT is well established. Recently, many researchers investigated the valorization of waste OPT for chemicals and energy, especially the production of sugars or other building blocks for organic synthesis products such as organic acids, vitamins and minerals [15]. The inner part of OPT contains about 80% sap of the total weight of OPT, with a fair amount of sugars that can be used as a feedstock for bioethanol production [16].
There are many existing methods for converting wastes to useful products, such as the hydrothermal method [17,18,19,20], enzymatic hydrolysis [21,22,23,24], steam explosion [25,26], concentrated acid hydrolysis [27,28], dilute acid pre-treatment, alkaline pretreatment, ionic liquids, and supercritical CO2 treatments [29,30,31,32,33,34,35,36,37]. Acids such as sulphuric acid, sodium hydroxide, and aqueous ammonia are used for biomass hydrolysis. However, the disadvantages of these conventional methods are the solvent recovery requirements, time-consuming, high energy consumption, excessive cost due to the use of solvents, poor extraction yield, and operating costs. Besides that, some of the organic solvents are corrosive, toxic, and may cause explosion and pollution.
Subcritical water (sub-CW) has recently gained interest for its use in converting biomass and organic materials into useful product and energy. Sub-CW is defined as liquid water between its boiling and critical temperature (374 °C) under high pressure that is equal or higher than the saturated vapor pressure. Sub-CW has unique features, such as a low dielectric constant at high temperatures as plotted in Figure 1 [38,39], making it possibly useful for extraction processes. It has been considered as an alternative to environmentally undesirable organic solvents. The ion-product (Kw) is maximum at 250 °C is another feature of sub-CW, which indicates the tendency of water to dissociate and facilitate hydrolysis. Currently, sub-CW has been used for the hydrolysis of biomass and carbohydrates into sugar and valuable products [40,41,42,43,44,45,46,47]. Asghari and Yoshida [47] hydrolyzed Japanese red pine wood and pure cellulose using sub-CW. Sasaki et al. [48] decomposed cellulose into glucose, fructose, and oligomers using sub-CW between 290 to 400 °C at 25 MPa with a flow-type reactor.
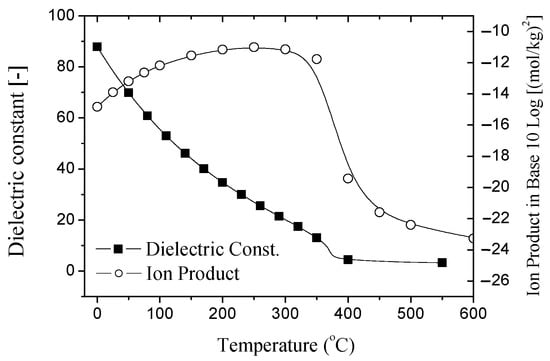
Figure 1.
Dielectric constant and ionic products of water at sub-critical state.
Although there have been studies on the decomposition of oil palm empty fruit bunch and mesocarp fiber under sub-CW conditions [3,41,49,50], there is no study on the conversion of waste OPT under sub-CW conditions. In the present work, the abandoned OPT was rapidly converted using sub-CW into sugars such as cellotriose, cellobiose, sucrose, fructose, glucose, and xylose. Furthermore, the decomposition of OPT into organic acids such as lactic acid, acetic acid, and malic acid were studied.
2. Materials and Methods
2.1. Sample Preparation and Pre-Treatment
Two tenera-type trunks from a 21- and 35-year-old OPT were obtained from the campus farm at Universiti Putra Malaysia and labelled as OPT21 and OPT35, respectively. The top section of both OPTs (OPT21-top and OPT35-top) and their corresponding bottom section (OPT21-btm and OPT35-btm) were obtained from the trunk, as illustrated in Figure 2a. The trunks were sliced into disc shapes, as shown in Figure 2b. The central zone of each segment was cut into small pieces (Figure 2c,d) because the volume of the internal part is much larger than the outside skin part. Furthermore, the internal part has a higher moisture content and sap. All the samples were placed in an airtight plastic bag and stored in a freezer at −18 °C to avoid microbial contamination.
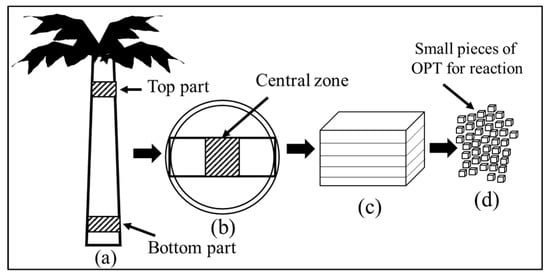
Figure 2.
Preparation of the oil palm trunk (OPT) samples prior to the subcritical water (sub-CW) treatment. (a) Oil palm tree illustrating the top and bottom sections, (b) disc-shaped trunks indicating central zone, (c) segmented central zones stacked together, and (d) small pieces of OPT from the segmented central zone.
The OPT pieces were dried in an oven (DRD620DA, Advantec) at 80 °C. The weight of the samples was measured every day until it became constant. The moisture content was calculated using Equation (1):
The moisture content was used to determine the dry weight of OPT. All the discussions in this study were based on the a weight basis.
2.2. Sub-CW treatment of OPT
A tube batch reactor made from stainless steel (SUS316 with a 0.008 m inner diameter, 0.15 m length, and 8 mL inner vol.) and Swagelok tube caps at both sides were used [51]. The OPT (2.5 g) and ultrapure water (3.5 mL) were charged into the reactor. Argon gas was used to replace air from the reactor to avoid excessive oxidation. Finally, the reactor was plugged tightly and immersed in a heating bath (Thomas Kagaku, Tokyo, Japan). The reactions were carried out at a constant temperature between 100 and 370 °C, with a rapid heating rate of 3.8 °C/s and a hold period between 1 and 20 min. The pressure in the reaction tube was projected from the saturated water vapor pressure-temperature table. After the reaction completes, the reactor was then taken out from the heating bath and immersed into a water bath at room temperature to rapidly quench the reactor. The reactions were performed at random to avoid systematic and propagation errors and so that the attained data would have less than 5% error.
The reaction products were separated into two phases: water-soluble and residual solid phases. First, all the contents in the reactor were recovered by washing with ultrapure water and collecting them into a centrifuge tube. Then, the tube was centrifuged for 5 min at 4000 rpm. The supernatant was recovered into a glass bottle. The appropriate amount of ultrapure water was added to the centrifuge tube. It was centrifuged again, and the supernatant was recovered into the same glass bottle. These washing procedures were repeated until the water phase became colorless. Then, the water phase was filtered and kept in a chiller for the analysis of water-soluble materials. The solid residue was dried at 55 °C in the oven. Tar was extracted from the solid phase using acetone using the same procedure as above. Then, the acetone was vaporized to gain the tar compounds. The residual solid was finally dried at 55 °C to obtain the amount of unreacted solid residue.
2.3. Sub-CW Treatment of OPT
The total organic carbon (TOC) was measured with a TOC analyzer (TOC-V, Shimadzu, Tokyo, Japan). The analyzer measured the total carbon (TC) and inorganic carbon (IC) separately. TOC was calculated by subtracting IC from TC. NaHCO3 and Na2CO3 solutions were used for constructing the IC calibration curve. Equation (2) defined the yield of TOC:
The total sugars were measured using the phenol-sulfuric acid method with a UV absorption spectrometer (UV-160A, Shimadzu, Japan). The absorbance was measured at 490 nm. The standard substance used was glucose. The calibration curve was prepared within the range of 0.2–1.0 AU equivalent toa glucose concentration of 10–100 ppm. The yield of total sugar was defined by Equation (3):
Cellotriose, cellobiose, glucose, fructose, and sucrose were used as the standard. The concentration of each sugar was determined by a high performance liquid chromatography, HPLC (PU-2080 plus, Jasco Corp, Tokyo, Japan) with two size-exclusion chromatography columns in series (Shodex SUGAR KS-801 and KS-G, Shodex Co.,Tokyo, Japan) using a refractive index detector (RI-2031 plus, Jasco Corp). This HPLC column oven was operated at 40 °C, and elution was carried out at a flow rate of 0.4 mL/min where ultrapure water was used as the mobile phase. Each calibration curve was made with different concentrations, and the injection volume for each sample was 20 µL.
The concentrations of organic acids were determined by HPLC (LC-10AD VP, Shimadzu) with double columns (Shim-pack SCR-102H, 8 mm I.D. × 300 mm L, Shimadzu) and a post column pH-buffered conductivity detector (CDD-6A, Shimadzu). The mobile phase was 5 mM p-toluenesulfonic acid (PTSA) solution, and the buffer phase was a mixture of 5 mM (PTSA) and 100 mM of EDTA both supplied at a flow rate of 0.8 mL/min at 40 °C. Acetic acid, lactic acid, and malic acid were used as the standards.
After all of the analyses were performed, the weight of the solid residue was weighed. The yield of solid residue was defined by Equation (4):
3. Results and Discussion
3.1. Moisture Content and Chemical Composition of OPTs
The moisture contents in the bottom and top sections of OPT21 and OPT35 during the drying process in the oven are presented in Table 1. The OPT21-btm has higher moisture content than the OPT21-top by a difference of ~20%. In contrast, the OPT35-top has a higher moisture content compared to the OPT35-btm, with a small difference of 2.7%. Generally, this variation of the moisture content in OPT is attributed to the capability of OPT to hold water molecules in its anatomical structure. OPT has high moisture content in the top sections due to the lower vascular bundle composition than parenchyma tissues [52,53]. However, based on the height factor, there is a tendency of the moisture content to decrease from the bottom to the top section through the effect of earth gravity, as in OPT21 [53]. This phenomenon mostly happened to the low-density central region, which is practically impossible to dry without excessive collapse and shrinkage [54]. Furthermore, the OPT moisture content was from 60 to 80% as compared to wood timber moisture content (40–50%) [55]. These moisture content results were used in the calculation of the dry weight of OPT.

Table 1.
The chemical composition of the 21-year-old OPT (OPT21).
Table 1 illustrates the chemical composition of OPT21. Only the hemicellulose and cellulose compositions were presented because of their abundance in OPT and their potential to be converted to sugars and organic acids. The cellulose compositions in both sections were higher compared to hemicellulose. This result is consistent with other researchers’ results, who used different methods, reported 32–41% cellulose and 21.2–34.5%hemicellulose in OPT [12,15,56,57]. In the present work, the hemicellulose and cellulose in both sections were between 20–32% and between 33–41%, respectively. The results were also within the range of the normal lignocellulosic components in plant biomass, which generally have 35–50% of cellulose, 20–35% of hemicellulose and 10–25% lignin [58]. This study has revealed the differences of moisture, cellulose, and hemicellulose contents in the top and bottom sections, and from various ages of the waste OPT.
3.2. Sub-CW Treatment of OPT
The effect of sub-CW temperatures to the treatment of OPT was investigated. Figure 3 shows photographs of the products after OPT being subjected to sub-CW treatment between 100–370 °C. The three phases produced after the sub-CW treatment were an water-soluble phase, oil (tar), and solid residue. The color of the water-soluble phase changed from bright yellow/brown to dark brown with increasing sub-CW temperature. The amount of solid diminished with an increasing reaction temperature, probably because a portion of the OPT decomposed into water-soluble materials and tar. This change is probably associated with the sub-CW hydrolysis reaction that occurred below 250 °C and the pyrolysis reaction that occurred above 250 °C.
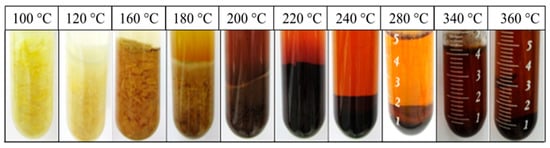
Figure 3.
Photographs of 21-year-old OPT (OPT21) after being subjected to sub-CW at various temperatures for 5 min.
3.3. Effect of Reaction Temperature on Yield of TOC
Figure 4 shows the effect of sub-CW temperatures on the yield of TOC that was obtained in the water-soluble phase from the bottom and top sections of OPT21 and OPT35. In the OPT21-btm (Figure 4A), the peaks appeared at 220 and 290 °C, and the TOC yield was 0.23 kg-C/kg-OPT. These two peaks signified that, below 250 °C, hemicellulose in the OPT has decomposed, possibly via sub-CW hydrolysis reaction. Above 250 °C, the cellulose fragment probably decomposed due to an oxidation and pyrolysis reactions. Meanwhile, from the OPT35-btm, the yield was 0.18 kg-C/kg-OPT at 210 and 280 °C. The organic compounds that formed below 220 °C were possibly monosaccharides, and those formed above 250 °C were oligosaccharides and organic acids.

Figure 4.
The effect of the reaction temperature on the yield of TOC after OPT21 (□) and OPT35 (▲) were subjected to a sub-CW treatment for 5 min. (A) Bottom and (B) top sections.
In Figure 4B, the OPT21-top has one peak at 230 °C and a maximum TOC yield of 0.37 kg-C/kg-OPT. From the OPT35-top, no substantial change occurred in the yield with about 0.16 kg-C/kg-OPT between 240 and 280 °C. It is interesting to note that the TOC yield trend is an almost similar trend to the ion product (Kw) of water as a function of the temperature. The Kw of water gives a maximum value of around 250 °C, as shown in Figure 1, which suggests the ability of water to promote the hydrolysis reaction [59]. Since the OPT21-top has the highest TOC yield, which therefore implies that the OPT was easily decomposed by sub-CW hydrolysis into other organic compounds at 250 °C.
3.4. Effect of Reaction Temperature on Yield of Total Sugar
The yield of sugar was investigated to elucidate the reason for the higher TOC yield. Figure 5 shows the effect of reaction temperature on the yield of total sugar in the water-soluble phase of the bottom and top sections of OPT. The reaction time was 5 min. The behavior was identical to the TOC results. From the OPT21-btm (Figure 5A), two peaks each at 180 °C and 240 °C, with a sugar yield of 0.29 kg/kg-OPT and 0.41 kg/kg-OPT, respectively, were observed. Meanwhile, from the OPT 35-btm, the maximum yields were 0.18 kg/kg-OPT at 170 °C and 0.23 kg/kg-OPT at 220 °C. The OPT21-btm had a higher yield than OPT35-btm with a difference of 11% and 18%, below and above 200 °C, respectively. This behavior is indicative of a different reaction temperature that caused the different fractionation stages between hemicellulose and cellulose. The first peak was described by the presence of a hemicellulose rich fraction, which is amorphous and readily hydrolyzed at lower temperatures (170 °C). The second fraction at higher temperatures (220–250 °C) is rich in cellulose [43,58].
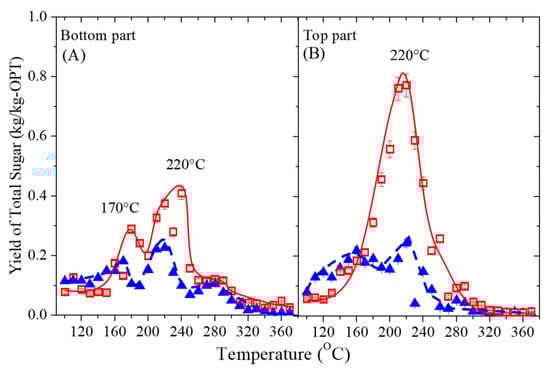
Figure 5.
Effect of the reaction temperature on the yield of total sugar after OPT 21 (□) and OPT 35 (▲) were subjected to a sub-CW treatment for 5 min. (A) Bottom and (B) top sections.
In Figure 5B, the highest sugar yields from OPT21-top and OPT35-top were 0.77 kg/kg-OPT and 0.32 kg/kg-OPT, respectively, both at 220 °C. The sugar yield from OPT21 was twice higher than OPT35, probably due to the higher composition of parenchyma tissues, which stored most of the sugars [60]. Above 300 °C, the sugar yield from both OPTs decreased and was negligible as a result of the pyrolysis reaction. Since the treatment of the OPT top section resulted in the highest yield of total sugars, the top section can be predominantly treated with sub-CW to yield sugars for bioethanol production [61].
Figure 6 illustrated the relationship between the yield of total sugar and Kw when a sub-CW treatment was carried out between 180 and 220 °C. This temperature range was considered because the ionic product of water is the highest [62,63]. The correlation coefficient between the yield of total sugar in the OPT21-top and Kw of water was 0.98. This excellent correlation signified that the sub-CW facilitated the hydrolysis of hemicellulose and cellulose in the OPT. The higher ionic-product constant in the water at subcritical state indicates the capability of OH− ions in water to dissociate, and thus activating the hydrolysis of lignocellulose. As a consequence, from the effect of sub-CW temperatures, the degradation of the lignocellulose was observed, which therefore signified that the hydrolysis process by sub-CW is dependent on the ionic-product constant value. In another study using other biomass waste, Zhu et al. reported that the hydrolysis of bean waste using sub-CW produced reducing sugars and monosaccharides [64].
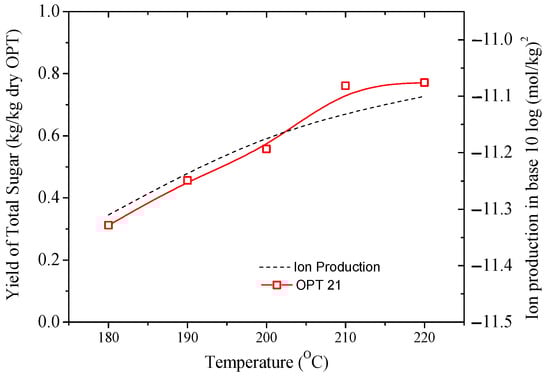
Figure 6.
The relation between the ion-products of water (---) and the yield of sugar (□).
3.5. Effect of Reaction Temperature on Yield of Solid Residue
Figure 7 shows the solid residue of OPT21 after being subjected to sub-CW treatment between 100 and 360 °C for 5 min. The solid residue of OPT is the portion of the OPT residue that did not dissolve after the sub-CW treatment. The quantity of the solid residue decreased, and the color changed from a light brown solid to a dark brown powder with an increasing temperature. This change could be associated with the carbonization and the formation of tar, which increased with increasing pyrolysis activity [20,35,65,66].
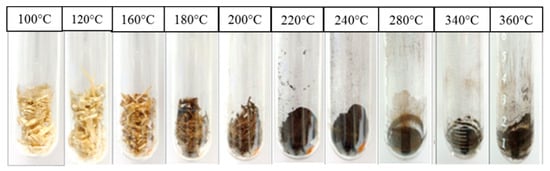
Figure 7.
Photographs of the solid residue of OPT21 after a 5 min reaction time under different sub-CW temperatures.
Figure 8 shows the effect of the sub-CW temperature on the yield of solid residue from OPT21 and OPT35 at a reaction time of 5 min. In Figure 8A, the yields of the solid residue yield from both OPT21-btm and OPT35-btm were almost similar. Between 100 and 150 °C, the yield did not change, suggesting that the decomposition did not occur below 150 °C. The yields decreased rapidly between 160 and 290 °C to 0.11 kg/kg-OPT because of the volatilization of cellulose. Above 300 °C, the yields were nearly constant around 0.1 kg/kg-OPT for both OPTs due to lignin decomposition [67].
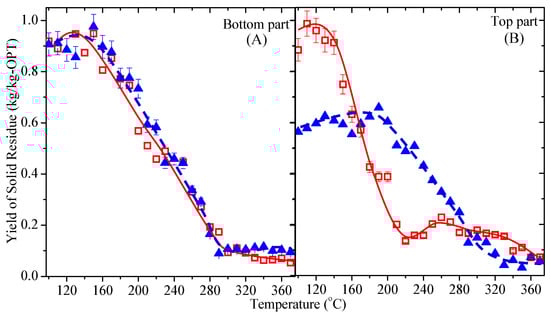
Figure 8.
The effect of the reaction temperature on the yield of solid residue after OPT21 (□) and OPT35 (▲) were subjected to sub-CW for 5 min. (A) Bottom and (B) top sections.
Figure 8B illustrates the yields of the solid residue of OPT21-top and OPT35-top. For OPT21-top, the yield was about 0.9 kg/kg-OPT, indicating that the decomposition of OPT had not yet occurred between 100 and 150 °C. The solid residue yield dropped to 0.2 kg/kg-OPT when treated at 210 °C and remained constant when treated until 360 °C. However, for the OPT35-top, the yield was 0.6 kg/kg-OPT between 100 and 190 °C. The OPT35-top was easier to decompose than the OPT35-btm below 200 °C, probably due to the density of the top section of OPT, which is smaller compared to the bottom section [14]. However, above 190 °C, the yield of solid residue from OPT21 significantly reduced to under 0.1 kg/kg-OPT. The sub-CW treatment caused hemicellulose to decompose into monosaccharides and part of the cellulose to decompose into a shorter chain of polysaccharides such as disaccharide and trisaccharide. This reduction was evidenced by the increase of TOC and the yield of total sugars in Figure 4 and Figure 5, which corresponded well with the decrease of the solid residue yield in Figure 8.
Consequently, regardless of the OPT sections and age, this study demonstrated that OPT decomposed considerably when the reaction temperature was above 280 °C. At this temperature, pyrolysis by sub-CW was more dominant in lignin decomposition to form bio-oil [68]. The detailed analysis of the solid residue was performed and reported in another study related to OPT pyrolysis for producing bio-oil as an alternative fuel.
3.6. Effect of Sub-CW Temperature on Yield of Free Sugar Components
Figure 9 shows the effect of the sub-CW temperature on the yield of each free sugar in both sections of OPT after being treated for 5 min. The water-soluble phase for reactions between 200 and 300 °C was analyzed for their sugar content. The sugars that were detected consisted of cellotriose, cellobiose, glucose, fructose, and xylose, and most of the sugars were reported to exist in the trunks [16,61].
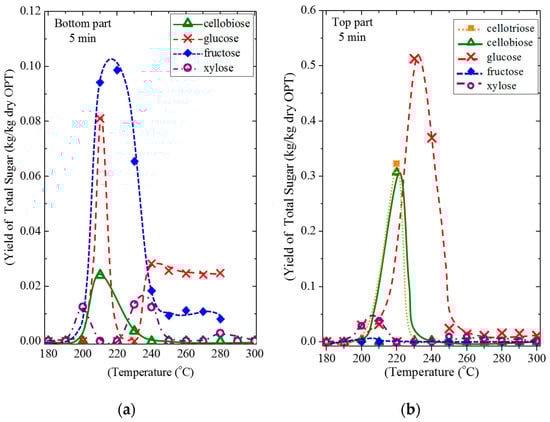
Figure 9.
The effect of the reaction temperature on the yield of free sugar after OPT21 was subjected to sub-CW for 5 min. (a) bottom and (b) top sections.
For the OPT21-btm in Figure 9a, the highest yield of sugar was fructose (0.10 kg/kg-OPT) at 220 °C, followed by glucose (0.08 kg/kg-OPT) at 210 °C, cellobiose (0.02 kg/kg-OPT) at 210 °C and xylose (0.01 kg/kg-OPT) at 230 °C. Surprisingly, the yield of fructose was higher than the glucose. Since fructose was not stable at high temperatures, the yield declined sharply with the increasing reaction temperature. The glucose yield increased sharply from 200 °C and then decreased sharply to 230 °C. A cellobiose peak appeared at 210 °C, which is indicative of the fact that cellulose in OPT was hydrolyzed during the sub-CW treatment. The yield of cellobiose dropped as the temperature increased because it was hydrolyzed into glucose. The yield of xylose was the lowest compared to other saccharides, where two small peaks appeared at 200 °C and 230 °C.
In Figure 9b, the yield of significant sugars from the OPT21-top was glucose (0.51 kg/kg-OPT) at 230 °C, followed by cellotriose and cellobiose (0.32 and 0.31 kg/kg-OPT, respectively) at 220 °C and xylose (0.04 kg/kg-OPT) at 210 °C. The yield of glucose was the highest among other saccharides due to the hydrolysis of hemicellulose and also due to the degradation of cellotriose and cellobiose to form glucose. Thus, the cellotriose and cellobiose peaks appeared at the same reaction temperature (220 °C) before glucose peaks, then decreasing as the temperature increased. The yields of xylose and fructose were low at every temperature.
The behavior in Figure 9 and all of the peaks below 250 °C explained that hydrolysis appeared at different temperatures [69]. In general, most of the identified products showed a peak at around 200 to 240 °C. This suggested that the hemicellulose and cellulose in OPT were broken down by sub-CW into tri‒, di‒, and monosaccharides by strong hydrolysis [69,70]. The monomer production and degradation rates vary with the type of sugar. Above 250 °C, the yield of sugar was less because of the degradation of sugar increased with reaction temperature. They are degraded into organic acids, furfural, and other by-products that were not identified in this research. The oligomer or glucose degradation rates are higher than the cellulose hydrolysis rate when subjected to a sub-CW treatment; thus, the yield of monosaccharide was lower [43].
3.7. Effect of Sub-CW Temperature on Yield of Organic Acids
Figure 10 shows the effect of the reaction temperature on the yield of organic acids in OPT21 between 200–370 °C for 5 min. The water-soluble phase was analyzed for organic acids by the HPLC method. The organic acids were produced as a result of the dehydrated products that were oxidized into malic acid, lactic acid, and acetic acid.

Figure 10.
The effect of the reaction temperature on the yield of organic acids after OPT21 was subjected to sub-CW for 5 min. (a) bottom and (b) top sections.
For OPT21-btm (Figure 10a), the acetic acid yield was 0.12 kg/kg-OPT between 240 °C and 280 °C. The acetic acid yield increased until 0.20 kg/kg-OPT at 360 °C. For the OPT21-top (Figure 10b), the yield of acetic acid increased above 300 °C until 0.16 kg/kg-OPT at 370 °C. The OPT21-btm had a slightly higher yield of acetic acid than the OPT21-top due to a higher yield of reducing sugar, which contributed to the yield of acetic acid. Acetic acid was generated above 280 °C in both sections of OPT mainly by the hydrolysis of the acetyl group of hemicellulose together with the production of pentose [71]. This behavior explained the reason for why the yield of total sugar dropped above 220 °C, as shown in Figure 5, while the yield of acetic acid increased above 280 °C. It is worth noting that the acetic acid yield for the OPT21-top was zero below 280 °C but was 0.12 kg/kg-OPT in OPT21-btm. The zero acetic acid was probably associated with a higher moisture content in the top section, as shown in Table 1. This distinction is indicative of the difference between the top and bottom sections of the OPT.
The yield of malic acid also increased as the temperature increased. In the OPT21-btm, the yield increased to 0.07 kg/kg-OPT at 300 °C. In OPT21-top, the malic acid yield was almost constant with the increasing temperature. The malic acid yield was 0.03 kg/kg-OPT at 260 °C and 0.04 kg/kg-OPT at 340 °C. The yield of malic acid in the OPT21-btm was higher than the OPT21-top by 2%. The lactic acid only formed between 200 to 290 °C in OPT21. This formation could be due to the degradation of lactic acid because it is reported to be unstable and volatile at high temperatures [72]. The highest lactic acid yields in the OPT21-btm and OPT21-top were between 0.04 kg/kg-OPT (270 °C) and 0.07 kg/kg-OPT (280 °C), respectively.
Consequently, both sections of the OPT21 had some slight differences in the yield of organic acids. The organic acids were reported to be produced by sub-CW oxidation and pyrolysis reactions above 200 °C [19,39]. Besides, the yield of sugar decreased due to the rapid degradation of monosaccharides into these organic acids. Those organic acids tend to form not only in OPT but also in other biomasses [16,67].
3.8. Effect of Sub-CW Reaction Time of OPT21
Based on the optimum yield of TOC and total sugar, 220 °C was chosen as the reaction temperature for studying the effect of the reaction time between 1–20 min. Figure 11 shows the yield of TOC, total sugar and the solid residue of OPT21 from different reaction times.

Figure 11.
The effect of the sub-CW treatment time over OPT21 on the yield of (a) TOC, (b) the total sugar and, and (c) the solid residue.
Figure 11a indicates the yield of TOC in the water-soluble phase. The TOC showed a sharp increase of up to 2 min with the highest TOC yields of 0.23 kg-C/kg-OPT and 0.36 kg-C/kg-OPT from OPT21-btm and OPT21-top, respectively. This showed that the sub-CW treatment required only a short reaction time for OPT decomposition into sugar and organic acids.
The total sugar yield was similar to the yield of TOC, as illustrated in Figure 11b. When the treatment was performed for 5 min, due to the strong hydrolysis activity, OPT produced the highest yield of total sugar with values of 0.37 kg/kg-OPT and 0.77 kg/kg-OPT from OPT21-btm and the OPT21-top, respectively. The total sugar yield decreased when the treatment prolonged over 5 min due to the degradation of sugar to organic acids. Moreover, it underwent further reactions to form bio-oil and char after a more extended treatment time. Therefore, the optimum reaction time to produce maximum yields of valuable materials by sub-CW was 5 min and at a temperature of 220 °C.
The yield of solid residue was 1 kg/kg-OPT before the sub-CW reaction, and it drastically dropped when the treatment time went up to 2 min, as shown in Figure 11c. The yield decreased rapidly to 0.4 kg/kg-OPT and 0.15 kg/kg-OPT from OPT21-btm and OPT21-top, respectively. The yield of solid residue decreased with time because OPT decomposed into sugars, organic acids, tar, and other valuable products via the sub-CW reaction. The yield was almost constant for a treatment longer than 2 min.
As a conclusion, the sub-CW treatment of OPT required only 5 min and a moderate temperature of only 220 °C for achieving the maximum yield of sugars and organic acids. Other methods, such as acid hydrolysis, required a longer reaction time (60–120 min), and most of the acid solutions used to obtain sugars in OPT are corrosive and less practical [6,73]. The short treatment time also demonstrated the advantage of the sub-CW method over the enzymatic hydrolysis method, which is reported to be very time-consuming [61,74].
4. Conclusions
The sub-CW treatment was performed to produce useful products from abandoned OPT. This is the first study that explored the utilization of waste OPT for sub-CW treatment based on the differences of moisture, cellulose, and hemicellulose contents in the top and bottom sections, and from different ages of the waste OPT. The sub-CW treatment successfully converted the waste OPT into sugars and organic acids, although OPT contained 60–80% moisture content. The conclusions of this work are as follows:
- OPT21 was more suitable than OPT35 for producing water-soluble products by sub-CW treatment because it produced a higher yield of sugar. The sugars yield can be utilized for second-generation bioethanol production. Furthermore, OPT21 is close to the economic lifespan of an oil palm tree and can be harvested as soon as the oil production of the tree has finished.
- The sub-CW promoted hydrolysis and converted the waste OPT into water-soluble saccharides (cellotriose, cellobiose, glucose, xylose, and fructose) and organic acids (acetic acid, lactic acid, and malic acid). As a result, the OPT solid residual waste was substantially reduced.
- The optimum reaction temperature and time for a maximum yield of total sugar were 240 °C (5 min) for the OPT21-btm and 220 °C (5 min) for the OPT21-top. Overall, the top section had a higher yield of sugar compared to the bottom section.
- From the present study, the sub-CW treatment process showed promising results and an environment-friendly solution to utilize abandoned OPT waste.
Author Contributions
This work was the contribution of the following members. Project conceptualization, H.Y.; methodology, H.I.; validation, N.A.M. and H.I.; formal analysis, H.I. and N.A.M.; investigation, M.H.S.I.; resources, H.Y.; data curation, H.I. and N.A.M.; writing—original draft preparation, H.I.; writing—review and editing, S.I.; visualization, H.Y.; supervision, S.I.; project administration, S.I.; and funding acquisition, H.Y.
Funding
The authors gratefully acknowledge the support of a part of this work by the Malaysian Government through the Education Ministry under the Fundamental Research Grant Scheme (Grant Number 5524505).
Conflicts of Interest
The authors declare no conflict of interest.
References
- Sulaiman, F.; Abdullah, N.; Gerhauser, H.; Shariff, A. An Outlook of Malaysian Energy, Oil Palm Industry and Its Utilization of Wastes as Useful Resources. Biomass Bioenergy 2011, 35, 3775–3786. [Google Scholar] [CrossRef]
- Khalil, H.A.; Jawaid, M.; Hassan, A.; Paridah, M.T.; Zaidon, A. Oil Palm Biomass Fibres and Recent Advancement in Oil Palm Biomass Fibres Based Hybrid Biocomposites. Compos. Their Appl. 2012, 187–220. [Google Scholar] [CrossRef]
- Goh, C.S.; Lee, K.T.; Bhatia, S. Hot Compressed Water Pretreatment of Oil Palm Fronds to Enhance Glucose Recovery for Production of Second Generation Bio-Ethanol. Bioresour. Technol. 2010, 101, 7362–7367. [Google Scholar] [CrossRef] [PubMed]
- Aghamohammadi, N.; Reginald, S.S.; Shamiri, A.; Zinatizadeh, A.A.; Wong, L.P.; Meriam, N.; Nik, B. An Investigation of Sustainable Power Generation from Oil Palm Biomass: A Case Study in Sarawak. Sustainability 2016, 8, 416. [Google Scholar] [CrossRef]
- Awalludin, M.F.; Sulaiman, O.; Hashim, R.; Aidawati, W.N. An Overview of the Oil Palm Industry in Malaysia and Its Waste Utilization through Thermochemical Conversion, Specifically via Liquefaction. Renew. Sustain. Energy Rev. 2015, 50, 1469–1484. [Google Scholar] [CrossRef]
- Chin, K.L.; H’ng, P.S.; Wong, L.J.; Tey, B.T.; Paridah, M.T. Production of Glucose from Oil Palm Trunk and Sawdust of Rubberwood and Mixed Hardwood. Appl. Energy 2011, 88, 4222–4228. [Google Scholar] [CrossRef]
- Abdullah, N.; Sulaiman, F. The Oil Palm Wastes in Malaysia. In Biomass Now—Sustainable Growth and Use; IntechOpen: London, UK, 2013; pp. 75–100. [Google Scholar]
- Yamada, H.; Tanaka, R.; Sulaiman, O.; Hashim, R.; Hamid, Z.A.A.; Yahya, M.K.A.; Kosugi, A.; Arai, T.; Murata, Y.; Nirasawa, S.; et al. Old Oil Palm Trunk: A Promising Source of Sugars for Bioethanol Production. Biomass Bioenergy 2010, 34, 1608–1613. [Google Scholar] [CrossRef]
- Lam, M.K.; Tan, K.T.; Lee, K.T.; Mohamed, A.R. Malaysian Palm Oil: Surviving the Food versus Fuel Dispute for a Sustainable Future. Renew. Sustain. Energy Rev. 2009, 13, 1456–1464. [Google Scholar] [CrossRef]
- Lamaming, J.; Hashim, R.; Sulaiman, O.; Sugimoto, T.; Sato, M.; Hiziroglu, S. Measurement of Some Properties of Binderless Particleboards Made from Young and Old Oil Palm Trunks. Meas. J. Int. Meas. Confed. 2014, 47, 813–819. [Google Scholar] [CrossRef]
- Jorge, F.C. Floating Concrete ! Light-Weight Concrete from Granulated Cork Waste. In Proceedings of the ICECFOP1—1st International Conference on Environmentally—Compatible Forest Products, Oporto, Portugal, 22–24 September 2004. [Google Scholar]
- Yuliansyah, A.; Hirajima, T. Efficacy of Hydrothermal Treatment for Production of Solid Fuel from Oil Palm Wastes. In Resource Management for Sustainable Agriculture; BoD–Books on Demand: Norderstedt, Germany, 2012; p. 296. [Google Scholar]
- Lim, K.O.; Ahmaddin, F.H.; Vizhi, S.M. A Note on the Conversion of Oil-Palm Trunks to Glucose via Acid Hydrolysis. Bioresour. Technol. 1997, 59, 33–35. [Google Scholar] [CrossRef]
- Sulaiman, O.; Salim, N.; Nordin, N.A.; Hashim, R.; Ibrahim, M.; Sato, M. The potential of oil palm trunk biomass as an alternative source for compressed wood othman sulaiman. Bioresources 2012, 7, 2688–2706. [Google Scholar] [CrossRef]
- Abdul Khalil, H.P.S.; Siti Alwani, M.; Ridzuan, R.; Kamarudin, H.; Khairul, A. Chemical Composition, Morphological Characteristics, and Cell Wall Structure of Malaysian Oil Palm Fibers. Polym. Plast. Technol. Eng. 2008, 47, 273–280. [Google Scholar] [CrossRef]
- Kosugi, A.; Tanaka, R.; Magara, K.; Murata, Y.; Arai, T.; Sulaiman, O.; Hashim, R.; Hamid, Z.A.A.; Yahya, M.K.A.; Yusof, M.N.M.; et al. Ethanol and Lactic Acid Production Using Sap Squeezed from Old Oil Palm Trunks Felled for Replanting. J. Biosci. Bioeng. 2010, 110, 322–325. [Google Scholar] [CrossRef] [PubMed]
- Rafein, M.; Nor, M.; Norrrahim, F.; Hirata, S.; Ali, M. Hydrothermal and Wet Disk Milling Pretreatment for High Conversion of Biosugars from Oil Palm Mesocarp Fiber. Bioresour. Technol. 2015, 181, 263–269. [Google Scholar] [CrossRef]
- Pińkowska, H.; Wolak, P.; Złocińska, A. Hydrothermal Decomposition of Xylan as a Model Substance for Plant Biomass Waste—Hydrothermolysis in Subcritical Water. Biomass Bioenergy 2011, 35, 3902–3912. [Google Scholar] [CrossRef]
- Gao, Y.; Wang, H.; Guo, J.; Peng, P.; Zhai, M.; She, D. Hydrothermal Degradation of Hemicelluloses from Triploid Poplar in Hot Compressed Water at 180–340 °C. Polym. Degrad. Stab. 2016, 126, 179–187. [Google Scholar] [CrossRef]
- Brunner, G. Near Critical and Supercritical Water. Part I. Hydrolytic and Hydrothermal Processes. J. Supercrit. Fluids 2009, 47, 373–381. [Google Scholar] [CrossRef]
- Rafein, M.; Hirata, S.; Ali, M. Hydrothermal Pretreatment Enhanced Enzymatic Hydrolysis and Glucose Production from Oil Palm Biomass. Bioresour. Technol. 2015, 176, 142–148. [Google Scholar] [CrossRef]
- Yoshida, M.; Liu, Y.; Uchida, S.; Kawarada, K.; Ukagami, Y.; Ichinose, H.; Kaneko, S.; Fukuda, K. Effects of Cellulose Crystallinity, Hemicellulose, and Lignin on the Enzymatic Hydrolysis of Miscanthus Sinensis to Monosaccharides. Biosci. Biotechnol. Biochem. 2008, 72, 805–810. [Google Scholar] [CrossRef]
- Öhgren, K.; Bura, R.; Saddler, J.; Zacchi, G. Effect of Hemicellulose and Lignin Removal on Enzymatic Hydrolysis of Steam Pretreated Corn Stover. Bioresour. Technol. 2007, 98, 2503–2510. [Google Scholar] [CrossRef]
- Mussatto, S.I.; Fernandes, M.; Milagres, A.M.F.; Roberto, I.C. Effect of Hemicellulose and Lignin on Enzymatic Hydrolysis of Cellulose from Brewer’s Spent Grain. Enzyme Microb. Technol. 2008, 43, 124–129. [Google Scholar] [CrossRef]
- Pumiput, P.; Chuntranuluck, S. Production Process of Hydrolysate from Steam Explosion of Oil Palm Trunk for Xylitol Fermentation. Kasetsart J. 2008, 42, 73–78. [Google Scholar]
- Teng, C.; Yan, Q.; Jiang, Z.; Fan, G.; Shi, B. Production of Xylooligosaccharides from the Steam Explosion Liquor of Corncobs Coupled with Enzymatic Hydrolysis Using a Thermostable Xylanase. Bioresour. Technol. 2010, 101, 7679–7682. [Google Scholar] [CrossRef] [PubMed]
- Yoon, S.Y.; Han, S.H.; Shin, S.J. The Effect of Hemicelluloses and Lignin on Acid Hydrolysis of Cellulose. Energy 2014, 77, 19–24. [Google Scholar] [CrossRef]
- Pessoa, J.R.A.; Mancilha, I.M.; Sato, S. Acid Hydrolysis of Hemicellulose from Sugarcane Bagasse. Braz. J. Chem. Eng. 1997, 14, 1–8. [Google Scholar] [CrossRef]
- Zavrel, M.; Bross, D.; Funke, M.; Büchs, J.; Spiess, A.C. High-Throughput Screening for Ionic Liquids Dissolving (Ligno-) Cellulose. Bioresour. Technol. 2009, 100, 2580–2587. [Google Scholar] [CrossRef] [PubMed]
- Mäki-arvela, P.; Anugwom, I.; Virtanen, P.; Sjöholm, R.; Mikkola, J.P. Dissolution of Lignocellulosic Materials and Its Constituents Using Ionic Liquids—A Review. Ind. Crop. Prod. 2010, 32, 175–201. [Google Scholar] [CrossRef]
- Tan, H.T.; Lee, K.T. Understanding the Impact of Ionic Liquid Pretreatment on Biomass and Enzymatic Hydrolysis. Chem. Eng. J. 2012, 183, 448–458. [Google Scholar] [CrossRef]
- Thanh, H.; Tanda, V.; Jae, J.; Sik, H.; Lee, H. Hydrolysis of Ionic Cellulose to Glucose. Bioresour. Technol. 2014, 167, 484–489. [Google Scholar]
- Lai, L.W.; Idris, A. Disruption of Oil Palm Trunks and Fronds by Microwave-Alkali Pretreatment. Bioresources 2013, 8, 2792–2804. [Google Scholar] [CrossRef]
- Li, C.; Knierim, B.; Manisseri, C.; Arora, R.; Scheller, H.V.; Auer, M.; Vogel, K.P.; Simmons, B.A.; Singh, S. Comparison of Dilute Acid and Ionic Liquid Pretreatment of Switchgrass: Biomass Recalcitrance, Delignification and Enzymatic Saccharification. Bioresour. Technol. 2010, 101, 4900–4906. [Google Scholar] [CrossRef] [PubMed]
- Lachos-Perez, D.; Brown, A.B.; Mudhoo, A.; Timko, M.T.; Rostagno, M.A.; Forster-Carneiro, T. Applications of Subcritical and Supercritical Water Conditions for Extraction, Hydrolysis, Gasification, and Carbonization of Biomass: A Critical Review. Biofuel Res. J. 2017, 4, 611–626. [Google Scholar] [CrossRef]
- Mazaheri, H.; Lee, K.T.; Bhatia, S.; Mohamed, A.R. Sub/Supercritical Liquefaction of Oil Palm Fruit Press Fiber for the Production of Bio-Oil: Effect of Solvents. Bioresour. Technol. 2010, 101, 7641–7647. [Google Scholar] [CrossRef] [PubMed]
- Qian, Y.; Zuo, C.; Tan, J.; He, J. Structural Analysis of Bio-Oils from Sub-and Supercritical Water Liquefaction of Woody Biomass. Energy 2007, 32, 196–202. [Google Scholar] [CrossRef]
- Yoshida, H.; Asghari, F.S. Kinetics of the Decomposition of Fructose Catalyzed by Hydrochloric Acid in Subcritical Water: Formation of 5-Hydroxymethylfurfural, Levulinic, and Formic Acids. Ind. Eng. Chem. Res. 2007, 46, 7703–7710. [Google Scholar] [CrossRef]
- Yoshida, H.; Matsuzaki, T. Conversion of Chicken Wastes to Valuable Materials, Oils, and Calcium Phosphate Using Sub-critical Water. In Proceedings of the 7th International Conference on Sustainable Agriculture for Food, Energy and Industry in Regional and Global Context (ICSAFEI2015), Kuala Lumpur, Malaysia, 25‒26 August 2015. ICSAFEI-158. [Google Scholar]
- Pourali, O. Production of Valuable Materials from Rice Bran Biomass Using Subcritical Water. Ph.D. Thesis, Osaka Prefecture University, Osaka, Japan, 2009; pp. 5–124. [Google Scholar]
- Mazaheri, H.; Lee, K.T.; Bhatia, S.; Mohamed, A.R. Subcritical Water Liquefaction of Oil Palm Fruit Press Fiber in the Presence of Sodium Hydroxide: An Optimisation Study Using Response Surface Methodology. Bioresour. Technol. 2010, 101, 9335–9341. [Google Scholar] [CrossRef]
- Carrier, M.; Loppinet-Serani, A.; Absalon, C.; Aymonier, C.; Mench, M. Degradation Pathways of Holocellulose, Lignin and α-Cellulose from Pteris Vittata Fronds in Sub- and Super Critical Conditions. Biomass Bioenergy 2012, 43, 65–71. [Google Scholar] [CrossRef]
- Prado, J.M.; Follegatti-Romero, L.A.; Forster-Carneiro, T.; Rostagno, M.A.; Maugeri Filho, F.; Meireles, M.A.A. Hydrolysis of Sugarcane Bagasse in Subcritical Water. J. Supercrit. Fluids 2014, 86, 15–22. [Google Scholar] [CrossRef]
- Prado, J.M.; Forster-Carneiro, T.; Rostagno, M.A.; Follegatti-Romero, L.A.; Maugeri Filho, F.; Meireles, M.A.A. Obtaining Sugars from Coconut Husk, Defatted Grape Seed, and Pressed Palm Fiber by Hydrolysis with Subcritical Water. J. Supercrit. Fluids 2014, 89, 89–98. [Google Scholar] [CrossRef]
- Oomori, T.; Khajavi, S.H.; Kimura, Y.; Adachi, S.; Matsuno, R. Hydrolysis of Disaccharides Containing Glucose Residue in Subcritical Water. Biochem. Eng. J. 2004, 18, 143–147. [Google Scholar] [CrossRef]
- Lin, R.; Cheng, J.; Ding, L.; Song, W.; Qi, F.; Zhou, J.; Cen, K. Subcritical Water Hydrolysis of Rice Straw for Reducing Sugar Production with Focus on Degradation By-Products and Kinetic Analysis. Bioresour. Technol. 2015, 186, 8–14. [Google Scholar] [CrossRef] [PubMed]
- Salak, F.; Yoshida, H. Conversion of Japanese Red Pine Wood (Pinus Densiflora) into Valuable Chemicals under Subcritical Water Conditions. Carbohydr. Res. 2010, 345, 124–131. [Google Scholar] [CrossRef]
- Sasaki, M.; Kabyemela, B.; Malaluan, R.; Hirose, S.; Takeda, N.; Adschiri, T.; Arai, K. Cellulose Hydrolysis in Subcritical and Supercritical Water. J. Supercrit. Fluids 1998, 13, 261–268. [Google Scholar] [CrossRef]
- Mustapa, A.N.; Manan, Z.A.; Mohd Azizi, C.Y.; Setianto, W.B.; Mohd Omar, A.K. Extraction of β-Carotenes from Palm Oil Mesocarp Using Sub-Critical R134a. Food Chem. 2011, 125, 262–267. [Google Scholar] [CrossRef]
- Hanim, S.S.; Norsyabilah, R.; Suhaila, M.H.N.; Noraishah, A.; Kartina, A.K.S. Effects of Temperature, Time and Pressure on the Hemicelluloses Yield Extracted Using Subcritical Water Extraction. Procedia Eng. 2012, 42, 562–565. [Google Scholar] [CrossRef]
- Yoshida, H.; Terashima, M.; Takahashi, Y. Production of Organic Acids and Amino Acids from Fish Meat by Sub-Critical Water Hydrolysis. Biotechnol. Prog. 1999, 15, 1090–1094. [Google Scholar] [CrossRef] [PubMed]
- Mhd Ramle, S.F.; Sulaiman, O.; Hashim, R.; Arai, T.; Kosugi, A.; Abe, H.; Murata, Y.; Mori, Y. Characterization of Parenchyma and Vascular Bundle of Oil Palm Trunk as Function of Storage. Lignocellulose 2012, 1, 33–44. [Google Scholar]
- Lim, S.C.; Gan, K.S. Characteristics and Utilisation of Oil Palm Stem. Timber Technol. Bull. 2005, 35, 81–96. [Google Scholar]
- Dungani, R.; Jawaid, M.; Khalil, H.P.S.A.; Aprilia, S. A Review on Quality Enhancement of Oil Palm Trunk Waste by Resin Impregnation: Future Materials. Bioresources 2013, 8, 3136–3156. [Google Scholar] [CrossRef]
- Pourali, O.; Salak, F.; Yoshida, H. Sub-Critical Water Treatment of Rice Bran to Produce Valuable Materials. Food Chem. 2009, 115, 1–7. [Google Scholar] [CrossRef]
- Atnaw, S.M.; Sulaiman, S.A.; Yusup, S. Downdraft Gasification of Oil Palm Fronds. Trends Appl. Sci. Res. 2011, 6, 1006–1018. [Google Scholar]
- Kong, S.H.; Loh, S.K.; Bachmann, R.T.; Rahim, S.A.; Salimon, J. Biochar from Oil Palm Biomass: A Review of Its Potential and Challenges. Renew. Sustain. Energy Rev. 2014, 39, 729–739. [Google Scholar] [CrossRef]
- Zhao, H.; Jones, C.L.; Baker, G.A.; Xia, S.; Olubajo, O.; Person, V.N.; Division, C.S.; Ridge, O.; Ridge, O. Regenerating Cellulose from Ionic Liquids for an Accelerated Enzymatic Hydrolysis. J. Biotechnol. 2009, 139, 47–54. [Google Scholar] [CrossRef] [PubMed]
- Tavakoli, O.; Yoshida, H. Conversion of Scallop Viscera Wastes to Valuable Compounds Using Sub-Critical Water. Green Chem. 2006, 8, 100–106. [Google Scholar] [CrossRef]
- Abe, H.; Murata, Y.; Kubo, S.; Watanabe, K.; Tanaka, R.; Sulaiman, O.; Hashim, R.; Fatimah, S.; Ramle, M.; Zhang, C.; et al. Estimation of the Ratio of Vascular Bundles to Parenchyma Tissue in Oil Palm Trunks Using NIR Spectroscopy. Bioresources 2013, 8, 1573–1581. [Google Scholar] [CrossRef]
- Murai, K.; Kondo, R. Extractable Sugar Contents of Trunks from Fruiting and Nonfruiting Oil Palms of Different Ages. J. Wood Sci. 2011, 57, 140–148. [Google Scholar] [CrossRef]
- Azrin, N.; Kurnin, A.; Halim, M.; Ismail, S.; Yoshida, H.; Izhar, S. Recovery of Palm Oil and Valuable Material from Oil Palm Empty Fruit Bunch by Sub- Critical Water Recovery of Palm Oil and Valuable Material from Oil Palm Empty Fruit Bunch by Sub-Critical Water. J. Oleo Sci. 2016, 65, 283–289. [Google Scholar] [CrossRef][Green Version]
- Yoshida, H.; Izhar, S.; Nishio, E.; Utsumi, Y.; Kakimori, N.; Asghari, F.S. Application of Sub-Critical Water for Recovery of Tin and Glass Substrates from LCD Panel E-Waste. Detritus 2018, 4, 98–103. [Google Scholar] [CrossRef]
- Zhu, G.; Zhu, X.; Fan, Q.; Wan, X. Pyrolysis Production of Reducing Sugars from Bean Dregs Waste by Hydrolysis in Subcritical Water. J. Anal. Appl. Pyrolysis 2011, 90, 183–187. [Google Scholar] [CrossRef]
- Zhao, Y.; Lu, W.; Wang, H. Supercritical Hydrolysis of Cellulose for Oligosaccharide Production in Combined Technology. Chem. Eng. J. 2009, 150, 411–417. [Google Scholar] [CrossRef]
- Wyman, C.; Decker, S.; Himmel, M.; Brady, J.; Skopec, C.; Viikari, L. Hydrolysis of Cellulose and Hemicellulose. Polysaccharides 2004. [Google Scholar] [CrossRef]
- Cardenas-Toro, F.P.; Alcazar-Alay, S.C.; Forster-Carneiro, T.; Meireles, M.A.A. Obtaining Oligo–and Monosaccharides from Agroindustrial and Agricultural Residues Using Hydrothermal Treatments. Food Public Heal. 2014, 4, 123–139. [Google Scholar] [CrossRef]
- Lachos-Perez, D.; Martinez-Jimenez, F.; Rezende, C.A.; Tompsett, G.; Timko, M.; Forster-Carneiro, T. Subcritical Water Hydrolysis of Sugarcane Bagasse: An Approach on Solid Residues Characterization; Elsevier: Amsterdam, The Netherlands, 2016; Volume 108. [Google Scholar] [CrossRef]
- Öztürk Ilker, I.; Irmak, S.; Hesenov, A.; Erbatur, O. Hydrolysis of Kenaf (Hibiscus cannabinus L.) Stems by Catalytical Thermal Treatment in Subcritical Water. Biomass Bioenergy 2010, 34, 1578–1585. [Google Scholar] [CrossRef]
- Huber, G.W.; Iborra, S.; Corma, A. Synthesis of Transportation Fuels from Biomass: Chemistry, Catalysts, and Engineering. Chem. Rev. 2006, 106, 4044–4098. [Google Scholar] [CrossRef]
- Möller, M.; Nilges, P.; Harnisch, F.; Schröder, U. Subcritical Water as Reaction Environment: Fundamentals of Hydrothermal Biomass Transformation. ChemSusChem 2011, 4, 566–579. [Google Scholar] [CrossRef]
- Prado, J.M.; Carneiro, T.F.; Gigo, M.A.; Celestrino, R.C.C.; Follegatti, L.A.; Filho, F.M.; Meireles, M.A.A. Subcritical Water Hydrolysis of Sugarcane Bagasse. In Proceedings of the III Iberoamerican Conference on Supercritical Fluids, Cartagena de Indias, Colombia, 1–5 April 2013; pp. 1–9. [Google Scholar]
- H’ng, P.S.; Wong, L.J.; Chin, K.L.; Tor, E.S.; Tan, S.E.; Tey, B.T.; Maminski, M. Oil Palm (Elaeis guineensis) Trunk as a Resource of Starch and Other Sugars. J. Appl. Sci. 2011, 11, 3053–3057. [Google Scholar] [CrossRef]
- Eom, I.Y. Efficient Ethanol Production from Dried Oil Palm Trunk Treated by Hydrothermolysis and Subsequent Enzymatic Hydrolysis. Biotechnol. Biofuels 2015, 8, 83. [Google Scholar] [CrossRef] [PubMed]
© 2019 by the authors. Licensee MDPI, Basel, Switzerland. This article is an open access article distributed under the terms and conditions of the Creative Commons Attribution (CC BY) license (http://creativecommons.org/licenses/by/4.0/).