Article

Modeling and Simulation of the Absorption of CO2 and NO2 from a Gas Mixture in a Membrane Contactor

Department of Chemical and Petroleum Engineering, UAE University, Al-Ain 15551, United Arab Emirates
Processes 2019, 7(7), 441; https://doi.org/10.3390/pr7070441
Submission received: 9 June 2019 / Revised: 8 July 2019 / Accepted: 8 July 2019 / Published: 11 July 2019
(This article belongs to the Special Issue Gas Capture Processes)

Abstract

:
The removal of undesirable compounds such as CO2 and NO2 from incineration and natural gas is essential because of their harmful influence on the atmosphere and on the reduction of natural gas heating value. The use of membrane contactor for the capture of the post-combustion NO2 and CO2 had been widely considered in the past decades. In this study, membrane contactor was used for the simultaneous absorption of CO2 and NO2 from a mixture of gas (5% CO2, 300 ppm NO2, balance N2) with aqueous sodium hydroxide solution. For the first time, a mathematical model was established for the simultaneous removal of the two undesired gas solutes (CO2, NO2) from flue gas using membrane contactor. The model considers the reaction rate, and radial and axial diffusion of both compounds. The model was verified and validated with experimental data and found to be in good agreement. The model was used to examine the effect of the flow rate of liquid, gas, and inlet solute mole fraction on the percent removal and molar flux of both impurity species. The results revealed that the effect of the liquid flow rate improves the percent removal of both compounds. A high inlet gas flow rate decreases the percent removal. It was possible to obtain the complete removal of both undesired compounds. The model was confirmed to be a dependable tool for the optimization of such process, and for similar systems.

Graphical Abstract

1. Introduction

Harmful gases are emitted into the atmosphere from industrial plants, because of the increase in the human population and the associated economic development, energy consumption, and the requirement of burning fossil fuels for water desalination and power generation purposes. Nitrogen dioxide (NO2) is believed to be one of the gases that contributes to smog and acid rain and which is harmful to human and animal well-being. Accordingly, there is an obligation to capture and eliminate nitrogen dioxide and other harmful gases, such NOx, SO2, and CO2 from industrial emission streams, proceeding to discharge into the atmosphere [1,2,3]. Various methods have been established for capturing the impurity of compounds such as physical and/or chemical absorption, adsorption, membrane technology, conversion to another compound, and condensation. There are various technologies available to remove CO2 and NOx [3,4,5]. Physical absorption incorporates mass transport within the phases and mass transfer at the liquid–gas boundary. Operating conditions and gas solubility are the main factors affecting physical absorption. An example of physical absorption is the capture of CO2 into liquid water using industrial absorption towers or gas–liquid membrane contactors. Chemical absorption is based on a chemical reaction between the absorbed substances and the liquid phase, such as the capture of CO2 in amine solutions [4,6]. The most widely used commercial and economical method is the chemical absorption technique, used in the conventional absorption packed bed towers employed in the absorption of CO2, H2S, and NO2 from chimney gas and natural gas via alkanolamine solutions, where the flue gas and the absorbent liquid are in direct contact. The conventional scrubbing method requires a huge absorption column with excess liquid absorbent and a large cross-sectional area in order to prevent foaming and channeling. The large amount of absorbent liquid utilized in the absorption process (i.e., rich solvent) increases the operating and regeneration cost as more heat is required for the regeneration and pumping of the recycled lean solvent. The main disadvantages of conventional chemical absorption processes are channeling, foaming, corrosion, and a large space area required and hence high operating and capital cost. The idea of using membrane contactor was first proposed for the absorption of carbon dioxide in sodium hydroxide as a liquid absorbent utilizing a non-dispersive microporous membrane where gas and liquid phases are not dispersed in each other [7,8]. A hollow fiber membrane contactor (HFMC) provides a greater surface contact area per unit volume, more than that of a conventional absorption column [9,10,11,12,13]. In most cases of membrane contactor operation, gas flows in the shell side, and liquid absorbent flows in the tube side; vice versa is also possible [14]. The performance of a HFMC declines when the micropores of the membranes are wetted with a liquid solvent [3,11,15,16,17]. The advantages of membrane processes are as follows: Gas and liquid flow rates are independent, high ratio of surface area per volume, easy scale up and down, and no worry about flooding and channeling [18]. The membrane acts as an obstacle between gas and liquid and delivers an exchange surface zone for the two phases, without the dispersion of the gas phase in the liquid phase. In the non-wetted mode, the membrane pores are filled with gas, and by contrast, in the wetted mode, part of the membrane pores are filled with the liquid absorbent. The pollutant gas compounds’ amputation process occurs when the gas filling the membrane micropores diffuses from the gas stream and is absorbed by the liquid absorbent running in the membrane lumen ide [1,16,19]. The removal of the contaminant gas compounds from the gas stream depends on the solubility of the acid gas molecules in the absorbent liquid, and on the concentration incline among the gas stream absorbent solution. The interaction between the selected gas solute and the selective absorbent liquid defines the performance of the pollutant gas removal rate [20]. Membrane fouling and membrane wettability are the main drawbacks of the membrane contactor. The wetted portion of the membrane adds an additional mass transfer resistance. Accordingly, in order to avoid membrane wettability, researchers focused on the use of hydrophobic polymeric membranes, such those made from polypropylene (PP), polytetrafluoroethylene (PTFE), polyvinylidene fluoride (PVDF), and polyethylene (PE) [21,22,23,24]. The Gas Liquid Hollow Fiber Member Contactor (GLMC) processes were used for the removal of CO2 from nitrogen, CO2 from natural gas, and the instantaneous removal of CO2 and SO2 from combustion released gas [17,19,20,25,26,27,28,29,30,31,32,33]. The experimental simultaneous capture of CO2 and NO2 from a pretended flue gas mixture containing CO2/NO2/N2 was first investigated using a commercial PTFE membrane by Ghobadi et al. [23]. The effects of the gas and liquid cross-flow velocity on the percent removal of these gasses were investigated. Various mathematical models were developed for the removal of carbon dioxide, sulfur dioxide, and hydrogen sulfide from simulated flue gas and natural gas streams [7,9,15,17,25,32,34,35,36,37,38,39]. To the extent of the author’s knowledge, so far, there is no mathematical model published to designate the synchronized capture of CO2/NO2 from a mixture of gas consisting of CO2/NO2/N2.
This study focusses on the development of a numerical model for the capture of CO2/NO2 from a gas containing: 5% CO2, 300 ppm NO2, and the balance is N2. The principal model equations were solved using COMSOL Multiphysics (Version 5.4, Comsol Inc., Zürich, Switzerland). The developed model was used to predict the influence of various operating parameters on the percent removal and molar flux of the acid gas components. The model was verified and validated with experimental data from literature [23].

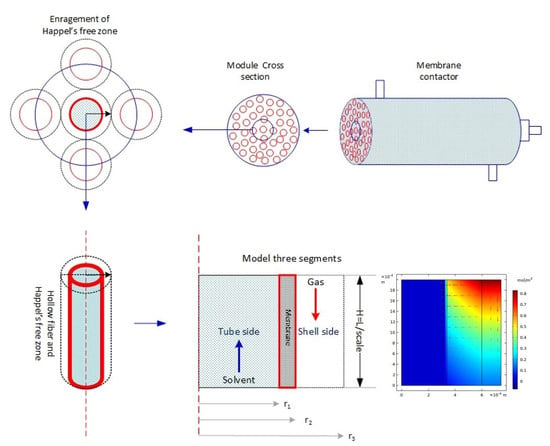
2. Model Development

The gas-liquid membrane process consists of many hollow fibers assembled in a module, where the liquid solvent flows inside the membrane lumen, and the gas flows in the shell sideways, or vice versa, in a co-current or countercurrent parallel flow. The pollutant gas compounds diffuse through the fiber walls towards the absorbent membrane–tube interface, as a result of the concentration gradient. Other gases are retained in the membrane pores because of their low diffusivity and low solubility in the liquid solvent. Figure 1 shows a schematic simplified geometry of the model domains representing the HFM module grounded on Happel’s free surface [40]. The model considers the following three separate domains: the liquid phase in the tube side, the non-wetted membrane, and the gas phase in the shell side. The system is steady state, described by cylindrical coordinates, angular concentration gradients are neglected, and an asymmetrical approach is considered.
The sizes of the membrane used in the simulation are presented in Table 1.
As seen from Table 1, the fiber length is 588 times longer than the fiber radius (effective module length is 200 mm and radius are 0.34 mm). Accordingly, the membrane length is scaled up so as to avoid an excessive number of elements and nodes and for a better appearance of the module in the simulation; therefore, a new scaled length is introduced by dividing the length by 100. The following assumptions were considered:
  • The process is at isothermal and steady state conditions;
  • Gas phase is an ideal gas, and the liquid phase is incompressible and Newtonian;
  • Solubility is based on Henry’s law at the liquid-gas interface.
The blended gas (CO2, NO2, and N2) is transported in the shell side by convection and diffusion, whereas, in the membrane section, the only transport mechanism is diffusion. The liquid phase (NaOH + H2O) is transported in the lumen by diffusion and convection. The following mass transport equations are formulated to describe the chemical absorption system in the model domains (tube, membrane, and shell). The developed mass transport equations are presented as follows.

2.1. Tube Side

The mass balance equations for the gas components of CO2, NO2, and N2 in the tube side can be stated, as per Equation (1), as follows:
D i , t 1 r ( r r ( C i , t r ) ) + D i , t   2 C i , t z 2 = v z , t ( C i , t z ) + R i
The subscripts in the material balance the following equations: t refers to tube side, m refers to membrane, and s refers to shell side, where C i , t refers to the concentration of component i in liquid moving in the tube side, i refers to the pollutant gas components: CO2, NO2, and R i is the rate of reaction of the species i . The length of the fiber is scaled to avoid excessive computation and to make the simulation result in a better profile. The scaling is performed as follows: let ξ = z / s c a l e . The scaling factor is substituted in Equation (1). Consequently, the equation becomes Equation (2), as follows:
D i , t 1 r ( r r ( C i , t r ) ) + D i , t s c a l e 2 2 C i , t ξ 2 = v z , t s c a l e ( C i , t ξ ) + R i
where the velocity of liquid inside the hollow fiber ( v z , t ) is described by the following parabolic equation:
v z , t = 2 Q t n π r 1 2 ( 1 ( r r 1 ) 2 )
where Qt is the volumetric liquid flow rate in the tube side, and n is the number of hollow fibers. The appropriate set of boundary conditions are specified as follows:
at   z = 0 , C i , t = 0 ( a ) at   z = H , 2 C i , t z 2 = 0 ( b ) at   r = 0 , C i , t   r = 0 ( c ) at   r = r 1 , C i , t = m i   C i , m ( d )
where mi is the dimensionless physical solubility of CO2 and NO2 in solvent, 0.82, 0.17, respectively. The values of the dimensionless physical solubility of CO2 and NO2 were calculated from Henry’s constant (H): 0.034 kmol/m3 atm, 0.007 kmol/m3 atm [23], respectively, using the relation mi = RTxH. The liquid phase reactions between NO2 and NaOH took several steps. First, NO2 dissolved in the aqueous NaOH was reacted with H2O, then neutralized with sodium hydroxide [41]. The controlling liquid phase reactions are as follows:
2 NO 2 + H 2 O HNO 2 + HNO 3
HNO 2 + NaOH NaNO 2 + H 2 O
HNO 3 + NaOH NaNO 3 + H 2 O
The overall reaction is designated, as per Equation (8), as follows:
2 NO 2 + 2 NaOH NaNO 2 + NaNO 3 + H 2 O
The general reaction rate is expressed in Equation (9), as follows:
r N O 2 N a O H = k r , 1 [ N O 2 ] [ N a O H ]
The reaction is the second order with a rate constant, k r , 1 ( m 3   mol 1 s 1 ) = 1.0 × 10 5 , [1]
The overall reaction of CO2 and NaOH is represented by the following reaction [42].
CO 2 + 2 NaOH Na 2 CO 3 + H 2 O
The rate of the reaction is determined, as per Equation (11), as follows:
r C O 2 N a O H = k r , 2 [ C O 2 ] [ N a O H ]
The reaction rate constant (in Equation (11)) is k r , 2 = 8.37   ( m 3   mol 1 s 1 ) [23].

2.2. Membrane Side

The transport of the solute gas (CO2 and NO2) components in the membrane section confined between r 1 and r 2 can be described by the steady state material balance equation (Equation (12)), where diffusion is the only transport mechanism in the membrane phase [34], as follows:
D i , m 1 r ( r r ( C i , m r ) ) + D i , m s c a l e 2 2 C i , m ξ 2 = 0
The proper boundary settings are specified, as per Equation (13), as follows:
at   z = 0 , C i , m   z = 0 ( a ) at   z = H , C i , m   z = 0 ( b ) at   r = r 1 , D i , m C i , m   r = D i , t C i , t   r ( c ) at   r = r 2 C i , m = C i , s ( d )

2.3. Shell Side

The steady state mass transport of solute gas (CO2 and NO2) components in the shell side (no chemical reaction occurs in the module shell zone) is expressed in Equation (14), as follows:
D i , s 1 r ( r r ( C i , s r ) ) + D i , s s c a l e 2 2 C i , s ξ 2 = v z , s s c a l e ( C i , s ξ )
The velocity profile in the shell side is described by Happel’s free surface [40] and can be calculated as per Equation (15), as follows:
v z , s = v z , m a x { 1 ( r 2 r 3 ) 2 } { ( r r 3 ) 2 ( r 2 r 3 ) 2 2 l n ( r r 2 )   3 + ( r 2 r 3 ) 4 4 ( r 2 r 3 ) 2 + 4 ln ( r 2 r 3 ) }
The applicable boundary conditions are specified as follows:
at   z = H , C i , s = C i , 0 ( a ) at   z = 0 , 2 C i , s z 2 = 0 ( b ) at   r = r 2 , D i , s   C i , s   r = D i , m   C i , m   r ( c ) at   r = r 3 , C i , s   r = 0 ( d )
The radius of the free surface ( r 3 ) can be determined as per Equation (17), as follows:
r 3 = r 2 ( 1 1 φ ) 0.5
The void fraction of the membrane module ( φ ) is calculated as per Equation (18):
φ = R 2 n   r 2 2 R 2
where R is the module inner radius, n is the number of fibers r1, and r2 is the fiber outside radius. The parameters used in the model are shown in Table 2.

3. Numerical Solution

The model governing the partial differential and algebraic equations was solved simultaneously using COMSOL software version 5.4. The software uses a finite element method to solve the model equations.

4. Results and Discussion

The accuracy of the mathematical model was checked prior to using the model for studying the effect of the various operating parameters on the percent deletion of CO2 and NO2 from the imitated flue gas. The model was authenticated with experimental data for the simultaneous absorption of an NO2 and CO2 from gas mixture in a PTFE polymeric gas–liquid hollow fiber membrane [23]. The percent removal of CO2 and NO2 was calculated as per Equation (19), as follows:
% Removal = F g , i n     C i , i n F g , o u t     C i , o u t F g , i n     C i , i n × 100
where F g , i n , F g , o u t , C i , i n , and C i , o u t are the inlet gas flow rate, outlet gas flow rate, inlet gas concentration of component i , and outlet gas concentration of component i , respectively. The 2D surface plot of the CO2 and NO2 concentration profile throughout the model domains are shown in Figure 2. The figure reveals that, even though the solubility of CO2 (0.75) is higher than NO2 (0.17) in the aqueous NaOH solution, the removal rate of nitrogen dioxide is much higher than that of carbon dioxide, which is attributed to the high reaction rate of NO2-NaOH.
Figure 3. illustrates the association of this model’s predictions relative to the experimental results for the effect cross-flow velocity of the feed gas on the simultaneous percent removal of CO2 and NO2 with fixed other parameters. A comparison of the percent removal of NO2 and the experimental data obtained from the literature was in good agreement; by contrast, there is a slight variance in the case of CO2. The removal flux decreased with the increased inlet gas velocity, attributable to the low residence time.
The predicted results were also authenticated with the experimental investigations for the case of the effects of the variable liquid velocities on the percent removal of NO2 and CO2 (Figure 4) at a fixed gas cross-flow velocity of 2.11 m/s, 0.5 M NaOH, 2% CO2, 300 ppm NO2, and the balance was nitrogen. The simulation results matched the experimental data, to a certain extent [23]. The results revealed that the increase in solvent velocity increased the percent removal of CO2 and NO2 sharply at low liquid velocities (below 0.05 m/s); as the liquid velocity increased further, there was a slight increase in the percent simultaneous removal of CO2 and NO2 from the gas mixture. The insignificant increase in liquid velocity higher than 0.05 m/s was attributed to a decrease in the residence time. The removal flux was calculated as per Equation (20):
J i = ( y i , i n Q i n y i , o u t Q o u t ) × 273.15 × 1000 22.4 × T g × A
where Ji is the removal molar flux of component i (mol/m2·s), yi,in, yi,out are the inlet and outlet molar fraction of component i in the gas phase, Qin, Qout are the inlet and outlet gas volumetric flow rate (m3/s), respectively, in gas molar volume (liter/mol) at standard conditions (1 atm and 0 °C) is 22.4; A is the membrane surface area (m2); 1000 is the conversion factor (liter/m3); Tg is the gas temperature in K. The 273.15 is the temperature at 0 °C (273.15 K).
The influence of the speed of the gas on the molar flux of CO2 and NO2 is illustrated in Figure 5. The figure reveals that there was noticeable increase in the removal flux of CO2 with the gas velocity; by contrast, the removal flux of NO2 was insignificant because of its lower inlet concentration in the gas stream (300 ppm), compared with the CO2 inlet concentration (2%). When the velocity of gas was increased from 1.05 m/s to 2.11 m/s, the removal flux increased from 0.003 to 0.0038 mol/m2·s; at a high gas velocity, the increase was insignificant, from example, with the increase in gas velocity from 4.21 to 6.32 m/s, the increase in molar flux was very small. This was attributed to a decrease in residence time, as well as the insufficient amount of solvent available for the excess amount of CO2 and NO2 components associated with the increase in gas stream volumetric feed rate.
Figure 6 demonstrates the effect of the change in the inlet CO2 mole fraction at a fixed inlet concentration of NO2 (300 ppm) on the component’s molar flux. The CO2 molar flux increased significantly when its concentration increased, which was expected, because as the amount of CO2 increased in the inlet gas stream, more CO2 was being absorbed, and hence the CO2 removal molar flux increased (molar flux: moles gas removed per area per time). By contrast, because of the fixed low concentration of NO2 in the feed stream, its removal flux was insignificant compared to that of CO2.
Figure 7 explains the effect of change in the inlet NO2 mole fraction in the feed gas stream at a fixed concentration of CO2 (2%) on the removal flux of CO2 and NO2. The predicted results are in the range of the experimental data [23] under the same conditions. The effect of change in the inlet mole fraction of NO2 on the CO2 removal flux was insignificant, the CO2 removal flux was kept around 0.004 mol/m2·s and was not influenced by the change of the NO2 inlet mole fraction. By contrast, there was a slight increase in the removal flux of NO2 which caused an increase form 3 × 10⁻⁵ to 15 × 10−5 mol/m2·s. This was attributed to the low inlet concentration of NO2 (in ppm) compared with the CO2 inlet concentration (2%), and consequently, the amount absorbed from CO2 and NO2 did not change significantly.

5. Conclusions

Model equations based on material balance were utilized to describe and study the simultaneous detention of NO2 and CO2 with aqueous NaOH solution in a membrane module. The hollow fiber membranes were fabricated from PTFE polymer. The model equations were solved, and the model predicted results were compared with data from experimental investigation available in literature. The model was found to be in good agreement with the experimental findings. The mathematical model was then employed to study the influence of the inlet flow rate of gas and liquid, concentration of CO2 and NO2 in the feed stream on their percent removal and molar flux. The results revealed that the increase in CO2 inlet mole fraction and gas cross-flow velocity shows a strong impact on the molar flux. By contrast, the change in the NO2 inlet concentration showed insignificant influence on the CO2 removal flux.

Conflicts of Interest

The author declare no conflict of interest.

References

  1. Sun, B.; Sheng, M.; Gao, W.; Zhang, L.; Arowo, M.; Liang, Y.; Shao, L.; Chu, G.W.; Zou, H.; Chen, J.F. Absorption of nitrogen oxides into sodium hydroxide solution in a rotating packed bed with preoxidation by ozone. Energy Fuels 2017, 31, 11019–11025. [Google Scholar] [CrossRef]
  2. Lee, Y.H.; Jung, W.S.; Choi, Y.R.; Oh, J.S.; Jang, S.D.; Son, Y.G.; Cho, M.H.; Namkung, W.; Koh, D.J.; Mok, Y.S.; et al. Application of pulsed corona induced plasma chemical process to an industrial incinerator. Env. Sci. Technol. 2003, 37, 2563–2567. [Google Scholar] [CrossRef]
  3. Golkhar, A.; Keshavarz, P.; Mowla, D. Investigation of CO2 removal by silica and CNT nanofluids in microporous hollow fiber membrane contactors. J. Memb. Sci. 2013, 433, 17–24. [Google Scholar] [CrossRef]
  4. Kohl, A.L.; Nielsen, R.B. Gas. Purification, 5th ed.; Gulf Publishing Company: Houston, TX, USA, 1997. [Google Scholar]
  5. Holstvoogd, R.D.; Van Swaaij, W.P.M. The influence of adsorption capacity on enhanced gas absorption in activated carbon slurries. Chem. Eng. Sci. 1990, 45, 151–162. [Google Scholar] [CrossRef] [Green Version]
  6. Yildirim, Ö.; Kiss, A.A.; Hüser, N.; Leßmann, K.; Kenig, E.Y. Reactive absorption in chemical process industry: A review on current activities. Chem. Eng. J. 2012, 213, 371–391. [Google Scholar] [CrossRef]
  7. Qi, Z.; Cussler, E.L. Microporous hollow fibers for gas absorption: I. Mass transfer in the liquid. J. Memb. Sci. 1985, 23, 321–332. [Google Scholar] [CrossRef]
  8. Qi, Z.; Cussler, E.L. Microporous hollow fibers for gas absorption: II. Mass transfer across the membrane. J. Memb. Sci. 1985, 23, 333–345. [Google Scholar] [CrossRef]
  9. Ghasem, N.; Al-Marzouqi, M. Modeling and experimental study of carbon dioxide absorption in a flat sheet membrane contactor. J. Membr. Sci. Res. 2017, 3, 57–63. [Google Scholar]
  10. Ghasem, N.; Al-Marzouqi, M.; Al-Marzouqi, R.; Dowaidar, A.; Vialatte, M. Removal of CO2 from gas mixture using hollow fiber membrane contactors fabricated from PVDF/Triacetin/Glycerol cast solution. In Proceedings of the European Conference of Chemical Engineering, ECCE’10, European Conference of Civil Engineering, ECCIE’10, European Conference of Mechanical Engineering, ECME’10, European Conference of Control, ECC’10, Tenerife, Spain, 30 November–2 December 2010. [Google Scholar]
  11. Darabi, M.; Rahimi, M.; Molaei Dehkordi, A. Gas absorption enhancement in hollow fiber membrane contactors using nanofluids: Modeling and simulation. Chem. Eng. Process. Process. Intensif. 2017, 119, 7–15. [Google Scholar] [CrossRef]
  12. Kenarsari, S.D.; Yang, D.; Jiang, G.; Zhang, S.; Wang, J.; Russell, A.G.; Wei, Q.; Fan, M. Review of recent advances in carbon dioxide separation and capture. Rsc Adv. 2013, 3, 22739–22773. [Google Scholar] [CrossRef]
  13. Lv, Y.; Yu, X.; Tu, S.T.; Yan, J.; Dahlquist, E. Experimental studies on simultaneous removal of CO2 and SO2 in a polypropylene hollow fiber membrane contactor. Appl. Energy 2012, 97, 283–288. [Google Scholar] [CrossRef]
  14. Gabelman, A.; Hwang, S.-T. Hollow fiber membrane contactors. J. Memb. Sci. 1999, 159, 61–106. [Google Scholar] [CrossRef]
  15. Ansaripour, M.; Haghshenasfard, M.; Moheb, A. Experimental and Numerical Investigation of CO2 Absorption Using Nanofluids in a Hollow-Fiber Membrane Contactor. Chem. Eng. Technol. 2018, 41, 367–378. [Google Scholar] [CrossRef]
  16. Zhang, Z.E.; Yan, Y.F.; Zhang, L.; Ju, S.X. Hollow fiber membrane contactor absorption of CO2 from the flue gas: Review and perspective. Glob. Nest J. 2014, 16, 354–373. [Google Scholar]
  17. Sohrabi, M.R.; Marjani, A.; Moradi, S.; Davallo, M.; Shirazian, S. Mathematical modeling and numerical simulation of CO2 transport through hollow-fiber membranes. Appl. Math. Model. 2011, 35, 174–188. [Google Scholar] [CrossRef]
  18. Mavroudi, M.; Kaldis, S.P.; Sakellaropoulos, G.P. A study of mass transfer resistance in membrane gas-liquid contacting processes. J. Memb. Sci. 2006, 272, 103–115. [Google Scholar] [CrossRef]
  19. Rezakazemi, M.; Darabi, M.; Soroush, E.; Mesbah, M. CO2 absorption enhancement by water-based nanofluids of CNT and SiO2 using hollow-fiber membrane contactor. Sep. Purif. Technol. 2019, 210, 920–926. [Google Scholar] [CrossRef]
  20. Li, J.L.; Chen, B.H. Review of CO2 absorption using chemical solvents in hollow fiber membrane contactors. Sep. Purif. Technol. 2005, 41, 109–122. [Google Scholar] [CrossRef]
  21. Park, H.H.; Deshwal, B.R.; Jo, H.D.; Choi, W.K.; Kim, I.W.; Lee, H.K. Absorption of nitrogen dioxide by PVDF hollow fiber membranes in a G-L contactor. Desalination 2009, 243, 52–64. [Google Scholar] [CrossRef]
  22. Ghasem, N.; Al-Marzouqi, M.; Duidar, A. Effect of PVDF concentration on the morphology and performance of hollow fiber membrane employed as gas-liquid membrane contactor for CO2 absorption. Sep. Purif. Technol. 2012, 98, 174–185. [Google Scholar] [CrossRef]
  23. Ghobadi, J.; Ramirez, D.; Khoramfar, S.; Jerman, R.; Crane, M.; Hobbs, K. Simultaneous absorption of carbon dioxide and nitrogen dioxide from simulated flue gas stream using gas-liquid membrane contacting system. Int. J. Greenh. Gas. Control. 2018, 77, 37–45. [Google Scholar] [CrossRef]
  24. Ghobadi, J.; Ramirez, D.; Jerman, R.; Crane, M.; Khoramfar, S. CO2 separation performance of different diameter polytetrafluoroethylene hollow fiber membranes using gas-liquid membrane contacting system. J. Memb. Sci. 2018, 549, 75–83. [Google Scholar] [CrossRef]
  25. Zhang, Z.; Yan, Y.; Zhang, L.; Ju, S. Numerical simulation and analysis of CO2 removal in a polypropylene hollow fiber membrane contactor. Int. J. Chem. Eng. 2014, 2014. [Google Scholar] [CrossRef]
  26. Rahmatmand, B.; Keshavarz, P.; Ayatollahi, S. Study of Absorption Enhancement of CO2 by SiO2, Al2O3, CNT, and Fe3O4 Nanoparticles in Water and Amine Solutions. J. Chem. Eng. Data 2016, 61, 1378–1387. [Google Scholar] [CrossRef]
  27. Hosseinzadeh, A.; Hosseinzadeh, M.; Vatani, A.; Mohammadi, T. Mathematical modeling for the simultaneous absorption of CO2 and SO2 using MEA in hollow fiber membrane contactors. Chem. Eng. Process. Process. Intensif. 2017, 111, 35–45. [Google Scholar] [CrossRef]
  28. Nii, S.; Takeuchi, H. Removal of CO2 and/or SO2 from gas streams by a membrane absorption method. Gas. Sep. Purif. 1994, 8, 107–114. [Google Scholar] [CrossRef]
  29. Mavroudi, M.; Kaldis, S.P.; Sakellaropoulos, G.P. Reduction of CO2emissions by a membrane contacting process. Fuel 2003, 82, 2153–2159. [Google Scholar] [CrossRef]
  30. Hedayat, M.; Soltanieh, M.; Mousavi, S.A. Simultaneous separation of H2S and CO2 from natural gas by hollow fiber membrane contactor using mixture of alkanolamines. J. Memb. Sci. 2011, 377, 191–197. [Google Scholar] [CrossRef]
  31. Mohammaddoost, H.; Azari, A.; Ansarpour, M.; Osfouri, S. Experimental investigation of CO2 removal from N2 by metal oxide nanofluids in a hollow fiber membrane contactor. Int. J. Greenh. Gas. Control. 2018, 69, 60–71. [Google Scholar] [CrossRef]
  32. Dai, Z.; Usman, M.; Hillestad, M.; Deng, L. Modelling of a tubular membrane contactor for pre-combustion CO2 capture using ionic liquids: Influence of the membrane configuration, absorbent properties and operation parameters. Green Energy Env. 2016, 1, 266–275. [Google Scholar] [CrossRef]
  33. Zhang, Z.; Cai, J.; Chen, F.; Li, H.; Zhang, W.; Qi, W. Progress in enhancement of CO2 absorption by nanofluids: A mini review of mechanisms and current status. Renew. Energy 2018, 118, 527–535. [Google Scholar] [CrossRef]
  34. Hajilary, N.; Rezakazemi, M. CFD modeling of CO2 capture by water-based nanofluids using hollow fiber membrane contactor. Int. J. Greenh. Gas. Control. 2018, 77, 88–95. [Google Scholar] [CrossRef]
  35. Wang, J.; Gao, X.; Ji, G.; Gu, X. CFD simulation of hollow fiber supported NaA zeolite membrane modules. Sep. Purif. Technol. 2019, 213, 1–10. [Google Scholar] [CrossRef]
  36. Khan, M.J.H.; Hussain, M.A.; Mansourpour, Z.; Mostoufi, N.; Ghasem, N.M.; Abdullah, E.C. CFD simulation of fluidized bed reactors for polyolefin production—A review. J. Ind. Eng. Chem. 2014, 20, 3919–3946. [Google Scholar] [CrossRef]
  37. Ghasem, N.; Al-Marzouqi, M.; Abdul Rahim, N. Modeling of CO2 absorption in a membrane contactor considering solvent evaporation. Sep. Purif. Technol. 2013, 110, 1–10. [Google Scholar] [CrossRef]
  38. Rosli, A.; Shoparwe, N.F.F.; Ahmad, A.L.L.; Low, S.C.; Lim, J.K.K. Dynamic modelling and experimental validation of CO2 removal using hydrophobic membrane contactor with different types of absorbent. Sep. Purif. Technol. 2019, 219, 230–240. [Google Scholar] [CrossRef]
  39. Günther, J.; Schmitz, P.; Albasi, C.; Lafforgue, C. A numerical approach to study the impact of packing density on fluid flow distribution in hollow fiber module. J. Memb. Sci. 2010, 348, 277–286. [Google Scholar] [CrossRef] [Green Version]
  40. Happel, J. Viscous flow relative to arrays of cylinders. Aiche J. 1959, 5, 174–177. [Google Scholar] [CrossRef]
  41. Villeneuve, K.; Albarracin Zaidiza, D.; Roizard, D.; Rode, S.; Nagy, E.; Feczkó, T.; Koroknai, B. Enhancement of oxygen mass transfer rate in the presence of nanosized particles. Chem. Eng. Sci. 2007, 62, 7391–7398. [Google Scholar]
  42. Zanfir, M.; Gavriilidis, A.; Wille, C.; Hessel, V. Carbon dioxide absorption in a falling film microstructured reactor: Experiments and modeling. Ind. Eng. Chem. Res. 2005, 44, 1742–1751. [Google Scholar] [CrossRef]
  43. Versteeg, G.F.; van Swaal, W.P.M. Solubility and diffusivity of acid gases (CO2, N2O) in aqueous alkanolamine solutions. J. Chem. Eng. Data 1988, 33, 29–34. [Google Scholar] [CrossRef]
Figure 1. Simplified geometry of membrane module based on Happel’s free surface method.
Processes 07 00441 g001
Figure 2. The 2D surface plot for the concentration profile of CO2 (left) and NO2 (right) at other fixed parameters (velocity of gas: 1.05 m/s; liquid rate: 0.02 m/s; 2% CO2; 300 ppm NO2; the balance is N2, initial concentration of CO2 and NO2, 0.832 mol/m3, 0.0125 mol/m3, respectively).
Processes 07 00441 g002
Figure 3. A comparison of this model’s predictions and experimental data [23] for the influence of the inlet gas velocity on the simultaneous percent removal of CO2 and NO2 (velocity of liquid: 0.05 m/s; solvent concentration: 0.5 M NaOH; inlet gas composition: 2% CO2; 300 ppm NO2; the balance is N2).
Processes 07 00441 g003
Figure 4. Effect of flow rate of absorbent on the percent removal of undesired gas (gas flow rate = 2.11 m/s, solvent concentration: 0.5 M NaOH; inlet gas composition: 2% CO2; 300 ppm NO2; the balance is N2).
Processes 07 00441 g004
Figure 5. Effect of the variable gas velocities on the NO2 and CO2 removal flux along the membrane length with fixed other parameters (concentration of NaOH: 0.5 M; velocity of solvent: 0.05 m/s; gas composition: 2% CO2; 300 ppm NO2; the balance is N2).
Processes 07 00441 g005
Figure 6. Impact of the inlet CO2 feed concentration on the NO2 and CO2 capture flux along the membrane length at other fixed parameters (aqueous NaOH: 0.5 M; velocity of solvent: 0.05 m/s; gas velocity: 2.11 m/s; gas composition: (2% to 10%) CO2; 300 ppm NO2; the balance is N2).
Processes 07 00441 g006
Figure 7. Effect of NO2 mole fraction in the feed gas stream on the removal molar flux of CO2 (left) and NO2 (right) at other fixed parameters (liquid velocity: 0.05 m/s; gas velocity: 2.11 m/s; 0.5 M NaOH; 100 to 500 ppm NO2; 2% CO2; the balance is N2).
Processes 07 00441 g007
Table 1. Membrane module dimensions [23].
Property Value
Inner fiber radius (mm)0.34
Outer fiber radius (mm)0.60
Number of fibers590
Module outer radius (mm)25.4
Module effective length (mm)200
Table 2. Physical properties used in the model.
Physical PropertyValueReference
Diffusivity of CO2 in shell, D CO 2 , s 1.855 × 10⁻⁵ m2/s[9]
Diffusivity of CO2 in tube, D CO 2 , t 1.92 × 10⁻⁹ m2/s[19]
Diffusivity of CO2 in membrane, D CO 2 , m D CO 2 , s × ε/τ[37]
Diffusivity of NO2 in shell, D NO 2 , s 1.54 × 10⁻⁵ m2/s[43]
Diffusivity of NO2 in tube, D NO 2 , t 1.4 × 10⁻⁹ m2/s[43]
Diffusivity of solvent in tube, Ds,t0.5 × D CO 2 , t Estimated
Diffusivity of NO2 in membrane, D NO 2 , m D NO 2 , s × ε/τ[37]
Porosity, ε0.52[23]
Tortuosity, τ(2−ε)2[9]

