Article

The Effect of Various Nanofluids on Absorption Intensification of CO2/SO2 in a Single-Bubble Column

by
Soroush Karamian
1,
Dariush Mowla
2 and
Feridun Esmaeilzadeh
2,*
1
Department of Chemical Engineering, Shiraz University, Shiraz 7134851154, Iran
2
Environmental Research Center in Petroleum and Petrochemical Industries, School of Chemical and Petroleum Engineering, Shiraz University, Shiraz 7134851154, Iran
*
Author to whom correspondence should be addressed.
Processes 2019, 7(7), 393; https://doi.org/10.3390/pr7070393
Submission received: 23 May 2019 / Revised: 20 June 2019 / Accepted: 21 June 2019 / Published: 26 June 2019
(This article belongs to the Special Issue Gas Capture Processes)

Abstract

:
Application of nanoparticles in aqueous base-fluids for intensification of absorption rate is an efficient method for absorption progress within the system incorporating bubble-liquid process. In this research, SO2 and CO2 were separately injected as single raising bubbles containing nanofluids to study the impact of nanoparticle effects on acidic gases absorption. In order to do this, comprehensive experimental studies were done. These works also tried to investigate the effect of different nanofluids such as water/Al2O3 or water/Fe2O3 or water/SiO2 on the absorption rate. The results showed that the absorption of CO2 and SO2 in nanofluids significantly increases up to 77 percent in comparison with base fluid. It was also observed that the type of gas molecules and nanoparticles determine the mechanism of mass transfer enhancement by nanofluids. Additionally, our findings indicated that the values of mass transfer coefficient of SO2 in water/Al2O3, water/Fe2O3 and water/SiO2 nanofluids are, respectively, 50%, 42% and 71% more than those of SO2 in pure water ( k L SO 2 w a t e r = 1.45 × 10 4   m / s ). Moreover, the values for CO2 in above nanofluids were, respectively, 117%, 103% and 88% more than those of CO2 in water alone ( k L CO 2 w a t e r = 1.03 × 10 4   m / s ). Finally, this study tries to offer a new comprehensive correlation for mass transfer coefficient and absorption rate prediction.

1. Introduction

Combustion of fossil fuels led to deforestation and global warming by the emission of acidic gases such as SO2 and CO2 into the environment [1]. Hence, in 1992, the United Nation Conference on Environment and Development offered a new strategy for reducing the emission of acidic and other greenhouse gases to below the standard level until 2000 [1]. Consequently, the governments should finance researchers and scholars to apply new methods and techniques to reduce the amount of CO2 as well as the SO2 produced from large-scale industries and sources [2,3,4,5,6].
In order to remove acidic gases from the natural gas, the scrubbing with the amine solution is the main process in the gas refineries. In addition, various techniques including physical and chemical absorption, membrane technology and adsorption methods are applied for the high CO2/SO2 production industries such as metal forming plants and petrochemical companies [7,8,9]. One of new approaches for enhance the absorption process, is addition of nanomaterials to basefluids for obtaining novel solvent with ability to absorb gases efficiently [2,3,10,11]. This method were elucidated by several researchers due to its high efficiency, and it has received much more attention in recent years [12,13].
Krishnamurthy et al. fulfilled a comprehensive research on the application of nanoparticles for increasing of mass transfer rate within a basefluid environment. They revealed that Brownian motion of nanoparticles, leading to induce the micro-convections in nanofluids, has the most impact on mass transfer rate [14]. Ashrafmansouri et al. comprehensively studied previous research and reported an review to highlight the impacts of nanomaterials in heat and mass transfer processes [11]. They reported that much higher thorough studies are needed to disclose the impacts of main parameters including nanoparticles mean size and morphology on absorption rate by using nanofluids. They also exhibited that nanofluid reusing as well as absorption process modeling are the most important subjects for advancement of this technique. In addition, Kim et al. showed that mass transfer rate of ammonia is enhanced when a few nanoparticles are added to the basefluid. They exhibited that bubbles breaking by nanoparticles considerably enhances mass transfer through increasing interfacial area. They also reported that smaller bubbles were produced in nanofluid than in a base fluid, leading to intensification in mass transfer surface area [15].
Ma et al. declared that by adding CNTs to a basefluid, the localized micro-convection occurs due to the Brownian motion of nanotubes [16]. They reported that induced convection can intensify the ammonia molecular diffusion within the nanofluid. Moreover, they concluded that the grazing effect can be considered another mechanism enhancing the efficiency of NH3 by means of the bubble absorption process [16]. Absorption of gas molecules by means of the nanoparticle surfaces at the bubble interface and then removing the adsorbed gas components from the nanoparticles surface into the fluid is known as grazing effect [17]. Kang et al. also assessed the impact of Carbon nanotubes on gas absorption in a nanofluid [18]. They also revealed that the mass transfer rate of gaseous ammonia in 0.001 wt. % CNTs loaded in nanofluid was 20% higher than that of pure deionized water [18,19].
Numerous researchers have focused on the application of nanofluids as a potential absorbent for the removal of acidic gases [6,11,12,20,21,22,23]. Esmaeili-Faraj et al. exhibited that the removal rate of H2S enhanced up to 40% when 0.02 wt. % of EGO (Exfoliated Graphene Oxide) is added to deionized water as a basefluid. They showed that the main mechanism for enhanced absorption rate is the grazing effect [4].
Jung et al. performed an extensive research in which Al2O3 nanoparticles were scattered in methanol as with nanoparticles volume fractions range of 0.005–0.1 vol. % [24]. They observed that the maximum CO2 removal was 8.3% at 0.01 vol. % nanoparticles compared to the conditions that pure methanol was used as an absorbent. They concluded that the enhanced CO2 uptake is due to the mixing effect of Al2O3 nanoparticles, which were caused by the particle-laden flows induced by Brownian motion [24]. In addition, they observed that for the concentration above a critical value, insignificant Brownian motion can be seen since the inter-particle interactions declines this motion [24].
Darvanjooghi et al. studied the absorption of CO2 by means of Fe3O4/water nanofluid during the applied alternating and constant magnetic fields [3]. Their results declared that both CO2 solubility and mass transfer rate are increased when the strength of magnetic field is high. In addition, they found that the solubility of CO2 and its average molar flux into the nanofluid possess a maximum value by applying an AC magnetic field. Finally, they showed that with the increment of magnetic field strength, the mass diffusivity of carbon dioxide in the nanofluid and renewal surface factor increase, whereas the diffusion layer thickness diminishes.
Although, the impacts of different parameters on gas absorption, by means of nanofluids, are studied in previous works, there are no fully agreement and comprehensive results regarding the influence of nanoparticles types on mass transfer parameters in oxides nanoparticles loaded in nanofluids.
Thus, the aim of this study is to reveal the effect of different metal oxide nanoparticles on SO2 and CO2 mass transfer parameters in a single-bubble absorber. Hence, comprehensive experimental studies are done to investigate the molar flux, absorption rate, mass transfer coefficient and diffusivity coefficient. In addition, a new correlation encompassing nanofluid properties was developed in order to estimate mass transfer coefficients of the mentioned gases in nanofluids.

2. Materials and Methods

2.1. Materials

In this research, SiO2 nanoparticles with the purity of 99.99 wt. %, Al2O3 nanoparticles with the purity of 99.98 wt. % and Fe2O3 nanoparticles with the purity of 99.92 wt. % were purchased from U.S. Nano Company, United State (see Table 1) to prepare water based nanofluids. In order to perform reverse titration for measuring the quantity of CO2 and SO2 dissolved in nanofluids, pure NaOH pellets (99.99 wt. %) and HCl with the purity of 37 vol. % were purchased from Merck Company, Germany. Moreover, phenolphthalein and methyl orange obtained from Merck Company, Germany were used as indicators for determination of the equivalent points. Deionized water was used for the preparation and dilution of nanofluids as well as washing the laboratory glassware. All chemical materials are used as received without further purification.

2.2. Apparatus

2.2.1. Nanofluid Preparation Instruments

In this study, the transmission electron microcopy (TEM) and dynamic light scattering (DLS) were used to estimate the size distribution of dry and dispersed metal oxides nanoparticles in deionized water, respectively. The TEM images of SiO2, Al2O3 and Fe2O3 nanoparticles were obtained by using Hitachi, 9000 NA, Japan to characterize the size of nanoparticles and their agglomeration [25]. For preparing the sample of nanoparticles used in TEM analysis, a suspension of the nanoparticles dispersed in ethanol (0.001 wt. %) was sonicated by using an ultrasonic bath, Parsonic 30S-400W, 28 kHz, for 20 min and then was placed on the graphite surface. The samples were then put in a vacuum oven to remove the ethanol before being introduced into the TEM test device. DLS, Malvern, Zeta Sizer Nano ZS, United Kingdom, was applied to estimate the sizes of nanoparticles and the size distribution of the obtained metal oxides nanoparticles in deionized water [5,25,26]. The stability and surficial electrostatic charges of the metal oxides nanoparticles in deionized water were estimated by using Zeta Potential test (ELSZ-2000, Otsuka Electronics Co., Osaka, Japan). This analysis is a key indicator of the stability of metal oxides nanoparticles within deionized water [12]. Zeta potential accounts for the electrostatic charges on the surface of nanoparticles causing repulsive forces between dispersed particles. The negatively and positively larger magnitude of zeta potential exhibits a significant stability of nanoparticles in the basefluid, whereas a lower magnitude of maximum Zeta-potential declares the tendency of nanoparticles for agglomeration [27]. A Mass Flow Controller (MFC) model Brooks Instrument 1-888-554-flow, USA, was implemented for the injection of CO2 and SO2 gases into the nanofluids through the absorption apparatus. Furthermore, water based nanofluids were prepared by measuring and adding the required weight amounts of metal oxide nanoparticles. To do so, a precise electric balance (TR 120 SNOWREX, Taiwan) was implemented. A pH meter (PCE-PHD 1, PCE-Instruments holding, Southampton, UK) was used for recording the pH of solutions during the titration. Finally, an ultrasonic processor (QSONICA-Q700, NY, USA) was used in order to stop forming the agglomeration of SiO2, Al2O3 and Fe2O3 nanoparticles, after they were under a mechanical ball-mill (YKM-2L, Changsha Yonglekang Equipment Co., Changsha, China) for grinding the clustered nanoparticles. A syringe-pump (Viltechmeda Plus SEP21S, manufactured in Vilnius, Lithuania) was also employed for injection of the titrant to the flask. Lastly, a magnetic stirrer (Model IKA-10038, Staufen, Germany) was used for stirring the solutions.

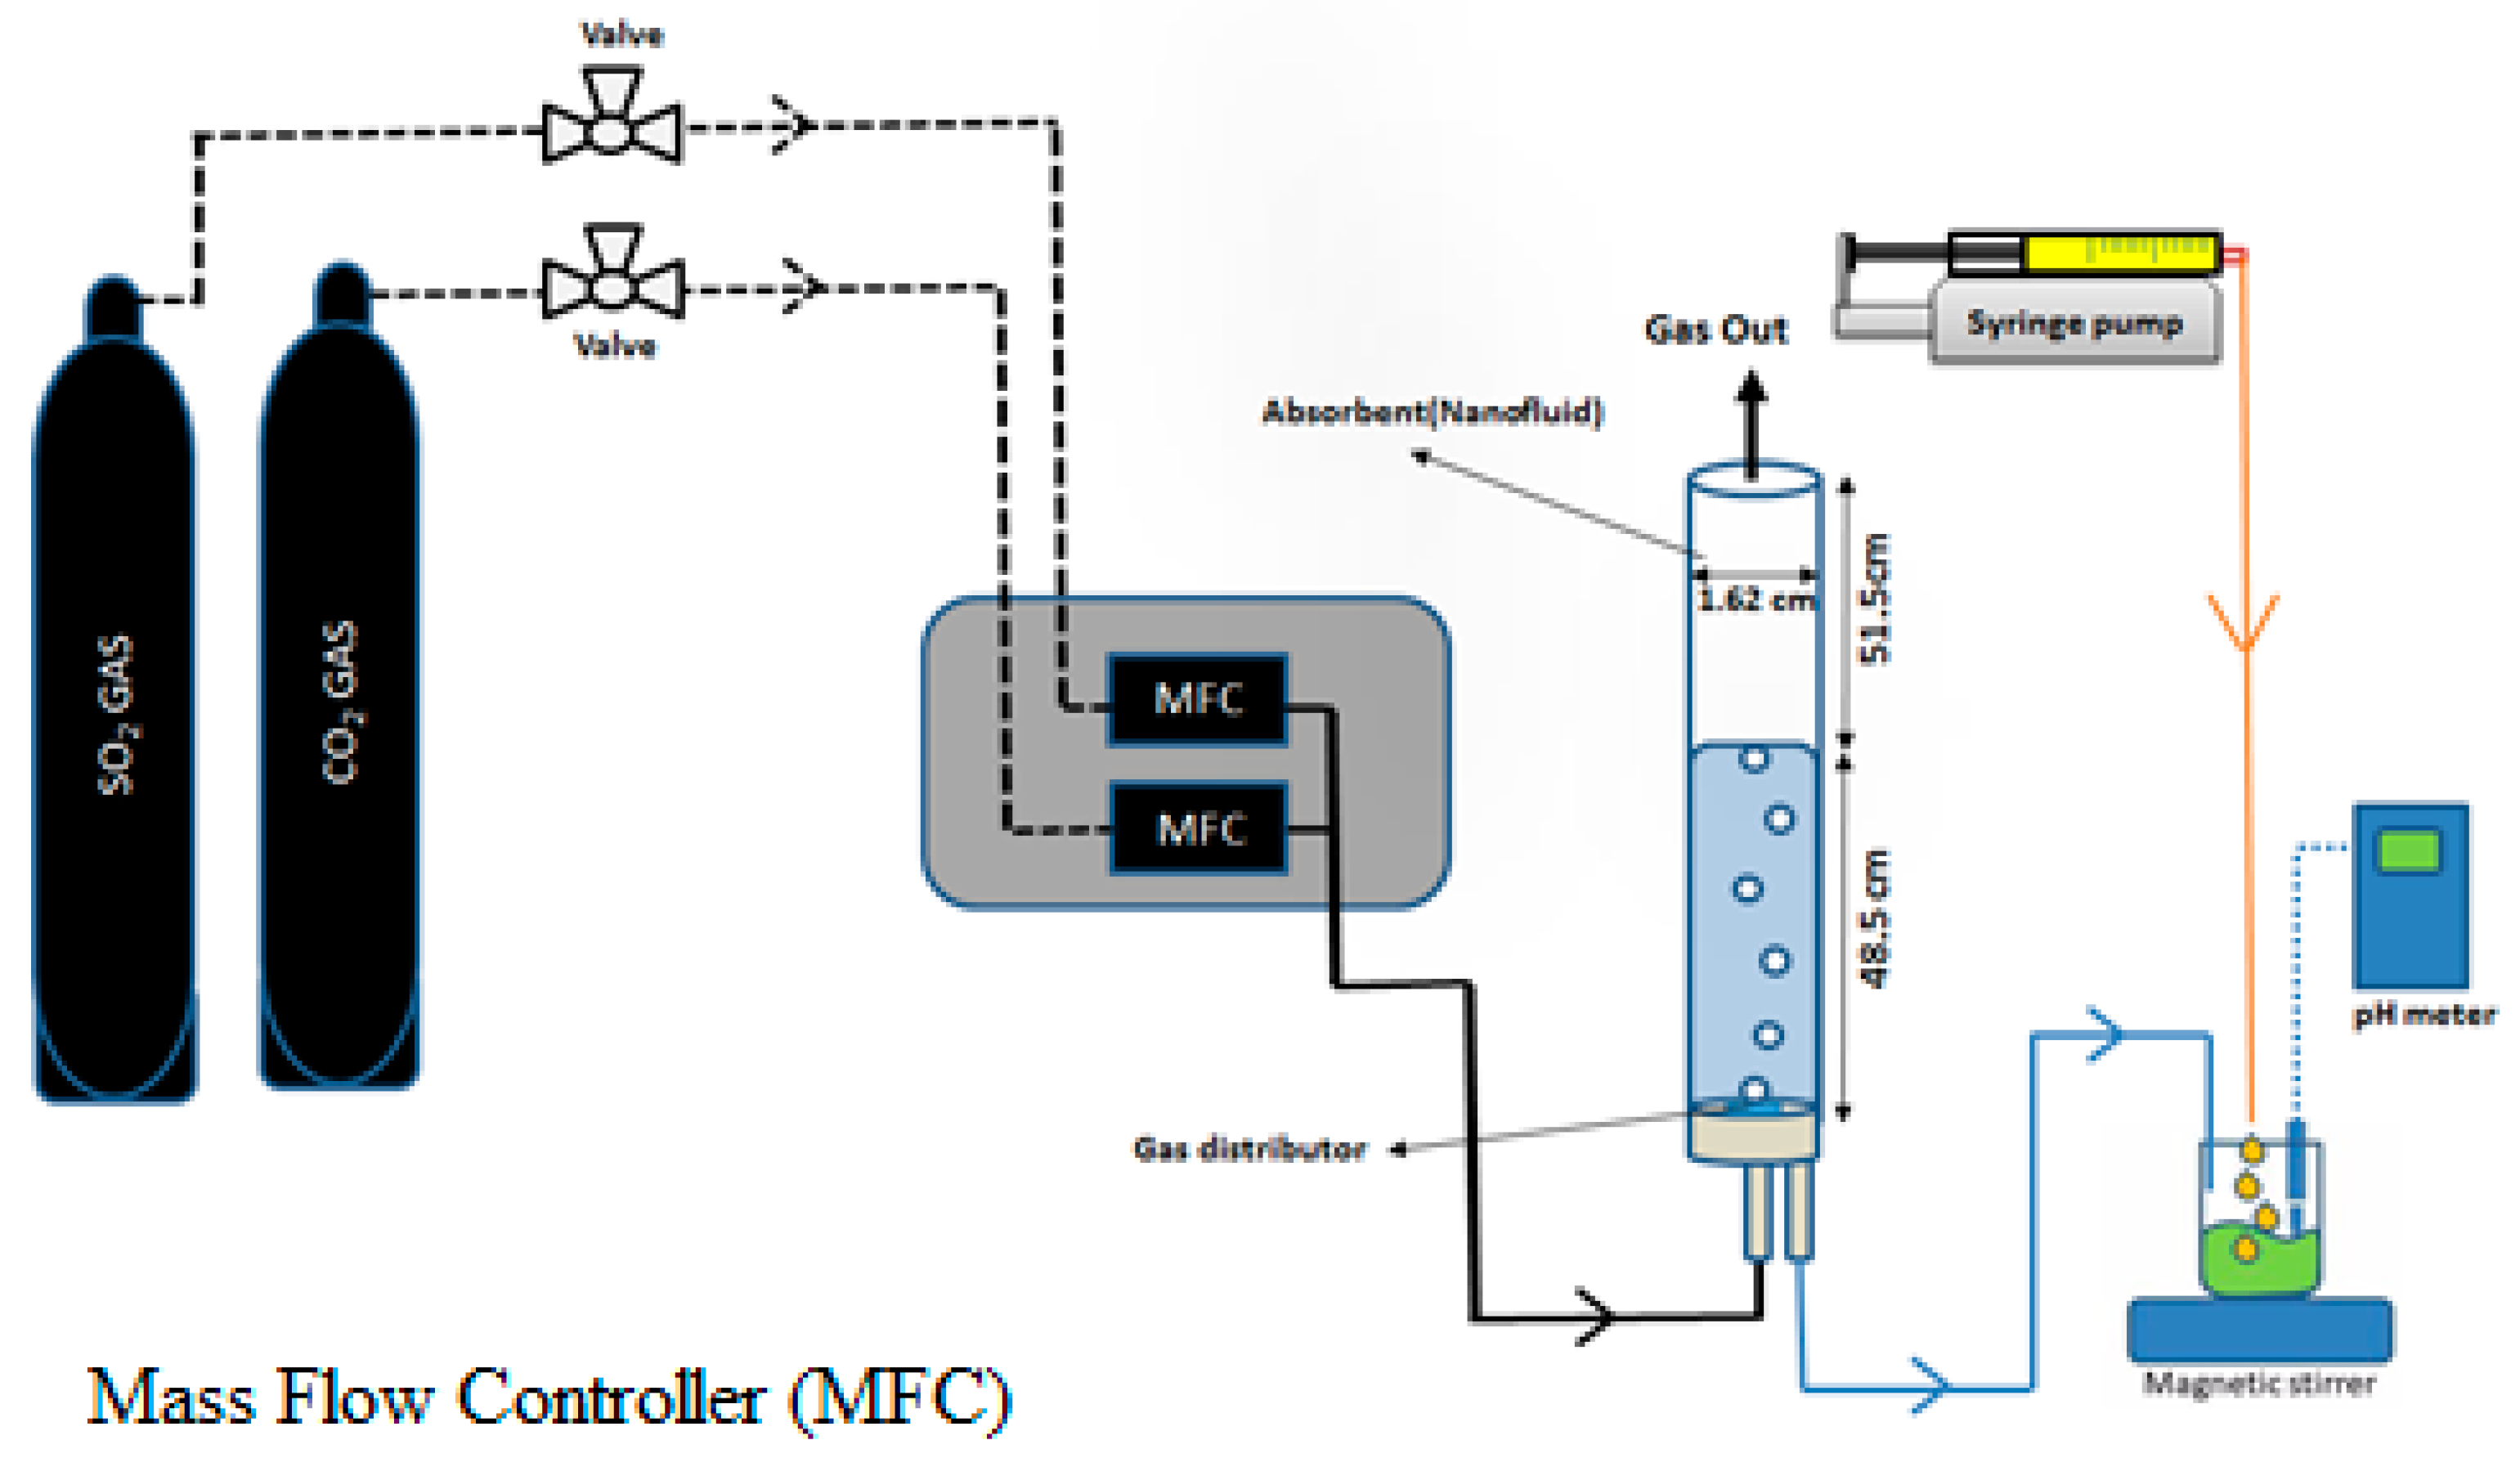
2.2.2. Experimental Set-Up

The experimental set-up contained a bubble column absorber filled with metal oxide nanoparticles loaded in nanofluids. A certain volume of CO2 and SO2 was injected into the nanofluid within the absorption column. Figure 1 exhibits the schematic diagram of a bubble column absorber that consists of a 1 m high and 16.2 mm diameter poly-methyl-meta-acrylate (PMMA) tube used as a semi-batch instrument to examine the absorption of acidic gases by means of nanofluids. In addition, in order to control the rate of gas absorption in nanofluids, a syringe-pump was used for the injection of the aforementioned gases through the absorber column. The gases were continuously injected into nanofluids in the absorber column with the constant flow rate of 500 mL/h in each experiment. The average bubbles diameter ranged from 6.9 to 7 mm, and the time for the rising of bubbles was found to be 2.3 s. Finally, in order to measure the concentration of gases in nanofluids in the reverse titration method, the injection of HCl solution into the discharged nanofluid was performed by means of the syringe-pump.

2.3. Methods

2.3.1. Nanofluid Preparation Procedure

At first, the nanoparticles were introduced to a ball-mill device for about 4 h to separate the agglomeration of nanoparticles. Then, water based nanofluids were prepared with the dispersing of 50 g SiO2, Al2O3 and Fe2O3 nanoparticles in 1000 mL deionized water, separately, to produce the main suspension with the nanoparticles concentration of 5.0 wt. %, (equal to 50,000 mg/L). After adding the nanoparticles to deionized water, the suspensions were kept under stirring condition of 800 rpm for 5 h. Finally, the nanoparticles were dispersed in the basefluid by using the sonication process under three sequences of 20 min. The amplitude and cycle time of sonication were set on 70% and 0.5 s, respectively. Also for the preparation of other suspensions with different nanoparticle concentrations of 0.005, 0.01, 0.1, 1.0, and 5.0 wt. %, the stock solutions were diluted with further deionized water.

2.3.2. Experimental Procedure

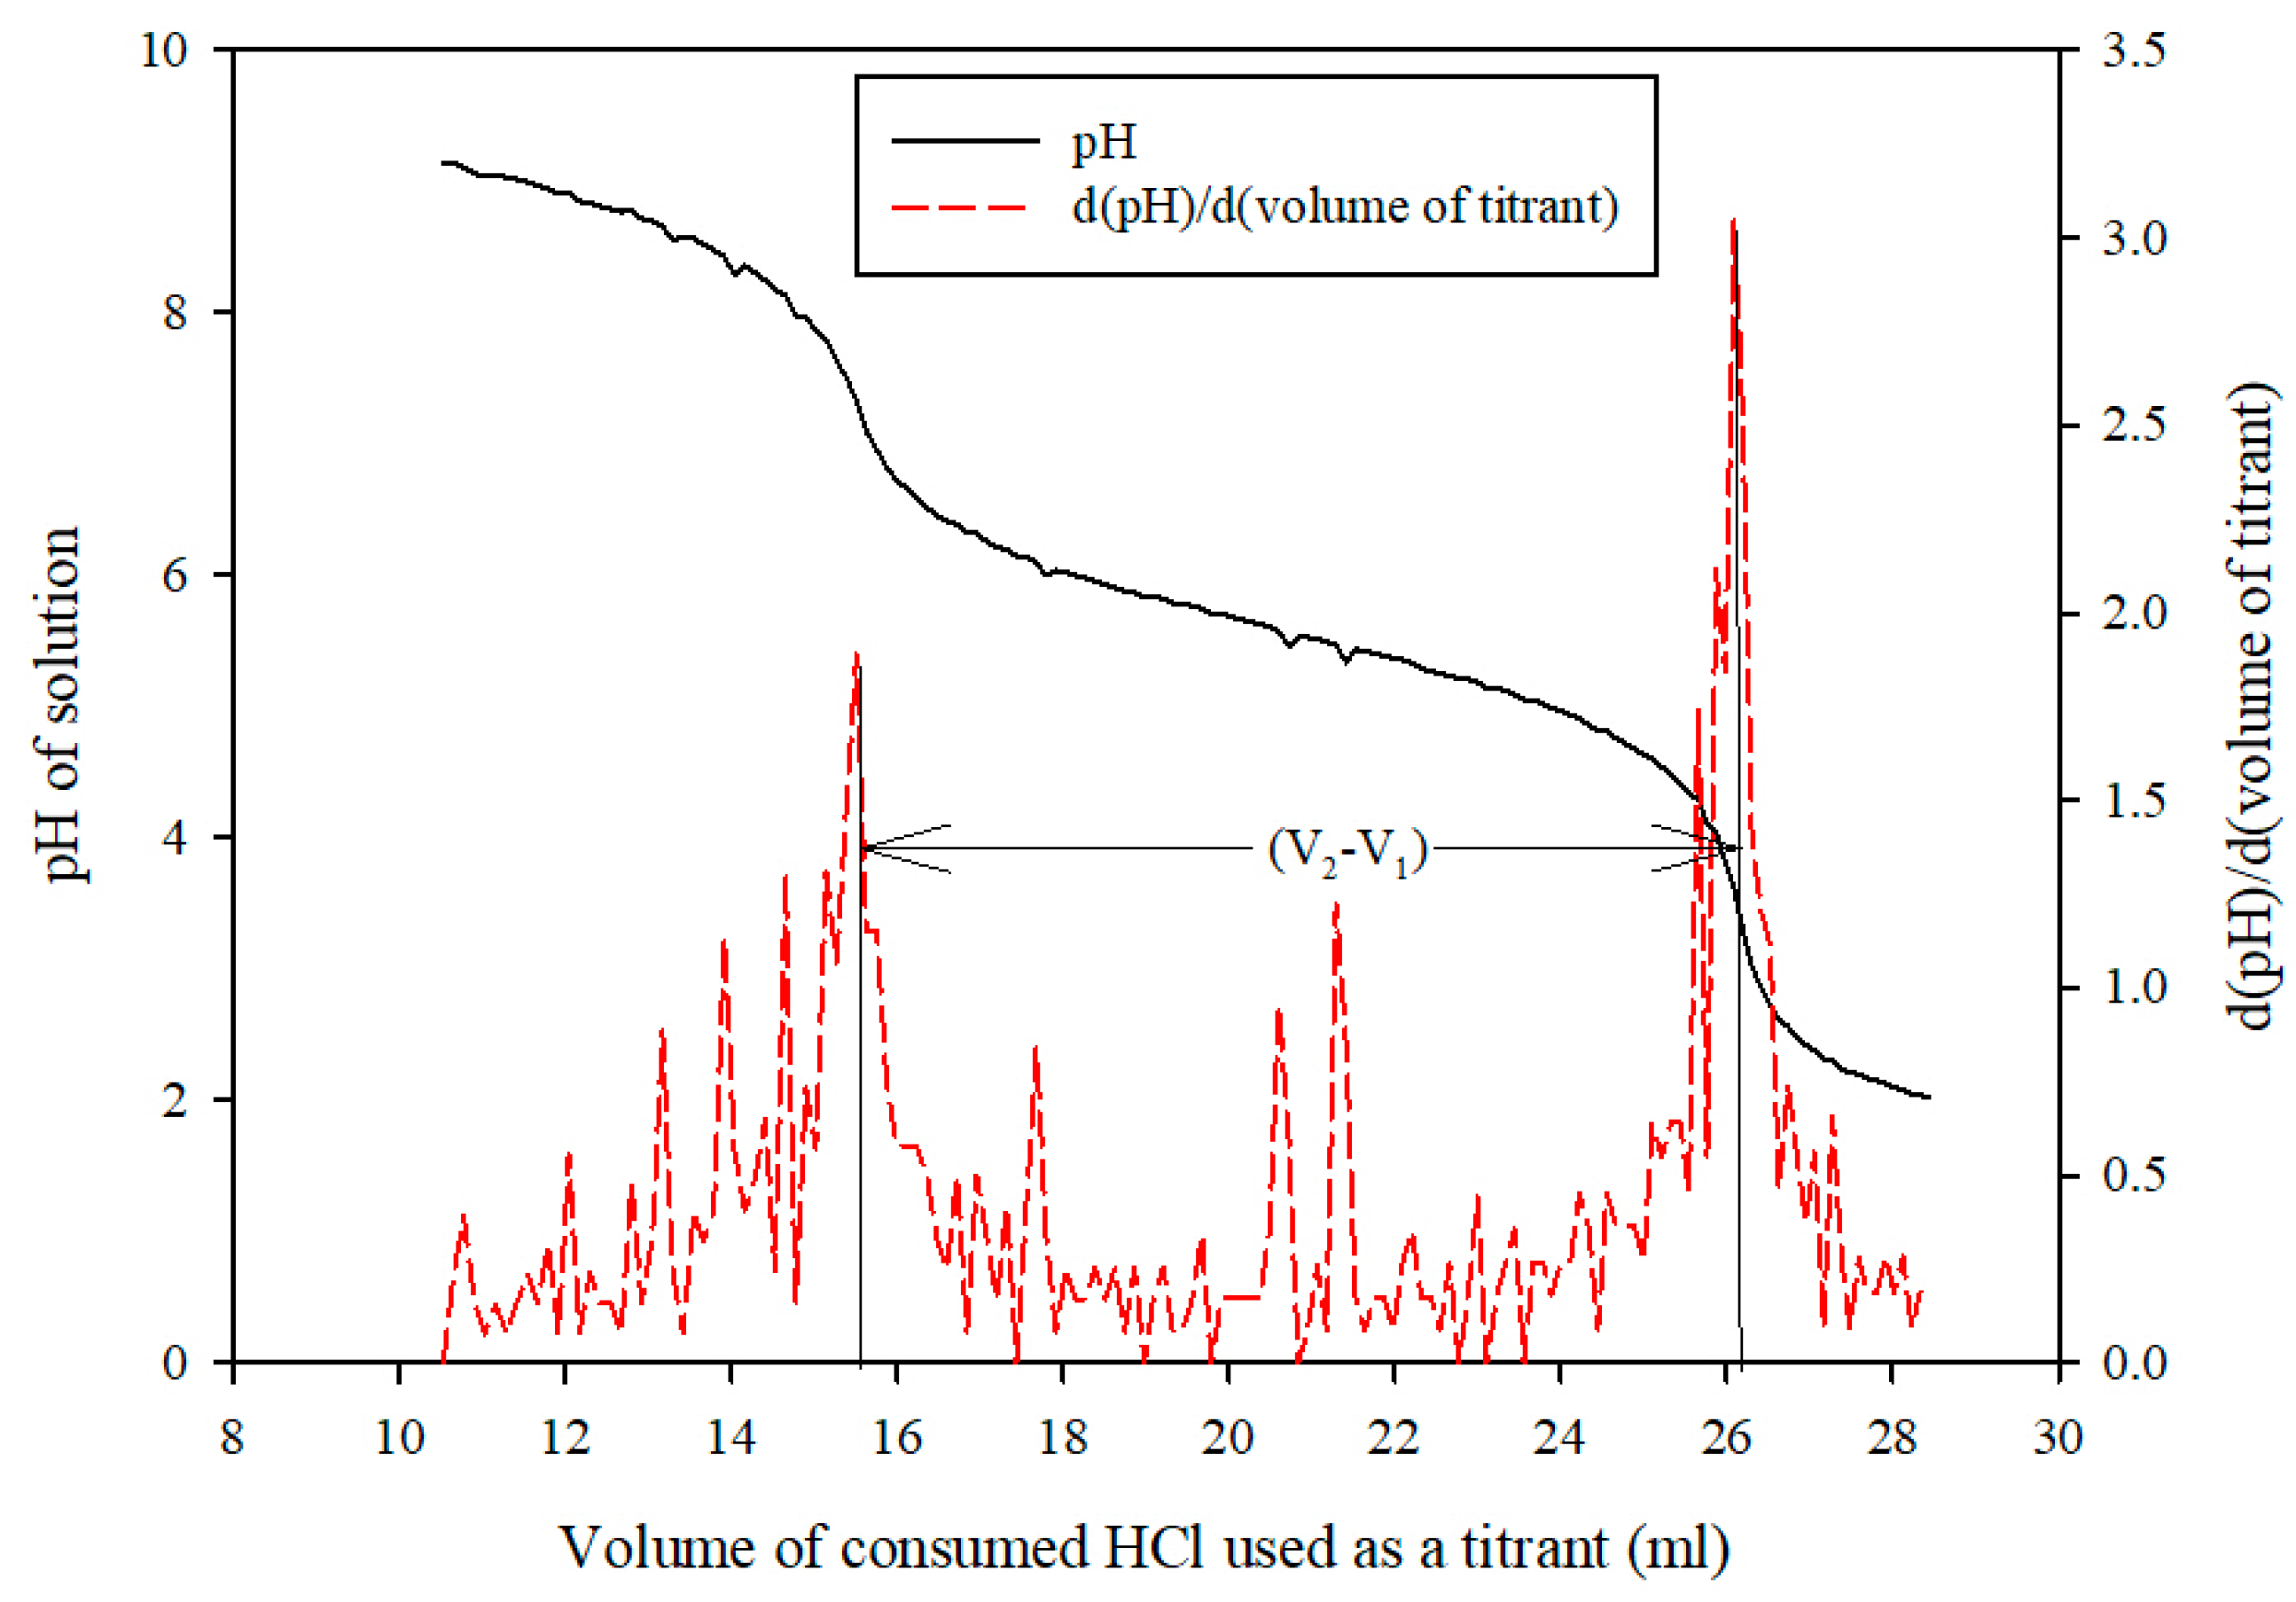
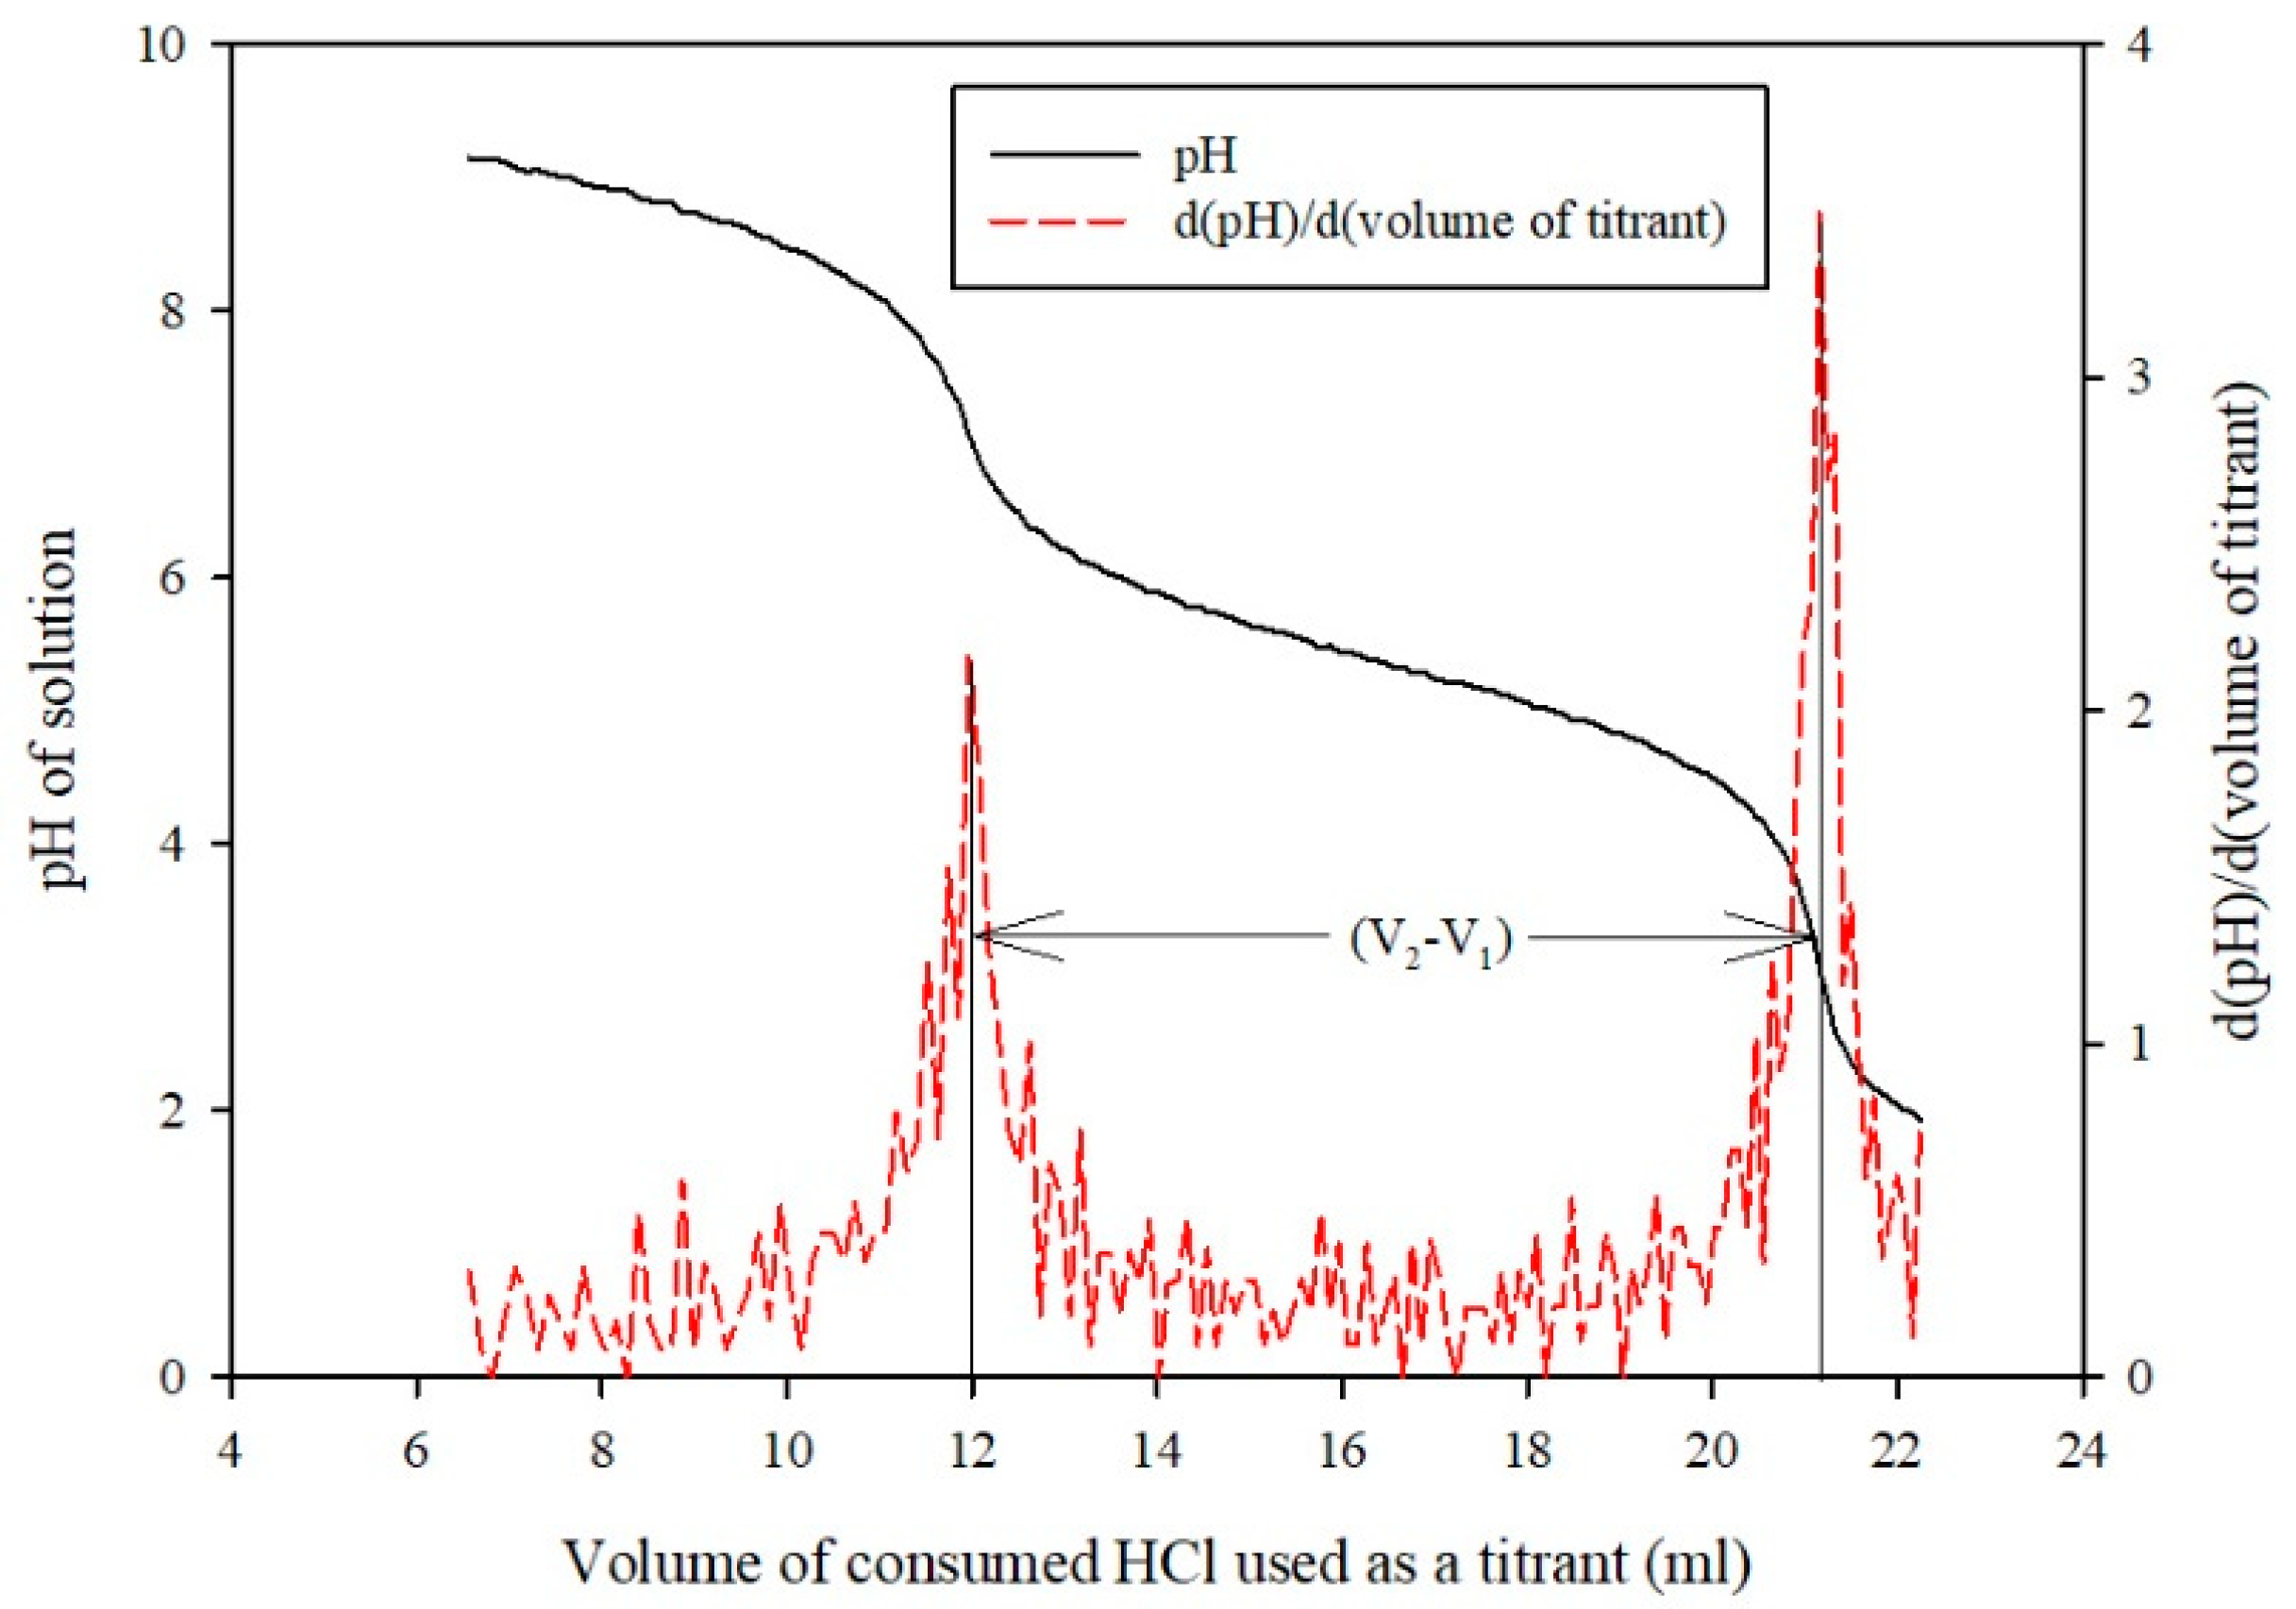
Sample Analysis Procedure

The analysis for measuring the amounts of absorbed CO2 and SO2 in the nanofluids was carried out by using the reverse titration wherein the standard HCl and NaOH solutions were used as the titrant and reactant for producing Na 2 CO 3 and Na 2 SO 3 , respectively [28]. Consequently, in order to determine CO2 and SO2 content by using the reverse titration, it is needed to convert H 2 SO 3 and H 2 CO 3 to Na 2 SO 3 and Na 2 CO 3 , respectively, by the addition of a strong standard base. To do so, the nanofluids were discharged to the flask containing 15 mL of 0.1 M NaOH solution. The carbon dioxide and sulfur dioxide in the solution reacted with the sodium hydroxide and formed sodium bicarbonate or bisulfate as Equation (1) [5]:
RO 2 + 2 NaOH Na 2 RO 3 + H 2 O ,   R = C ( Carbon )       o r         S ( Sulfur )
The titration was then accomplished to neutralize the amount of remained NaOH, and then excess HCl (as a titrant) in the flask reacted with Na 2 SO 3 and Na 2 CO 3 during the titration according to the following reactions:
Na 2 RO 3 + HCl NaCl + NaHRO 3 ,   R = C ( Carbon )       o r         S ( Sulfur )
NaHRO 3 + HCl NaCl + H 2 O + RO 2 ,   R = C ( Carbon )       o r         S ( Sulfur )
According to Equation (2), the discharged samples were titrated with the standard acid solution, (0.1 M HCl), at first equivalent point. The titration with HCl then converted all the remained bicarbonate and bisulfate to SO 2 and CO 2 according to Equation (3). In this method, the difference of consumed HCl between two equivalent points represents the amount of CO2 or SO2 absorbed in the solution. Equation (4) was used for determining the value of absorbed gases by means of nanofluids [2,3,28]:
C RO 2   = ( V 2 V 1 ) × M V × 10 3
where C RO 2   is the absorbed CO2 or SO2 concentration in the nanofluids or deionized water (mol/m3), M is HCl molarity (mol/lit), and V is the volume of absorbent used in the column, (equal to 100 mL), in all experiments. V1 and V2 are the volumes (mL) of standard acid solution consumed for neutralizing bicarbonate and bisulfate to SO 2 and CO 2 at two equivalent points, respectively (Figure 2 and Figure 3).
In this work, the molar flux of absorbed CO2 and SO2 was calculated by means of the CO2 and SO2 concentration in the nanofluid according to the following equation (Equation (5)) [2,3,28]:
N ave ,   RO 2 = C RO 2   × V ( 4 π r 0 2 n ) × ( τ ) × 10 6
Here, N ave , RO 2 is the average molar flux transferred from gas, (pure CO2 or SO2), to liquid phase (mol/m2 s), τ is the total gas-liquid contact time of bubbles passing through the nanofluids (s), which is equal to multiply of the bubbles number by raising time of one single bubble (2.3 S), n is the number of bubbles passes through nanofluids within the absorber column and r 0 is the average bubbles radius (3.5 mm) that assumed to be constant at all experiments.

Measurement of Mass Transfer Parameters

In order to obtain the mass transfer coefficient and diffusivity of CO2 or SO2 in a water based nanofluid, a set of experiments were performed in which the aforementioned gases were separately injected at the bottom of the column within the volumes of 20, 25, 30, 35, 40, 45 and 50 mL. The mass transfer parameters were then calculated by obtaining the absorption of CO2 and SO2 as well as the implementation of the model suggested by Zhao et al. [29].

Uncertainty Analysis

In this research, the uncertainty of the experimentations was calculated by the errors of measurements for parameters, incorporating time of raising bubbles, volume of liquid for the titration method and pH of solutions. The time of raising bubbles was measured by using a digital chronometer with the maximum accuracy of ±0.01 s, the pH of discharged nanofluids was measured during the titration by a pH meter with the maximum accuracy of ±0.1, and the volumes of liquids were measured by laboratories glassware with the maximum accuracy of ±0.1. According to the literature [2,3], the relative uncertainty of final experimental results was calculated as follows [30,31]:
U   =   ± ( Δ V V ) 2 + ( Δ t t ) 2 + ( Δ pH PH ) 2
Consequently, by substituting the values in Equation (6) the relative uncertainty of the experimental results was found to be less than 5.2 %.

3. Results and Discussion

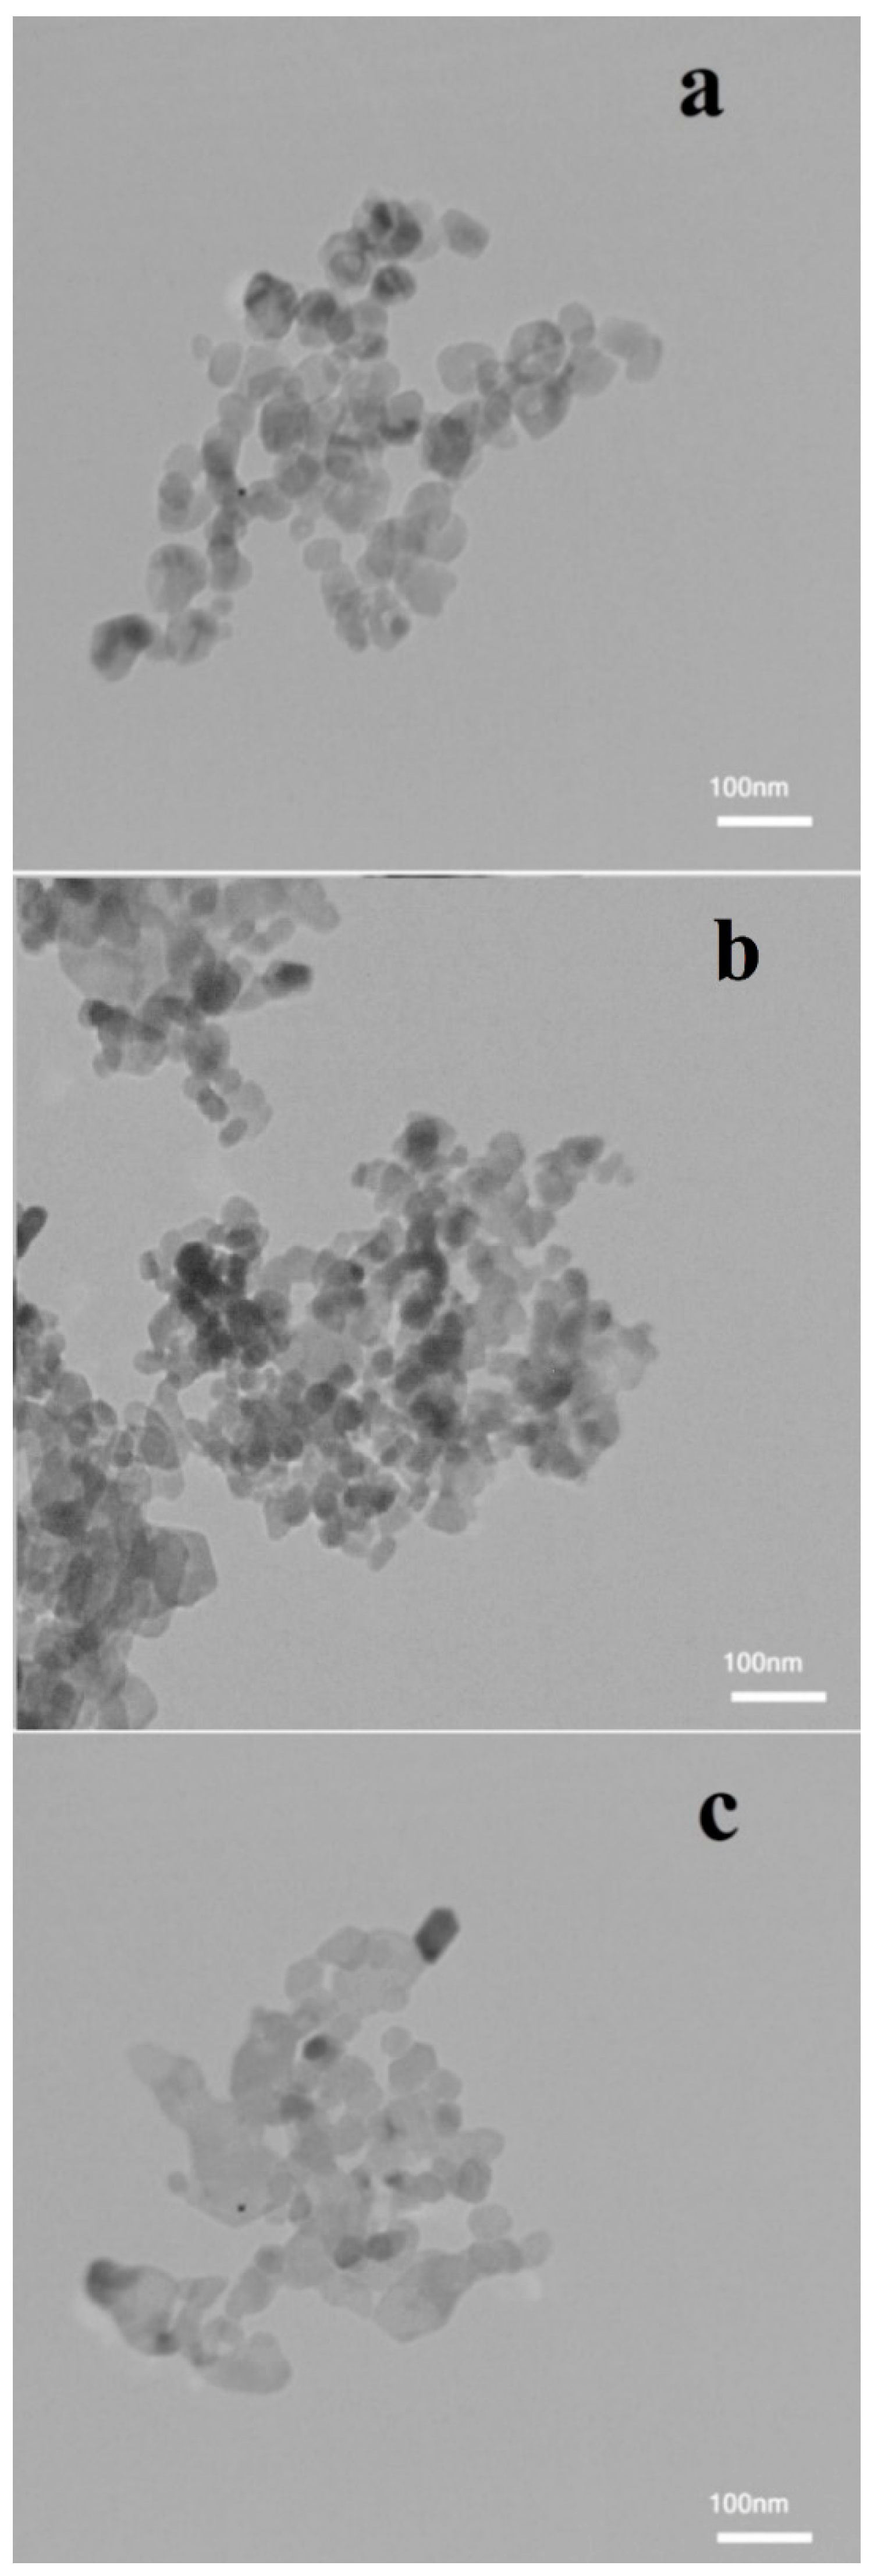
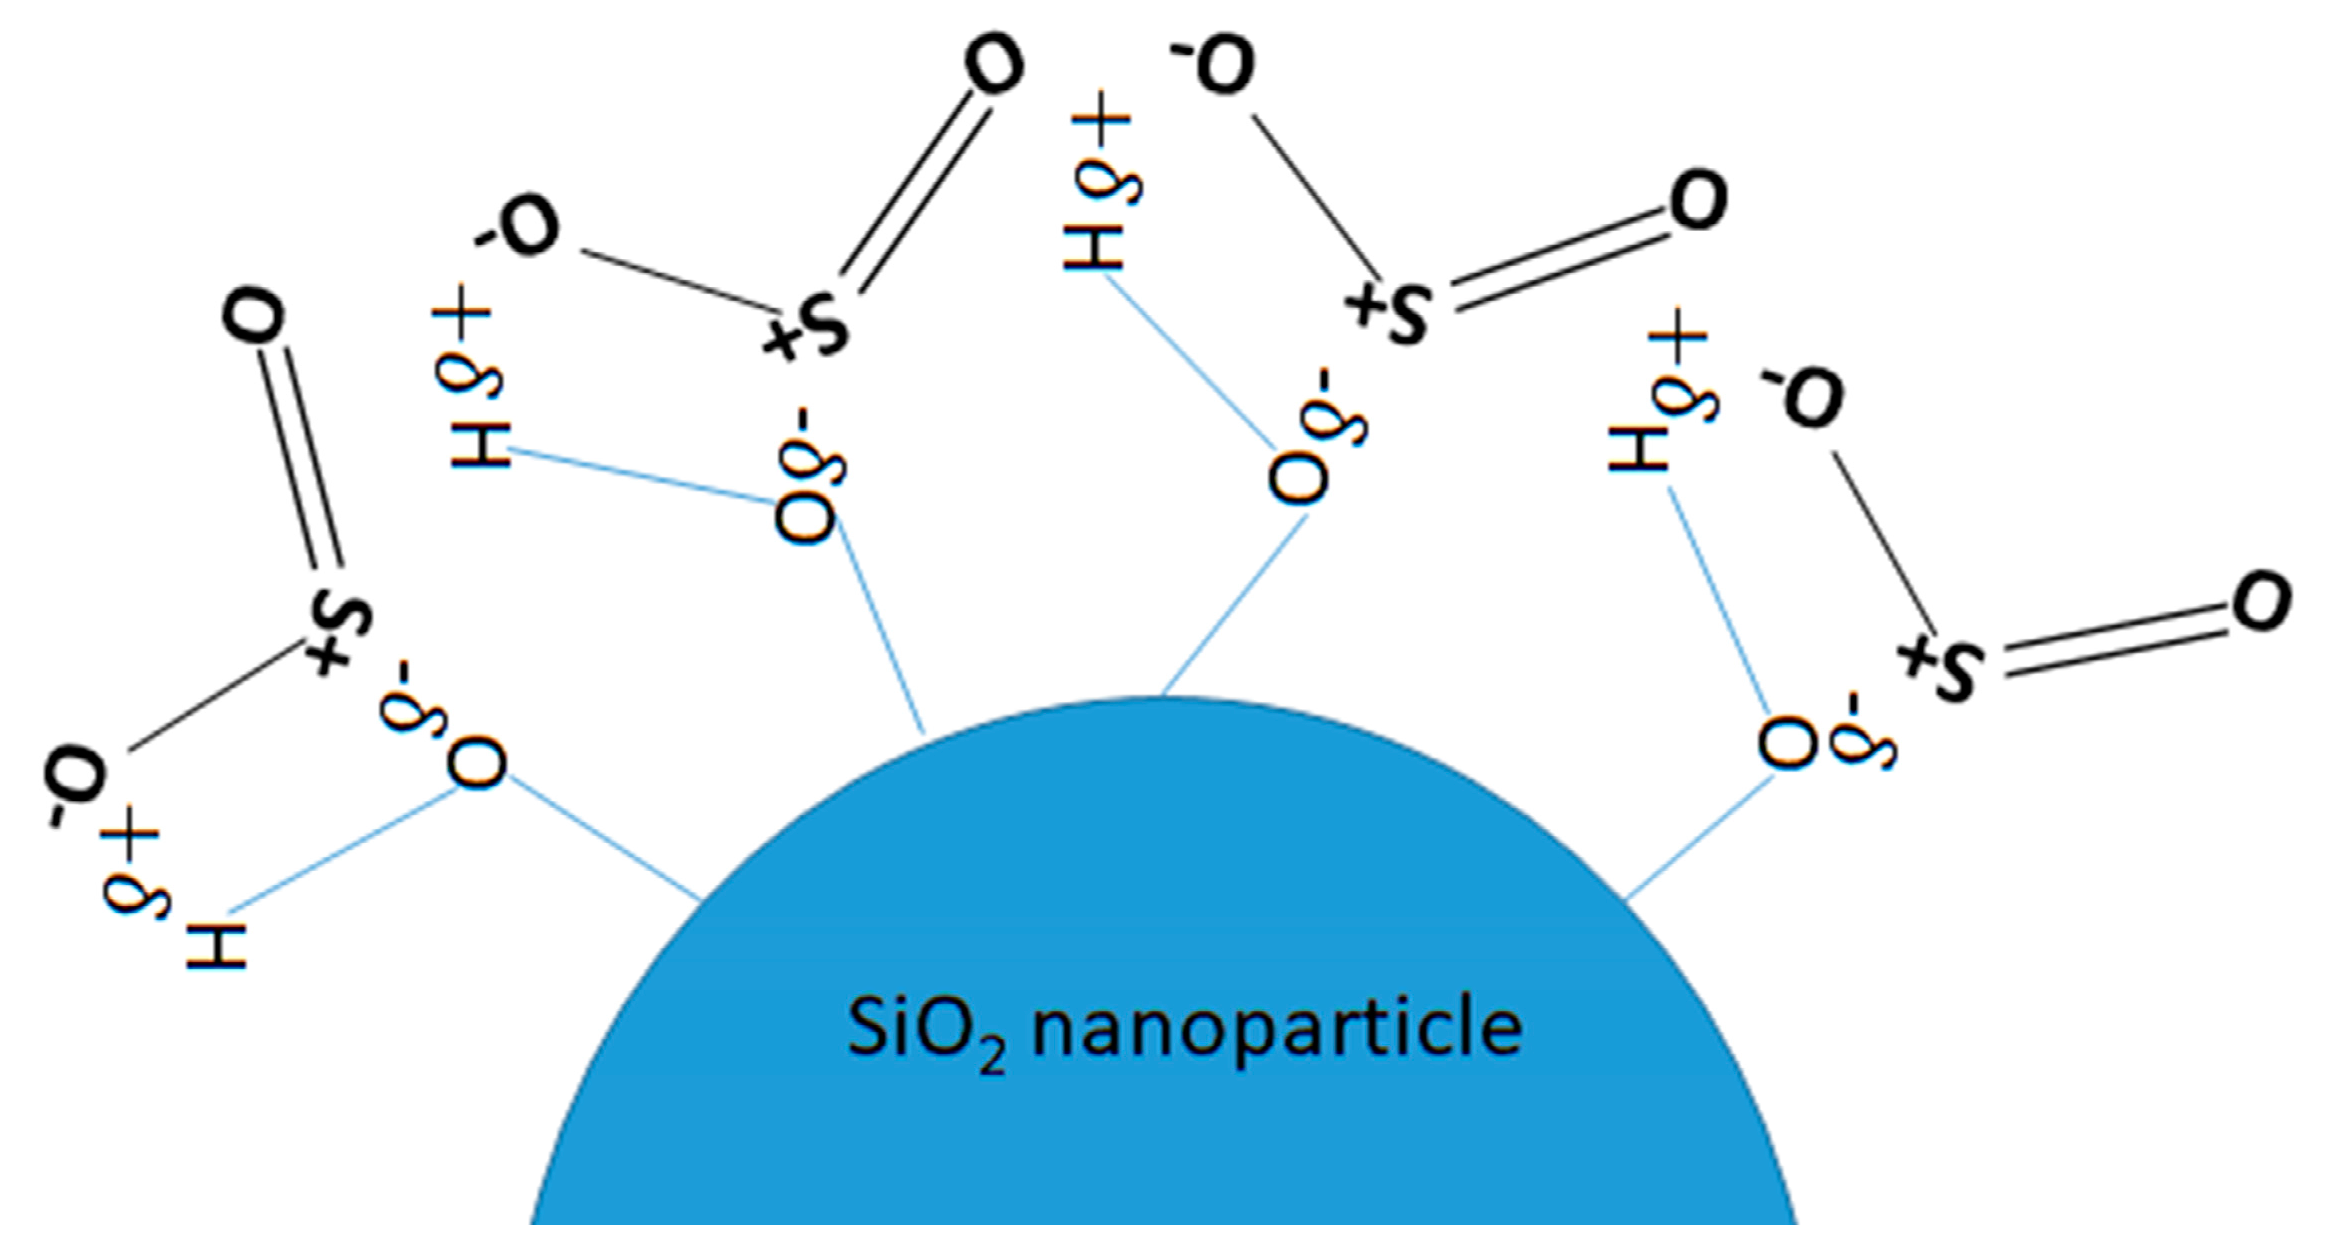
3.1. Nanofluid Characterization

Figure 4 exhibits the TEM images of SiO2, Al2O3 and Fe2O3 nanoparticles that used for the preparation of water based nanofluids. These images show that the diameter of SiO2 nanoparticles ranged from 20 to 60 nm (Figure 4a), the diameter of Al2O3 nanoparticles ranged from 30 to 80 nm (Figure 4b) and the diameter of Fe2O3 nanoparticles ranged from 20 to 60 nm (Figure 4c). In addition, the results presented in Figure 4 exhibit that all metal oxides nanoparticles have a semi-spherical morphology that no considerable agglomeration was observed [32].
The results of DLS analysis for SiO2, Al2O3 and Fe2O3 nanoparticles dispersed in deionized water exhibited that the mean diameter of nanoparticles for SiO2 is 48.3 nm with Poly Dispersity Index, (P.D.I.), of 0.105 and the mean diameter of nanoparticles for Al2O3 and Fe2O3 is found to be 54.7 nm and 55.1 nm, respectively, with P.D.I.s of 0.145 and 0.138, respectively. These results confirm that the dispersion technique, which was used in this research, led to the well-dispersed nanoparticles diameter, with a narrow range of 48.3 to 55.1 nm. The results of this test indicate that the average size of nanoparticles is equal to that estimated by using TEM test declaring no significant agglomeration during the dispersion of nanoparticles in the basefluid.
Zeta-potential analysis can be implemented in order to quantify the stability of nanoparticles in the basefluid [33]. These results represent that nanofluids have high stability due to the fact that their zeta potential is lower than −45 mV [34]. In other words, the magnitude of the zeta potential determines the degree of electrostatic repulsion between similarly charged particles in colloidal dispersions. The large magnitude of the zeta potential for SiO2/water, Al2O3/water and Fe2O3/water nanofluids (−97.8 mV for Al2O3/water, 100.2 mV for SiO2/water and 79.5 mV for Fe2O3/water nanofluids) indicated high stability of nanoparticles representing high repulsive electrostatic forces [35].

3.2. Absorption

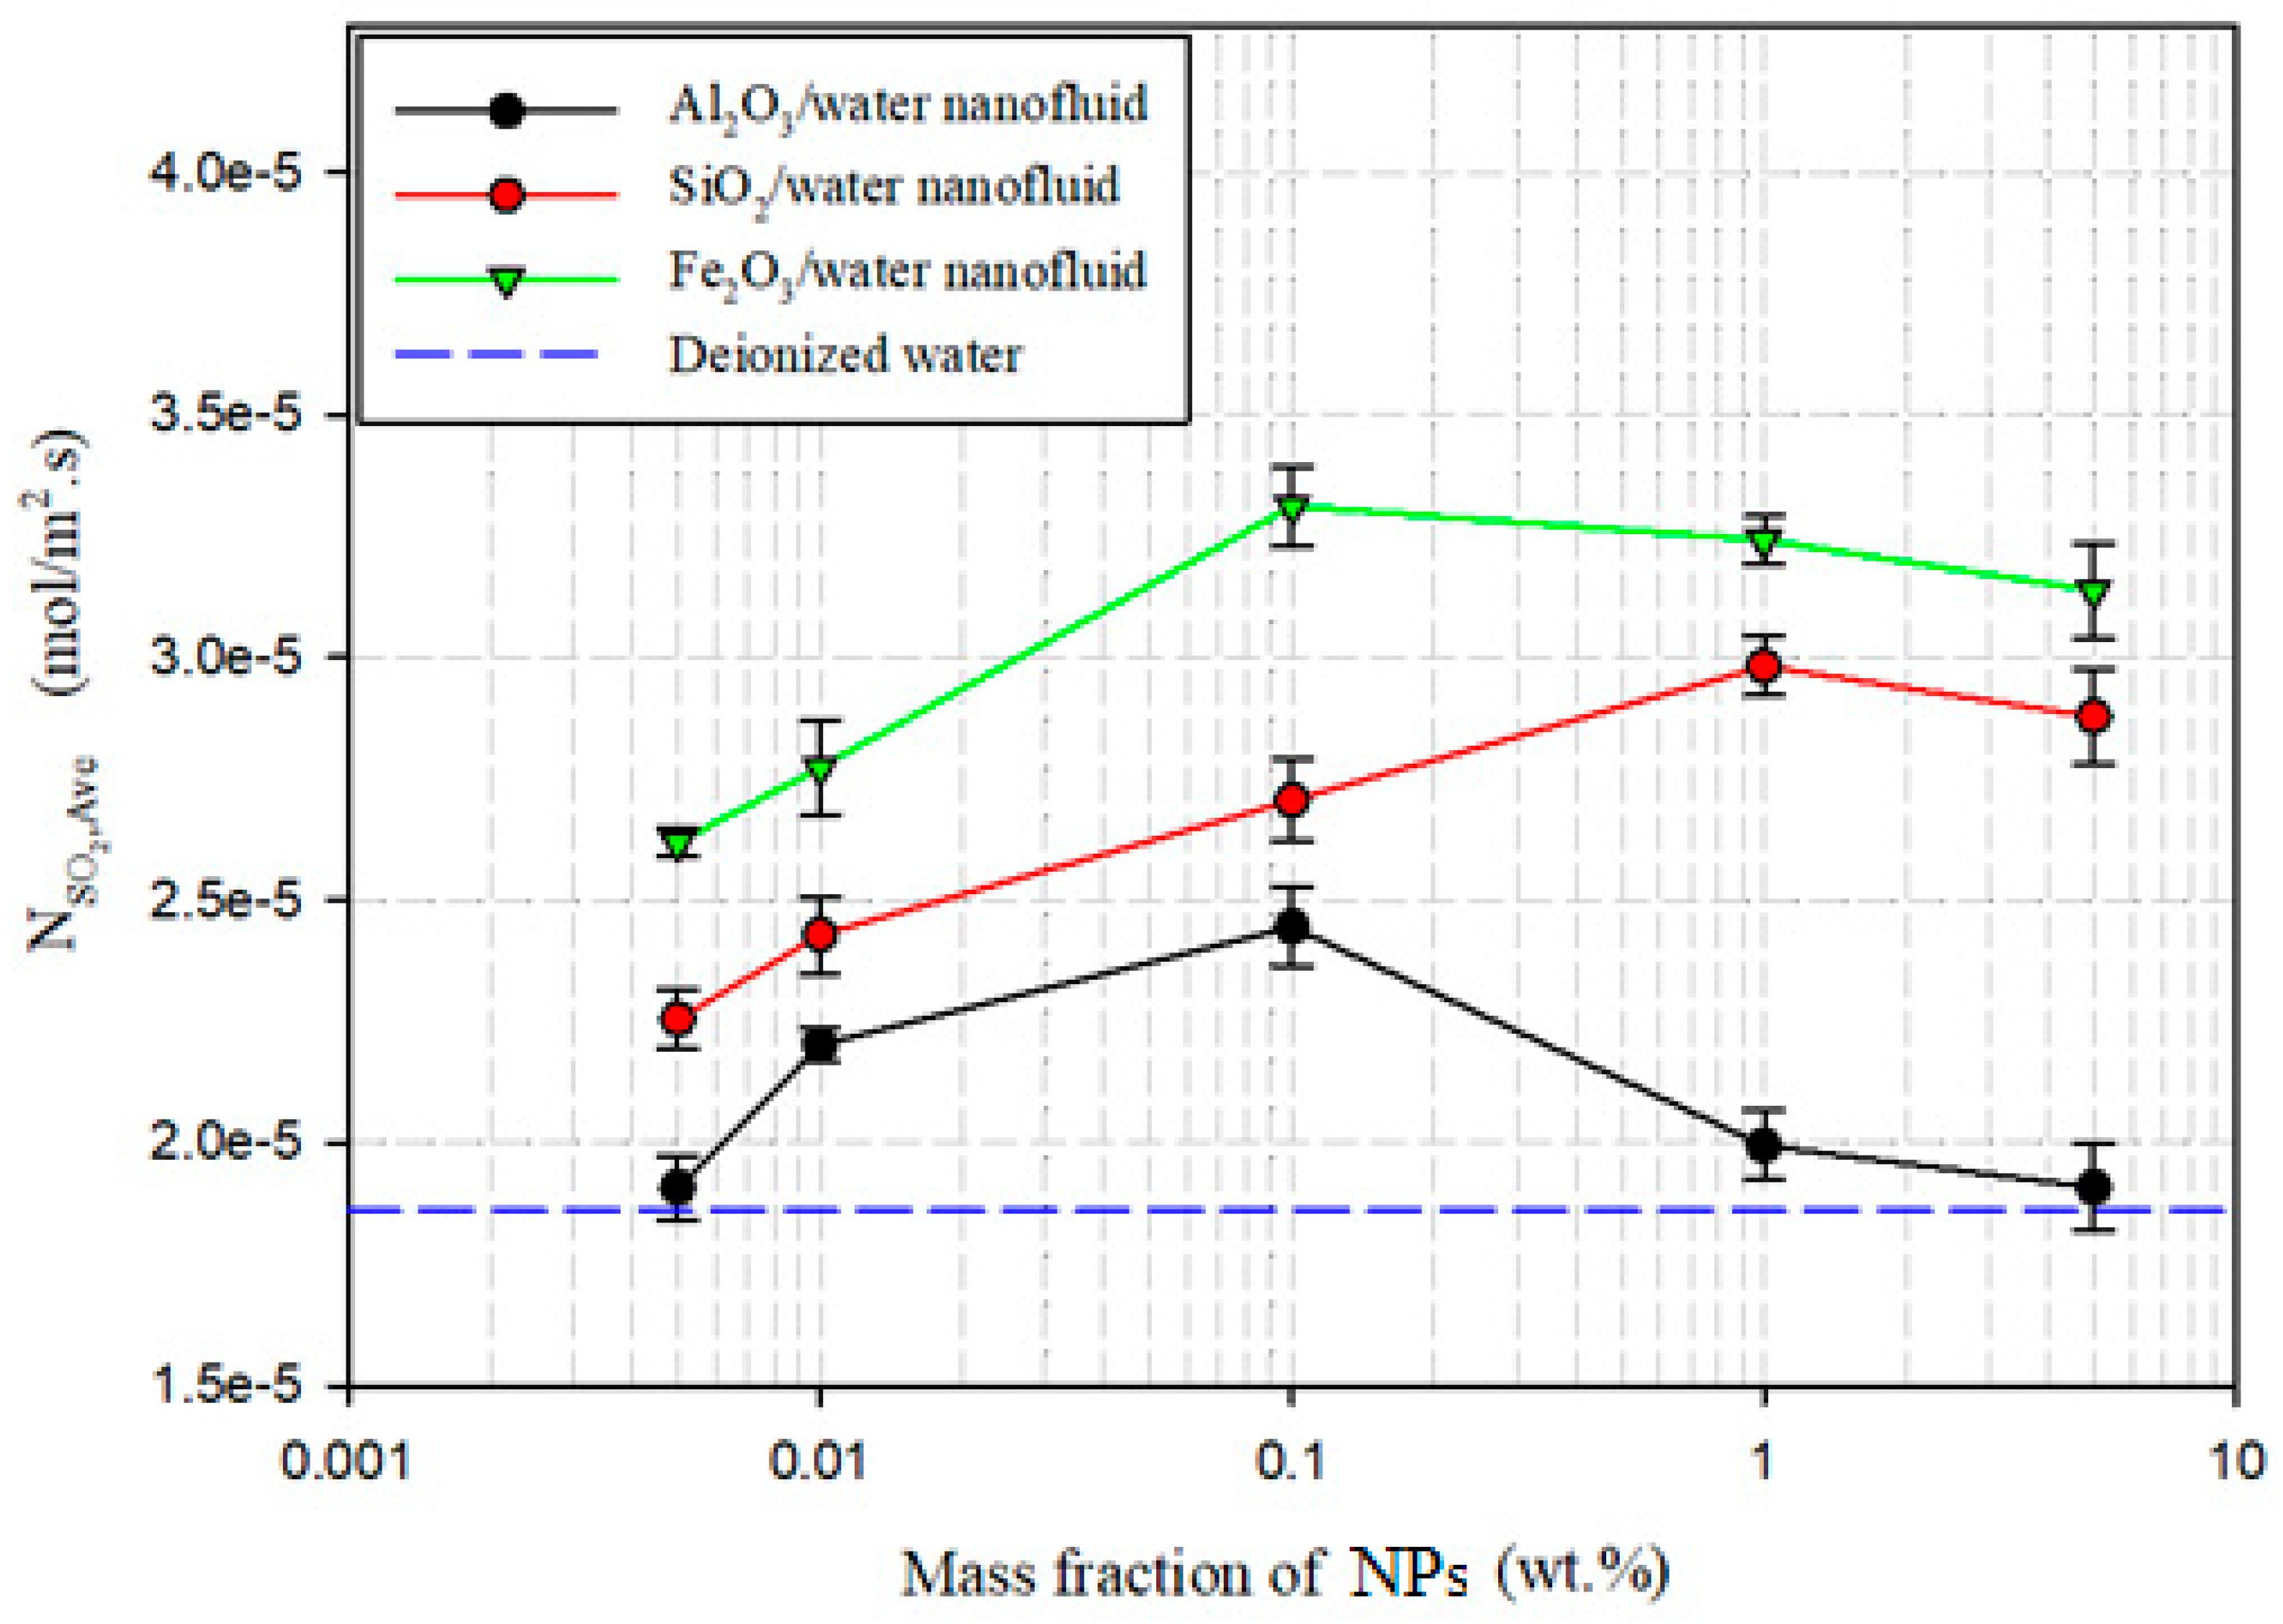
3.2.1. Maximum Absorption

Figure 5 shows the average molar flux of CO2 into each of these three nanofluids: SiO2/water, Al2O3/water or Fe2O3/water. The mass fraction of each metal oxides nanoparticle varies from 0.005 to 5 wt. %. The experimentations were repeated four times at a fixed mass fraction of metal oxides nanoparticles and the standard deviations are shown in this figure as the error bars. According to the results presented in this figure, the average molar flux of CO2 increases about 21% with the increase of Al2O3 nanoparticles from 0.005 to 0.1 wt. % while the molar flux decreases for higher Al2O3 nanoparticles loads (0.1 to 5 wt. %). Moreover, the value of CO2 molar flux increases about 45% when the mass fraction of SiO2 nanoparticles increases from 0.005 to 0.01 wt. %. Moreover, for higher mass fractions of SiO2 nanoparticles, a remarkable declination on CO2 molar flux resulted. In addition, the value of CO2 molar flux enhances about 16% when mass fraction of Fe2O3 nanoparticles enhances from 0.005 to 1 wt. %, and a declination of CO2 molar flux resulted in the mass fraction range of up to 5 wt. %. Table 2 represents the mass fraction of nanoparticles where by the maximum value of CO2 molar flux obtained. It can be concluded from this table that CO2 absorption molar flux has a maximum value at 0.1, 0.01 and 1 wt. % for Al2O3/water, SiO2/water and Fe2O3/water nanofluids, respectively. For all nanoparticles types, the nanoparticles intensify the micro-convections, producing larger mass transfer rate in comparison to pure basefluid; thus, initial increase in CO2 absorption would be rationalizable with the aforementioned nanoparticles mass fractions. On the other hands, increasing a number of nanoparticles leads to enhance further the viscosity of nanofluids, thereby overcoming the nanoparticles micro-convection impacts together with diminishing the absorption of CO2 within the nanofluids [4,12]. Furthermore, Figure 5 clearly exhibits that CO2 absorption molar flux in metal oxides-based nanofluids is larger than that in deionized water for various nanoparticles mass loads.
Figure 6 displays the average molar flux of SO2 into each of these three nanofluids: SiO2/water, Al2O3/water or Fe2O3/water. The aforementioned metal oxides nanoparticles were dispersed in deionized water with different concentrations of 0.005, 0.01, 0.1, 1 and 5 wt. %. These experimentations were also repeated four times at a fixed mass fraction of each metal oxide nanoparticle, and the error bars express the standard deviation obtained from the measurements. According to the obtained results, the average molar flux of SO2 enhances about 28% with the Al2O3 nanoparticles enhancement from 0.005 to 0.1 wt. %, and for higher nanoparticles loads, a substantial decrease resulted in its molar flux. In addition, the value of SO2 absorption rate into SiO2/water nanofluid increases about 32% when the mass fraction of SiO2 nanoparticles in deionized water increases from 0.005 to 1 wt. %. After a further increase of mass fraction up to 5 wt. %, the absorption of CO2 declines. Moreover, the value of CO2 molar flux increases about 26% when mass fraction of Fe2O3 nanoparticles increases from 0.005 to 0.1 wt. %; and with a further increase of nanoparticles mass fraction from 0.1 to 5 wt. %, the value of CO2 absorption declines. According to the results presented in Table 2, the maximum molar flux of SO2 can be obtained with the nanoparticles mass fractions of 0.1, 1 and 0.1 wt. % for Al2O3/water, SiO2/water and Fe2O3/water nanofluids, respectively. Similar to the results achieved for CO2 absorption, the addition of nanoparticles into the deionized water enhances the micro-convections and intensifies the mass transfer rate of SO2 while increasing the nanoparticles load increases further the viscosity of nanofluids, declining the absorption rate of SO2 into the nanofluids [4,12]. The results presented in this figure show that SO2 absorption in metal oxides nanofluids is more than that in deionized water.

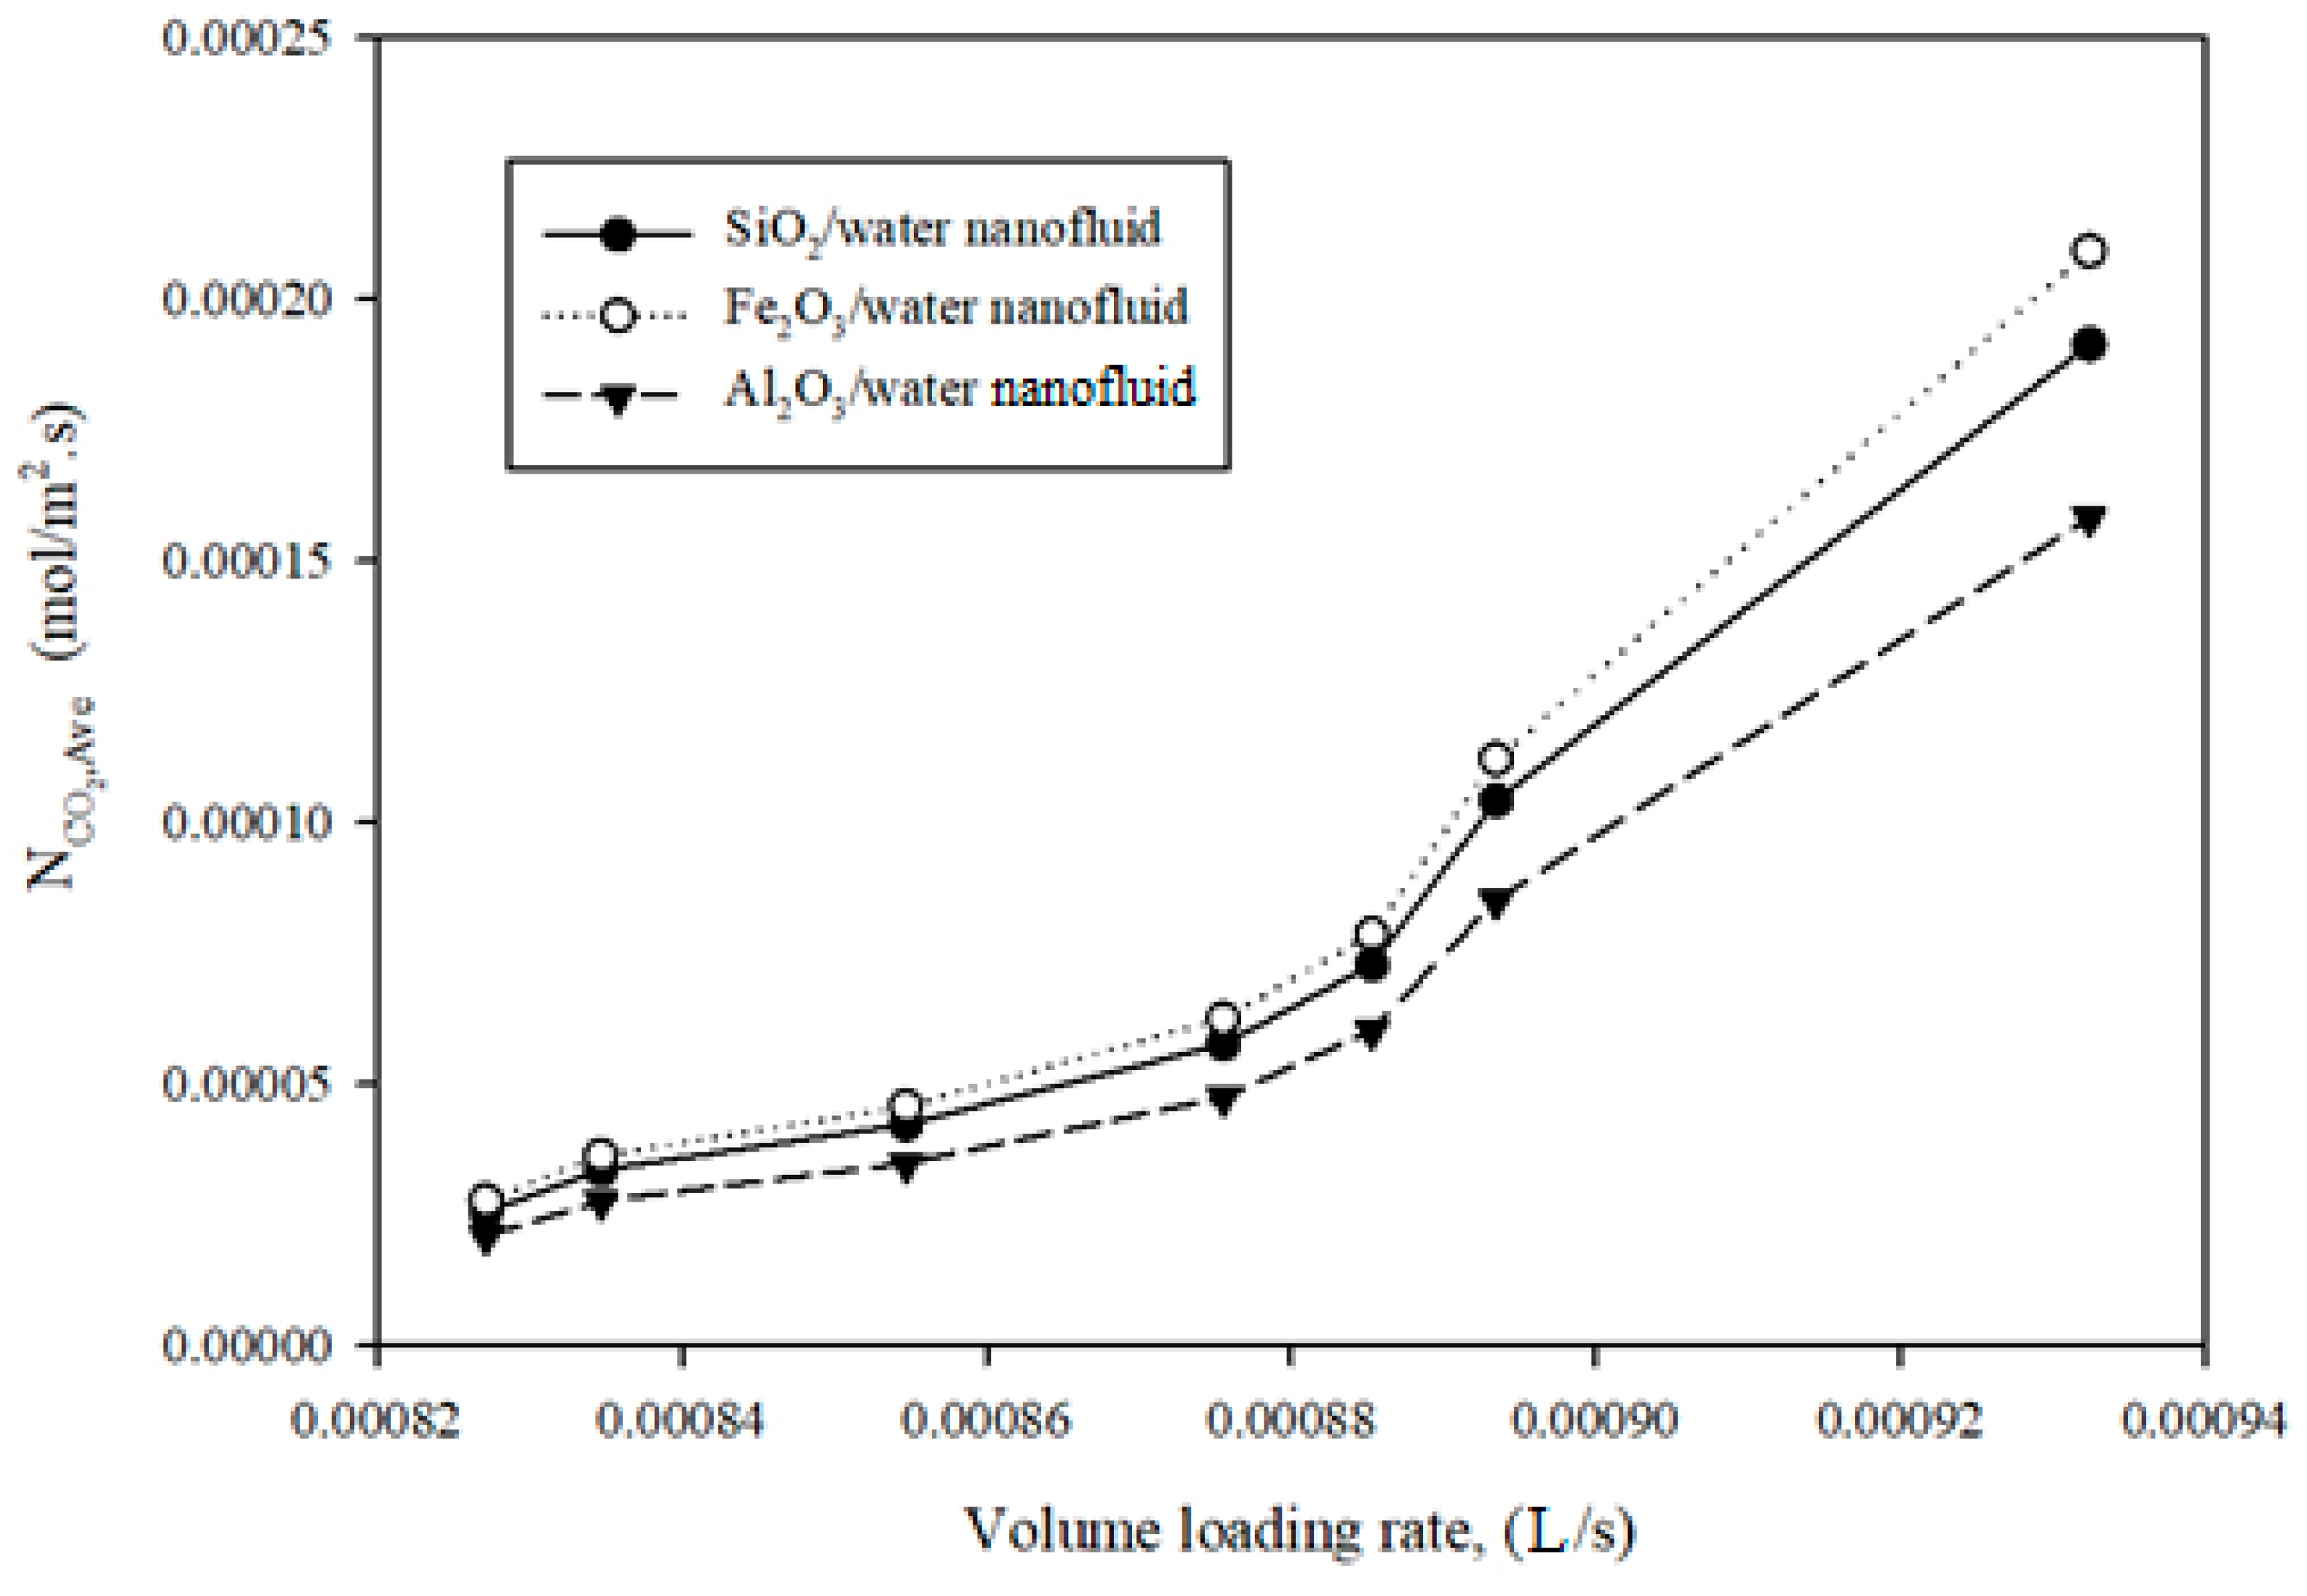
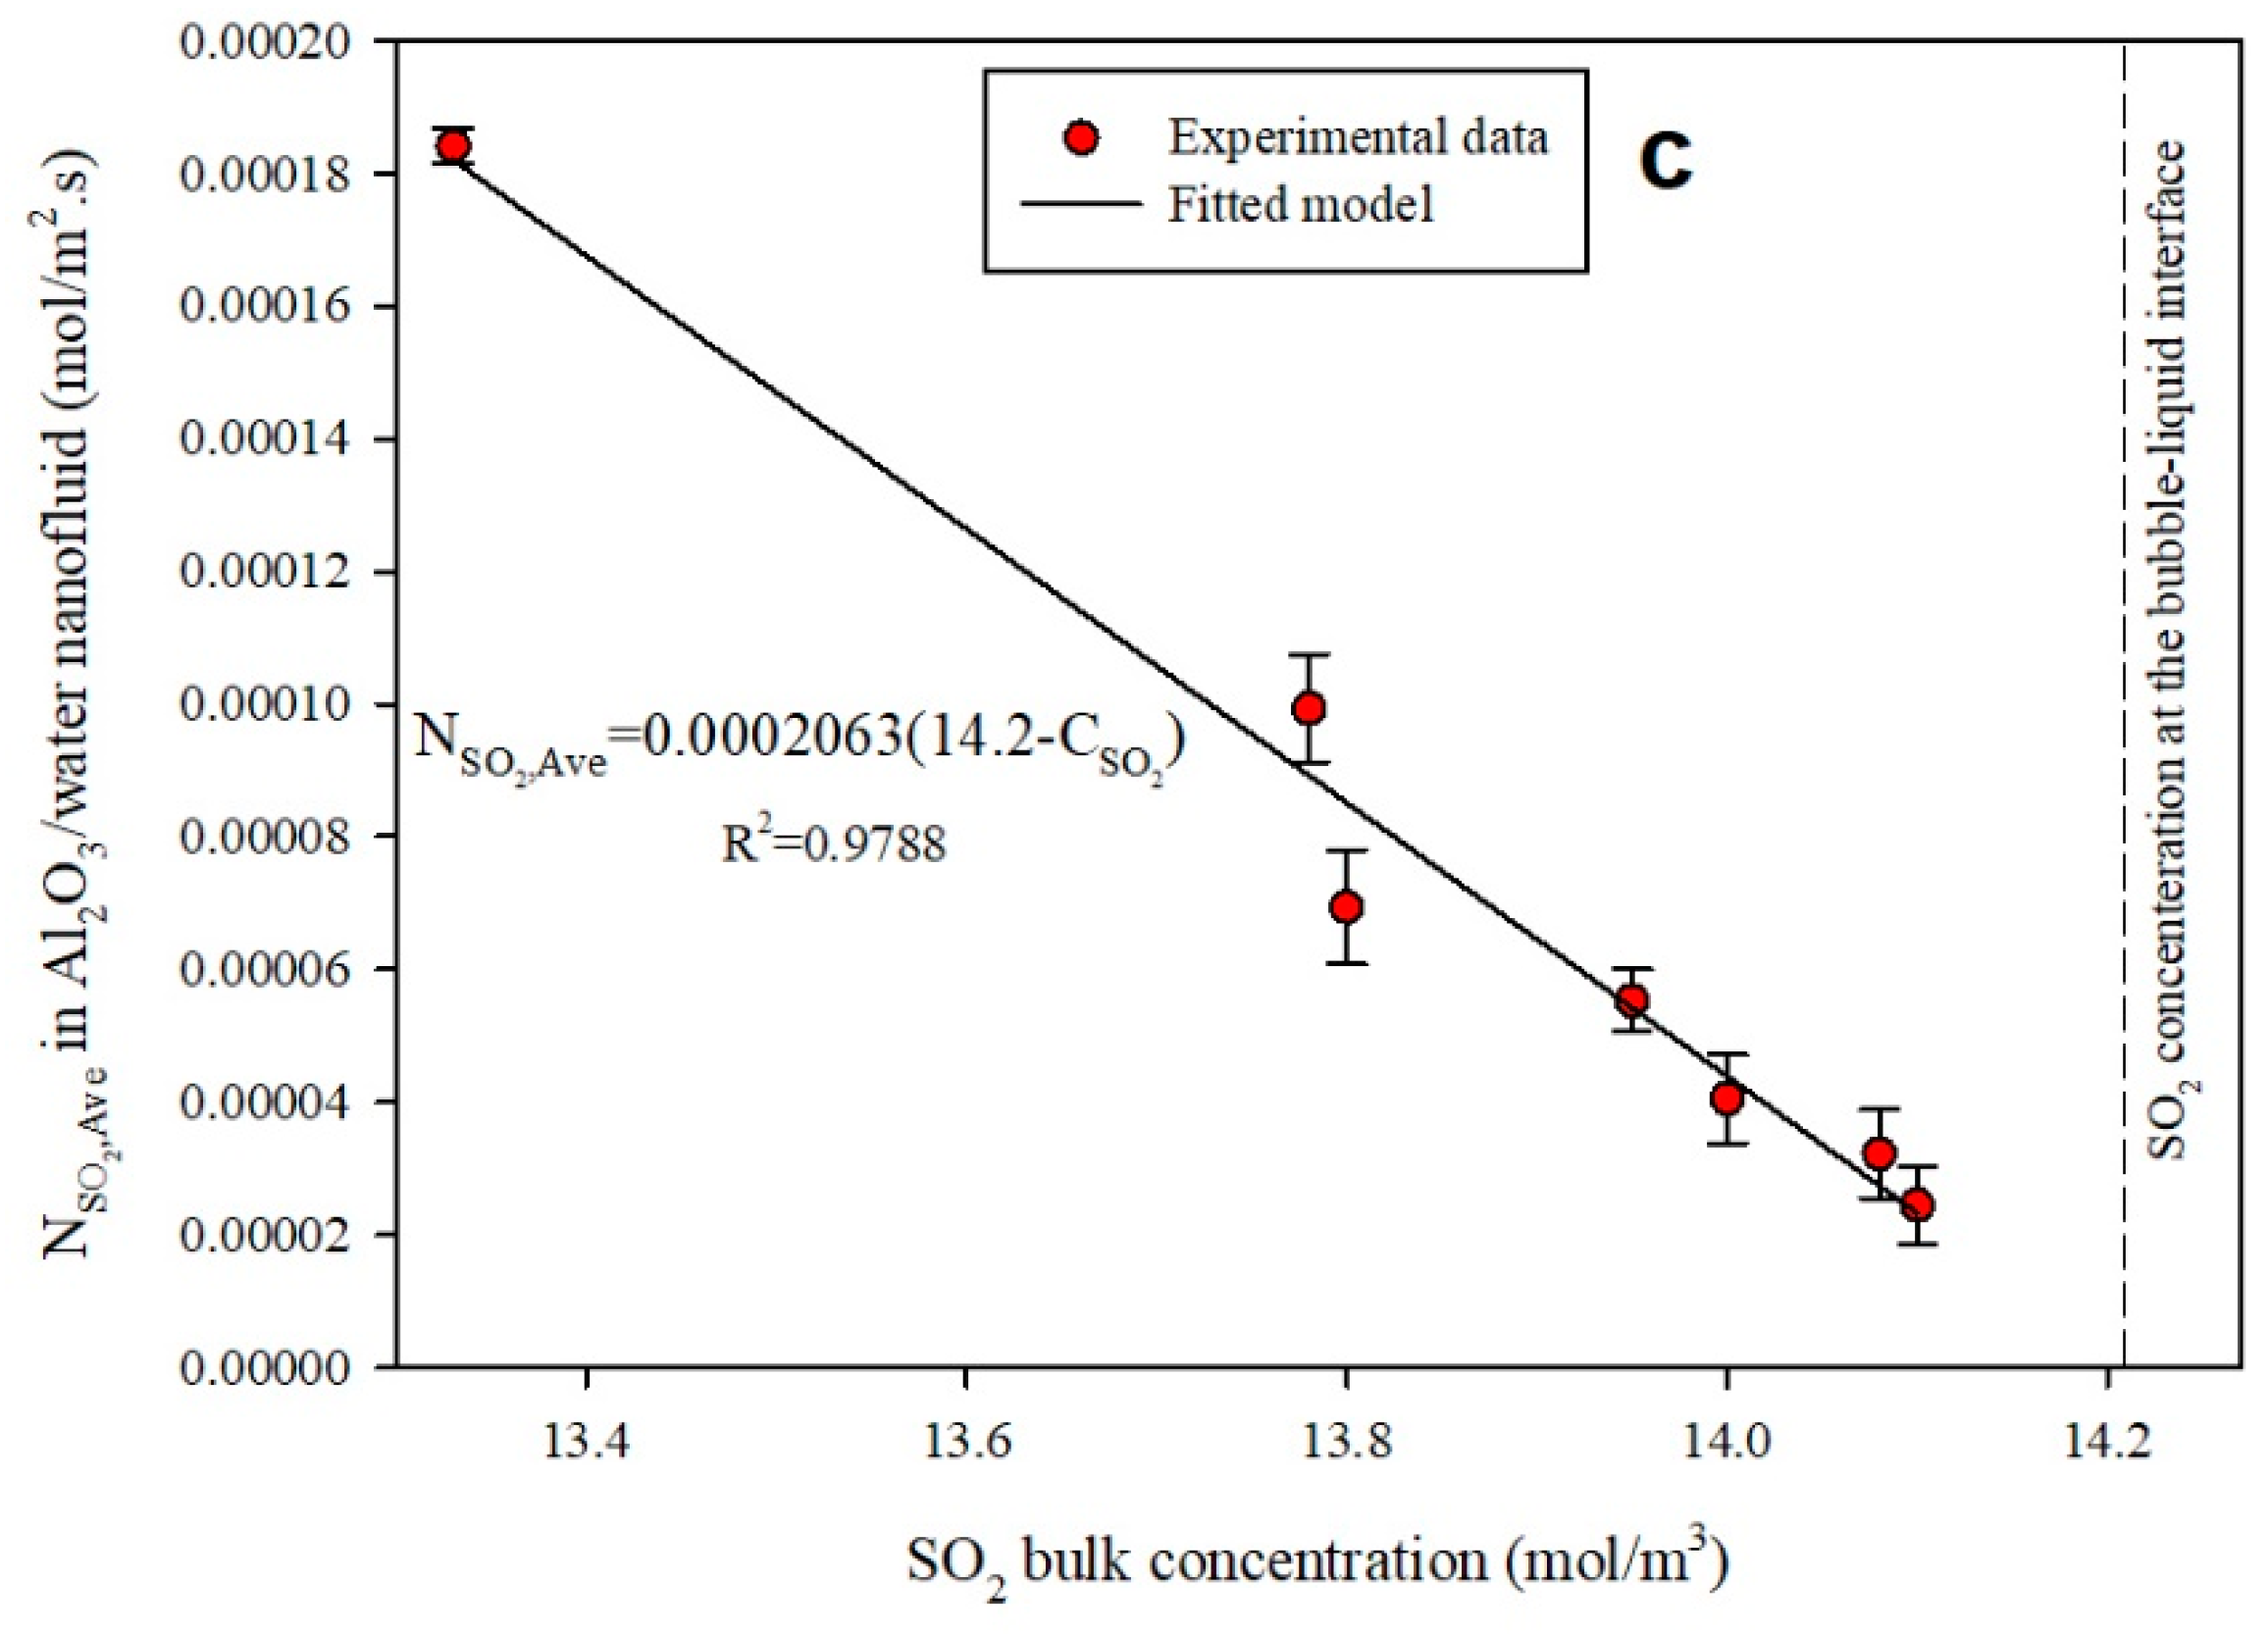
3.2.2. Probing of Mass Transfer Rate

Volume loading rate (mL/mL s), can be attributed to the rate of gas injection divided to the total volume of gas equal to which is 50 mL. It actually represents the time which is passing during the mass transfer process and clearly shows what portion of gas is injected through the nanofluid. Therefore, this parameter can easily show the ability of nanofluid to absorb gas at the beginning of the injection or at the end of the process. Figure 7 presents the results of average CO2 absorption in each of these three nanofluids: SiO2/water, Al2O3/water or Fe2O3/water against the volume loading rate that was measured at the temperature of 25 °C and the optimum mass fractions of 0.1, 0.01 and 1 wt. % for SiO2, Al2O3 and Fe2O3 nanoparticles in deionized water, respectively. These findings reveal that the absorption rate increases with the enhancement in volume loading rate. Additionally, it is chiefly clear when Fe2O3/water is used as an absorbent, the maximum value of absorption rate is obtained at any volume loading rate. Moreover, these results indicate that the minimum value of CO2 absorption for the Al2O3/water nanofluid resulted in comparison to the other nanofluids assessed in this work. These findings indicated that type of the used nanoparticles had a major effect on mass transfer rate. In addition, it can be concluded from this figure that the mass transfer flux is low at lower volume loading rates, and it increases with the increment of loading rate due to having a higher driving force of mass transfer.
Figure 8 also shows the results of average SO2 absorption in each of these three nanofluids: SiO2/water, Al2O3/water or Fe2O3/water against the volume loading rate that was measured at the temperature of 25 °C and the concentrations of 0.1, 1 and 0.1 wt. % for Al2O3, SiO2 and Fe2O3 nanoparticles in deionized water, respectively. These results, which are similar to those obtained for CO2 absorption, show that the absorption rate increases with the growth in volume loading rate, and when SiO2/water is used as an absorbent, the maximum value of absorption rate is obtained at each gas volume loading rate; while for CO2 absorption by using Fe2O3/water nanofluid, a higher absorption rate achieved. In addition, it is chiefly evident that the minimum value of SO2 absorption for the Al2O3/water nanofluid resulted in comparison to the other nanofluids assessed in this work, that is similar to CO2 case. These findings declared that type of the used nanoparticles and their interactions with CO2 and SO2 had a major effect on mass transfer rate of the gas into the nanofluids. Moreover, the value of absorption rate is similar to the case of CO2 absorption.

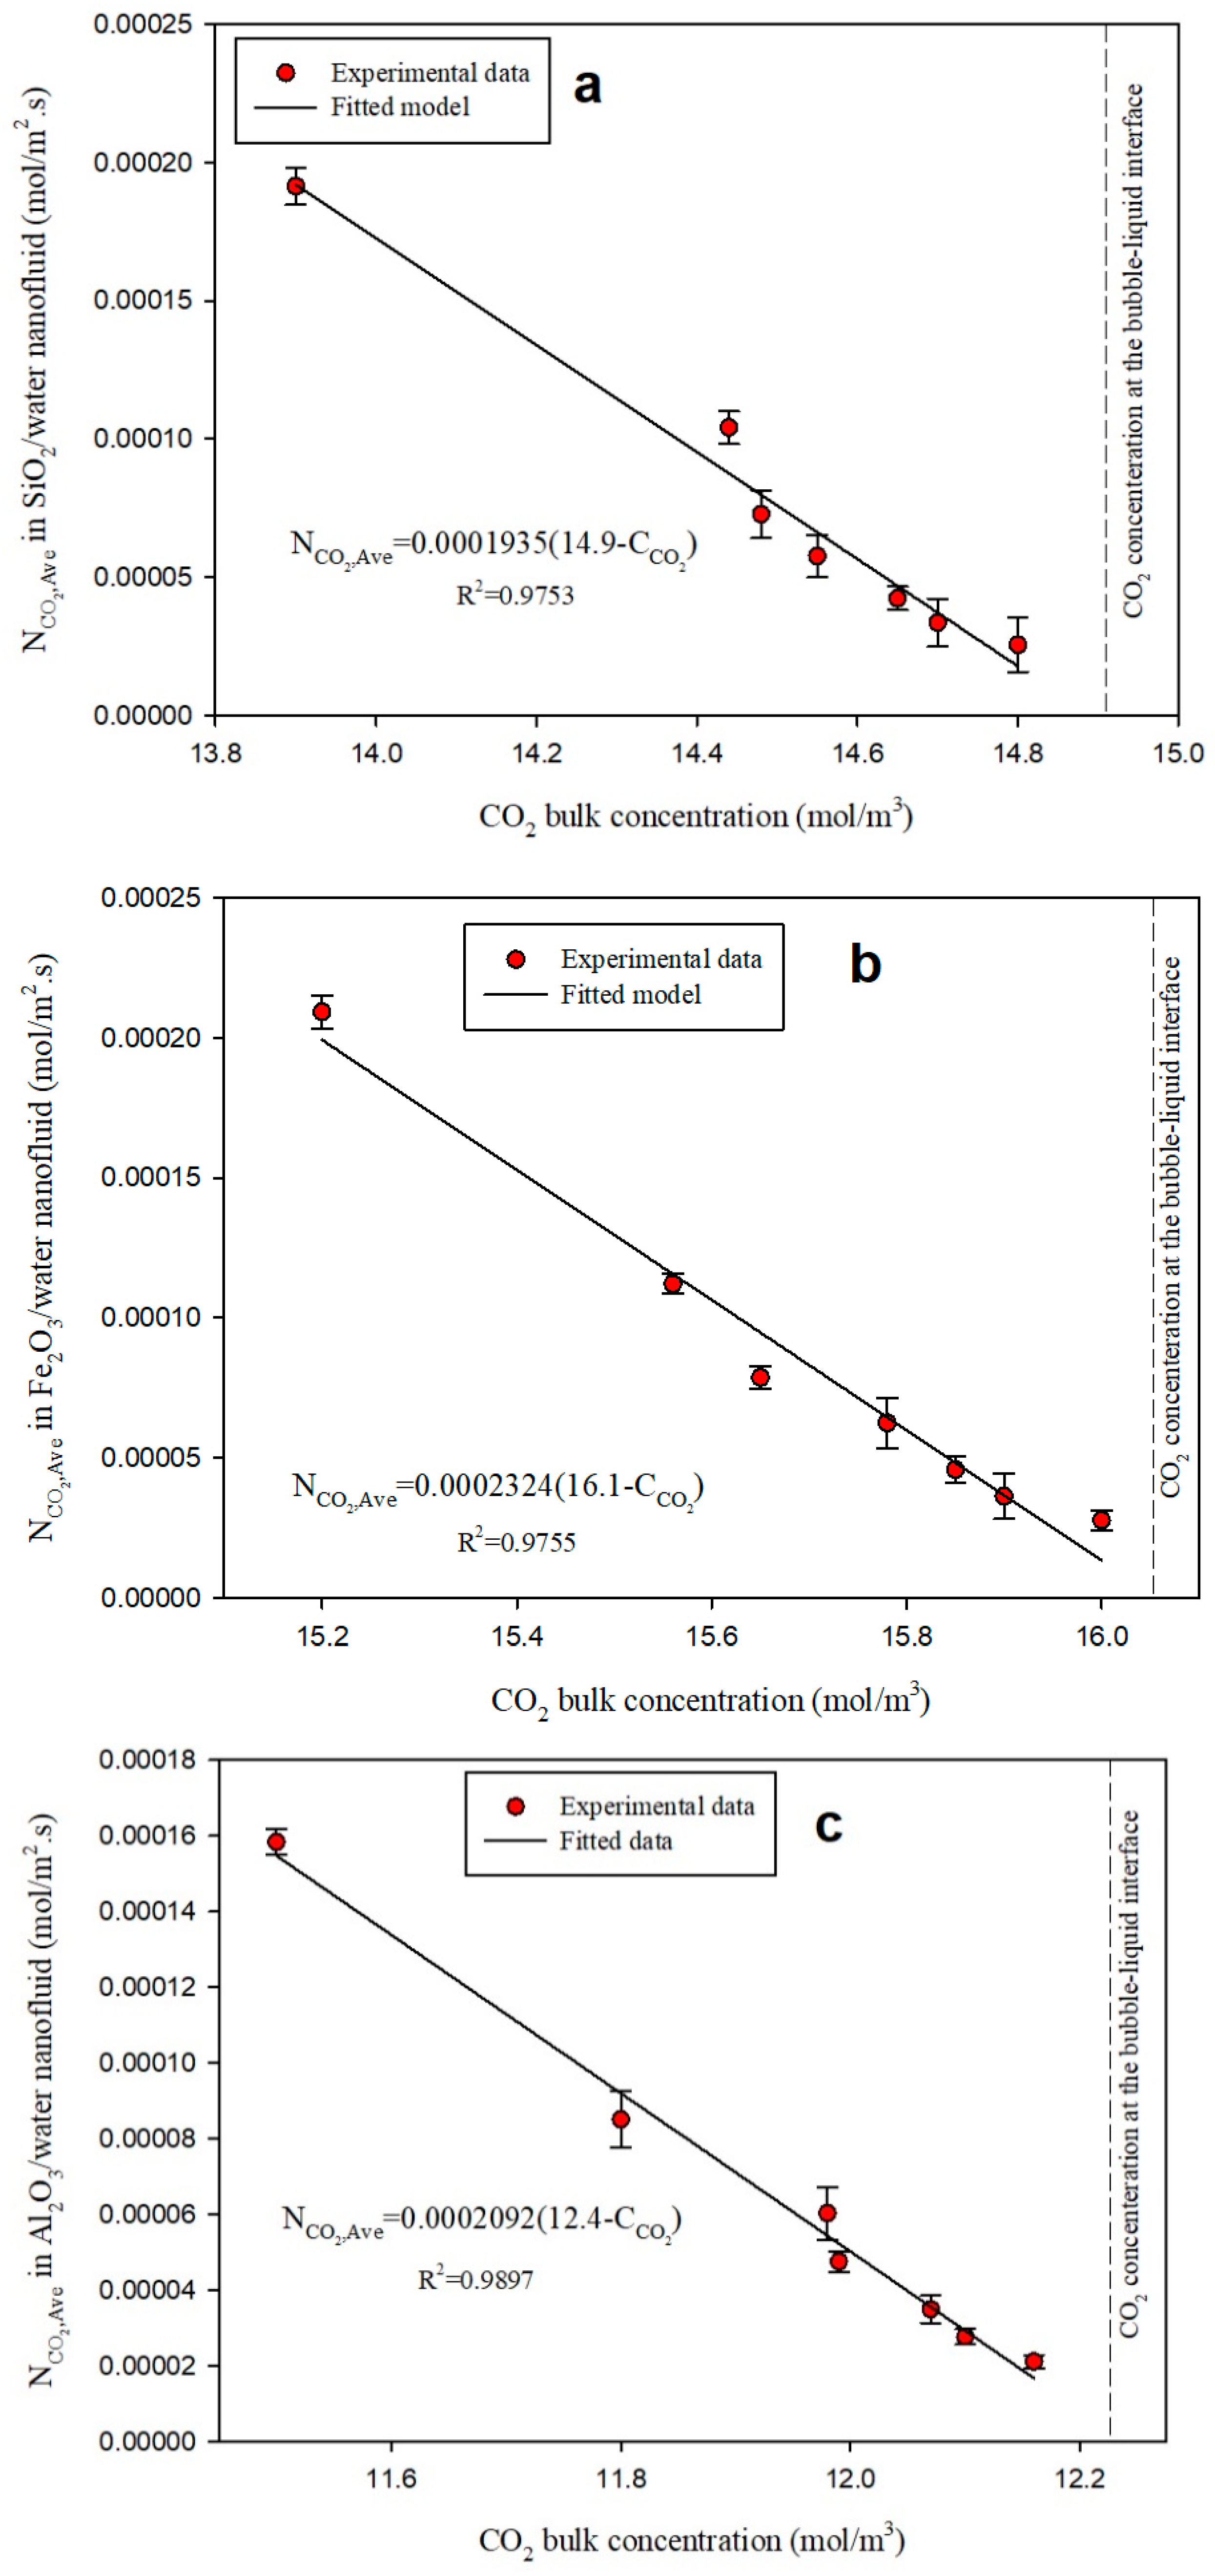
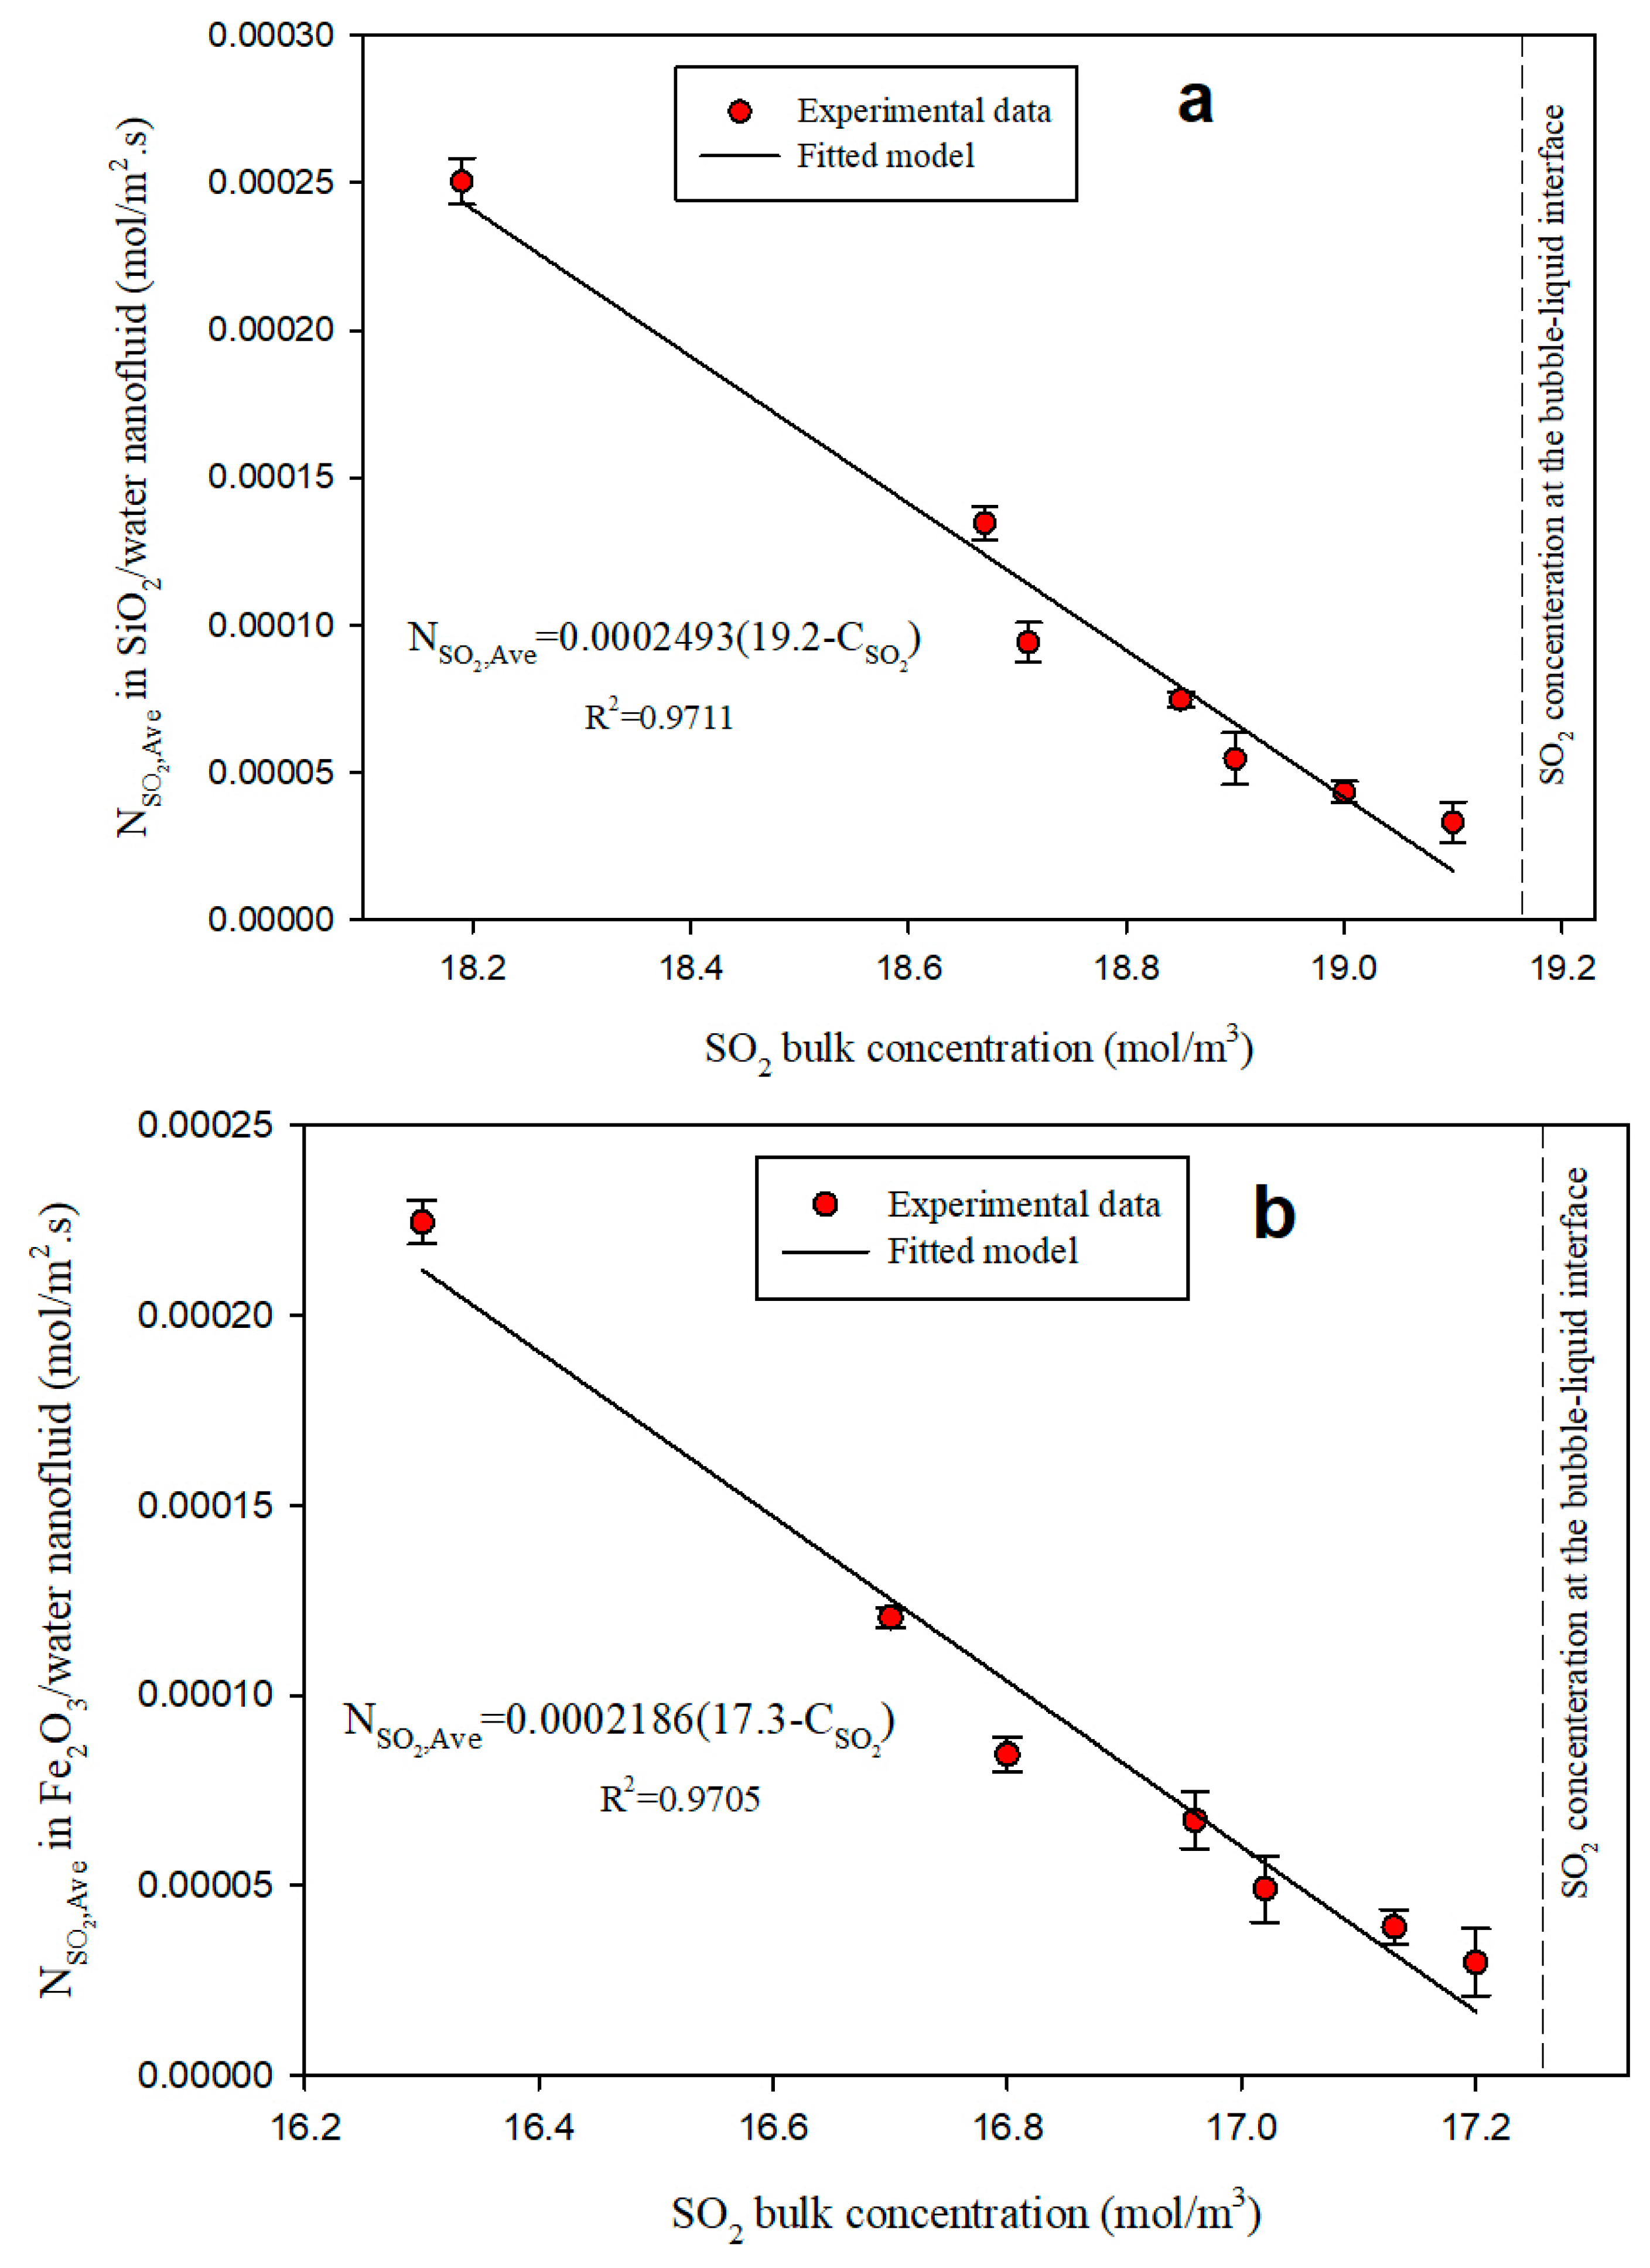
3.2.3. Mass Transfer Coefficient

For the calculation of mass transfer coefficient, in separate runs, various volumes of gases (20, 25, 30, 35, 40, 45 and 50 mL that are, respectively, equal to 7, 10, 12, 13, 15.6, 17.6 and 20 min total gas-liquid contact time) were injected into the column and then gas concentration and molar flux were measured. Figure 9 shows the average molar flux of CO2/SO2 against the dissolved concentration of CO2/SO2 in the liquid bulk. These results clearly exhibit that an increase in CO2/SO2 bulk concentration consecutively decreases the average value of molar flux due to the reduction of mass transfer driving force. Moreover this observation has approximately a linear behavior for all cases. In order to potpourri of this linear behavior, the principal mass transfer equation (Equation (7)) was used, and the experimental values for the absorption of CO2/SO2 by using different nanofluids were fitted to Equation (7):
N A v g = k L ( C RO 2 , O b s e r v e d * C RO 2 )
where k L is the mass transfer coefficient at liquid phase, (m/s), C RO 2 is the bulk concentration of CO2/SO2 within the nanofluids, and C RO 2 , O b s e r v e d * is the observed concentration of CO2/SO2 at gas-liquid interface, (mol/m3). It is mentioned that observed value for gas concentration in the interface was calculated from extrapolation of line fitted on experimental data. Since linear pattern was assumed for molar flux and gas concentration. According to the results obtained for the absorption of CO2 into each of these three nanofluids: SiO2/water, Al2O3/water or Fe2O3/water (Figure 9a–c), the model was fitted to the experimental data with the R2 equal to 0.9753, 0.9755 and 0.9897 declaring high accuracy of the regression analysis and low deviation of the experimental data from the fitted model.
The average molar flux of SO2 versus the bulk concentration is shown in Figure 10. These results are also similar to those obtained for CO2 absorption declaring that an increase in SO2 bulk concentration leads to decrease the average value of molar flux, representing a significant declination in mass transfer driving force. In order to obtain the mass transfer coefficient and SO2 concentration at the bubbles-liquid interface, the regression analysis was also performed on Equation (7), and the equation was fitted to the values for SO2 absorption into each of these three nanofluids: SiO2/water, Al2O3/water or Fe2O3/water (Figure 10a–c) with the R2 equal to 0.9711, 0.9705 and 0.9788, respectively. These values confirm the high accuracy of the regression analysis.
According to the results obtained from Figure 9 and Figure 10, it can be concluded that for all nanofluids used in this study, the vertical diagram (dashed line) shows the observed concentration of CO2 and SO2 at the bubble-liquid interface. Furthermore, the diagonal plot of average molar flux versus the bulk concentration of CO2 and SO2 represents the operating line for gas absorption into the nanofluids. It is clearly evident that by approaching the operating line to the equilibrium concentration of CO2 and SO2 in each of these three nanofluids, namely SiO2/water, Al2O3/water or Fe2O3/water, a lower molar flux resulted.
Table 3 represents the values of relative mass transfer coefficient for SO2 and CO2 absorption by using SiO2/water, Al2O3/water or Fe2O3/water nanofluids with respect to water alone. These values are the slope of operating line in Figure 9 and Figure 10. According to these results, the maximum value of relative mass transfer coefficient for CO2 absorption was achieved by Al2O3/water nanofluid while the value of relative mass transfer coefficient for SiO2/water was observed to possess a minimum value in comparison to the other nanofluids assessed in this work. Additionally, these findings exhibit that the maximum value of mass transfer coefficient for SO2 absorption was achieved for SiO2/water, and this parameter for Fe2O3/water was found to be less than the others. According to the results presented in this table, relative mass transfer coefficient intensively depend on type of the nanofluid. In fact, the absorption of SO2 by SiO2/water nanofluid and the absorption of CO2 by Fe2O3/water nanofluid demonstrate higher values for the relative mass transfer coefficient and relative gas concentration at the bubble-liquid interface.

3.3. Diffusivity Coefficient
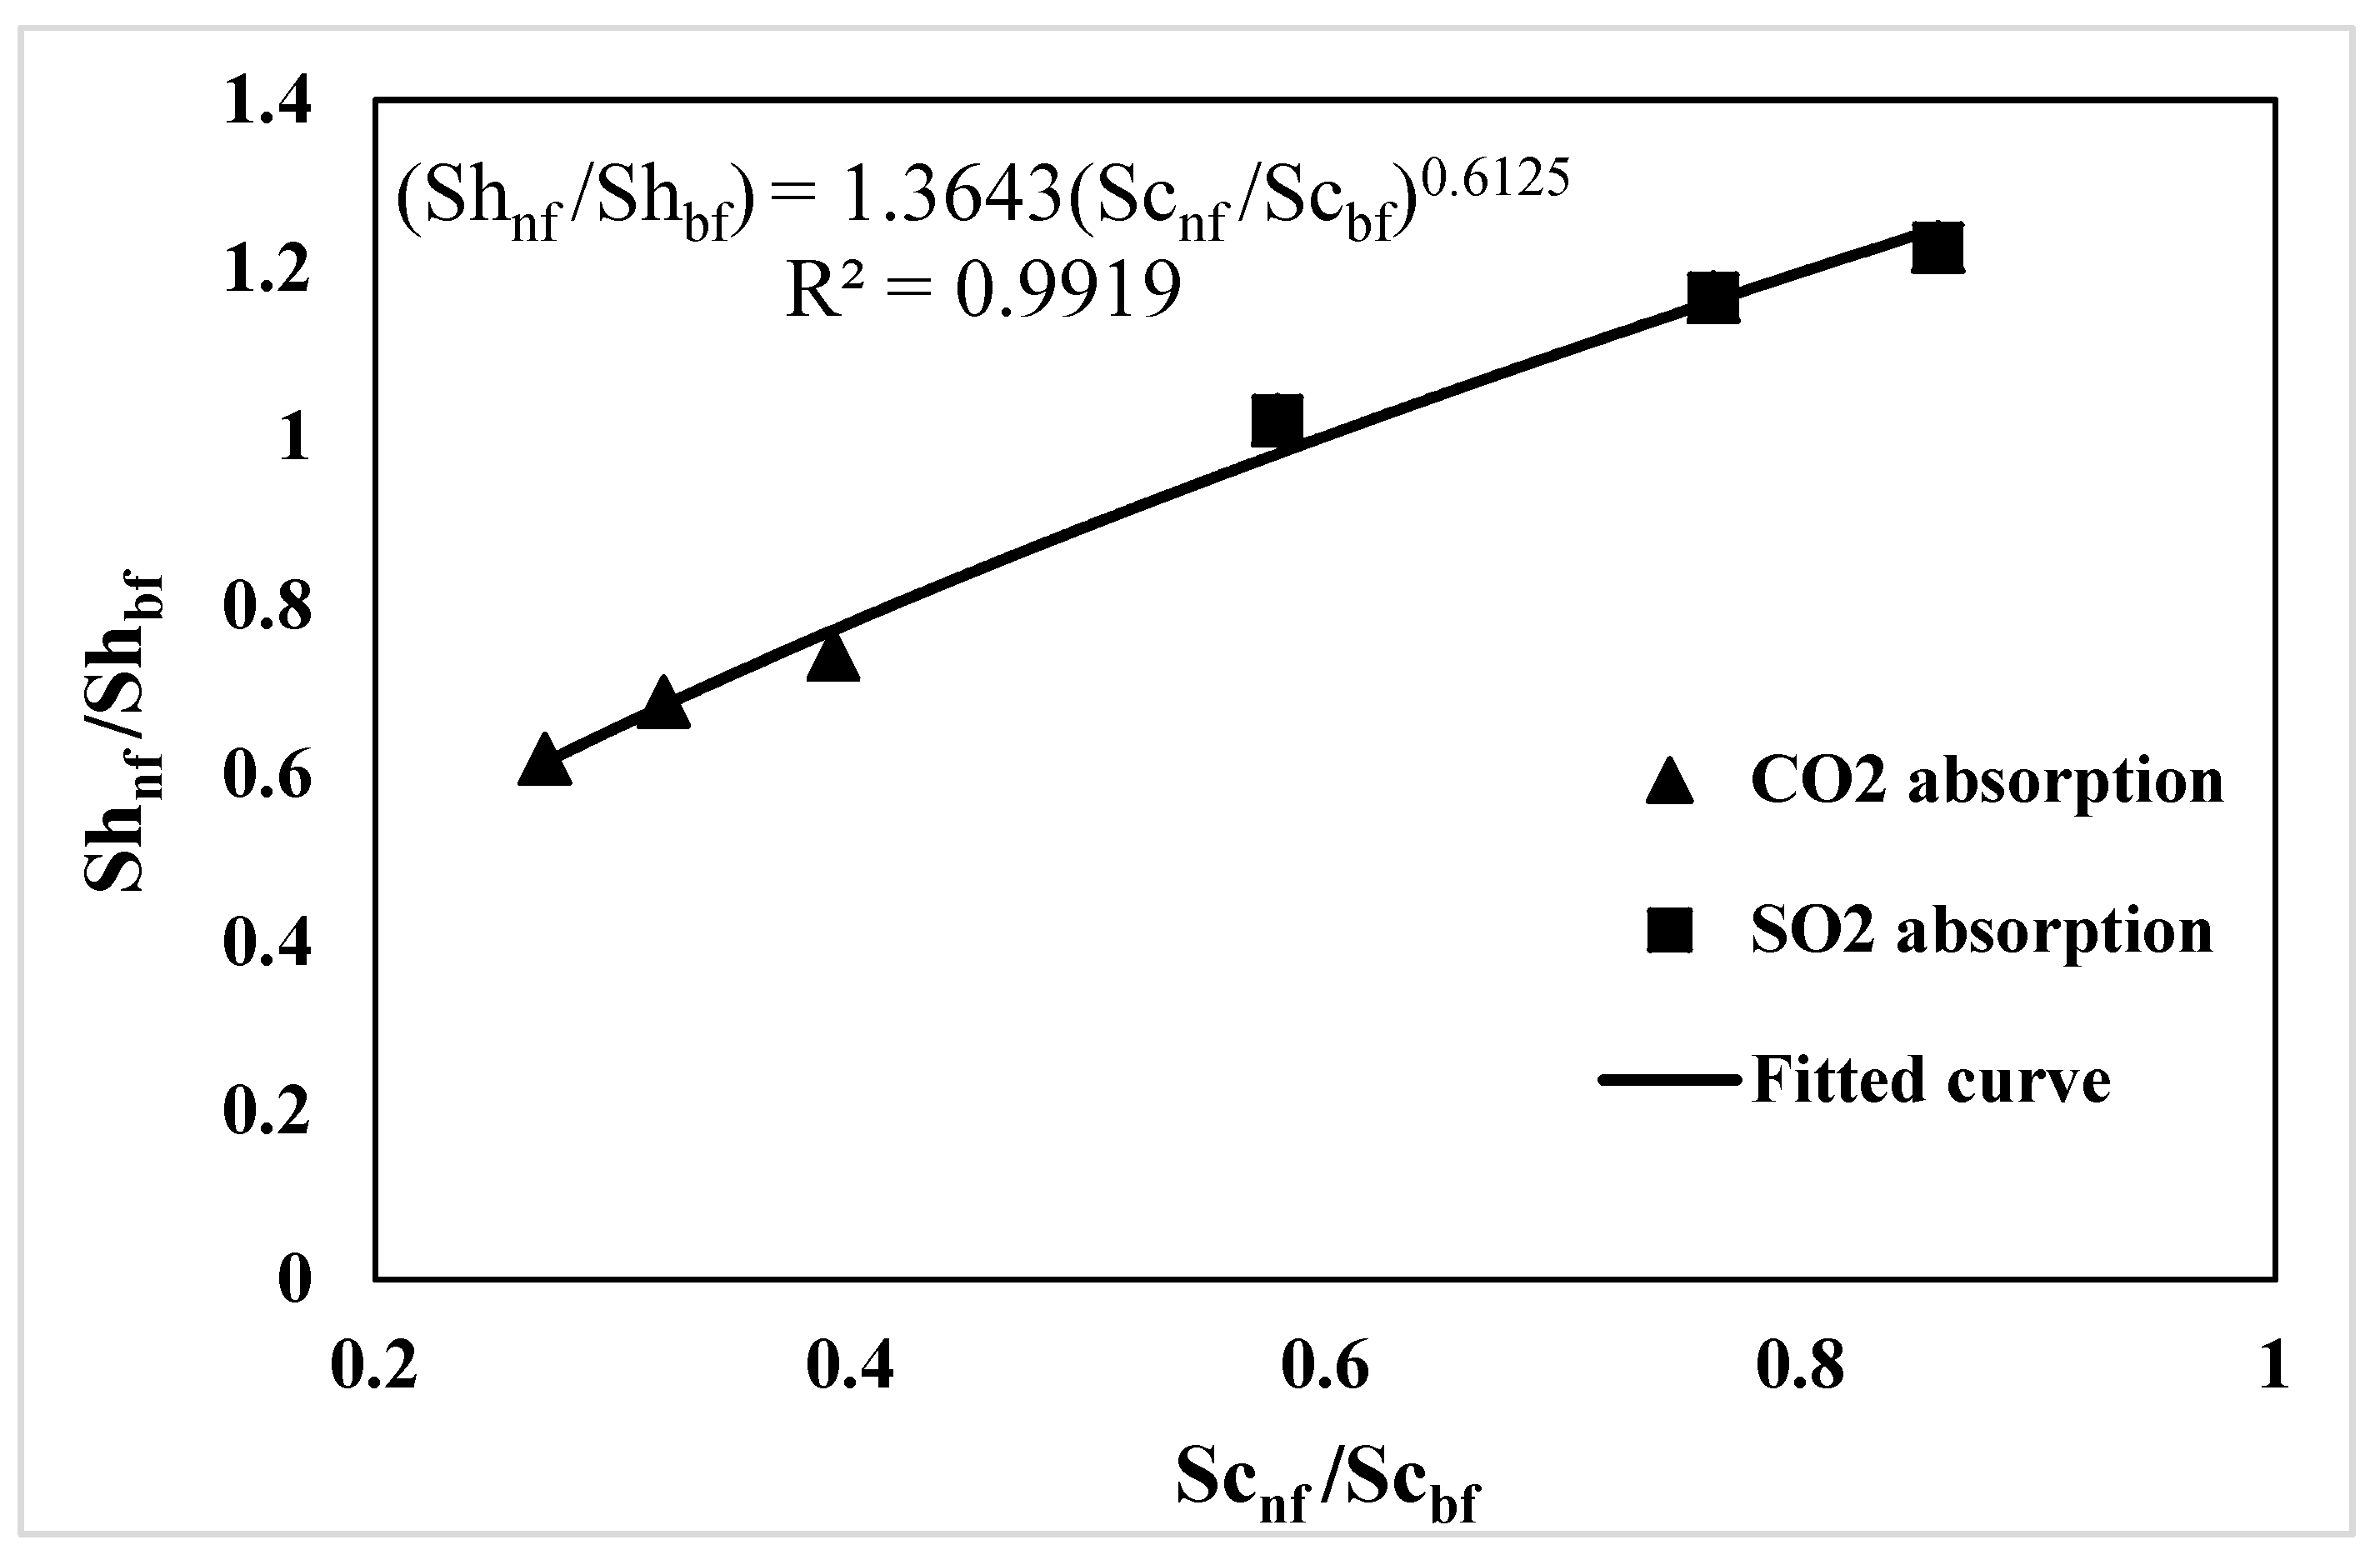
In general, diffusivity of gases into a fluid has a higher impact on mass transfer coefficient as well as rate of gas absorption. In this study, Equation (8) was used to obtain the diffusivity of SO2 and CO2 into each of these three nanofluids, namely SiO2/water, Al2O3/water or Fe2O3/water. This equation indicates a bubble-liquid mass transfer model for raising a single bubble through a liquid based on Dankwert’s theory [5,29].
N A v e = D   s i n h ( δ s D ) + D   r 0   s D   c o s h ( δ s D ) r 0   s i n h ( δ s D ) ( C RO 2 , i C RO 2 )
In this model, the main factors affecting on mass transfer rate are the surface renewal rate (s), bubbles radius ( r 0 ), diffusion layer thickness ( δ ) and the diffusivity of gases through a liquid (D). N A v e is the molar flux ( m o l / m 2   s ) , C RO 2 and C RO 2 , i are the concentration of dioxide gases within the liquid bulk and at the bubble-liquid interface (mol/m3), respectively.
By comparing Equations (7) and (8), the mass transfer coefficient of a gas into the liquid by using a single bubble can be obtained from the following relation:
k L = D   s i n h ( δ s D ) + D   r 0 s D   c o s h ( δ s D ) r 0   s i n h ( δ s D )
This equation was used for estimating the diffusivity of SO2 and CO2 within the nanofluids. It has been reported by Darvanjooghi et al. that the effective parameters in Equation (9) (s, δ and D) intensively depend on the size of nanoparticles in the basefluid. They reported that the size of nanoparticles was about 40 to 50 nm, and the values of surface renewal rate, s, and the diffusion layer thickness, δ , were 6.85 and 0.201 mm, respectively [2]. In this research, the average mean diameter of nanoparticles ranges from 40 to 60 nm. Additionally, it can be assumed that the values of s and δ would be constant during the absorption of SO2 and CO2 and depend on just nanoparticles mean diameter. Additionally, the mass transfer coefficients for both SO2 and CO2 gases within the nanofluids studied here have been already calculated in Table 3. Therefore, Equation (9) can be simplified to the following relation:
F ( D , s , δ ) = exp ( 2 δ s D ) D r 0 s . D r 0 k L r 0 s . D r 0 k L = 0 ,   s = 6.85     and   δ = 0.201
where F ( D , s , δ ) must be equal to zero for certain values of mass transfer coefficient and gas diffusivity within the different nanofluids. By using the Newton-Raphson method, Equation 10 can be solved according to the following equation in which F ( D n , s , δ ) / D n can be obtained by obtaining partial derivative of Equation (10). The initial value of diffusivity, D 0 , was set on 10−10.
D n + 1 = D n F ( D n , s , δ ) F ( D n , s , δ ) / D n   ,   n = 0 ,   1 ,   2 ,   3 ,
Table 4 presents the values of SO2 and CO2 diffusivities into SiO2/water, Al2O3/water or Fe2O3/water nanofluids. According to the results obtained from Table 4, it is evident that the maximum value of diffusivity for the absorption of CO2 is obtained when water/Fe2O3 is used as an absorbent, and the maximum diffusivity for the absorption of SO2 is achieved when being used water/SiO2 nanofluid. As can be seen in this table, for nanoparticles with the higher density ( ρ SiO 2 = 2.196 g/cm3, ρ Al 2 O 3 = 3.980 g/cm3, ρ Fe 2 O 3 = 5.242 g/cm3) more diffusivity of CO2 within the nanofluid is observed which is attributed to the nanoparticles Brownian motion inducing more diffusion of CO2 molecules at the bubble-liquid interface. It has been previously reported by Attari et al. that the momentum caused by Brownian velocity of nanoparticles leading to produce micro-convections, depending on nanoparticles density according to the following relation [20]:
M o B r o w n i a n = λ ρ p
According to this equation by having an increase in nanoparticles density, more momentum can be transferred through the liquid phase; and consequently, a higher magnitude of micro-convections produces. Previous efforts declared that only two significant mechanisms including Brownian micro-convections and grazing effect (absorption of gas molecules by nanoparticles at the bubble-liquid interface and desorption of them into the liquid) can be involved during the gas absorption when a nanofluid is used as an absorbent [2,3,4,5,10,11,36]. For the absorption of CO2, Brownian mechanism has a major impact on gas molecules transfer due to the fact that CO2 molecules have not a very polar structure and asymmetric molecular configuration to produce high molecular charges (O=C=O) for being absorbed by nanoparticles surface charge; therefore, the Brownian mechanism indicates that water/Fe2O3 leads to a higher diffusivity of CO2 because of the larger micro-convections. Consequently, the minimum value of CO2 diffusivity in water/SiO2 nanofluid could be observed due to the lower density and lower magnitude of micro-convections produced by SiO2 nanoparticles.
On the other hands, due to the high polarity of SO2 molecules and formation of its Lewis structure during the absorption process [37] (Figure 11), it can be easily absorbed by means of nanoparticles surficial charge, which they are at the vicinity of the bubble-liquid interface. In addition, it is reported from the previous researches that SiO2 nanoparticles have a high value of surface charge due to the formation of silanol bonds (Si-O-H) at the nanoparticles surface [12], which has been confirmed by Zeta Potential test presented in this study. Therefore, the main mechanism for the absorption of SO2 is attributed to grazing effect by means of nanoparticles at the bubble-liquid interface resulting a high diffusivity of SO2 gas when water/SiO2 nanofluid is used (Figure 11).

3.4. Correlation

Froessling [38] estimated the mas transfer of a raising bubble in a liquid by using Equation (13):
S h = 0.6 ( R e ) 1 / 2 ( S c ) 1 / 3
Equation (13) was found to be a suitable correlation for prediction of the absorption of different gases into wide ranges of liquids by means of single bubble absorber system [39]. In order to estimate Sh number for the gas absorption by nanofluids, other physical properties including dynamic viscosity, kinematic viscosity, and density of nanofluids were needed to obtain according to the following relations [40]:
μ n f = μ b f ( 1 φ ) 2.5
ρ n f = φ ρ p + ( 1 φ )   ρ b f
ν n f = μ n f / ρ n f        
where φ is the volume fraction of oxides nanoparticles within the deionized water (can be obtained by using Equation (17) μ b f is the dynamic viscosity of the deionized water,   ρ p is the bulk density of nanoparticles (presented in Table 1) and ρ b f is the density of the deionized water (1000 kg/m3).
φ ( % v o l ) = w ( % w t ) w ( % w t ) + ρ p ρ b f ( 100 w ( % w t ) )
The values of Re, Sc and Sh can be calculated using the following equations:
R e b = U b d b / ν n f
S c n f = ν n f / D n f
S h n f = k L , n f . d b / D n f
In these equations, Ub means the bubble rising velocity in the column that was approximately found to be 0.21 m/s for all the experiments. Additionally, d b is the bubble diameter that was measured as 7 mm for all cases. Table 4 also presents the values of Reb, Sh and Sc for the absorption of CO2 and SO2 by using the mentioned nanofluids.
According to Table 4 and Equation (18), the value of Reynolds number does not change significantly when either nanofluid or pure basefluid is applied during the absorption process by means of raising a single bubble absorber i.e., ν n f ν b f . Therefore, it can be assumed that the Reynolds number has no significant effect on relative Sherwood number and this parameter is found to be just as a function of relative Schmidt number according to below:
S h n f S h b f = K   ( S c n f S c b f ) m
m and K were calculated by using a two-dimensional regression analysis over the experimental data shown in Figure 12. According to this figure, the following equation was obtained for the mentioned parameters with the R2 = 0.9919. Equation (22) can predict the Sherwood number for various gas-nanofluid absorption systems at Reb~1300, accurately:
S h n f S h b f = 1.3643   ( S c n f S c b f ) 0.6125           f o r   R e b 1300
It is mentioned that S h b f can be calculated by the Froessling equation (Equation (13)).

4. Conclusions

In this research, the absorption of SO2 and CO2 was elucidated by using a single-bubble column absorption setup into water based nanofluids containing SiO2, Fe2O3 or Al2O3 nanoparticles. The results of this study clearly show that the aforementioned nanofluids have high stability since the zeta potential is lower than −45 mV. The results of TEM and DLS analysis also display that the average size of nanoparticles is within limit of 40–60 nm.
These results also declared that the maximum absorption of CO2 and SO2 could be obtained when water/SiO2 or water/Fe2O3 nanofluid is utilized as an absorbent. Moreover, our findings also showed that the maximum relative absorption for SO2 and CO2 in the studied nanofluids in comparison to base fluid occurs when a water/Fe2O3 or water/SiO2 nanofluid was used as the absorbent. Indeed, our results show that the type of gas molecules and nanoparticles determines the mechanism of mass transfer intensification of nanofluids. Therefore, both Brownian motion and grazing effect play crucial role for the increment of mass transfer in gas absorption by nanofluids. According to the type of gas and nanoparticles, the major mechanism can be distinguished.
In addition, mass transfer parameters incorporating diffusivity of gases into the oxides nanoparticles loaded in nanofluids, Sherwood number and Schmidt number were obtained. The results exhibit that the addition of nanoparticles (due to increment of Brownian momentum) increases diffusivity coefficient, and the maximum diffusivity for CO2 and SO2 absorption was obtained for water/Fe2O3 and water/SiO2 nanofluids, respectively.
Finally, a new correlation is offered for the prediction of Sherwood number versus Schmidt number in gas-nanofluid systems (for Reb about 1300) in which the experimental values are predicted with high accuracy.

Author Contributions

S.K.: Conceived and designed the analysis, Collected the data, Contributed data or analysis tools, Performed the analysis, Wrote the paper; F.E.: Conceived and designed the analysis, Contributed data or analysis tools, Performed the analysis, Wrote the paper; D.M.: Conceived and designed the analysis, Performed the analysis.

Funding

This research received no external funding.

Acknowledgments

The authors are grateful to the Shiraz University for supporting this research.

Conflicts of Interest

The authors declare no conflict of interest.

Nomenclature

N Molar flux (mol/m2 s)
C Gas concentration at liquid bulk (mol/m3)
C O b s * The observed gas concentration at gas-liquid interface (mol/m3)
V Volume of nanofluid in the single bubble absorber (m3)
n Number of bubbles
τ Average rising time for one bubble through the column (s)
r 0 Average radius of bubbles (m)
k L Mass transfer coefficient in liquid phase (m/s)
D Diffusion coefficient (m2/s)
δ Diffusion layer thickness (mm)
s Renewal surface factor (1/s)
RebReynolds number (Ubdbnf)
ScSchmidt number (ʋnf/Dnf)
ShSherwood number (kLdb/Dnf)
d b Diameter of bubbles raising through nanofluid (m)
φ Volume fraction (%)
wMass fraction (%)
ρ Density (kg/m3)
v Kinematic viscosity (m2/s)
λ Constant value for calculation of Brownian momentum transfer
ReffRelative absorption rate (Nnf/Nbf)
MHCl molarity (mol/lit)
λ Constant value as a function of nanoparticles density, temperature, volume fraction, mean diameter, heat capacity, and Boltzmann constant.
MoMomentum that can be transferred by means of nanoparticle random motion
Subscript
n f Nanofluid
b f Basefluid
p Nanoparticles
BBubble

References

  1. Nii, S.; Takeuchi, H. Removal of CO2 and/or SO2 from gas streams by a membrane absorption method. Gas Sep. Purif. 1994, 8, 107–114. [Google Scholar] [CrossRef]
  2. Darvanjooghi, M.H.K.; Esfahany, M.N.; Esmaeili-Faraj, S.H. Investigation of the Effects of Nanoparticle Size on CO2 Absorption by Silica-Water Nanofluid. Sep. Purif. Technol. 2017. [Google Scholar] [CrossRef]
  3. Darvanjooghi, M.H.K.; Pahlevaninezhad, M.; Abdollahi, A.; Davoodi, S.M. Investigation of the effect of magnetic field on mass transfer parameters of CO2 absorption using Fe3O4-water nanofluid. AIChE J. 2017, 63, 2176–2186. [Google Scholar] [CrossRef]
  4. Esmaeili-Faraj, S.H.; Nasr Esfahany, M.; Jafari-Asl, M.; Etesami, N. Hydrogen sulfide bubble absorption enhancement in water-based nanofluids. Ind. Eng. Chem. Res. 2014, 53, 16851–16858. [Google Scholar] [CrossRef]
  5. Esmaeili-Faraj, S.H.; Nasr Esfahany, M. Absorption of hydrogen sulfide and carbon dioxide in water based nanofluids. Ind. Eng. Chem. Res. 2016, 55, 4682–4690. [Google Scholar] [CrossRef]
  6. Kim, J.-K.; Jung, J.Y.; Kang, Y.T. Absorption performance enhancement by nano-particles and chemical surfactants in binary nanofluids. Int. J. Refrig. 2007, 30, 50–57. [Google Scholar] [CrossRef]
  7. Baker, R.W. Future directions of membrane gas separation technology. Ind. Eng. Chem. Res. 2002, 41, 1393–1411. [Google Scholar] [CrossRef]
  8. Richard, M.A.; Bénard, P.; Chahine, R. Gas adsorption process in activated carbon over a wide temperature range above the critical point. Part 1: Modified Dubinin-Astakhov model. Adsorption 2009, 15, 43–51. [Google Scholar] [CrossRef]
  9. Whitman, W.G. The two film theory of gas absorption. Int. J. Heat Mass Transf. 1962, 5, 429–433. [Google Scholar] [CrossRef]
  10. Ashrafmansouri, S.S.; Nasr Esfahany, M. Mass transfer into/from nanofluid drops in a spray liquid-liquid extraction column. AIChE J. 2016, 62, 852–860. [Google Scholar] [CrossRef]
  11. Ashrafmansouri, S.S.; Esfahany, M.N. Mass transfer in nanofluids: A review. Int. J. Therm. Sci. 2014, 82, 84–99. [Google Scholar] [CrossRef]
  12. Darvanjooghi, M.H.K.; Esfahany, M.N. Experimental investigation of the effect of nanoparticle size on thermal conductivity of in-situ prepared silica–ethanol nanofluid. Int. Commun. Heat Mass Transf. 2016, 77, 148–154. [Google Scholar] [CrossRef]
  13. Chol, S. Enhancing thermal conductivity of fluids with nanoparticles. ASME-Publ.-Fed 1995, 231, 99–106. [Google Scholar]
  14. Krishnamurthy, S.; Bhattacharya, P.; Phelan, P.; Prasher, R. Enhanced mass transport in nanofluids. Nano Lett. 2006, 6, 419–423. [Google Scholar] [CrossRef] [PubMed]
  15. Kim, J.-K.; Jung, J.Y.; Kim, J.H.; Kim, M.-G.; Kashiwagi, T.; Kang, Y.T. The effect of chemical surfactants on the absorption performance during NH3/H2O bubble absorption process. Int. J. Refrig. 2006, 29, 170–177. [Google Scholar] [CrossRef]
  16. Ma, X.; Su, F.; Chen, J.; Zhang, Y. Heat and mass transfer enhancement of the bubble absorption for a binary nanofluid. J. Mech. Sci. Technol. 2007, 21, 1813. [Google Scholar] [CrossRef]
  17. Zhou, M.; Cai, W.F.; Xu, C.J. A new way of enhancing transport process–The hybrid process accompanied by ultrafine particles. Korean J. Chem. Eng. 2003, 20, 347–353. [Google Scholar] [CrossRef]
  18. Kang, Y.T.; Lee, J.-K.; Kim, B.-C. Absorption heat transfer enhancement in binary nanofluids. In International Congress of Refrigeration; Curran Associates, Inc.: Beijing, China, 2007. [Google Scholar]
  19. Yang, L.; Du, K.; Niu, X.F.; Cheng, B.; Jiang, Y.F. Experimental study on enhancement of ammonia–water falling film absorption by adding nano-particles. Int. J. Refrig. 2011, 34, 640–647. [Google Scholar] [CrossRef]
  20. Attari, H.; Derakhshanfard, F.; Darvanjooghi, M.H.K. Effect of temperature and mass fraction on viscosity of crude oil-based nanofluids containing oxide nanoparticles. Int. Commun. Heat Mass Transf. 2017, 82, 103–113. [Google Scholar] [CrossRef]
  21. Heris, S.Z.; Etemad, S.G.; Esfahany, M.N. Experimental investigation of oxide nanofluids laminar flow convective heat transfer. Int. Commun. Heat Mass Transf. 2006, 33, 529–535. [Google Scholar] [CrossRef]
  22. Kang, Y.T.; Kim, H.J.; Lee, K.I. Heat and mass transfer enhancement of binary nanofluids for H2O/LiBr falling film absorption process. Int. J. Refrig. 2008, 31, 850–856. [Google Scholar] [CrossRef]
  23. Wang, X.-Q.; Mujumdar, A.S. Heat transfer characteristics of nanofluids: A review. Int. J. Therm. Sci. 2007, 46, 1–19. [Google Scholar] [CrossRef]
  24. Jung, J.-Y.; Lee, J.W.; Kang, Y.T. CO2 absorption characteristics of nanoparticle suspensions in methanol. J. Mech. Sci. Technol. 2012, 26, 2285–2290. [Google Scholar] [CrossRef]
  25. Andrade, Â.L.; Fabris, J.D.; Ardisson, J.D.; Valente, M.A.; Ferreira, J.M. Effect of tetramethylammonium hydroxide on nucleation, surface modification and growth of magnetic nanoparticles. J. Nanomater. 2012, 2012, 15. [Google Scholar] [CrossRef]
  26. Andrade, Â.L.; Souza, D.M.; Pereira, M.C.; Fabris, J.D.; Domingues, R.Z. pH effect on the synthesis of magnetite nanoparticles by the chemical reduction-precipitation method. Quim. Nova 2010, 33, 524–527. [Google Scholar] [CrossRef] [Green Version]
  27. Davoodi, S.M.; Sadeghi, M.; Naghsh, M.; Moheb, A. Olefin–paraffin separation performance of polyimide Matrimid®/silica nanocomposite membranes. RSC Adv. 2016, 6, 23746–23759. [Google Scholar] [CrossRef]
  28. Terraglio, F.P.; Manganelli, R.M. The absorption of atmospheric sulfur dioxide by water solutions. J. Air Pollut. Control Assoc. 1967, 17, 403–406. [Google Scholar] [CrossRef]
  29. Zhao, B.; Wang, J.; Yang, W.; Jin, Y. Gas–liquid mass transfer in slurry bubble systems: I. Mathematical modeling based on a single bubble mechanism. Chem. Eng. J. 2003, 96, 23–27. [Google Scholar] [CrossRef]
  30. Skoog, D.A.; West, D.M. Fundamentals of Analytical Chemistry; Thomson Brooks/Cole: Pacific Grove, CA, USA, 2004. [Google Scholar]
  31. Teng, T.-P.; Hung, Y.-H.; Teng, T.-C.; Mo, H.-E.; Hsu, H.-G. The effect of alumina/water nanofluid particle size on thermal conductivity. Appl. Therm. Eng. 2010, 30, 2213–2218. [Google Scholar] [CrossRef]
  32. Vijayakumar, R.; Koltypin, Y.; Felner, I.; Gedanken, A. Sonochemical synthesis and characterization of pure nanometer-sized Fe3O4 particles. Mater. Sci. Eng. A 2000, 286, 101–105. [Google Scholar] [CrossRef]
  33. áO’Brien, R.W. Electroacoustic studies of moderately concentrated colloidal suspensions. Faraday Discuss. Chem. Soc. 1990, 90, 301–312. [Google Scholar] [CrossRef]
  34. Faraji, M.; Yamini, Y.; Rezaee, M. Magnetic nanoparticles: Synthesis, stabilization, functionalization, characterization, and applications. J. Iran. Chem. Soc. 2010, 7, 1–37. [Google Scholar] [CrossRef]
  35. Kim, W.-G.; Kang, H.U.; Jung, K.-M.; Kim, S.H. Synthesis of silica nanofluid and application to CO2 absorption. Sep. Sci. Technol. 2008, 43, 3036–3055. [Google Scholar] [CrossRef]
  36. Koo, J.; Kleinstreuer, C. Impact analysis of nanoparticle motion mechanisms on the thermal conductivity of nanofluids. Int. Commun. Heat Mass Transf. 2005, 32, 1111–1118. [Google Scholar] [CrossRef]
  37. Purser, G.H. Lewis structures are models for predicting molecular structure, not electronic structure. J. Chem. Educ. 1999, 76, 1013. [Google Scholar] [CrossRef]
  38. Vasconcelos, J.M.; Orvalho, S.P.; Alves, S.S. Gas–liquid mass transfer to single bubbles: Effect of surface contamination. AIChE J. 2002, 48, 1145–1154. [Google Scholar] [CrossRef]
  39. Calderbank, P.; Lochiel, A. Mass transfer coefficients, velocities and shapes of carbon dioxide bubbles in free rise through distilled water. Chem. Eng. Sci. 1964, 19, 485–503. [Google Scholar] [CrossRef]
  40. Mishra, P.C.; Mukherjee, S.; Nayak, S.K.; Panda, A. A brief review on viscosity of nanofluids. Int. Nano Lett. 2014, 4, 109–120. [Google Scholar] [CrossRef] [Green Version]
Figure 1. Schematic diagram of experimental set-up.
Processes 07 00393 g001
Figure 2. Plot of pH and its differentiation versus volume of consumed titrant, (HCl), for the injection of 50 mL SO2 through deionized water.
Processes 07 00393 g002
Figure 3. Plot of pH and its differentiation versus volume of consumed titrant, (HCl), for the injection of 50 mL CO2 through deionized water.
Processes 07 00393 g003
Figure 4. Transmission electron microcopy (TEM) images of (a) SiO2, (b) Al2O3 and (c) Fe2O3 nanoparticles.
Processes 07 00393 g004
Figure 5. Average molar flux of CO2 versus mass fraction of metal oxides nanoparticles (NPs).
Processes 07 00393 g005
Figure 6. Average molar flux of SO2 versus mass fraction of metal oxides nanoparticles.
Processes 07 00393 g006
Figure 7. Average molar flux of CO2 versus volume loading rate.
Processes 07 00393 g007
Figure 8. Average molar flux of SO2 versus volume loading rate.
Processes 07 00393 g008
Figure 9. Average molar flux versus CO2 bulk concentration for (a) SiO2/water, (b) Al2O3/water and (c) Fe2O3/water nanofluids.
Processes 07 00393 g009
Figure 10. Average molar flux versus SO2 bulk concentration for (a) SiO2/water, (b) Al2O3/water and (c) Fe2O3/water nanofluids.
Processes 07 00393 g010aProcesses 07 00393 g010b
Figure 11. Schematic diagram of grazing effect of SiO2 nanoparticles during the absorption of SO2.
Processes 07 00393 g011
Figure 12. Effect of relative Schmidt number on relative experimental Sherwood number.
Processes 07 00393 g012
Table 1. Physical properties of the nanoparticles (NPs) used in this study.
PropertiesSiO2 NPsAl2O3 NPsFe2O3 NPs
Molecular weight (g/mol)60.08101.96159.69
Density (g/cm3)2.1963.9805.242
Melting point (°C)171320541539
AppearanceWhite solid powder White solid powderRed-brown solid powder
Table 2. Maximum molar flux and relative absorption rate for SO2 and CO2.
AbsorbentSO2 AbsorptionCO2 Absorption
%   wt .   NPs   in   N m a x N m a x N n f N b f %   wt .   NPs   in   N m a x N m a x N n f N b f
Water (bf) 1.871 × 10−51.000 1.566 × 10−51.000
SiO2/water1.02.983 × 10−51.5940.012.774 × 10−51.771
Al2O3/water0.12.445 × 10−51.3070.12.098 × 10−51.340
Fe2O3/water0.13.312 × 10−51.7701.02.566 × 10−51.638
Table 3. Relative mass transfer coefficient for CO2 and SO2 in the base fluid (BF) and various nanofluids (NF).
GasAbsorbent k L × 10 4 ,   ( m / s ) k L n f k L b f
CO2Water (BF)1.0301.00
Water/SiO2 NF1.9351.88
Water/Fe2O3 NF2.3242.03
Water/Al2O3 NF2.0922.17
SO2Water (BF)1.4501.00
Water/SiO2 NF2.4931.71
Water/Fe2O3 NF2.1861.42
Water/Al2O3 NF2.0631.50
Table 4. Diffusion coefficient as well as Re, Sh and Sc for CO2 and SO2 absorption by using of nanofluids.
GasAbsorbentD, (m2/s) ν   ( m / s ) ScRebSh.
CO2Water/SiO25.38 × 10−98.899 × 10−71651298234
Water/Fe2O37.76 × 10−98.864 × 10−71141303195
Water/Al2O36.28 × 10−98.451 × 10−71351367217
Deionized water2.12 × 10−98.900 × 10−74201298316
SO2Water/SiO28.89 × 10−98.706 × 10−7981327182
Water/Fe2O36.85 × 10−98.864 × 10−71291303207
Water/Al2O36.12 × 10−98.852 × 10−71451305219
Deionized water5.27 × 10−98.900 × 10−71691298179

