1. Introduction and Background
For many centuries, exhaustible fuels formed the basis of meeting most of the world’s energy demands. The continuous increment in the world’s population and technological development has led to an extensive and incremental utilization of fossil fuels [
1]. The increasing concentrations of the greenhouse gases in the Earth’s atmosphere due to human activities has resulted in global warming and related climate change. Burning of fossil fuels is one of the major activities leading to the emission of greenhouse gases [
2]. Therefore, these reasons generate a need of transition from fossil fuels to renewable energy sources over the coming decades. Indeed, one of the biggest challenges facing humankind over the next few years is decreasing dependence on fossil fuels (such as natural gas) and their by-products and controlling the emission of greenhouse gases responsible for climate change. In other words, it is necessary to make a shift towards a sustainable energy economy [
3].
One of the versatile, sustainable, and scalable forms of energy storage is hydrogen [
4,
5]. Hydrogen could act as an energy carrier and prove as an alternative to petroleum products [
6,
7]. Moreover, hydrogen is capable of producing electricity via electrochemical reaction when used in a fuel cell [
8]. A fuel cell is an electrochemical device capable of converting the chemical energy of the reactants into electricity [
9]. The proton exchange membrane (PEM)-unitized regenerative fuel cell URFC contains a proton exchange membrane as an electrolyte (commonly known as membrane electrode assembly (MEA)) and operates at room temperature. Hydrogen can be stored in the form of gas under high pressure, liquid at cryogenic temperatures, and as a chemical compound known as solid-state or electrochemical storage. Electrochemical hydrogen storage is safer compared to its peer storage forms [
10] and has attracted the maximum attention of researchers. However, the best reported figure of electrochemical hydrogen storage is less than U.S. department of energy (DOE) targets. Conventional hydrogen production and storage system involves an electrolyzer, gas compressor, and fuel cell. Having lots of mechanical components results in lower round-the-trip efficiency. Therefore, a URFC was introduced by Bahaman and Andrews in 2015 [
11] that involved dependency on a gas storage system and incurred energy expenditure, which became the key limitation of the system. To overcome this limitation of the URFC, a modified URFC was introduced in 2015 by Professor John Andrews and Saeed Seif Mohammadi and they called it as a proton battery [
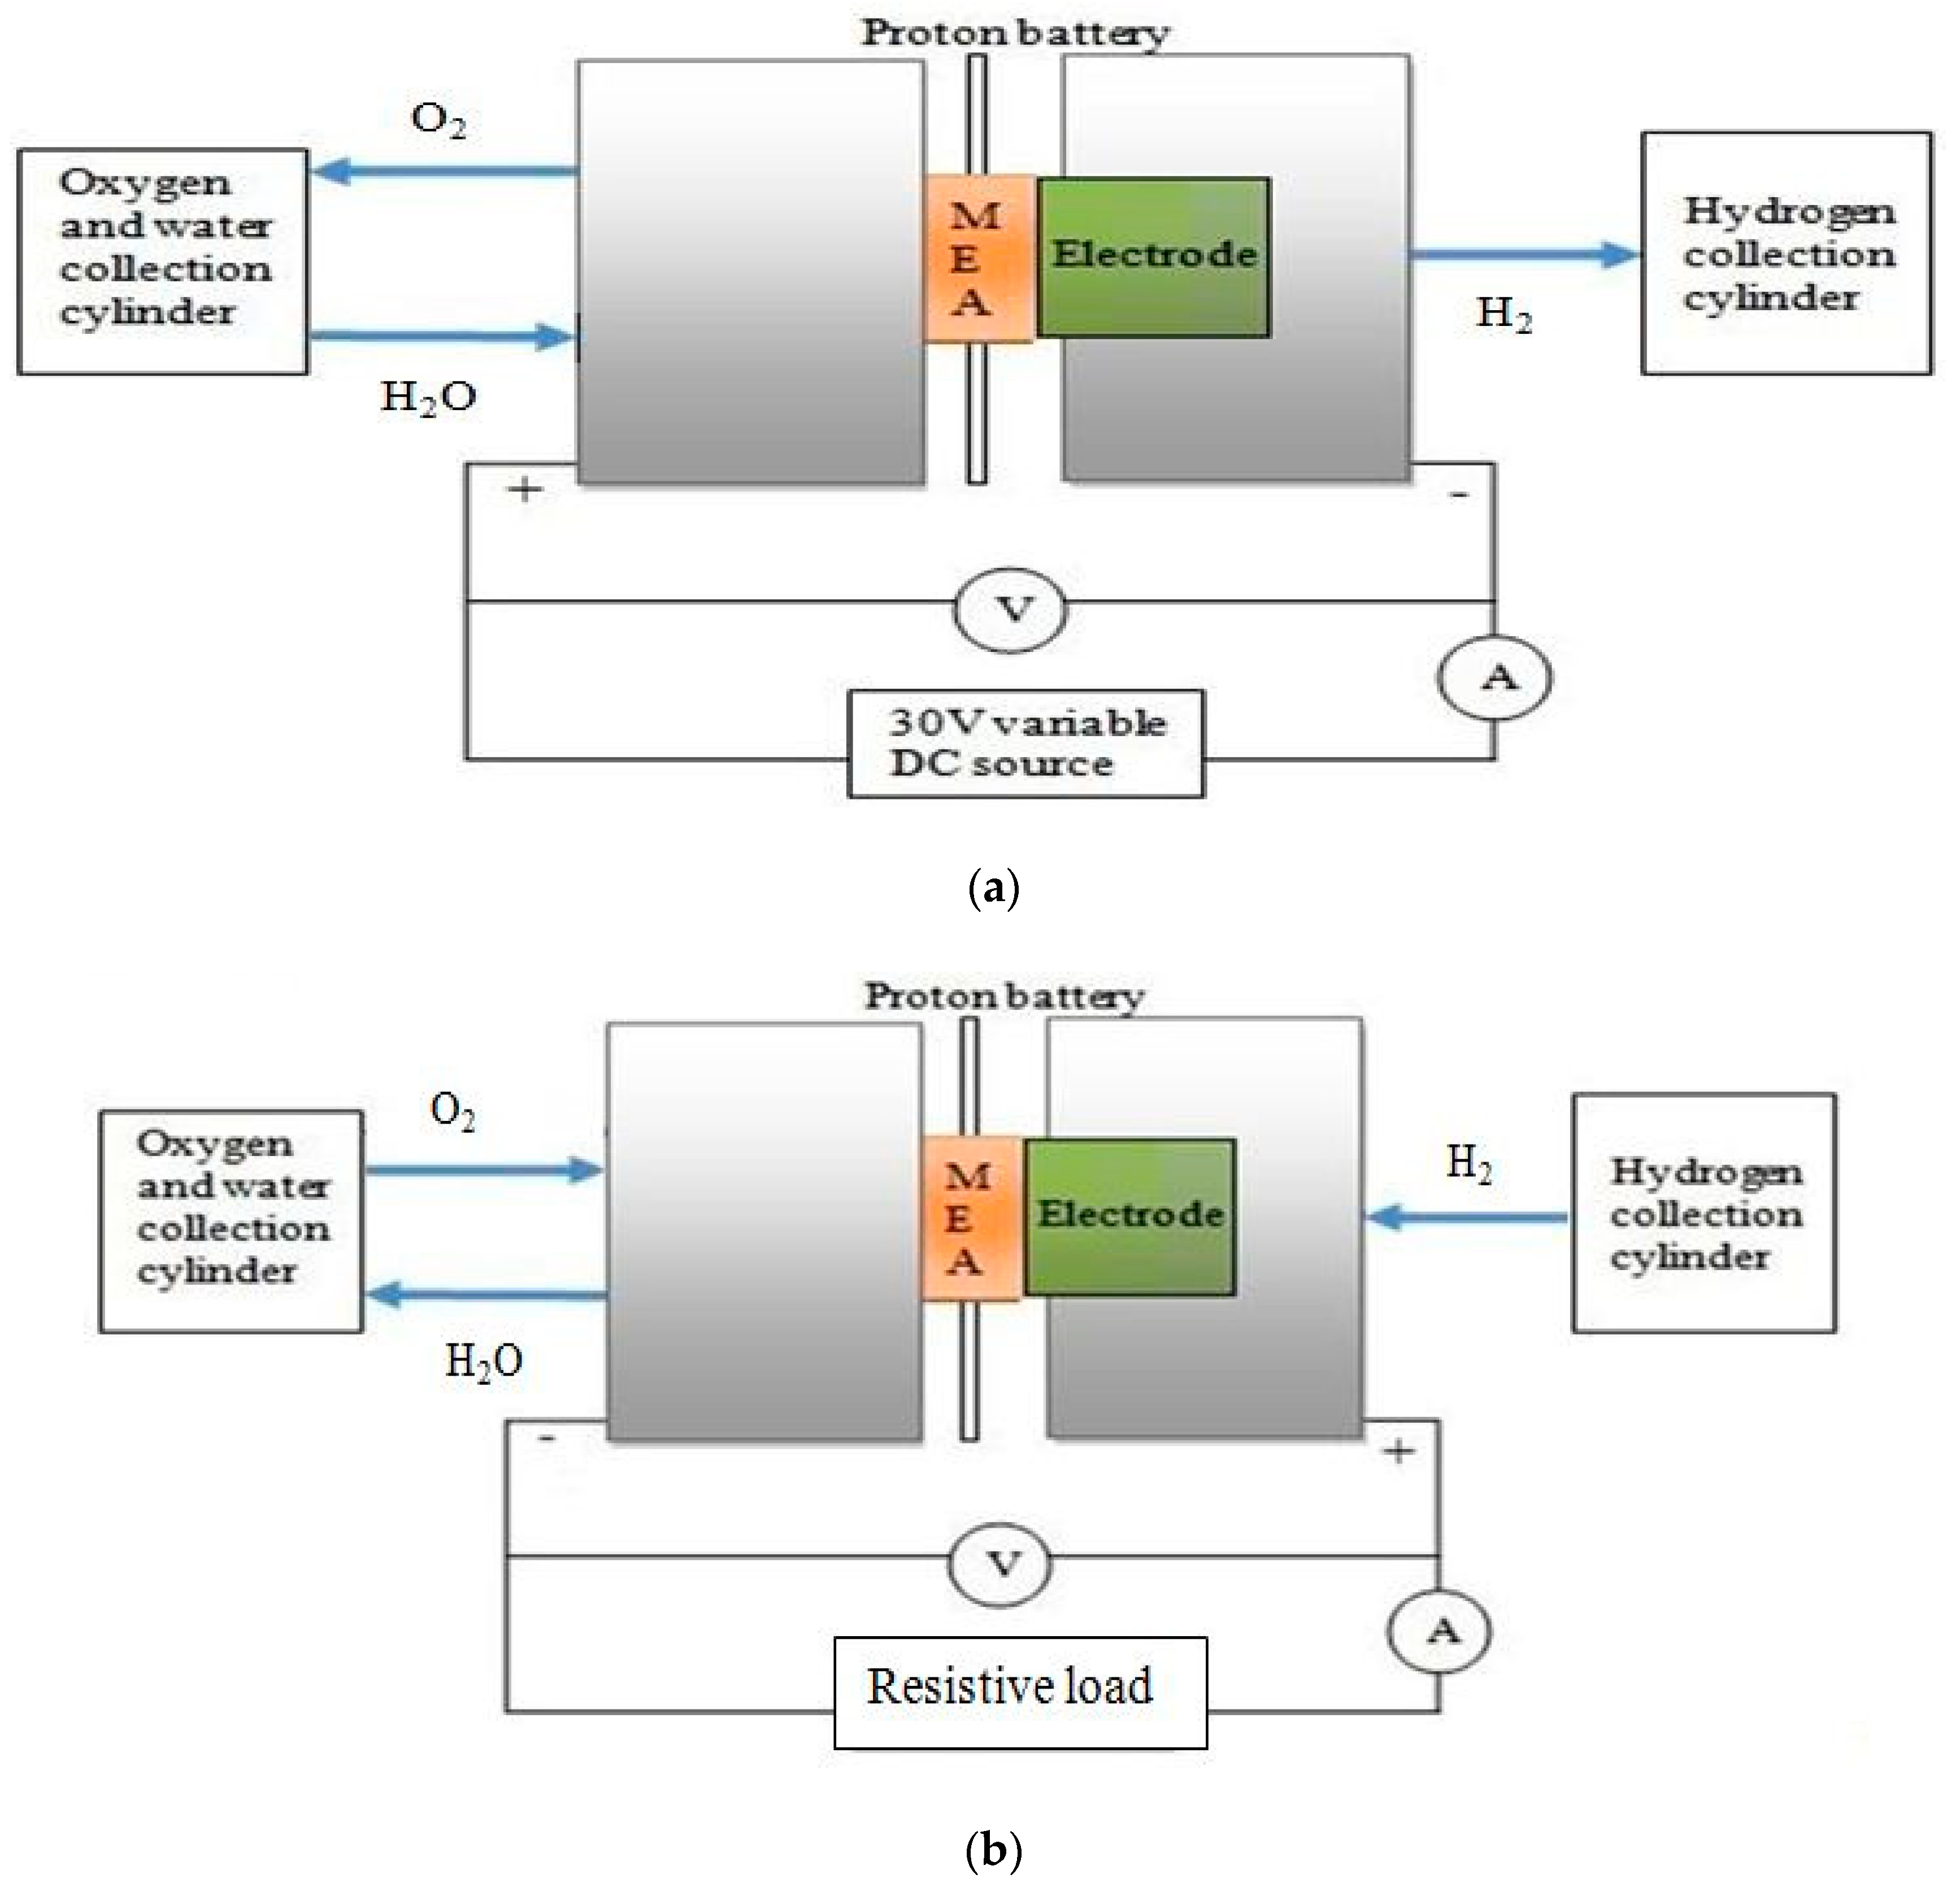
12]. Proton battery is a modified URFC that could run as an electrolyzer to generate hydrogen from water, and store hydrogen in ionic form and fuel cells to give electricity and water. A schematic of charging (electrolysis mode) and discharging (fuel cell mode) of modified URFC or proton battery with hydrogen ion is shown in
Figure 1 and
Figure 2, respectively.
In the earlier research work, aAB
5-type metal hydride electrode was used for the storage of hydrogen within a modified URFC, but the stored hydrogen formed strong chemical bonds with the storage medium and failed to come out [
12]. Additionally, AB
5 reportedly encourage the formation of hydrogen gas, which is to be discouraged in the operation of a modified URFC [
13]. The authors did manage to store 1 wt% of hydrogen in a porous AB
5-based electrode, but no significant signs of hydrogen discharge are reported [
12]. Moreover, metal hydride being heavy, costly, and having low degree of reversibility were replaced by carbon. In 2013, Javad Jazaeri reported on testing of a composite activated carbon–nafion (aC-nafion) electrode, instead of AB
5 metal hydride, in a modified URFC for electrochemical hydrogen storage [
14]. Carbon has a large internal pore surface area, ease of availability, low cost, and is light weight; it has been considered as a suitable alternative for further research work. However, no sign of electrochemical hydrogen storage was reported by Jazaeri with an explanation that nafion (chemically known as perfluorosulfonic acid), which served as the proton conducting medium within the activated carbon electrode, failed to penetrate in aC due to its larger molecular size [
14]. Therefore, further research focused on the use of liquid proton conducting mediums within the porous storage electrodes [
15]. Heidari S. et al. in 2018 reported on achieving nearly 1 wt% of electrochemical hydrogen storage in an acid-soaked aC electrode during charging and 0.8 wt% during discharging [
15]. As per the literature [
16,
17,
18,
19,
20], multi-walled carbon nanotubes (MWCNT)is a form of carbon that has potential to store hydrogen, but its technical feasibility for electrochemical hydrogen storage within a proton battery or a modified URFC is yet to be proven. The aim of this paper is; therefore, to investigate experimentally the electrochemical hydrogen storage capacity of a solid MWCNT-based electrode when integrated in a modified URFC or proton battery.
2. Experiment and Materials
Details regarding materials used to conduct this experiment have been mentioned in
Table 1.
2.1. Fabrication of MWCNT Electrode
The specification of MWCNT used in this experiment is listed in
Table 2. For fabrication of the electrode, a measured quantity of MWCNT was mixed with 19.25% of egg white (used as binder) to prepare the electrode. The mixture of egg white and MWCNT was mixed well and poured into a mold to attain a desired shape. Egg whites consist of 90% water, which, when evaporated, leaves behind the building material to bind up together the powdered MWCNT particles [
21]. It was just enough to bind the MWCNT particles and any excess of the binder could cover-up the pores of MWCNT particles, which are active sited for H-storage. After evaporating the moisture content of the mixture in the sun for 2 days, the electrode was ready, as shown in
Figure 3a. The mold used for casting the electrode (shown in
Figure 3b) was designed and 3D printed with specifications 25 × 25 × 2 mm.
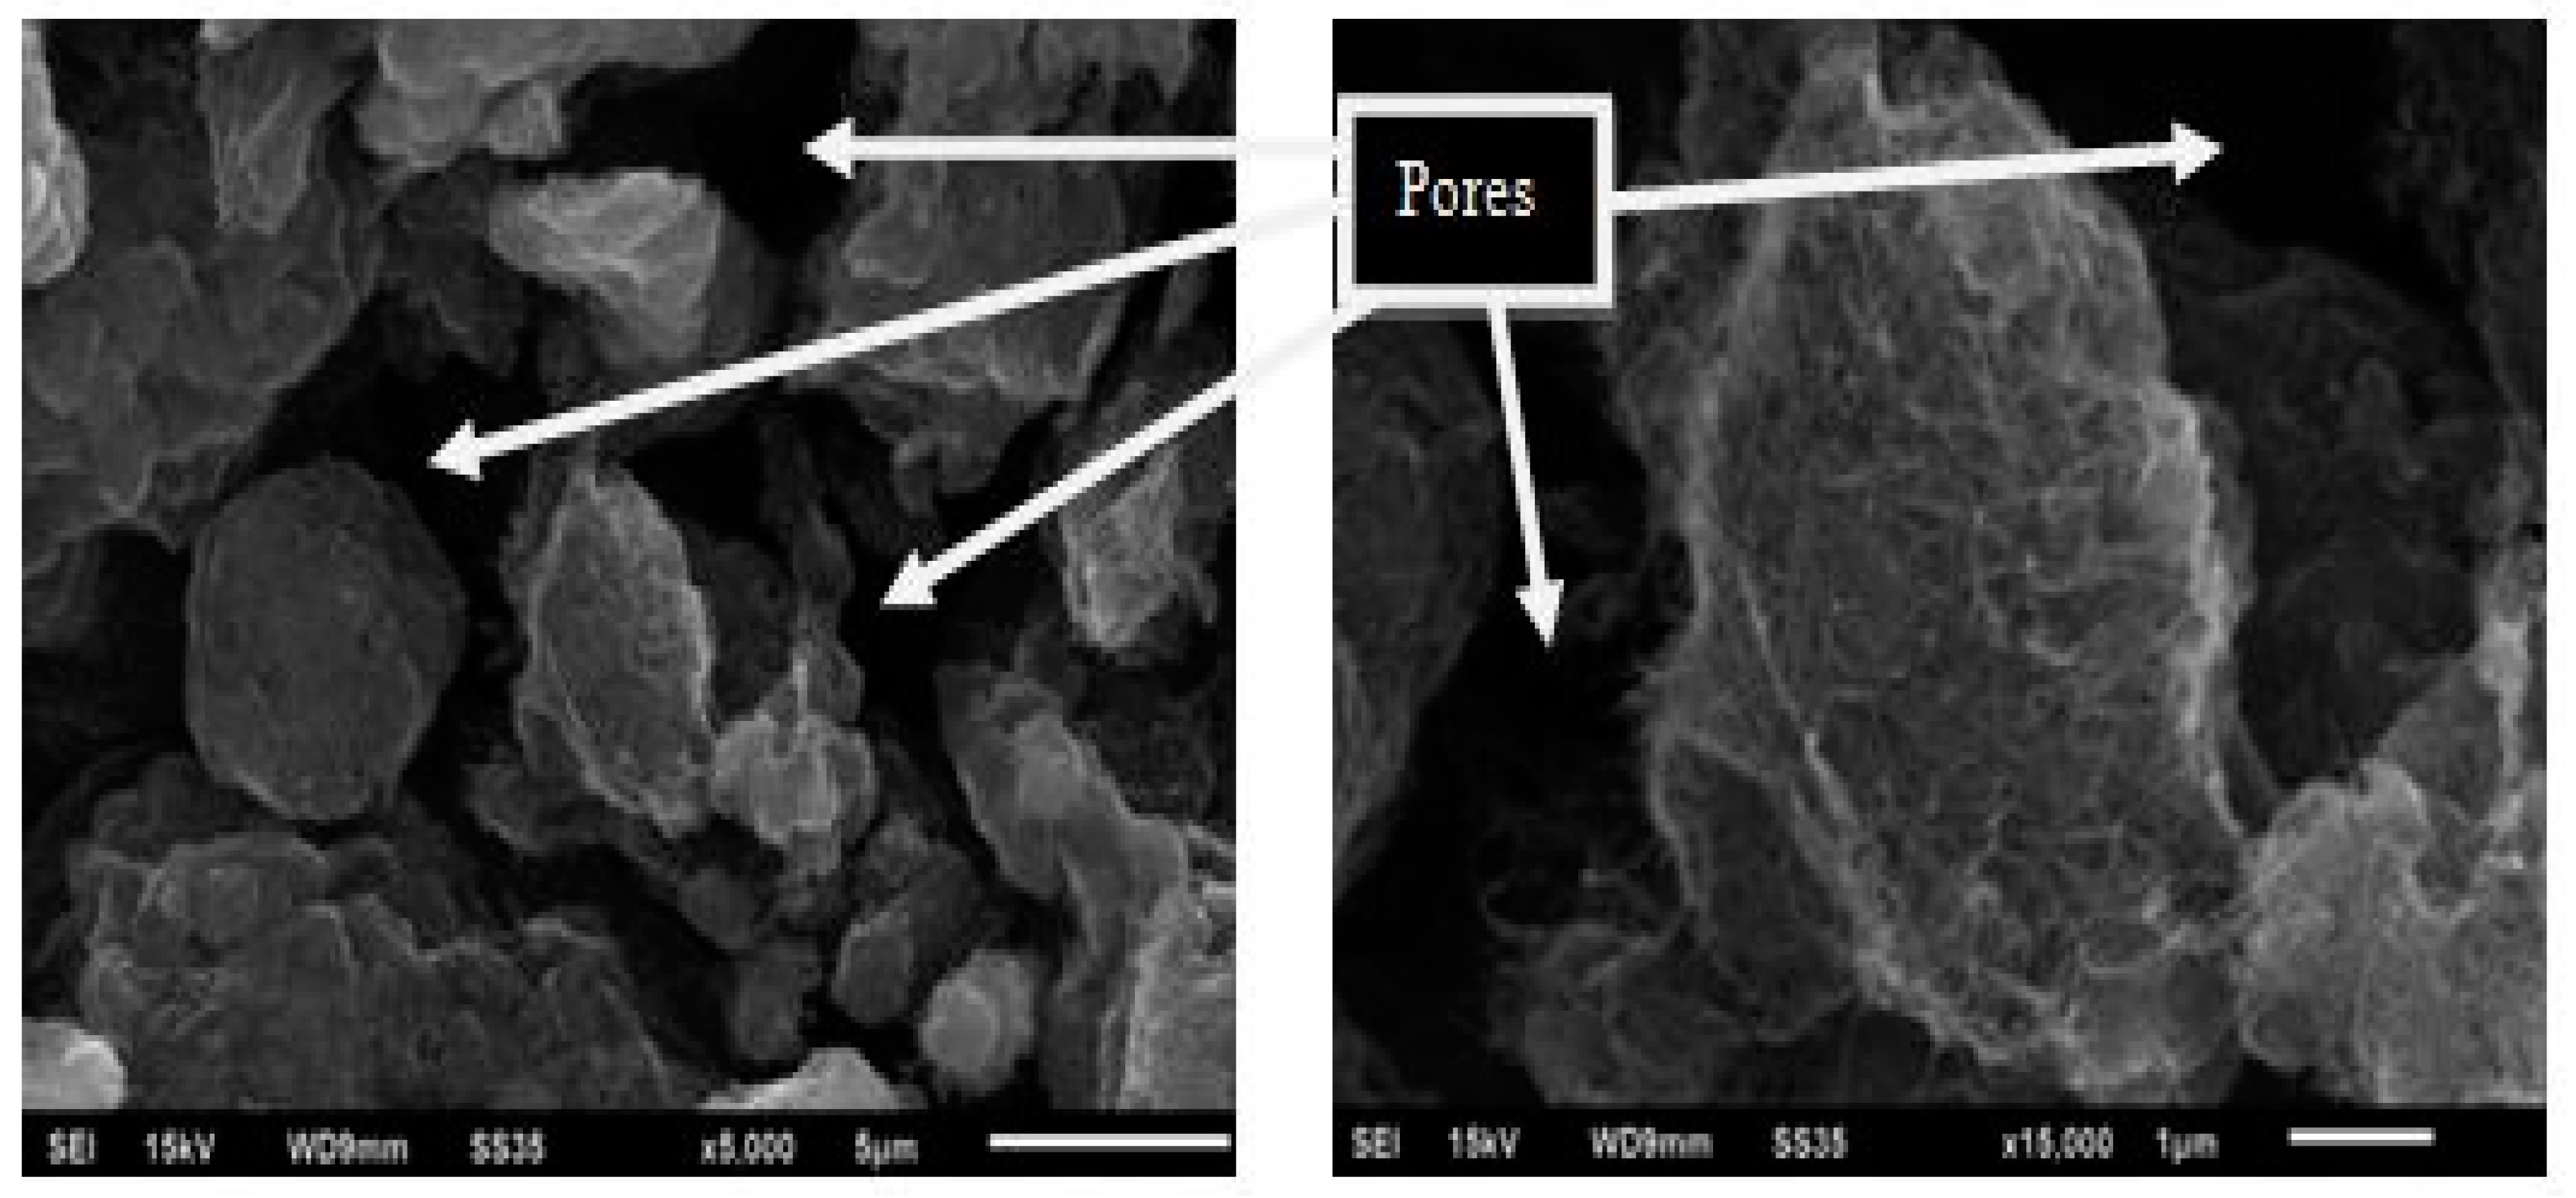
In case of solid-state hydrogen storage, pores play an important role. The porosity of the electrode can be ascertained from
Figure 4, which is a scanning electron microscopy (SEM) image of the MWCNT electrode.
Pores are classified according to their size [
22].
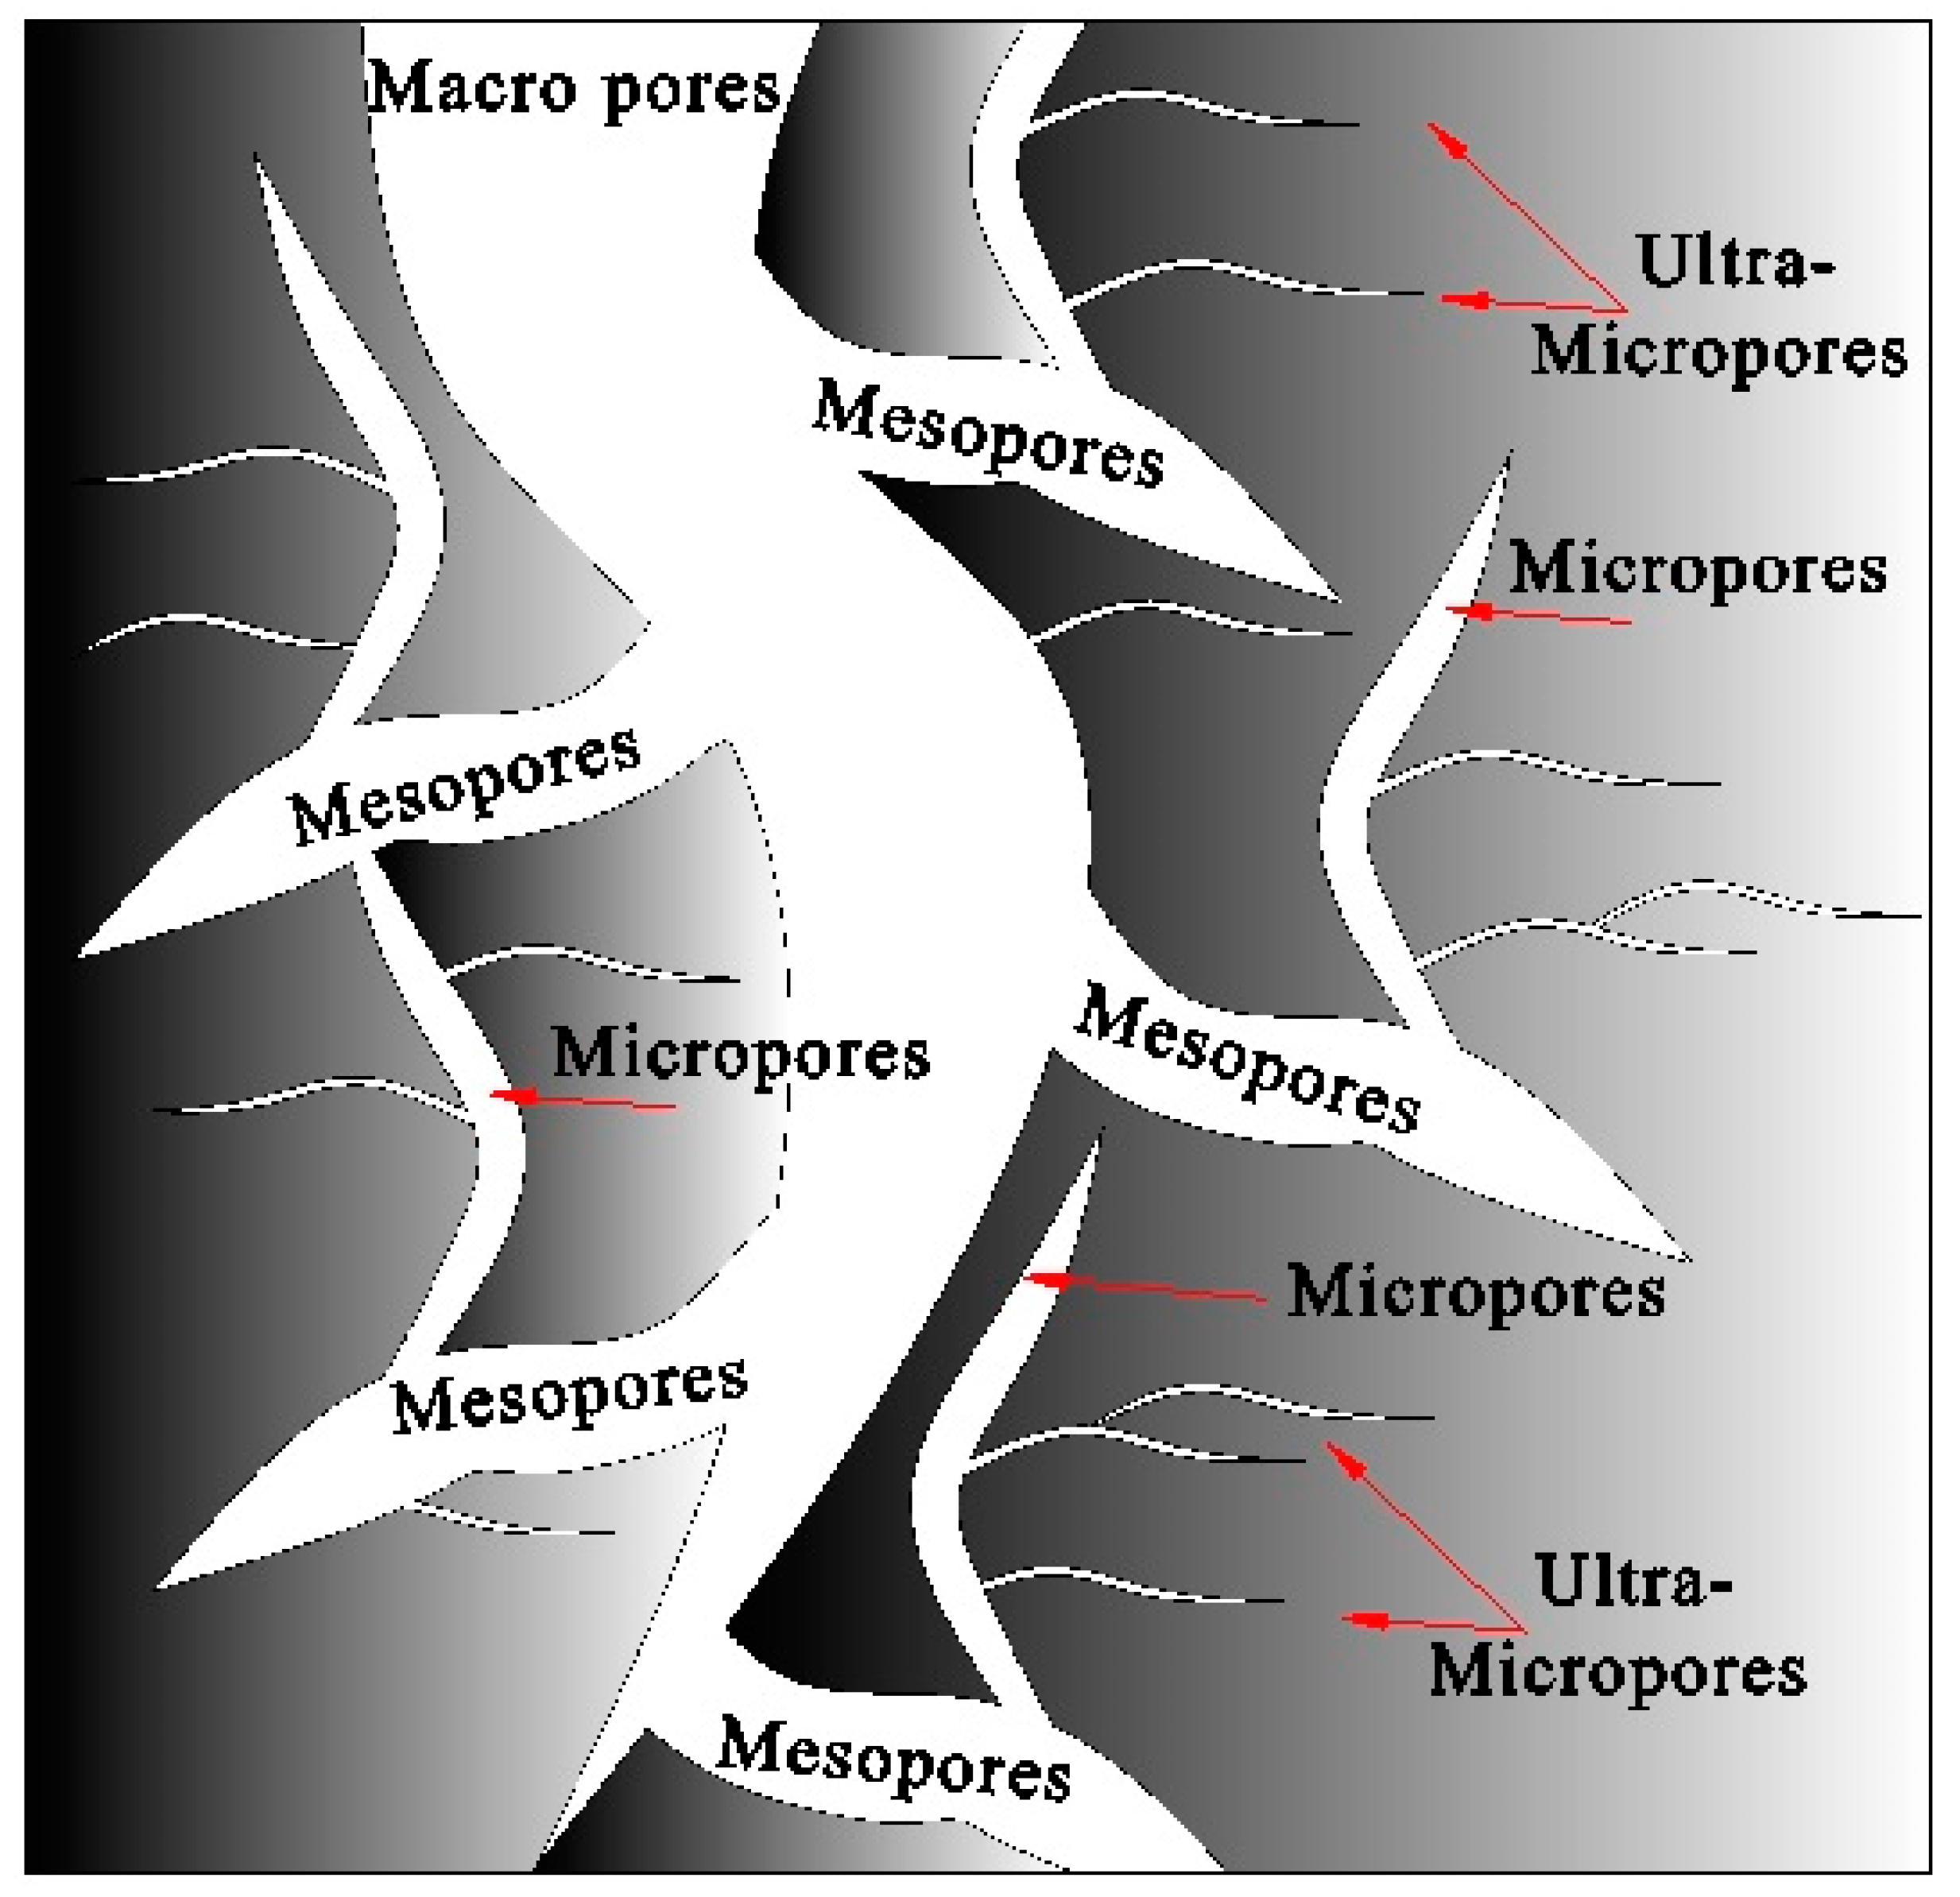
Table 3 classifies different types of pores along with their sizes. The pores are interconnected, as shown in
Figure 5, and are the sites for electrochemical hydrogen storage. The major amount of hydrogen stored in solid state is in ultramicropores [
23].
Egg white, being an organic binder, has a major component of carbon and oxygen. From the EDS (energy dispersive spectroscopy), as mentioned in
Table 4, the carbon content of the electrode was found to be 84.16%. As the egg white used was 19.25%, the rest was MWCNT, thus the carbon content of the porous electrode should be more than 80.75%. The presence of other elements was because of the egg white which is an organic protein.
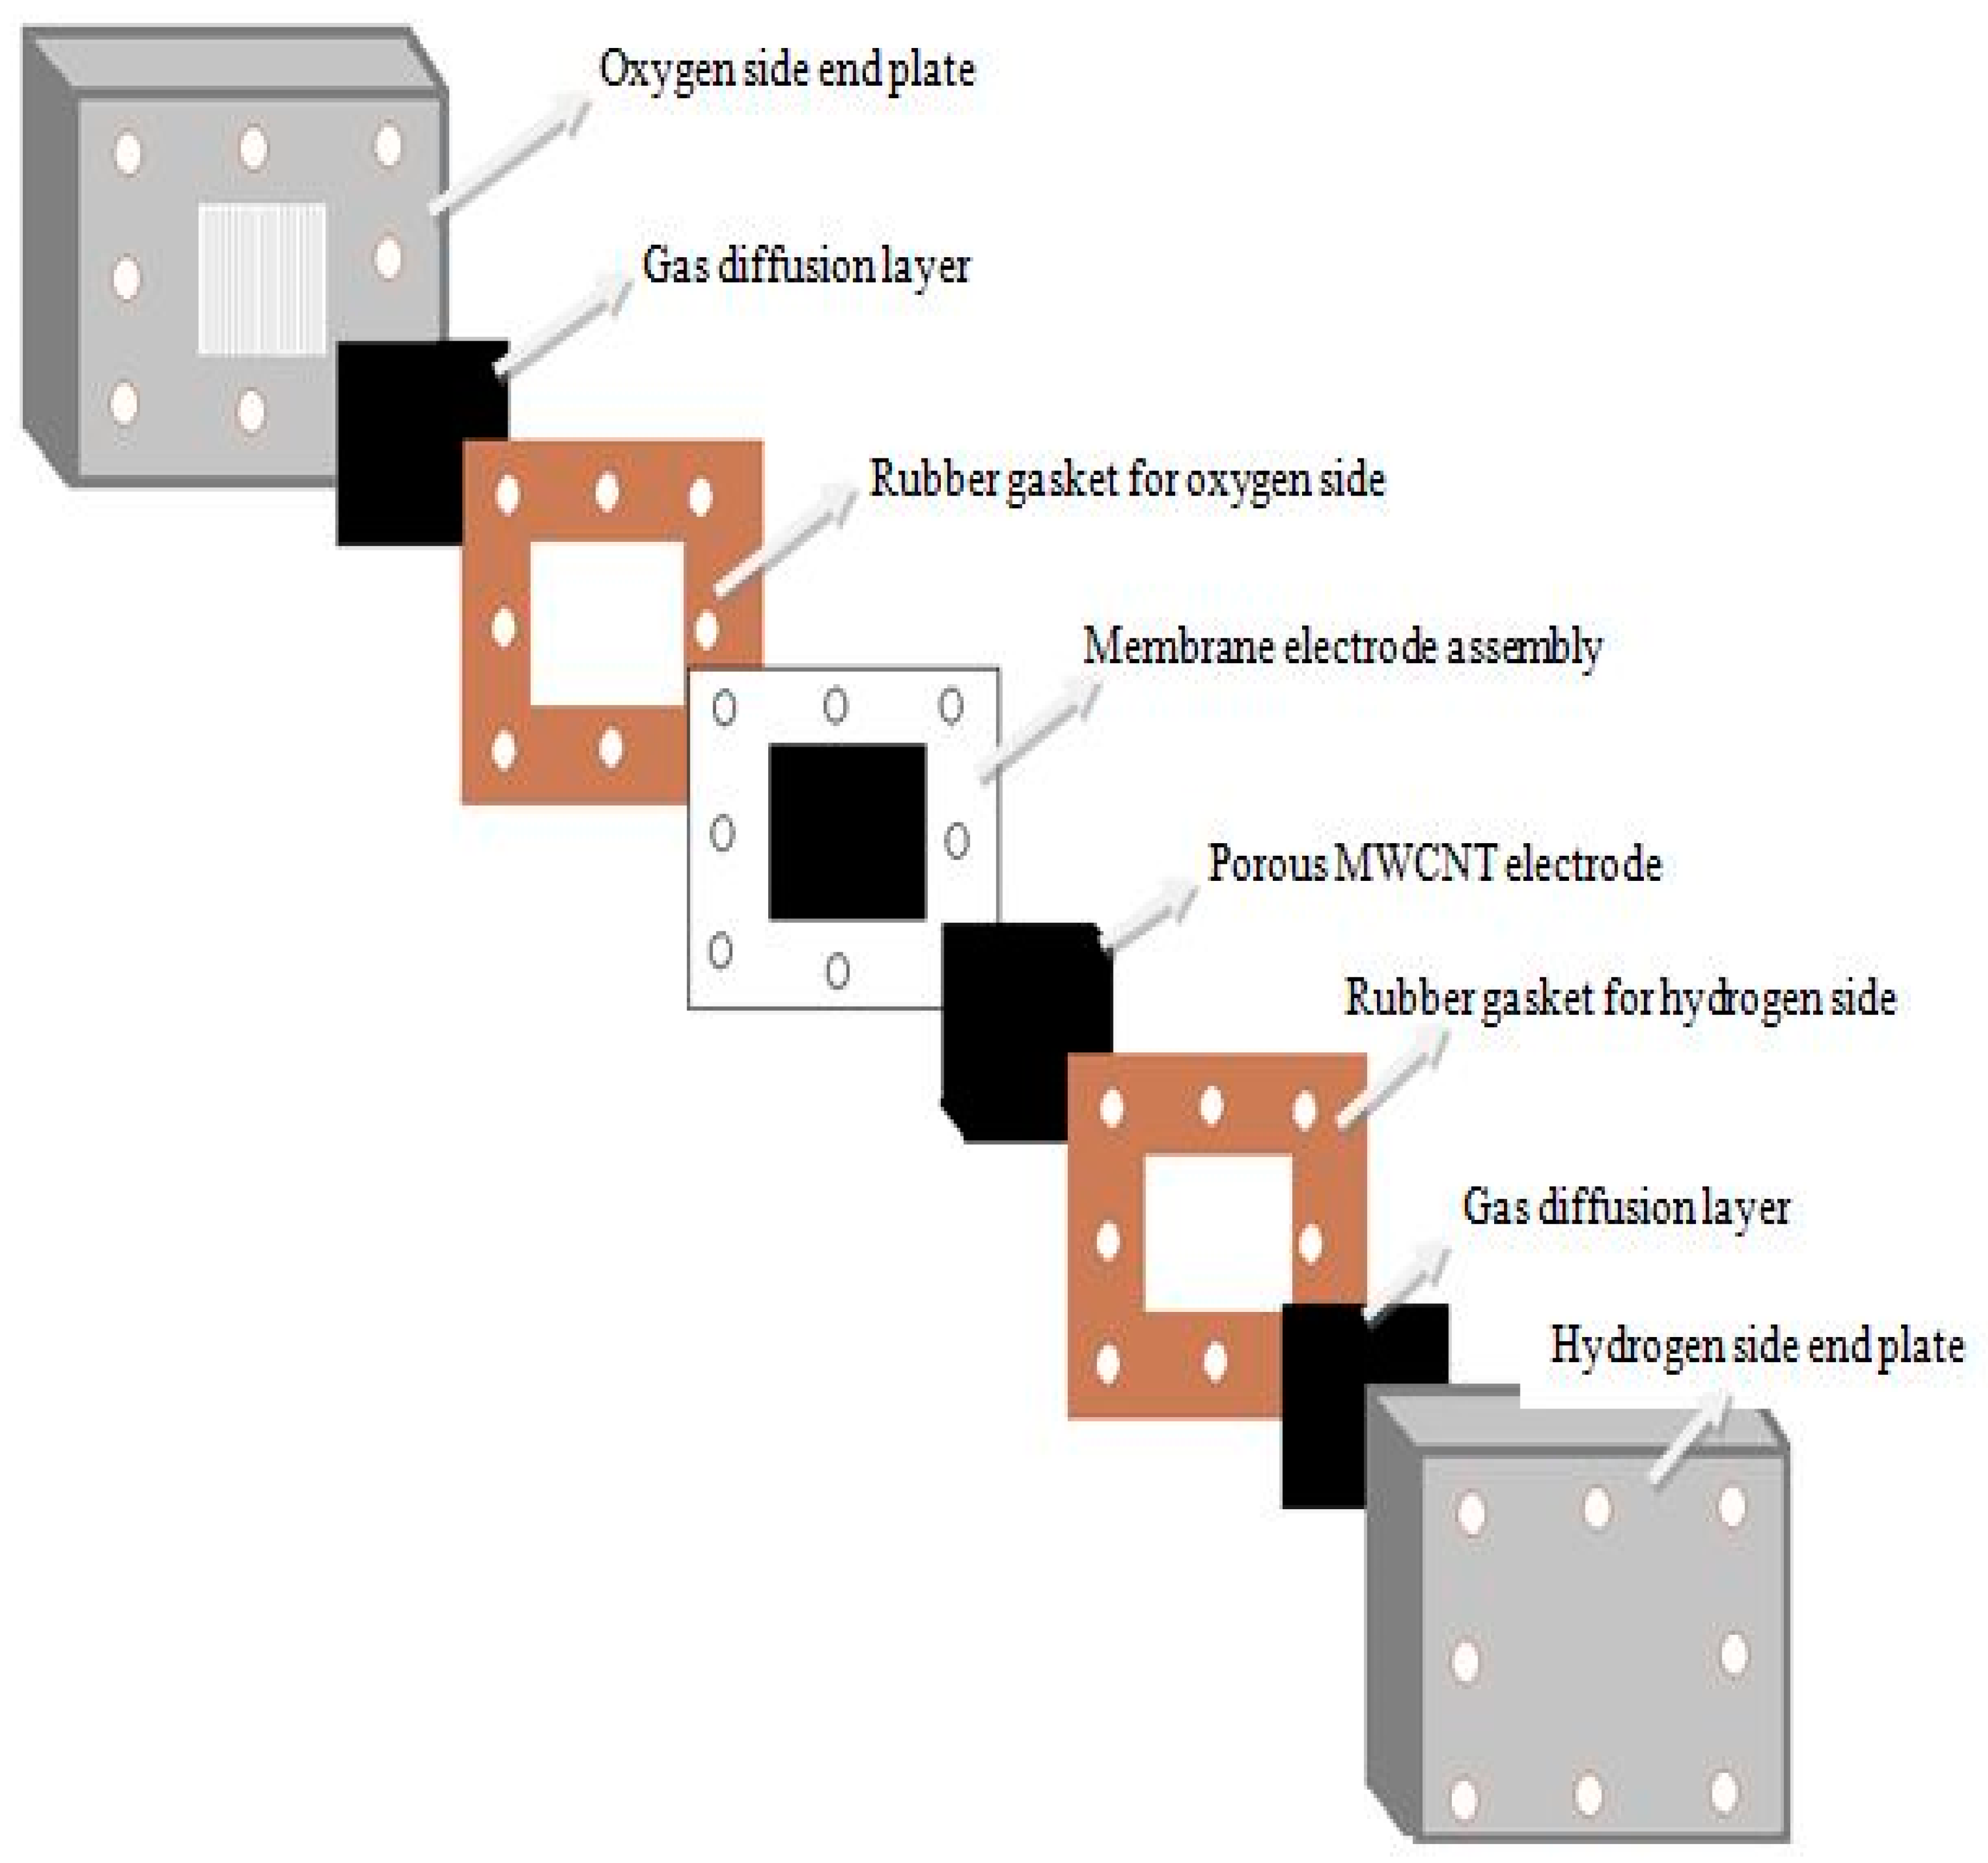
2.2. Fabrication of Modified URFC
The modified URFC was fabricated with the constituter parts: membrane electrode assembly, bi-polar end plates, gas diffusion layer, rubber gasket, and MWCNT electrode. Membrane electrode assembly (MEA) consists of a proton exchange membrane and catalyst for the oxygen and hydrogen sides. The presence of a catalyst helps in initiating the breakdown of water at the anode side during charging (electrolysis mode), and the release of electron along with proton from the electrode during discharging (fuel cell mode). In this experiment, the MEA was a reversible type with catalyst loading on the oxygen side as iridium oxide plus platinum black, and on the hydrogen side the loading was of platinum black. Nafion 117 was used as a proton exchange membrane in modified URFC. On performing SEM test on MEA (shown in
Figure 6), it was found that catalyst loading on MEA was evenly distributed, which favors the controlled water dissociation and hydrogen redox reaction. The active area of MEA was 25 mm × 25 mm, which was equal to the size of the electrode. In order to check the presence of impurity in MEA, EDS test was performed on the anode and cathode sides, as mentioned in
Table 5 and
Table 6, respectively. No substantial impurity was found on both sides of MEA.
The bi-polar end plates of modified URFC, shown in
Figure 7, are generally made up of metals such as stainless steel, titanium, or metallic alloys. The end plates should have high thermal conductivity, high electrical conductivity, high resistance to corrosion, low permeability to gas, high mechanical strength, and low mass. Stainless steel metallic (SS316) plates are widely used for research activity because they have low cost, ease of manufacturing, high thermal and electrical conductivity, and good mechanical properties. The end plate contains header and flow channels that provide path for oxygen flow to the oxygen side of the membrane and the removal of hydrogen to other side. The flow channels present on both the anode and cathode side end plates were of serpentine design and were identical except for the number openings in the headers. The oxygen side end plate or anode end plate consisted of three openings in the header—one for water inlet, one for oxygen gas outlet, and the third one for oxygen gas inlet, required while discharging the cell. On the other hand, the hydrogen side end plate or cathode end plate had two openings in the header—one for the hydrogen gas outlet and another for the hydrogen gas inlet, if required to enhance the reaction rate while discharging. The active area for activated carbon and electrode assembly was 25 × 25 mm. The end plates on both sides had the same dimensions (i.e., 72 × 84 mm), but varied in thickness. End plate on the hydrogen side was 9 mm thick to accommodate the electrode, whereas the oxygen side end plate was 7 mm thick. The flow channel plays an important role in proper and even circulation of reactant gases on the electrode, as well as in the removal of water from the electrode [
24].
Figure 7 shows the oxygen and hydrogen side end plates along with their flow channels.
Gas diffusion layer plays important part in a modified URFC. It provides the function of: MEA mechanical support, allowing diffusion of gas in and out of active areas, and protecting the catalyst from erosion and corrosion. Carbon cloth (CC) has been used as gas diffusion layer (GDL) for the hydrogen and oxygen sides of the electrode. The active area of carbon cloth was 2.5 × 2.5 cm2 same as that of the porous electrode and MEA.
2.3. Testing
To test MWCNT electrode’s electrochemical hydrogen storage capacity, modified URFC was assembled as shown in
Figure 8. The porous electrode was soaked in 0.2 mL of 1M dilute sulfuric acid (dilute); this was done in order to provide a conductive medium for protons inside the MWCNT electrode. The MEA and rubber gasket was sealed with silicone gel in order to avoid any leakage of gas. For electrical separation of the oxygen and hydrogen sides, nut and bolt assembly was covered with insulating sleeves along with plastic washers.
The setup also included gas collection cylinders for the hydrogen and oxygen sides. The cell was connected to two separate gas collection cylinders (shown in
Figure 9) each, for oxygen and hydrogen gas.
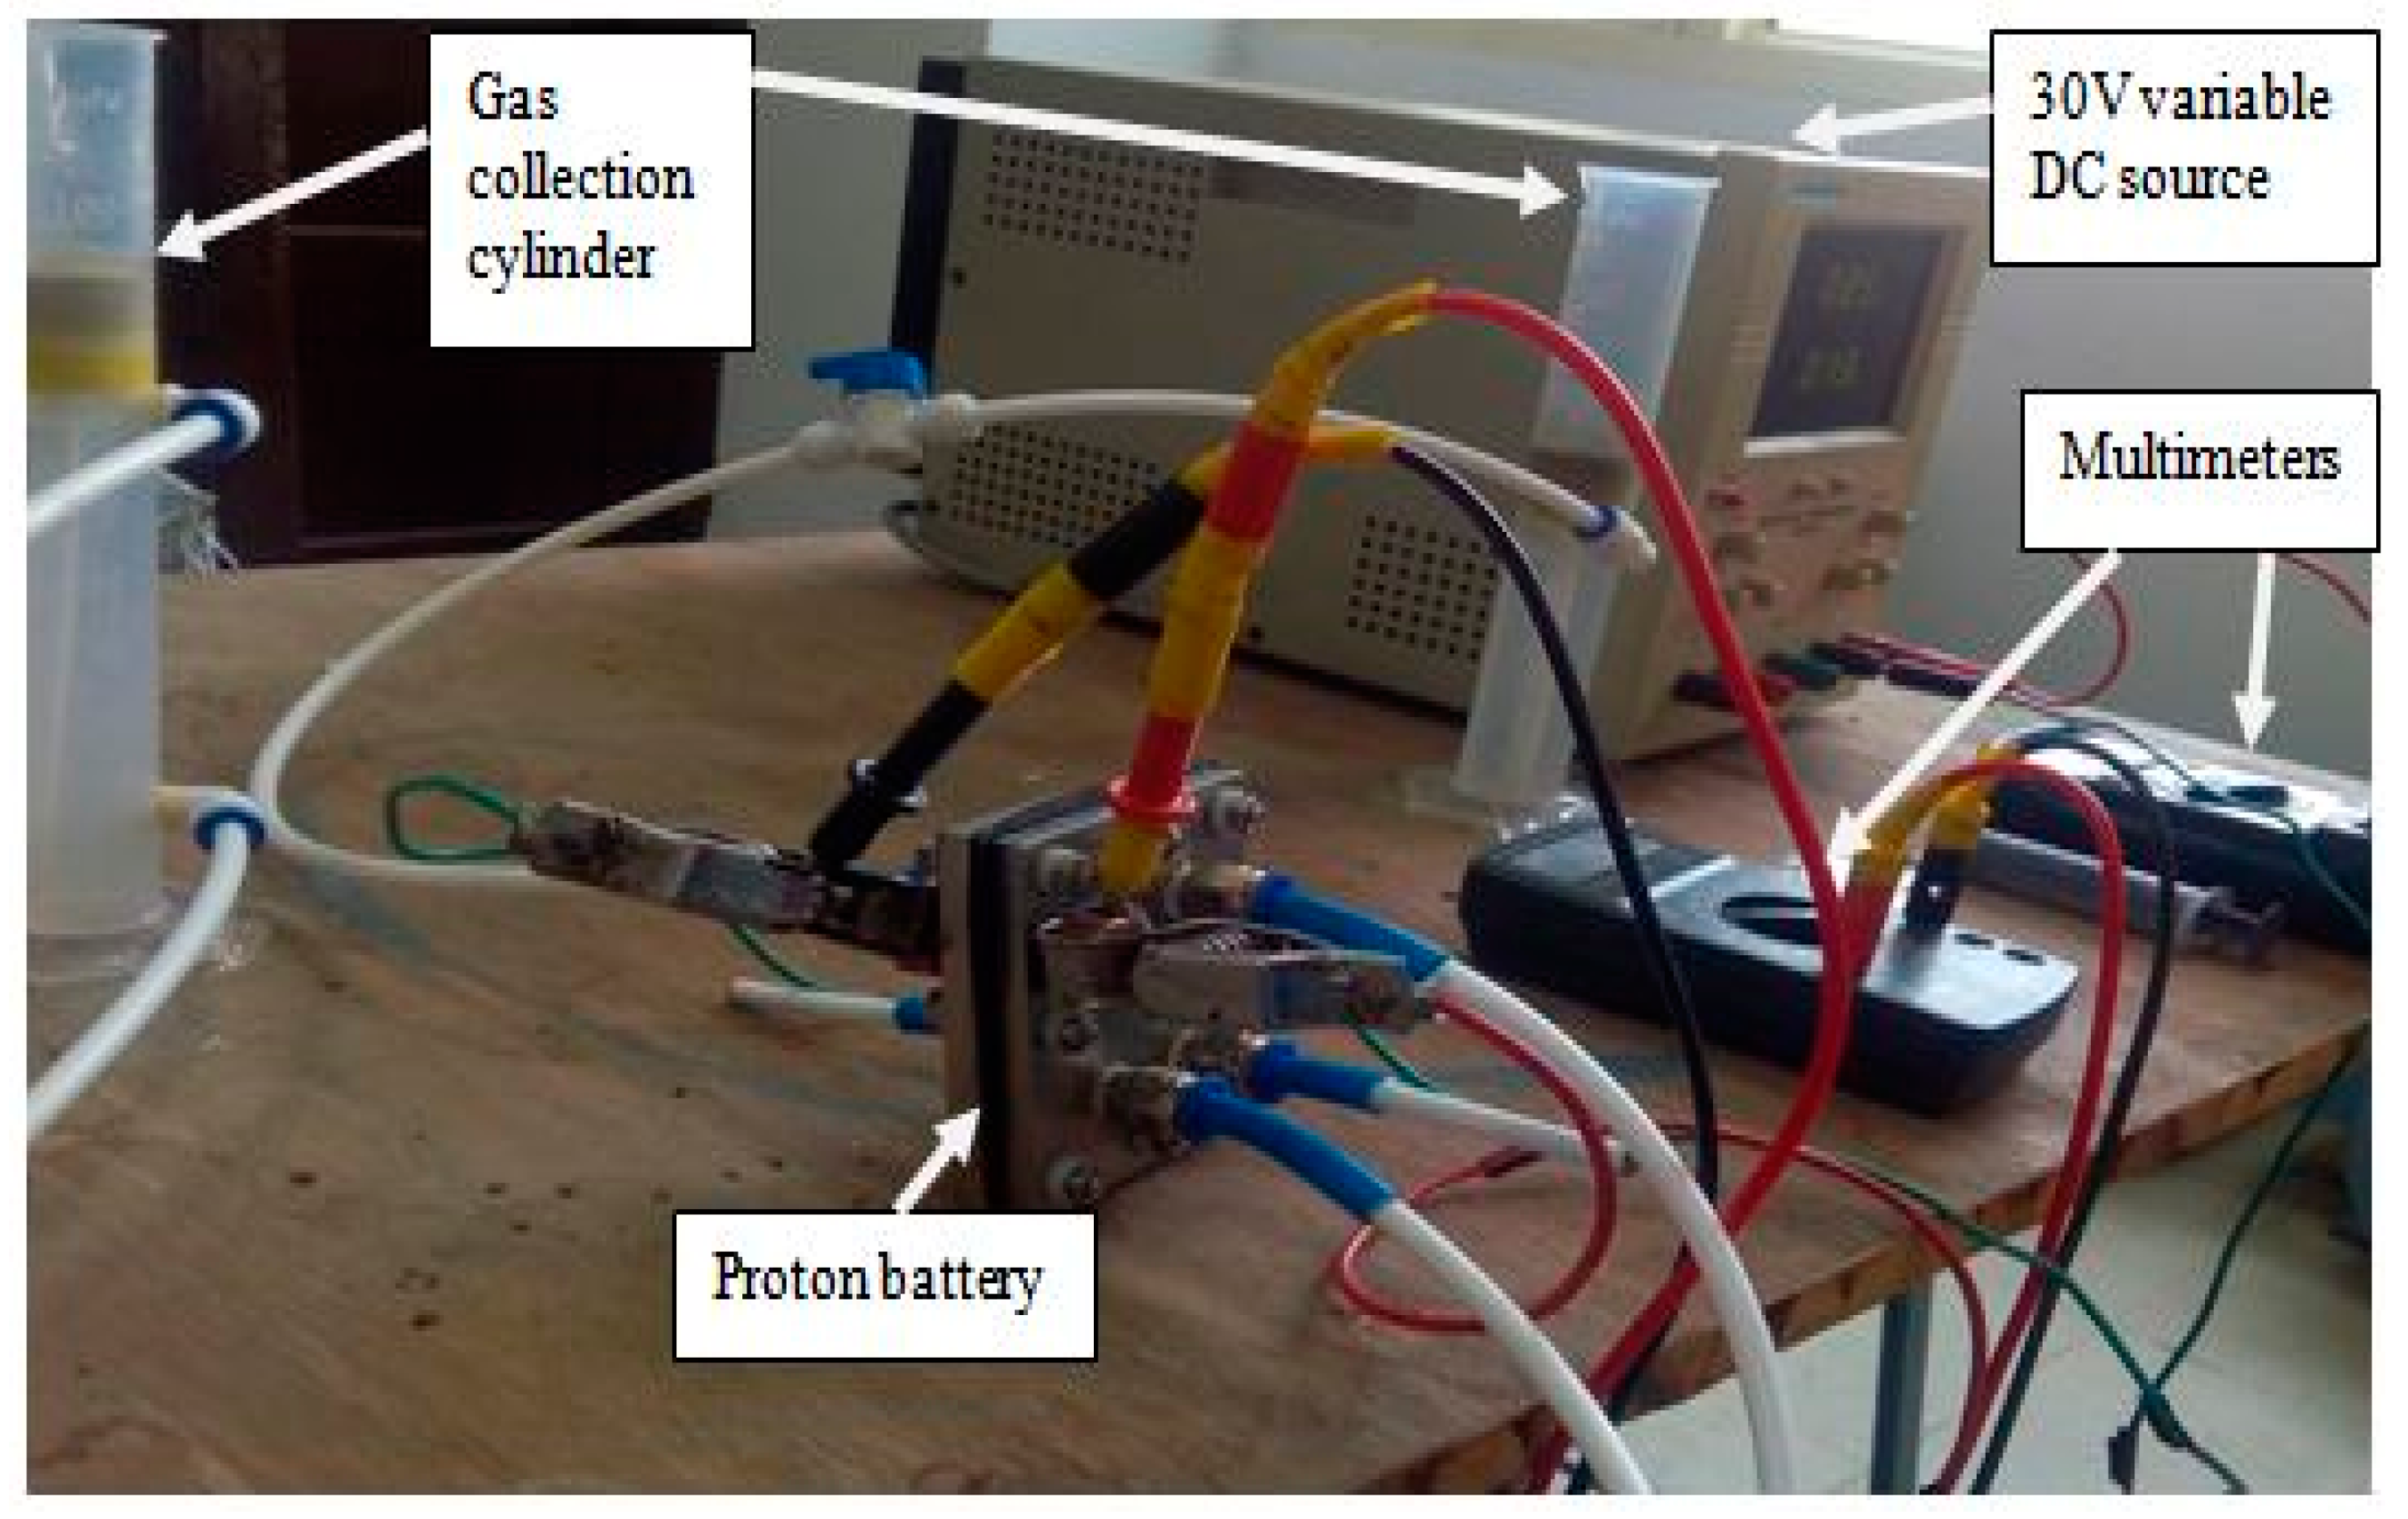
The experimental setup of the modified URFC or proton battery is shown in
Figure 10 along with schematic diagram in
Figure 11. The oxygen side of the proton battery had three outlets, two for oxygen and one for water intake. On the hydrogen side, there were two vents for extraction of hydrogen gas. In the process of electrolysis, the water inlet was connected to the lower vent of the anode side end plate, oxygen was collected from the upper vent, and the third vent was blocked. On the hydrogen side, the upper vent was used as hydrogen outlet, whereas the bottom vent was blocked. A variable 30 V DC source was used to supply electric charge in the case of electrolyzer mode of the modified URFC. Two multimeters were used to measure the voltage across and current through the cell.
For galvanostatic charging, the potential across the battery was initially kept at 1.5 V and increased by 0.1 V after every half hour. With the rise in potential, the current across the battery increased. The potential of battery was raised till rapid evolution of hydrogen gas was observed in the gas collection cylinder indicating that the storage was full. The operation was stopped thereafter. Water supplied was dissociated into oxygen, H+, and electron under the influence of electric potential and catalyst. The produced oxygen gas was allowed to move out of the cell and was collected, whereas H+ passed through the polymer membrane (Nafion 117 in this case) and electron travelled through the electrical circuit. Hydrogen ions emerging on the polymer membrane at cathode get stabilized with electron before entering into the porous storage electrode (MWCNT electrode in this case). Hydrogen atoms get adsorbed in the MWCNT electrode either by forming a weak chemical bond on the internal surface of pores (called chemisorption) or by getting physically adsorbed inside the tiniest pores (ultramicropores) due to Van der Waals forces.
The experimental set up was made to rest for one hour after charging process for discharging. While discharging, the cell was connected to an electrical load in order to start drawing current out of it. Under the influence of potential difference, the weak surface chemical bond breaks up and the hydrogen atom comes out of the storage. Here hydrogen reduction (HRR) reaction takes place, in which the platinum black catalyst breaks the hydrogen atom into H+ and electron. Hydrogen ion and electron travels back towards the oxygen side through the membrane and the electrical circuit, respectively; where they react with the oxygen produced while charging to reform water. The weight of the produced oxygen and hydrogen and the charging and discharging capacity in mAh/g were recorded and used later in calculation to ascertain the electrochemical hydrogen storage capacity of the fabricated MWCNT electrode.
3. Results
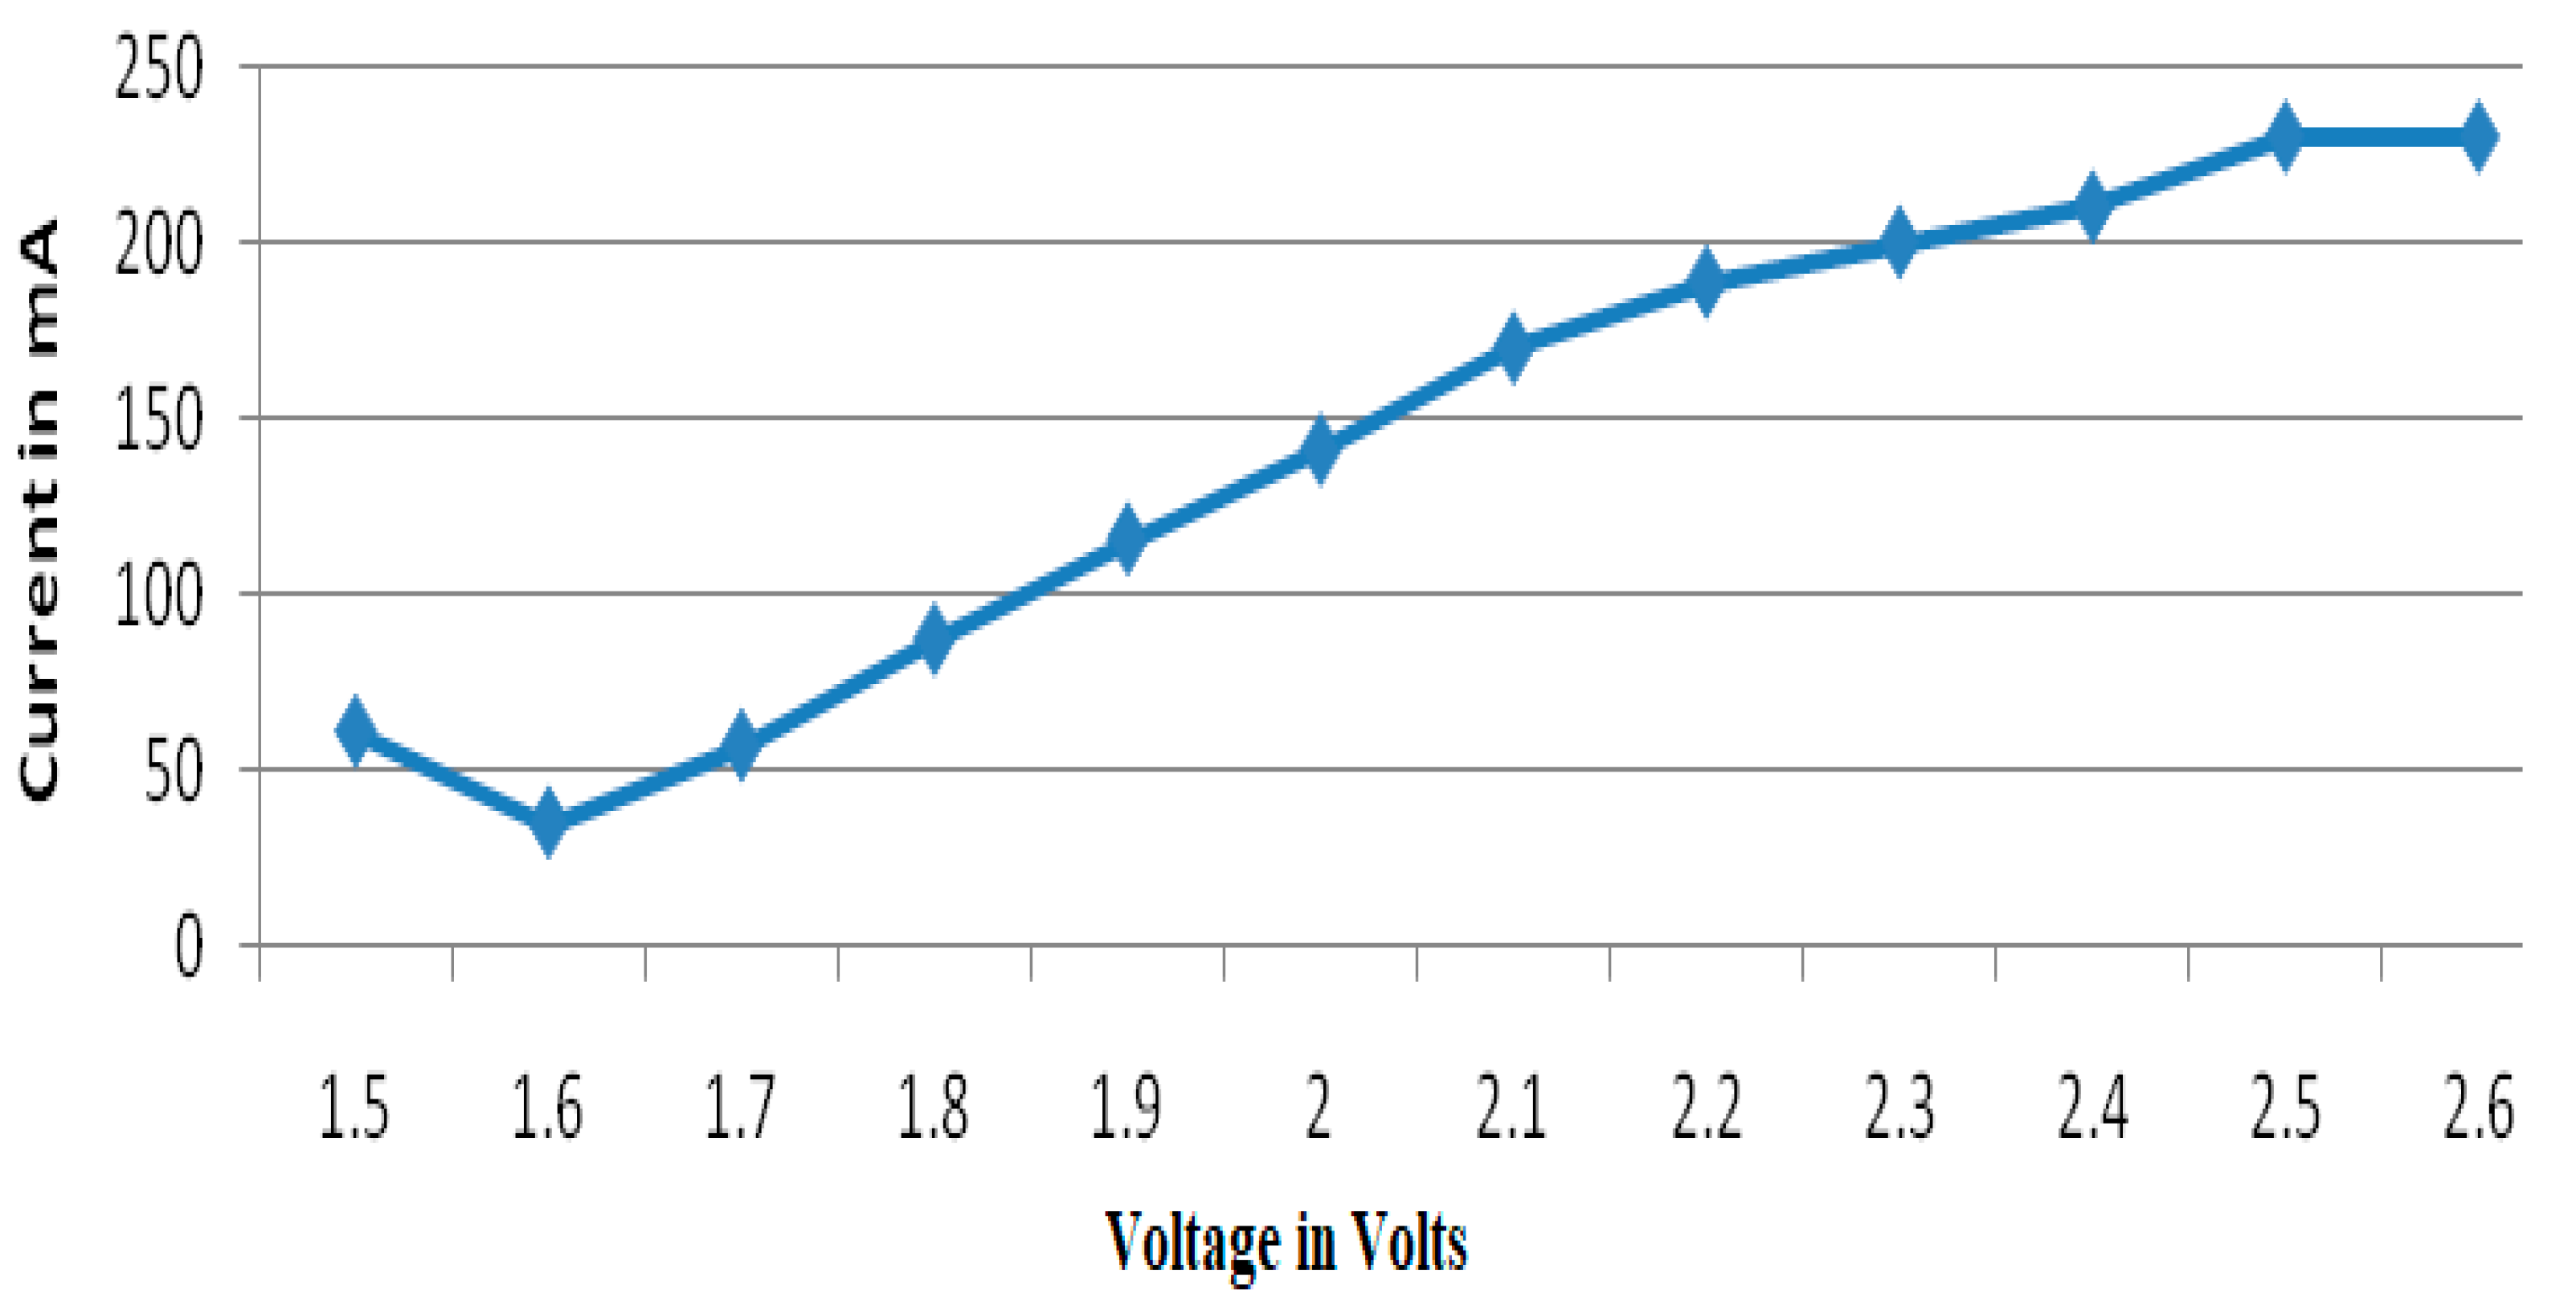
During galvanostatic charging, the voltage was increased by 0.1 V in an interval of thirty minutes. From
Figure 12, it can be inferred that current increased with voltage. The maximum rise in current observed was 230 mA. At 2.6 V, the charging process was stopped due to the sudden increment in production of hydrogen gas, indicating that the storage was full (i.e., the hydrogen ions that were emerging on the membrane were combining with electrons to form hydrogen gas, instead of entering into the storage electrode). The sharp dip in the curve, as shown in
Figure 12, was due to the electric potential predominantly being utilized for water disassociation. Once the electric potential reached a value that was enough to break the inter-molecular forces associated with hydrogen and oxygen in water, the current started rising (refer to
Figure 12 and
Table 7).
Voltage was increased after specified time intervals that lead to an increase in current and, hence, the production of hydrogen ions. For the first 1.5 h of charging, no hydrogen gas generation was observed in the collection cylinder. However, the cut-in voltage (i.e., where current starts rising after the dip shown in
Figure 12) of 1.5 V resulted in generation of oxygen gas, which was observed in the form of bubbles in the collection cylinder (shown in
Figure 9). It was deemed that the corresponding hydrogen got absorbed in the electrode and there was no visible sign of hydrogen generation.
Figure 13 represents the hydrogen generation rate during charging of the cell. It is clearly visible in the figure that the cut-in voltage was reached at 1.5 V in 1.5 h, after which the dissociated hydrogen moved out of the cell and bubbled through water in the collection cylinder. Although the presented work aims to suppress the formation of hydrogen gas, practically not all the emerging H
+ ions on the electrolytic membrane get adsorbed in the storage (i.e., certain H
+ ions do combine with e
– and liberate as H
2). A fairly linear behavior of the hydrogen gas generation rate (i.e., the slope of curve in
Figure 13) was observed with respect to increase of the applied voltage and corresponding current, as is clear from
Figure 13 and
Table 8.
The production of oxygen started when water was subjected to cut-in voltage of 1.5 V, as shown in
Figure 14 and
Table 9. The oxygen produced was stored in the gas collection cylinder and its production increased with the rise in the voltage. The higher the applied voltage, the higher would be the charge flow through the circuit, leading to the increase in the production of oxygen ions that combine to form oxygen gas and release electrons in the presence of the catalyst. This was verified through Faraday’s law given in Equation (1).
where,
Mo→ mass of oxygen generated in Kg.
I→ current in amperes.
t→ time in seconds.
F→ Faraday’s constant = 96,485 J per volt gram equivalent.
R→ gas constant = 8.314 J/mol·K.
T→ ambient temperature in Kelvin.
P→ atmospheric pressure in kilo Pascals.
During electrolyzer mode or charging, the amount of hydrogen produced was calculated by Faraday’s law given in Equation (2).
where,
M→ theoretical mass of hydrogen generated in kg.
I→ discharge current in mA.
t→ discharge time in sec.
F→ Faraday’s constant (96,485 C mol−1).
Mass of the produced hydrogen was subtracted from theoretically calculated mass of hydrogen to ascertain the amount of hydrogen adsorbed in the porous MWCNT electrode. After calculating the mass of hydrogen stored in the electrode, the percent of hydrogen stored in MWCNT was calculated by Equation (3).
where,
HC→ weight percent of hydrogen stored in MWCNT.
H→ mass of hydrogen stored in MWCNT.
C→ mass of MWCNT used in electrode.
The weight percent of hydrogen was calculated for successive time intervals of 30 min, and its variation with respect to the applied current is shown in
Figure 15 and
Table 10. The initial plateau in the curve signifies the amount of electric potential that got invested in overcoming the inter-molecular forces of H
2O and; therefore, lead to lower hydrogen storage, as shown in
Figure 15. Once the water started disassociating, a linear increase in hydrogen storage with respect to the applied voltage was observed. Another plateau between 1.8 and 2.1 V was due to the saturation of the storage space and, finally, after 2.1 V, a clear drop in the curve could be seen that signifies that storage is almost full, thereby increasing the H
2 generation rate rapidly.
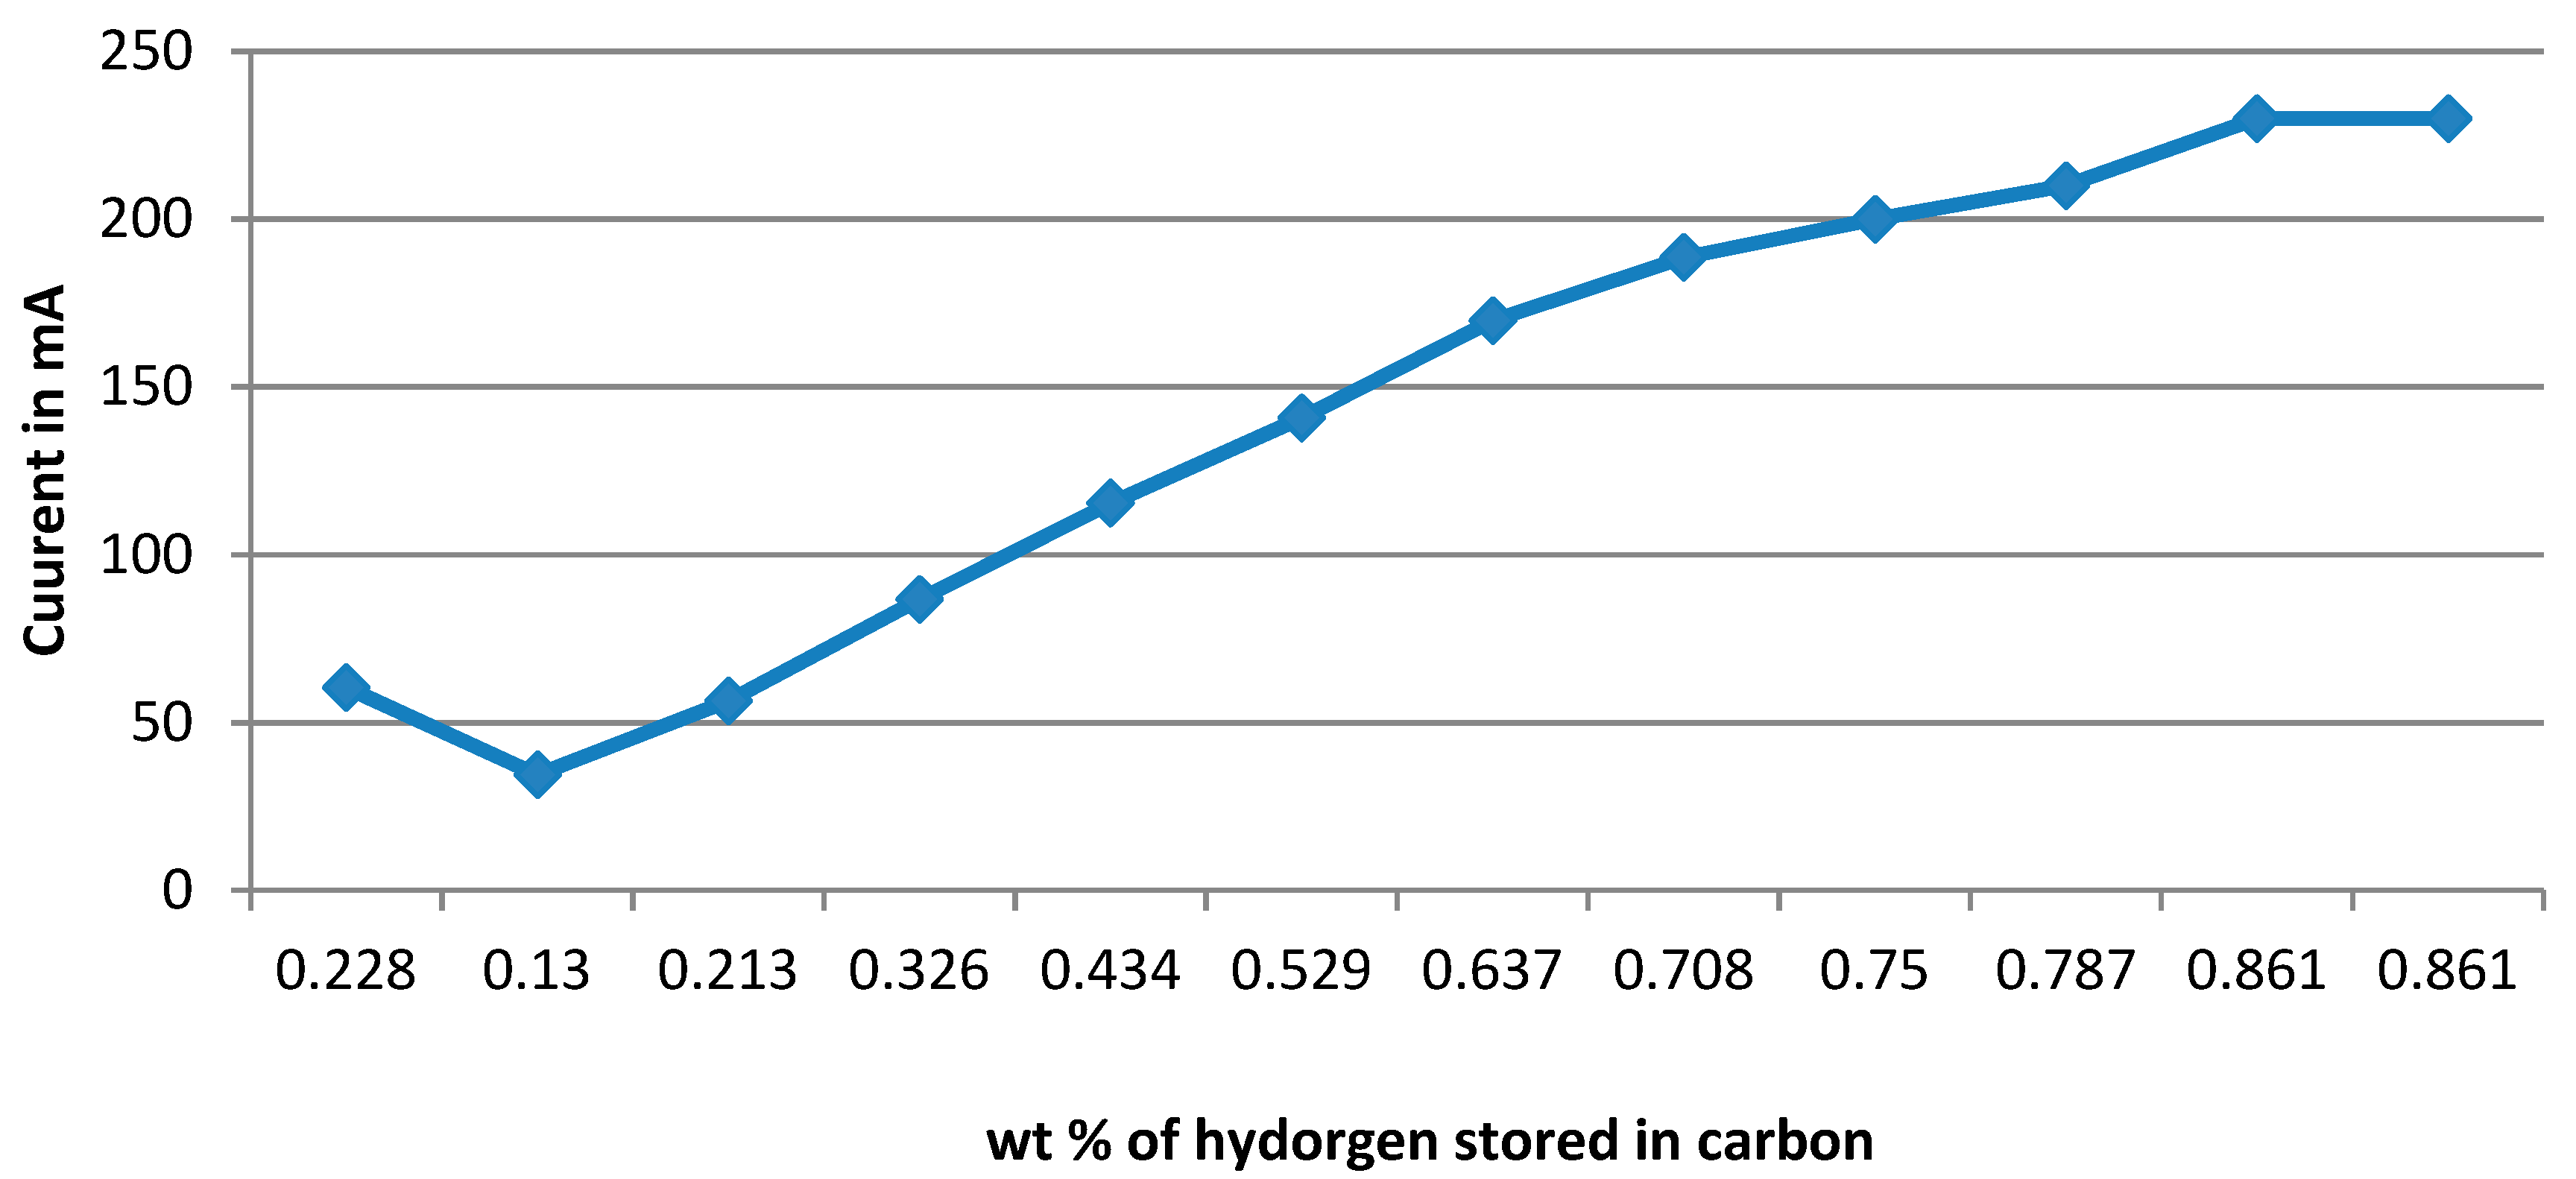
Figure 16 and
Table 11 are an outcome of the curves presented in
Figure 12 and
Figure 15 for verification of the obtained results. It represents the wt% of hydrogen getting adsorbed electrochemically in the porous MWCNT electrode with respect to current. From
Figure 16, it can be suggested that for electrochemical hydrogen storage in porous storage material, the charging current has to be maintained at a low value to discourage generation of hydrogen gas.
The graph between hydrogen wt% stored in MWCNT with respect to time is shown in
Figure 17 and corresponding values are presented in
Table 12. The maximum percent of hydrogen stored in carbon was 0.387% after 3 h of electrolysis. The possible reason for decay in hydrogen storage in MWCNT is that its pores get filled after a certain time. Since the voltage was applied at time (t) = 0 and the applied voltage was increased with respect to time, that is why the shape of curves in both
Figure 15 and
Figure 17 were the same, which, thereby, justifies the authenticity of the obtained results.
The consolidated results obtained during a single cycle of charging and discharging of the fabricated modified URFC are presented in
Table 13 and compared with those reported in literature [
14].
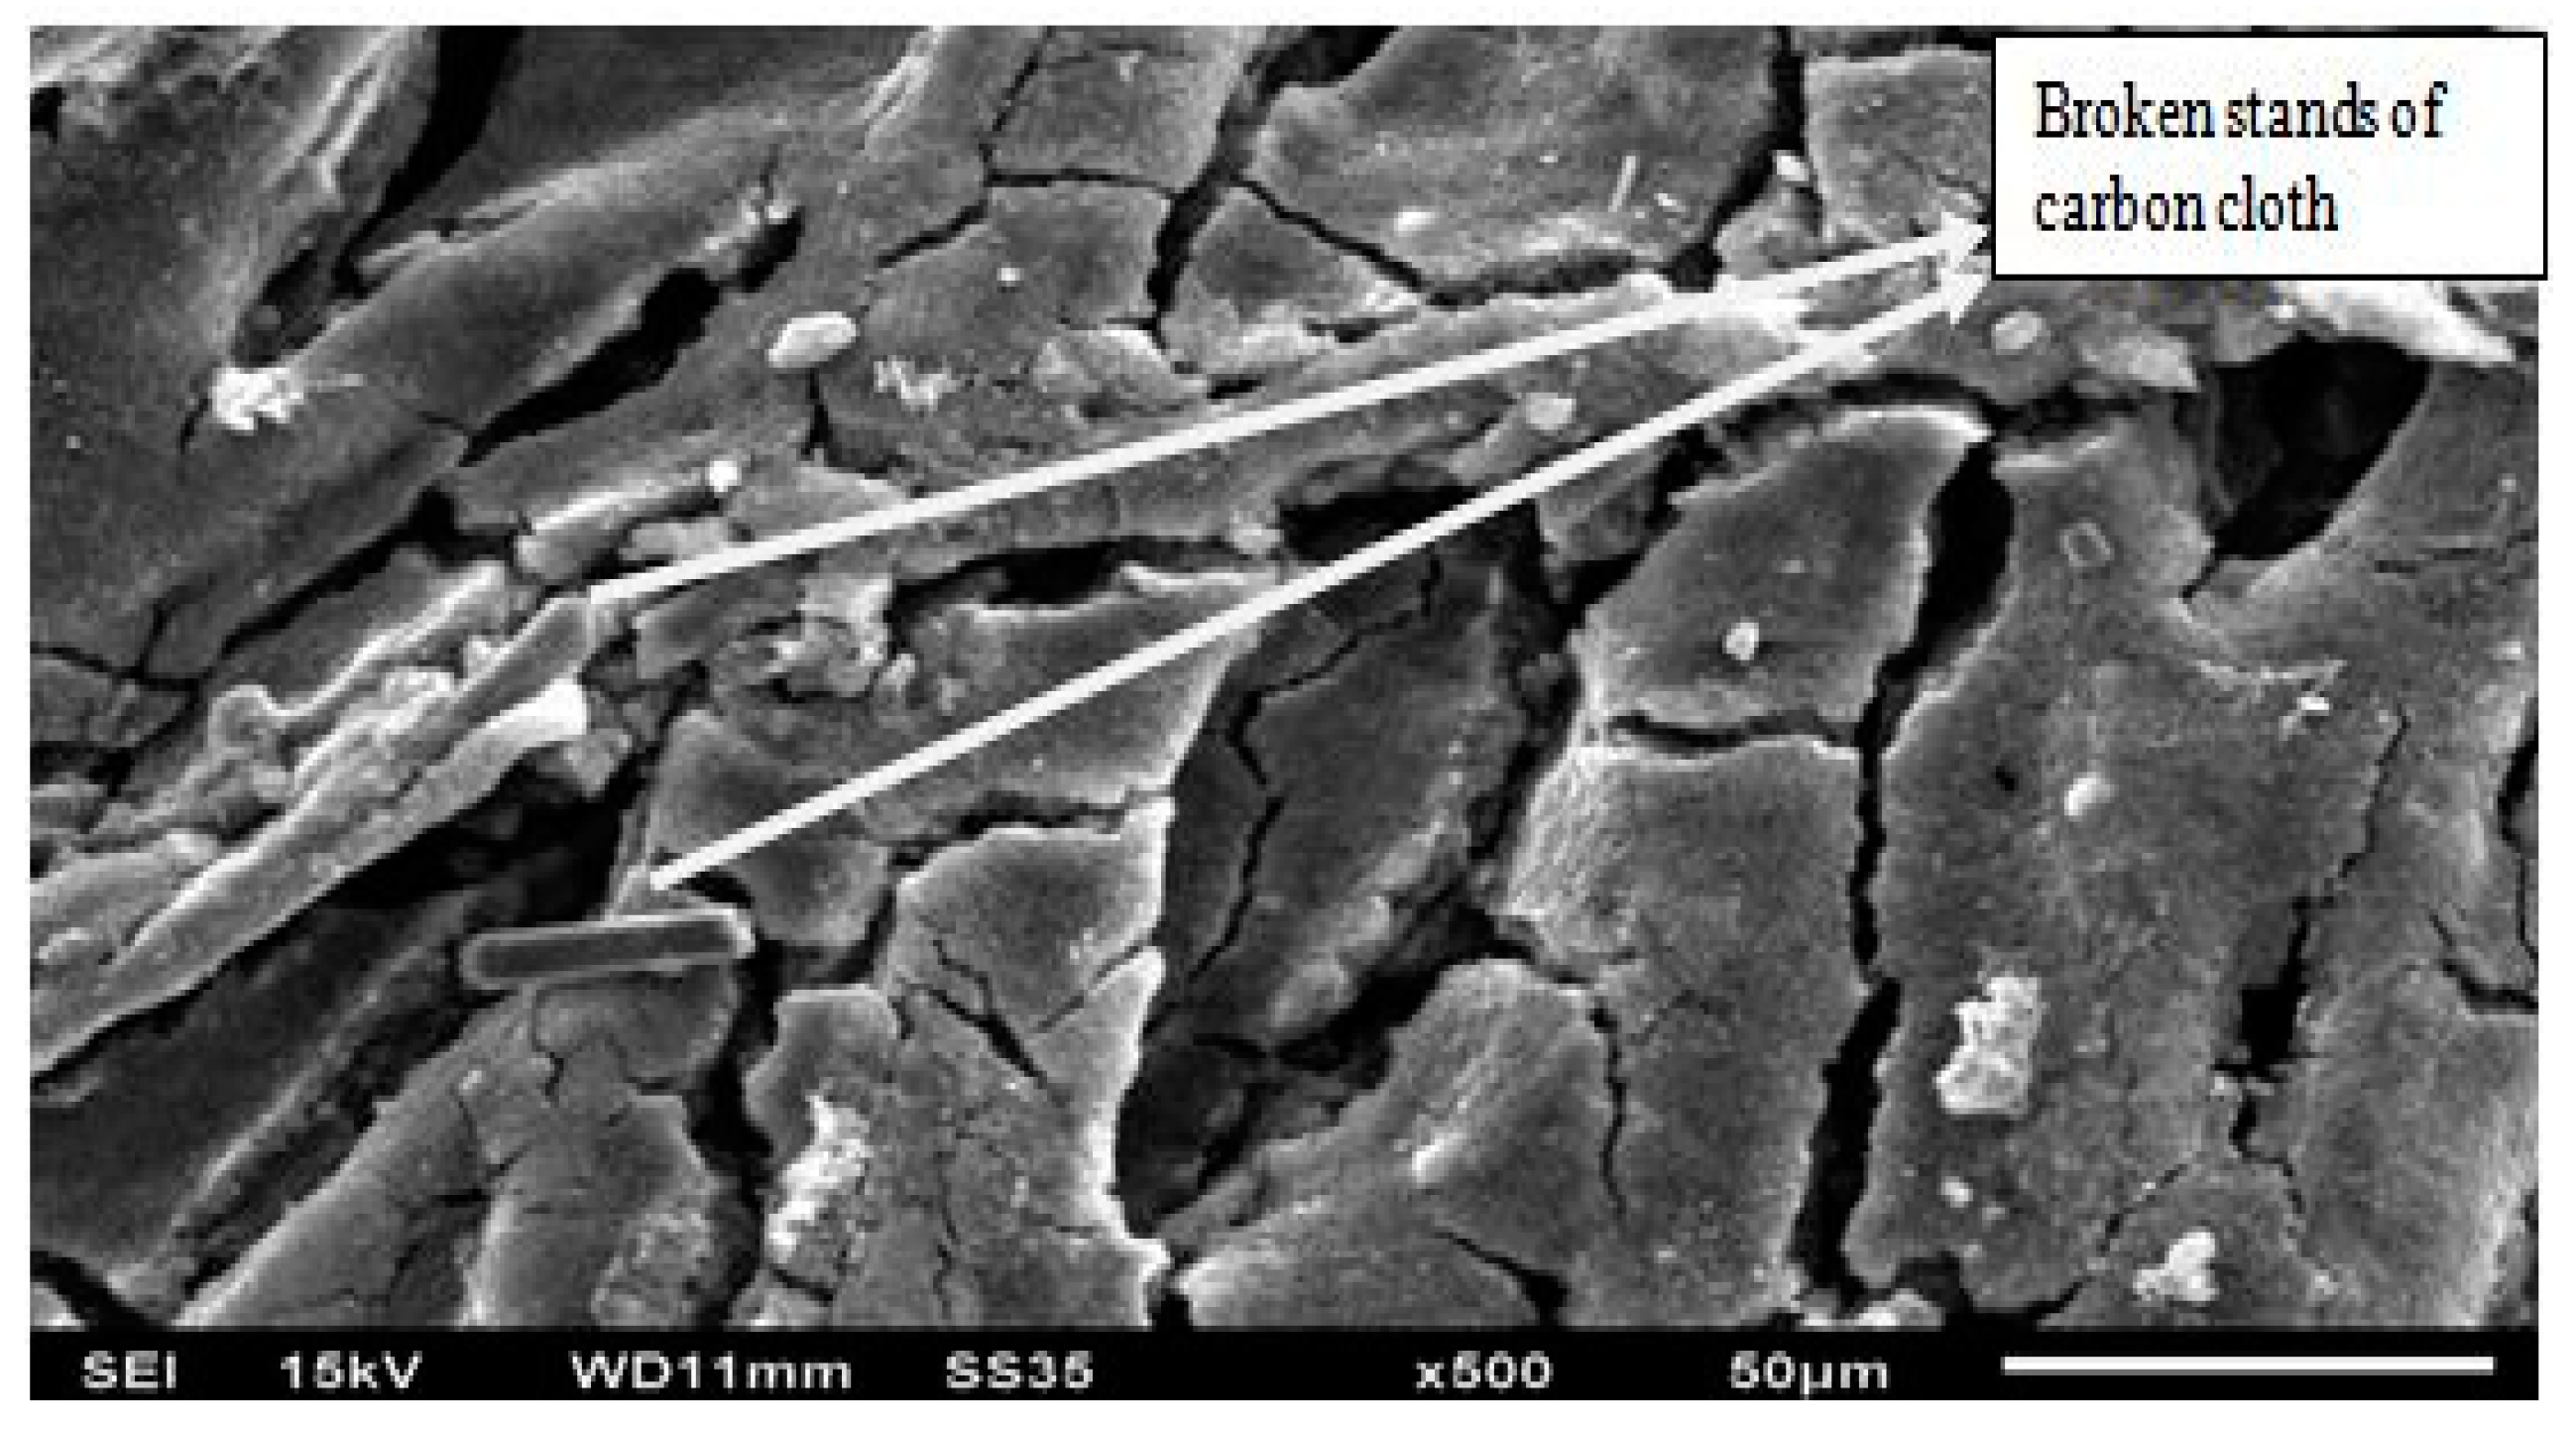
The SEM test was performed on the oxygen side CC after the experiment, as shown in
Figure 18. It was found that stands of carbon cloth got broken during the experimental procedure due to oxidation.
4. Discussion
As per the chemical composition of water, it was deemed that, in dissociation, two hydrogen atoms would release. Ideally, the amount of hydrogen produced should be double the amount of oxygen, but it was observed that the amount of hydrogen produced was far less than the produced oxygen; presuming no leakage and negligible loss, the deficit hydrogen got adsorbed electrochemically in the porous MWCNT electrode. The produced hydrogen got adsorbed physically in the porous MWCNT electrode, simultaneously allowing few atoms to form hydrogen gas. The adsorption process [
25] was in two forms—chemisorption and physisorption. During chemisorption, there was a weak chemical bond formation between the host material, hydrogen ion, and electron, whereas in the case of physisorption, weak Van der Waals forces between the surface of the host and hydrogen were formed. Whereas during desorption, electrical load was applied across the cell. The charging capacity of the cell was found to be 666.9 mAh/g, which is equivalent to 2.47 wt%, and is significantly higher than reported in literature published in 2018 [
15]. The discharging capacity of the cell was found to be 661.5 mAh/g, which is equivalent to 2.45 wt%, and higher than the reported literature of 2018 [
15]. US DOE target of hydrogen in terms of wt% is 4.0 wt% for single use and 3.0% for rechargeable [
26]. However, this target is for gaseous storage in various materials, whereas in the presented work the hydrogen is being stored in solid-state (ionic form-H
+), which is the safest form compared to other storage forms. In the presented work, generation of hydrogen gas is suppressed by operating at low voltage and current ranges. Additionally, the gaseous hydrogen storage needs the pressure of 700 bar and in the presented work the operating pressure is atmospheric (i.e., 1 bar). Therefore, we cannot compare the achieved gravimetric energy densities with US DOE targets for gaseous hydrogen storage.
5. Conclusions
It is experimentally demonstrated that hydrogen can be stored in solid-state in a MWCNT electrode integrated in a modified URFC or proton battery. It is evident from the obtained results that the hydronium ions (H3O+) travelled through the MEA, from anode to cathode, through the polymer electrolyte and got adsorbed in the porous electrode. The employed cell integrated with the porous MWCNT electrode is charged with capacity of 666.9 mAh/g, which is equivalent to 2.47 wt%, whereas the discharged capacity is 661.5 mAh/g, which is equivalent to 2.45 wt% and is comparable with the U.S. DOE targets for hydrogen storage. However, rapid cyclic charge–discharge testing is required to be carried out in future to ascertain the life cycle of the proton battery. It is also observed, in experimentation, that the carbon cloth on the anode side, which served as a gas diffusion layer (GDL), got oxidized during the charging mode. Therefore, for GDL, it is recommended to use alternate material, like porous titanium felt/frit. The obtained result proves the technical feasibility of a modified URFC with an integrated MWCNT-based hydrogen storage electrode. However, other measures are to be taken to enhance the gravimetric energy storage density, like the usage of alternate proton conducting medium within the porous hydrogen storage electrode.


