Article

Investigating the Molecular Basis of N-Substituted 1-Hydroxy-4-Sulfamoyl-2-Naphthoate Compounds Binding to Mcl1

by
Kalaimathy Singaravelu
1,
Pavithra K. Balasubramanian
2 and
Parthiban Marimuthu
3,*
1
Turku Computer Science and Informatics, Department of Future Technologies, University of Turku, FI-20520 Turku, Finland
2
Department of Bioscience and Biotechnology, Institute of KU Biotechnology, Konkuk University, Seoul 05029, South Korea
3
Structural Bioinformatics Laboratory, Biochemistry, Faculty of Science and Engineering, Åbo Akademi University, Tykistökatu 6A, FI-20520 Turku, Finland
*
Author to whom correspondence should be addressed.
Processes 2019, 7(4), 224; https://doi.org/10.3390/pr7040224
Submission received: 2 April 2019 / Revised: 15 April 2019 / Accepted: 17 April 2019 / Published: 19 April 2019
(This article belongs to the Special Issue Molecular Dynamics Modeling and Simulation)

Abstract

:
Myeloid cell leukemia-1 (Mcl1) is an anti–apoptotic protein that has gained considerable attention due to its overexpression activity prevents cell death. Therefore, a potential inhibitor that specifically targets Mcl1 with higher binding affinity is necessary. Recently, a series of N-substituted 1-hydroxy-4-sulfamoyl-2-naphthoate compounds was reported that targets Mcl1, but its binding mechanism remains unexplored. Here, we attempted to explore the molecular mechanism of binding to Mcl1 using advanced computational approaches: pharmacophore-based 3D-QSAR, docking, and MD simulation. The selected pharmacophore—NNRRR—yielded a statistically significant 3D-QSAR model containing high confidence scores (R2 = 0.9209, Q2 = 0.8459, and RMSE = 0.3473). The contour maps—comprising hydrogen bond donor, hydrophobic, negative ionic and electron withdrawal effects—from our 3D-QSAR model identified the favorable regions crucial for maximum activity. Furthermore, the external validation of the selected model using enrichment and decoys analysis reveals a high predictive power. Also, the screening capacity of the selected model had scores of 0.94, 0.90, and 8.26 from ROC, AUC, and RIE analysis, respectively. The molecular docking of the highly active compound—C40; 4-(N-benzyl-N-(4-(4-chloro-3,5-dimethylphenoxy) phenyl) sulfamoyl)-1-hydroxy-2-naphthoate—predicted the low-energy conformational pose, and the MD simulation revealed crucial details responsible for the molecular mechanism of binding with Mcl1.

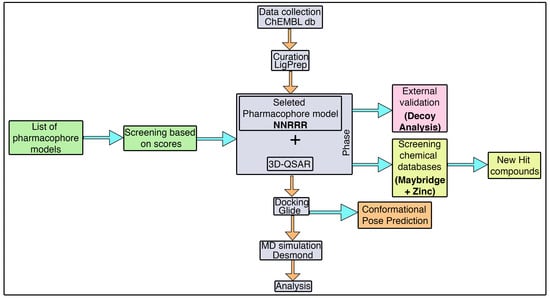
Graphical Abstract

1. Introduction

The Bcl-2 family members play a central role in apoptosis regulation [1]. The members of this protein family comprises (i) anti-apoptotic proteins (AAP: Bcl-2, Bcl-xL, Bfl-1/A1, Bcl-w, and Mcl1) containing four BH (Bcl-2 homologue) domains, (ii) pro–apoptotic proteins (PAP: Bax, Bak, and Bok) containing three BH domains, and (iii) BH3-only proteins (Bad, Bid, Bik, Bim, Bmf, Hrk, Noxa, and Puma) only have a BH domain, which ultimately determines the cellular lifetime [2]. These family members predominantly function via homo– or heterodimerization formation of BH domains and regulate apoptosis [3].
Among the Bcl-2 family members, Mcl1 (myeloid cell leukemia 1) is the most frequently amplified gene, and thus it is an attractive therapeutic target [4]. This favorable physiological activity of Mcl1 helps the cancerous cell to evade normal cell death. Furthermore, this eventually causes the spread of infectious cells to several parts of the body [5] including the lungs, breasts, prostate, pancreas, ovaries, and cervix [6,7]. Due to cancerous cells widely spread all over the human system, the infection gains strong resistance to several chemotherapeutic agents [8,9].
The experimental details show that the three-dimensional structure of Mcl1 is tightly packed with a series of amphipathic α-helical bundles [10,11,12]. These α-helical bundles are arranged in such a manner that they form a distinct binding groove on the surface of Mcl1 [12,13,14,15,16]. This binding groove covers a large surface area, and is occupied by an ensemble of hydrophobic residues providing an excellent spot to accommodate its partners from other family members (PAP or BH3-only peptides) or the non-peptide substances [10]. These hydrophobic residues inside the pocket are (i) highly conserved, (ii) remain crucial for binding partner selectivity, and (iii) are also the main reason for showing a wide range of binding affinity values when interacting with its binding partner for apoptotic regulation. For example, cytochrome c release is highly affected due to the sequestration of Bak by Mcl1 activity; the Bim protein can bind with all the members of AAPs, while Noxa proteins show high selectivity with Mcl1 [15,17]. These notable characters of Mcl1 make it a highly challenging therapeutic target, and also remind us of the need for novel cancer drug development [18].
Several studies have been reported on novel peptides [19,20,21] and non-peptide leads [22,23,24,25,26,27] with activity values in the subnanomolar range, but none have reached the market. In recent years, researchers have identified few selective Mcl1 inhibitors that showed significant downregulating effects. For instance, AMG176 synergistically exhibits remarkable activity when provided in combination with venetoclax [28,29], which was recently approved by the FDA [30,31]. Also, the discovery of AZD5991 demonstrates selective targeting to Mcl1 [32]. Likewise, a recent study revealed a series of Mcl1 inhibitors that exhibited the potential to inhibit its overexpression activity [33]. Taking advantage of this, the current study is an attempt to understand the mechanistic behavior of the current compound series with Mcl1. To achieve this, a combination of in silico approaches—pharmacophore-based 3D-Quantitative Structure Activity Relationship, docking, and Molecular Dynamics (MD) simulation—is widely used [34,35,36,37,38,39,40]. Correspondingly, a pharmacophore-based 3D–QSAR model was constructed based on known inhibitors obtained from the literature [33], with the aim of gaining knowledge on the critical chemical features responsible for its maximum activity. Subsequently, the docking approach was used to predict the low-energy conformational pose for the highly active compound. The MD simulation is a useful tool for investigating crucial interactions at the ligand binding interface, large conformational changes in biomolecules, ion exchange across the membranes, and protein folding and unfolding pathways. Additionally, this approach is used in various stages of drug discovery research [41,42]. In light of that, an MD simulation was performed on our docked complex to observe the molecular mechanism of binding with Mcl1. Taken together, the details from the current study could provide critical insights required for the next-generation inhibitor development that may potentially downregulate Mcl1 activity.

2. Materials and Methods

2.1. Obtaining Mcl1 Inhibitors

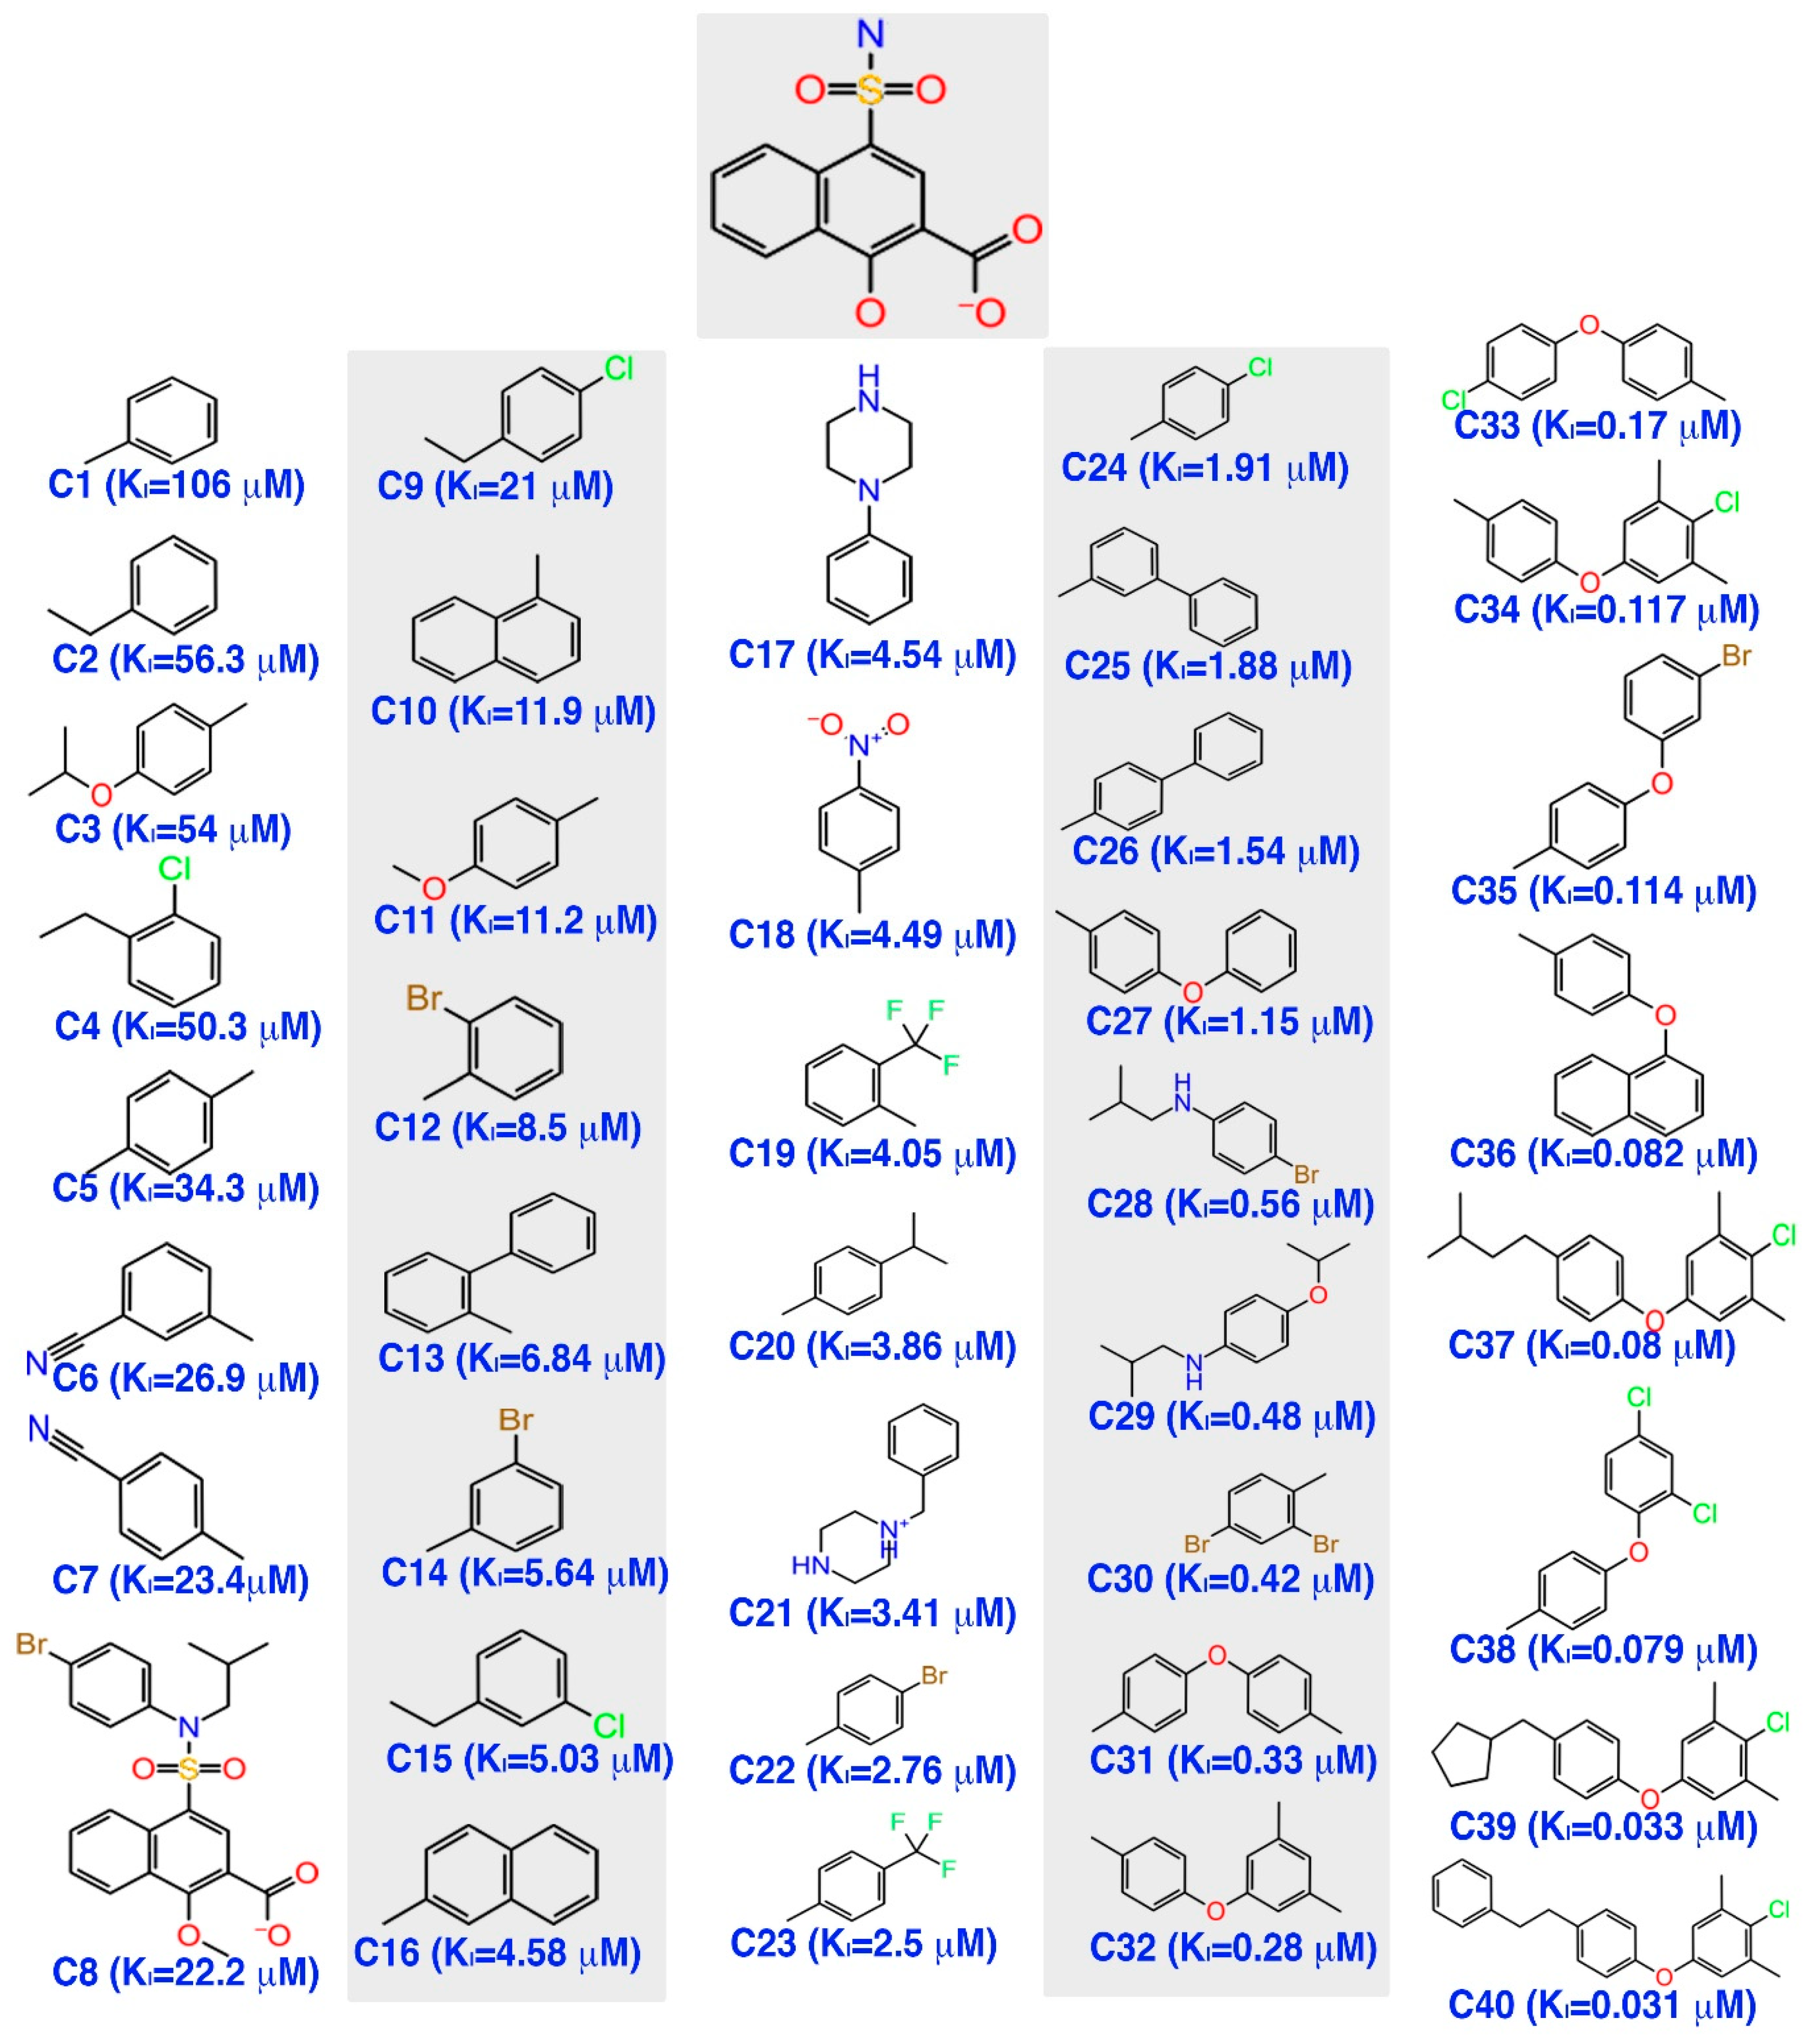
The inhibitor dataset used in the present work was retrieved based on the literature [33] from ChEMBL database (assay id:3779852) (https://www.ebi.ac.uk/chembl) (Figure 1). An extensive investigation of the dataset revealed that the selected chemical dataset satisfies the necessary features—the same experimental type; covers a range of chemical structures and its inhibitory potency profiles (0.031 to 106 Ki (µM))—required for the study. Consequently, the selected chemical dataset is subjected to LigPrep module (Schrödinger 2016-3, New York, NY, USA) to generate low-energy conformers at pH = 7.4 and OPLS_2005 force field [43].

2.2. Pharmacophore Hypothesis Generation and Validation

The phase module [44] available in the Schrödinger 2016-3 suite provided an excellent tool for the construction of pharmacophore-based 3D-QSAR models in our previous studies [37,38,40], and thus the same method is adopted in the current investigation. Initially, all the low-energy conformers were imported to the “Develop Common Pharmacophore Hypotheses” panel, together with its activity values (3.975 to 7.509—pKi (µM)). Next, the “Activity Threshold” was set to 5 and 6 for the minimum and maximum threshold, which eventually separates the low-energy conformers into active (pKi > 6.247–7.509 μM), moderately active (pKi range 5.071–5.939 μM), and inactive (pKi > 3.975–4.951 μM) groups, respectively. Then, the rapid sampling approach was used to enhance the ligand conformers with the default parameters [40]. The enhanced conformers thus obtained were subsequently treated with pre- and post-processing procedures using the OPLS_2005 force field for 100 steps, while the RMSD tolerance was maintained at 1 Å. Furthermore, “Automated Random Selection” was used to divide the ensemble into training (29) and test sets (11)—based on a 70% and 30% data separation procedure [45]—that comprises 40 compounds. A minimum and maximum cutoff were set to 4 and 5 for the “Define Variant List.” Likewise, the “must match active groups” was set to 10 to produce a list of 28 variants, which was used to generate pharmacophoric maps. Finally, the generated hypotheses were ranked with the default cutoff.

2.3. 3D-QSAR Model Building

All 40 compounds in the selected chemical dataset were used to develop an atom-based 3D-QSAR model based on previously developed pharmacophore maps as the backbone with a default grid space of 1 Å. Generally, the regression statistical approach was used to validate the quality of the 3D-QSAR model in several studies. In particular, the Partial Least Square (PLS) regression statistical approach provides the advantage to carry out an extended search for the given the dataset to several folds. Therefore, the PLS approach available in the Schrödinger 2016-3 suite was used to evaluate the quality of the predicted 3D-QSAR model in the current study. Simultaneously, a 3D contour map was also generated to assess the compounds’ reactivity. To gain comparative insights, the high and low active molecules were superposed on to the 3D contour map and graphically visualized.

2.4. Model Validation

The ability of the 3D-QSAR model to predict the activity values for the chemical dataset is crucial, and therefore it is further validated using the correlation coefficient approach. Generally, analysis based on the correlation coefficient approach is highly effective, as it clearly demonstrates the close correspondence between the dataset provided in terms of numerical values between 0 to 1. Thus, the quality of the model developed can be validated based on a higher correlation coefficient value closer to 1. Here, the correlation coefficient value was calculated using predicted values versus the experimental/actual values of the training (r2) and test (q2) datasets, respectively.

2.5. External Validation Using a Database of Useful Decoys

The enrichment analysis is widely used to validate the reliability of the generated model. For this, a separate database of decoy molecules was used. Typically, the decoy dataset is prepared based on the similarity of the reference compounds that are predicted as active by the 3D-QSAR model. Therefore, the selected decoy compounds comprises the physicochemical properties of the reference compounds, but differ in their 2D structures. Consequently, a set of 13 active molecules predicted by the 3D-QSAR model was selected and submitted to the DUD-E web server (http://dude.docking.org), which produced a list of decoys. The decoys thus obtained were further processed using the LigPrep module with the same parameters previously mentioned. Afterwards, the Enrichment Factor (EF) and the goodness of hit (GH) score were calculated using the following equations. The EF was computed based on the following equation:
EF = ( H a H t ( A D ) )
GH = { [ H a ( 3 a + H t ) 4 H t A ] } [ 1 ( H t H a ) ( D A ) ]
where Ha represents the total number of active compounds retrieved from the hit list, Ht represents the number of compounds retrieved by the screening, A represents the total number of active compounds in the database, and D represents the total number of compounds in the decoy database. The GH value is bound between 0 and 1, which assures the quality of the generated model as null or an ideal status, respectively. Furthermore, the % of the ratio actives (%RA) can also be estimated using the following equation:
% RA = [ ( H a A ) 100 ]
Likewise, the screening performance of the 3D-QSAR model was estimated by the Receiver Operating Characteristic (ROC) curve. The Robust Initial Enhancement (RIE), and the area under the curve (AUC) values were also obtained during this analysis. The RIE was obtained using the following formula:
RIE = 1 n i = 1 n e a x i 1 n [ 1 e a e ( a n ) 1 ]
where xi = (ri/N) represents the relative rank of the ith active compound and α represents the tuning parameter. Normally, the RIE was obtained based on the decrease in exponential value exhibited by the active molecules, while AUC represents the probability value acquired when the randomly chosen known active compound ranked higher than a randomly chosen decoy molecule. The ideal screen performance of the model is validated based on ROC and AUC values closer to 1, and large positive RIE values. The ROC is calculated using the following formula:
ROC = RIE    X   n N s i n h ( α 2 ) c o s h ( α 2 ) c o s h [ α 2 a ( n N ) ] + 1 1 e 1 ( n N )

2.6. Screening Potential Compounds

To identify new inhibitors with a novel scaffold that matches the 3D-QSAR properties, the generated five-site pharmacophore hypothesis—NNRRR—was used to screen the database of chemical compounds. For this, the ZINC (zinc.docking.org) [46] and Maybridge (maybridge.com) databases were obtained, and treated with the LigPrep module (Schrödinger 2016-3), as previously mentioned. Consequently, the resulting hits were filtered using ADME (absorption, distribution, metabolism and excretion) [47,48,49] and Lipinski’s rule of 5 (RO5) [50] properties using the QikProp (Schrödinger, 2016-3) program, simultaneously. QikProp readily predicts the applicability of the drug candidates by eliminating the problematic compounds and generating a wide range of physicochemical properties that are considered to have high significance in pharmaceutical research. The resulting compounds may have the ability to downregulate the Mcl1 activity.

2.7. Structure Preparation

The experimentally determined three-dimensional structure of Mcl1 complexed with 3-[3-(4-chloro-3,5-dimethylphenoxy)propyl]-1-benzothiophene-2-carboxylic acid (henceforth—X) (PDB:4HW3, chain A and resolution 2.4 Å) [7] was obtained from a protein data bank [51]. The co-crystallized ligand is obtained from members of two different fragments merged together, and the lead compound potentially inhibits Mcl1 with a high binding affinity value (Ki = 0.055 µM). Additionally, the selection of this PDB coordinate is appropriate due to the fact that the co-complexed ligand X shows close structural similarity with the chemical dataset [33].

2.8. Molecular Docking

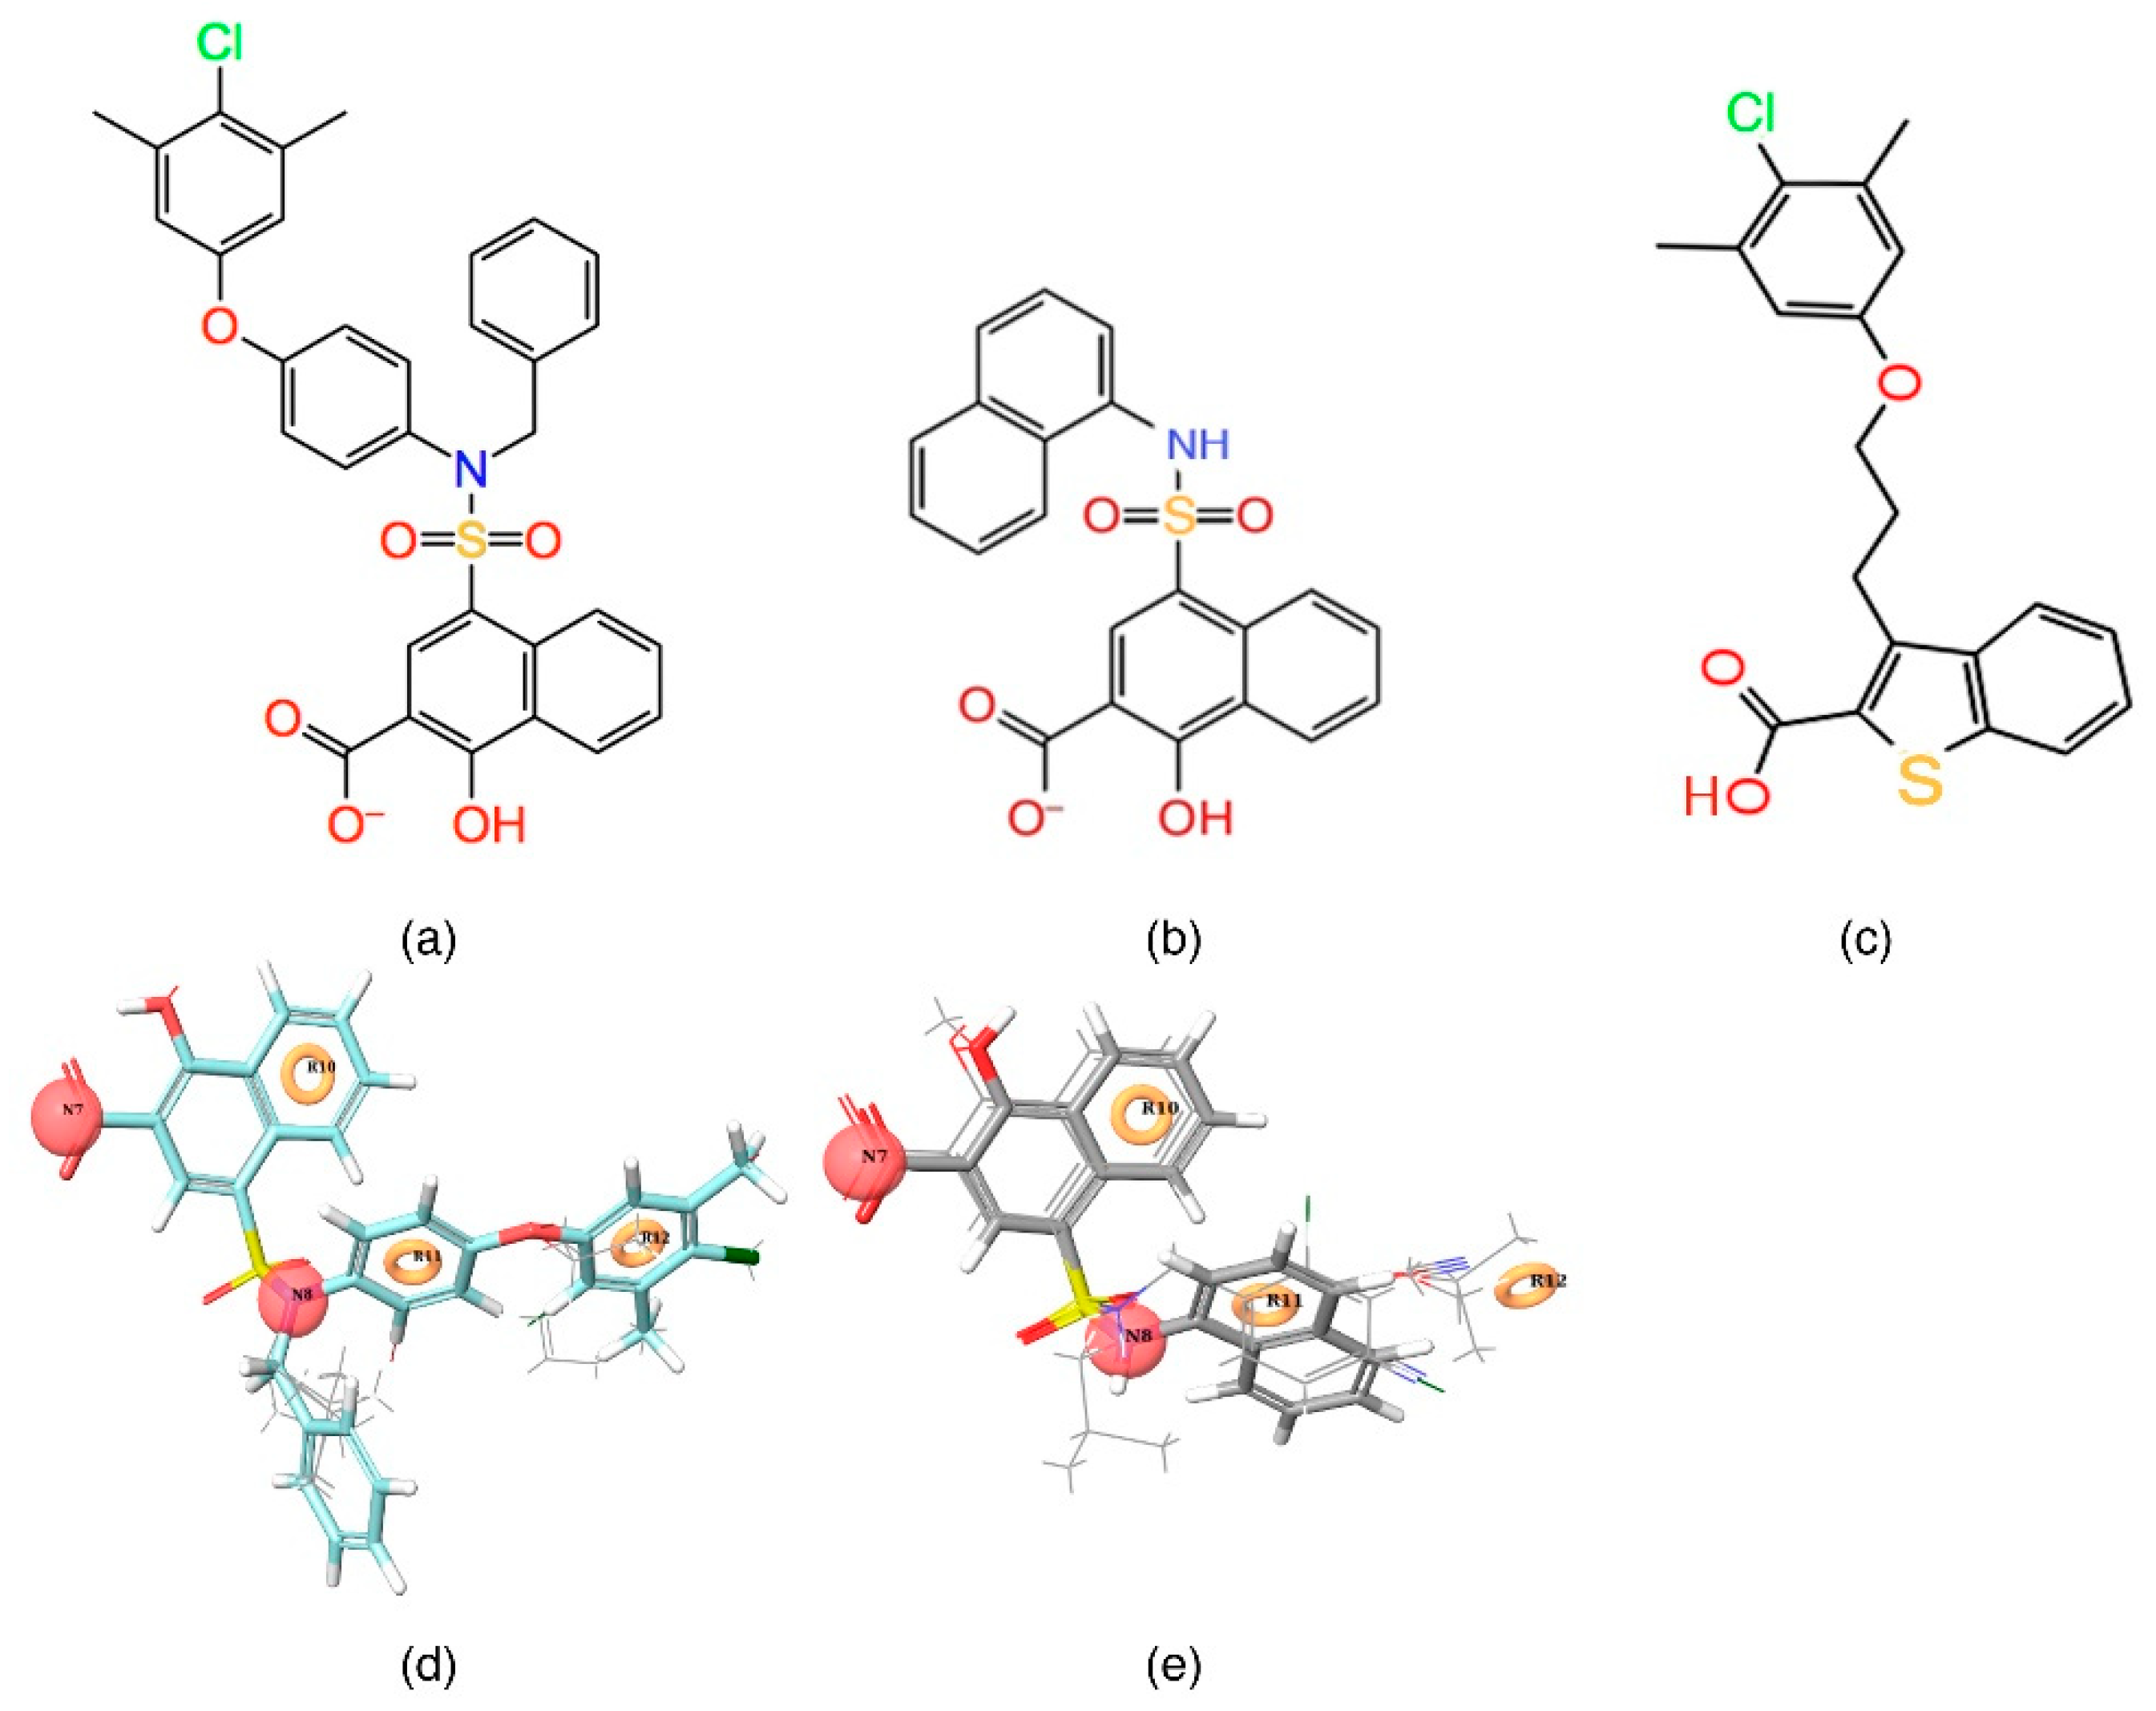
The Glide (Grid-Based Ligand Docking with Energetics) program available in Schrödinger 2016-3 was used to carryout molecular docking studies. Initially, the pre-processed Mcl1 and the highly active compound—C40 (4-(N-benzyl-N-(4-(4-chloro-3,5-dimethylphenoxy)phenyl)sulfamoyl)-1-hydroxy-2-naphthoate; ChEMBL ID: 3781822; Ki = 0.031 μM; Figure 2a) from the chemical dataset [33]—was selected for the study. Next, the co-crystallized ligand X was assigned as the centroid of energy-based grid box, which entirely covers the hydrophobic pocket residues—A227, F228, M231, L235, L246, V249, M250, V253, F254, R263, T266, L267, F270 and G271—of Mcl1. Subsequently, the setup was subjected to Glide XP docking run in the hydrophobic binding pocket of Mcl1 with default parameters. The post-docking minimization cutoff was set to 100. The docking runs produced low-energy conformers and docking scores, simultaneously. The 2D “Ligand Interaction diagram” and graphical visualization of poses were used to analyze all the docking results.

2.9. Molecular Dynamics

The stability of the predicted binding pose—C40—inside the hydrophobic pocket Mcl1 was analyzed by MD simulations using Desmond [52] program using OPLS_2005 force field [43] as provided by Schrödinger suite. The Mcl1–C40 complex was placed inside the orthorhombic box and was solvated using the TIP3P water model. The buffer was placed at 10 Å distance between the protein surface and the edge of the box. Fifteen Na+ and 17 Cl counter ions were added to neutralize the system. Overall, the system contained a total of 19,219 atoms prior to the simulation. Initially, this setup was subjected to LBFGS minimization for 2000 steps, while the gradient descent cutoff was set to 25 kcal/mol/Å. The smooth partial mesh Ewald (PME) method was used to calculate long-range electrostatic interactions [53]. The short-range electrostatic interactions were calculated with the default cutoff radius of 9 Å. Next, the system was subjected to a gradual increase in temperature from 0 to 300 K with a time step of 2 fs. Finally, the entire setup was subjected to a 100 ns production run in the NPT ensemble, while the temperature was maintained at 300 K, the Nose–Hoover thermostat [54] and the Martyna–Tobias–Klein [55] borostat relaxation time was set to 200 ps.

2.10. Analysis of MD Trajectory

The interactions between Mcl1 and C40 over the period of time were inspected using the Maestro graphical interface. Additionally, the trajectory analysis such as root mean squared deviation (RMSD), radius of gyration (Rg), and root mean squared fluctuation (RMSF) was performed using Schrodinger 2016-3 in-built programs.

3. Results and Discussion

3.1. Pharmacophore Model Generation

The alignment of the active chemical compounds plays a central role in generating a pharmacophore model using the phase protocol [44] in Schrödinger. This pharmacophore model essentially links the details of the pivotal functional group with its activity values. Additionally, this hypothesis was used as a backbone to build an atom-based 3D-QSAR model, which in turn was used to predict the activity and study the relationship of the given dataset. Consequently, the model exhibited important pharmacophoric features in three-dimensional space.
Initially, a five-site pharmacophore model—hydrogen bond acceptor (A), hydrogen bond donor (D), hydrophobic (H), negative ionization (N), and aromatic ring (R)—was obtained from the inhibitor dataset, which is common to all 13 compounds from the active group. Subsequently, the generated hypothesis was scored and ranked by the phase program based on survival, survival-inactive, site, vector, volume and activity (Table 1). A five-featured pharmacophore model—NNRRR—was selected based on the high survival score (6.176), and comprises two negative (N) and three aromatic (R) features. To gain further insights, the most active (Figure 2a,d) and least active (Figure 2b,e) compounds from the inhibitor dataset were superposed over the generated pharmacophore.
The Figure 2d shows that all active compounds from the dataset entirely occupied the selected hypothesis that comprises two negative and three aromatic ring features. This explains why the chemical features present in the selected pharmacophore model have the potential to interact with the Mcl1 binding pocket, which may induce its inhibitory activity. Furthermore, the intersite distances and the angle measurement between the site points (Figure 3; Table 2 and Table 3) of the hypothesis—NNRRR—determine the quality of the developed pharmacophore model. These measurements highlight the robustness of the selected pharmacophore model. Overall, the result provides confidence that the selected hypothesis—NNRRR—was reliable and could be used for further 3D-QSAR model development.

3.2. 3D-QSAR Model

The previously developed pharmacophore hypothesis—NNRRR—was used to build a 3D-QSAR model, with the phase [44] program. For this, the entire dataset was subdivided into 29 training and 11 test set compounds (Table S1) that subsequently produced 3D-QSAR. Simultaneously, the activity values for the chemical dataset were also obtained during the 3D-QSAR model development (Table 4). The PLS prediction approach exhibited—r2 = 0.9209, q2 = 0.8459, and Pearson’s R = 0.9356—a greater degree of confidence to the developed 3D-QSAR model. Here, r2 and q2 represent 92% and 86% of variance in the observed activity values obtained for the training and test data, respectively. Also, the scoring based on Pearson’s R is obtained by the correlation between the predicted and the observed activity for the test dataset. As can be seen from Table 4, the Pearson’s R produced higher value—0.9356—which in turn explains why the developed 3D-QSAR model is more statistically significant. Also, the robustness of the developed 3D-QSAR model is further validated by the difference between the r2 and q2 being 0.075 (0.9209 − 0.8459 = 0.075). Additionally, a smaller standard deviation (SD = 0.3036) was obtained for the regression analysis and RMS error (RMSE = 0.3473) values for the test set predictions. These values indicate that the developed QSAR model is highly reliable to predict the activity of novel compounds.

3.3. Scatter Plot

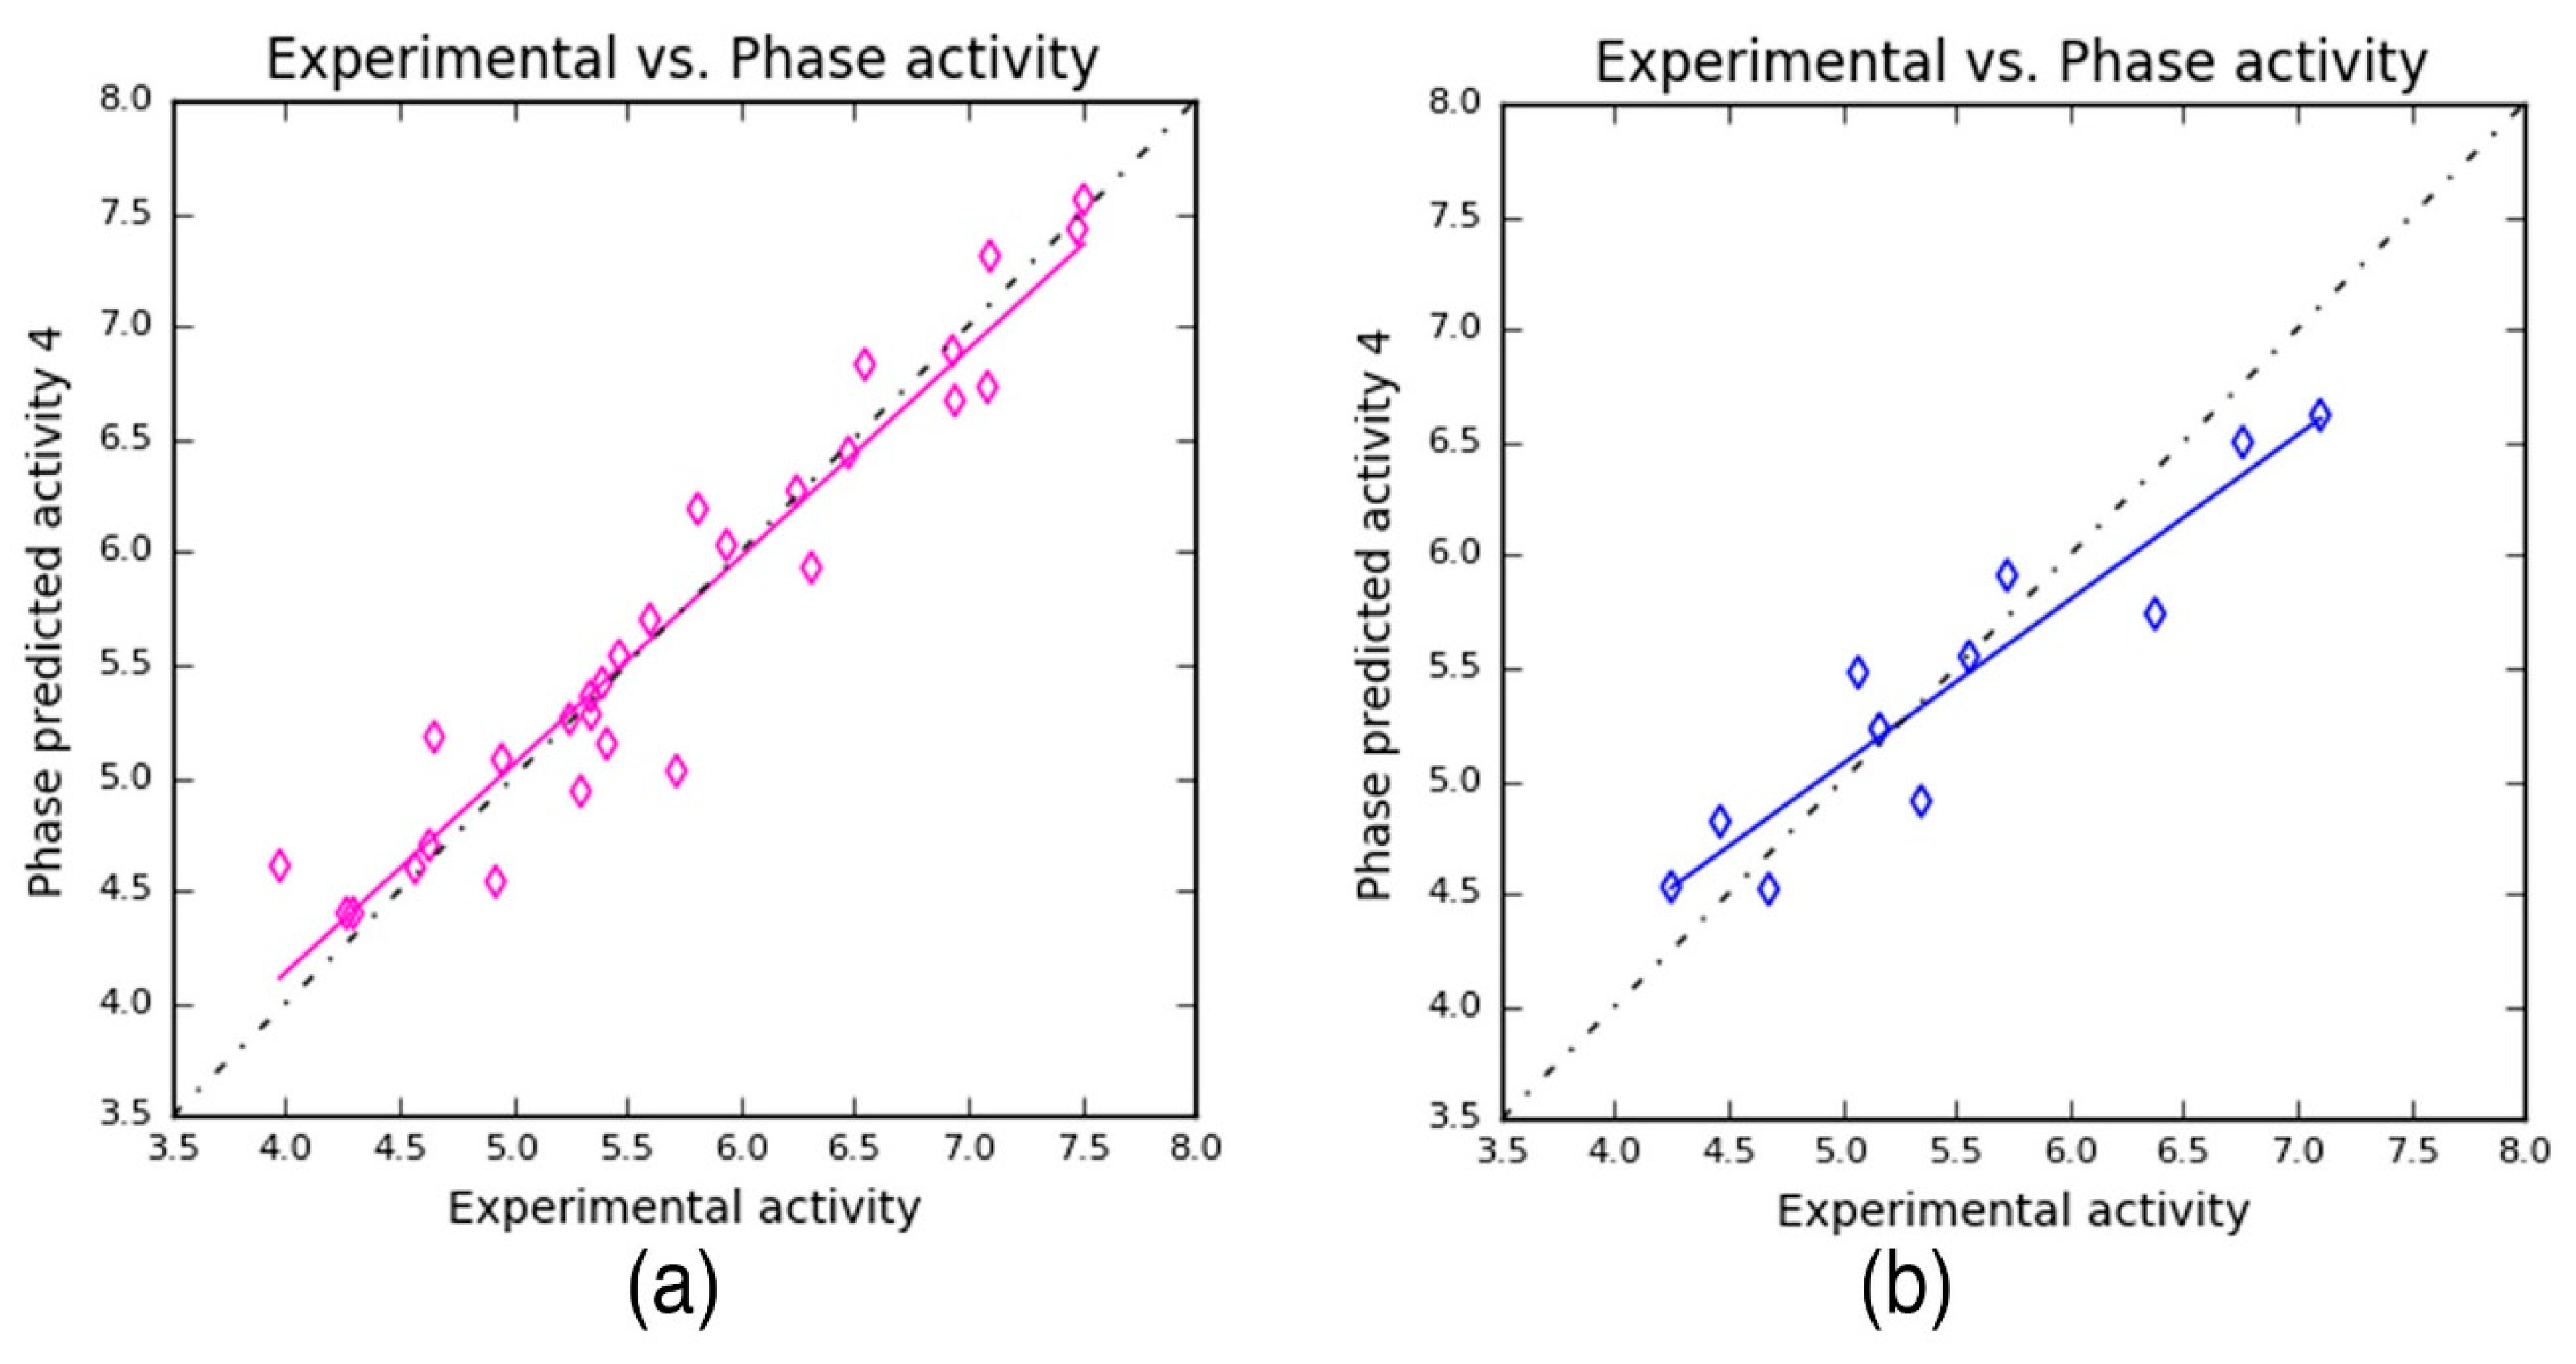
Subsequently, the scatter plots were obtained for the training and the test dataset, individually (Figure 4). The plots were constructed based on the experimental and predicted values to find the best line of fit for the training and test datasets. The scatter plots are used to gain clarity on (i) the correlation between the chemical dataset, (ii) which in turn helps us to understand the predictability of the developed 3D–QSAR model. Here, the scatter plot shows the training and test molecules that are proximal to the best-fit line, which explains the robustness of the developed model.

3.4. Model Evaluation by Decoy Analysis

Typically, the predictive power of the developed 3D-QSAR hypothesis can be estimated by the enrichment factor (EF) analysis using the dataset of decoy molecules that was not used for the model building. In particular, this analysis was carried out with the aim to reveal the ability of the 3D-QSAR model to discriminate the actives from the decoy compounds. The current model predicted a set of 13 active compounds (Table S1) that was treated as the reference dataset and submitted to the DUD-E database, which retrieved 537 decoy compounds. These decoy compounds obtained from the DUD-E database contain all the physiochemical properties of the reference compounds, with the exception of different 2D structures. Subsequently, a decoy database (550 compounds-D) was prepared that includes all the actives (41 compounds-A) and the DUD-E outputs (537 compounds). Now, the prepared decoy database was used to screen against the developed 3D-QSAR model. The result revealed that in 1% of the total database the generated model screened 28 decoys and five active compounds overall. This results in 12%, 13%, and 0.78 for RA, EF, and GH, respectively (Tables S2–S4).
Furthermore, the screening performance of the 3D-QSAR model was estimated using the ROC curve (Figure S1), which clearly reveals the balance between the sensitivity (capacity to identify true positive) and the specificity (the capacity to exclude false positives) of the dataset used. Additionally, the ROC value is predominantly used to assess the overall performance of the generated model. In the current study, a total of 550 compounds were used. These compounds were ranked based on the activity values predicted by the 3D-QSAR model, which subsequently estimates the ROC. Here, the ROC was 0.94, which suggests that the selected model exhibited an ideal screening performance by distinguishing the active molecules from the inactive ones. This further demonstrates that the model is reliable, and can be readily used to screen different sets of compounds. Consequently, the AUC and RIE values were 0.90 and 8.26 from the screening performance evaluation for the selected model, respectively. The resulting AUC value closer to 1 and the large positive RIE value signify additional support to the screening performance evaluation exhibited by the selected model.
Overall, the enrichment validation results attained using the decoy molecules confirm that the developed 3D-QSAR model is robust and contains rational properties that are required for the virtual screening of different sets of compounds.

3.5. Contour Map Analysis

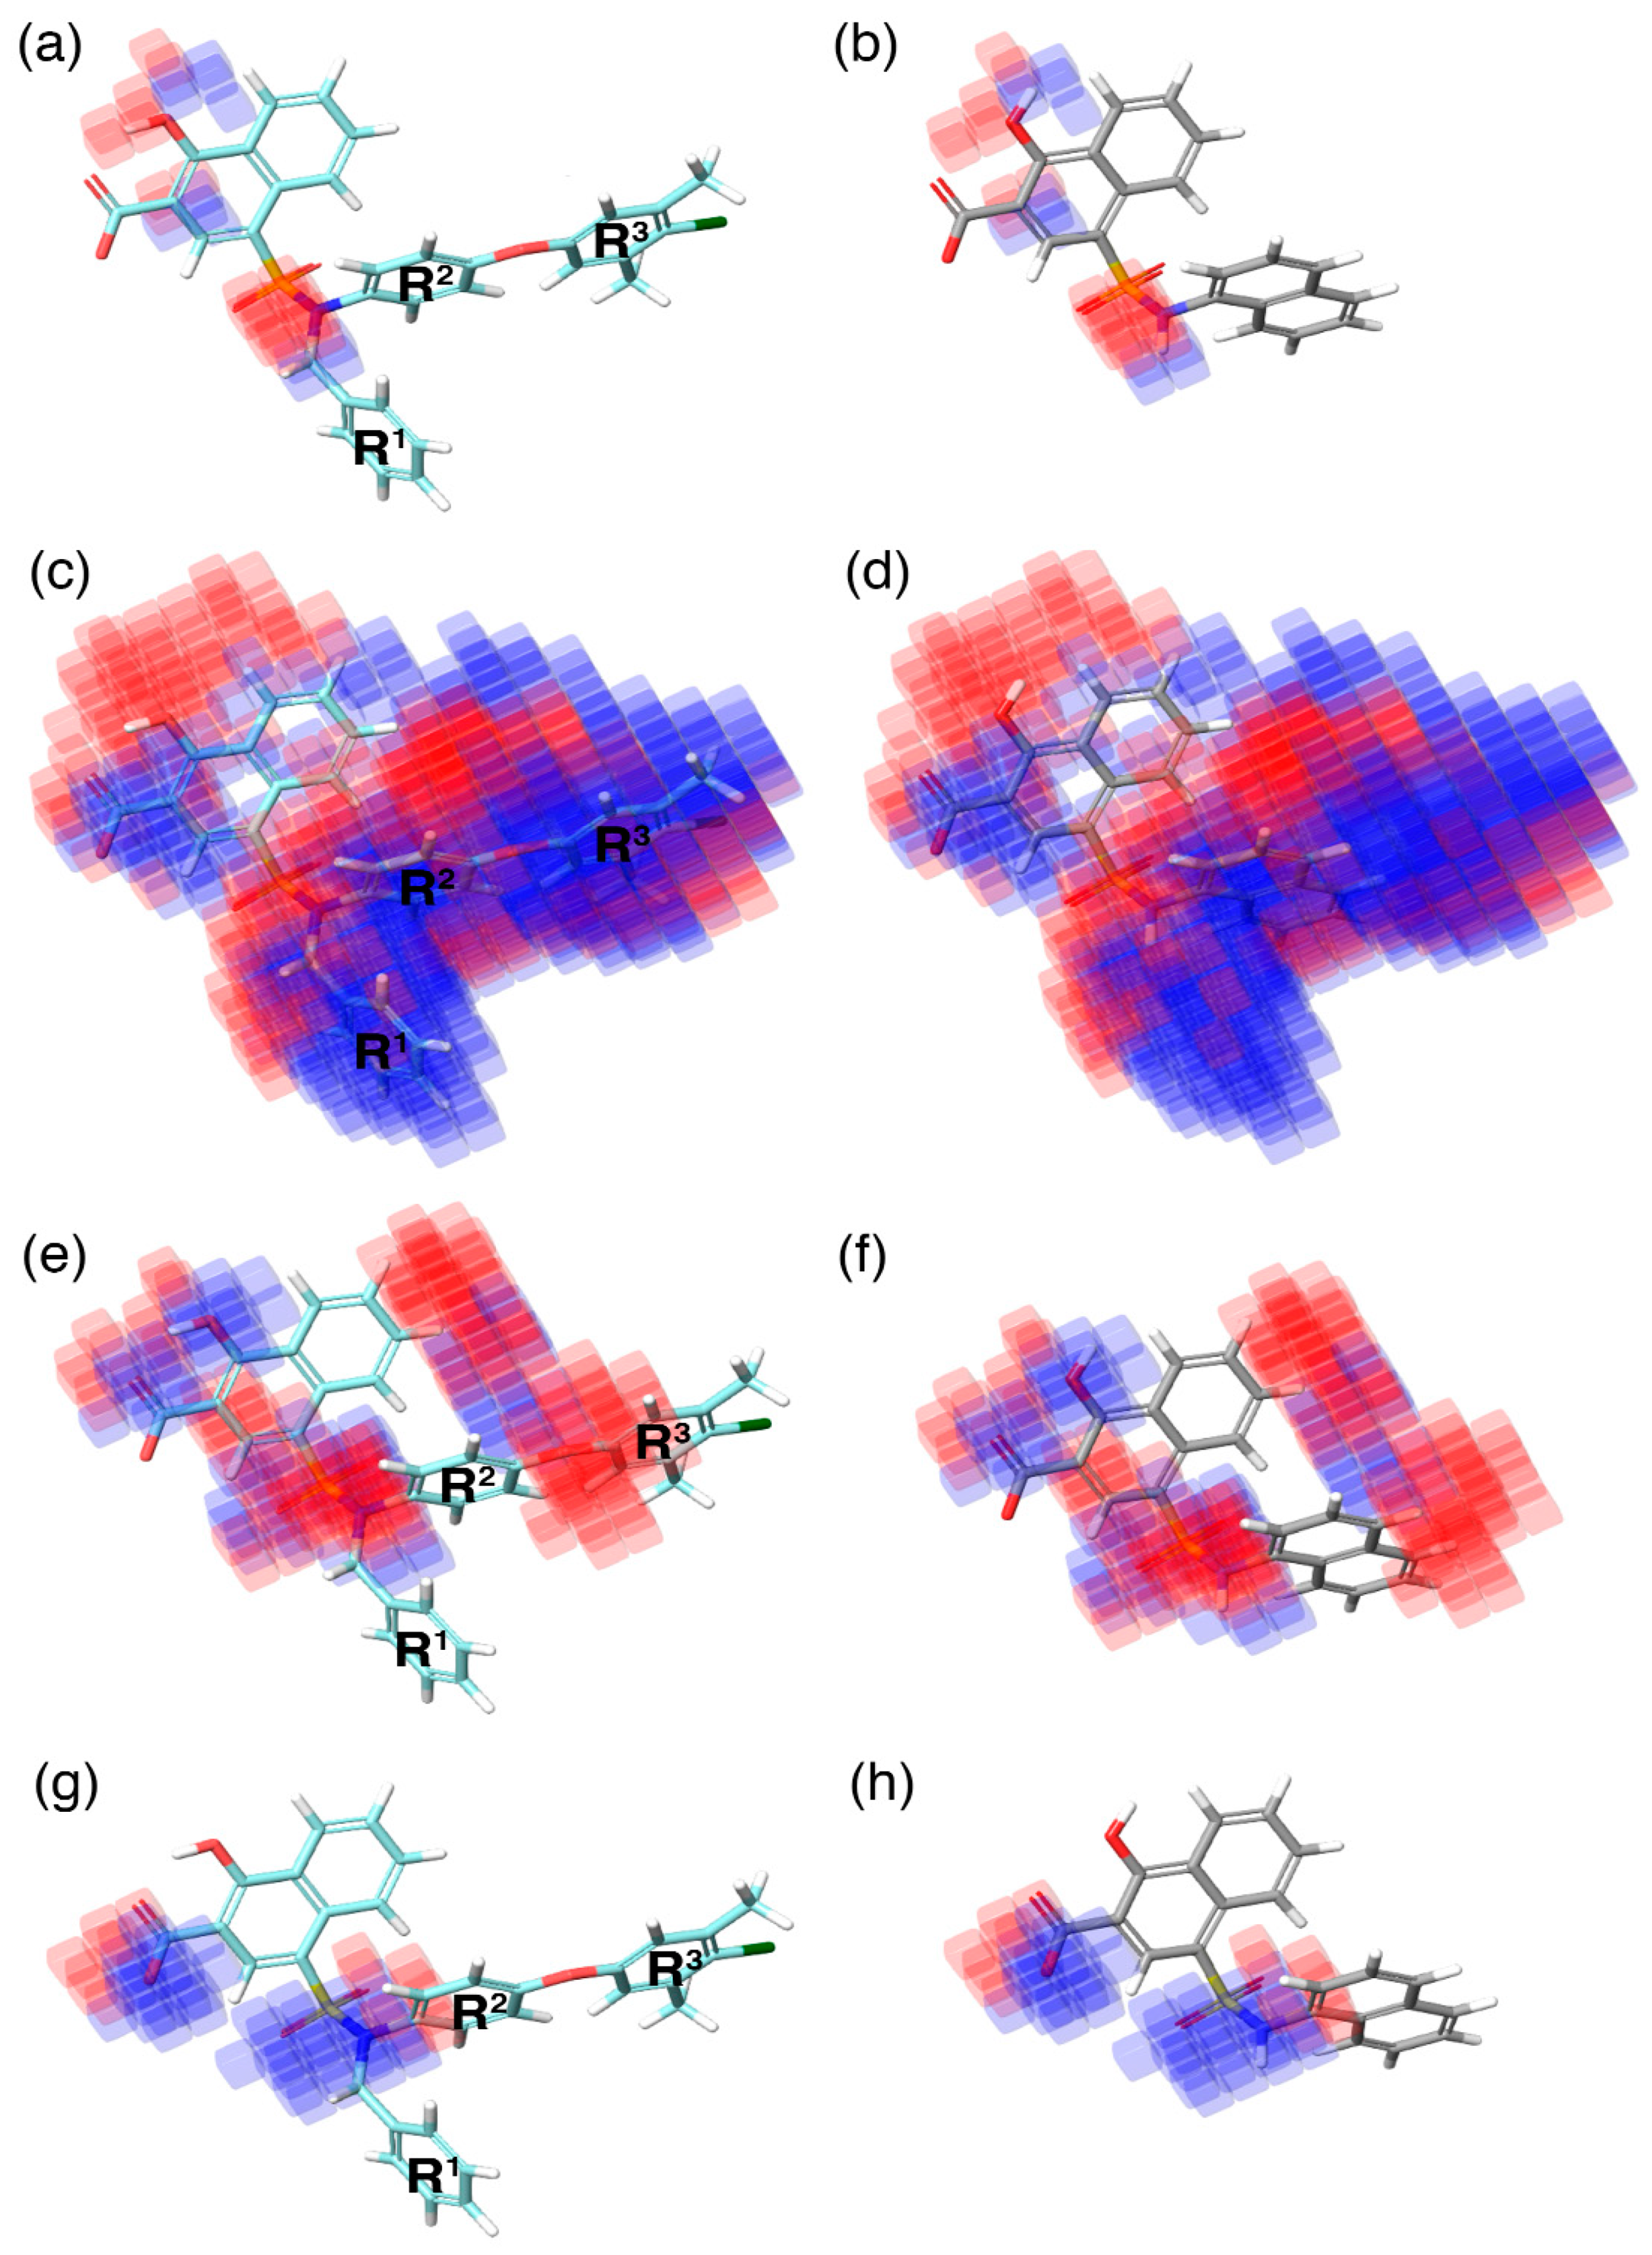
During QSAR model building, the phase program in the Schrödinger suite produces a 3D contour map. This contour map highlights the favorable (highlighted in blue) and unfavorable (highlighted in red) regions exhibited by an individual molecular property in correlation with the 3D–QSAR model (Figure 5). These individual molecular properties are associated with the positive and negative regression coefficient scores generated by the phase program using the chemical dataset alignment. Subsequently, these scores can predict the contribution of a specific region of the model to the positive or negative effect towards activity.
In the current study, the contour maps developed using the training dataset revealed four different components—i: hydrogen bond donor, ii: hydrophobic iii: negative ionic, and iv: electron withdrawal—that are crucial for the activity. These contour maps comprise blue and red spots that are graphically inspected (Figure 5). In order to gain comprehensive insights into the reactive effect of a specific atomic position, the highly active—C40—and least active—C1—compounds from the dataset was superposed over the different contours that comprise individual molecular properties.
(i) The contour map corresponding to the hydrogen bond donor (Figure 5a,b) component is superposed with C40 (Figure 5a), displayed as blue cubes distributed proximal to the aromatic rings of the naphthalene, and the sulfonamide NH group that bridges the R1, R2, and R3 substitutions. This suggests that the presence of a donor substitution (e.g., N, O, P, or S) at this position may favor the formation of an electrostatic interaction. Contrastingly, the red contours situated proximal to the sulfonamide oxygen and the hydroxyl group of the naphthalene ring of C40 show that the hydrogen bond donor substitutions are not favored.
(ii) The contour map for hydrophobic characteristics (Figure 5c,d) displays blue cubes highly distributed proximal to the R1, R2, and R3 regions of C40 (Figure 5c). This result reveals that the multiple phenyl substitutions—R1, R2, and R3 regions—of the C40 may enhance the hydrophobicity, and might play a major role in its higher activity. Additionally, this result is supported by our docking analysis (see below), which also predicts that the phenyl groups at the R1 and R3 positions form π–π interactions with the side-chain aromatic ring of F254 and F270, respectively, whereas, the relatively weak red spots distributed around the sulfonamide and the naphthalene ring position of the C40 denote that these regions are unfavorable to the hydrophobicity. In comparison with C40, the C1 compound lacks substitutions at this position, which is the major reason behind the weak hydrophobicity (Figure 5d).
(iii) Furthermore, the contour of the negative ionic feature was superposed on C40 and C1 (Figure 5e,f). It is observed from the contour maps that the blue cubes are distributed proximal to the carboxylic and hydroxy region of naphthalene ring. This indicates that negative ionic substitutions are favored at this position. The presence of negatively charged oxygen atoms at this position is crucial to establish ionic contact with the R263 of Mcl1, and to stabilize the complexity, whereas the dense red cubes distributed over the oxygen atom that connects the R2 and R3 phenyl rings, and the sulfonamide group that connects the R1, R2, and R3 substitutions to the naphthalene ring, show unfavorable effects.
(iv) Additionally, the electron withdrawal map depicted over C40 and C1 (Figure 5g,h) shows the blue cubes distributed around the carboxylic group of the naphthalene ring, and the sulfonamide group that connects multiple phenyl groups. This predicts that electron-accepting substitutions (such as N or O) at this position may be favorable to the activity.
Thus, the contour map visualization gives us the ability to assess the (i) individual molecular properties and (ii) the volume occupied by the compounds in three-dimensional space.
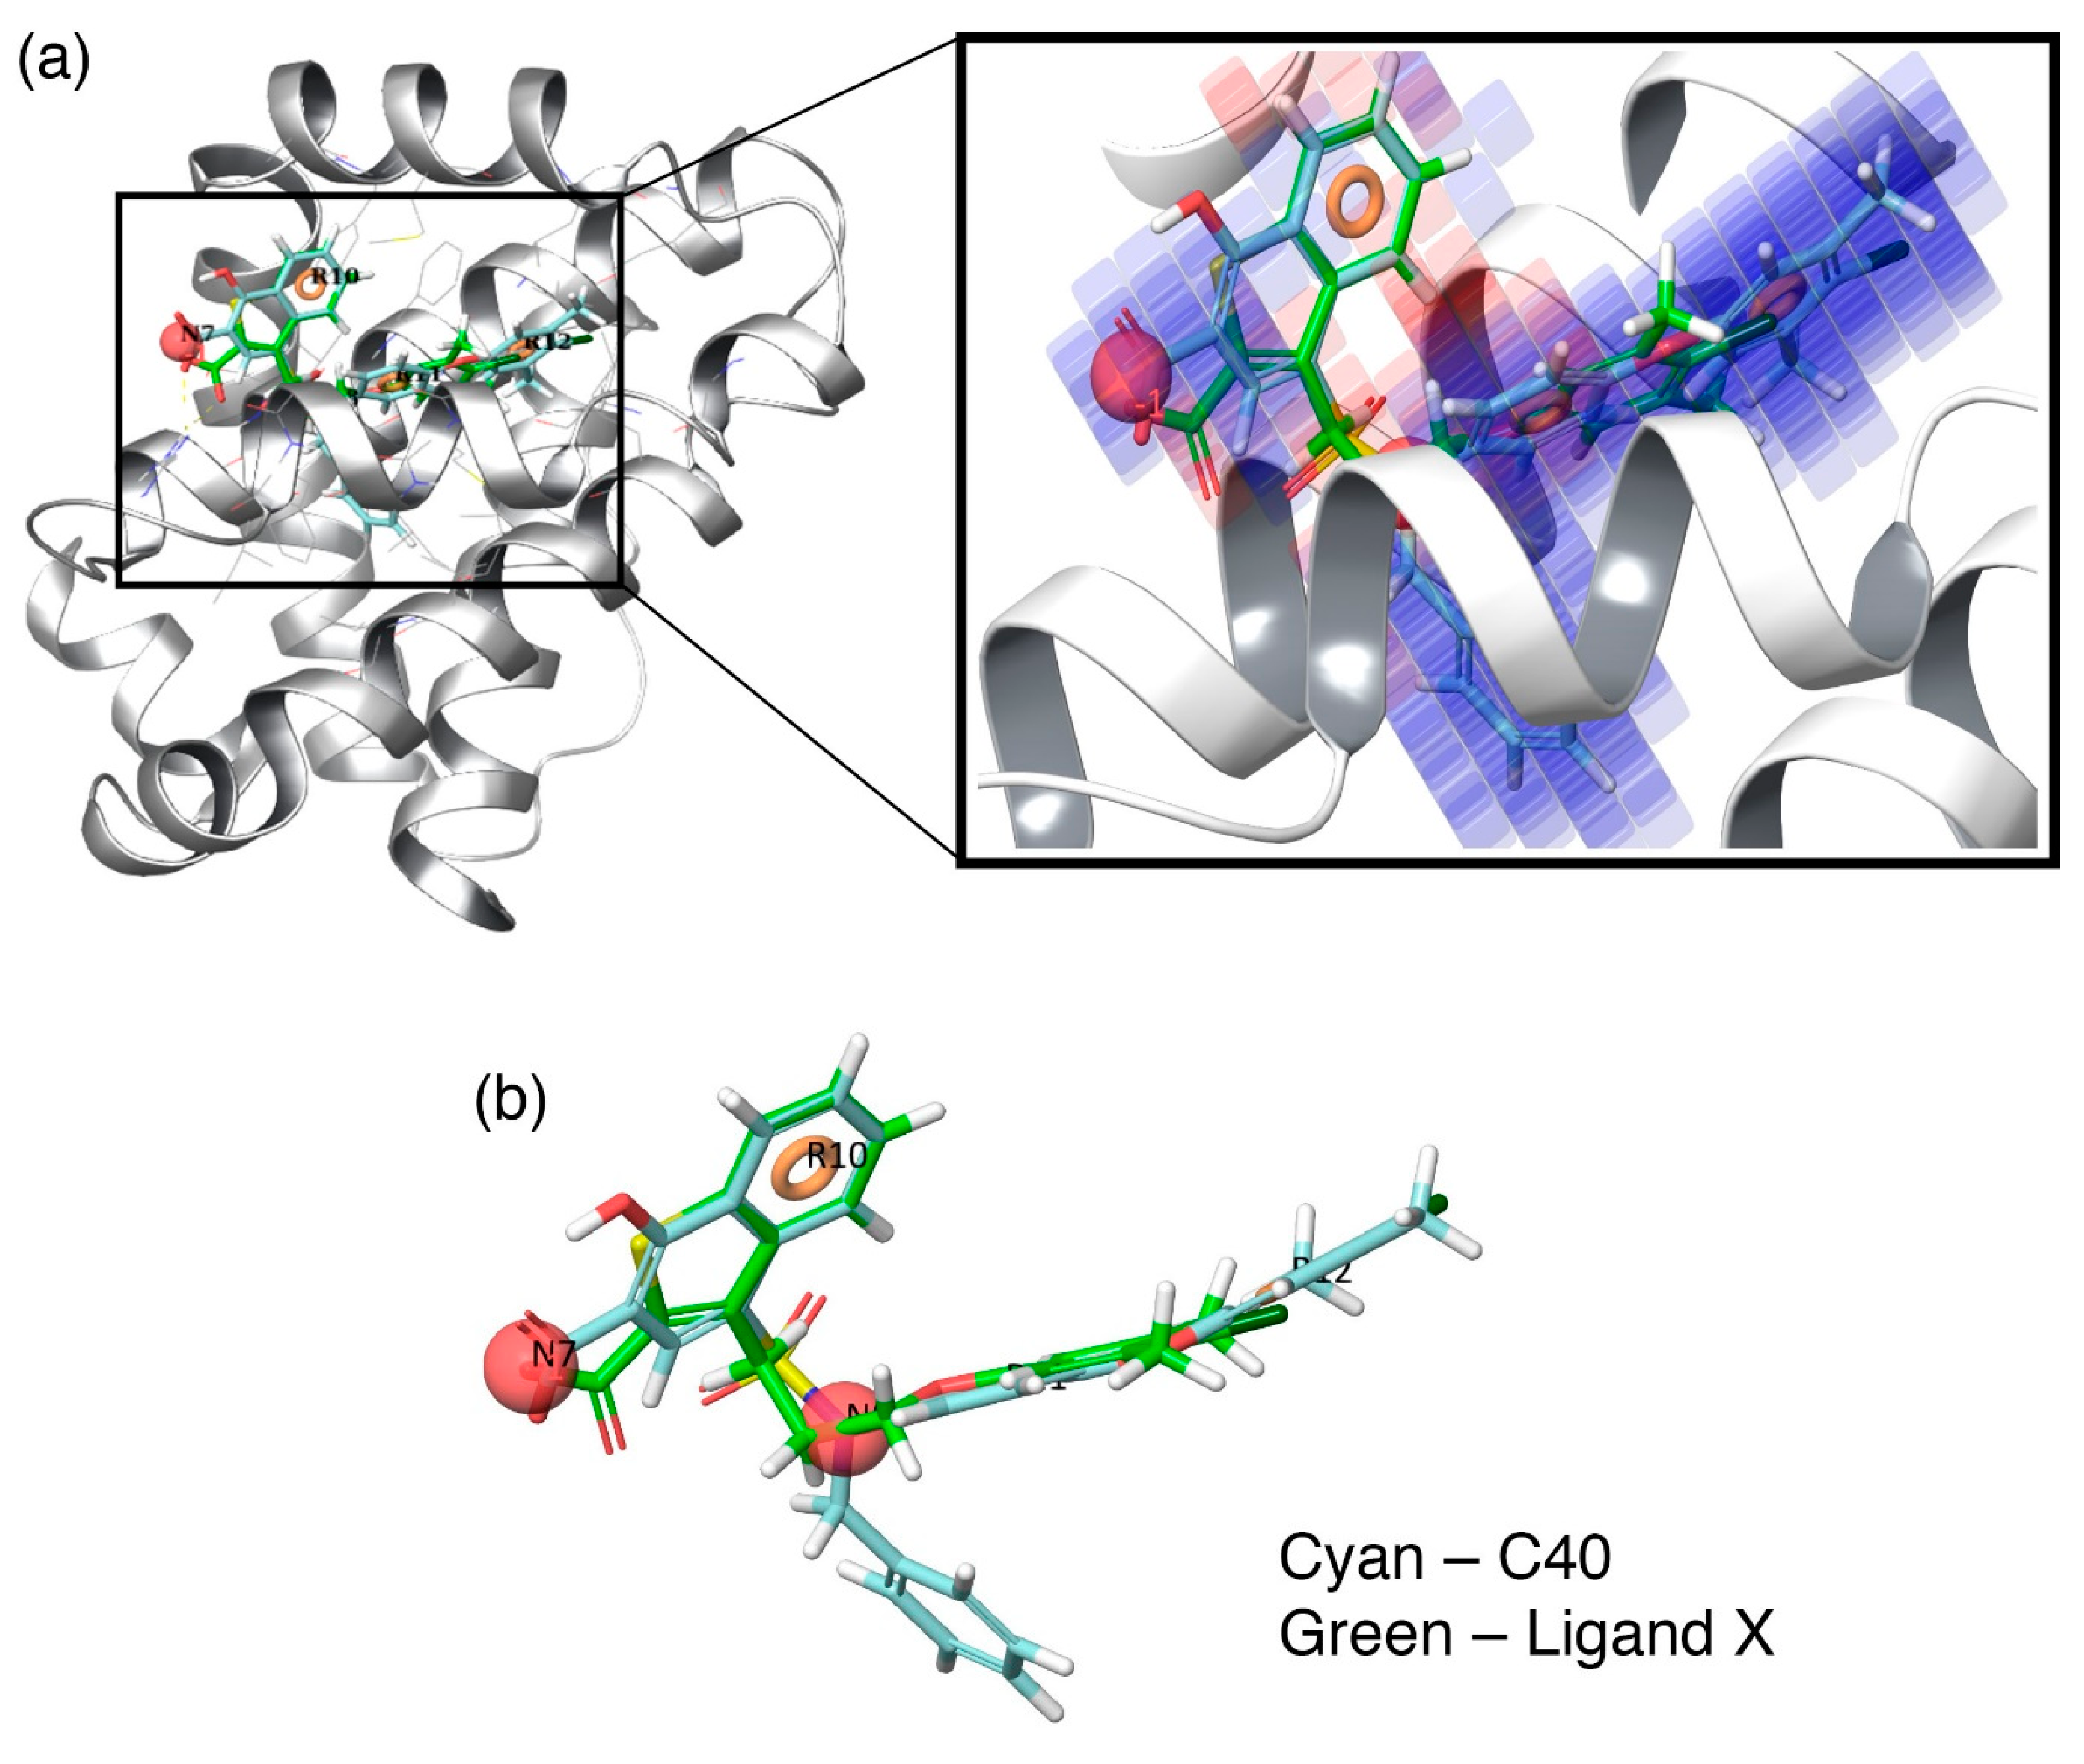
Additionally, to visualize the contributions of the individual molecular properties towards protein binding, the hydrophobic contour map (which exhibits the maximal regression coefficient) was superposed at the binding pocket of Mcl1 (Figure 6). Figure 6a clearly highlights the specific region of the contour map’s contribution to the activity inside the hydrophobic pocket of Mcl1. For more clarity, the predicted binding pose of the highly active compound—C40—were superposed over the crystal ligand X (Figure 6b), which indicates that the head naphthyl moiety and the tail 4-chloro-3,5-dimethylphenyl regions are aligned well, while the benzyl group is buried well inside the P2 pocket of Mcl1. Conclusively, the selected pharmacophore—NNRRR—based 3D-QSAR model can be used as a position constraint to screen a new chemical compound database that may contain novel scaffold with high binding affinity to inhibit Mcl1 activity.

3.6. Identifying Novel Inhibitors

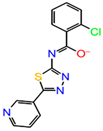
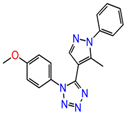
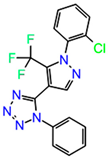
The generated five-site pharmacophore hypothesis—NNRRR—was used to identify new inhibitors with a novel scaffold that matches the molecular properties predicted by the 3D-QSAR model. To obtain new inhibitors that could potentially target the hydrophobic binding groove of Mcl1, lead-like compounds from ZINC (6,053,287) and Maybridge (51,775) was used. All default parameters were applied to screen the database of chemical compounds to match the predicted 3D features to each of the five inter-feature distances. There was a total of 6078 hit compounds, comprising 5935 and 143 identified by the pharmacophore model from ZINC and Maybridge databases, respectively. Subsequently, all the hit compounds were filtered for ADME and Lipinski’s rule-of-five properties using the QikProp program. The hit compounds were filtered based on 44 different physicochemical descriptors generated by QikProp. Finally, 17 compounds survived the filtering procedure. Consequently, the top five compounds were selected as the representatives and presented (Table 5). These compounds may have properties that could inhibit Mcl1 activity. These hit compounds require further experimental validation.

3.7. Molecular Docking Analysis

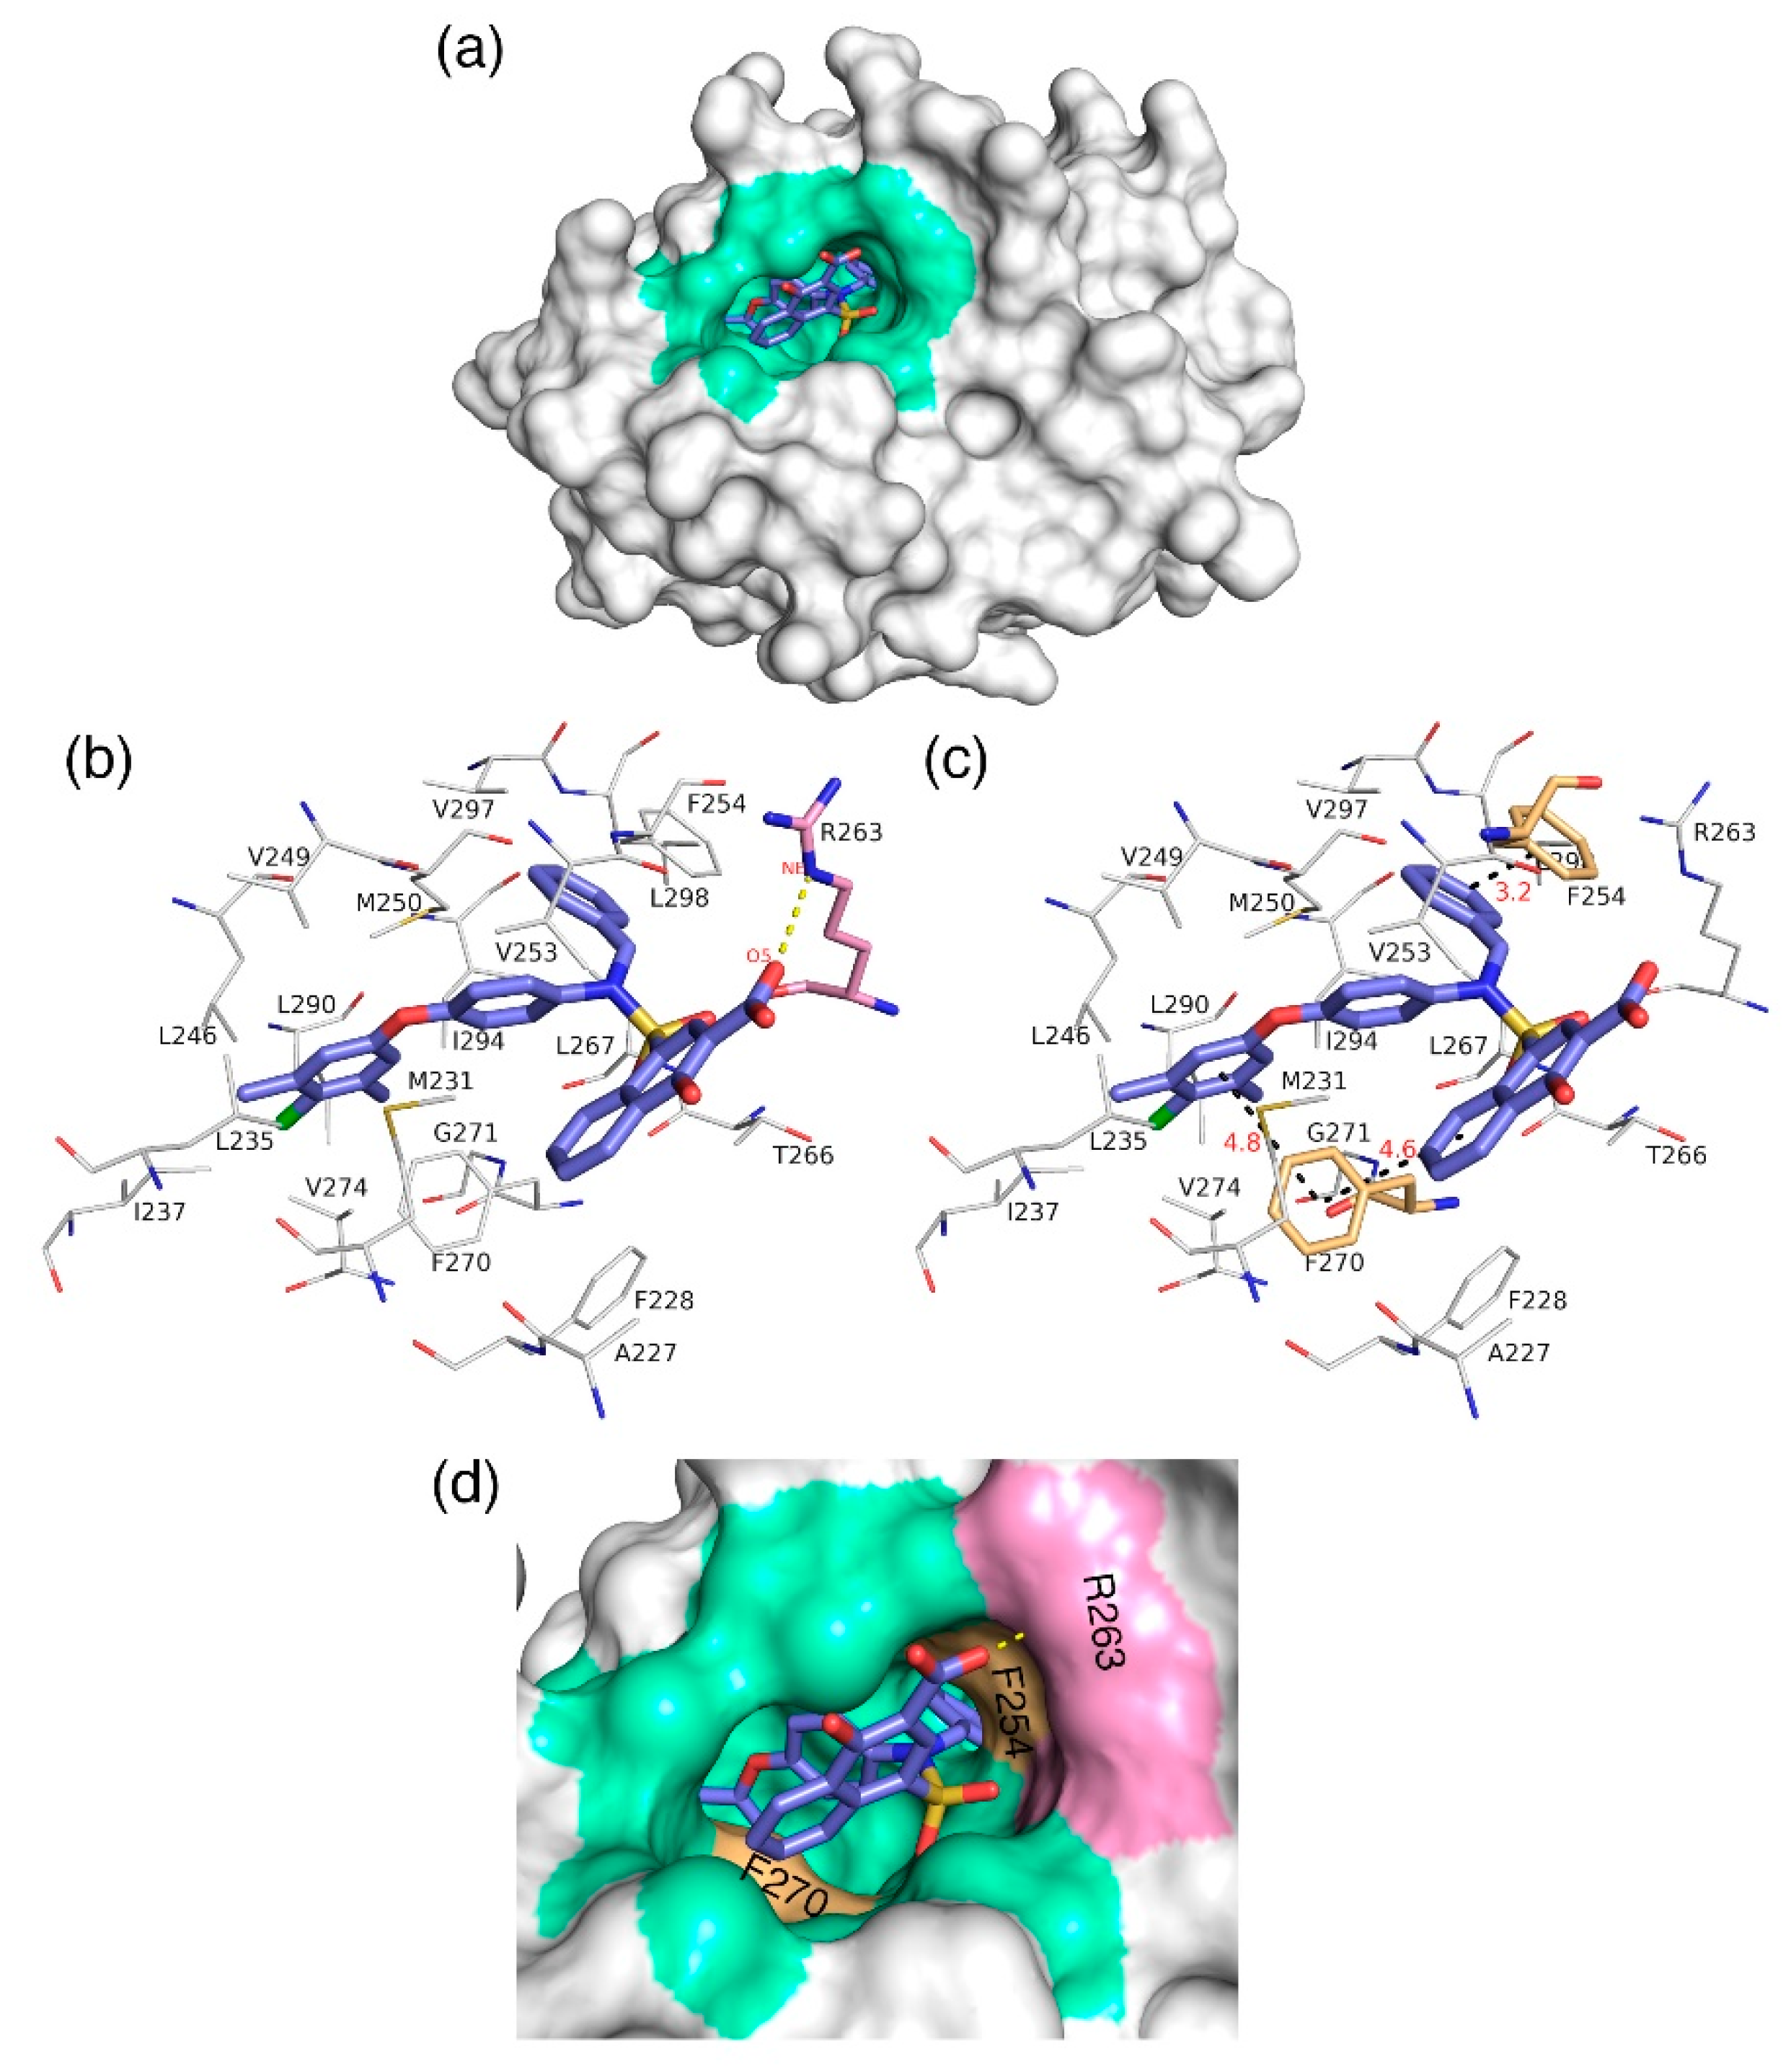
The docking analysis aims to predict the low-energy conformational pose of a given ligand on the binding pocket of a protein. Here, the compound with high inhibitory activity—C40 with Ki = 0.031 µM—was selected from the dataset and subjected to docking at the hydrophobic binding pocket of Mcl1 (Figure 7) using the glide program available in the Schrödinger suite. Subsequently, the docking runs generated 79 low-energy conformational poses. Furthermore, the ensemble of ligand poses was investigated, and the best conformation was selected based on the docking score (−24.30 kcal/mol—Table 6) and a graphical inspection of bonded and non-bonded contacts. Here, the preliminary docking analysis reveals that (a) good alignment was observed between the crystal ligand X and the low-energy conformational pose of the highly active compound—C40—from the dataset, and (b) the docked ligand—C40—was surrounded by A227, F228, M231, L235, I237, L246, V249, M250, V253, F254, R263, T266, L267, F270, G271, V274, L290, I294, V297, and L298 residues at the Mcl1 binding pocket by covering a larger area of interaction.
Further analysis shows that the electrostatic interaction stabilizes the predicted low-energy conformational pose of C40 inside the binding pocket of Mcl1. This electrostatic interaction takes place between the negatively charged carboxylic acid group of C40 and the positively charged side-chain atom of R263, i.e., between the O5 atom of C40 and the NH atom from the guanidium side-chain of R263. Apart from the strong electrostatic interaction, the predicted low-energy conformational pose of C40 was further stabilized by a series of π–π interactions. These π–π interactions occurred between the (i) naphthyl moiety and (ii) the chlorobenzene of C40 with the side-chain benzene ring of F270; and the (iii) benzene ring that inserts deep into the P2 pocket with these side-chain benzene ring of F254 of Mcl1. From the figure, it is observed that these π–π interactions help to anchor the C40 in place, enhancing the complex’s stability. The distances between residues involved in the π–π interactions are depicted in Figure 7c. Furthermore, the rest of the surrounding hydrophobic residues provide additional strength for complex stability via non-bonded interactions.
3.8. MD Simulations of Docked Complex

In our previous investigation, MD simulation was widely applied to Bcl-2 family proteins to gain an understanding on the mechanism of action [37,39,40,56]. Likewise, the current study is an attempt to extend our understanding of the molecular mechanism of Mcl1 with the highly active compound from the dataset—C40—used to construct the 3D-QSAR model. Consequently, the molecular mechanism of interaction and its stability during the MD simulation were analyzed.

3.8.1. Stability Analysis of Mcl1–C40 Complex by RMSD

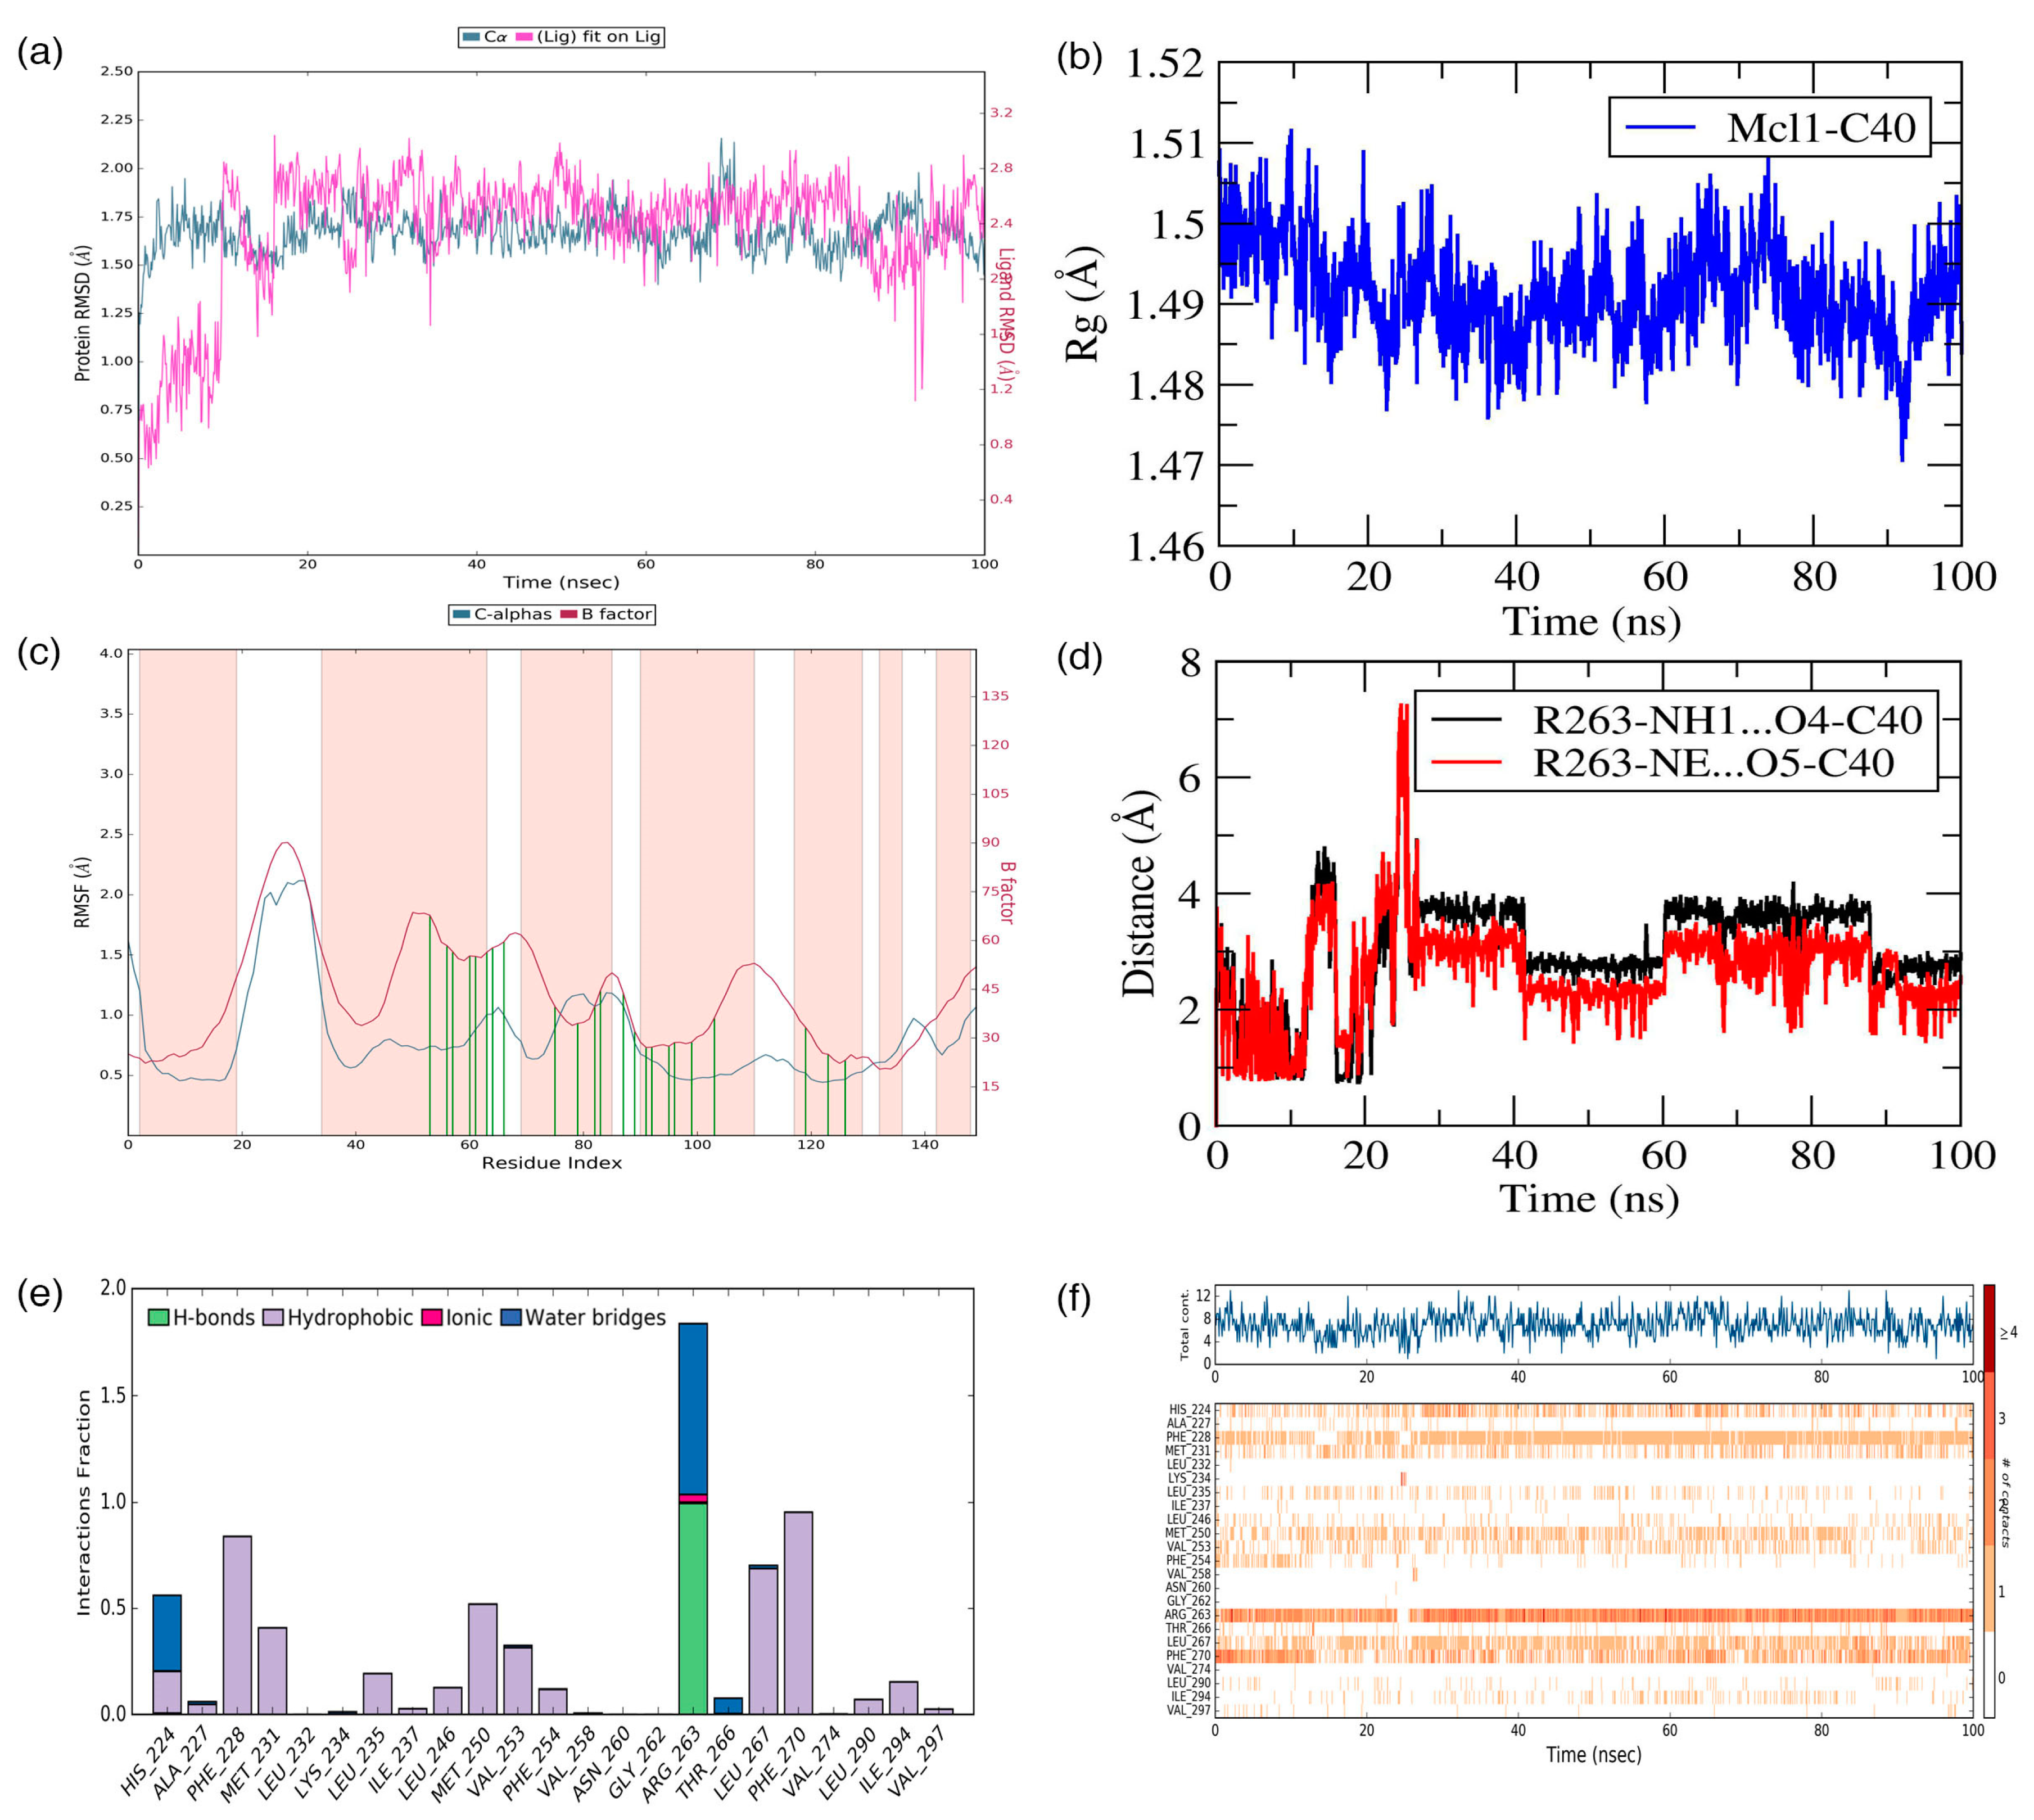
Initially, the structural deviations of the Cα atoms during the MD simulation for Mcl1 and C40 were calculated individually for each time point throughout the simulation by RMSD analysis (Figure 8a). The RMSD analysis provides insight into the change in structural conformation of Mcl1 over time. Here, the figure shows that the Mcl1 attained the equilibrium phase from the starting time until the end of the simulation, indicating that the MD simulation has equilibrated quite well. The RMSD value for Mcl1 is ~1.6 Å.
Simultaneously, ligand RMSD analysis was performed to gain insights about the stability of ligand interactions with the binding pocket of Mcl1. The RMSD values of the ligand were obtained by comparing ligand coordinates during the MD simulation against the initial conformation. Further observation in Figure 8a revealed that the compound C40 experienced more deviation during the early part of the simulation, i.e., until 20 ns; and then reached the equilibrium phase and maintained until the end of the simulation with an RMSD value of ~1.75 Å.

3.8.2. Stability Analysis of Mcl1–C40 Complex by Radius of Gyration (Rg)

The stability of the system can be examined through the Rg approach by comparing all Cα coordinates to the initial frame during the MD simulation. Typically, Rg measures the overall differences in the protein structure due to ligand binding, which can be defined as the root mean squared distance of the collection of atoms from its common center-of-mass. Here, the Rg analysis was carried out for the Mcl1–C40 complex over time (Figure 8b). Figure 8b shows that the Rg values was maintained at ~1.48 to 1.5 Å for the studied complex, which in turn clearly demonstrates that Mcl1 experienced only a negligible amount of conformational change (between 1.48 to 1.5 Å) due to C40 binding.

3.8.3. Stability Analysis of Mcl1–C40 Complex by RMSF

Next, a structural flexibility analysis was performed on all the Cα atoms in Mcl1 for each time point throughout the simulation by RMSF analysis (Figure 8c). Here, the RMSF analysis was performed to gain insight into local changes in the Mcl1 structure. The peaks in the RMSF graph highlight the region of Mcl1 that experienced fluctuations during the MD simulation. A deeper investigation in Figure 8c reveals that the (i) N– and C– portions and (ii) the loop regions of the Mcl1 experienced expected fluctuations. Furthermore, (iii) the binding site region where C40 interacts with Mcl1 experienced minor fluctuations (green lines). These contact residues permit C40 to explore the Mcl1 binding pocket to find an energetically favorable position and establish a tight interaction with its surroundings.

3.8.4. Interface Analysis during MD Simulation

To gain insights into the molecular mechanism of protein–ligand binding during MD simulation, the Mcl1–C40 complex interface was investigated using the MD trajectory. The preliminary observation on the trajectory displays that C40 did not experience any dissociation from the Mcl1 binding cavity during the MD simulation. Instead, C40 involved direct interaction with the surrounding residues. The C40 fits well deep inside the Mcl1 binding cavity with a low-energy conformational state and remained stable during the MD simulation. Furthermore, the bonded and non-bonded interactions were also examined at the Mcl1 binding pocket region using a representative snapshot collected from the equilibrium phase of the MD trajectory.
The interface analysis reveals that electrostatic and hydrophobic interactions play a major role in ligand binding (Figure 8d–f). In particular, a salt bridge interaction between R263 and the oxygen atom of C40 plays a significant role by exhibiting a strong influence on the complex stability. It is important to know the evolution of the salt bridge interaction between Mcl1 and C40 over a period of time. Therefore, the distances between the side-chain NH1 and NH atoms in the guanidium group of R263 and the side-chain carboxylic acid of C40 were measured (Figure 8d).
The graph clearly points out that the distances between the donor and acceptor atoms of C40 and Mcl1 remained consistent throughout the simulation. The distances are approximately 3.0 and 3.2 Å, respectively. Additionally, the interacting frequencies for binding site residues with C40 were monitored (Figure 8e). The figure displays that R263 interacts with C40 at a higher frequency than the other residues. This clarifies that the salt bridge contact plays a major role in maintaining C40 inside the binding pocket of Mcl1.
Apart from the hydrogen bond interactions, the hydrophobic contacts present at the Mcl1–C40 interface provide further strength to the complex stability (Figure 8f). The figure reveals that C40 is constantly surrounded by hydrophobic residues, such as A227, F228, M231, L232, L235, I237, L246, M250, V253, F254, V258, G262, L267, F270, V274, L290, I294, and V297, during the simulation. Among these ensembles, the F228, M250, L267, and F270 residues established strong contact with C40 for more than 70% of the simulation time. This explains that these residues are involved in a constant interaction with C40 for a longer time period and play a major role in complex stability.

4. Conclusions

In summary, we attempted to explore crucial molecular properties and the mechanism of binding using a known series of N-substituted 1-hydroxy-4-sulfamoyl-2-naphthoate inhibitor targeting Mcl1. Multiple computational tools provided a great advantage. In the current investigation, we extended our understanding of the crucial molecular properties of the known inhibitor series responsible for its activity. For this, a five-site pharmacophore-based 3D-QSAR model—NNRRR—was developed that exhibited high confidence scores. External validation performed on the 3D-QSAR model revealed that the selected model has high predictive power. Subsequently, the highly active compound—C40—docked at the Mcl1 binding pocket revealed a low-energy conformational pose, together with a conserved charged interaction with R263 of Mcl1. Furthermore, the MD simulation on the docked complex demonstrated the molecular mechanism of binding over a period of time. The extensive MD analysis predicted the crucial residues—F228, M250, R263, L267, and F270—that have more impact on the complex stability for an N-substituted 1-hydroxy-4-sulfamoyl-2-naphthoate compound series. Utilizing the information available in this intense area of research is inevitable, as the results obtained from the current investigation may act as initial guidelines for the discovery of a novel Mcl1 inhibitor.

Supplementary Materials

The following are available online at https://www.mdpi.com/2227-9717/7/4/224/s1, Table S1: The chemical datasets used for 3D-QSAR model constructions along with its activity values (ChEMBL assay id: 3779852); Table S2: Count and percentage of Decoys; Table S3: Count and percentage of actives; Table S4: Enrichment factors with respect to N% sample size; Figure S1: ROC curve obtained for the model NNRRR against randomly curve.

Author Contributions

K.S. and P.K.B. contributed equally to data curating, validation, formal analysis and writing; M.P. was responsible for the methodology, conceptualization, supervision, and review and editing.

Acknowledgments

M.P. gratefully acknowledges the use of the bioinformatics infrastructure facility supported by Biocenter Finland and thanks CSC-IT Center for Science (Project: 2000461) for the computational facility; Jukka Lehtonen for the IT support; Mark Johnson (SBL), Åbo Akademi University for providing the lab facility; and Outi Salo-Ahen (Pharmacy), Åbo Akademi University for support and discussion. No specific grant from funding agencies in the public, commercial, or not-for-profit sectors was involved in this research.

Conflicts of Interest

The authors declare no potential conflict of interest.

Abbreviations

Mcl1Myeloid Cell Leukemia 1
Bcl-2B cell leukemia 2
AAPAnti-apoptotic protein
PAPPro-apoptotic peptides
QSARQuantitative Structure–Activity Relationship
PLSPartial Least squared
MDMolecular Dynamics Simulations
RMSERoot mean squared error
RMSDRoot mean squared deviation
RMSFRoot mean squared fluctuation
RgRadius of gyration

References

  1. Timucin, A.C.; Basaga, H.; Kutuk, O. Selective targeting of antiapoptotic BCL-2 proteins in cancer. Med. Res. Rev. 2019, 39, 146–175. [Google Scholar] [CrossRef]
  2. Chan, S.L.; Yu, V.C. Proteins of the bcl-2 family in apoptosis signalling: From mechanistic insights to therapeutic opportunities. Clin. Exp. Pharmacol. Physiol. 2004, 31, 119–128. [Google Scholar] [CrossRef]
  3. Marsden, V.S.; Strasser, A. Control of apoptosis in the immune system: bcl-2, bh3-only proteins and more. Annu. Immunol. 2003, 21, 71–105. [Google Scholar] [CrossRef] [PubMed]
  4. Michels, J.; Johnson, P.W.; Packham, G. Mcl-1. Int. J. Biochem. Cell Biol. 2005, 37, 267–271. [Google Scholar] [CrossRef] [PubMed]
  5. Day, C.L.; Chen, L.; Richardson, S.J.; Harrison, P.J.; Huang, D.C.; Hinds, M.G. Solution structure of prosurvival Mcl-1 and characterization of its binding by proapoptotic BH3-only ligands. J. Biol. Chem. 2005, 280, 4738–4744. [Google Scholar] [CrossRef] [PubMed]
  6. Akgul, C. Mcl-1 is a potential therapeutic target in multiple types of cancer. Cell. Mol. Life Sci. 2009, 66, 1326–1336. [Google Scholar] [CrossRef]
  7. Friberg, A.; Vigil, D.; Zhao, B.; Daniels, R.N.; Burke, J.P.; Garcia-Barrantes, P.M.; Camper, D.; Chauder, B.A.; Lee, T.; Olejniczak, E.T.; et al. Discovery of potent myeloid cell leukemia 1 (Mcl-1) inhibitors using fragment-based methods and structure-based design. J. Med. Chem. 2013, 56, 15–30. [Google Scholar] [CrossRef]
  8. Wesarg, E.; Hoffarth, S.; Wiewrodt, R.; Kröll, M.; Biesterfeld, S.; Huber, C.; Schuler, M. Targeting BCL-2 family proteins to overcome drug resistance in non-small cell lung cancer. Int. J. Cancer 2007, 121, 2387–2394. [Google Scholar] [CrossRef] [PubMed]
  9. Peddaboina, C.; Jupiter, D.; Fletcher, S.; Yap, J.L.; Rai, A.; Tobin, R.P.; Jiang, W.; Rascoe, P.; Rogers, M.K.N.; Smythe, W.R.; et al. The downregulation of Mcl-1 via USP9X inhibition sensitizes solid tumors to Bcl-xl inhibition. BMC Cancer 2012, 12, 541. [Google Scholar] [CrossRef] [PubMed]
  10. Fire, E.; Gullá, S.V.; Grant, R.A.; Keating, A.E. Mcl-1-Bim complexes accommodate surprising point mutations via minor structural changes. Protein Sci. 2010, 19, 507–519. [Google Scholar] [CrossRef] [PubMed]
  11. Liu, Q.; Moldoveanu, T.; Sprules, T.; Matta-Camacho, E.; Mansur-Azzam, N.; Gehring, K. Apoptotic Regulation by MCL-1 through Heterodimerization. J. Biol. Chem. 2010, 285, 19615–19624. [Google Scholar] [CrossRef] [PubMed]
  12. Stewart, M.L.; Fire, E.; E Keating, A.; Walensky, L.D. The MCL-1 BH3 helix is an exclusive MCL-1 inhibitor and apoptosis sensitizer. Nat. Methods 2010, 6, 595–601. [Google Scholar] [CrossRef] [PubMed]
  13. Cao, X.; Yap, J.L.; Newell-Rogers, M.K.; Peddaboina, C.; Jiang, W.; Papaconstantinou, H.T.; Jupitor, D.; Rai, A.; Jung, K.-Y.; Tubin, R.P.; et al. The novel BH3 α-helix mimetic JY-1-106 induces apoptosis in a subset of cancer cells (lung cancer, colon cancer and mesothelioma) by disrupting Bcl-xL and Mcl-1 protein–protein interactions with Bak. Mol. Cancer 2013, 12, 42. [Google Scholar] [CrossRef]
  14. Foight, G.W.; Ryan, J.A.; Gullá, S.V.; Letai, A.; Keating, A.E. Designed BH3 Peptides with High Affinity and Specificity for Targeting Mcl-1 in Cells. ACS Chem. Biol. 2014, 9, 1962–1968. [Google Scholar] [CrossRef]
  15. Fogha, J.; Marekha, B.; De Giorgi, M.; Voisin-Chiret, A.S.; Rault, S.; Bureau, R.; Santos, J.S.-D.O. Toward Understanding Mcl-1 Promiscuous and Specific Binding Mode. J. Chem. Inf. Model. 2017, 57, 2885–2895. [Google Scholar] [CrossRef]
  16. Modi, V.; Sankararamakrishnan, R. Binding affinity of pro-apoptotic BH3 peptides for the anti-apoptotic Mcl-1 and A1 proteins: Molecular dynamics simulations of Mcl-1 and A1 in complex with six different BH3 peptides. J. Mol. Graph. Model. 2017, 73, 115–128. [Google Scholar] [CrossRef] [PubMed]
  17. Placzek, W.J.; Sturlese, M.; Wu, B.; Cellitti, J.F.; Wei, J.; Pellecchia, M. Identification of a Novel Mcl-1 Protein Binding Motif. J. Biol. Chem. 2011, 286, 39829–39835. [Google Scholar] [CrossRef] [PubMed]
  18. Escudero, S.; Luccarelli, J.; Lee, S.; Wales, T.E.; Cohen, D.T.; Gallagher, C.G.; Cohen, N.A.; Huhn, A.J.; Bird, G.H.; Engen, J.R.; et al. Allosteric inhibition of antiapoptotic MCL-1. Nat. Struct. Mol. Biol. 2016, 23, 600–607. [Google Scholar]
  19. Joseph, T.L.; Lane, D.P.; Verma, C.S. Stapled BH3 Peptides against MCL-1: Mechanism and Design Using Atomistic Simulations. PLoS ONE 2012, 7, e43985. [Google Scholar] [CrossRef] [PubMed]
  20. Berger, S.; Procko, E.; Margineantu, D.; Lee, E.F.; Shen, B.W.; Zelter, A.; Silva, D.-A.; Chawla, K.; Herold, M.J.; Garnier, J.-M.; et al. Computationally designed high specificity inhibitors delineate the roles of BCL2 family proteins in cancer. eLife 2016, 5, 1422. [Google Scholar] [CrossRef]
  21. Brouwer, J.M.; Lan, P.; Cowan, A.D.; Bernardini, J.P.; Birkinshaw, R.W.; Van Delft, M.F.; Sleebs, B.E.; Robin, A.Y.; Wardak, A.; Tan, I.K.; et al. Conversion of Bim-BH3 from Activator to Inhibitor of Bak through Structure-Based Design. Mol. Cell 2017, 68, 659–672. [Google Scholar] [CrossRef]
  22. Lee, T.; Bian, Z.; Zhao, B.; Hogdal, L.J.; Sensintaffar, J.L.; Goodwin, C.M.; Belmar, J.; Shaw, S.; Tarr, J.C.; Veerasamy, N.; et al. Discovery and biological characterization of potent myeloid cell leukemia-1 inhibitors. Febs Lett. 2017, 591, 240–251. [Google Scholar] [CrossRef] [PubMed]
  23. Luan, S.; Ge, Q.; Chen, Y.; Dai, M.; Yang, J.; Li, K.; Liu, D.; Zhao, L. Discovery and structure-activity relationship studies of N-substituted indole derivatives as novel Mcl-1 inhibitors. Bioorganic Med. Chem. Lett. 2017, 27, 1943–1948. [Google Scholar] [CrossRef]
  24. Wang, Z.; Xu, W.; Song, T.; Guo, Z.; Liu, L.; Fan, Y.; Wang, A.; Zhang, Z. Fragment-Based Design, Synthesis, and Biological Evaluation of 1-Substituted-indole-2-carboxylic Acids as Selective Mcl-1 Inhibitors. Arch. Pharm. 2017, 350. [Google Scholar] [CrossRef]
  25. Xu, G.; Liu, T.; Zhou, Y.; Yang, X.; Fang, H. 1-Phenyl-1H-indole derivatives as a new class of Bcl-2/Mcl-1 dual inhibitors: Design, synthesis, and preliminary biological evaluation. Bioorganic Med. Chem. 2017, 25, 5548–5556. [Google Scholar] [CrossRef]
  26. Shaw, S.; Bian, Z.; Zhao, B.; Tarr, J.C.; Veerasamy, N.; Jeon, K.O.; Belmar, J.; Arnold, A.L.; Fogarty, S.A.; Perry, E.; et al. Optimization of Potent and Selective Tricyclic Indole Diazepinone Myeloid Cell Leukemia-1 Inhibitors Using Structure-Based Design. J. Med. Chem. 2018, 61, 2410–2421. [Google Scholar] [CrossRef]
  27. Wakui, N.; Yoshino, R.; Yasuo, N.; Ohue, M.; Sekijima, M. Exploring the selectivity of inhibitor complexes with Bcl-2 and Bcl-XL: A molecular dynamics simulation approach. J. Mol. Graph. Model. 2018, 79, 166–174. [Google Scholar] [CrossRef] [PubMed]
  28. Caenepeel, S.; Brown, S.P.; Belmontes, B.; Moody, G.; Keegan, K.S.; Chui, D.; Whittington, D.A.; Huang, X.; Poppe, L.; Cheng, A.C.; et al. AMG 176, a Selective MCL1 Inhibitor, Is Effective in Hematologic Cancer Models Alone and in Combination with Established Therapies. Cancer Discov. 2018, 8, 1582–1597. [Google Scholar] [PubMed]
  29. Ramsey, H.E.; Fischer, M.A.; Lee, T.; Gorska, A.E.; Arrate, M.P.; Fuller, L.; Boyd, K.L.; Strickland, S.A.; Sensintaffar, J.; Hogdal, L.J.; et al. A Novel MCL1 Inhibitor Combined with Venetoclax Rescues Venetoclax-Resistant Acute Myelogenous Leukemia. Cancer Discov. 2018, 8, 1566–1581. [Google Scholar] [CrossRef]
  30. Deeks, E.D. Venetoclax: First Global Approval. Drugs 2016, 76, 979–987. [Google Scholar] [CrossRef]
  31. Gentile, M.; Petrungaro, A.; Uccello, G.; Vigna, E.; Recchia, A.G.; Caruso, N.; Bossio, S.; De Stefano, L.; Palummo, A.; Storino, F.; et al. Venetoclax for the treatment of chronic lymphocytic leukemia. Expert Investig. Drugs 2017, 26, 1307–1316. [Google Scholar] [CrossRef]
  32. Tron, A.E.; Belmonte, M.A.; Adam, A.; Aquila, B.M.; Boise, L.H.; Chiarparin, E.; Cidado, J.; Embrey, K.J.; Gangl, E.; Gibbons, F.D.; et al. Discovery of Mcl-1-specific inhibitor AZD5991 and preclinical activity in multiple myeloma and acute myeloid leukemia. Nat. Commun. 2018, 9, 5341. [Google Scholar] [CrossRef]
  33. Lanning, M.E.; Yu, W.; Yap, J.L.; Chauhan, J.; Chen, L.; Whiting, E.; Pidugu, L.S.; Atkinson, T.; Bailey, H.; Li, W.; et al. Structure-Based Design of N-Substituted 1-Hydroxy-4-sulfamoyl-2-naphthoates as Selective Inhibitors of the Mcl-1 Oncoprotein. Eur. J. Med. Chem. 2016, 113, 273–292. [Google Scholar] [CrossRef] [PubMed]
  34. Balasubramanian, P.K.; Balupuri, A.; Cho, S.J. Molecular modeling studies on series of Btk inhibitors using docking, structure-based 3D-QSAR and molecular dynamics simulation: A combined approach. Arch. Pharmacal. Res. 2016, 39, 328–339. [Google Scholar] [CrossRef]
  35. Balasubramanian, P.K.; Balupuri, A.; Kang, H.-Y.; Cho, S.J. Receptor-guided 3D-QSAR studies, molecular dynamics simulation and free energy calculations of Btk kinase inhibitors. BMC Syst. Biol. 2017, 11, 6. [Google Scholar] [CrossRef] [PubMed]
  36. Balasubramanian, P.K.; Balupuri, A.; Kothandan, G.; Cho, S.J. In silico study of 1-(4-Phenylpiperazin-1-yl)-2-(1H-pyrazol-1-yl) ethanones derivatives as CCR1 antagonist: Homology modeling, docking and 3D-QSAR approach. Bioorganic Med. Chem. Lett. 2014, 24, 928–933. [Google Scholar] [CrossRef]
  37. Marimuthu, P.; Balasubramanian, P.K.; Singaravelu, K. Deciphering the crucial molecular properties of a series of Benzothiazole Hydrazone inhibitors that targets anti-apoptotic Bcl-xL protein. J. Biomol. Struct. Dyn. 2017. [Google Scholar] [CrossRef]
  38. Marimuthu, P.; Lee, Y.J.; Kim, B.H.; Seo, S.S. In silico approaches to evaluate the molecular properties of organophosphate compounds to inhibit Acetylcholinesterase activity in housefly. J. Biomol. Struct. Dyn. 2018. [Google Scholar] [CrossRef]
  39. Marimuthu, P.; Singaravelu, K. Prediction of Hot Spots at Myeloid Cell Leukemia-1-Inhibitor Interface Using Energy Estimation and Alanine Scanning Mutagenesis. Biochemistry 2018, 57, 1249–1261. [Google Scholar] [CrossRef]
  40. Marimuthu, P.; Singaravelu, K. Unraveling the Molecular Mechanism of Benzothiophene and Benzofuran scaffold merged compounds binding to anti-apoptotic Myeloid cell leukemia 1. J. Biomol. Struct. Dyn. 2018. [Google Scholar] [CrossRef]
  41. Dror, R.O.; Dirks, R.M.; Grossman, J.; Xu, H.; Shaw, D.E. Biomolecular Simulation: A Computational Microscope for Molecular Biology. Annu. Biophys. 2012, 41, 429–452. [Google Scholar] [CrossRef] [PubMed]
  42. Bermudez, M.; Mortier, J.; Rakers, C.; Sydow, D.; Wolber, G. More than a look into a crystal ball: protein structure elucidation guided by molecular dynamics simulations. Drug Discov. Today 2016, 21, 1799–1805. [Google Scholar] [CrossRef]
  43. Shivakumar, D.; Williams, J.; Wu, Y.; Damm, W.; Shelley, J.; Sherman, W. Prediction of Absolute Solvation Free Energies using Molecular Dynamics Free Energy Perturbation and the OPLS Force Field. J. Chem. Theory Comput. 2010, 6, 1509–1519. [Google Scholar] [CrossRef]
  44. Dixon, S.L.; Smondyrev, A.M.; Knoll, E.H.; Rao, S.N.; Shaw, D.E.; Friesner, R.A. PHASE: A new engine for pharmacophore perception, 3D QSAR model development, and 3D database screening: 1. Methodology and preliminary results. J. Comput. Aided Mol. Des. 2006, 20, 647–671. [Google Scholar] [CrossRef]
  45. Roy, K.; Chakraborty, P.; Mitra, I.; Ojha, P.K.; Kar, S.; Das, R.N. Some case studies on application of “rm2” metrics for judging quality of quantitative structure–activity relationship predictions: Emphasis on scaling of response data. J. Comput. Chem. 2013, 34, 1071–1082. [Google Scholar] [CrossRef]
  46. Irwin, J.J.; Sterling, T.; Mysinger, M.M.; Bolstad, E.S.; Coleman, R.G. ZINC: A Free Tool to Discover Chemistry for Biology. J. Chem. Inf. Model. 2012, 52, 1757–1768. [Google Scholar] [CrossRef] [PubMed]
  47. Bansal, E.; Srivastava, V.K.; Kumar, A. Synthesis and anti-inflammatory activity of 1-acetyl-5-substituted aryl-3-(beta-aminonaphthyl)-2-pyrazolines and beta-(substituted aminoethyl) amidonaphthalenes. Eur. J. Med. Chem. 2001, 36, 81–92. [Google Scholar] [CrossRef]
  48. Wright, J.L.; Gregory, T.F.; Kesten, S.R.; Boxer, P.A.; Serpa, K.A.; Meltzer, L.T.; Wise, L.D.; Espitia, S.A.; Konkoy, C.S.; Whittemore, E.R.; et al. Subtype-Selective-N-Methyl-d-Aspartate Receptor Antagonists: Synthesis and Biological Evaluation of 1-(Heteroarylalkynyl)-4-benzylpiperidines. J. Med. Chem. 2000, 43, 3408–3419. [Google Scholar] [CrossRef] [PubMed]
  49. Zhao, Y.H.; Le, J.; Abraham, M.H.; Hersey, A.; Eddershaw, P.J.; Luscombe, C.N.; Boutina, D.; Beck, G.; Sherborne, B.; Cooper, I.; et al. Evaluation of human intestinal absorption data and subsequent derivation of a quantitative structure-activity relationship (QSAR) with the Abraham descriptors. J. Pharm. Sci. 2001, 90, 749–784. [Google Scholar] [CrossRef]
  50. A Lipinski, C.; Lombardo, F.; Dominy, B.W.; Feeney, P.J. Experimental and computational approaches to estimate solubility and permeability in drug discovery and development settings. Adv. Drug Deliv. Rev. 2001, 46, 3–26. [Google Scholar] [CrossRef]
  51. Berman, H.; Henrick, K.; Nakamura, H.; Markley, J.L. The worldwide Protein Data Bank (wwPDB): Ensuring a single, uniform archive of PDB data. Nucleic Acids Res. 2007, 35, D301–D303. [Google Scholar] [CrossRef]
  52. Bowers, K.J.; Chow, D.E.; Xu, H.; Dror, R.O.; Eastwood, M.P.; Gregersen, B.A.; Klepeis, J.L.; Kolossváry, I.; Moraes, M.A.; Sacerdoti, F.D.; et al. Scalable Algorithms for Molecular Dynamics Simulations on Commodity Clusters. In Proceedings of the 2006 ACM/IEEE Conference on Supercomputing—SC ’06, Tampa, FL, USA, 11–17 November 2006. [Google Scholar]
  53. Cerutti, D.S.; Duke, R.E.; Darden, T.A.; Lybrand, T.P. Staggered Mesh Ewald: An extension of the Smooth Particle-Mesh Ewald method adding great versatility. J. Chem. Theory Comput. 2009, 5, 2322. [Google Scholar] [CrossRef] [PubMed]
  54. Tuckerman, M.; Martyna, G.J.; Klein, M.L. Nosé–Hoover chains: The canonical ensemble via continuous dynamics. J. Chem. Phys. 1992, 97, 2635–2643. [Google Scholar]
  55. Martyna, G.J.; Tobias, D.J.; Klein, M.L. Constant pressure molecular dynamics algorithms. J. Chem. Phys. 1994, 101, 4177–4189. [Google Scholar] [CrossRef]
  56. Marimuthu, P.; Singaravelu, K. Deciphering the crucial residues involved in heterodimerization of Bak peptide and anti-apoptotic proteins for apoptosis. J. Biomol. Struct. Dyn. 2017. [Google Scholar] [CrossRef] [PubMed]
Figure 1. The chemical dataset used for the pharmacophore-based 3D-QSAR studies (ChEMBL—3779852) [33].
Processes 07 00224 g001
Figure 2. 2D (a,b), and 3D (d,e) representations of highly active [C40—CHEMBL 3781822] and inactive [C1—CHEMBL 3780357] compound superposed over a five-point pharmacophore hypothesis. (c) A 2D representation of the reference ligand obtained from the PDB ID: 4HW3 structure.
Processes 07 00224 g002
Figure 3. (a) Distances and (b) angles (Å) measured between the five-point pharmacophore hypothesis (red circles indicate negative sites and brown rings indicate aromatic ring features).
Processes 07 00224 g003
Figure 4. Scatter plots: The predicted activity values plotted against experimental values for (a) training set (y = 0.92x + 0.46 (R2 = 0.92)) and (b) test set (y = 0.73x + 1.43 (R2 = 0.87)) compounds.
Processes 07 00224 g004
Figure 5. The highly active (C40–cyan), and inactive (C1–gray) molecules superposed over the 3D-QSAR model, represented in semi-transparent cubes (blue—positive regression coefficient; red—negative regression coefficient) in the context of (a,b) H-bond donor, (c,d) hydrophobic, (e,f) negative-ionic, and (g,h) electron-withdrawal effects, respectively. R1, R2, and R3 on the highly active compound represent the regions substituted to improve the activity of the compounds.
Processes 07 00224 g005
Figure 6. (a) Overlay of highly active inhibitor—C40—together with its contour map onto the crystal structure of Mcl1 at the hydrophobic binding pocket and (b) alignment of the highly active inhibitor (cyan)—C40—and its hypothesis over the crystal ligand X (green).
Processes 07 00224 g006
Figure 7. (a) Molecular surface representation to show the region where the highly active inhibitor—C40—interacts with Mcl1. (b) The salt bridge (yellow dotted lines) (c) and π–π interactions (black dotted lines with distances in Å) between the highly active compound—C40—and binding site residues of Mcl1. (d) A magnified view of the binding groove of Mcl1 (represented in surface) highlighting the principal interactions between the C40 and surrounding contacts.
Processes 07 00224 g007
Figure 8. (a) Root mean squared deviation (RMSD), (b) radius of gyration (Rg), (c) root mean squared fluctuation (RMSF), (d) distances between the polar atoms, (e) interacting frequency, and (f) interaction types monitored for the Mcl1–C40 complex during MD simulation.
Processes 07 00224 g008
Table 1. Different score values obtained from the generated hypothesis.
S.NoIDSurvivalSurvival-InactiveSiteVectorVolumeSelectivityEnergyActivityInactive
1NNRRR6.1764.425110.9781.58706.7621.751
2ADHRR6.1734.3220.640.9790.5931.8140.0966.9431.851
3DHRRR6.1724.8860.480.8370.6072.1085.9537.4811.286
4AAADR6.1714.1350.820.8820.6821.43307.1022.036
5AHRRR6.1714.1550.340.8880.3451.7452.9957.1022.016
Table 2. The intersite distances between the selected pharmacophore hypotheses.
EntrySite 1Site 2Distance
431N7N86.269
431N7R105.777
431N7R118.246
431N7R1213.032
431N8R104.890
431N8R112.935
431N8R127.862
431R10R115.098
431R10R128.451
431R11R125.104
Table 3. The intersite angles between the selected pharmacophore hypotheses.
EntrySite 1Site 2Site 3Angle
431N8N7R1047.7
431N7N8R1060.9
431N7N8R11123.1
431R10N8R1176.9
431N7R10N871.4
431N7R10R1198.4
431N8R10R1134.1
431R11R10R1234.1
431N8R11R1069.1
431R10R11R12111.9
431N8R12R119.1
431R10R12R1134.1
Table 4. Partial least square (PLS) analysis for statistically significant hypothesis.
IDFactorsSDR2FpStabilityRMSEQ2Pearson’s R
NNRRR10.50450.754382.91.02 × 10−90.95640.49780.68360.8808
20.46160.802052.67.20 × 10−100.94810.49870.68240.8754
30.37800.872356.92.60 × 10−110.81570.46690.72160.8850
40.30360.920969.97.20 × 10−130.77270.34730.84590.9356
50.25360.947182.46.63 × 10−140.72410.43360.75990.8952
Table 5. Top 5 hit compounds obtained from ZINC and Maybridge databases filtered using QikProp program.
Molecule ID2D Representationmol_MWlogPoctlogPwlogPo/wlogSlogBBHuman Oral Absorption (%)
ZINC00755398 Processes 07 00224 i001330.79116.99910.5392.959−4.573−0.416100
ZINC08321521 Processes 07 00224 i002285.36613.5736.7333.664−4.573−0.127100
ZINC10312638 Processes 07 00224 i003286.35413.8678.8321.969−3.819−0.64189.25
MB1 Processes 07 00224 i004332.36416.0358.5563.358−5.247−0.51100
MB2 Processes 07 00224 i005390.75416.918.2724.451−6.835−0.049100
mol_MW—molecular weight of the molecule; logPoct—predicted octanol/gas partition coefficient; logPw—predicted water/gas partition coefficient; logPo/w—predicted octanol/water partition coefficient; logS—predicted aqueous solubility in mol dm−3; logBB—predicted brain/blood partition coefficient; HumanOralAbsorption (%)—predicted human oral absorption on a 0 to 100% scale.
Table 6. Docking score obtained for the top five low-energy conformational poses.
Docking PoseBinding Energy (kcal/mol)
1−24.30
2−24.92
3−25.13
4−25.32
5−26.07