3.1. Pharmacophore Model Generation
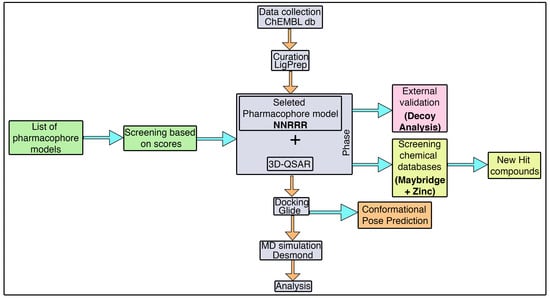
The alignment of the active chemical compounds plays a central role in generating a pharmacophore model using the phase protocol [
44] in Schrödinger. This pharmacophore model essentially links the details of the pivotal functional group with its activity values. Additionally, this hypothesis was used as a backbone to build an atom-based 3D-QSAR model, which in turn was used to predict the activity and study the relationship of the given dataset. Consequently, the model exhibited important pharmacophoric features in three-dimensional space.
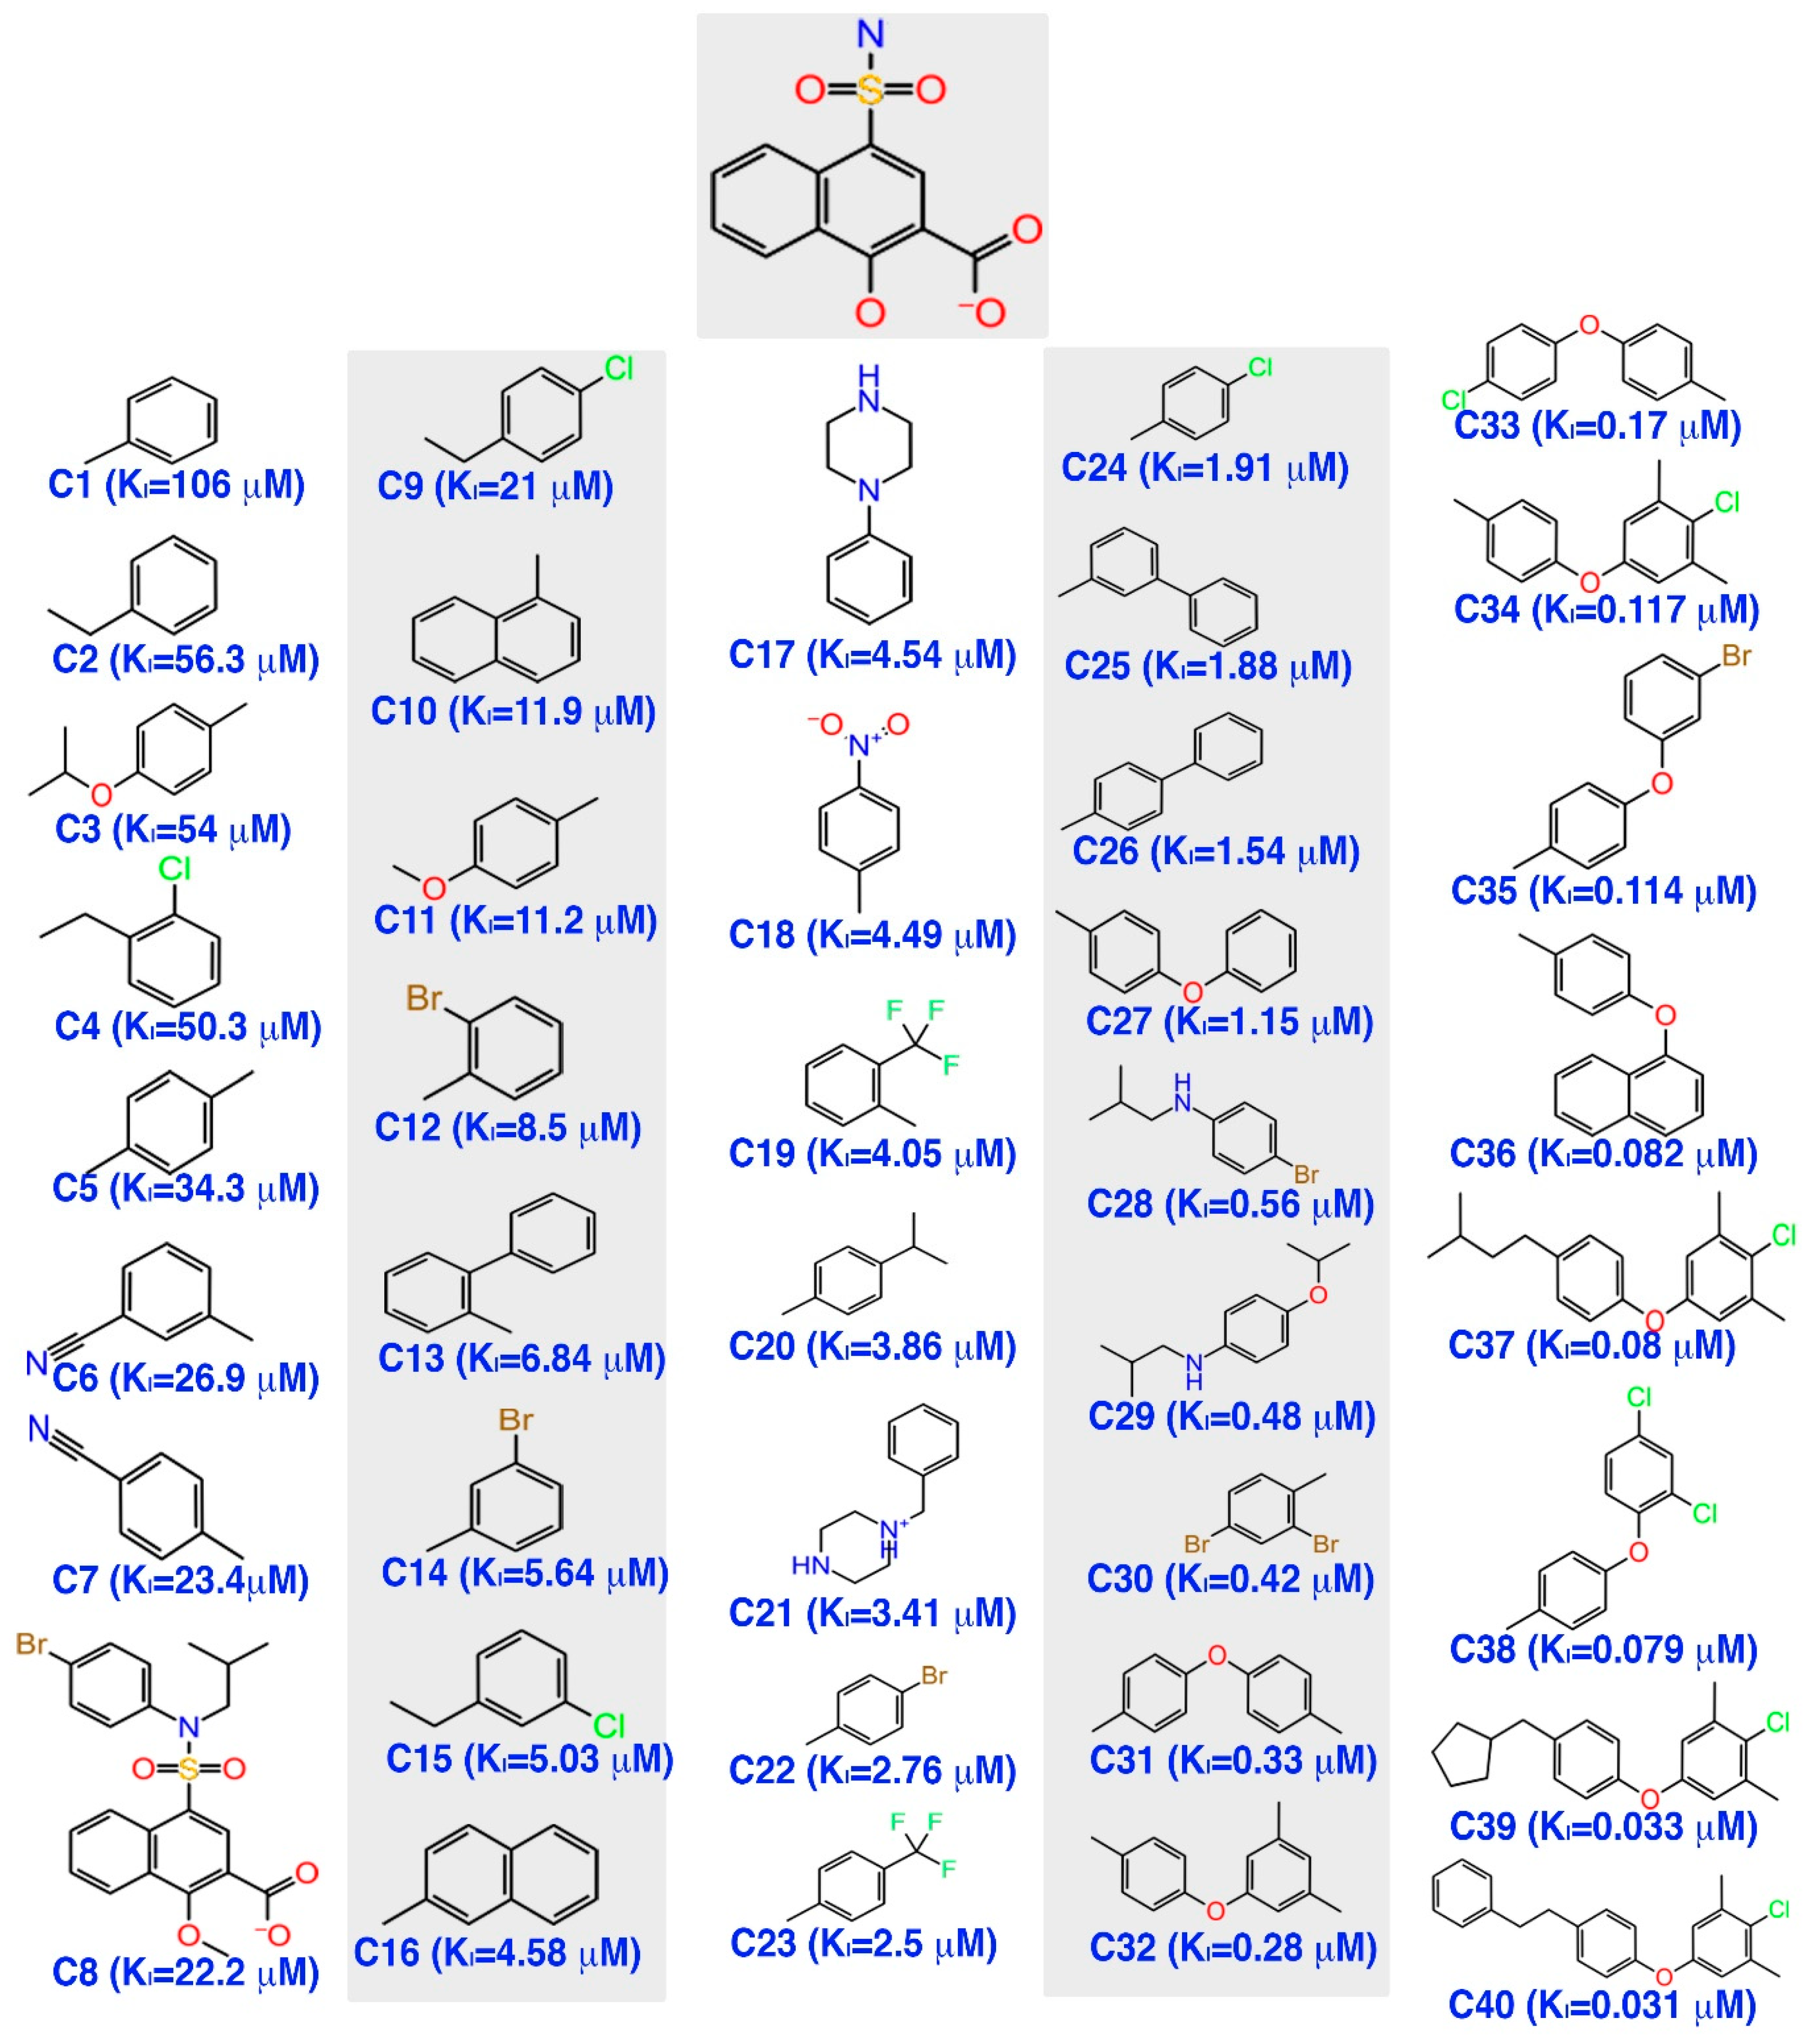
Initially, a five-site pharmacophore model—hydrogen bond acceptor (A), hydrogen bond donor (D), hydrophobic (H), negative ionization (N), and aromatic ring (R)—was obtained from the inhibitor dataset, which is common to all 13 compounds from the active group. Subsequently, the generated hypothesis was scored and ranked by the phase program based on survival, survival-inactive, site, vector, volume and activity (
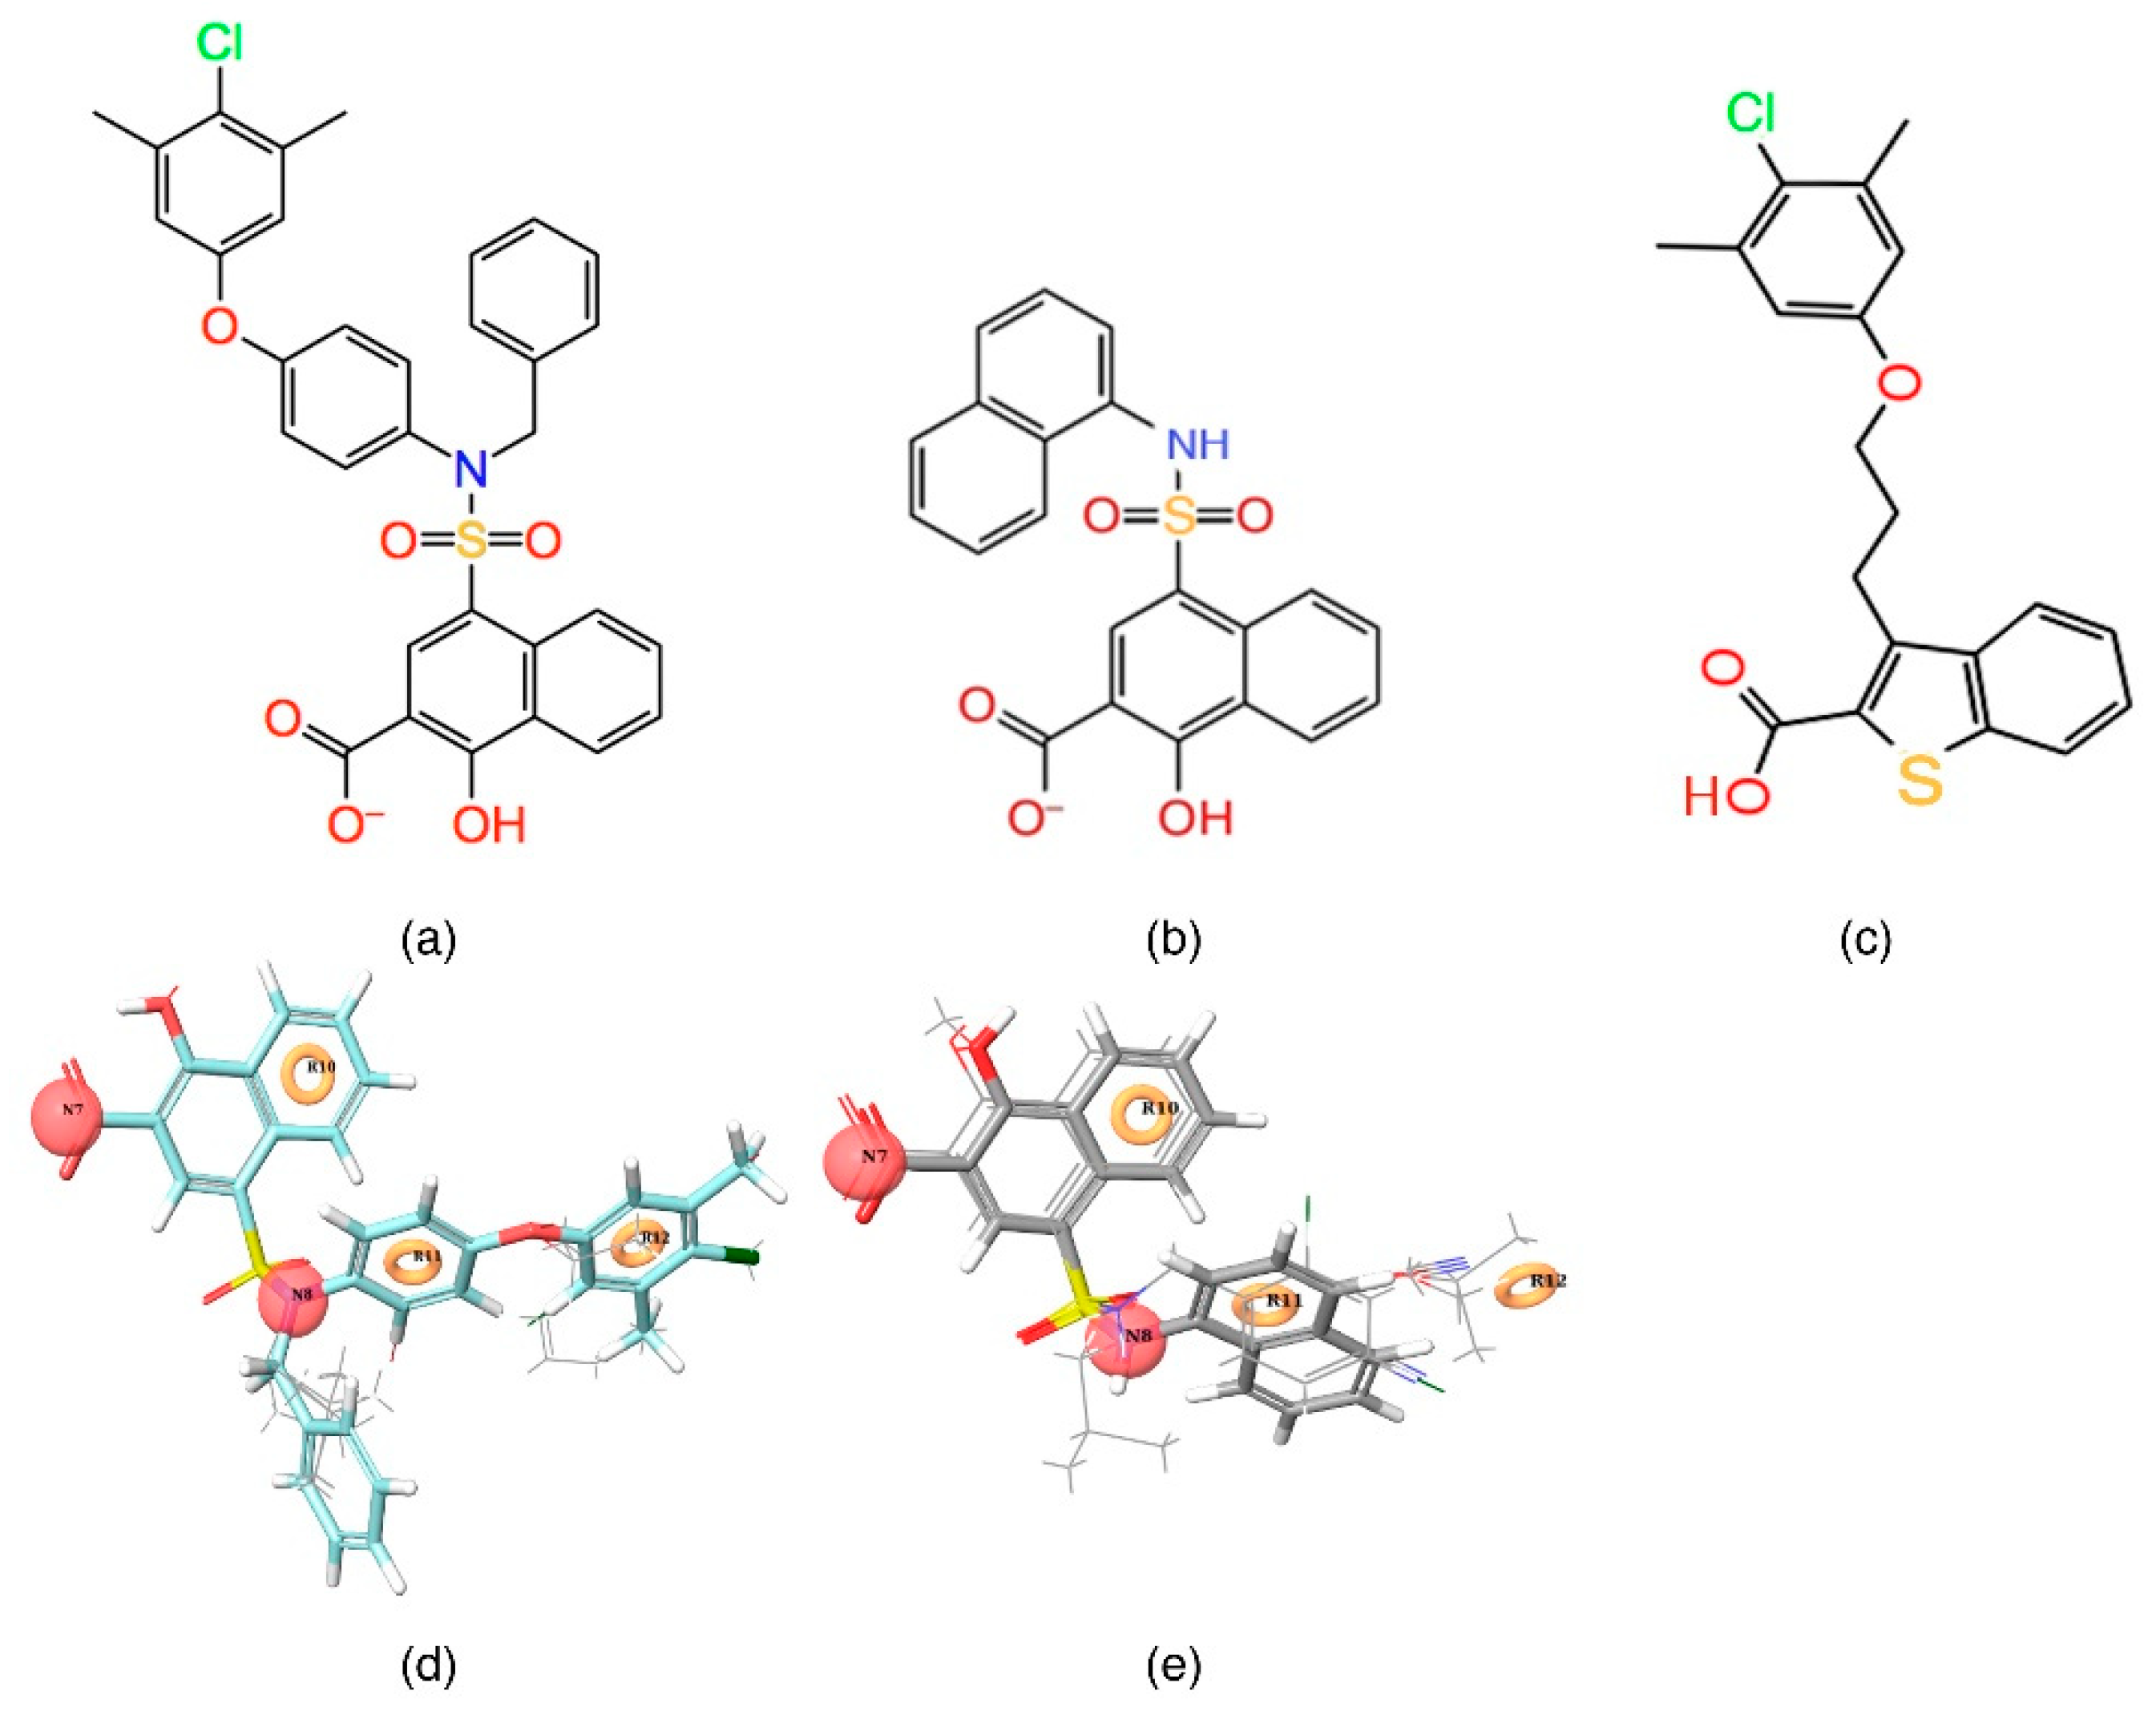
Table 1). A five-featured pharmacophore model—NNRRR—was selected based on the high survival score (6.176), and comprises two negative (N) and three aromatic (R) features. To gain further insights, the most active (
Figure 2a,d) and least active (
Figure 2b,e) compounds from the inhibitor dataset were superposed over the generated pharmacophore.
The
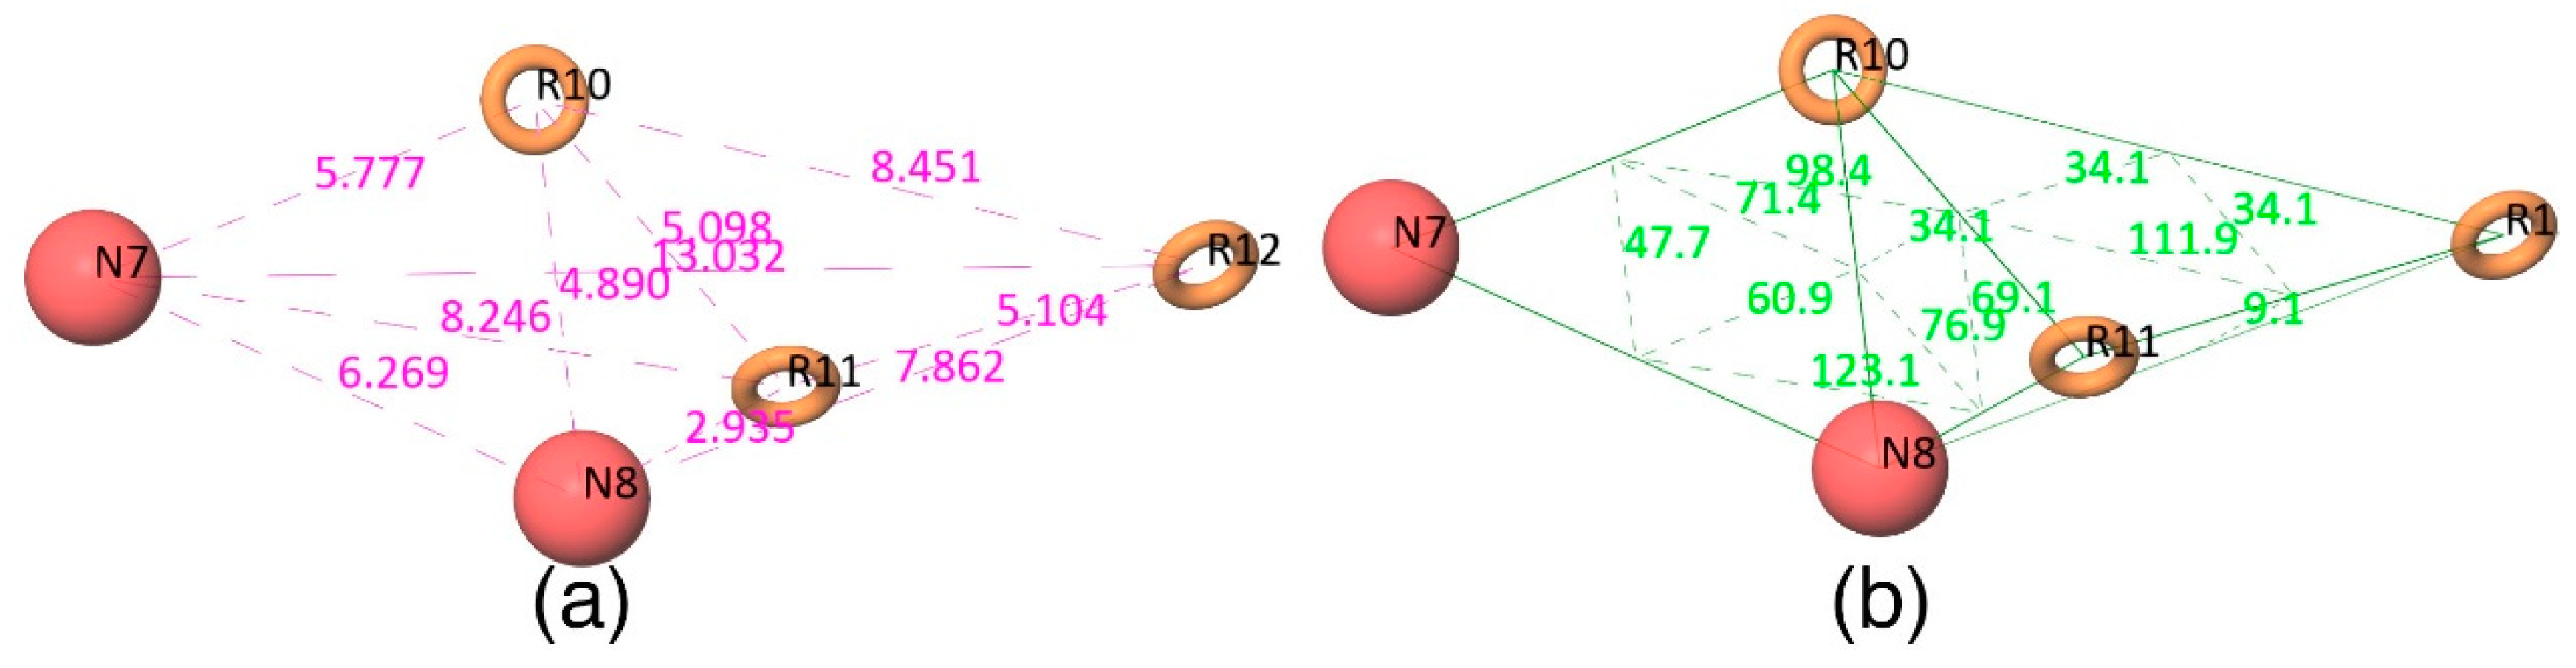
Figure 2d shows that all active compounds from the dataset entirely occupied the selected hypothesis that comprises two negative and three aromatic ring features. This explains why the chemical features present in the selected pharmacophore model have the potential to interact with the Mcl1 binding pocket, which may induce its inhibitory activity. Furthermore, the intersite distances and the angle measurement between the site points (
Figure 3;
Table 2 and
Table 3) of the hypothesis—NNRRR—determine the quality of the developed pharmacophore model. These measurements highlight the robustness of the selected pharmacophore model. Overall, the result provides confidence that the selected hypothesis—NNRRR—was reliable and could be used for further 3D-QSAR model development.
3.2. 3D-QSAR Model
The previously developed pharmacophore hypothesis—NNRRR—was used to build a 3D-QSAR model, with the phase [
44] program. For this, the entire dataset was subdivided into 29 training and 11 test set compounds (
Table S1) that subsequently produced 3D-QSAR. Simultaneously, the activity values for the chemical dataset were also obtained during the 3D-QSAR model development (
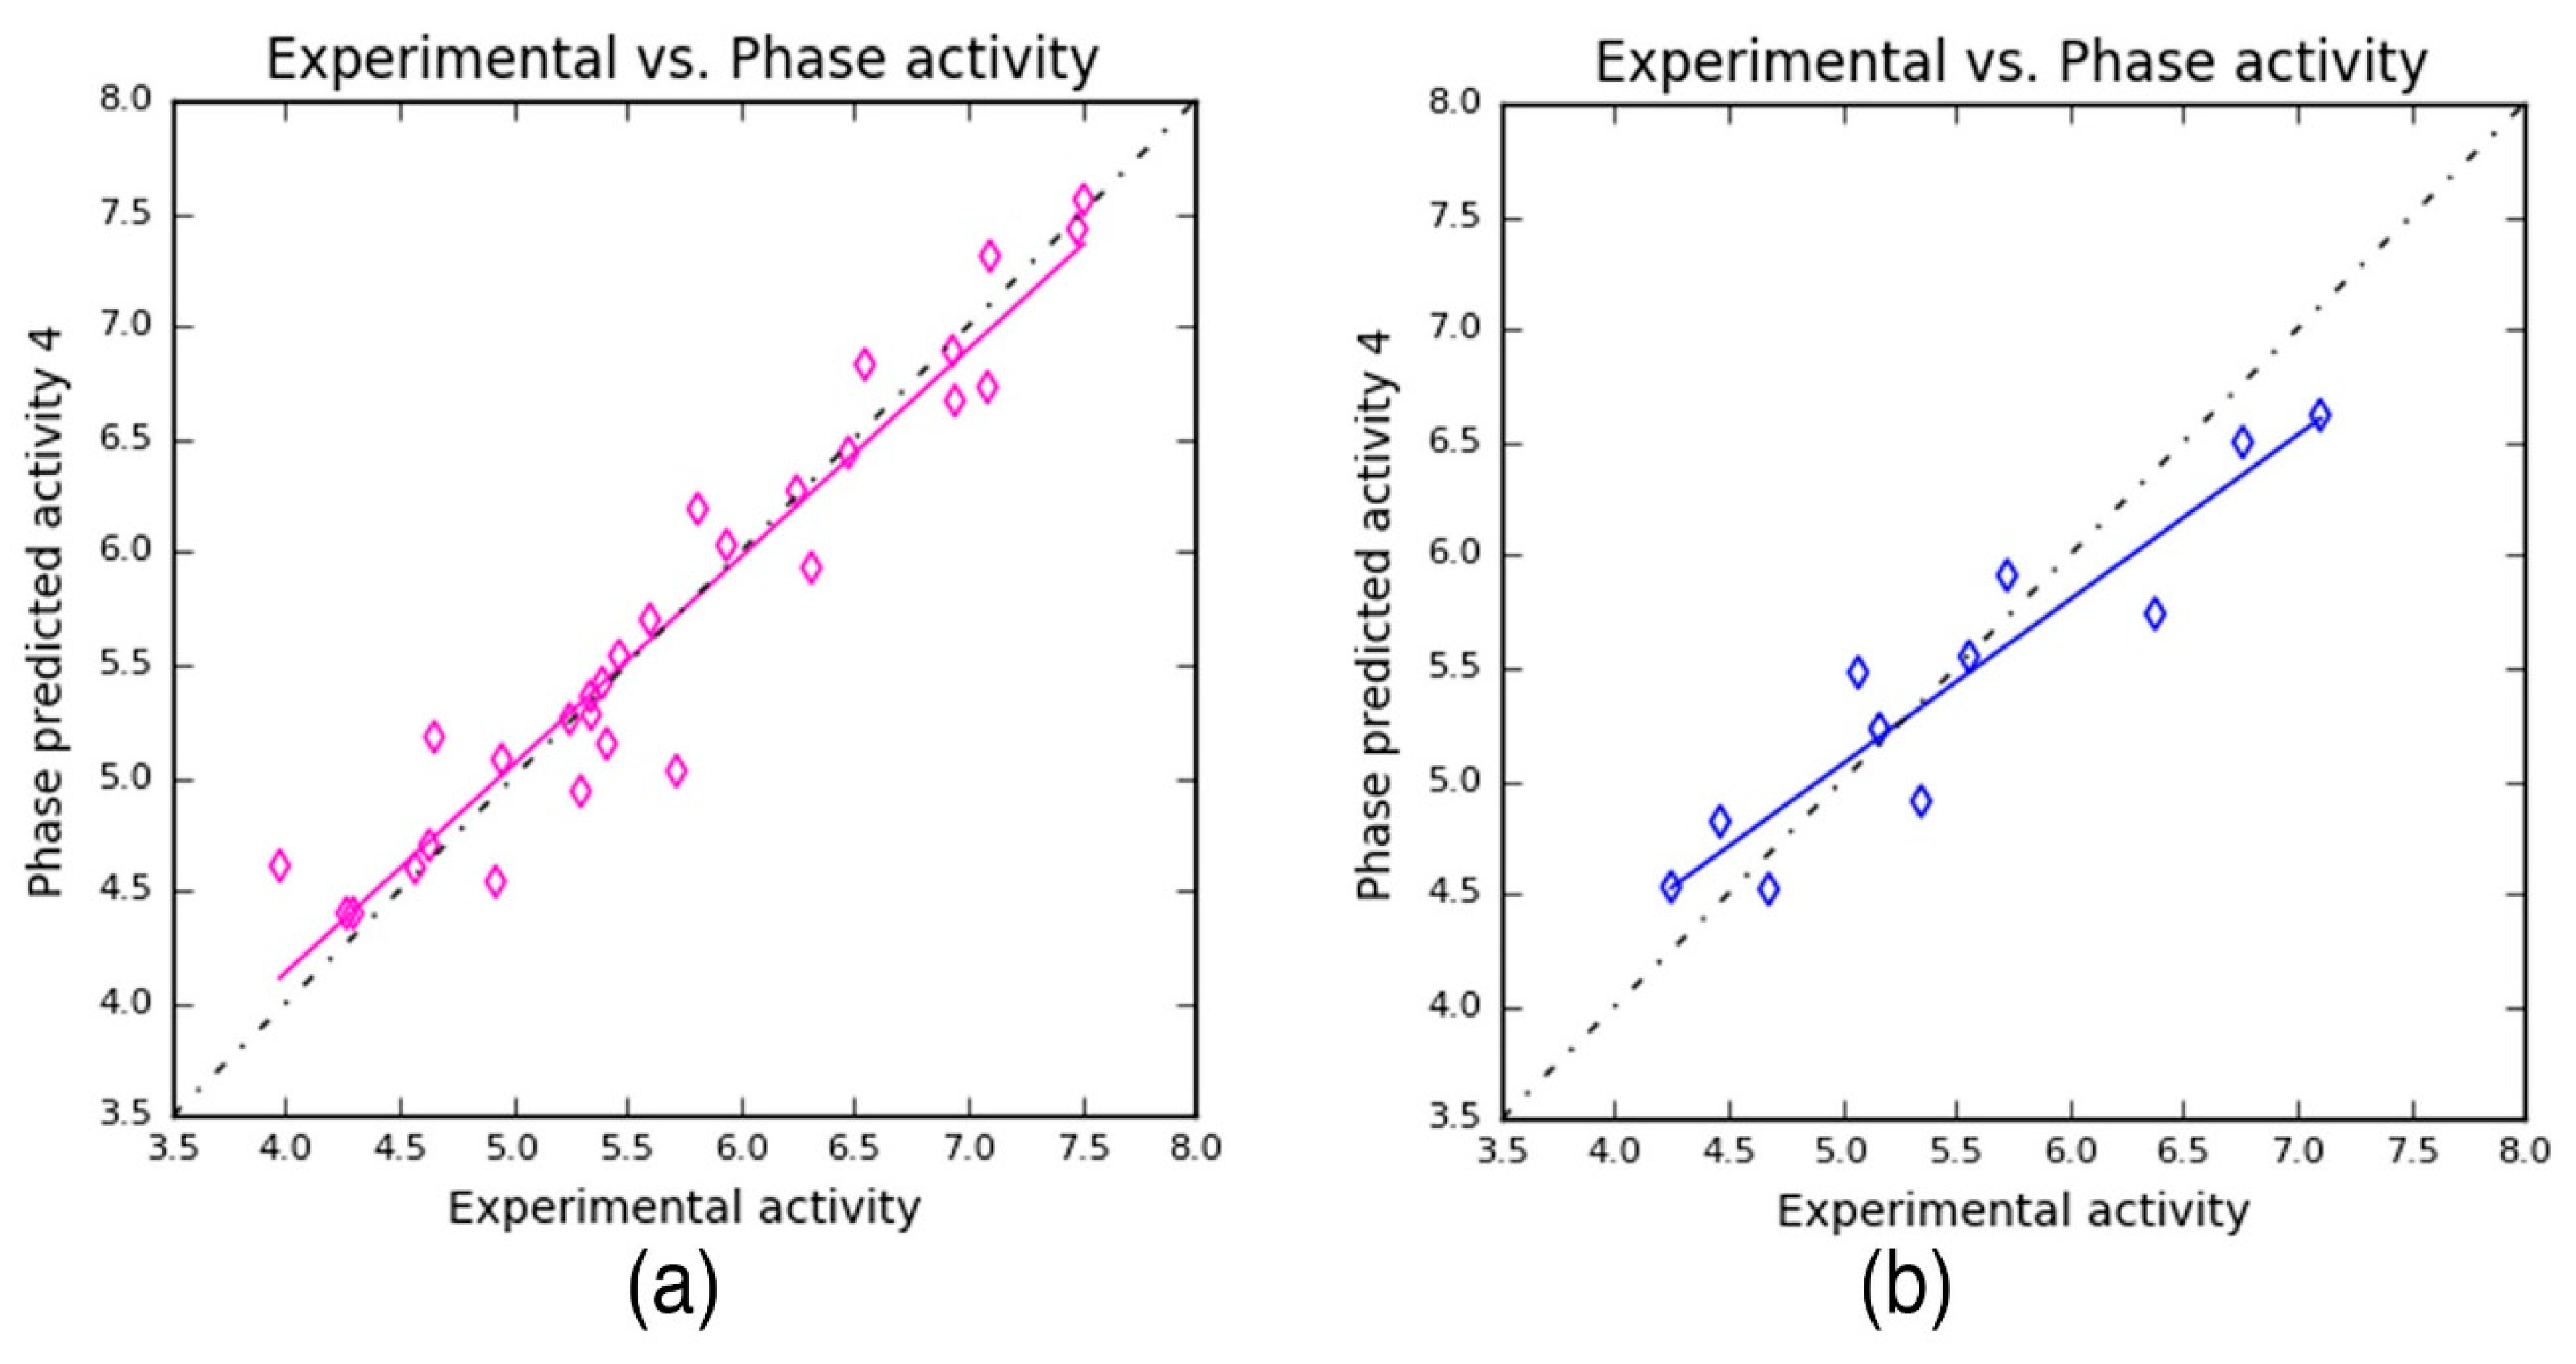
Table 4). The PLS prediction approach exhibited—
r2 = 0.9209,
q2 = 0.8459, and Pearson’s
R = 0.9356—a greater degree of confidence to the developed 3D-QSAR model. Here,
r2 and
q2 represent 92% and 86% of variance in the observed activity values obtained for the training and test data, respectively. Also, the scoring based on Pearson’s
R is obtained by the correlation between the predicted and the observed activity for the test dataset. As can be seen from
Table 4, the Pearson’s
R produced higher value—0.9356—which in turn explains why the developed 3D-QSAR model is more statistically significant. Also, the robustness of the developed 3D-QSAR model is further validated by the difference between the
r2 and
q2 being 0.075 (0.9209 − 0.8459 = 0.075). Additionally, a smaller standard deviation (SD = 0.3036) was obtained for the regression analysis and RMS error (RMSE = 0.3473) values for the test set predictions. These values indicate that the developed QSAR model is highly reliable to predict the activity of novel compounds.
3.4. Model Evaluation by Decoy Analysis
Typically, the predictive power of the developed 3D-QSAR hypothesis can be estimated by the enrichment factor (
EF) analysis using the dataset of decoy molecules that was not used for the model building. In particular, this analysis was carried out with the aim to reveal the ability of the 3D-QSAR model to discriminate the actives from the decoy compounds. The current model predicted a set of 13 active compounds (
Table S1) that was treated as the reference dataset and submitted to the DUD-E database, which retrieved 537 decoy compounds. These decoy compounds obtained from the DUD-E database contain all the physiochemical properties of the reference compounds, with the exception of different 2D structures. Subsequently, a decoy database (550 compounds-D) was prepared that includes all the actives (41 compounds-A) and the DUD-E outputs (537 compounds). Now, the prepared decoy database was used to screen against the developed 3D-QSAR model. The result revealed that in 1% of the total database the generated model screened 28 decoys and five active compounds overall. This results in 12%, 13%, and 0.78 for RA, EF, and GH, respectively (
Tables S2–S4).
Furthermore, the screening performance of the 3D-QSAR model was estimated using the ROC curve (
Figure S1), which clearly reveals the balance between the sensitivity (capacity to identify true positive) and the specificity (the capacity to exclude false positives) of the dataset used. Additionally, the ROC value is predominantly used to assess the overall performance of the generated model. In the current study, a total of 550 compounds were used. These compounds were ranked based on the activity values predicted by the 3D-QSAR model, which subsequently estimates the ROC. Here, the ROC was 0.94, which suggests that the selected model exhibited an ideal screening performance by distinguishing the active molecules from the inactive ones. This further demonstrates that the model is reliable, and can be readily used to screen different sets of compounds. Consequently, the AUC and RIE values were 0.90 and 8.26 from the screening performance evaluation for the selected model, respectively. The resulting AUC value closer to 1 and the large positive RIE value signify additional support to the screening performance evaluation exhibited by the selected model.
Overall, the enrichment validation results attained using the decoy molecules confirm that the developed 3D-QSAR model is robust and contains rational properties that are required for the virtual screening of different sets of compounds.
3.5. Contour Map Analysis
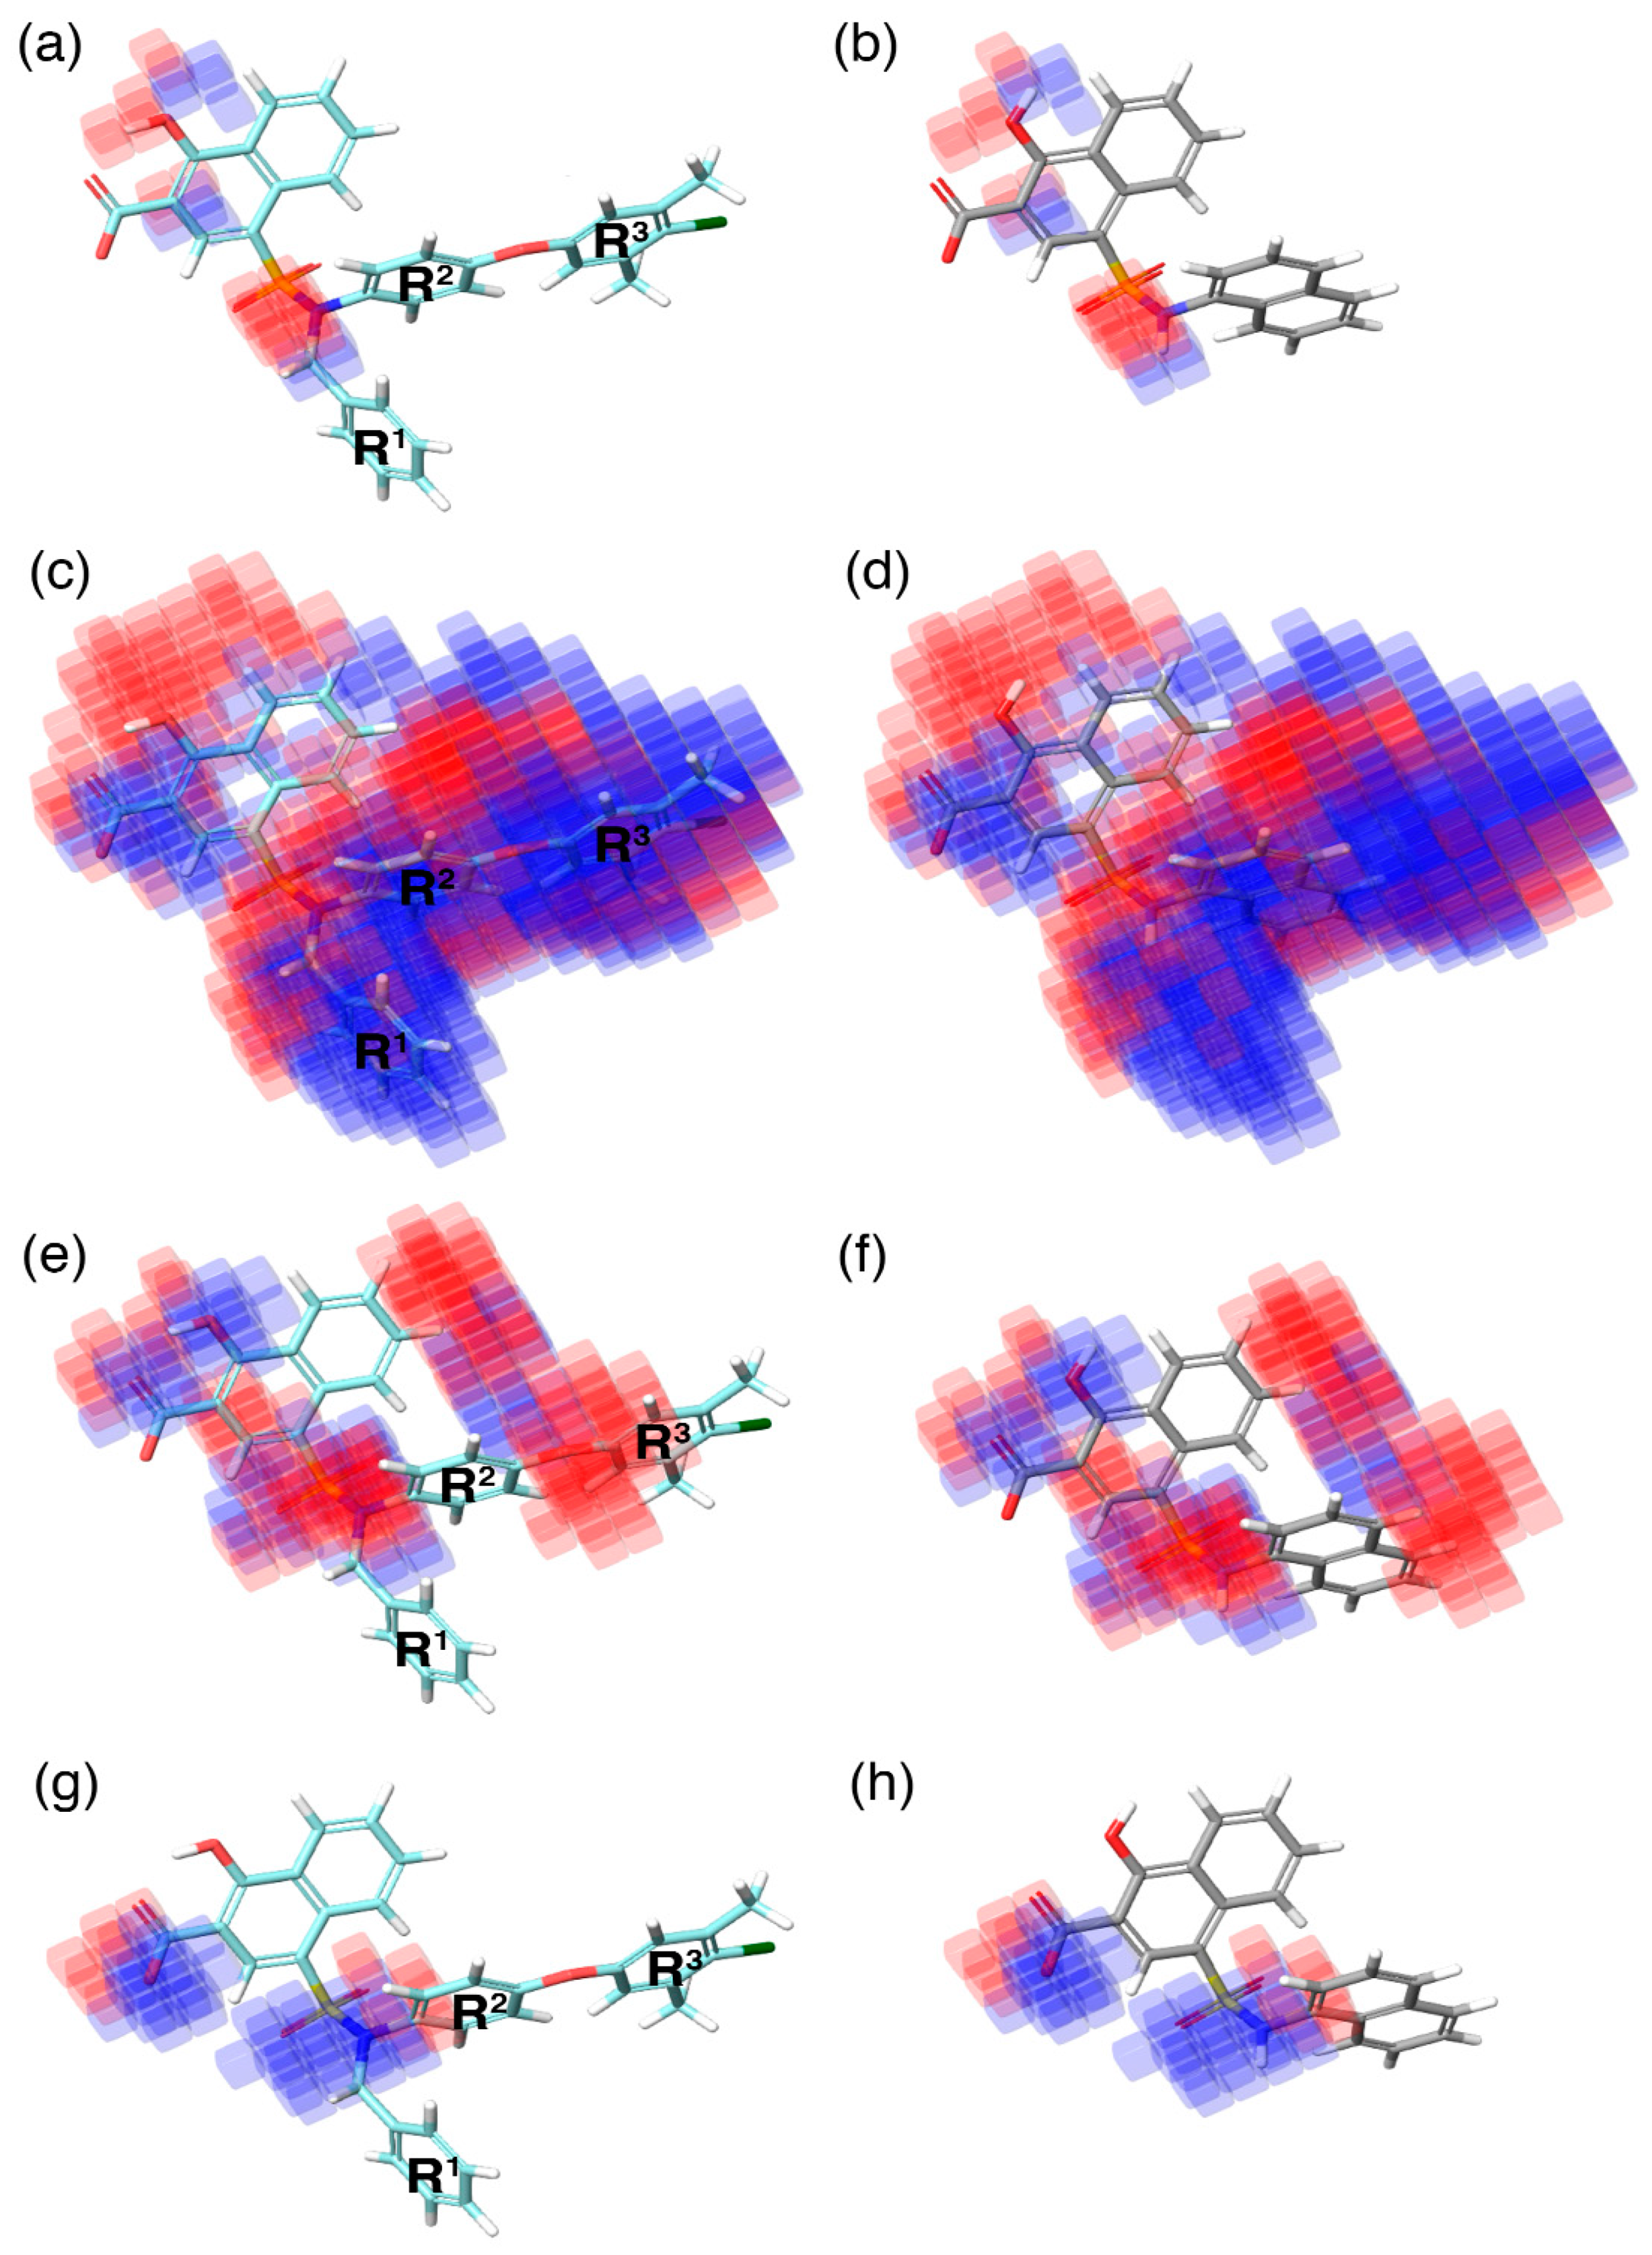
During QSAR model building, the phase program in the Schrödinger suite produces a 3D contour map. This contour map highlights the favorable (highlighted in blue) and unfavorable (highlighted in red) regions exhibited by an individual molecular property in correlation with the 3D–QSAR model (
Figure 5). These individual molecular properties are associated with the positive and negative regression coefficient scores generated by the phase program using the chemical dataset alignment. Subsequently, these scores can predict the contribution of a specific region of the model to the positive or negative effect towards activity.
In the current study, the contour maps developed using the training dataset revealed four different components—i: hydrogen bond donor, ii: hydrophobic iii: negative ionic, and iv: electron withdrawal—that are crucial for the activity. These contour maps comprise blue and red spots that are graphically inspected (
Figure 5). In order to gain comprehensive insights into the reactive effect of a specific atomic position, the highly active—
C40—and least active—
C1—compounds from the dataset was superposed over the different contours that comprise individual molecular properties.
(i) The contour map corresponding to the hydrogen bond donor (
Figure 5a,b) component is superposed with
C40 (
Figure 5a), displayed as blue cubes distributed proximal to the aromatic rings of the naphthalene, and the sulfonamide NH group that bridges the R
1, R
2, and R
3 substitutions. This suggests that the presence of a donor substitution (e.g., N, O, P, or S) at this position may favor the formation of an electrostatic interaction. Contrastingly, the red contours situated proximal to the sulfonamide oxygen and the hydroxyl group of the naphthalene ring of
C40 show that the hydrogen bond donor substitutions are not favored.
(ii) The contour map for hydrophobic characteristics (
Figure 5c,d) displays blue cubes highly distributed proximal to the R
1, R
2, and R
3 regions of
C40 (
Figure 5c). This result reveals that the multiple phenyl substitutions—R
1, R
2, and R
3 regions—of the
C40 may enhance the hydrophobicity, and might play a major role in its higher activity. Additionally, this result is supported by our docking analysis (see below), which also predicts that the phenyl groups at the R
1 and R
3 positions form π–π interactions with the side-chain aromatic ring of F254 and F270, respectively, whereas, the relatively weak red spots distributed around the sulfonamide and the naphthalene ring position of the
C40 denote that these regions are unfavorable to the hydrophobicity. In comparison with
C40, the
C1 compound lacks substitutions at this position, which is the major reason behind the weak hydrophobicity (
Figure 5d).
(iii) Furthermore, the contour of the negative ionic feature was superposed on
C40 and
C1 (
Figure 5e,f). It is observed from the contour maps that the blue cubes are distributed proximal to the carboxylic and hydroxy region of naphthalene ring. This indicates that negative ionic substitutions are favored at this position. The presence of negatively charged oxygen atoms at this position is crucial to establish ionic contact with the R263 of Mcl1, and to stabilize the complexity, whereas the dense red cubes distributed over the oxygen atom that connects the R
2 and R
3 phenyl rings, and the sulfonamide group that connects the R
1, R
2, and R
3 substitutions to the naphthalene ring, show unfavorable effects.
(iv) Additionally, the electron withdrawal map depicted over
C40 and
C1 (
Figure 5g,h) shows the blue cubes distributed around the carboxylic group of the naphthalene ring, and the sulfonamide group that connects multiple phenyl groups. This predicts that electron-accepting substitutions (such as N or O) at this position may be favorable to the activity.
Thus, the contour map visualization gives us the ability to assess the (i) individual molecular properties and (ii) the volume occupied by the compounds in three-dimensional space.
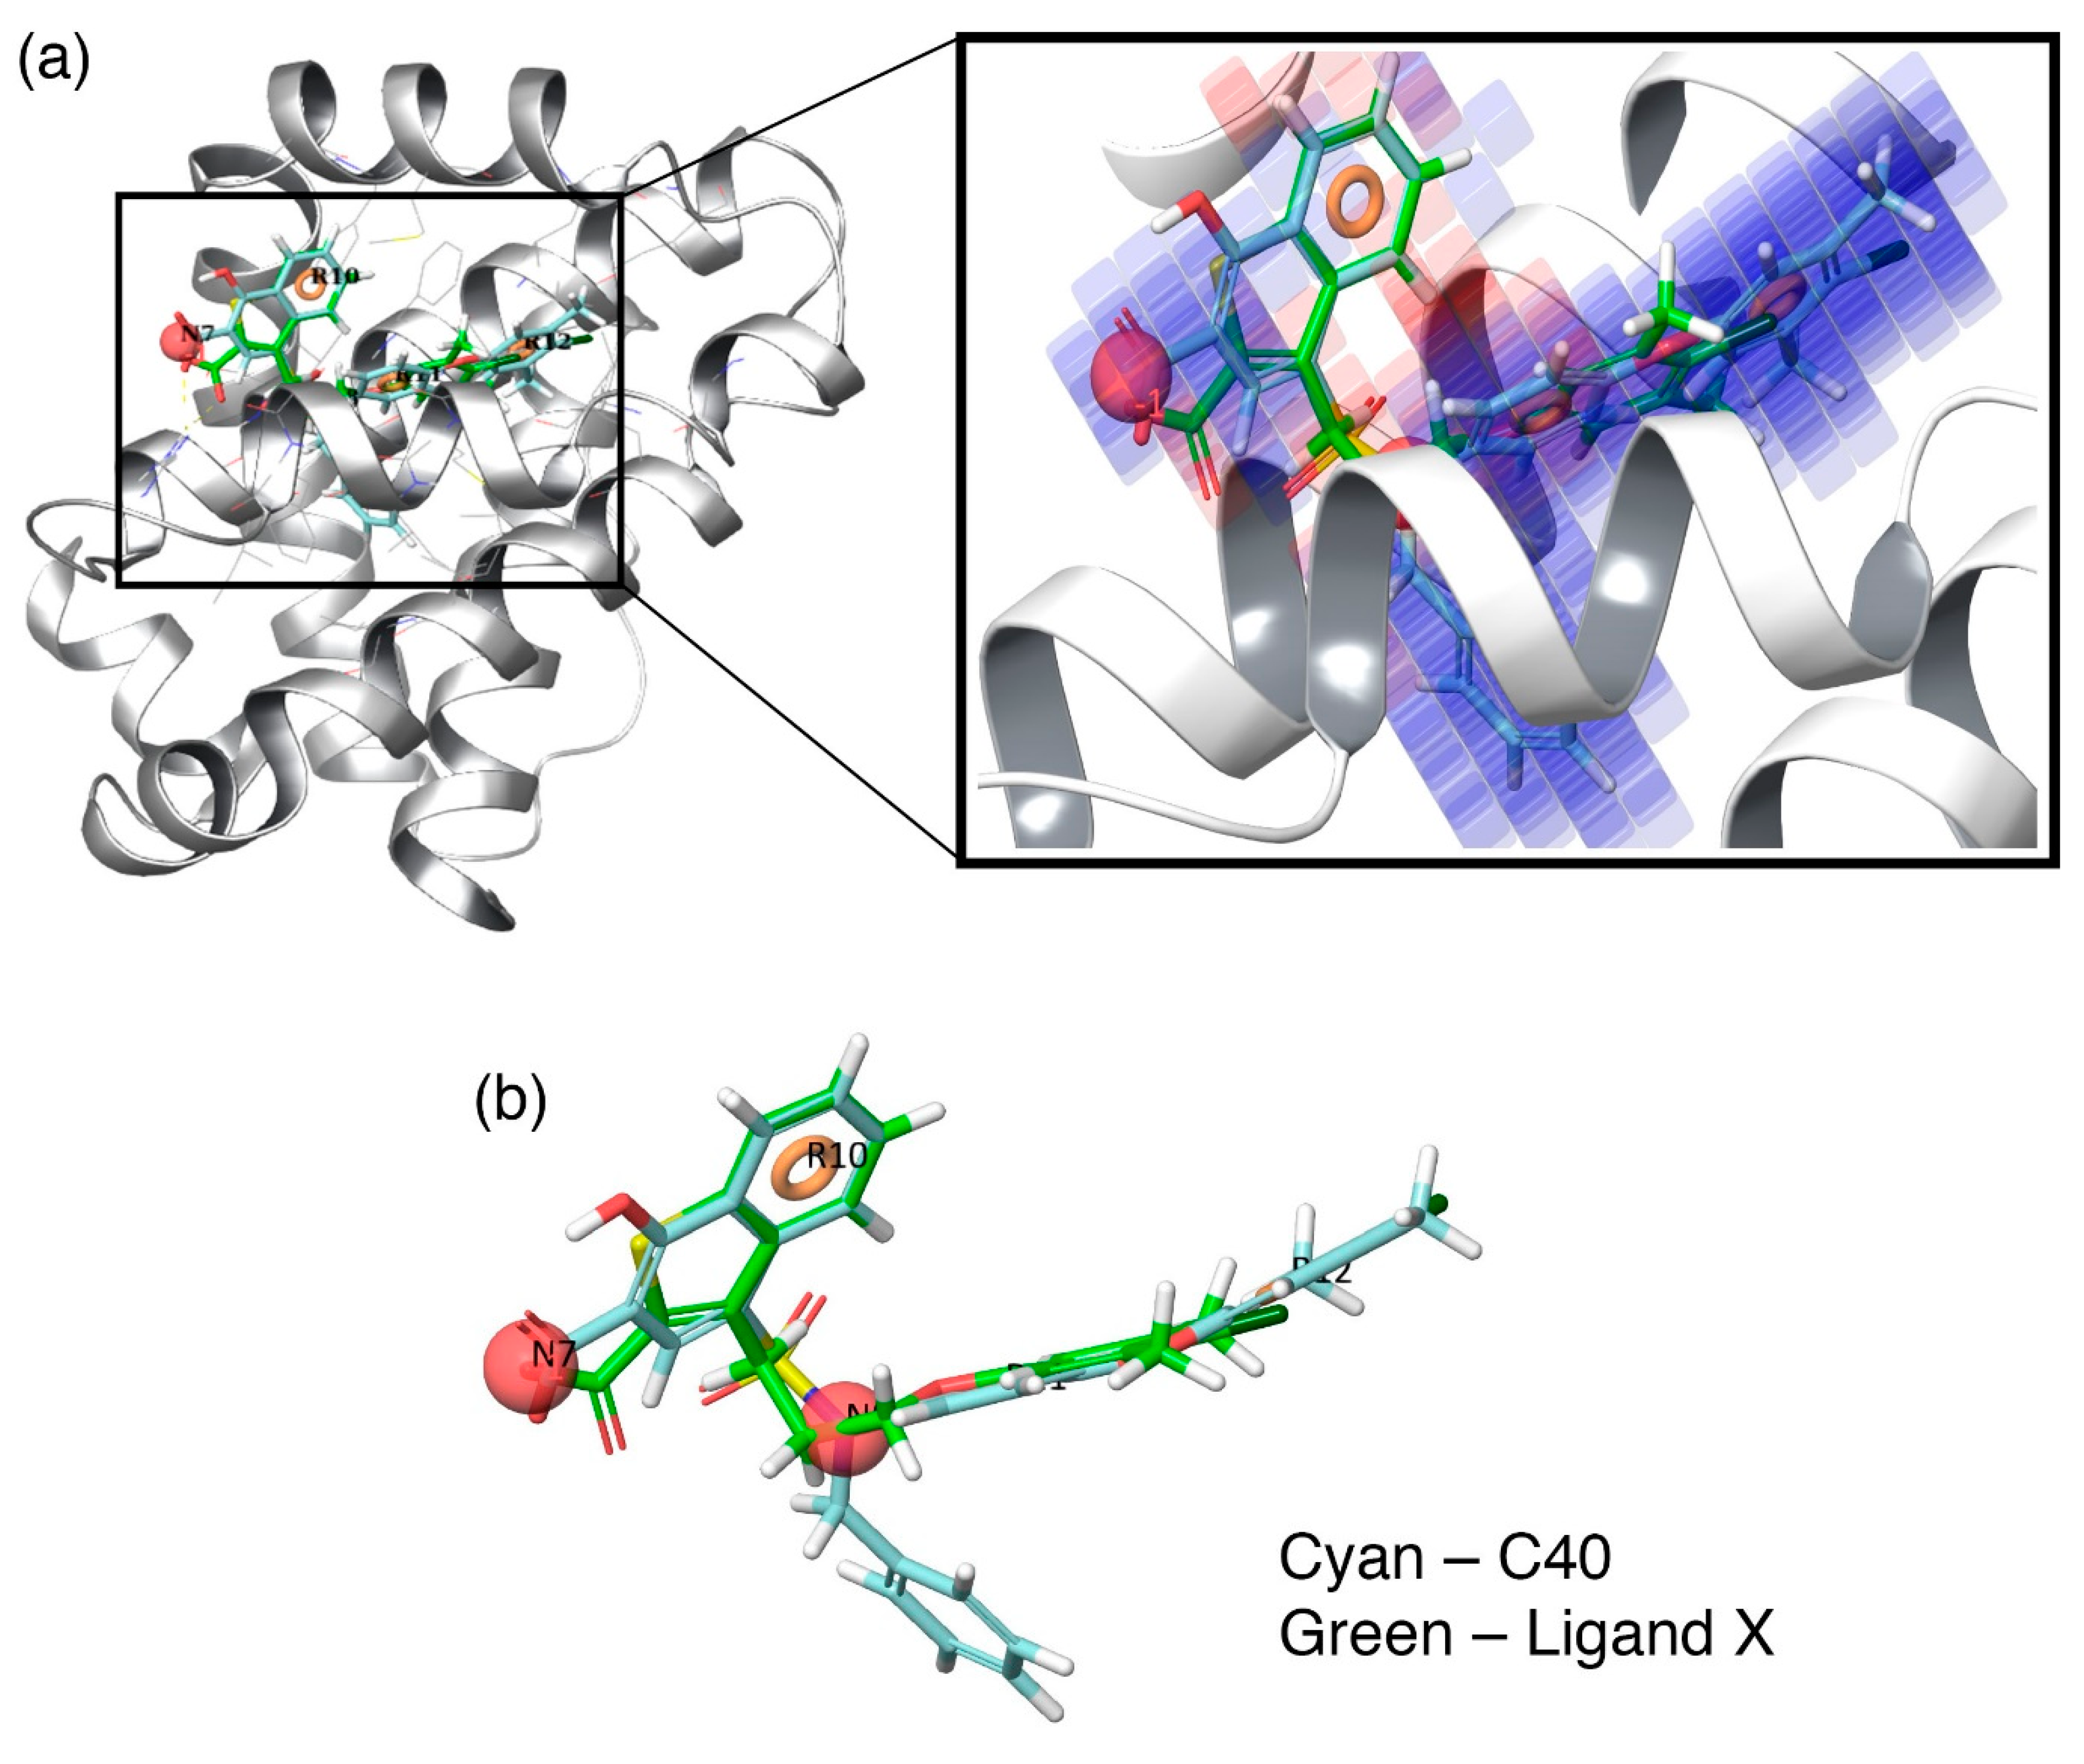
Additionally, to visualize the contributions of the individual molecular properties towards protein binding, the hydrophobic contour map (which exhibits the maximal regression coefficient) was superposed at the binding pocket of Mcl1 (
Figure 6).
Figure 6a clearly highlights the specific region of the contour map’s contribution to the activity inside the hydrophobic pocket of Mcl1. For more clarity, the predicted binding pose of the highly active compound—
C40—were superposed over the crystal ligand
X (
Figure 6b), which indicates that the head naphthyl moiety and the tail 4-chloro-3,5-dimethylphenyl regions are aligned well, while the benzyl group is buried well inside the P2 pocket of Mcl1. Conclusively, the selected pharmacophore—NNRRR—based 3D-QSAR model can be used as a position constraint to screen a new chemical compound database that may contain novel scaffold with high binding affinity to inhibit Mcl1 activity.
3.7. Molecular Docking Analysis
The docking analysis aims to predict the low-energy conformational pose of a given ligand on the binding pocket of a protein. Here, the compound with high inhibitory activity—
C40 with K
i = 0.031 µM—was selected from the dataset and subjected to docking at the hydrophobic binding pocket of Mcl1 (
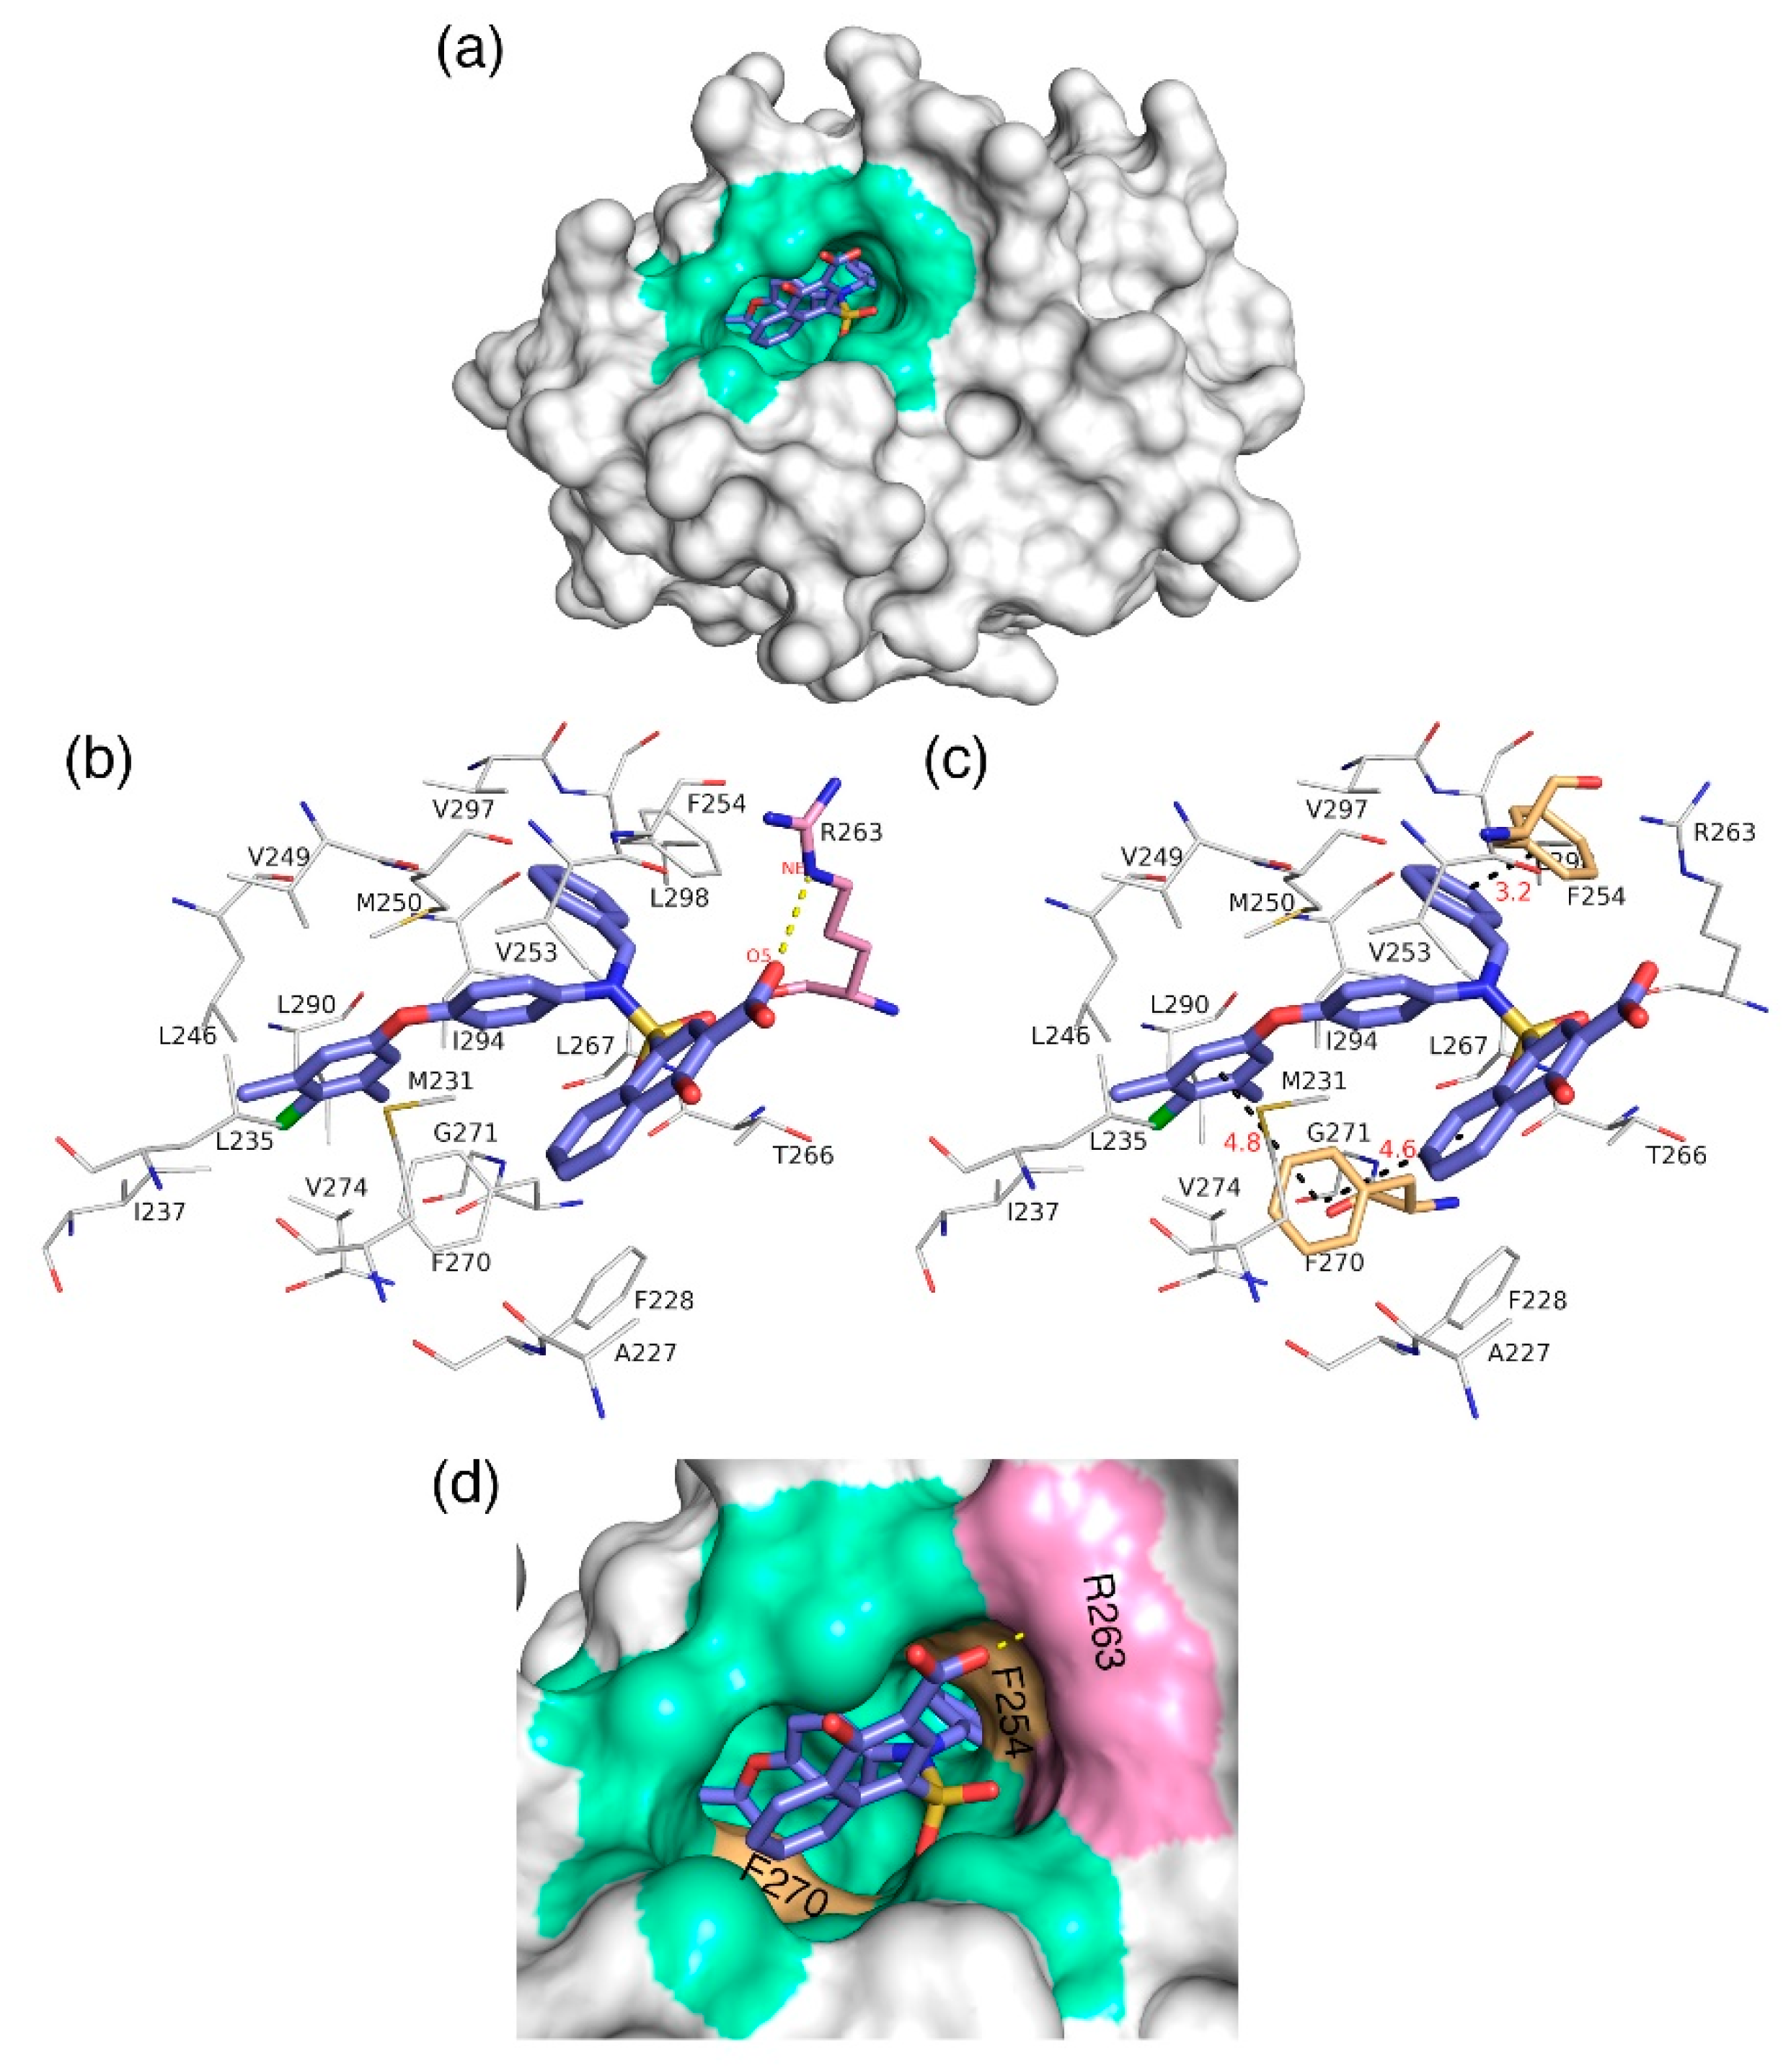
Figure 7) using the glide program available in the Schrödinger suite. Subsequently, the docking runs generated 79 low-energy conformational poses. Furthermore, the ensemble of ligand poses was investigated, and the best conformation was selected based on the docking score (−24.30 kcal/mol—
Table 6) and a graphical inspection of bonded and non-bonded contacts. Here, the preliminary docking analysis reveals that (a) good alignment was observed between the crystal ligand
X and the low-energy conformational pose of the highly active compound—
C40—from the dataset, and (b) the docked ligand—
C40—was surrounded by A227, F228, M231, L235, I237, L246, V249, M250, V253, F254, R263, T266, L267, F270, G271, V274, L290, I294, V297, and L298 residues at the Mcl1 binding pocket by covering a larger area of interaction.
Further analysis shows that the electrostatic interaction stabilizes the predicted low-energy conformational pose of
C40 inside the binding pocket of Mcl1. This electrostatic interaction takes place between the negatively charged carboxylic acid group of
C40 and the positively charged side-chain atom of R263, i.e., between the O5 atom of
C40 and the NH atom from the guanidium side-chain of R263. Apart from the strong electrostatic interaction, the predicted low-energy conformational pose of
C40 was further stabilized by a series of π–π interactions. These π–π interactions occurred between the (i) naphthyl moiety and (ii) the chlorobenzene of
C40 with the side-chain benzene ring of F270; and the (iii) benzene ring that inserts deep into the P2 pocket with these side-chain benzene ring of F254 of Mcl1. From the figure, it is observed that these π–π interactions help to anchor the
C40 in place, enhancing the complex’s stability. The distances between residues involved in the π–π interactions are depicted in
Figure 7c. Furthermore, the rest of the surrounding hydrophobic residues provide additional strength for complex stability via non-bonded interactions.


