4.2. Analysis of Pressure’s Effect on the Gas Diffusion
(1) The BD Model
Equation (4) implies that the BD model includes three unknown parameters, including fast effective diffusion coefficient
Dae, slow effective diffusion coefficient
Die and the ratio of macropore adsorption/desorption to the total adsorption/desorption
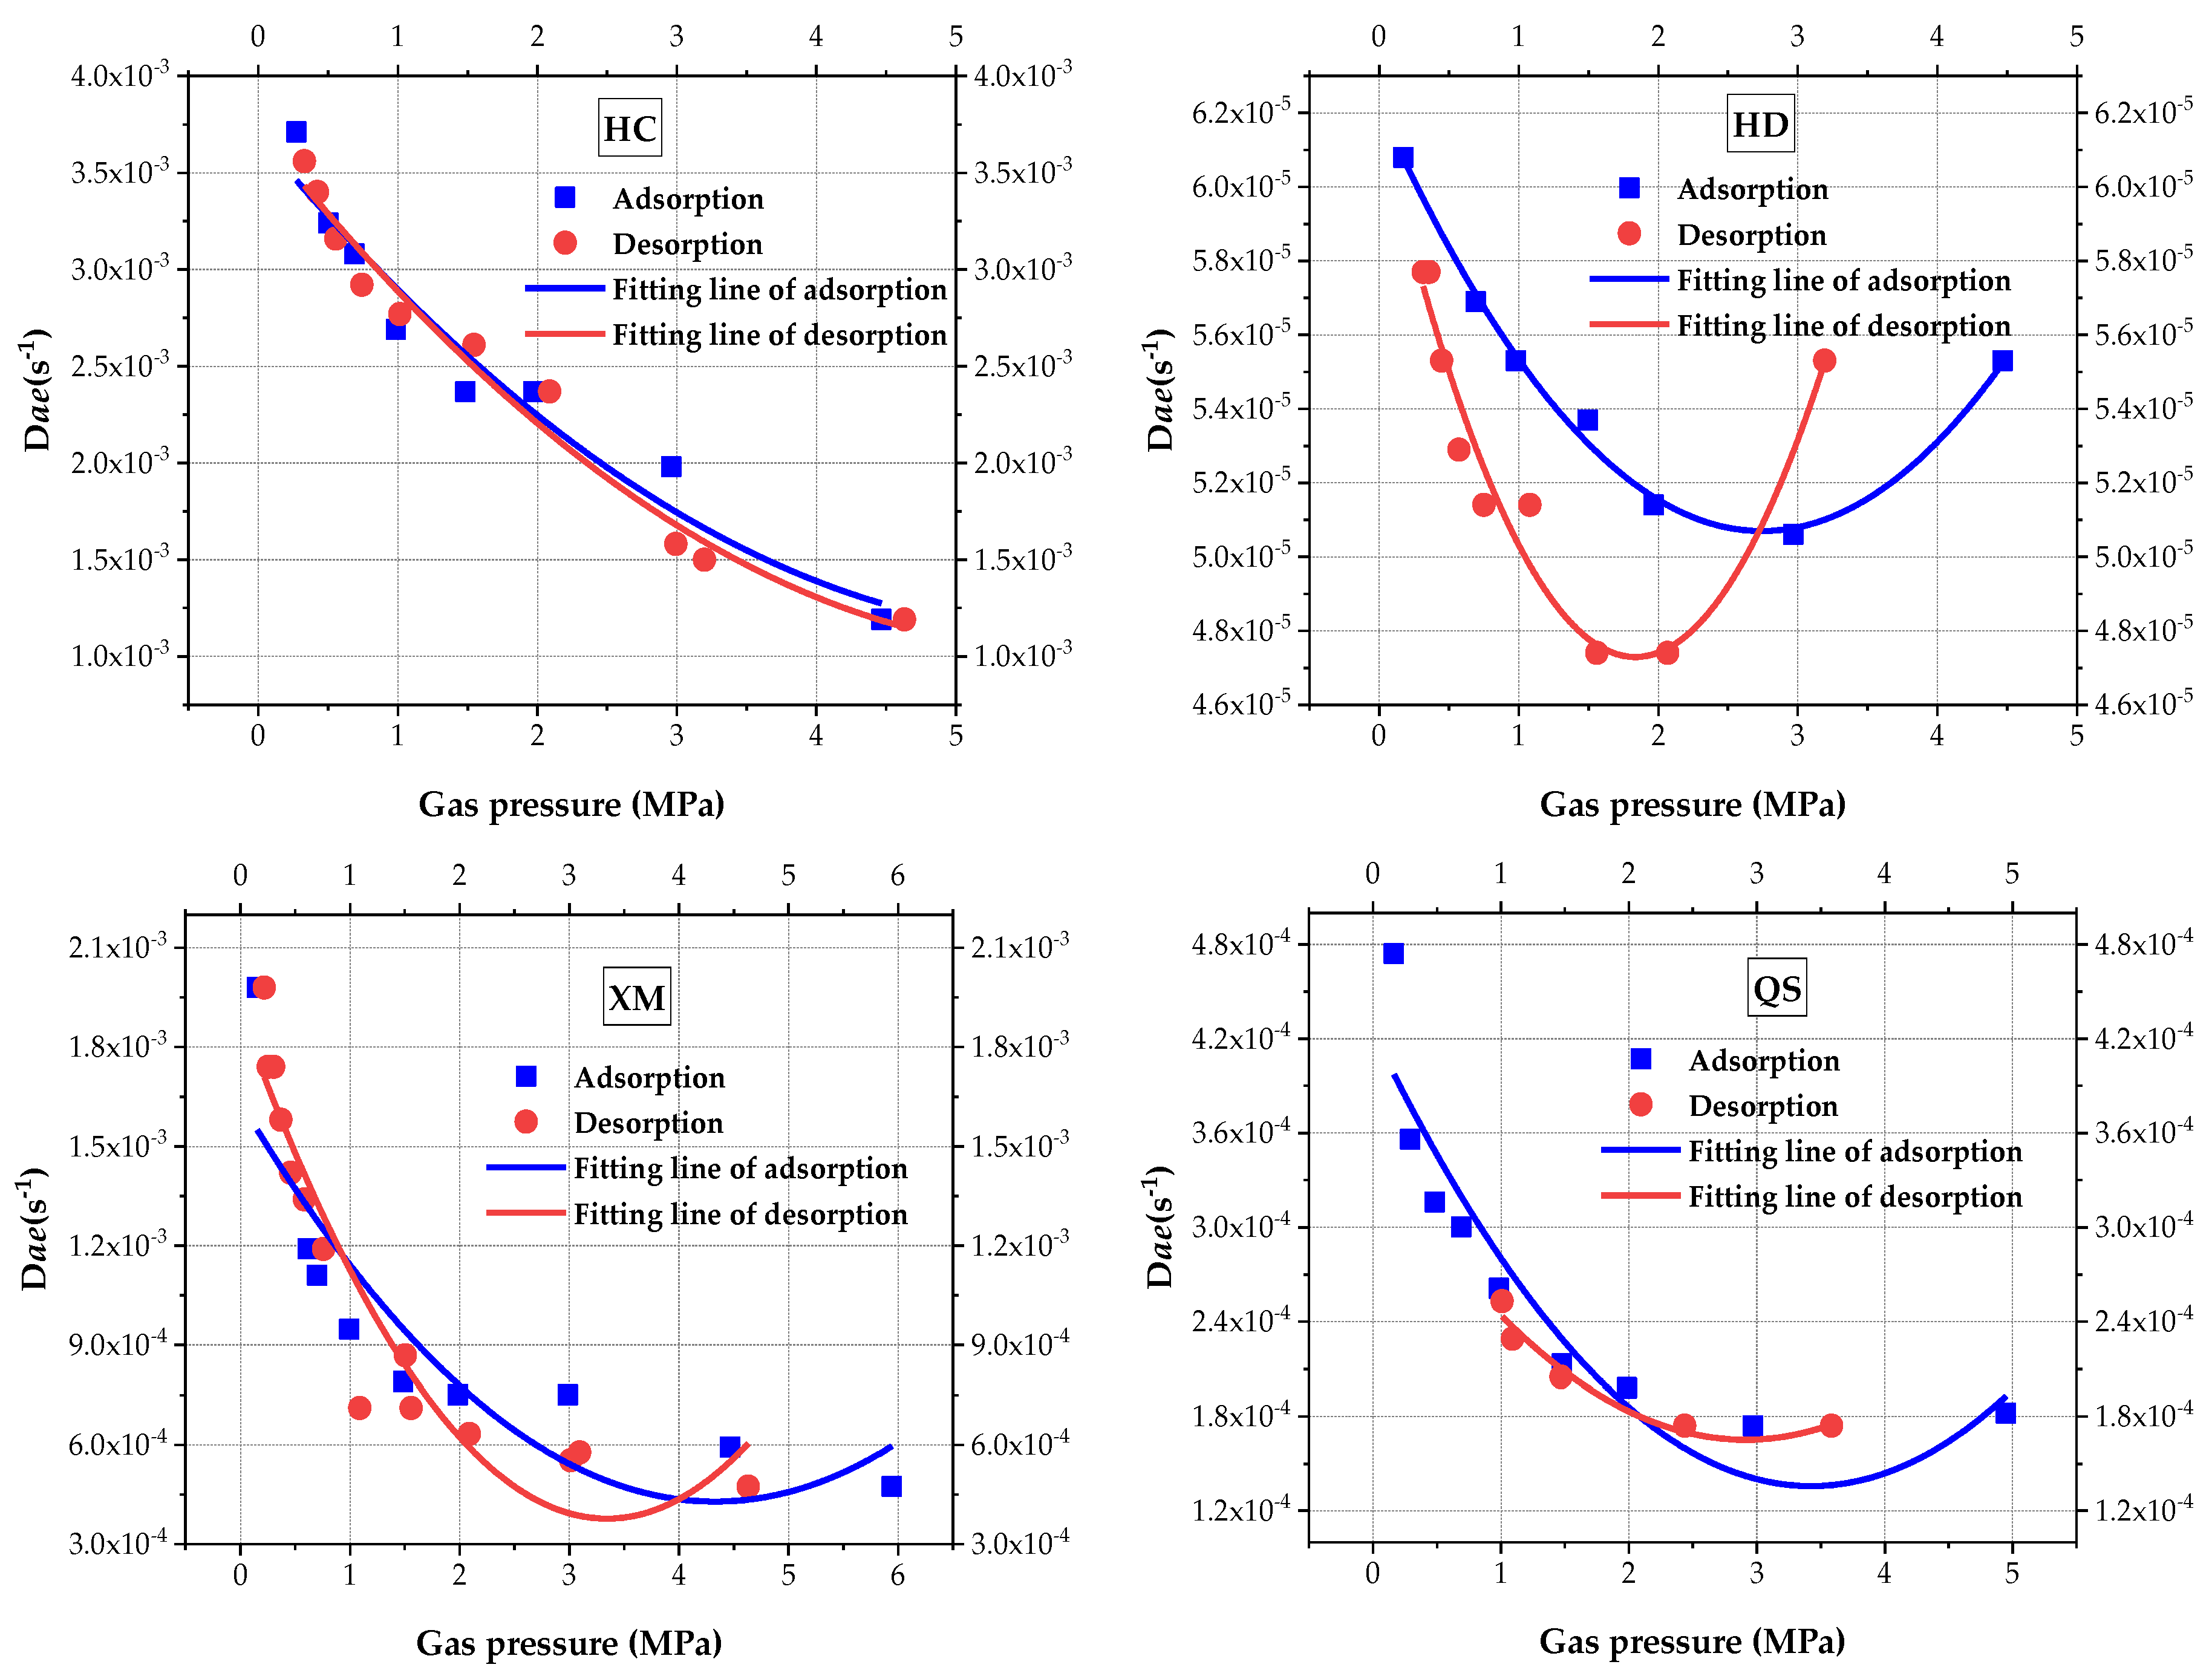
β. Using Equation (4) to calculate the BD characteristic parameters and analyze the impact of pressure on
Dae (
Figure 6) and quadratic polynomial is to fit the results, the fitting goodness and calculated coefficient are shown in
Table 4. As can be seen from
Figure 6, the macropore diffusion coefficient
Dae decreases with the increase in pressure in three out of four sample coals (i.e, HC, XM and QS). Concerning the HD,
Dae shows a V-shape trend, which first decreases and then increases as the increases in pressure.
Figure 6 also shows that the impact law of pressure on
Dae is better illustrated by the quadratic polynomial. When comparing the values of
Dae, in both the adsorption and desorption processes,
Dae(HC) >
Dae(XM) >
Dae(QS) >
Dae(HD). The difference of
Dae in the absorption versus the desorption process becomes larger from HC to QS. No significant increasing trend of HC, XM and QS is found when the pressure increases, It is suspected that the set maximum pressure is not in the threshold level.
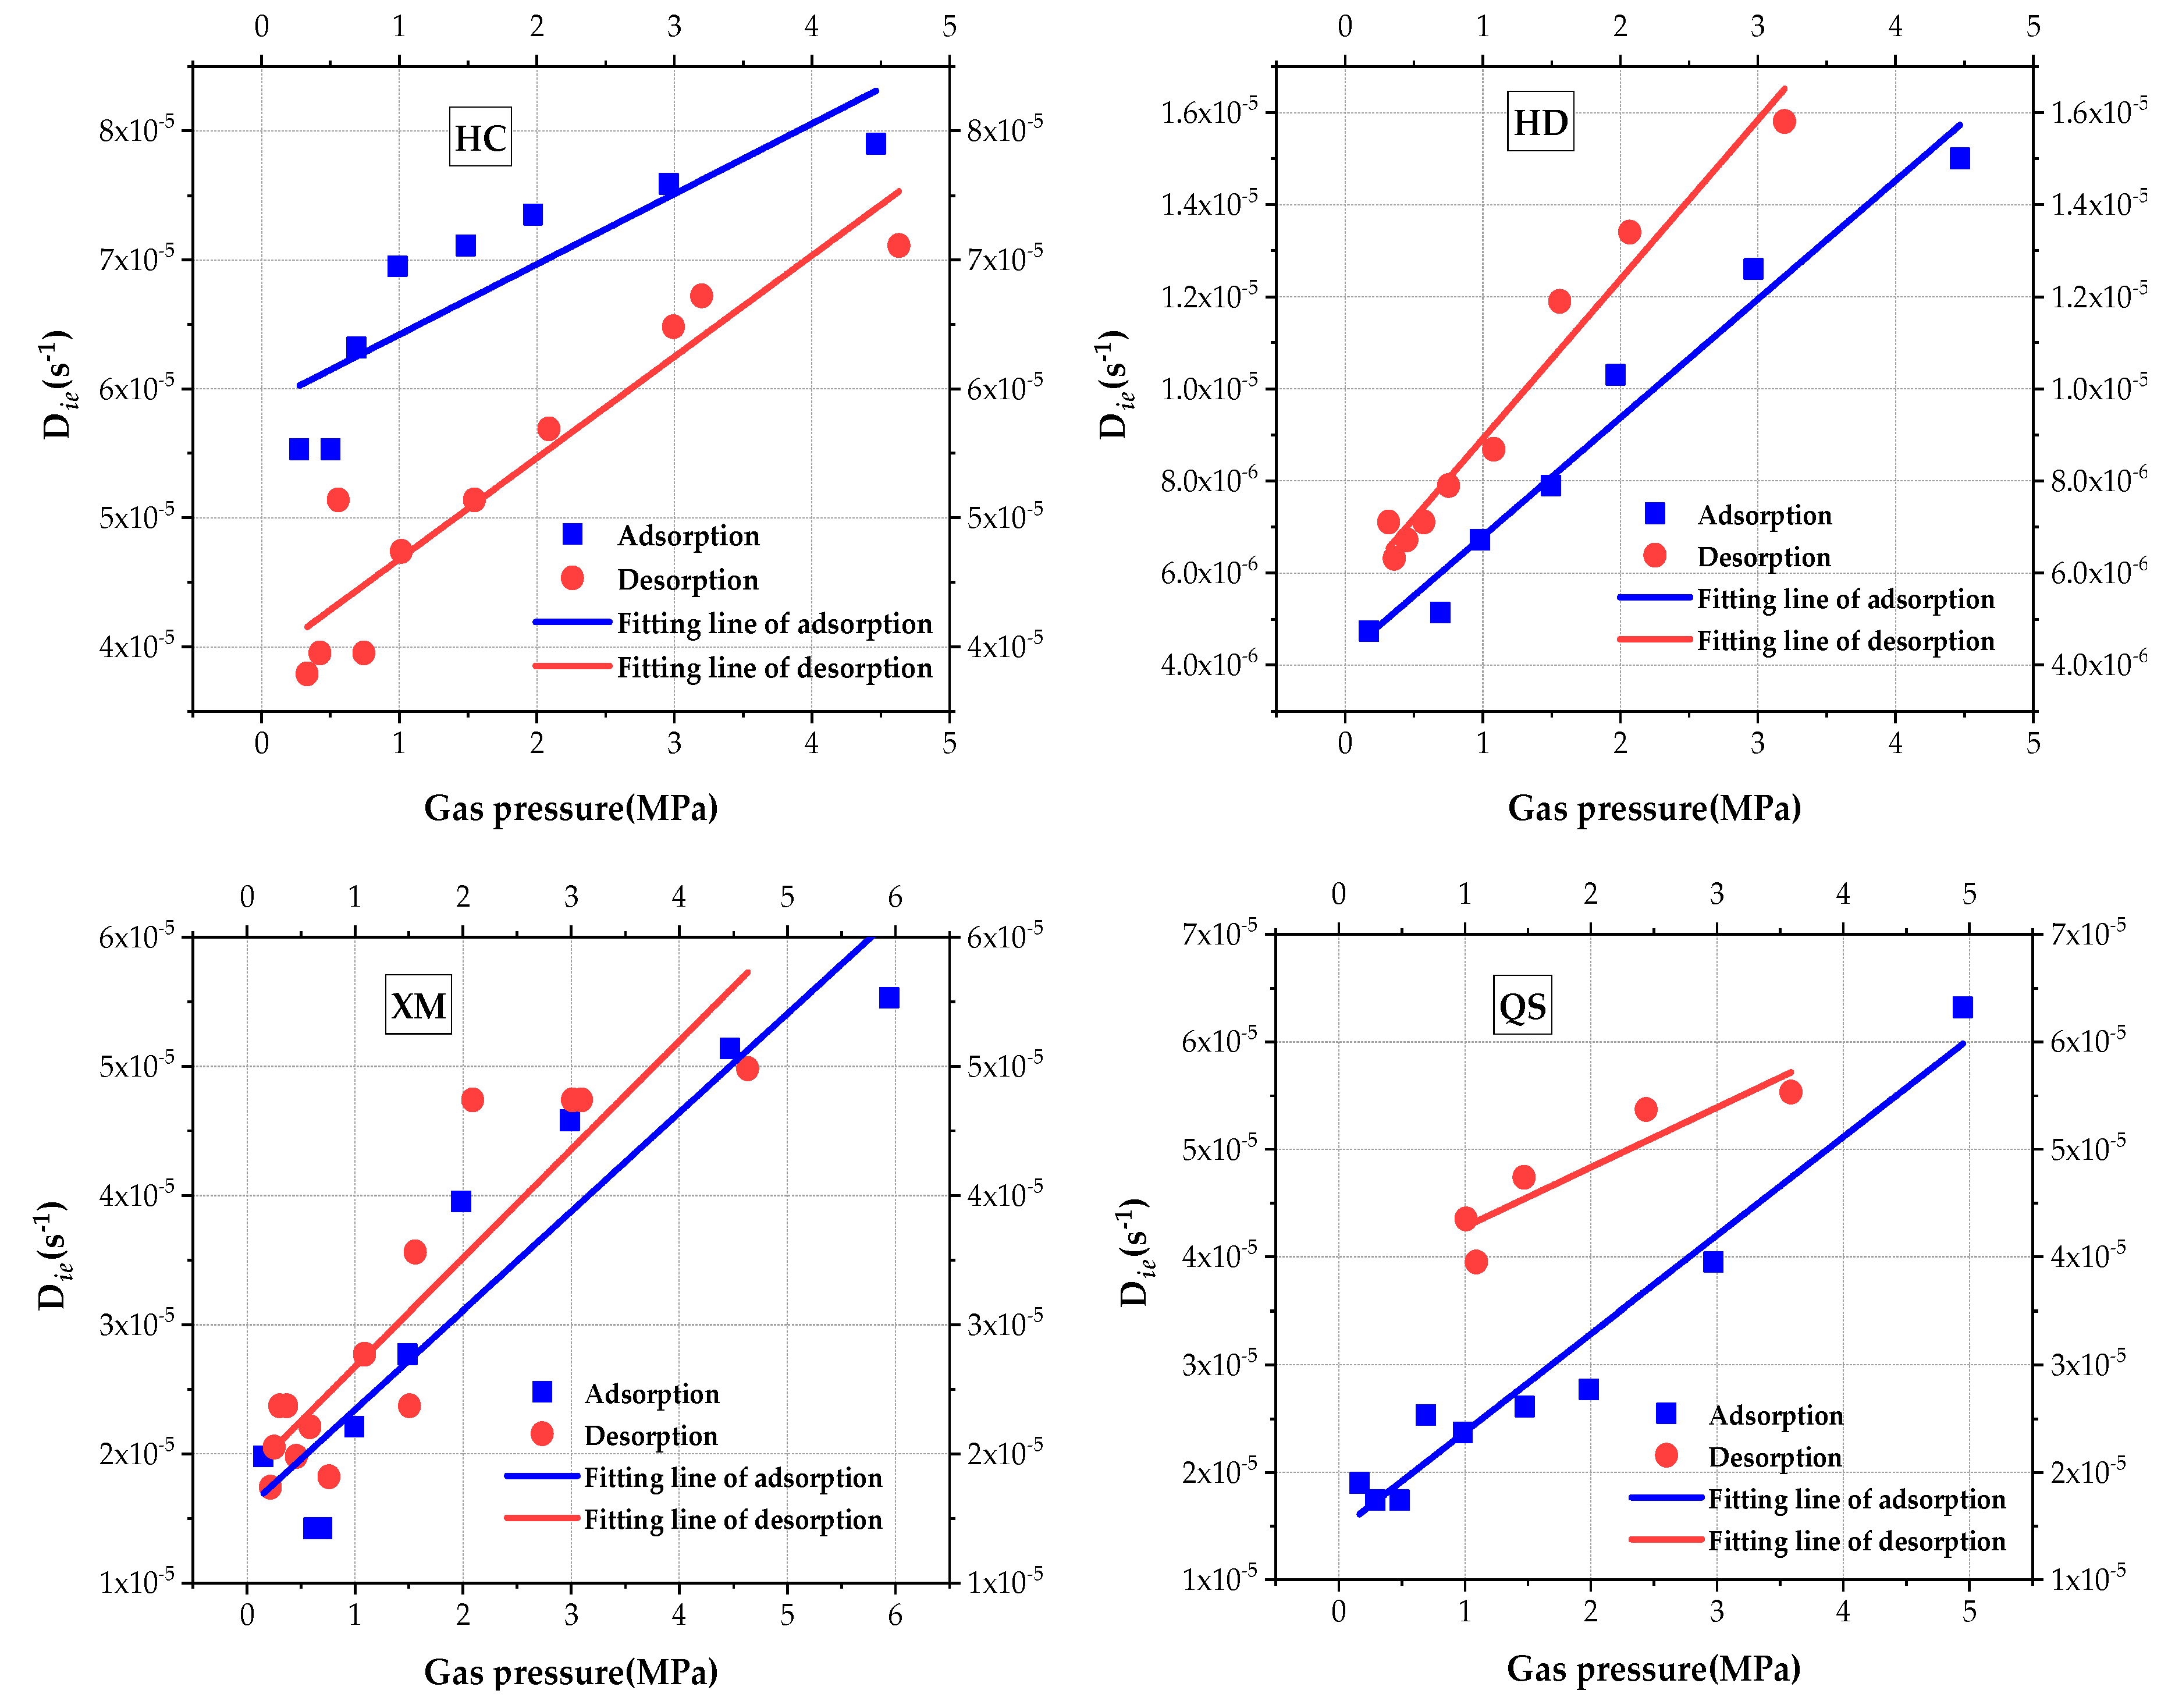
The impact of gas pressure on
Die is analyzed and is shown in
Figure 7. Linear regression is used to fit the results and, results of the fitting goodness and calculated coefficient are given in
Table 5. It can be clearly seen that the slow efficient diffusion coefficient
Die increases with the increase in pressure for all four samples. The impact law of pressure on
Die is better explained by the linear regression. When comparing the values of
Die, the order is
Die(HC) >
Die(XM) >
Die(QS) >
Die(HD) in the adsorption process and
Die(HC) >
Die(QS) >
Die(XM) >
Die(HD) in the desorption process.
The calculation results show that β is 0.74~0.76 for HC, 0.58~0.6 for HD, 0.67~0.69 for XM and 0.69~0.7 for QS, respectively, implying that the diffusion characteristic parameter β keeps constant in the adsorption/desorption process. This further indicates that β which represents the intrinsic property would not show a significant fluctuation with the change in pressure.
(2) The DD Model
The DD model includes two unknown characteristic parameters, the characteristic rate parameter
kΦ and the stretching parameter
α. The influencing law of pressure on the
kΦ and
α are re-analyzed, and calculated based on the gas diffusion experimental results and Equation (5). The results are shown in
Figure 8 and
Figure 9, respectively.
Gregory Staib et al. [
23,
27] found that
kΦ decreases with the increase in pressure which ranges from 0~3 MPa in their studies. In terms of the vitrinite-rich coal samples,
α increases with gas pressure while for the inertinite-rich coal samples, no significant changing trend is found for
α.
Figure 8 shows that in our study,
kΦ keeps unchanged in the pressure fluctuation process. Concerning XM and QS,
kΦ slightly decreases with the increase in pressure when the pressure is less than P
0, but it keeps constant while the pressure is larger than P
0.
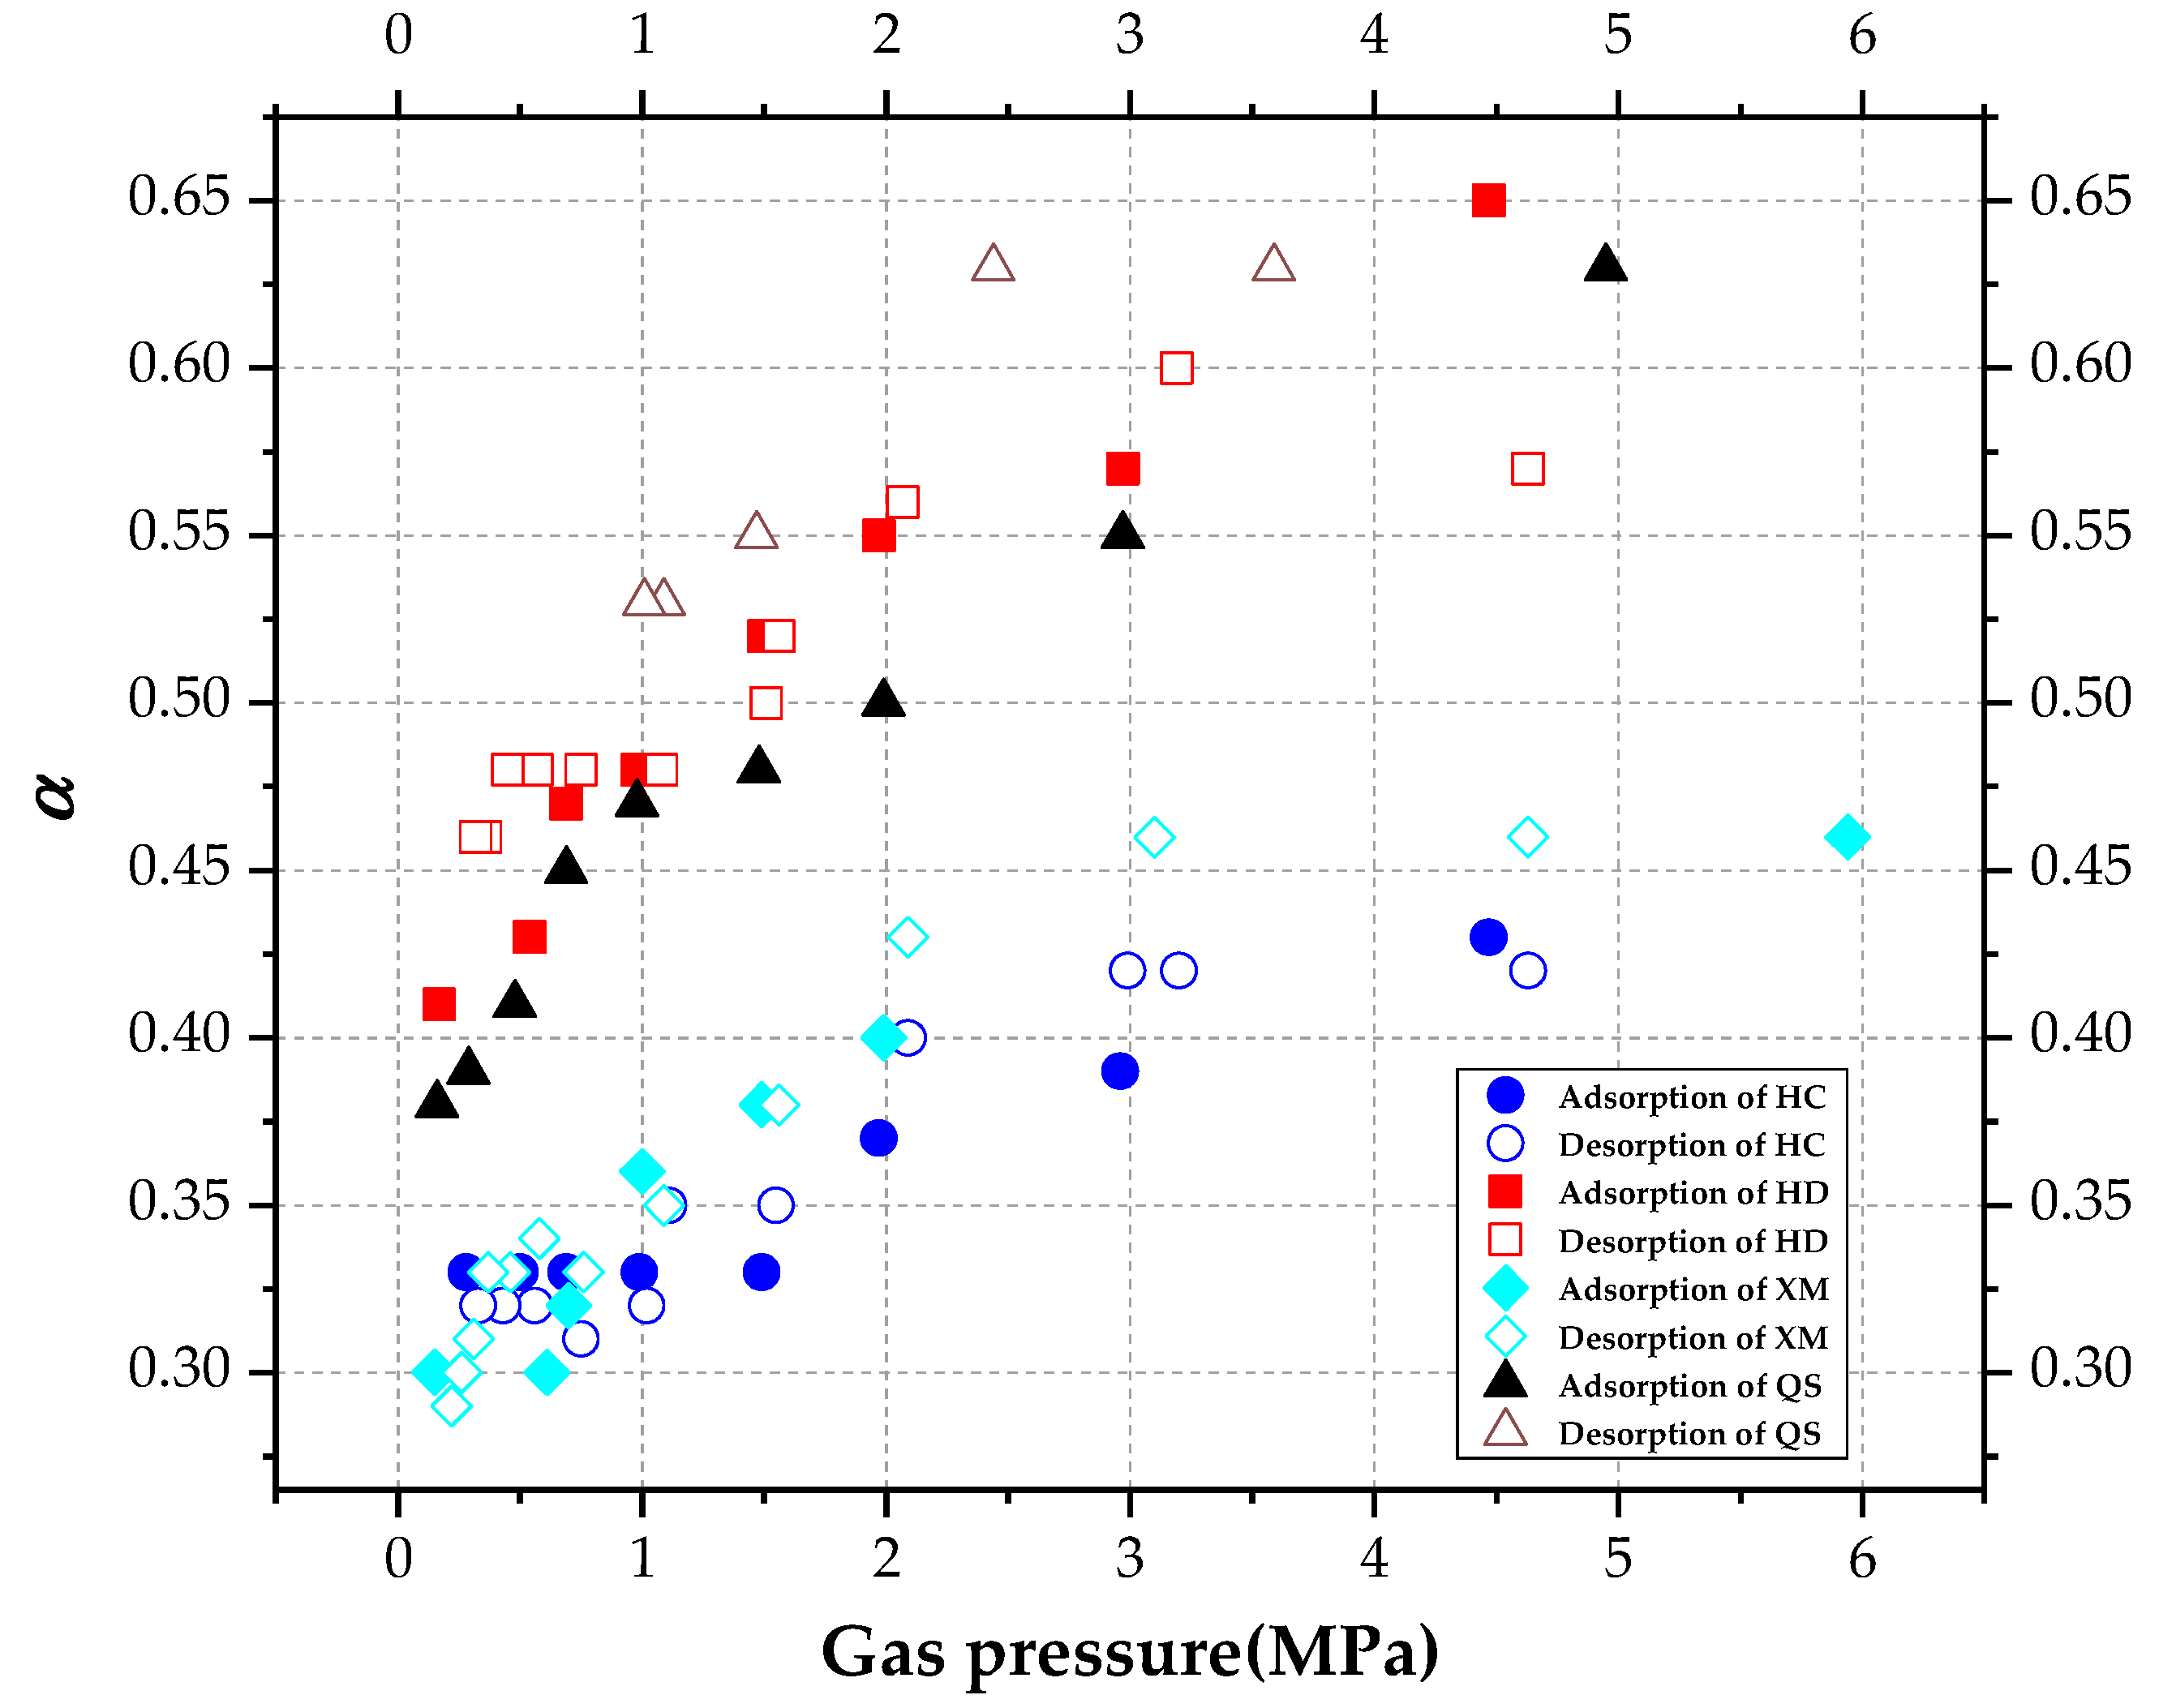
As shown in
Figure 9,
α increases with pressure. The mean values of α were calculated in
Table 6. The mean value of
α is ordered as
α(HD) >
α(QS) >
α(XM) >
α(HC) in the absorption process, while the order is
α(QS) >
α(HD) >
α(HC) >
α(HM) in the desorption process.
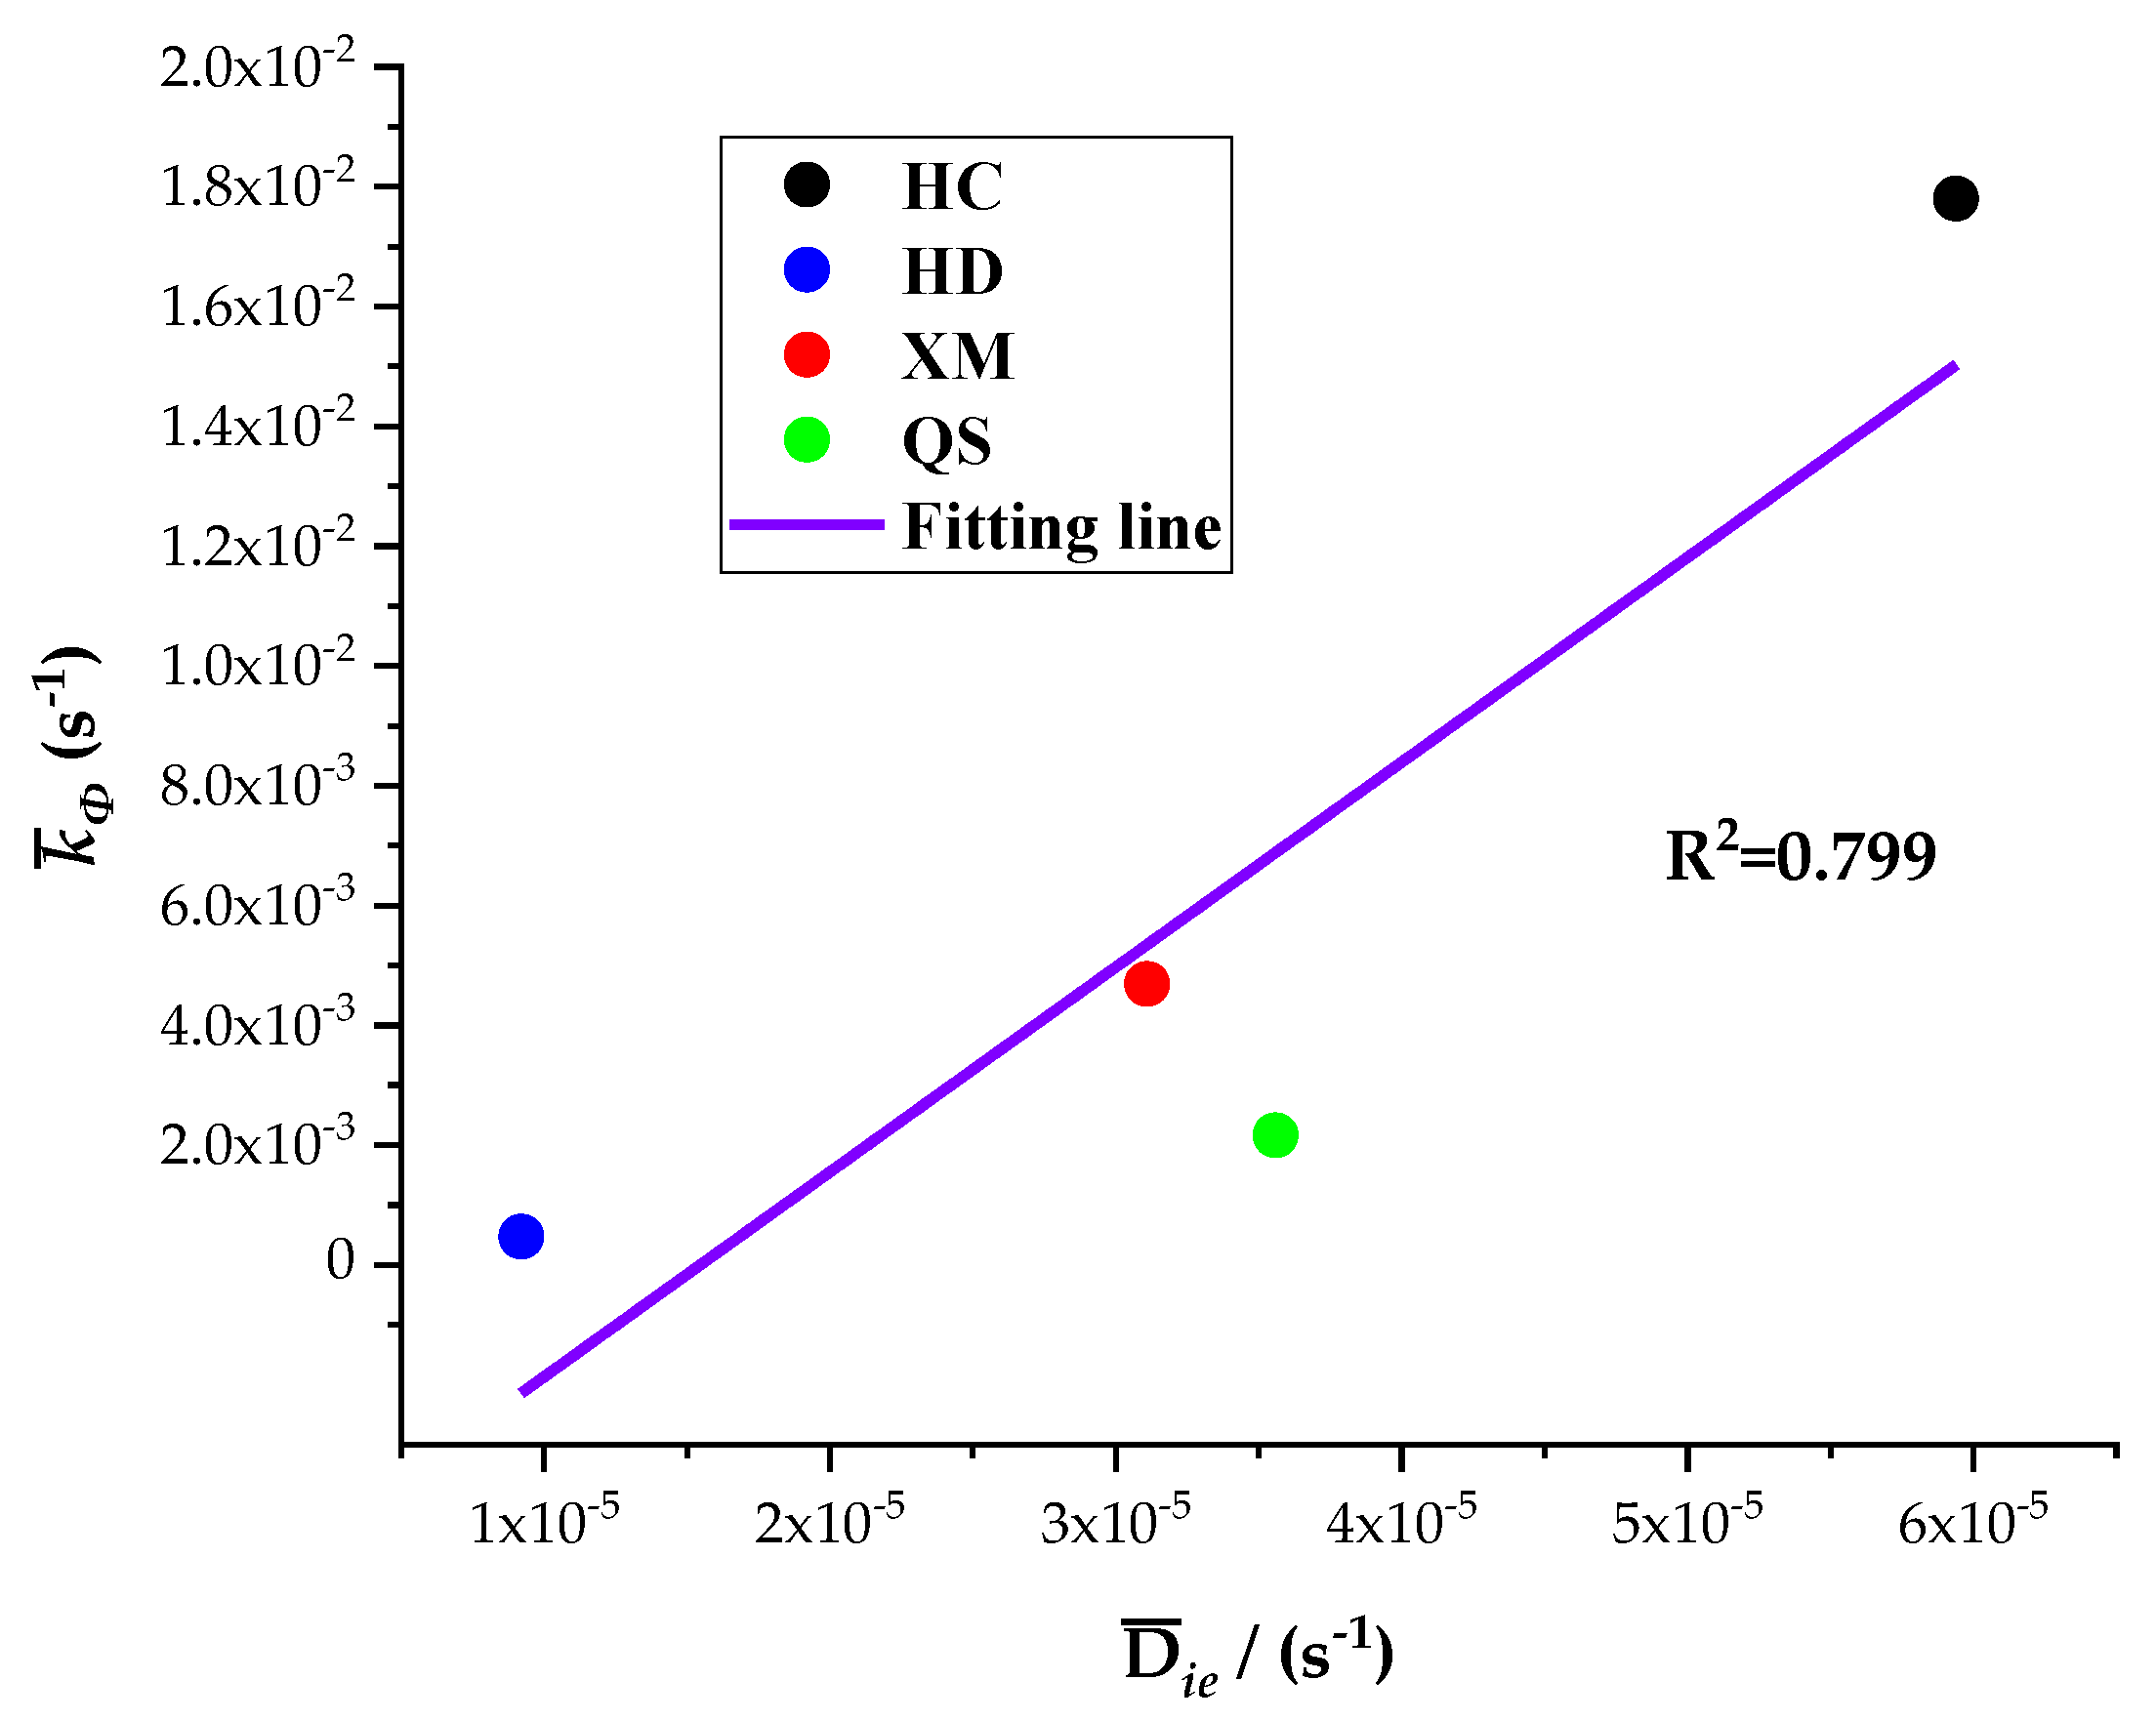
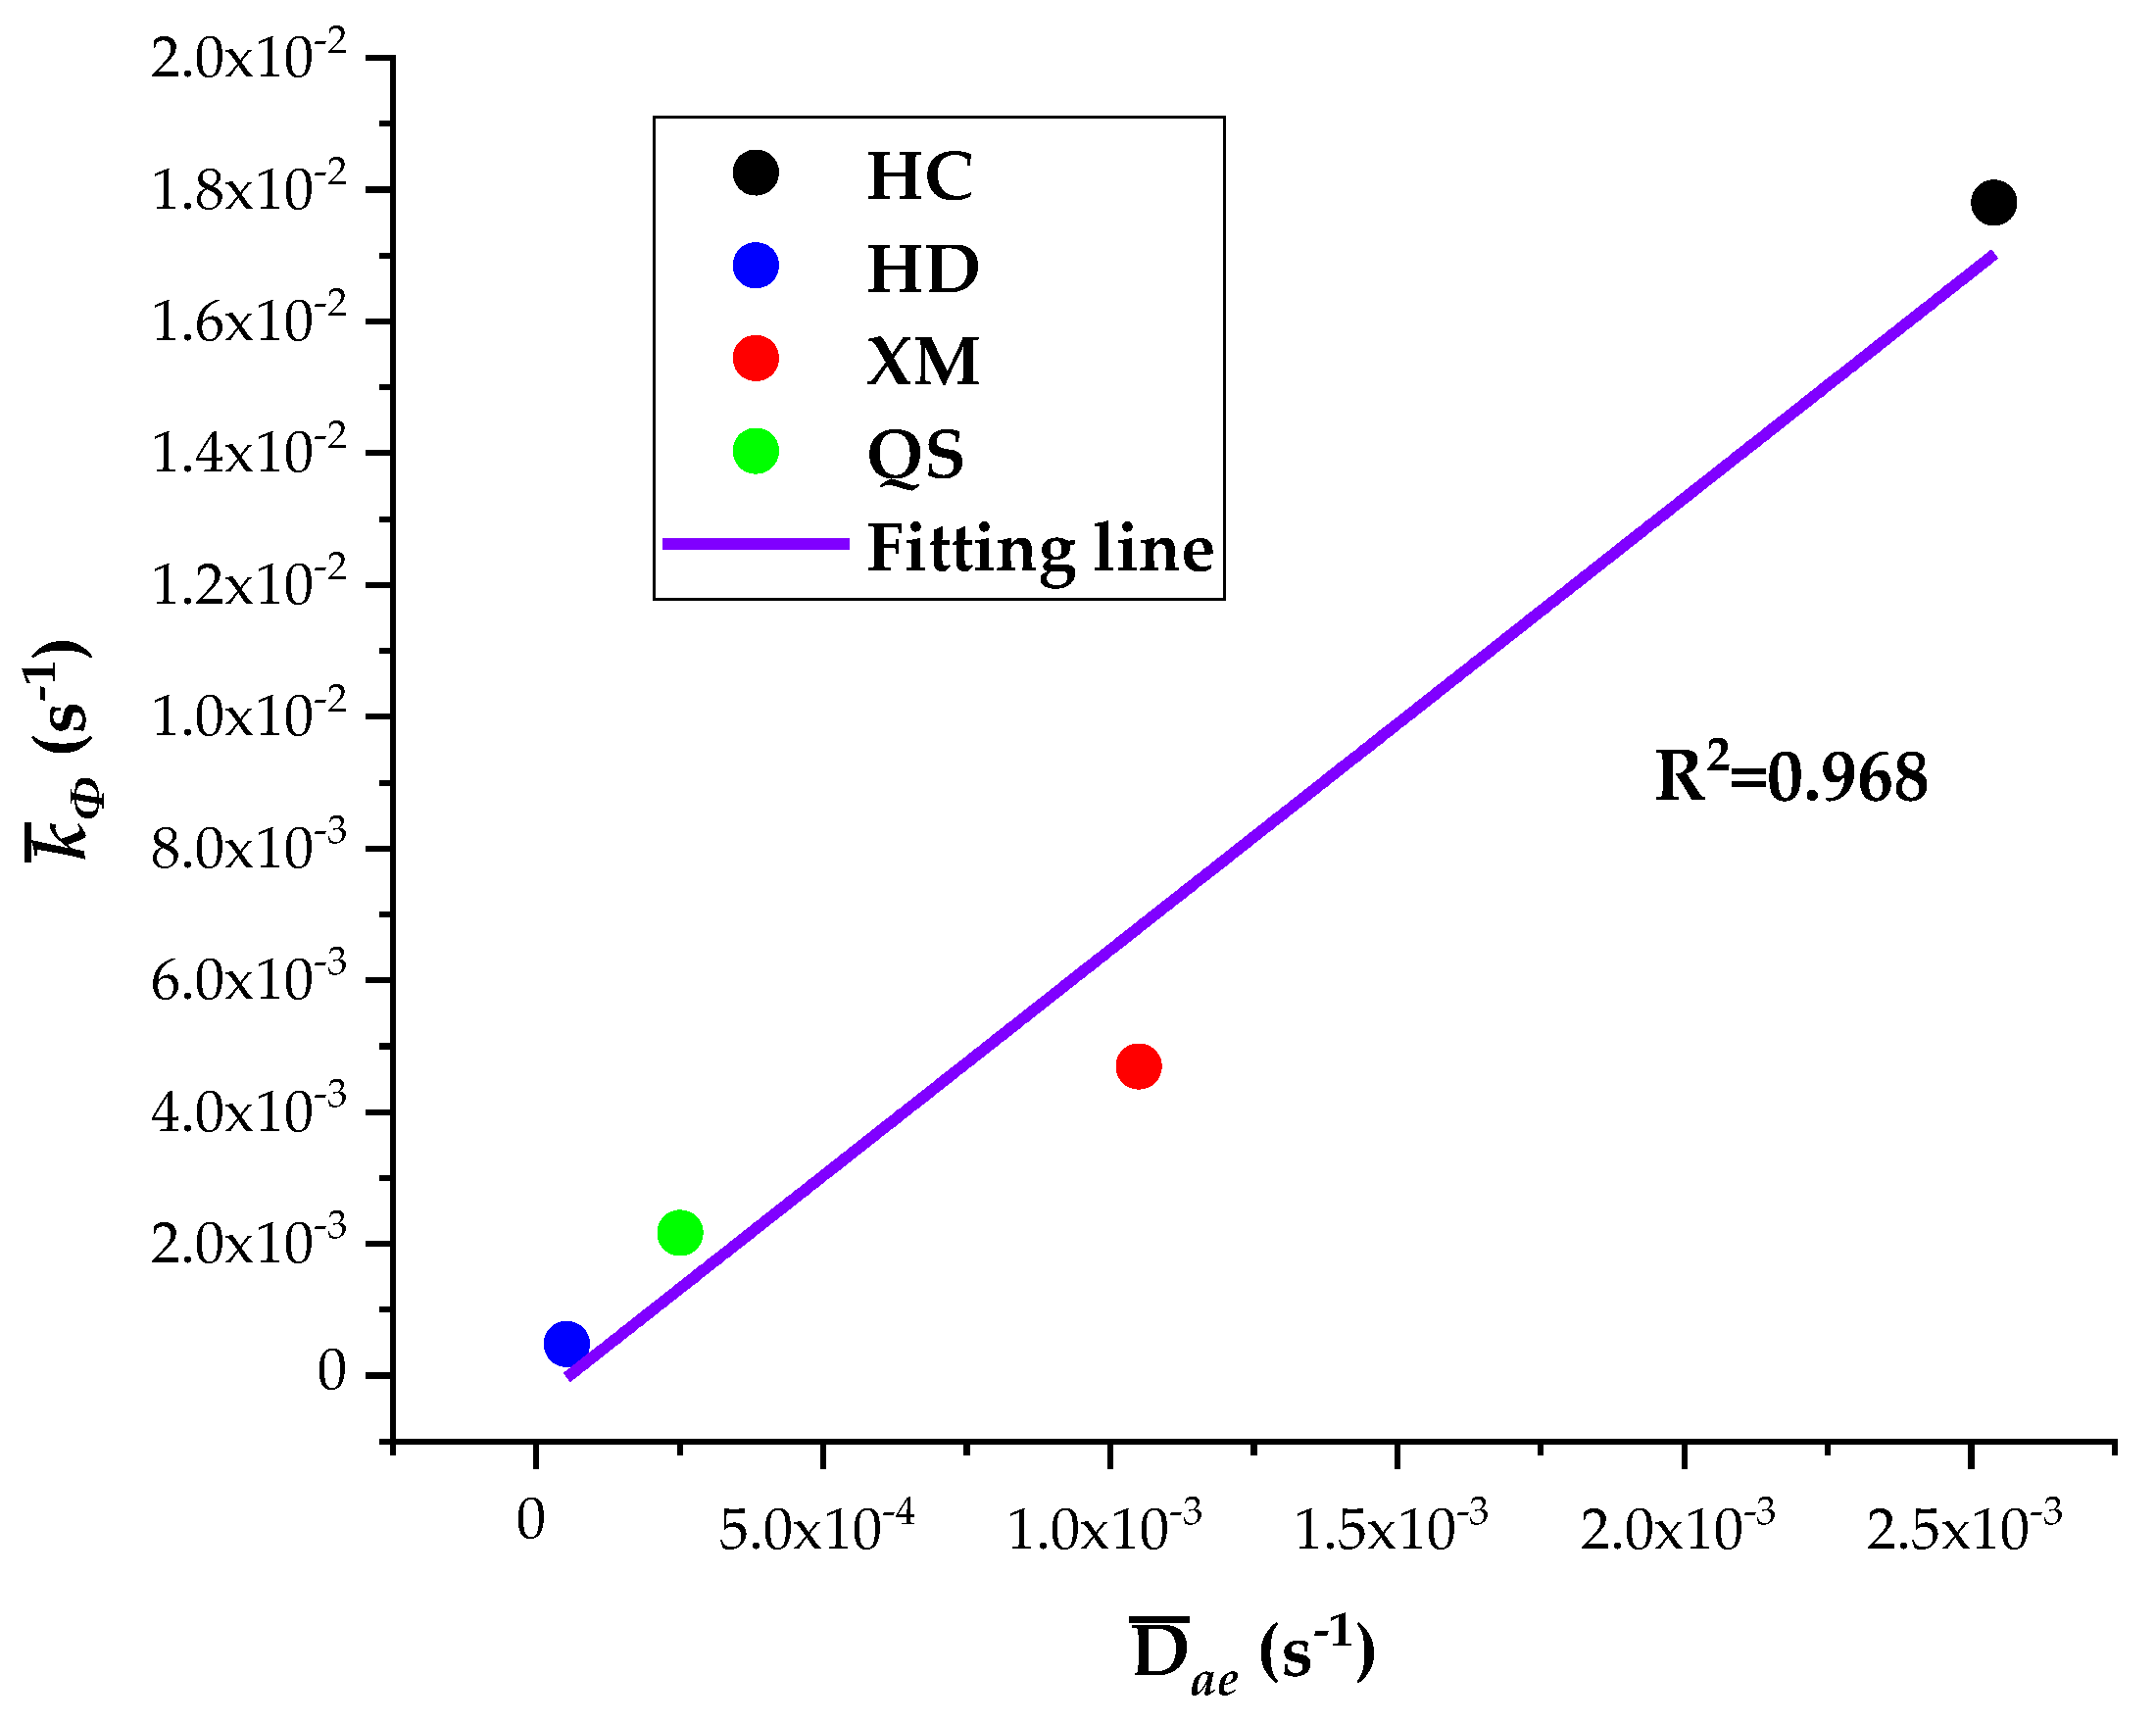
(3) Analysis of the correlation of diffusion characteristics parameters
The five diffusion characteristics parameters of the BD and DD models are treated by the homogenization procedure and the results are shown in
Table 7. It can be seen that
Dae,
Die and
kΦ are the largest for HC, in the middle for XM and QS, and the smallest for HD. The linear regression results of
kΦ on
Dae and
kΦ on
Die are shown in
Figure 10 and
Figure 11, respectively.
The results show a good linear correlation of Dae, Die and kΦ in our experimental results, and the goodness of fit is the best for Dae and kΦ. It suggests that both the diffusion coefficients Dae and Die and characteristic rate parameter kΦ are suitable for describing the coal gas diffusion rate. The analysis above suggests that the fast diffusion coefficient Dae decreases with the increase in pressure while the slow diffusion coefficient Die increases with the increase in pressure. kΦ keeps fixed and thus may be considered as a combined effect of Dae and Die.
4.3. Analysis of the Relationship between Pore Structure Characteristics and Gas Diffusion
By analyzing and summarizing the impact, law of CH
4 diffusion under different pressures, we found the diversity of gas diffusion coefficients in both absorption and desorption process for different coal samples. Because the coal pore structures might directly affect the diffusion process of gas [
28], experiments on the low temperature nitrogen absorption and mercury penetration were conducted to test the characteristics of coal pore structure.
The Quadrasorb instrument is used for the low temperature nitrogen absorption experiment and the PoreMaster60 mercury porosimeter instrument is applied for the mercury penetration. coal samples particles with 1~3 mm in size are prepared and dried. The low temperature nitrogen absorption method is suitable for testing the distribution of coal micropore ranging from 0~25 nm, which determines the coal specific surface area [
28]. Because the mercury penetration method is not accurate in testing the micropore, it is only suitable for analyzing the pores which are bigger than 25 nm. Therefore, in this study, the computation of pore volume is calculated by the low temperature nitrogen absorption method when the pore size ranges from 0~25 nm and by the mercury penetration method if the pore size is bigger than 25 nm. The specific surface area and pore volume are given in
Table 8 and
Table 9, respectively.
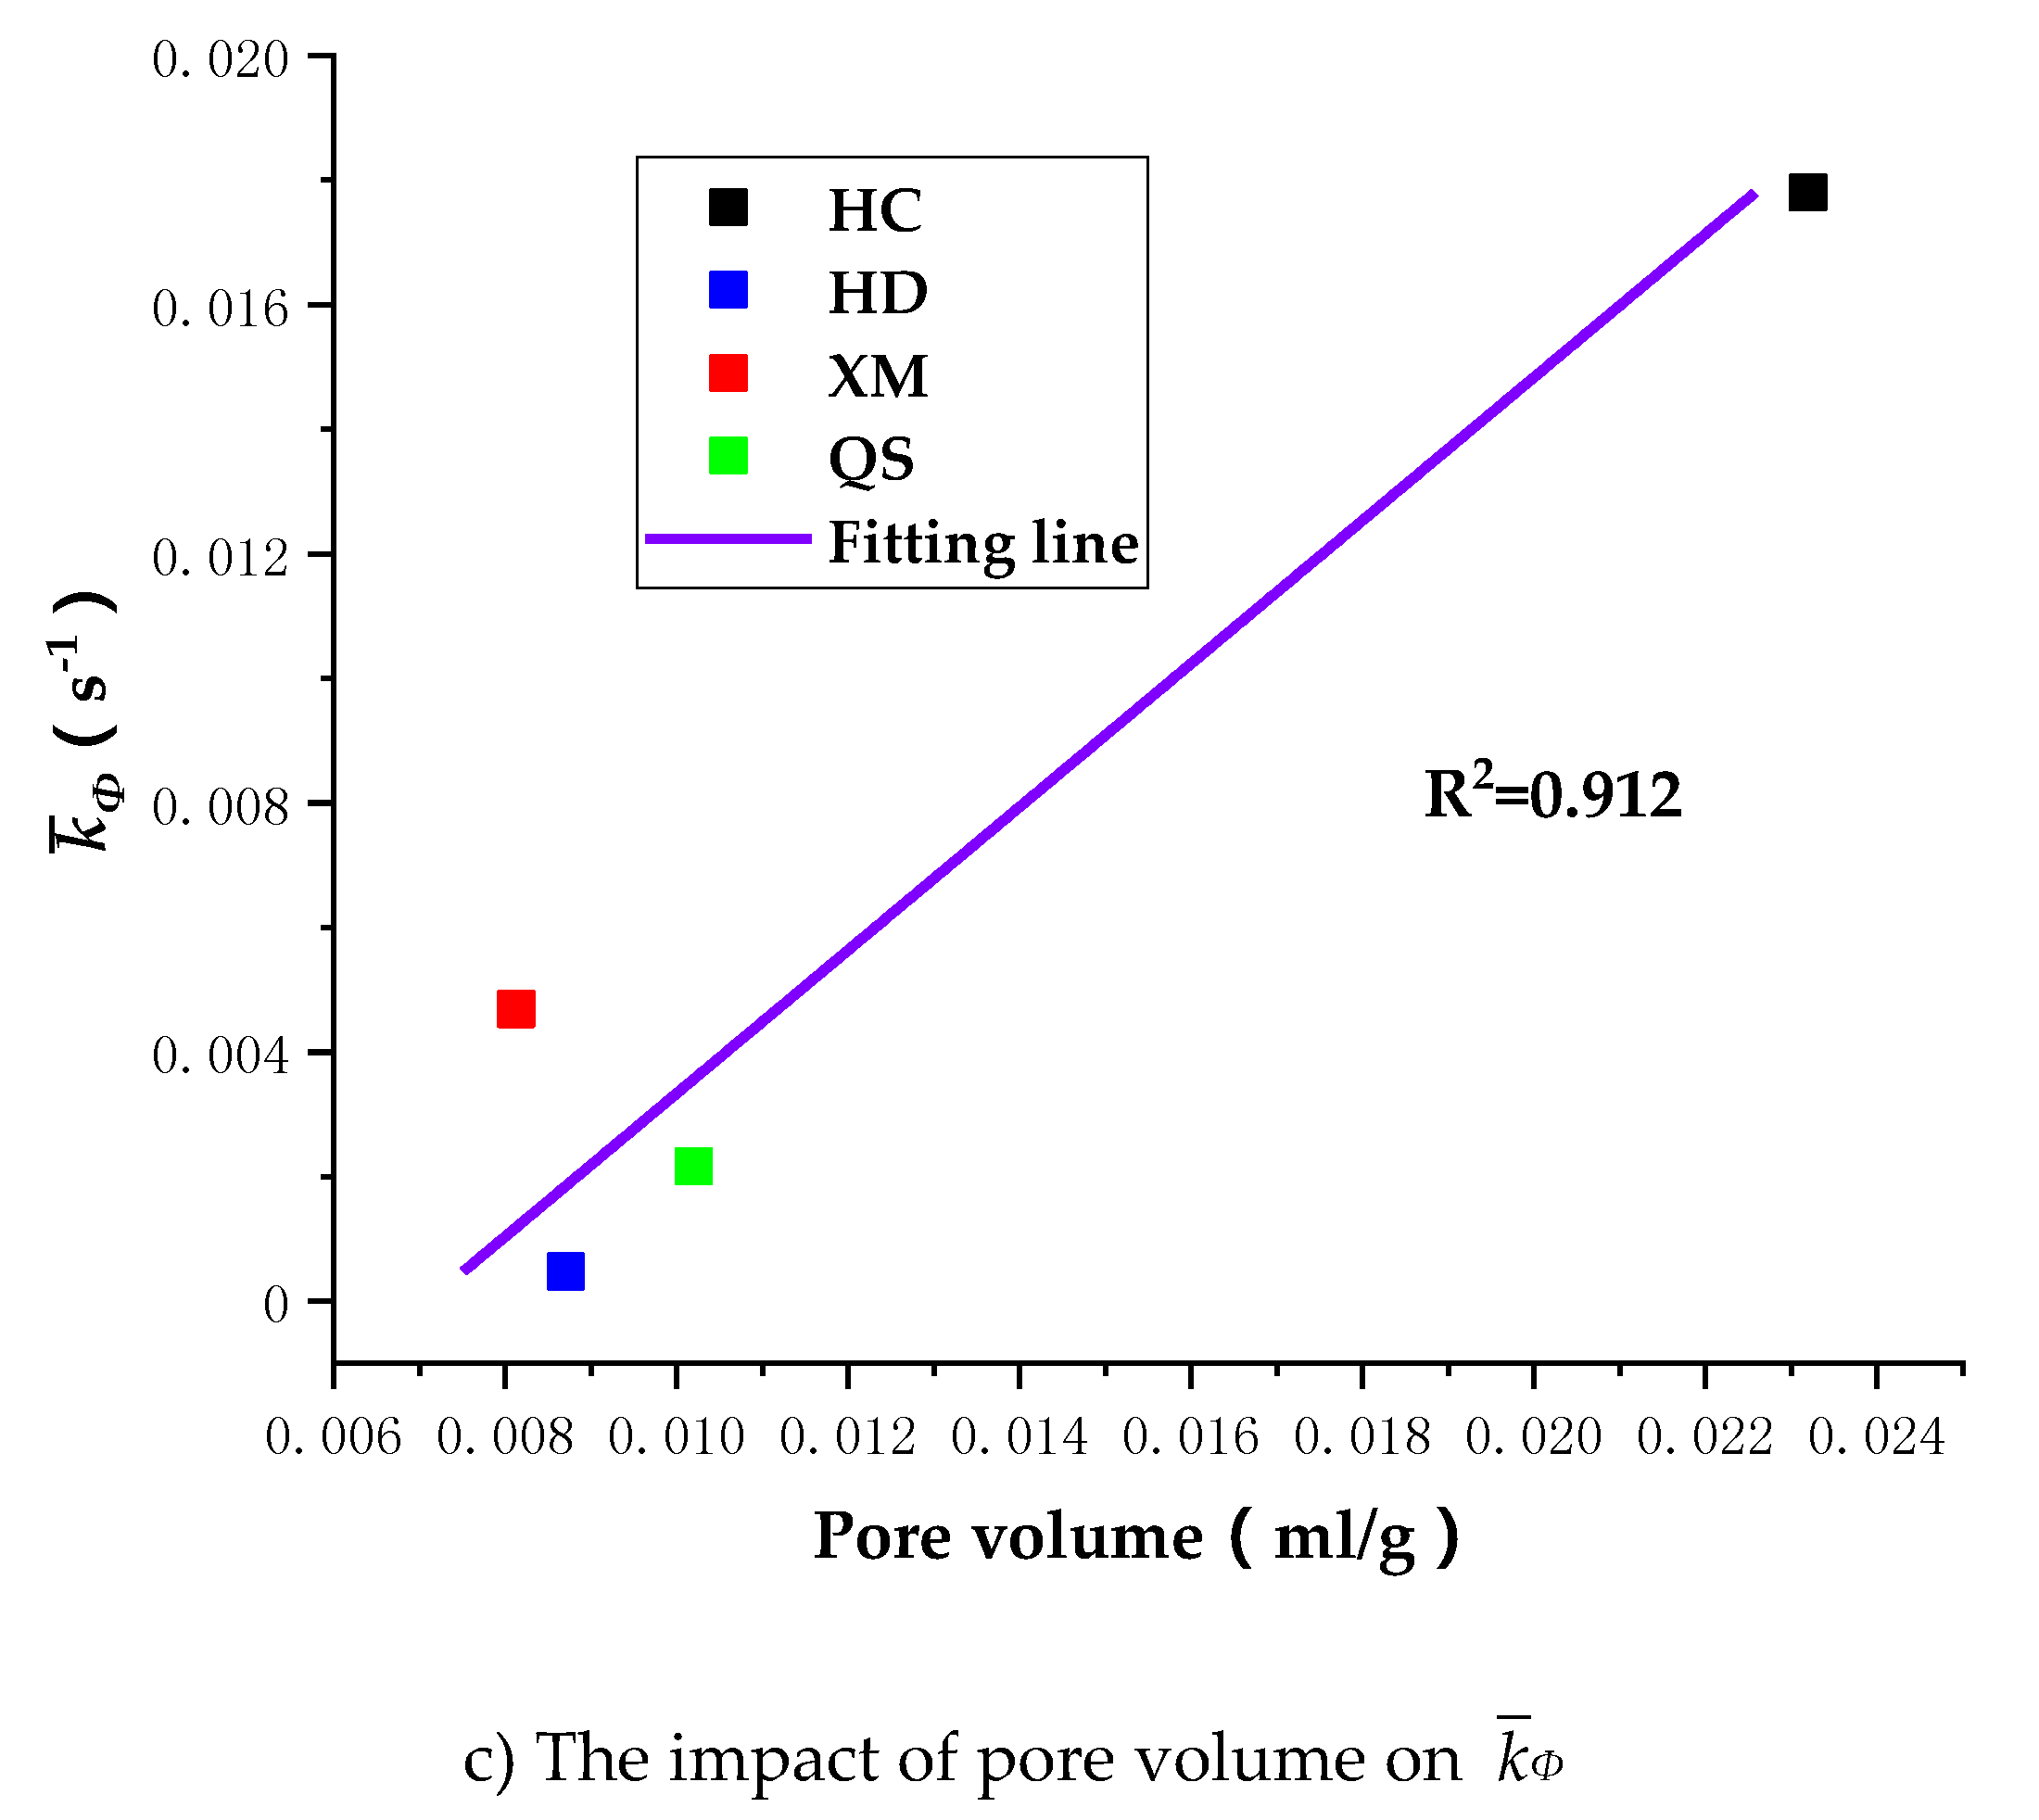
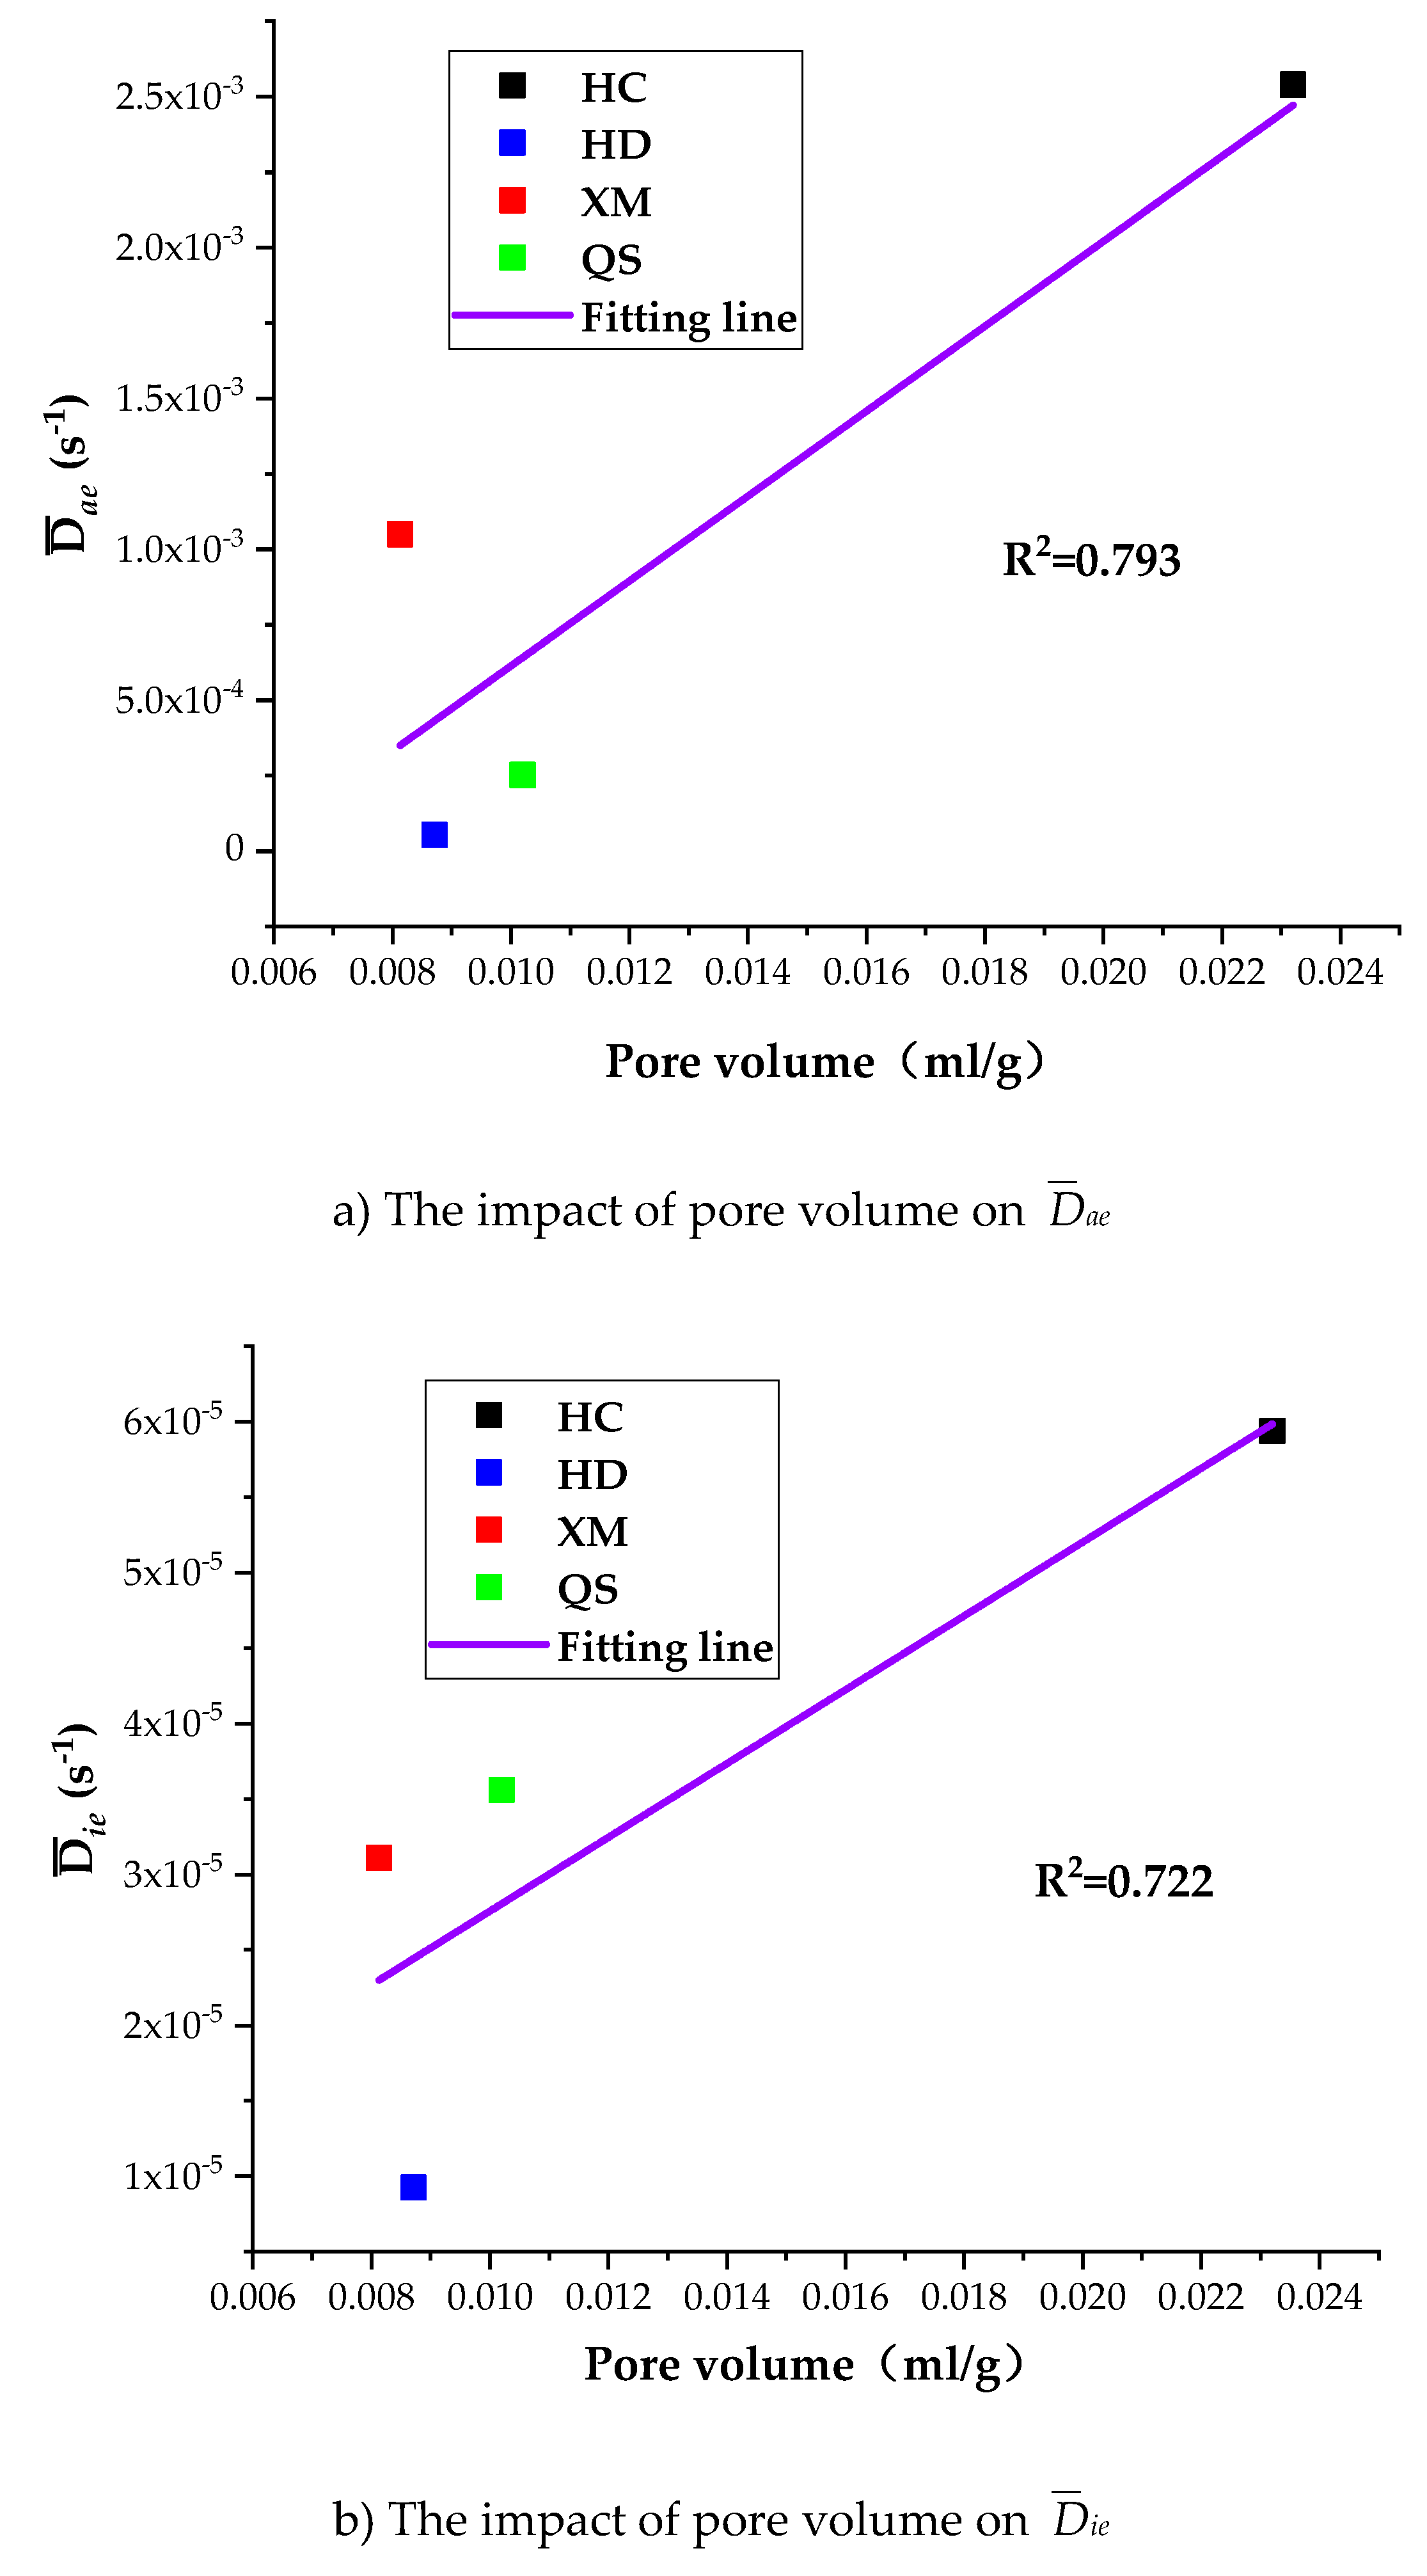
To further understand the impact of coal pore structure characteristics on the gas diffusion, we run the linear regressions of
Dae,
Die and
kΦ on pore volume. As shown in
Figure 12, the correlation between the pore volume and the diffusion coefficients is, largest for
kΦ (R
2 = 0.912), middle for
Dae (R
2 = 0.793) and smallest for
Die (R
2 = 0.722).
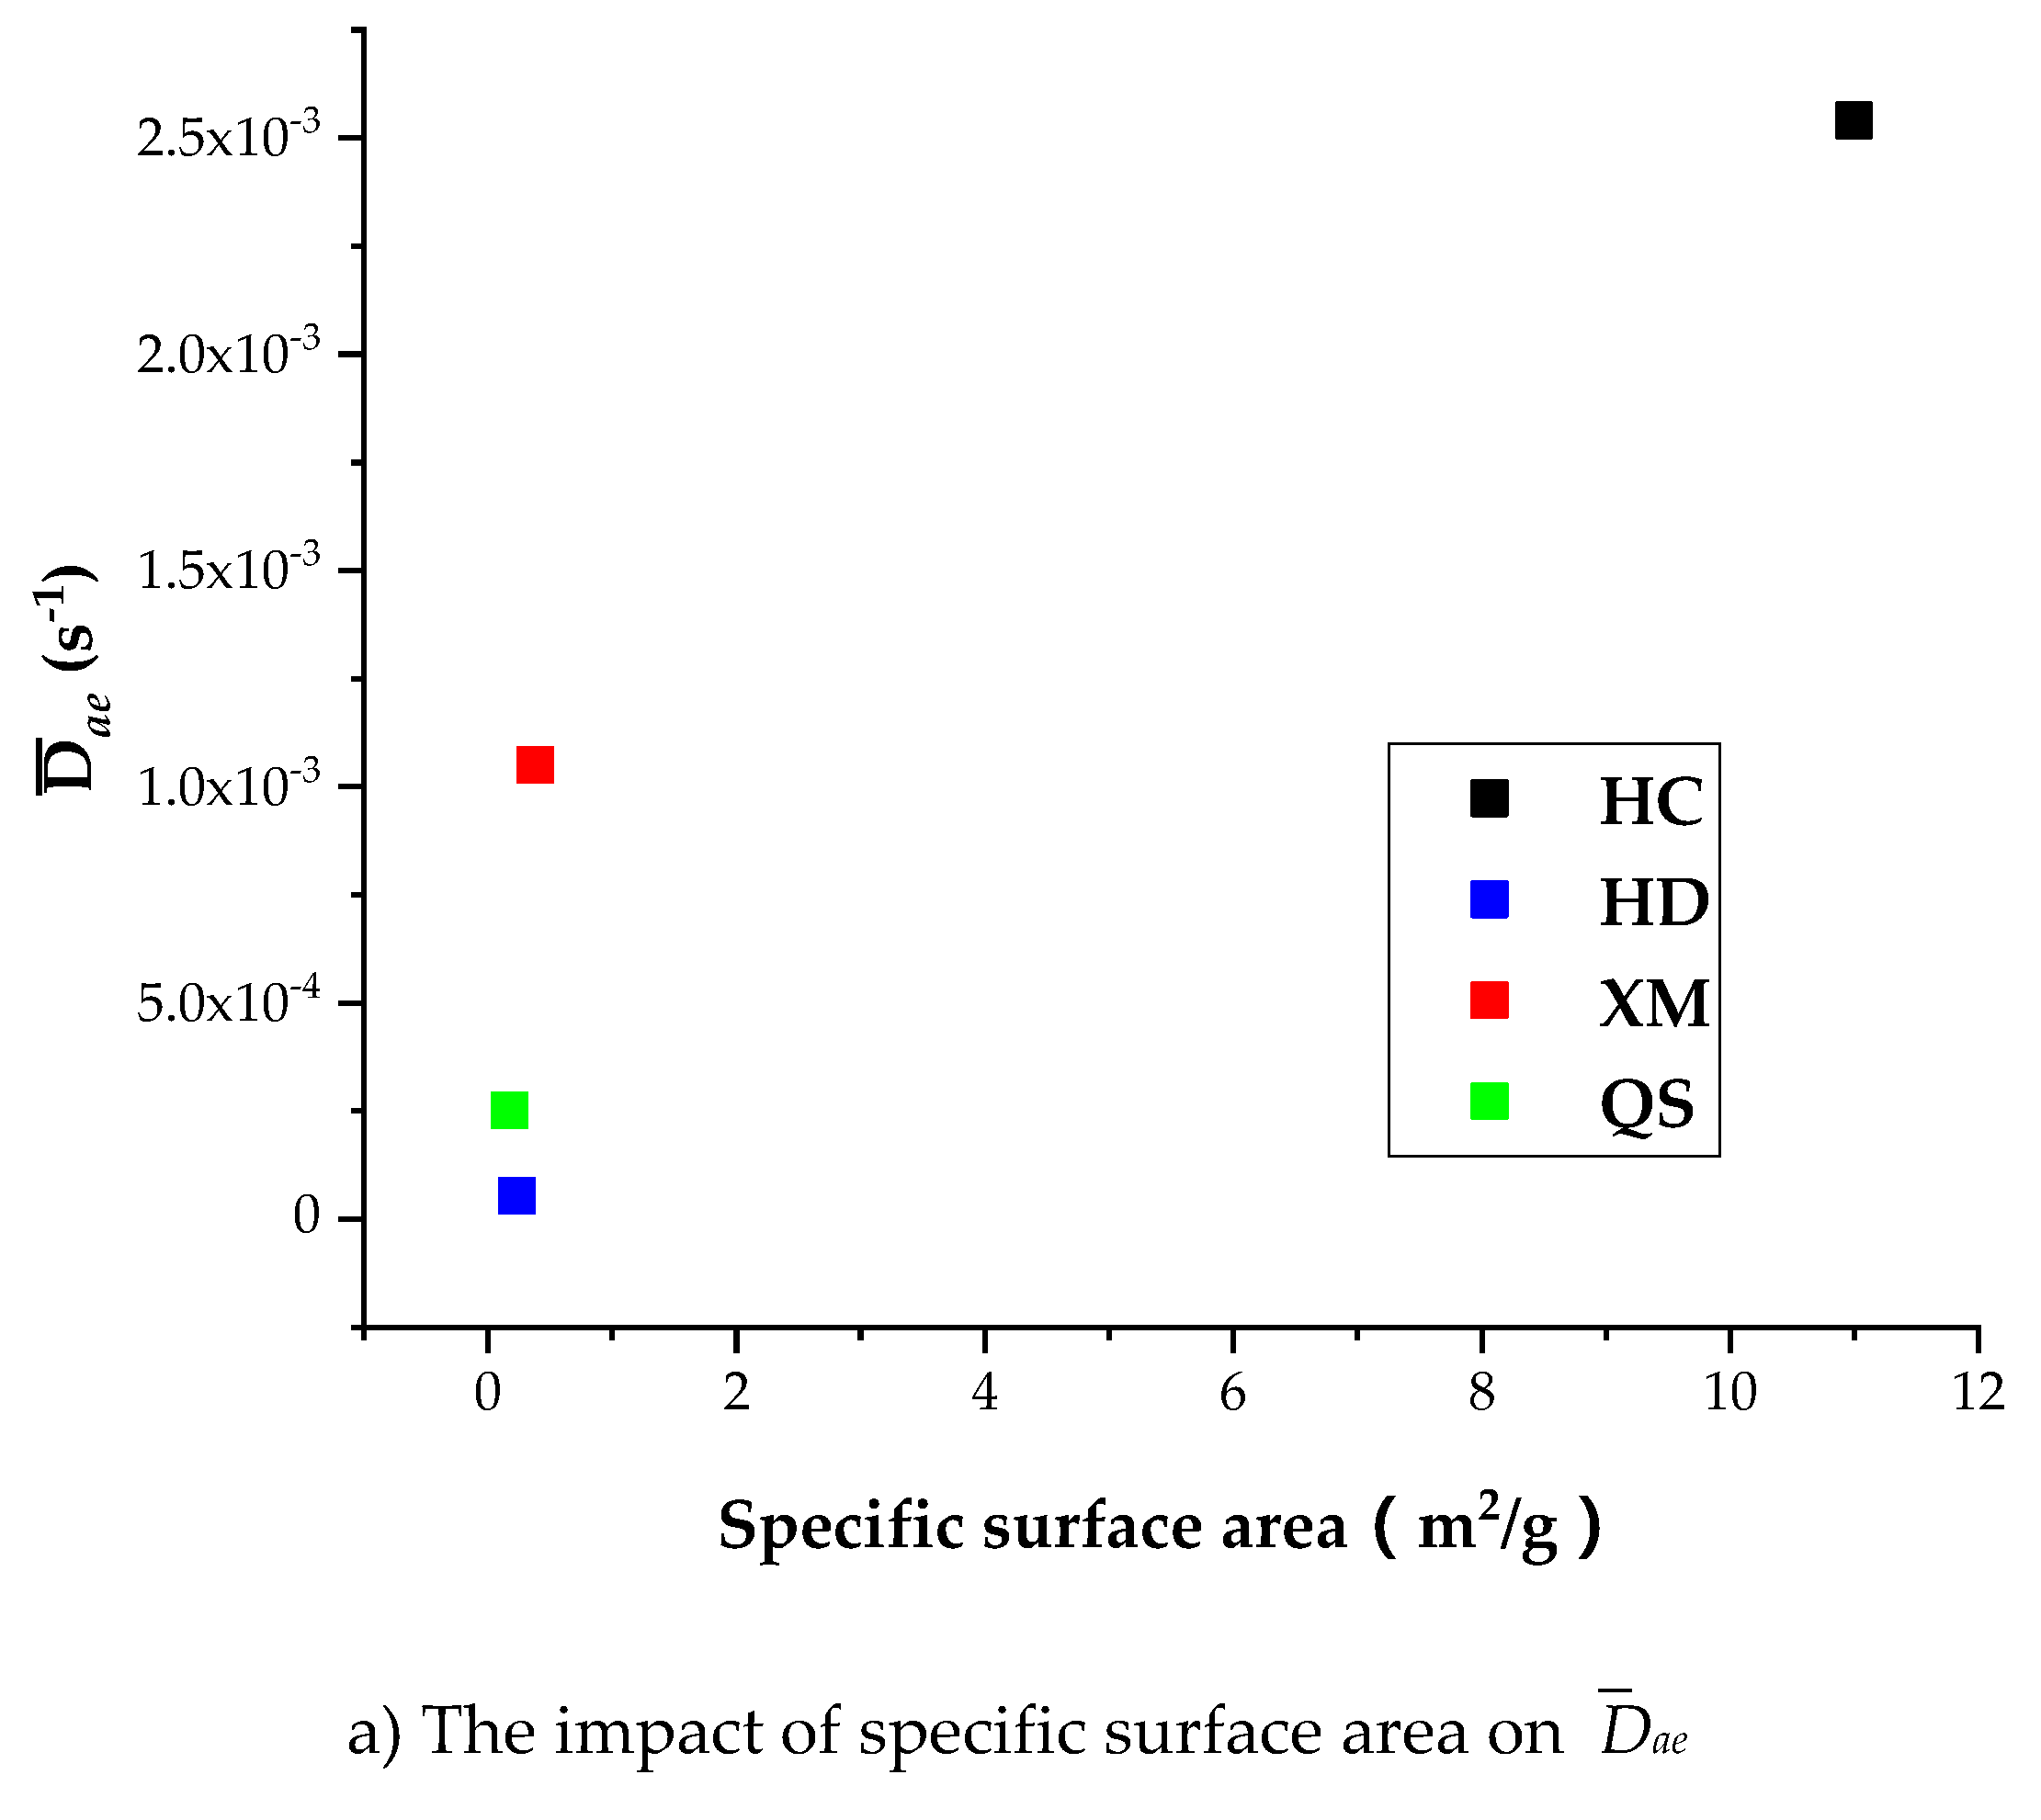
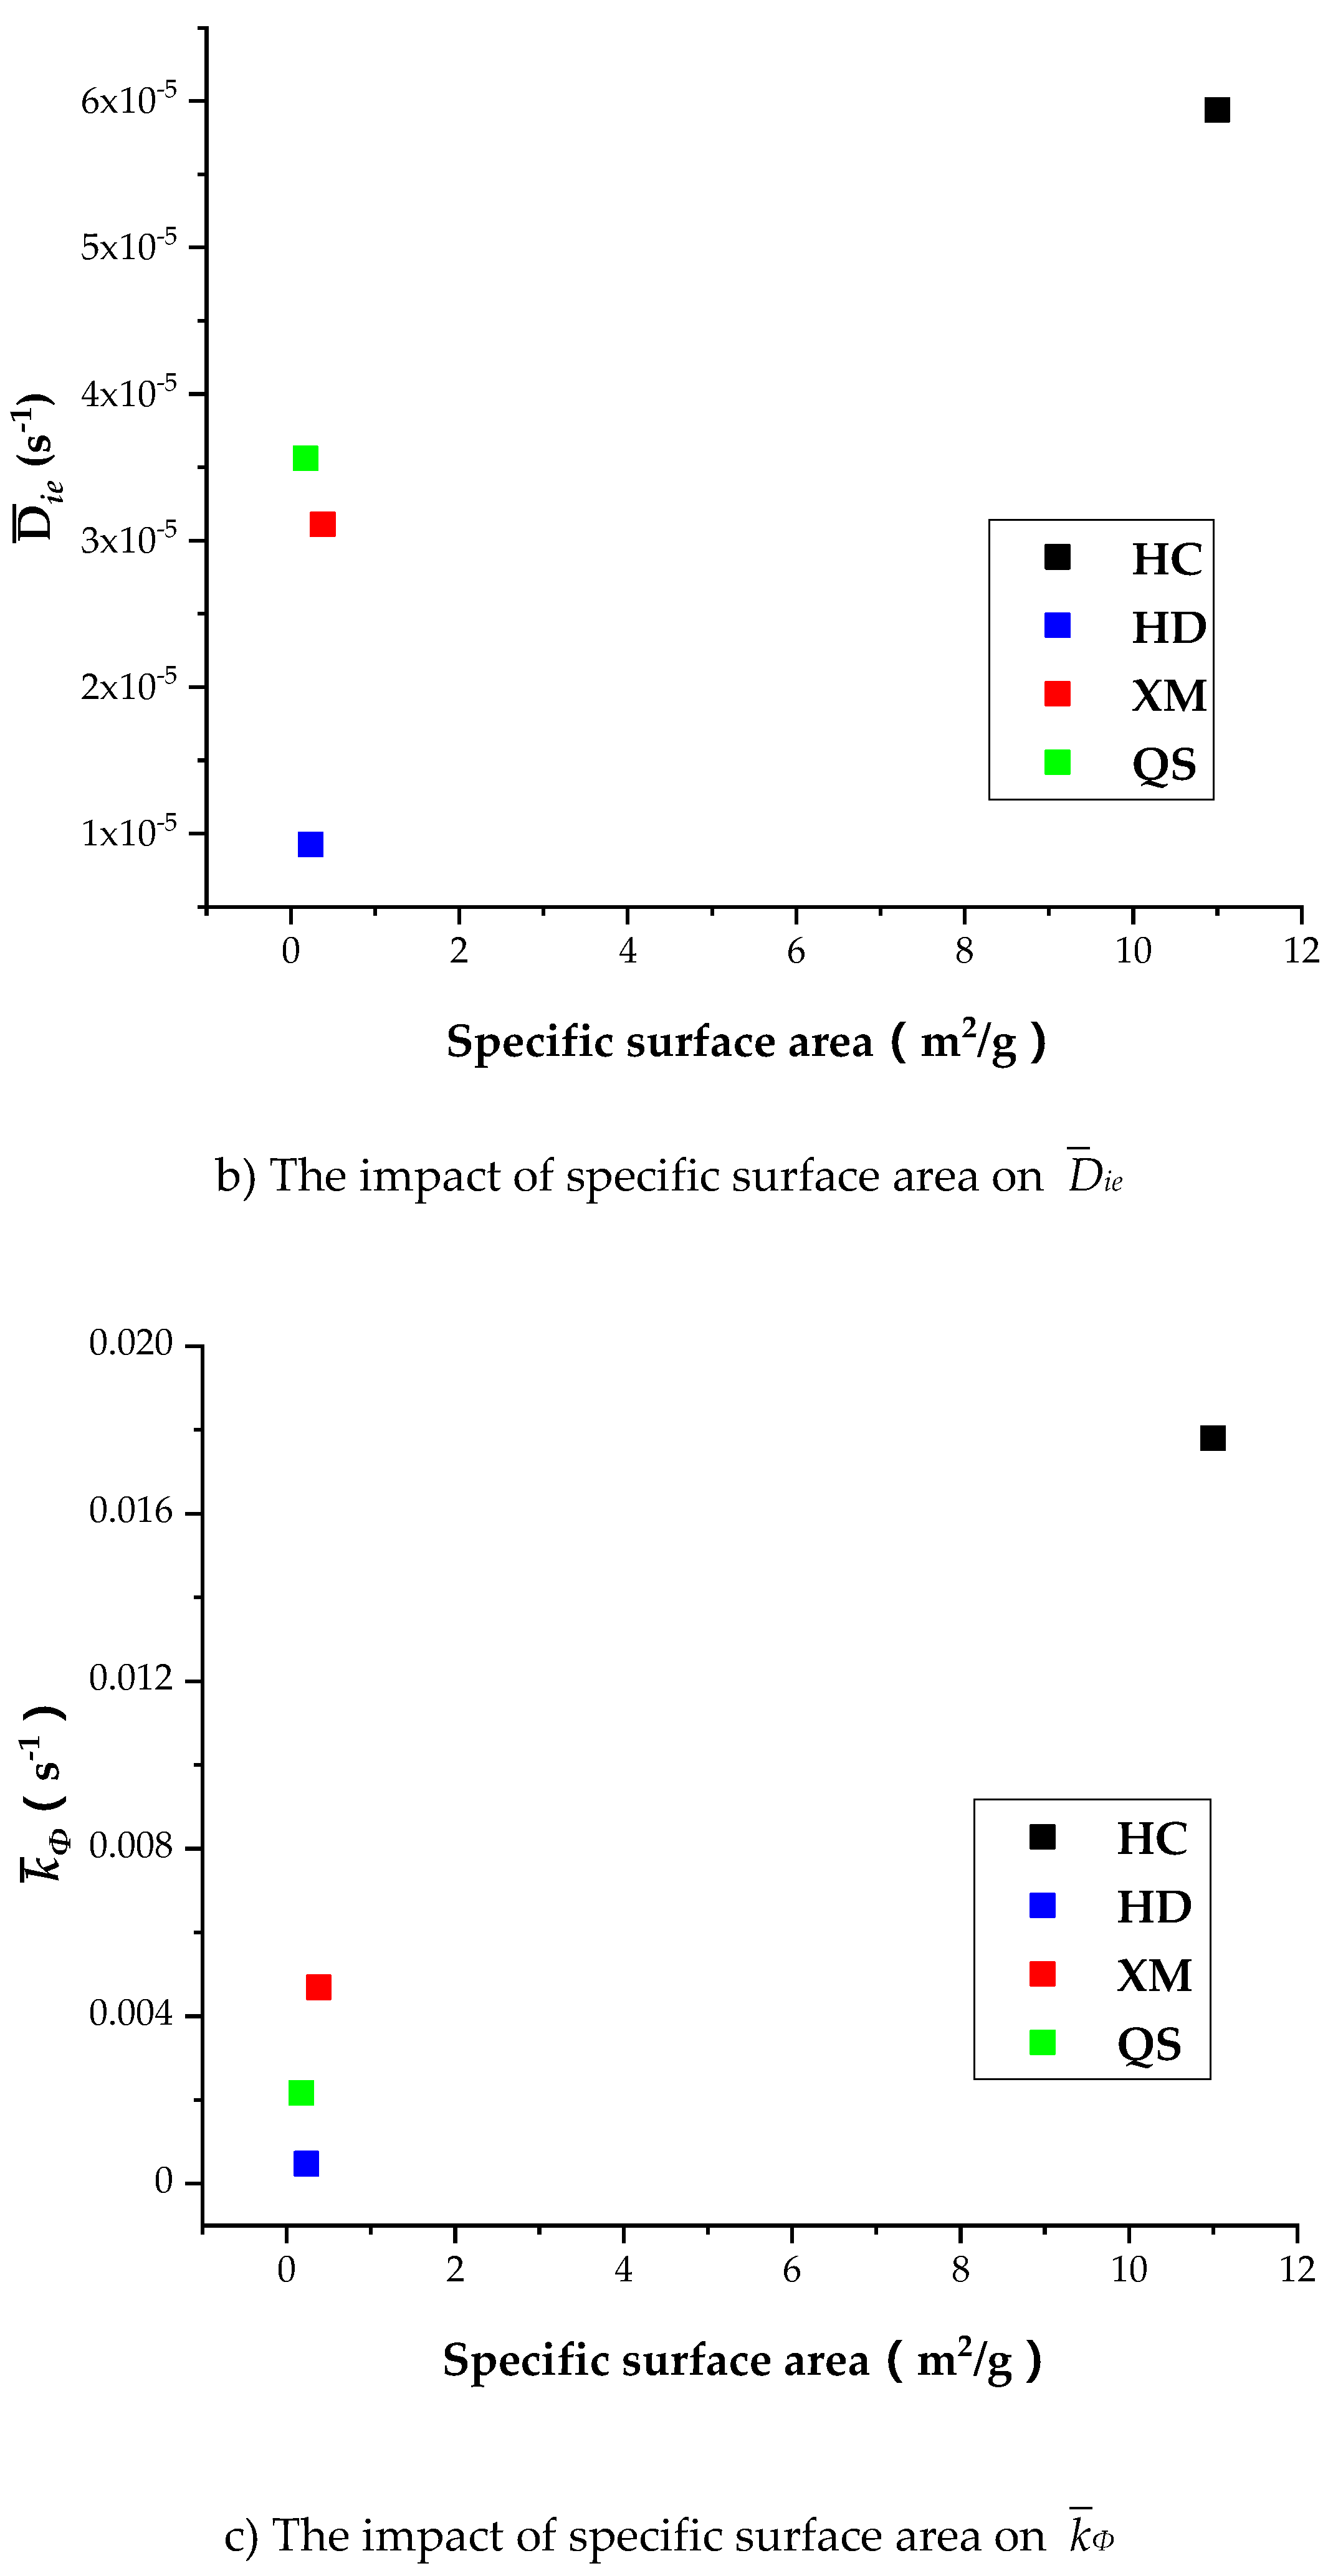
Table 8 shows that the specific surface area is larger in HC relatively to other coal samples, indicating that the porosity in HC is well developed than other coal samples. It is shown in
Table 7 that
Dae,
Die and
kΦ of CH
4 is the largest in HC, suggesting the porosity development level is correlated with the diffusion rate. However,
Figure 13a shows that
Dae of HD, QS and XM significantly increases when
Dae is smaller than 1.6 × 10
−11 while the specific surface area keeps unchanged.
Figure 13b,c show that the impact of specific surface area on
Die and
kΦ is small in all coal samples excluding HC. It is worth to mention that our experimental results can only be considered as reference due to the small number of coal samples. The impact of coal structure on the diffusion parameters requires further study. In conclusion, the fluctuation of diffusion coefficients with respect to the gas pressure is correlated to the variation of pore characteristics, but the reason is still mysterious due to lack of evidence.
4.4. Discussion on the Influence of Inconstant Diffusion Coefficients on CBM Recovery
Previous studies have demonstrated that the BD diffusion cannot be overlooked and replaced by UD diffusion if diffusion is a constraint of gas production, especially for the coal seam with relatively large cleat spacing [
24]. In this study, we found the BD and DD models are more accurate in describing the diffusion process, while pressure has apparent influence on the diffusion coefficients. From this point of view, the inconstant diffusion coefficients will have impacts on the CBM recovery rate. In terms of BD coefficients, most samples show an increase of fast diffusion coefficient
Dae but a decrease of slow diffusion coefficient
Die during the drop of coal seam pressure. The increase or decrease of diffusion coefficient will certainly accelerate or hinder gas flow, but these two effects might be compromised for the BD model and the ultimate effect depends on the net value of these two effects. For the DD model,
kΦ keeps at a stable level, this phenomenon proves the above speculation as
kΦ can be seen as a combination of
Dae and
Die. However, the stretching parameter α decreases during pressure dropping, which indicates the CBM recovery rate will be reduced due to the change of diffusion coefficient.


