Article

Model for the Patterns of Salt-Spray-Induced Chloride Corrosion in Concretes under Coupling Action of Cyclic Loading and Salt Spray Corrosion

1
State Key Laboratory for Geomechanics & Deep Underground Engineering, China University of Mining and Technology, Xuzhou 221116, China
2
School of Civil Engineering, Xuzhou Institute of Technology, Xuzhou 221008, China
*
Author to whom correspondence should be addressed.
Processes 2019, 7(2), 84; https://doi.org/10.3390/pr7020084
Submission received: 15 December 2018 / Revised: 1 February 2019 / Accepted: 2 February 2019 / Published: 7 February 2019
(This article belongs to the Special Issue Fluid Flow in Fractured Porous Media)

Abstract

:
In this study, the patterns of chloride ion erosion of unsaturated concrete subjected to the coupling action of cyclic loading and salt spray corrosion were experimentally studied, and Fick’s Second Law was used to fit the variation patterns of chloride concentration to obtain the chloride diffusion coefficient. Accordingly, we have established a mathematical model that describes chloride transport in unsaturated concrete and accounts for the effects of gas flow, water migration, convection diffusion, and capillary action. This model is composed of three equations—the gas flow equation, the solution flow equation, and the solute convection–diffusion equation. The COMSOL numerical analysis software was subsequently used to obtain solutions for this model, based on parameters such as porosity and the chloride diffusion coefficient. Subsequently, the saturation, relative permeability, and the chloride ion concentration during the first corrosion cycle were analyzed. The numerical results were consistent with the experimental values and were therefore superior to the values obtained using Fick’s Second Law.

1. Introduction

Concrete structures in tidal zones (or splash zones) are prone to damage owing to various physical, chemical, and biological factors [1,2,3,4]. One of the main causes of damage in reinforced concrete structures is chloride intrusion, which usually leads to steel-bar corrosion and concrete cracks [5,6]. There have been many studies on the pattern and mechanism of chloride intrusion in tidal zones (or splash zones). Most of these studies have focused on the transport of chloride in unsaturated concrete. It is generally accepted that chloride intrusion in a tidal or splash zone primarily occurs via capillary adsorption on the concrete surface and diffusion within the concrete [7,8,9]. Based on Fick’s Second Law, Jin et al. studied the effects of water on chloride intrusion and established a convection–diffusion model for chlorides in unsaturated concrete [7]. Pan et al. established a convection–diffusion equation for chlorides and obtained solutions for this equation, based on the theoretical understanding that the transport processes of chlorides in unsaturated concrete are jointly determined by diffusion and convection effects [10]. Using dual-porosity models, Yan et al. established equations that describe the transport of chlorides in concrete and the fractures owing to the coupling of concentration gradients and pore-fluid saturation gradients [11]. Li et al. proposed a model for chloride transport based on water transport mechanisms on concrete surfaces that are alternatingly wet and dry, and they experimentally validated this model [12,13]. Polder studied chloride transport patterns (in wet–dry cycles) in unsaturated concrete using an electrochemically accelerated experimental approach [14]. Several scholars have also constructed water–chloride transport models based on the effects of water migration in concrete pores [15,16,17,18]. For example, Zanden et al. adopted the diffusion coefficient to describe the water transport processes in concrete, and they established the transport equations for water and chlorides in concrete samples subjected to wet–dry cycles using the convection–diffusion model [19].
Currently, most studies on the patterns of chloride transport in unsaturated concrete are based on Fick’s Second Law; these studies comprehensively account for the effects of capillary action, convection–diffusion, and water migration [20,21,22]. However, the transmission of chlorides in unsaturated concrete is an extremely complex process and is influenced by a variety of factors. In actual systems, gas flow is also an important factor for the transport of chlorides. Therefore, the objective of this study was to establish a chloride transport model that accounts for the effects of gas flow, water migration, capillary action, and convection–diffusion. The COMSOL numerical analysis program was used to obtain solutions for this model. The results were compared with experimental data to validate the model.

2. Experimental Research on Chloride Transport in Concrete

2.1. Materials

The cementitious materials used in the experiment were Portland cement, mineral powder (G), and fly ash (F) that were supplied by two local companies. The fine aggregate was river sand with a fineness modulus of 2.8 and an apparent density of 2769 kg/m3. The coarse aggregate was crushed limestone with a size of 5–20 mm and an apparent density of 2719 kg/m3. The slushing agent for the concrete was carboxylic acid provided by Wulong, and the mix proportion of the concrete is summarized in Table 1.
The specimens were kept in molds for about 24 h at room temperature (20 ± 5 °C) after casting. Then, they were remolded and placed in a standard curing room of a controlled temperature (20 ± 2 °C) and a relative humidity of more than 95% for 28 days before they were tested.

2.2. Test Methods

The dimensions of the concrete samples were 100 × 100 × 400 mm. The serial numbers and quantity of the samples are shown in Table 2, whereas Figure 1 shows the flowchart of the tests. The experimental procedures are described below:
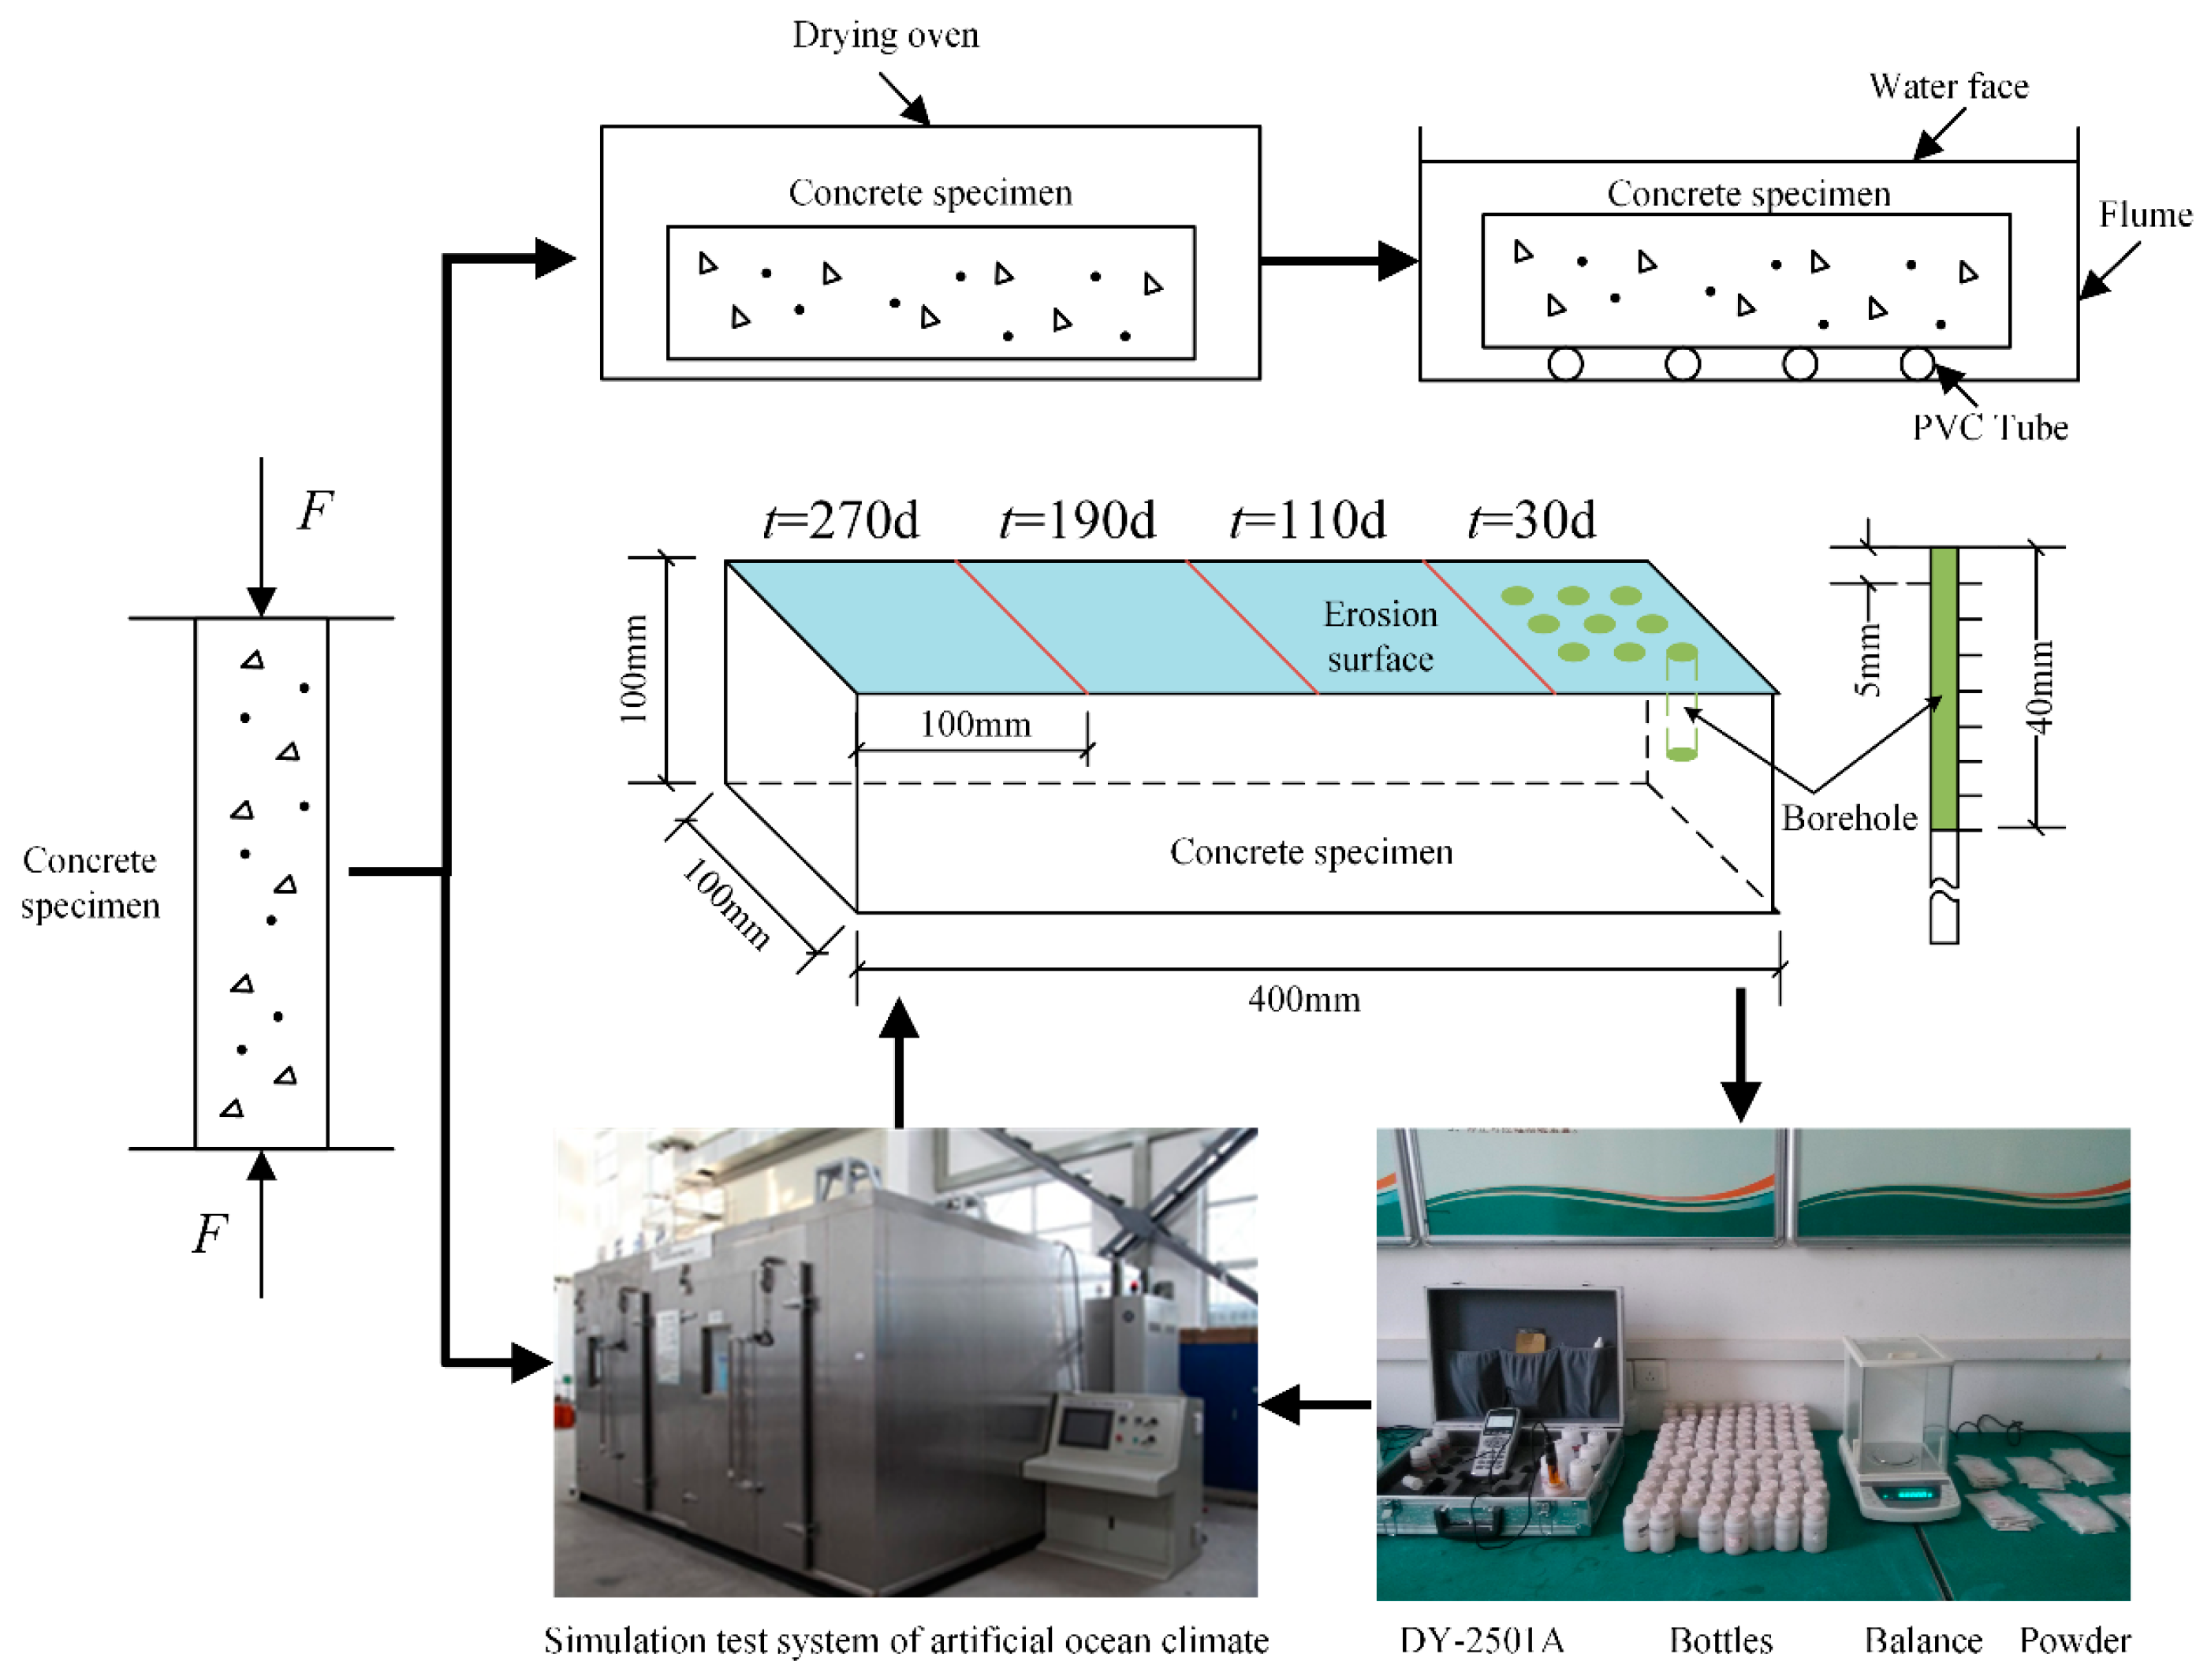
  • Uniaxial compression tests were performed on the concrete samples that had been cured for 28 days to measure their strength ( σ c ).
  • Three cyclic loading protocols (i.e., 50%, 65%, and 80% σ c ) were used to obtain concrete samples with three different porosities and were numbered as #1, #2, and #3, respectively. The detailed experimental steps of applying the cyclic loads are as follows: firstly, each specimen was loaded at the loading rate of 5 kN/s using force control, until the load reached the specified load setting value (here, the set value was 50%, 65%, or 80% of the compressive strength limit (c)), and then the load was maintained for 120 s. After that, each specimen was unloaded at the unloading rate of 5 kN/s, until the load value was 0 kN, and then the completely unloaded state was maintained for 120 s. This procedure was repeated for 5 cycles in total, according to the above loading and unloading operations. Finally, the sample was completely unloaded (load was 0 kN).
  • After cyclic loading, the samples with different porosities were placed in a drying oven and dried at 40 °C for 48 h. Subsequently, the samples were weighed, and the initial weights were recorded. Subsequently, the samples were soaked in water for 48 h. The weights of the samples at saturation were measured, and their porosities were calculated (Table 3).
  • One of the 100 × 400 mm surfaces of the samples was used as the corrosion surface, whereas the other sides were sealed using epoxy resins. Subsequently, the concrete samples were placed in an artificial marine climate simulation laboratory for salt spray corrosion tests. The relative humidity was 75–80%, and the duration of the salt spray was 12 h, after which the samples were dried for another 12 h—this cycle was continuously repeated for the duration of the test. The concentration of the NaCl solution used in this test was 5%.
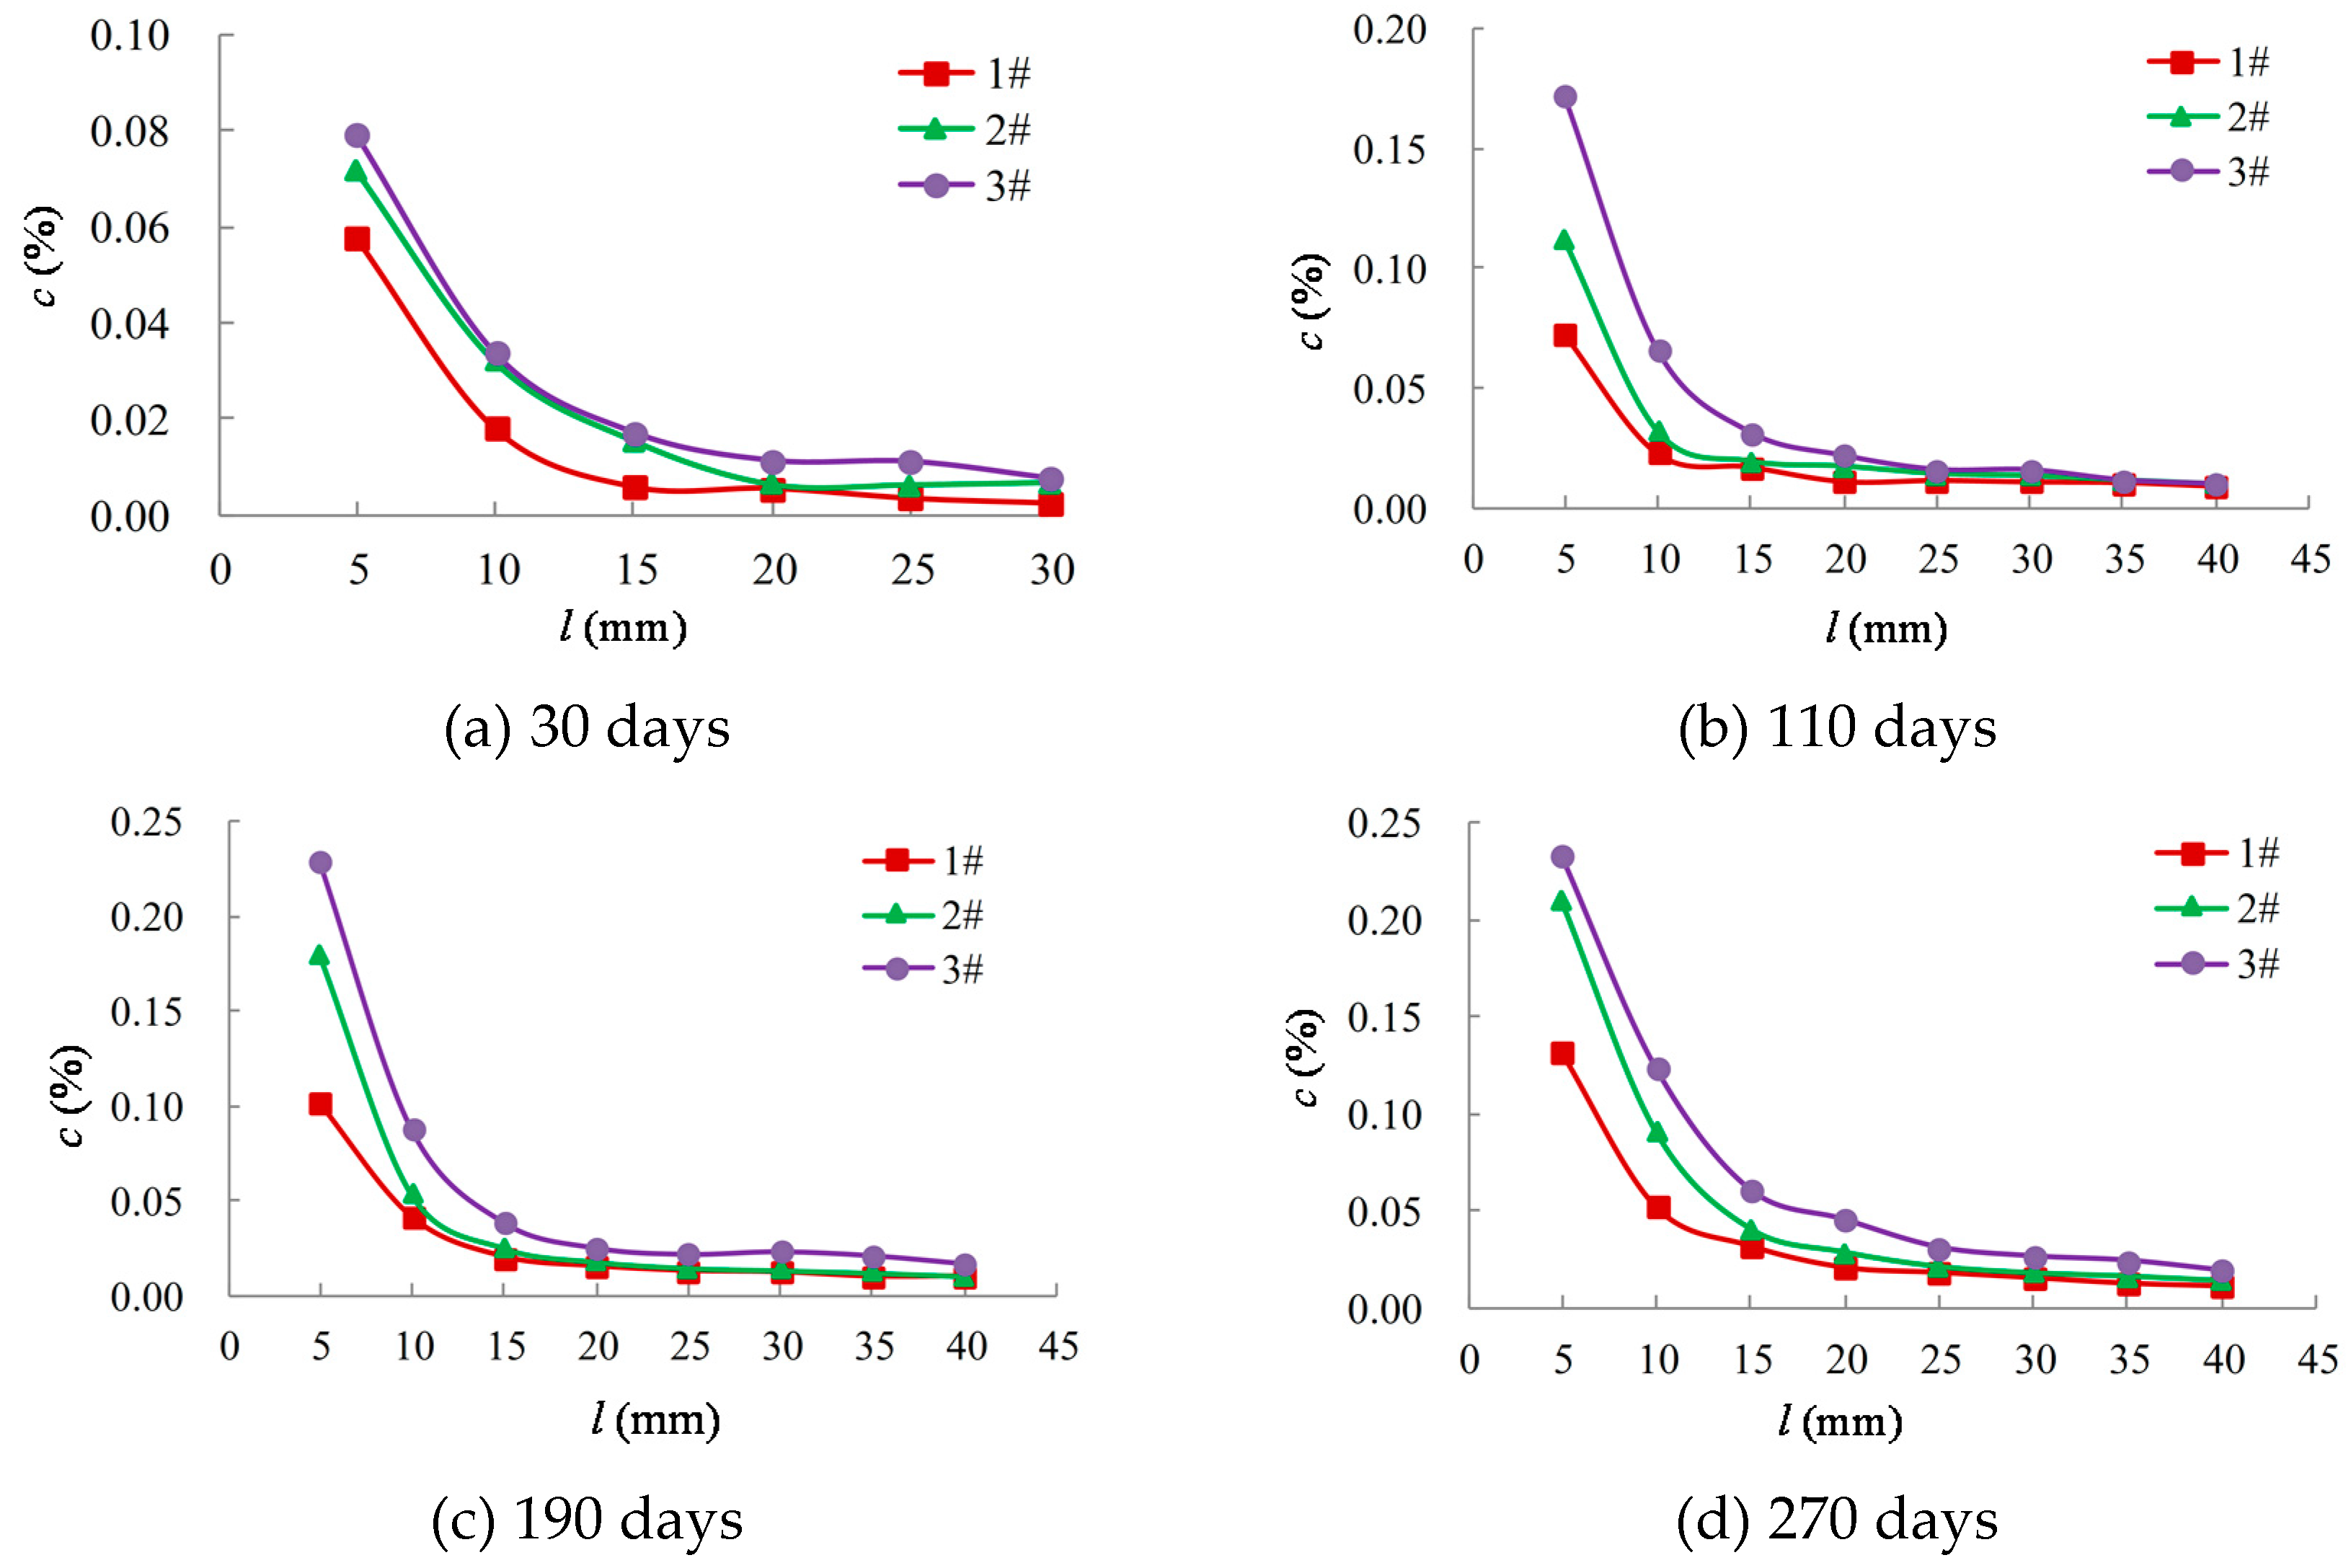
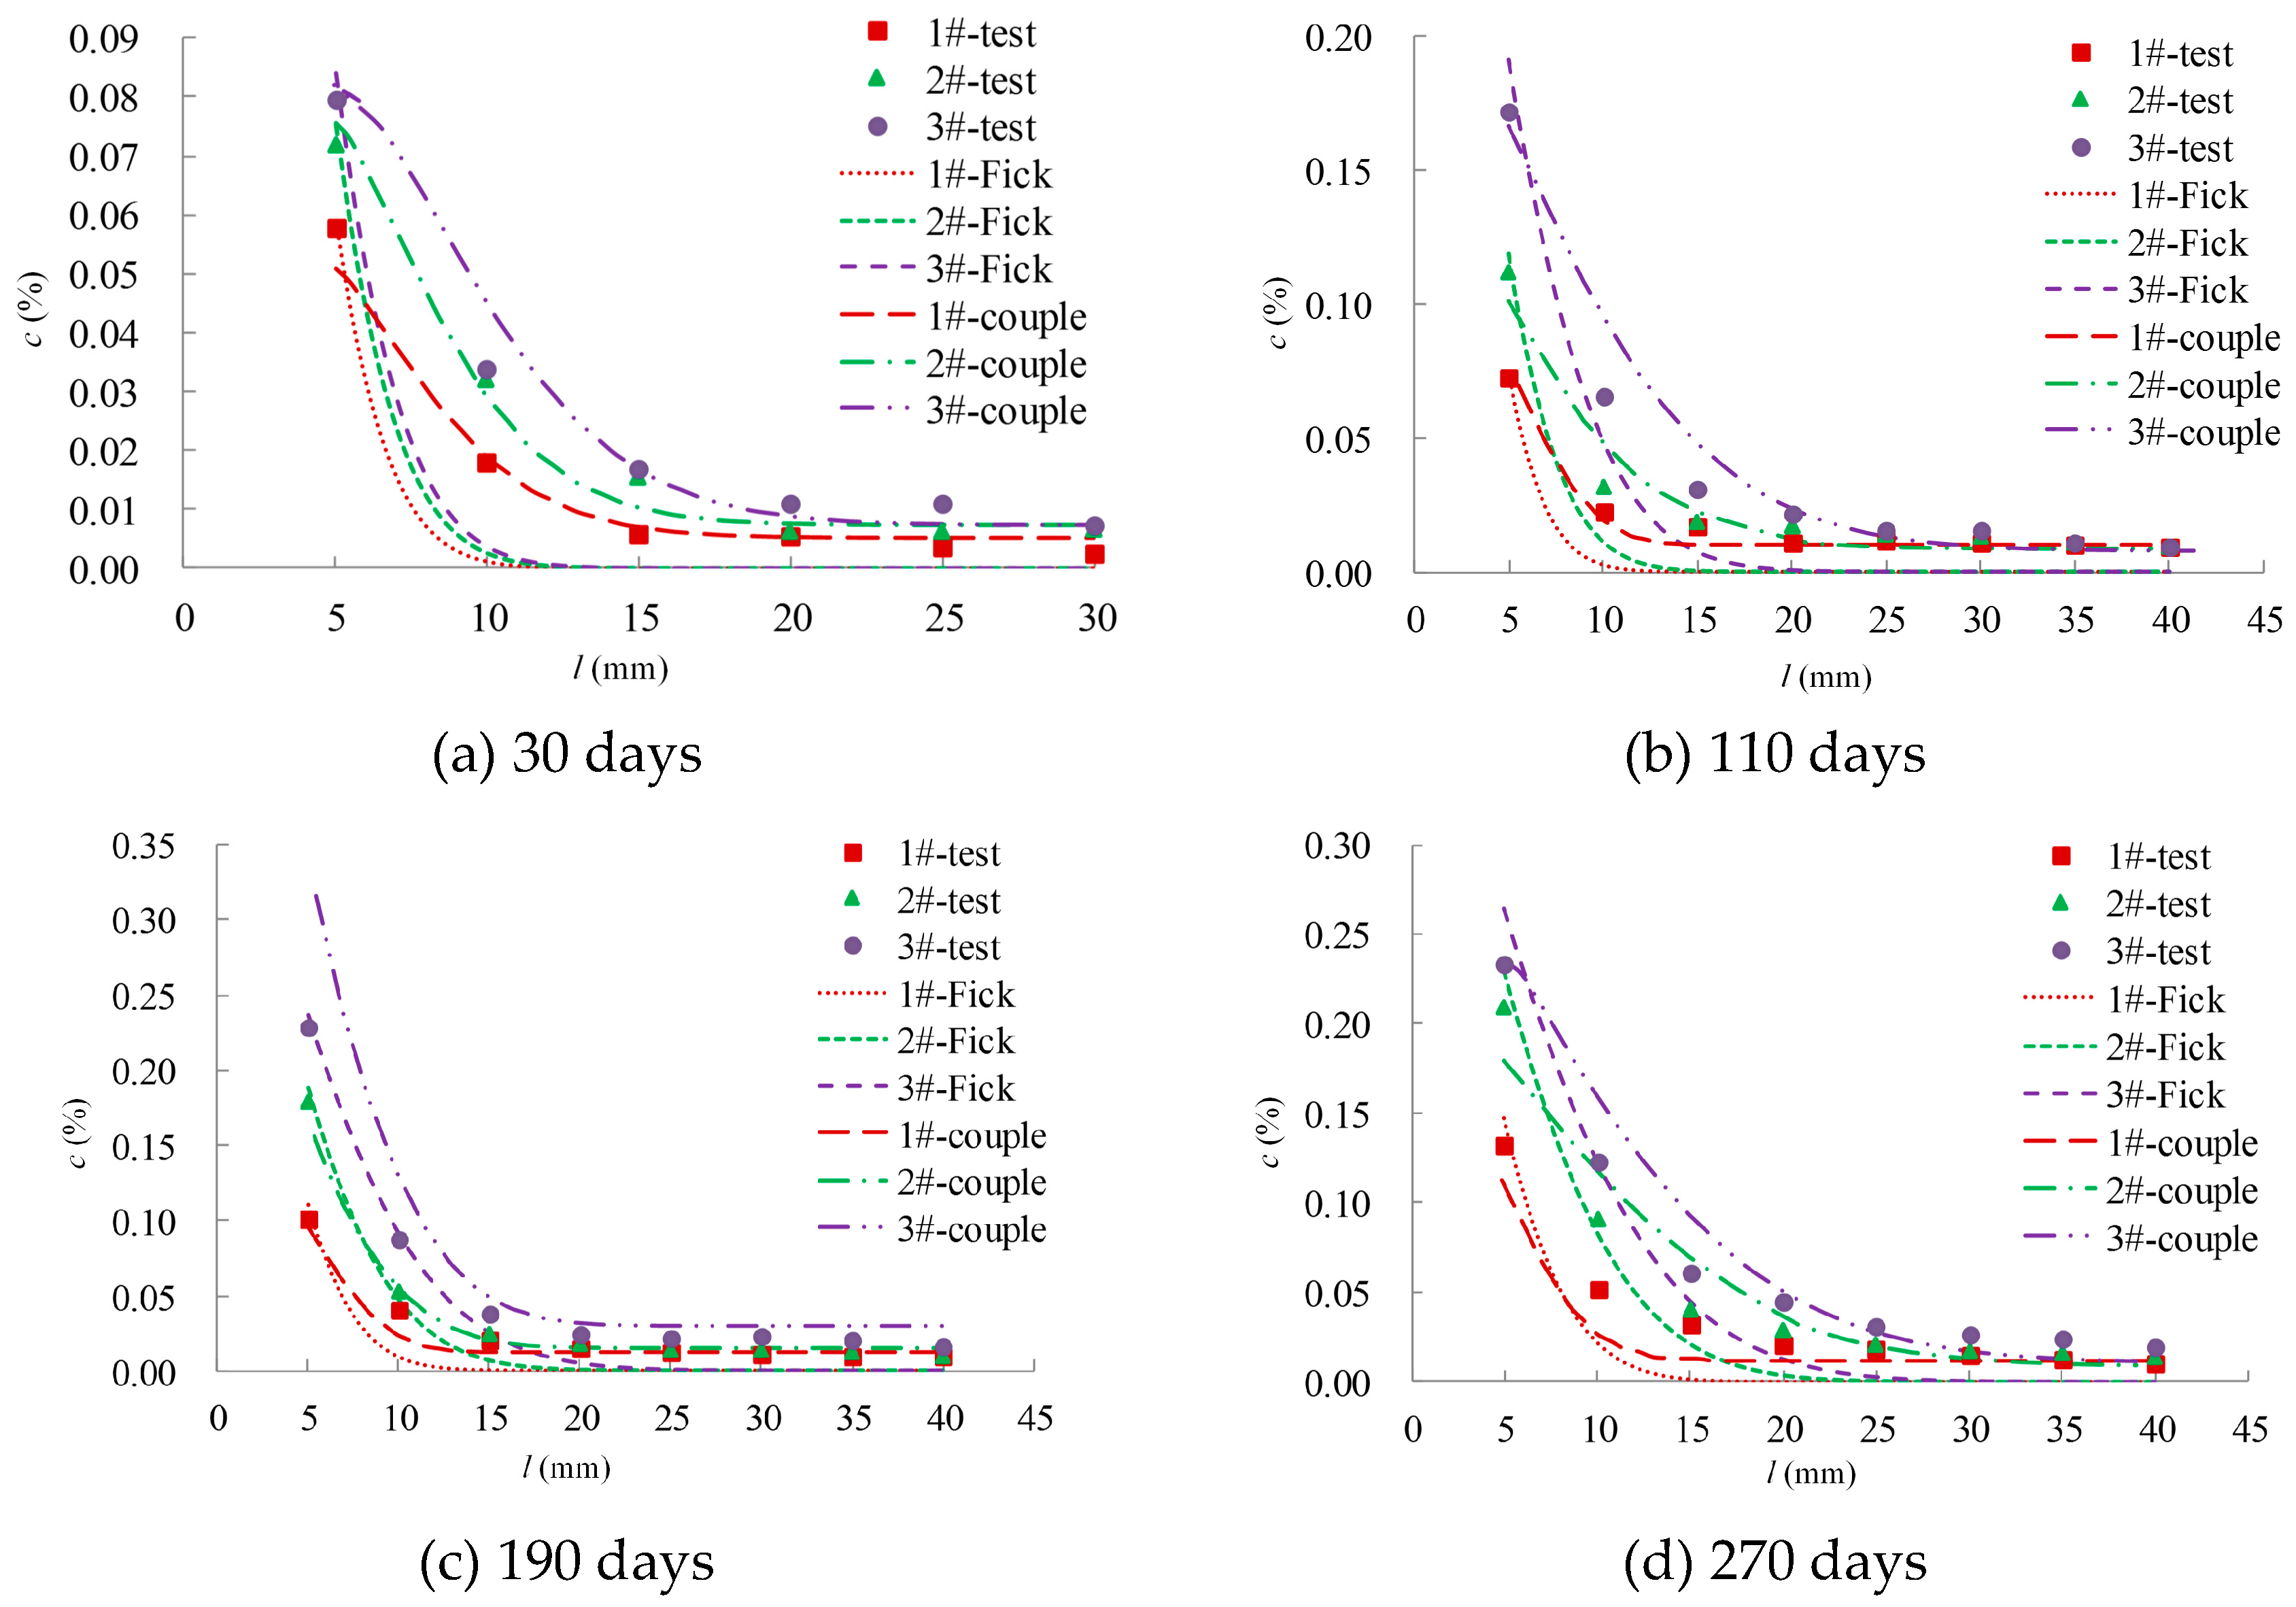
  • When the corrosion time reached 30, 110, 190, and 270 days, concrete powders were obtained from the samples at depths of 5, 10, 15, 20, 25, 30, 35, and 40 mm, which were sealed in plastic bags. Subsequently, 4 g of the concrete powder was mixed with 40 g of distilled water in a reagent bottle. The bottle was shaken for 30 min in a solution shaker before being allowed to settle for 24 h.
  • The concentration of the chloride ions was measured using a DY-2501A Chloride Meter.
  • After testing, the holes in the concrete samples were filled with silicon sealant, and the samples were returned to the laboratory for further corrosion until the subsequent time point, and subsequently, step (6) was repeated. This was continued until the end of the experiment.

2.3. Results and Discussion

Figure 2 shows the variational curve of c against l in the concrete samples (c is the concentration of chloride ions in the concrete samples, and l is the depth from the specimen surface). Figure 2a–d correspond to the time points at 30, 110, 190, and 270 days, respectively. It was observed that c decreased with an increase in l. When l < 15 mm, c decreased rapidly, with an average decrease of 80.80%; when l > 15 mm, c decreased slowly, and the average decrease was only 39.10%. As stated previously, cyclic salt sprays were used as the mechanism of corrosion in this study. The intrusion of chloride ions was mainly driven by capillary actions and concentration gradients. Since the surface of the concrete was the first area that came into contact with the external chlorides, large quantities of chloride accumulated on the surface, resulting in a large chloride concentration gradient. By comparison, fewer chloride ions accumulated deep inside the concrete samples, and, consequently, the chloride ion concentrations were relatively small. It was also observed that, for the same l, c increased with an increase in the porosity; this is because a high porosity increases water and gas permeability, which promotes chloride accumulation.
Fick’s Second Law was used to fit the pattern of chloride corrosion.
Fick’s Second Law is expressed as
C ( l , t ) = C 0 + ( C s C 0 ) ( 1 e r f l 2 D t )
where C0 denotes the initial mass concentration of chloride in an arbitrary section of the concrete, Cs is the mass concentration of chloride ions on the concrete surface at an arbitrary time (t), D denotes the diffusion coefficient of chloride ions, t represents time, l represents the depth, and erf represents the error function.
By re-arranging Equation (1), the diffusion coefficient of chloride ions can be calculated by
D = 1 t { l / 2 e r f [ 1 C ( l , t ) C 0 C s C 0 ] } 2
where Cs is calculated as follows:
c s = ϕ ρ w ω ρ s + ϕ ρ w ω × 35.5 58.5 × 100 %
where ϕ denotes the concrete porosity, ρ w is the density of the NaCl solution, ρ s is the concrete density, and ω is the mass percentage of NaCl in the solution. Further, ϕ assumed the values of the average porosities in Table 3, which were 3.49%, 3.83%, and 4.71%, ρ s was 2420.67 kg/m3, ρ w was 1050 g/m3, and ω was 5%.
The diffusion coefficient of the chlorides when l = 5 mm was calculated using MATLAB with Equation (3) (Table 4). The average value was used in the subsequent numerical calculations.

3. Model for Coupled Water–Gas–Chloride Transport

3.1. Basic Assumption
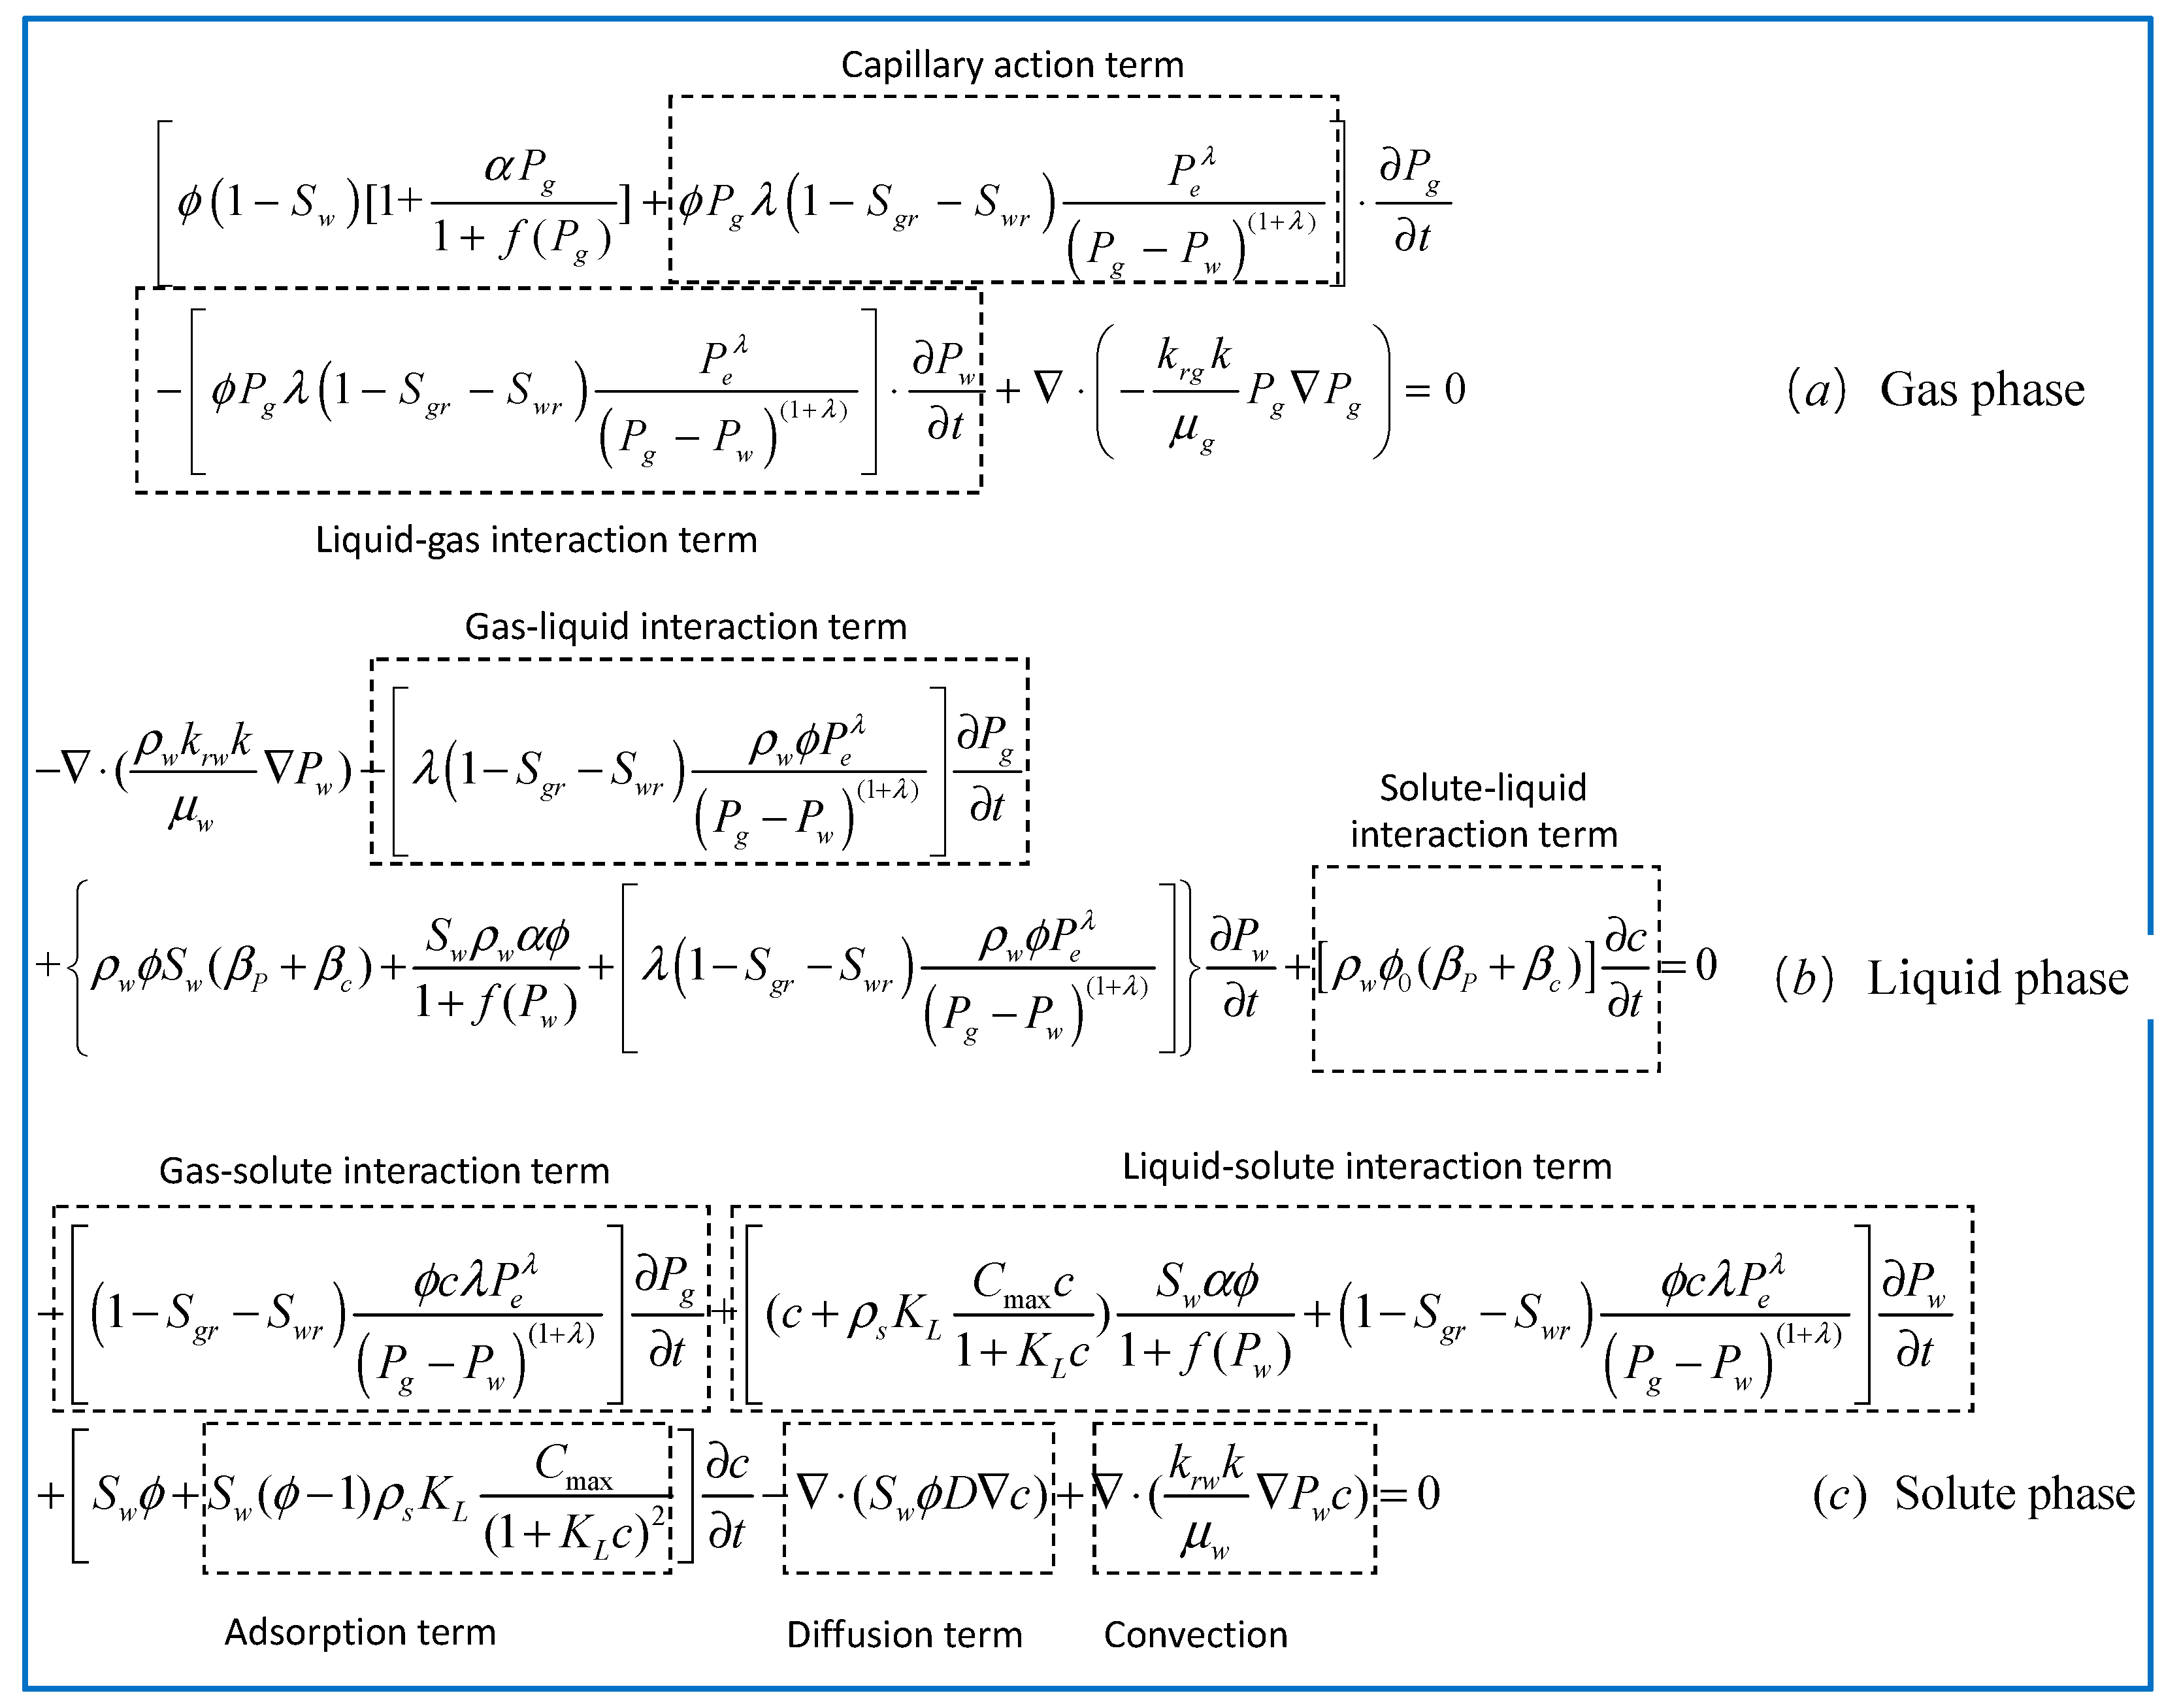
The model for coupled water–gas–chloride transport in unsaturated concrete was established with the following assumptions: (a) concrete is a single porosity medium, (b) the liquids and gases in concrete are ideal liquids and gases, (c) the influence of temperature on parameters such as dynamic viscosity is negligible, (d) only the transmission of a single solute (chloride ions) in concrete is considered, (e) in unsaturated concrete, the liquid phase is the chloride solution, whereas the gas phase is air, (f) there is no exchange of matter between the gas and the liquid phases over the entirety of the process, and (g) it is assumed that the solute (chloride ions) does not evaporate throughout the process, i.e., there is no exchange of matter between the gas phase and the solute [23,24,25,26].
In this paper, the gas–liquid two-phase flow model in a single-porosity medium was deduced first, and then the diffusion and gas–liquid two-phase flow were linked using the mass continuous equation according to the relationship between the saturation and the diffusion model.

3.2. Gas Flow Model

The equation of the continuity of gaseous masses without considering the source term is as follows:
m g t + ( ρ g q g ) = 0
where m g denotes the mass of air, ρ g is the air density, and q g is the Darcy velocity vector.
In the following subsection, explanations are provided for each of the terms in Equation (4).
(1) Expression of the Gaseous Mass
The gaseous mass is expressed as
m g = ρ g ϕ ( 1 S w )
where ϕ denotes the porosity of concrete and S w is the water saturation.
According to the state equation of ideal gases, ρ g = M g R T P g , where M g denotes the molecular mass of the gas, R is the gas constant, and T is the absolute temperature, Equation (5) can be written as
m g = M g R T P g ϕ ( 1 S w )
(2) Equation of Porosity
When subjected to small loads or no load, the deformations in the porous media are mainly driven by pore pressure; hence, pore deformation occurs without significant changes in the particle volume.
In order to facilitate subsequent derivations, α was introduced to represent the pore deformation caused by changes in pore pressure:
α = 1 U w d U w d P
where U w denotes the volume of the pores. Thus, porosity may be expressed by
ϕ = f ( P ) 1 + f ( P )
where f ( P ) = ϕ 0 1 + ϕ 0 e α ( P P 0 ) , ϕ 0 is the initial porosity, and P 0 is the initial pore pressure.
(3) Darcy Velocity Vector of the Gas Phase
Darcy’s law in the gas phase for a unit volume of porous concrete can be expressed as
q g = k g e μ g P g
where k g e is the effective permeability of the gas phase (phase permeability) and μ g is the dynamic viscosity of the gas phase.
(4) Expression for Effective Permeability
The expression for effective permeability is
k g e = k r g k
where k r g is the relative permeability of the gas phase and k is the absolute permeability of the porous concrete.
(5) Expression for Absolute Permeability
Absolute permeability is the permeability when only one fluid (single phase) exists in the pores of the concrete, the fluid does not react with the concrete, and the fluid flows in accordance with the Darcy linear percolation law.
Absolute permeability is an important parameter for characterizing porous media, since it is closely related to the porosity of the medium. In this study, the relationship between the permeability and porosity in porous media, as reported by Chilingar, was defined as [27]
k = d 2 ϕ 3 72 ( 1 ϕ 2 )
where k denotes the permeability of porous media, ϕ is the porosity of porous media, and d is the effective diameter of the particles in porous media. Based on Equation (8), the following equation was obtained:
k = k 0 ( 1 ϕ 0 ) 2 ϕ 0 3 f ( P ) 3 1 f ( P )
(6) Saturation and Relative Permeability
Fluid saturation is defined as the ratio of the volume of a fluid in a pore of an object to the pore volume, expressed as a percentage or fraction.
Based on the theories related to oil reservoir models [15], the relationship between the relative permeability, water pressure, gas pressure, and saturation [28,29] is derived in the following.
The capillary pressure is expressed as
P c = P e ( S w ) 1 λ = P g P w
where P e denotes the constant capillary pressure at the entrance, S w is the saturation of the standard liquid phase, and λ is the pore size distribution index.
The relative permeability is expressed as
k r w = ( S w ) 2 + 3 λ λ
k r g = ( 1 S w ) 2 [ 1 ( S w ) 2 + λ λ ]
The relationship between the standard liquid phase saturation and water–gas saturations is expressed as
S w = S w S w r 1 S g r S w r
S w + S g = 1
where S w r and S g r are relevant constants.
By re-arranging Equation (13), we obtain
S w = ( P e P g P w ) λ
By substituting Equation (18) into Equations (14) and (15), the relationships between the relative permeability, water pressure, and gas pressure are derived as
k r w = ( P e P g P w ) 2 + 3 λ
k r g = [ 1 ( P e P g P w ) λ ] 2 [ 1 ( P e P g P w ) 2 + λ ]
The relationship between saturation, water pressure, and gas pressure can be obtained by rearranging Equation (16):
S w = ( 1 S g r S w r ) ( P e P g P w ) λ + S w r
(7) Flow Model for the Gaseous Phase
By substituting Equations (6), (8), (9), and (19)–(21) into Equation (4), the flow model for the gaseous phase can be obtained as
[ ϕ ( 1 S w ) [ 1 + α P g 1 + f ( P g ) ] + ϕ P g λ ( 1 S g r S w r ) P e λ ( P g P w ) ( 1 + λ ) ] P g t [ ϕ P g λ ( 1 S g r S w r ) P e λ ( P g P w ) ( 1 + λ ) ] P w t + ( k r g k μ g P g P g ) = 0

3.3. Flow Model for the Liquid Phase

(1) Continuity Equation of Liquid Masses
The continuity equation of liquid masses is expressed as
m w t + ( ρ w q w ) = 0
where m w denotes the mass of the solution in a unit volume of porous concrete, ρ w is the density of the solution, and q w refers to the Darcy velocity vector of the solution.
(2) Mass of the Liquid Phase
The mass of the liquid phase is expressed as
m w = ρ w ϕ S w
where ρ w is the density of the solution, ϕ is the porosity, and S w is the saturation of the solution.
During chloride transport in concrete, the pore pressure and the solution concentration change, which leads to changes in the solution density. Therefore, ρ w is a function of P and c:
ρ w = ρ w ( P , c )
In order to characterize the variation of density with the pore pressure and the solution concentration, we introduced a compressible pressure coefficient, β p , and a compressible concentration coefficient, β c :
β P = 1 ρ w d ρ w d P β c = 1 ρ w d ρ w d c
where β p denotes the ratio between the change in density caused by the unit pressure changes and the initial density, whereas β c denotes the ratio between the density changes caused by the changes in the unit concentration and the initial density.
Subsequently, the relationship between the variations in solution density with the pore pressure and the solution concentration can be obtained as follows:
ρ w = ρ w 0 e [ β P ( P P 0 ) + β c ( c c 0 ) ]
where ρ w 0 denotes the initial solution density, P 0 is the initial pore pressure, and c 0 is the initial concentration of the chloride ions.
(3) Darcy Velocity Vector of the Liquid Phase
Darcy’s law for the liquid phase in a unit volume of porous concrete can be expressed as
q w = k w e μ w P w
where k w e denotes the effective permeability of the liquid phase (phase permeability) and μ w is the dynamic viscosity of the liquid phase.
The effective permeability can be expressed as
k w e = k r w k
where k r w denotes the relative permeability of the liquid phase and k is the absolute permeability of the porous concrete media. Therefore, we obtain
q w = k r w k μ w P w
(4) Flow Model for the Liquid Phase
The flow model of the liquid phase is
( ρ w k r w k μ w P w ) [ λ ( 1 S g r S w r ) ρ w ϕ P e λ ( P g P w ) ( 1 + λ ) ] P g t + { ρ w ϕ S w ( β P + β c ) + S w ρ w α ϕ 1 + f ( P w ) + [ λ ( 1 S g r S w r ) ρ w ϕ P e λ ( P g P w ) ( 1 + λ ) ] } P w t + [ ρ w ϕ 0 ( β P + β c ) ] c t

3.4. Convection–Diffusion Models for Chlorides

The transport of chlorides in concrete is a complex process, and it may be treated as the transport of solutes (chlorides) in solution. Solute transport in porous media is influenced by various factors, such as convection, molecular diffusion, mechanical dispersion, precipitation–dissolution combined effects, and chemical adsorption. In this study, only convection, mechanical dispersion, and chemical adsorption were considered in the convection–diffusion model for chlorides in unsaturated concrete.
When the concrete pores are filled with the solution, the pore water inside the concrete does not migrate as a whole. Under the condition that the chloride ion and the hydration product of the concrete do not react chemically, the process of chloride ions migrating from the outside of the concrete to the interior of the concrete, depending on the concentration gradient difference inside and outside of the concrete, can be considered as a pure diffusion process. Convection refers to the phenomenon of the whole substance migrating with a carrier solution. The main cause of the convection of chloride ions in concrete is the directional seepage of the pore liquid under pressure, capillary adsorption, and electric field forces [30].
Accordingly, S w was introduced into the continuity equation for the mass of chlorides in saturated concrete, from which the continuity equation for chloride masses in unsaturated porous media was obtained as follows:
( m c ) t ( S w ϕ D c ) + ( v c ) = 0
where the mass of chloride ions in the solution is expressed as m c = S w ϕ c ( 1 ϕ ) ρ s K L C max c 1 + K L c and v w is the Darcy velocity vector of the solution.
By substituting the relevant equations into Equation (32), the convection–dispersion model for chlorides in unsaturated concrete was obtained as follows:
[ ( 1 S g r S w r ) ϕ c λ P e λ ( P g P w ) ( 1 + λ ) ] P g t + [ ( c + ρ s K L C max c 1 + K L c ) S w α ϕ 1 + f ( P w ) + ( 1 S g r S w r ) ϕ c λ P e λ ( P g P w ) ( 1 + λ ) ] P w t + [ S w ϕ + S w ( ϕ 1 ) ρ s K L C max ( 1 + K L c ) 2 ] c t ( S w ϕ D c ) + ( k r w k μ w P w c ) = 0

3.5. Model for Coupled Water–Gas–Chloride Transport

The model for coupled water–gas–chloride transport in unsaturated concrete consists of three parts: the flow model for the gaseous phase, the flow model for the liquid phase, and the convection–diffusion model for chloride ions, as shown in Figure 3a–c. This model accounts for the effects of convection, diffusion, chemical adsorption, and capillary action and reflects on the coupling effects between gas–liquid flows and solute transport in unsaturated porous media. The “gas phase term” represents the influence of the gas phase on the solute.

4. Model Calculations and Validation

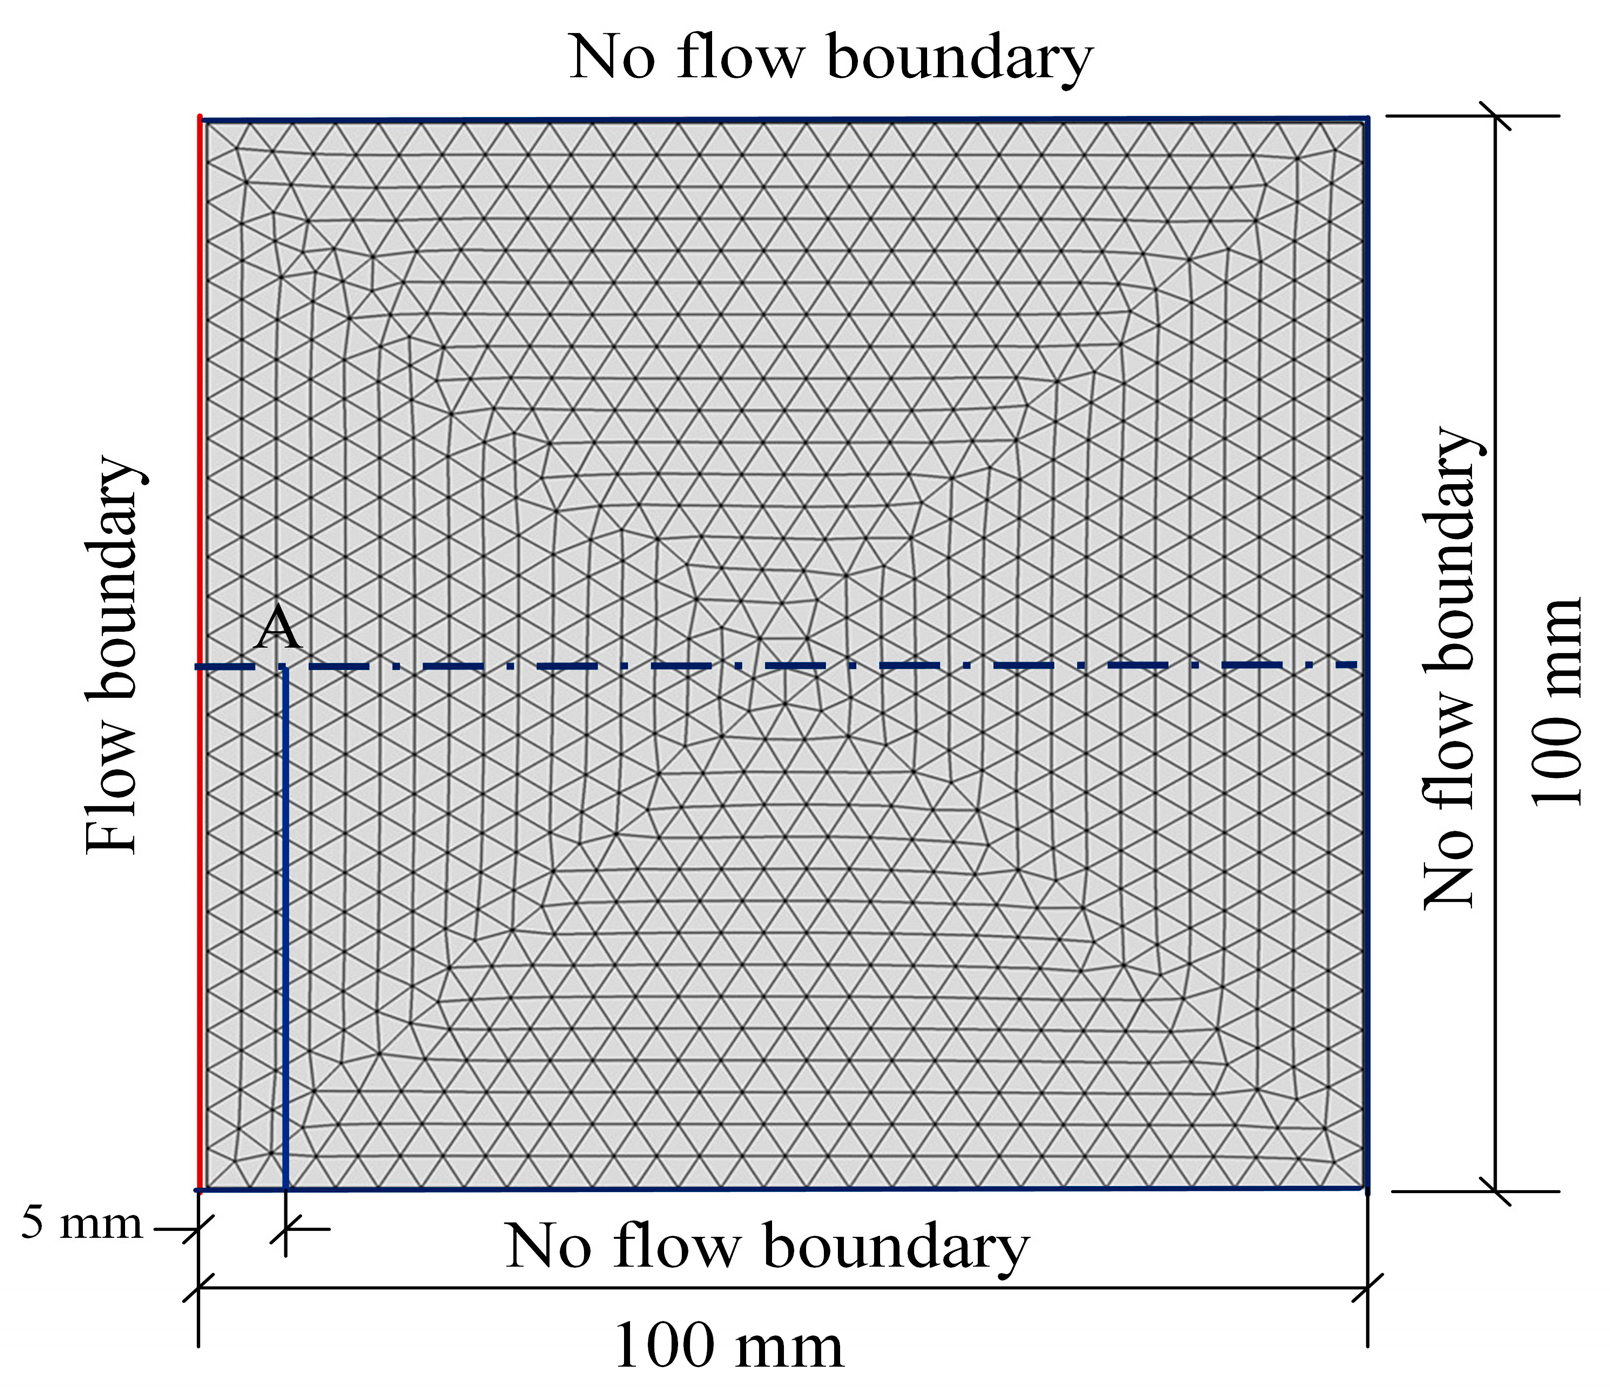
4.1. Calculation Scheme

(1) Numerical model
The geometrical dimensions of the numerical model were 100 × 100 mm. The left boundary was subjected to chloride corrosion, whereas the remaining boundaries were non-seepage boundaries. Point A was slightly above the central line and was 5 mm from the left boundary, as shown in Figure 4.
(2) Configuration of boundary conditions
According to the fluctuation of the sea level in the tidal zone during 24 h, the variation of the chloride concentrations in the left boundary during a single cycle (24 h) was described using Equation (34), as shown in Figure 5a. The variation of the pressure was described using Equation (35), as shown in Figure 5b.
In Equation (34), n = 0, 1, 2, 3, …, t represents the time (s), and c (t) denotes the concentration of chloride ions (mol/m3):
c ( t ) = { 50 + 804 7200 × ( t 86400 × n ) 0 + 86400 × n t < 7200 + 86400 × n 854 7200 + 86400 × n t < 43200 + 86400 × n 854 804 7200 × ( t 43200 86400 × n ) 43200 + 86400 × n t < 50400 + 86400 × n 50 50400 + 86400 × n t < 86400 + 86400 × n
p ( t ) = { 1.01 e 5 + 0.19 e 5 7200 × ( t 86400 × n ) 0 + 86400 × n t < 7200 + 86400 × n 1.2 e 5 7200 + 86400 × n t < 43200 + 86400 × n 1.2 e 5 0.19 e 5 7200 × ( t 43200 86400 × n ) 43200 + 86400 × n t < 50400 + 86400 × n 1.01 e 5 50400 + 86400 × n t < 86400 + 86400 × n
In Equation (35), n = 0, 1, 2, 3…, t is the time (s), and p (t) is the boundary pressure (Pa).
(3) Scheme of the numerical calculation
Numerical simulation scheme is shown in Table 5.
(4) Parameters for the numerical calculation
Since it is very difficult to obtain solutions for coupled models with complicated boundary conditions, the model in this work was further simplified prior to the calculations. For example, ϕ, ρw, and D were set to constant values, based on the values described by previous studies (Table 6).

4.2. Results and Analysis

(1) Variation of model parameters
In this section, the variation of parameters such as saturation, permeability, relative permeability, and chloride ion concentration during the first cycle were analyzed.
(1-1) Variations in saturation
Figure 6 shows the variation of saturation, S, at Point A with time, t, during the first cycle.
It can be observed that the chlorides were transmitted into the concrete within the first 12 h, thus increasing the solution saturation and decreasing the gas saturation. During the period between the 12th and the 24th hour, surface water evaporation led to a decrease in the solution saturation and an increase in the gas saturation.
(1-2) Variations in fluid permeability
Figure 7 shows the variation of the ratio between the solution permeability, kw, and the initial solution permeability, kw0, (kw/kw0) at Point A with time, t, during the first cycle.
At t = 12 h, kw reached its maximum value, which was 10 times the value of kw0; at t = 24 h, the value of kw was 9 times that of kw0. Further, the curve can be divided into six segments. When t = 0–2 h, the solution permeability ratio, kw/kw0, grew at its most rapid rate, at 1.50/h. This suggests that the solution rapidly entered the concrete during this period. When t = 2–6 h, the rate of kw/kw0 growth decreased to 0.75/h. When t = 2–12 h, kw/kw0 continued to increase, but with a lower, stabilized rate of 0.33/h. When t = 12–14 h, kw/kw0 began to decrease slowly, indicating that the solution on the concrete surface had begun to evaporate. When t = 14–18 h, kw/kw0 continued to decrease, and eventually stabilized, such that kw/kw0 = 9.0 when t = 18 h. When t = 18–24 h, the solution permeability ratio, kw/kw0, was maintained at a steady value.
(1-3) Variations in relative permeability
Figure 8 shows the variation of the relative permeability of the solution, krw, and the relative permeability of the gas phase, krg, at point A with time, t, during the first cycle.
When t = 0–2 h, krg increased, whereas krw was nearly zero. Most of the pores in the concrete were initially stable and filled with gas. When the boundary liquid pressure increased, the gas within the concrete changed from a stable state to a flow-dominated state. Consequently, the relative permeability of the gas increased slightly. Since the solution did not reach Point A, krw was zero. When t = 2–16 h, krw increased slowly and krg declined rapidly. When t = 16 h, krw = krg, indicating that most of the pores in the concrete were filled with water. When t = 12–24 h, krw continued to increase, albeit quite slowly, whereas krg continued to decrease slowly.
(1-4) Variations in chloride concentration within 24 h.
Figure 9 illustrates the variation of chloride concentrations, c, with depth, l, on the central line during the first cycle.
At t = 0 h, the initial concentration, c, was 50 mol/m3 at each of the points on the line. When t = 0–12 h, c decreased with an increase in l. When l reached a certain value, c reached its minimum value and remained steady. A peak value was not observed. When t = 12–24 h, c increased initially, and subsequently decreased with an increase in l. When l reached a certain value, the value of c reached a plateau. Therefore, there was a peak value of c. When the solution evaporated on the concrete surface, the chlorides dispersed and were transported internally and externally owing to the concentration gradients and capillary action. Consequently, a peak could be observed at a certain distance from the concrete surface.
(2) Variation of chloride concentrations
Numerical calculations were performed according to the schemes listed in Table 5. The initial porosities of each scheme were 3.49%, 3.83%, and 4.71%. The molar concentrations were converted to mass concentration to facilitate the experimental validation of the numerical results. The conversion formula is
c = c 1 M C L ϕ ρ s
where cl is the molar concentration of chloride ions, MCL- is the molar mass of chloride ions, ϕ is the porosity, and ρ s is the density of the concrete samples.
The results of the coupling model presented in this study were compared with the experimental data and fitted results of Fick’s Second Law, as shown in Figure 10. Figure 10a–d correspond to the results at 30, 110, 190, and 270 days, respectively. In the figure, ‘test’ corresponds to the experimental value, ‘Fick’ corresponds to the result obtained using Fick’s Second Law, and ‘couple’ corresponds to the results of the proposed model. The following conclusions were drawn from the analysis of the results.
The results of the coupling model proposed in this study were consistent with the experimental results, indicating that the model provides a reasonable description of chloride transport in concrete. Nonetheless, a few deviations were observed between the model and experimental results because the equations were highly nonlinear and the calculations attenuated some of these expressions. Furthermore, the model did not account for the heterogeneity of the concrete.
As the depth increased, the fits obtained by Fick’s Second Law gradually became smaller than the experimental results and their final values approached zero. The results of the model proposed in this work are thus superior to those of Fick’s Second Law, since the proposed model produced a closer approximation of the experimental values. Since Fick’s Second Law only considers the diffusion of chlorides and ignores the effects associated with gaseous flows, water migration, capillary actions, etc., it cannot provide an accurate description of chloride transport processes. These deficiencies have been addressed in the model proposed in this work.

5. Conclusions

(1) The porosities of concrete with 30% fly ash and 20% mineral powder were calculated under the action of three cyclic loading protocols (i.e., 50%, 65%, and 80% σ c ) and were 3.49%, 3.83%, and 4.71%, respectively.
(2) The chloride ion transport law of concrete was obtained by a salt spray corrosion test under the action of three cyclic loading protocols, and the average chloride ion diffusion coefficients of concrete were 2.235, 2.974, and 3.793 × 10⁻¹² m2/s, respectively, which were calculated by using Fick’s Second Law.
(3) We have constructed a model for coupled water–gas–chloride transport in unsaturated concrete using gas flow models, liquid flow models, and solute convection–diffusion models. This model accounts for the effects of gas flows, water migration, convection–diffusion, and capillary actions and reflects on the coupling between gas–liquid flows and solute transport in unsaturated porous media.
(4) The coupled water–gas–chloride transport model was solved based on cyclic boundary conditions. The variations in parameters such as saturation, relative permeability, and chloride concentration during the first corrosion cycle were also analyzed. Through calculations performed on concretes with different initial porosities, this study has determined that the chloride concentrations calculated using the proposed model are consistent with the experimental results and are therefore superior to those obtained using Fick’s Second Law.

Author Contributions

R.L. conceived and designed the experiments. X.M. and B.L. contributed to the theoretical calculation and numerical simulation parts of the work and composed the paper manuscript. H.Y. and L.Z. analyzed the data. All of the authors contributed to the writing of the paper.

Funding

The authors gratefully acknowledge the financial support for this work provided by the Outstanding Youth Science Foundation of China (No.51322401), the Science and Technology Project of the Chinese Ministry of Housing and Urban–Rural Construction of China (No.2013-K4-22, 2014-K4-042 and 2016-K4-033), the Science and Technology Project of Housing and Urban-Rural Construction Department of Jiangsu Province (No.2017ZD163), the Natural Science Foundation of the Jiangsu Higher Education Institutions of China (No.16KJB560017 and 18KJB560019), the General Program of Chinese National Building Materials Industry Technology Innovation Program of China (No. 2016-Z-2, 2016-Z-5, 2016-Z-7 and 2016-Z-8), and the Research Program of Xuzhou Institute of Technology (XKY2016228).

Conflicts of Interest

The authors declare no conflicts of interest.

References

  1. Lv, J.F.; Tab, Z.J.; Ba, H.J. Micro-structure and performance analysis of marine concrete after extended exposure to marine environment. J. China Univ. Min. Technol. 2010, 39, 530–531. [Google Scholar]
  2. Rita, B.F. Electrochemical sensors for monitoring the corrosion conditions of reinforced concrete structures: A review. Appl. Sci. 2017, 7, 1157. [Google Scholar]
  3. Geng, J.; Easterbrook, D.; Liu, Q.F.; Li, L.Y. Effect of carbonation on release of bound chlorides in chloride contaminated concrete. Mag. Concr. Res. 2015, 68, 353–363. [Google Scholar] [CrossRef]
  4. Yu, B.; Ning, C.; Li, B. Probabilistic durability assessment of concrete structures in marine environments: Reliability and sensitivity analysis. China Ocean Eng. 2017, 31, 63–73. [Google Scholar] [CrossRef]
  5. Dai, H.J.; Wang, F.C.; Wu, Y.H.; Nan, F. Durability of concrete used for oil-platform in tidal zone. J. Building Mater. 2000, 3, 135–141. [Google Scholar]
  6. Li, B.; Yin, H.G.; Mao, X.B.; Li, Y.; Zhang, L.Y.; Liu, R.X.; Qiu, P.T. Macroscopic and microscopic fracture features of concrete used in coal mine under chlorine salt erosion. Int. J. Min. Sci. Technol. 2016, 26, 455–459. [Google Scholar] [CrossRef]
  7. Jin, W.L.; Zhang, Y.; Lu, Z.Y. Mechanism and mathematic modeling of chloride permeation in concrete under unsaturated state. J. Chin. Ceram. Soc. 2008, 36, 1362–1369. [Google Scholar]
  8. Jin, W.L.; Jin, L.B.; Yan, Y.D.; Yao, C.J. Field inspection on chloride ion-intrusion effect of seawater in dry-wet cycling zone of concrete structures. J. Hydraul. Eng. 2009, 40, 364–365. [Google Scholar]
  9. Zhang, Q.Z.; Gu, X.L.; Zhang, W.P.; Huang, Q.H. Model on capillary pressure saturation relationship for concrete. J. Tong Ji Univ. Nat. Sci. 2012, 40, 1753–1755. [Google Scholar]
  10. Pan, Z.C.; Chen, A.R. Numerical simulation of chloride transportation process in unsaturated concrete. J. Tong Ji Univ. Nat. Sci. 2011, 39, 314–315. [Google Scholar]
  11. Yan, Y.D.; Jin, W.L.; Wang, H.L.; Lu, C.H. Chloride transport in cracked concrete under wet-dry cycling condition. J. Tong Ji Univ. Nat. Sci. 2013, 44, 2060–2062. [Google Scholar]
  12. Li, C.Q.; Li, K.F. Chloride ion transport in cover concrete under drying-wetting cycles: Theory, experiment and modeling. J. Chin. Ceram. Soc. 2010, 38, 581–582. [Google Scholar]
  13. Li, C.Q.; Li, K.F. Moisture transport in cover concrete under drying-wetting cycles: Theory, experiment and modeling. J. Chin. Ceram. Soc. 2010, 38, 1151–1153. [Google Scholar]
  14. Polder, B.P.; Peelen, W.H.A. Characterisation of chloride transport and reinforcement corrosion in concrete under cyclic wetting and drying by electrical resistivity. Cem. Concr. Compos. 2002, 24, 427–435. [Google Scholar] [CrossRef]
  15. Thiery, M. Modelisation du sechage des betons: Analyse des differents modes de transfert hydrique. Revue Européenne de Génie Civil 2007, 11, 541–578. [Google Scholar] [CrossRef]
  16. Ma, D.; Cai, X.; Li, Q.; Duan, H.Y. In-situ and numerical investigation of groundwater inrush hazard from grouted karst collapse pillar in longwall mining. Water 2018, 10, 1187. [Google Scholar] [CrossRef]
  17. Li, K.F.; Li, C.Q.; Chen, Z.Y. Influential depth of moisture transport in concrete subject to drying-wetting cycles. Cem. Concr. Compos. 2009, 31, 693–698. [Google Scholar] [CrossRef]
  18. Ma, D.; Duan, H.Y.; Liu, J.F.; Li, X.B.; Zhou, Z.L. The role of gangue on the mitigation of mining-induced hazards and environmental pollution: An experimental investigation. Sci. Total Environ. 2019. [Google Scholar] [CrossRef]
  19. Zanden, A.; Taher, A.; Arends, T. Modelling of water and chloride transport in concrete during yearly wetting/drying cycles. Constr. Build. Mater. 2015, 81, 120–123. [Google Scholar] [CrossRef]
  20. Zhao, Y.X.; Chen, C.; Gao, X.J.; Jin, W.L. Seasonal variation of surface chloride ion content and chloride diffusion coefficient in a concrete doc. Adv. Struct. Eng. 2013, 16, 395–403. [Google Scholar] [CrossRef]
  21. Zhou, Z.L.; Cai, X.; Ma, D.; Du, X.; Chen, L.; Wang, H.; Zang, H. Water saturation effects on dynamic fracture behavior of sandstone. Int. J. Rock Mech. Min. Sci. 2019, 114, 46–61. [Google Scholar] [CrossRef]
  22. Wang, L.C.; Wang, J.Z. Mesoscale simulation of chloride diffusion in concrete subjected to flexural loading. Adv. Struct. Eng. 2014, 17, 561–571. [Google Scholar] [CrossRef]
  23. Bourbatache, K.; Millet, O.; Aït-Mokhtar, A. Ionic transfer in charged porous media. Periodic homogenization and parametric study on 2D microstructures. Int. J. Heat Mass Transf. 2012, 55, 5979–5991. [Google Scholar] [CrossRef]
  24. Ma, D.; Duan, H.Y.; Cai, X.; Li, Z.; Li, Q.; Zhang, Q. A global optimization-based method for the prediction of water inrush hazard from mining floor. Water 2018, 10, 1618. [Google Scholar] [CrossRef]
  25. Wu, Y.; Liu, J.S.; Elsworth, D. Dual Poroelastic Response of coal Seam to CO2 Injection. Int. J. Greenh. Gas Control 2010, 4, 668–678. [Google Scholar] [CrossRef]
  26. Ma, D.; Rezania, M.; Yu, H.-S.; Bai, H.-B. Variations of hydraulic properties of granular sandstones during water inrush: Effect of small particle migration. Eng. Geol. 2017, 217, 61–70. [Google Scholar] [CrossRef]
  27. Chilingar, G.V. Relationship between porosity, permeability, and grain size distribution of sands and sandstones. Dev. Sedimentol. 1964, 1, 71–74. [Google Scholar]
  28. Zhou, Z.; Cai, X.; Ma, D.; Chen, L.; Wang, S.; Tan, L. Dynamic tensile properties of sandstone subjected to wetting and drying cycles. Constr. Build. Mater. 2018, 182, 215–232. [Google Scholar] [CrossRef]
  29. Ma, D.; Cai, X.; Zhou, Z.L.; Li, X.B. Experimental investigation on hydraulic properties of granular sandstone and mudstone mixtures. Geofluids 2018, 2018, 9216578. [Google Scholar] [CrossRef]
  30. Ge, Y.F. Fine Numerical Simulation and Experimental Study of Chloride Corrosion of Self-Compacting Concrete; School of Civil Engineering Southeast University: Nanjing, China, 2017; pp. 3–4. [Google Scholar]
Figure 1. Flow chart of the test.
Processes 07 00084 g001
Figure 2. The change curves of chloride ion concentration, c, with depth, l.
Processes 07 00084 g002
Figure 3. Water–gas–chloride coupling transport model in unsaturated concrete.
Processes 07 00084 g003
Figure 4. Numerical calculation model.
Processes 07 00084 g004
Figure 5. Boundary conditions.
Processes 07 00084 g005
Figure 6. The change curves of saturation, S, with time, t.
Processes 07 00084 g006
Figure 7. The change curves of the solution permeability ratio, kw/kw0, with time, t.
Processes 07 00084 g007
Figure 8. The change curves of gas and liquid relative permeability, krg and krw, respectively, with time, t.
Processes 07 00084 g008
Figure 9. The change curves of chloride ion concentration, c, with depth, l.
Processes 07 00084 g009
Figure 10. The comparison curves of chloride ion concentration, c, with depth, l.
Processes 07 00084 g010
Table 1. Mix ratio of concrete.
Water–Cement RatioAdmixtureContent (%)Cement
(kg/m3)
Fly Ash
(kg/m3)
Mineral Powder
(kg/m3)
Sand
(kg/m3)
Stone (kg/m3)Water (kg/m3)
0.32F + G15 + 35226681587401112145
Table 2. Number of specimens.
Sample NO.1#2#3#
NO./piece333
Table 3. Porosity of concrete.
Sample NO.Porosity ϕ (%)
Sample 1Sample 2Sample 3Mean
13.923.223.303.49
23.904.213.383.83
34.734.135.264.71
Table 4. Chloride diffusion coefficient, D.
Sample NO.Chloride Diffusion Coefficient (D) (×10−12 m2/s)
t = 30 dt = 110 dt = 190 dt = 270 dMean
15.2431.5921.1260.9792.235
25.8042.0892.0461.9572.974
36.1233.3143.0662.6673.793
Table 5. Numerical simulation scheme.
SchemeParameter
ϕ0 %D0 (×10−12 m2/s)
Scheme 13.492.235
Scheme 23.832.974
Scheme 34.713.793
Table 6. Numerical simulation parameters.
ParameterValue
Initial porosity ϕ0/%ϕ0
Pore deformation coefficient α/(1/Pa)1e-6
Pressure compressibility βp /(1/Pa)5e-8
Concentration compressibility βc/ (m3/mol)1e-5
Water permeability kw/(m2)1e-15
Langmuir adsorption constant KL/(m3/mol)0.001
Langmuir maximum adsorbing capacity Cmax/(mol/m3100
Initial concentration C0/(mol/L)50
Solution density ρw/(kg/m3)1025
Gas density ρg/(kg/m3)1.23
Concrete density ρc/(kg/m3)2450
Chloride diffusion coefficient D0/(m2/s)D0
Liquid dynamic viscosity uw/(Pa·s)0.00101
Gas dynamic viscosity ug/(Pa·s)0.00085
Liquid initial pressure P0/(Pa)1.01e5
Liquid initial saturation Swr/%30
Gas initial saturation Sgr/%70
Concrete permeability K0/(m2)1e-14

