Article

Agent-Based Simulation of Value Flow in an Industrial Production Process

Department of Manufacturing Engineering, Transilvania University of Brasov, 29 Eroilor Boulevard, Brasov 500036, Romania
*
Author to whom correspondence should be addressed.
Processes 2019, 7(2), 82; https://doi.org/10.3390/pr7020082
Submission received: 15 December 2018 / Revised: 2 February 2019 / Accepted: 3 February 2019 / Published: 7 February 2019

Abstract

:
The current competitive environment demands companies to be more and more efficient. In order to increase manufacturing efficiency, two apparently independent approaches have emerged: lean strategies, focusing on identifying and minimizing non-added value activities, identifying wastes in the system and their elimination, and information tools for planning and controlling activities. In this paper, a manufacturing system was considered for which it was necessary to increase the production capacity in order to respond to the customer’s increased demand. A practical case study in the automotive industry for a medium-sized enterprise was considered. In order to investigate the production process parameters and to implement lean principles, Value Stream Mapping (current analysis and optimized solution) and Anylogic agent-based simulations were carried out. Based on this, the lean performances, specific for the target VSM, were evaluated in terms of key performance indicators. The benefits of integrating agent-based simulation in the design and analysis of the value flow in the production chain are the capitalization of the information offered by Value Stream Mapping and the possibility to choose the best one from the possible scenarios. It generates important time and cost reductions without further resource waste.

Graphical Abstract

1. Introduction

The manufacturing of products has lately evolved from mass production to customized production [1]. In this context, optimizing the use of resources remains a challenge for organization. In [2], Lieder at al. defines the industrial businesses as “a complex adaptive system between customers (actors) and manufacturing systems (technical artefacts) producing products”.
The lean philosophy, applied in the permanent improvement of processes, is based on the concept of product value. The value of the product, from a business perspective, is defined as what the customer pays. Wherever a product is made, there is a flow of value [3]. Depending on the scale, strategy, and level of development of the organization and of the culture where it is applied, lean is a management system, a philosophy or a tool set [4,5,6].
Starting from the identification and elimination of non-value-added activities, Womack and Jones [7] define five lean principles: value, value stream, flow, pull, and perfection. The first step is represented by setting the value from the client’s perspective. Once the value has been established, the next step is mapping the processes by identifying value flows. After the losses have been identified and removed from the process, the next step presupposes ensuring process fluidity, without throttling, smoothly, uninterrupted flows to the customer. By following the steps outlined above, if implementation is correctly done, lean remarkable results can be achieved in terms of efficiency, time cycle reduction, productivity, material costs, scrap reduction, resulting in lower overall costs and high competitiveness [7].
The main types of waste that are addressed within lean are defects, unnecessary transport, unnecessary motion, setup time, finished goods inventory, inappropriate processing, failure time, work-in-process (WIP), raw material inventory, and lack of integrated approach [8,9]. Starting from the lean classic, the methodology evolves towards lean digital and lean 4.0 [10].
The intersection between lean and simulation was investigated in several studies. From small businesses to multinational companies, organizations apply simulation models to analyze logistics networks, reduce costs and improve customer service [11]. That is why, mapping this flow, modelling and optimizing it by using specific tools represent necessary actions within the company [12,13].
During a production process, many dysfunctions can occur because of various influencing factors. An appropriate method to analyze, prevent, optimize, or look for solutions those production dysfunctions is using a process modeling and simulation technique, by digital plant environment implementation [14,15,16]. The advantage of using process simulations is that it helps maintain or even increase the value of the manufactured products to serve for negative influencing factors identification and eliminate the unnecessary waste.
However, according to the authors’ best knowledge, some of simulation models are necessary to acquire additional datasets with respect to the data provided by Value Stream Mapping (VSM). A model simulation which allows to use only VSM information is what this research wishes to address.
In this respect, the paper presents a methodology to improve VSM by adding the agent-based simulation to it. The work is structured in the following sections. Section 2 describes the lean concepts, VSM, and simulation in the light of recent research. As a result of the bibliographic, theoretical and applicative research on the integration of VSM with other modeling/simulation tools, Section 3 presents the simulated model of the VSM. After the presentation of the current VSM, making the decision is assisted, by using specific tools, so that VSM target can respond to the company’s objectives for a given time. A case study at a medium-sized enterprise, presented in Section 4, contributes to the easy understanding of the proposed model. Section 5 includes a summary and the analysis of results further research directions, and Section 6 contains the conclusion.

2. Value Stream—Mapping and Simulation

2.1. Mapping a Value Stream

VSM, as a visual tool, proves to be effective in the continuous improvement of processes. Beginning from the classic approach, in four steps, many authors have proposed its integration within other tools that might increase VSM’s effectiveness [17].
Goti et al. [17] and Yin et al. [18], in a comparative study of various modeling methods, highlight VSM’s superiority, its degree of formalization, completeness, modeling skills, and model extension, in relation to Flowchart, Role behavior, IDEF0 (Integrated DEFinition) diagram, and Petri net.
Researchers as well as practitioners, after critical analyses, have looked for ways to improve VSM by integrating other tools at various stages of building a value chain. Braglia et al. [19] and Gunduz et al. [20] present VSM as a tool for linear systems. In the case of complex systems, it is necessary to improve the approach by connecting it to other tools [3,10,12,14,15].
A model for the improvement of the value-mapping process by the integration of stakeholders’ requirements for the development of sustainable business is proposed by Geissdoerfer et al. [21].
VSM is a lean management method for the analysis of the current state of being and for the design of a future situation for the series of events that a product or service undergoes from the raw material to the customer [19], VSM was developed in 1995 [22].
Seth and Gupta [13] define VSM as the process of mapping material and information flows in the form of value stream afferent to components and subassemblies, taking into account manufacturing, suppliers and distribution to the customer. According to Meudt [10] and Heravi et al. [23], VSM is one of the most efficient methodologies for mapping and analyzing process chain.
Andreadis, Garza-Reyes, and Kumar [24], analyzing with a view to increasing the competitiveness of the organization, describe the VSM methodology, underlining the importance of value chain implementation and management.
VSM presents graphically all the activities necessary for the achievement of the product or service requested by the client for which the flow of materials and information is viewed in the analyzed area [25]. In this way, losses in the value flow can be identified, and solutions are looked for in order to have them reduced or eliminated.
Designing the value flow map means the graphical representation of material, human, and information flows that are involved in the achievement of the product. The analysis of the values flow and the design of the diagram lead to an overall image of processes at all levels, from raw material to delivery to the customer. The objective is to describe all steps that are taken and to identify those that do not add any value in order to have them eliminated. Last but not least, VSM results in a better understanding of the process as a whole.
Although the design of the value flow is often associated with production, the methodology is also used in logistics, in the supply chain, in the related industries, in the health services, in software development, in the administrative and office processes as an effective tool for the improvement of processes by the identification of waste. This approach, based on four steps, was proposed by Rother et al. [26] and Tapping et al. [27].
The VSM stages, described in the papers presented in the previous paragraphs, are:
  • choice of the product family;
  • representation of the current VSM status;
  • VSM achievement–target;
  • establishment of the action plan.

2.2. Production Process Simulation

In the context of increased demand for a higher degree of product customization and personalization, simulation leads to resource economy [28,29,30]. Manufacturing processes simulation, as an intermediate stage in implementing digital manufacturing asks for the use of specific technologies and methods [31,32,33,34,35,36,37,38,39].
While System Dynamics and discrete-event simulation modeling are traditional, agent-based simulation modeling is relatively new and can be used across all abstraction levels [40]. Agents may model objects of very diverse nature and scale and allow defining the agents’ behavior which will prove useful for more complex research. The agent-based approach is more general and powerful [31,32,40,41]; it is also easier to implement and maintain [40].
In a defined environment, Borshchev and Filippov [40] as well as Schonemann et al. [28] propose to use agent-based modeling simulation. This approach involves modeling of individual object behavior [41]. According to Norton [42], Chamoso [43], Cocco [44], and Thang [45], agent-based modeling focuses on the individual active components of a system. This is in contrast to both the more abstract system dynamics approach, and the process-focused discrete event method.
With agent-based modeling, active entities, known as agents, must be identified and their behavior defined. They may be people, households, vehicles, equipment, products, or companies, whatever is relevant to the system [42,43,44]. Connections between them are established, environmental variables set, and simulations run. The global dynamics of the system then emerge from the interactions of the many individual behaviors [46].
Ruiz et al. [47] present an evaluation of the most used software simulation tools for manufacturing systems, as Arena, Extend, Microsaint, Quest, Witness, FlexSim, and Promodel. The results of [45] include the advantages of using the agent paradigm. Heydaryan et al. [48], Kokareva et al. [49] Fiľo et al. [50] and Siderska et al. [51] propose as solutions for simulating production processes, Siemens Tecnomatix software which includes, for making digital models of production lines, Process Simulate package [41], or Promodel [52]. Simulink, Anylogic, Witness are described by Goodal in [53].
Anylogic is a software system developed by the AnyLogic Company for modeling, simulation, analysis, visualization, and optimization of production systems and processes, material flow and logistics operations [40]. Anylogic provides a single platform for dynamic simulation [53].
Goodall et al. [53], Schwab et al. [54], Zhang et al. [55], and Ohab et al. [56] describe different applications using agent-based model in Anylogic software. The AnyLogic simulation environment allows working with agent-based, discrete-event, and system dynamics simulation models to customize material and information resources in a production system. Simulation modeling uses objects and rules that describe the dynamic behaviors of systems [56,57].
The simulation shown in this paper uses agent-based modelling using Anylogic.

3. Material and Methods of Simulated VSM

Starting from the conclusions presented at the end of the previous section, the authors suggest introducing some additional steps for the study of the dynamic behavior of the systems, and respectively VSM simulation.

3.1.VSM Achievement

a) Current VSM is made starting from the requirements of the customer and is developed following the steps of the product process flow. The main flows in a VSM are information flow and material flow. A process flow diagram identifies the parameters that represent process characteristics.
In order to analyze the current state of VSM, the entry data is:
  • choice of the product with the highest production volume;
  • calculation of client’s takt time;
  • identification of the operations required to achieve the product;
  • cycle time measurement;
  • identification of the positioning for operators;
  • inter-operations inventory;
  • calculation of the duration of the assembly process;
  • calculation of the Lead time process;
  • calculation of operator load and of the number of operators required;
  • general plan of the production line.
b) VSM target
It represents the ideal manufacturing line and the predicted process. The VSM target contains:
  • proposal to position operators to reach the target;
  • reducing inventory between operations;
  • calculating the duration of the assembly process;
  • calculating lead time process;
  • establishing the operator’s load capacity and the number of operators required to reach the target;
  • general plan of the manufacturing line;
  • mapping the value flow.

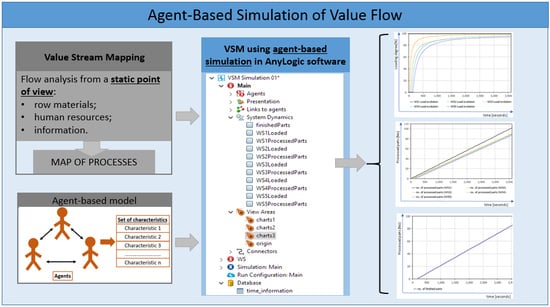
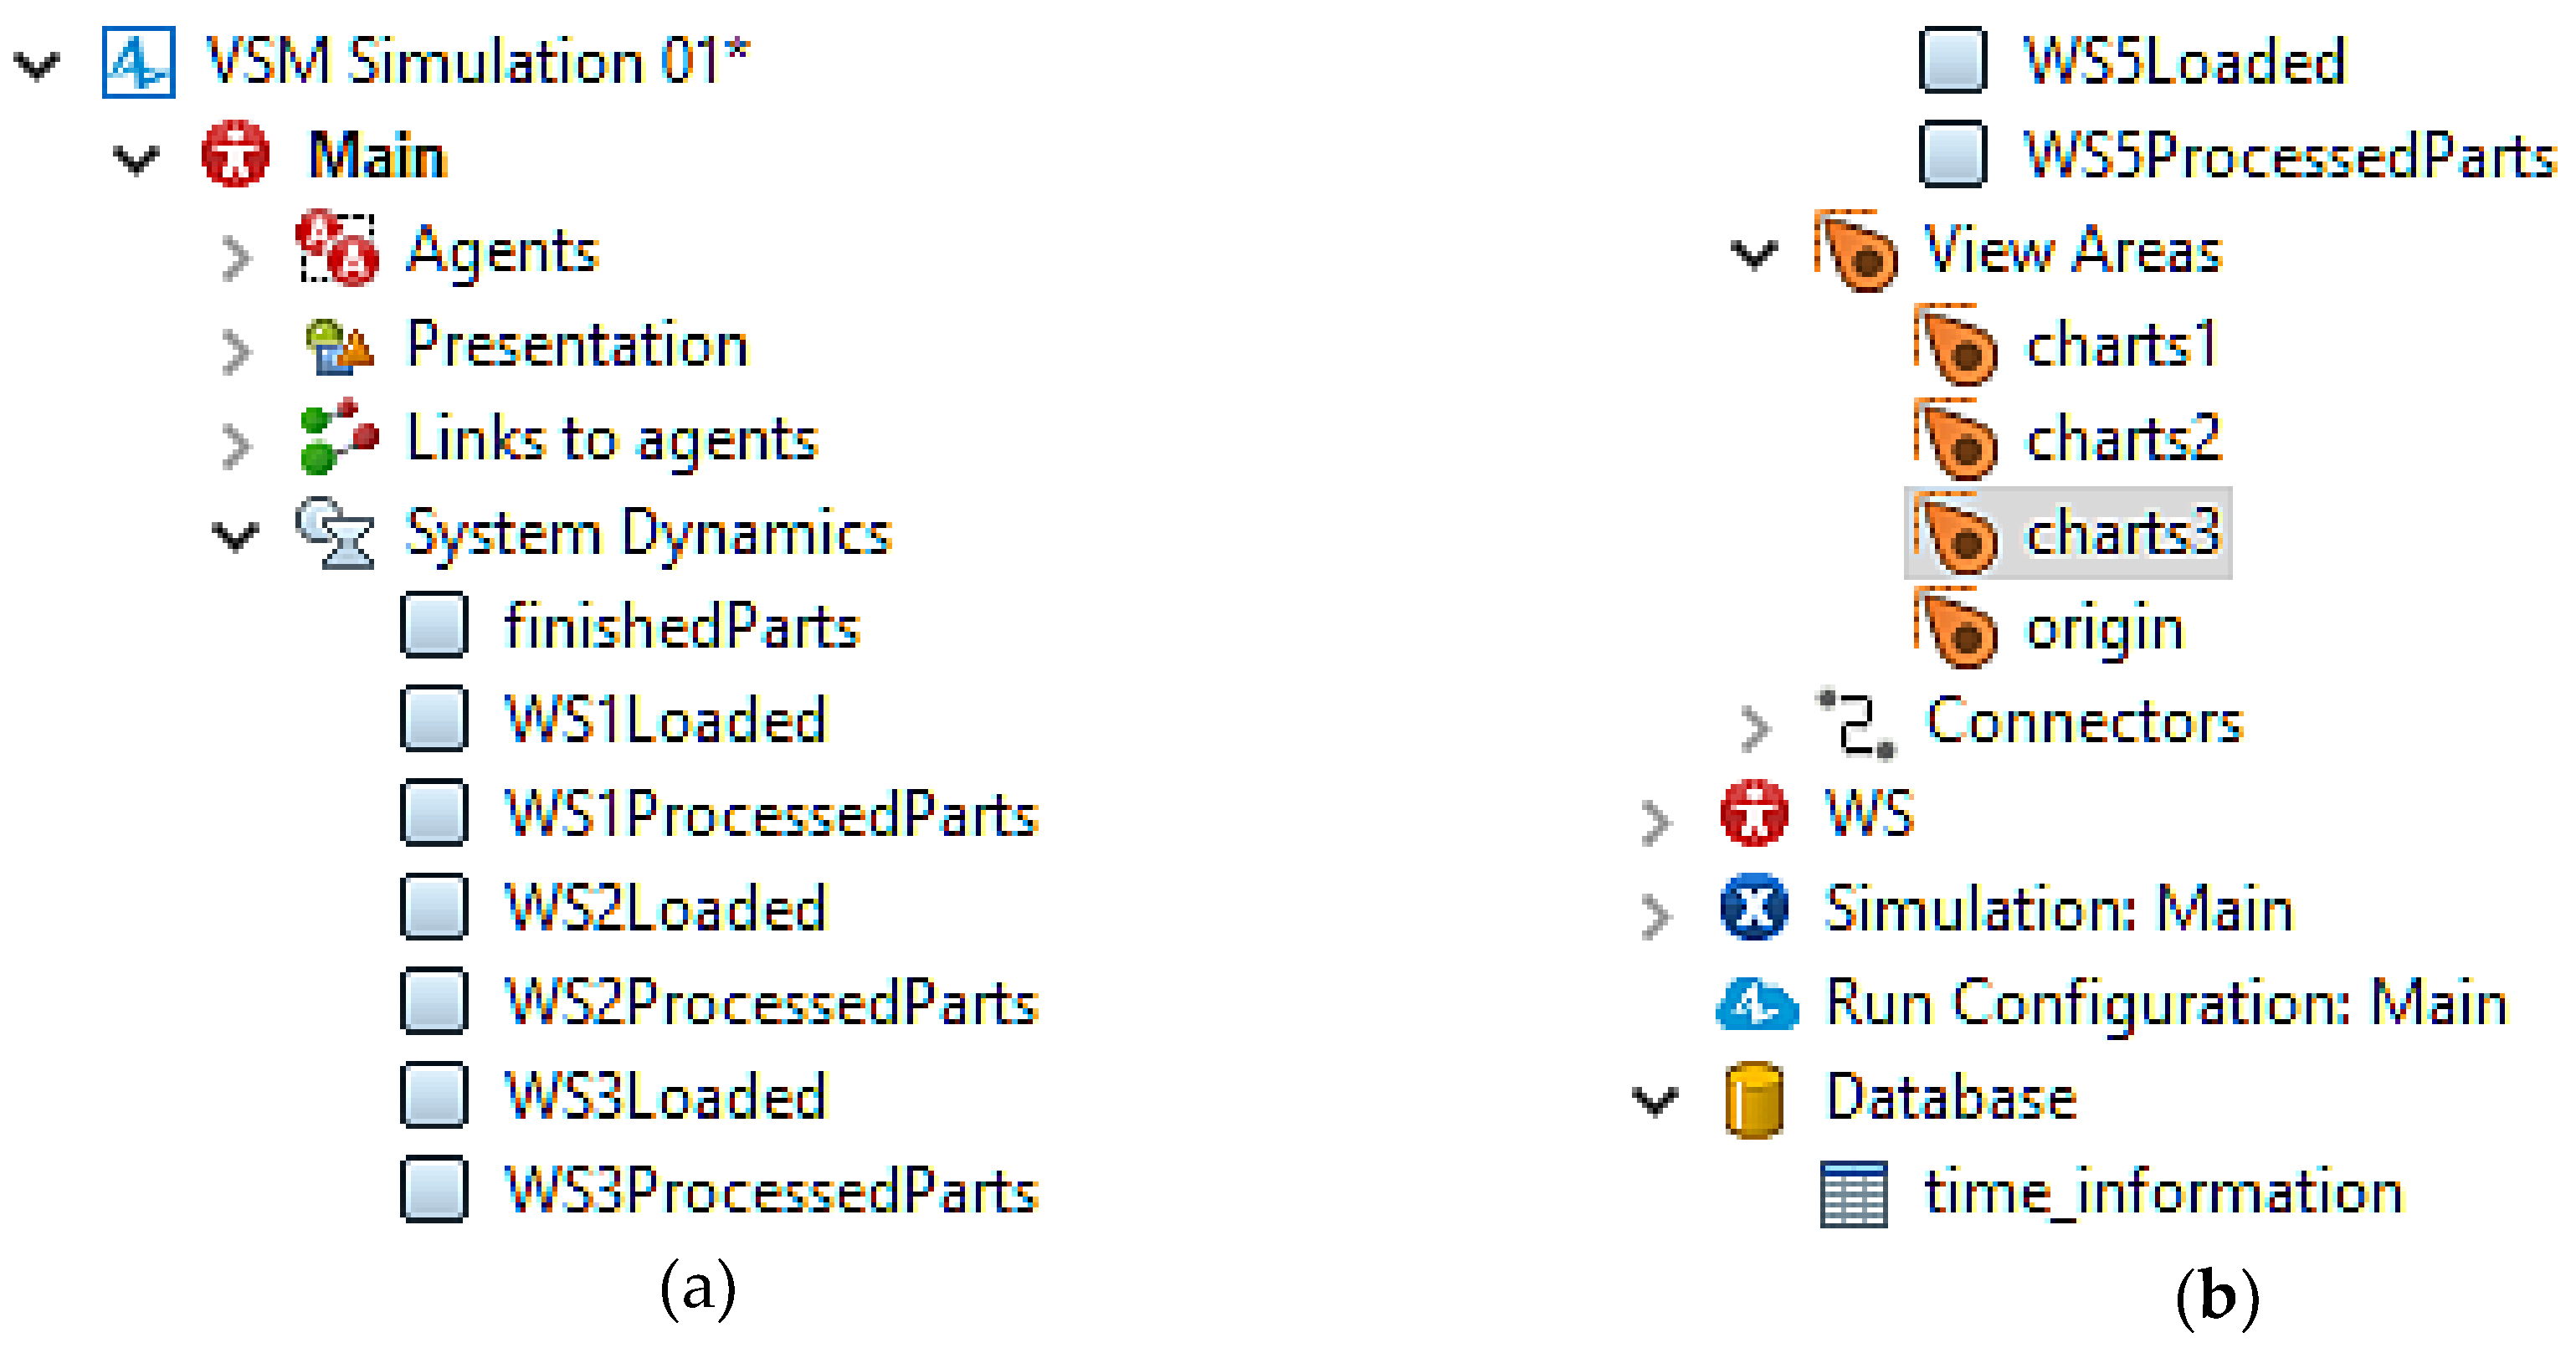
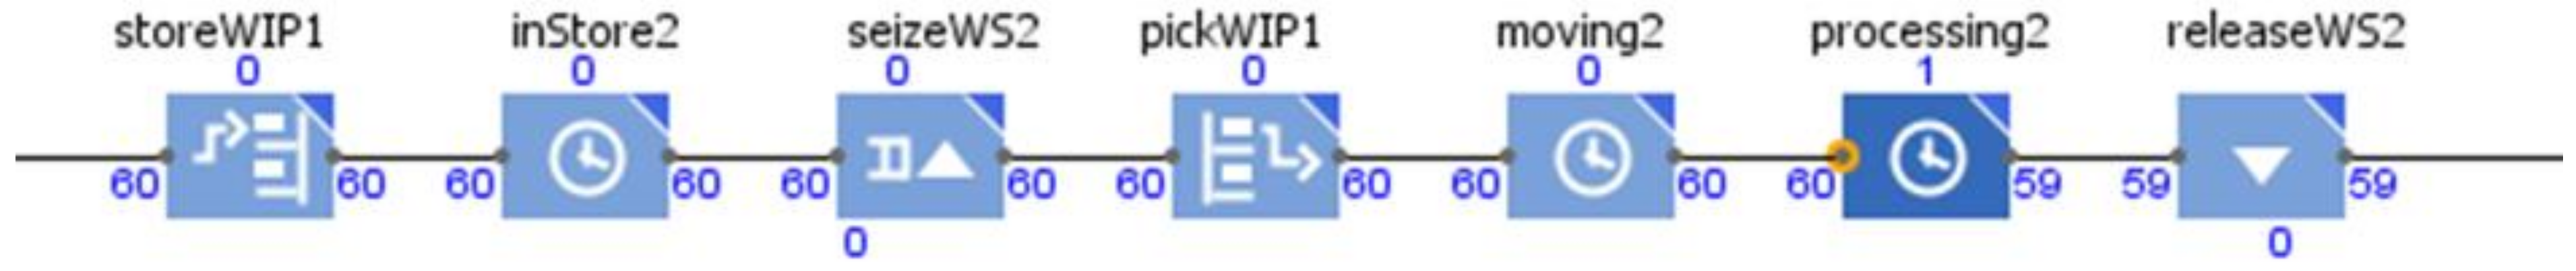
3.2. VSM Simulation Model

The completion of this stage involves building an agent model using the Anylogic simulation environment [53,58]. The process-centric model of real-world systems is used, and it contains the following elements [53]:
  • primary elements: agents and resources;
  • derivatives;
  • processes detailed to operations and sequences, characterized by queues, delays, and resource utilization.
The model of the process defined by flowcharts allows graphic representation; the graphic process representations were obtained from the Process Modeling Library’s blocks (Figure 1a). In the next steps, the process flowchart is created.
AnyLogic was used to simulate the process with the initial cycle times and the process with the final cycle times given by the VSM target.
The variables and the view areas of the final project structure are depicted in Figure 1b. Multiple view areas are needed as AnyLogic time plots. These plots are necessary for machine load tracking, for the tracking of the machine load evolution in time, for a comparative view of machine loads, and for tracking the number of processed and finished parts. Since the input data already consists of full cycle times, measured as the difference of time between the product’s time of leaving the current workstation and the time leaving the previous workstation, it is sufficient to use the main agent and the WS (workstation) agent (used only to graphically represent the workstations).
Simple graphics (Figure 2) were also used to graphically simulate the flow of products through the workstations (WS). Resource pools containing only one object were used to enable the seizing and releasing of each of the workstations for processing, with the added benefit that the total load of a workstation can be seen directly next to it. As the loads are restricted from the beginning to 75% of the total working time by taking into account only six hours out of eight, the process uses maximum loads.
To keep things simple and flexible, a logic which employs delays was used for each workstation (Figure 3). It consists of putting the product in the rack, delaying it there if needed, seizing the workstation, taking the product from the rack and moving it (delay block to specify moving time), processing it, and releasing the workstation when done.
The external input data for the simulation consists of the cycle times for each operation. Since the project needed to be prepared to handle frequent data changes, this data was saved in Excel sheets and then imported into the project’s data base. This enabled easy data changes for simulating new scenarios. A database table with the two sets of the cycle times is depicted in Figure 4b.
It is noticeable that the actual cycle times were split in two (an interval of 4 s for moving the product and the rest of the cycle times for processing the product at the workstations). This was found to be necessary in order to make the processing of individual products at a workstation show up in the charts. Figure 4a shows how a delayed object is connected to data from the project’s database and how actions are used to modify the values of variables to obtain new results.

3.3. Evaluation of Lean Performance for the VSM Target Simulation Model

In order to evaluate the results of the production process improvement using simulation, the references [59,60,61,62] recommend the evaluation of lean performance by using seven key performance indicators (KPI) presented in Table 1, from which three indicators specific to the problem to be solved will be used.
Of the seven indicators referring to Table 1, VSM allows to deal with three of them: people productivity (PP), value added per person (VAPP), and percent of use of production space (FSU) [30].

4. Application in an Industrial Process Case Study

The development of the proposed model will be done on a medium complexity product of a medium-sized enterprise, a twin-tube damper. The various stakeholders (practitioners, researchers, an external observer) were involved in consensus building steps, emphasis on flow and the use of the proposed simulation.
The dampers can be manufactured in eight constructive variants. The components of the damper are the following: two concentrically positioned tubes, a piston rod, a sealing and guiding piston rod pack, a piston pack, a lower valve, and a valve pin for the adjustment function. The connection elements are: an upper ring connection screwed in the piston rod and a ring attached in the aluminum tube by a spherical nut on the bottom (Figure 5). The necessary adjustment elements are: an adjustment lever, a sliding guide slider, two stringback springs, and an adjusting cable adapter.
The current situation is characterized by a demand of 367 dampers per day; the known problems are inventory management, the execution of parallel operations, and an inefficient use of the workforce. The foreseen demand is 550 dampers per day.
In order to establish current VSM, the flow value analysis on the production line is necessary. It is noticeable that the production line is a manual assembly one. Table 2 shows the data taken from the production line applied to scenario 1, measured for 20 days.
Two scenarios will be evaluated, one for 367 dampers (as a current situation, represented by Value Stream Analysis), and the other for 550 dampers (as a target situation, represented by Value Stream Design).
The assembly line of the twin-tube damper is a manual one (In Table 3 there is a Workcenter description). In order to meet customer requirements, taking into account the type of line, cycle time must be 75% of customer’s takt (58.9 s/parts).
The cycle time was measured with a timer for each operation, with one operator for a batch of 40 pieces.
The data existing in Table 4, which support the actual VSM, are introduced in the agent-based simulation model.
The first set of charts is used to analyze the existing production process (Value Stream Analysis).
Figure 6a shows the real-time load of the first workstation during the last ten minutes of the first hour. An important difference of cycle times is noticeable between the first three workstations and the last two. Figure 6b shows the evolution of the load for all the workstations, during the first hour. The evolution of the number of processed part (Figure 6c) and of the finished part (Figure 6d) are also simulated, during the first hour.
The second set of charts was used to analyze the final production process with cycle times given by VSM target (presented as Value Stream Design).
Figure 7a shows the real-time load of the first workstation during the last ten minutes of the first hour. Closer values for all cycle times are noticeable. Figure 7b shows the evolution of the load for all the workstations, during the first hour, as well as the evolution of the processed and finished par (Figure 7c,d).
For the VSM target simulation, the following requirements were considered:
  • the processing has to consider client’s maximal production time, otherwise the results will lead to overproduction or non-compliance according to the customer’s requirements;
  • production in line with the customer’s maximal production time involves balancing workload at all stages of the process;
  • the replacement of production in isolated islands with a continuous production flow, or, if not possible, production will be coordinated by pull supermarket systems;
  • production planning will only be involved at very few moments in the added value flow;
  • different types of products are programmed in equal batches per day for equalizing distribution during basic processes.

5. Discussion

The results obtained using simulated scenarios were depicted in Table 5. Taking into account the specifics of the case study and manual assembly production line, three KPIs were used:
  • growth of the PP value indicates the fact that most of direct employees’ work is adding value to the process, non-value-added work is reduced to minimum, waste is eliminated;
  • VAPP emphasizes the difference between the input value and the output value during production. The output and input values reflect the difference between the final value of the end product and the value of raw materials and services used;
  • FSU stands for the increasing of the space efficiency taken up by the production process.
The evaluation of the results of simulated scenario, according to the problem presented in the case study, were depicted in Table 5 (according to [61]).
Adopting the chosen solution (validated by the results of simulation) generate an action plan. In the application described above, the actions will be: the presentation of customer demand and modification plan, hiring an operator or displacing an operator from another manufacturing line, training the new operator, settling the operators after the new layout, and beginning production according to the target takt.
From the point of view of the evaluation of agent-based simulation model, the assessment was made after a brainstorming by practitioners, researchers, and external evaluators. The proposed solution led to realistic improvements.

6. Conclusions

A research on adding simulation to VSM reveals the following conclusions:
  • putting VSM into practice is studied by manufacturing and other domains such services [62,63], health care, logistics, and transport [64,65,66]
  • a VSM approach in the Industry 4.0 context [3,10,12] implies, besides the development of specific software tools, a “refinement of the necessary data”;
  • flows represented in a VSM are: the material and the informational flow from a static point of view;
  • VSM can be a tool taken from the classic lean approach to the digital lean approach and the lean 4.0 approach. It consists of mapping and analyzing where the process is improved;
  • simulation is a complementary tool, allowing both the visualization of the evolution of processes represented by the help of VSM, as well as the workstation position optimization;
  • the use of dynamic simulation in process analysis helps to increase the system’s response rate to customer demand;
  • the exploitation of the benefits of Lean and simulation approaches will be pillars for Industry 4.0 paradigm.
The theoretical model (VSM and agent-based simulation) developed within the present research was applied to a damper product assembly line. The simulation project modules in the AnyLogic environment allow for an easy deployment in any situation in which it is used as a VSM optimization methodology.
The proposed solution is a flexible one, adapted to a small and medium-sized enterprise. The input data is represented by the time frames associated to each modeled agent (current situation and target situation) by filling an Excel table and importing it into AnyLogic.
The other elements that characterize the process are already defined in the design phase of the application. The temporal response of the system (using the AnyLogic multiplier system) focused both on the load rate analysis of each workstation as well as on the comparison between workstations. Following this indicator, along with the tracking of the number of manufactured parts resulted in the development of balancing solutions.
The simulation of the target variant, aimed at increasing the production according to the client’s future requirements, allowed the analysis of the systems’ reaction and the validation of the proposed solution.
Future research directions will refer to the development of new algorithms that will represent the base for the simulation of the production systems, by including as an input parameter to track the energy consumed by the workstations (in the automatic workstations case) and people behaviors (in the manual assembly workstation), according to agent-based model facilities. This approach will help even more in taking an efficient decision regarding the optimization of processes [67,68,69,70].

Author Contributions

L.P. and B.D. conceived and designed the simulation; M.D.N. modelled the product for case study; L.P., B.D. and G.O. analyzed the data and wrote the paper. All authors read and approved the final manuscript.

Funding

This research was partially funded by Transilvania University of Brasov in the research program Transilvania University Scholarship.

Conflicts of Interest

The authors declare no conflict of interest.

Abbreviations

VSMValue Stream Mapping
KPIKey performance indicator
PPPeople Productivity
VAPPValue Added Per Person
FSUFloor Space Utilisation
WSWorkstation
WIPWork in process

References

  1. Schonberger, R.J. World Class Manufacturing; Simon and Schuster: New York, NY, USA, 2008. [Google Scholar]
  2. Lieder, M.; Asif, F.M.A.; Rashid, A. Towards Circular Economy implementation: An agent-based simulation approach for business model changes. Auton. Agent Multi-Agent Syst. 2017, 31, 1377. [Google Scholar] [CrossRef]
  3. Buer, S.V.; Strandhagen, J.O.; Chan, F.T.O. The link between Industry 4.0 and lean manufacturing: Mapping current research and establishing a research agenda. Int. J. Prod. Res. 2018, 56, 2924–2940. [Google Scholar] [CrossRef]
  4. Shah, R.; Ward, P.T. Defining and developing measures of lean production. J. Oper. Manag. 2007, 25, 785. [Google Scholar] [CrossRef]
  5. Bhasin, S. Lean Management Beyond Manufacturing; Springer International Publishing AG: Cham, Switzerland, 2015. [Google Scholar]
  6. Seth, D.; Seth, N.; Dhariwal, P. Application of value stream mapping (VSM) for lean and cycle time reduction in complex production environments: A case study. Prod. Plan. Control 2017, 28, 398. [Google Scholar] [CrossRef]
  7. Womack, J.P.; Jones, D.T. Lean Thinking: Banish Waste and Create Wealth in Your Corporation; Simon & Schuster: London, UK, 2003. [Google Scholar]
  8. Hines, P.; Rich, N. The seven value stream mapping tools. Int. J. Oper. Prod. Manag. 1997, 17, 46. [Google Scholar] [CrossRef]
  9. Marodin, G.A.; Saurin, T.A.; Tortorella, G.L.; Denicol, J. How context factors influence lean production practices in manufacturing cells. Int. J. Adv. Manuf. Technol. 2015, 79, 1389. [Google Scholar] [CrossRef]
  10. Meudt, T.; Metternich, J.; Abele, J. Value stream mapping 4.0: Holistic examination of value stream and information logistics in production. CIRP Ann. Manuf. Technol. 2016, 66, 413. [Google Scholar] [CrossRef]
  11. Pereira, L.G.; Tortorella, G.L. A literature review on lean manufacturing in small manufacturing companies. In Progress in Lean Manufacturing; Davim, J.P., Ed.; Springer International Publishing AG: Cham, Switzerland, 2018; pp. 69–89. [Google Scholar]
  12. Zhuang, C.; Liu, J.; Xiong, H. Digital twin-based smart production management and control framework for the complex product assembly shop-floor. Int. J. Adv. Manuf. Technol. 2018, 96, 1149–1163. [Google Scholar] [CrossRef]
  13. Seth, D.; Gupta, V. Application of value stream mapping for lean operations and cycle time reduction: An Indian case study. Prod. Plan. Control 2005, 16, 44–59. [Google Scholar] [CrossRef]
  14. Reis, M.S.; Gins, G. Industrial process monitoring in the big data/industry 4.0 era: From detection, to diagnosis, to prognosis. Processes 2017, 5, 35. [Google Scholar] [CrossRef]
  15. Jasti, N.V.K.; Kodali, R. Lean production: Literature review and trends. Int. J. Prod. Res. 2015, 53, 867–885. [Google Scholar] [CrossRef]
  16. Dallasega, P.; Rauch, E.; Frosolini, M.A. Lean approach for real-time planning and monitoring in engineer-to-order construction projects. Buildings 2018, 8, 38. [Google Scholar] [CrossRef]
  17. Goti, A.; de la Calle, A.; Gil, M.J.; Errasti, A.; Bom, P.R.D.; García-Bringas, P. Development and application of an assessment complement for production system audits based on data quality, IT infrastructure, and sustainability. Sustainability 2018, 10, 4679. [Google Scholar] [CrossRef]
  18. Yin, D.; Ming, X. A modular approach for lean product Development (LPD) based on system engineering. In Product Lifecycle Management for Digital Transformation of Industries, Proceedings of the PLM 2016. IFIP Advances in Information and Communication Technology; Harik, R., Rivest, L., Bernard, A., Eynard, B., Bouras, A., Eds.; Springer: Cham, Switzerland, 2016; p. 492. [Google Scholar]
  19. Braglia, M.; Carmignani, G.; Zammori, F. A new value stream mapping approach for complex production systems. Int. J. Prod. Res. 2006, 44, 3929. [Google Scholar] [CrossRef]
  20. Gunduz, M.; Fahmi Naser, A. Cost based value stream mapping as a sustainable construction tool for underground pipeline construction projects. Sustainability 2017, 9, 2184. [Google Scholar] [CrossRef]
  21. Geissdoerfer, M.; Nancy, M.P.; Bocken, E.; Hultink, J. Design thinking to enhance the sustainable business modelling process—A workshop based on a value mapping process. J. Clean. Prod. 2016, 135, 1218. [Google Scholar] [CrossRef]
  22. Rother, M.; Shook, J. Learning to See: Value-Stream Mapping to Create Value and Eliminate Muda, Version 1.4; Lean Enterprise Institute: Boston, MA, USA, 1999. [Google Scholar]
  23. Heravi, G.; Firoozi, M. Production process improvement of buildings’ prefabricated steel frames using value stream mapping. Int. J. Adv. Manuf. Technol. 2017, 89, 3307. [Google Scholar] [CrossRef]
  24. Andreadis, E.; Garza-Reyes, J.A.; Kumar, V. Towards a conceptual framework for value stream mapping (VSM) implementation: An investigation of managerial factors. Int. J. Prod. Res. 2017, 28, 7073–7095. [Google Scholar] [CrossRef]
  25. Rother, M.; Shook, J. Learning to See: Value Stream Mapping to Add Value and Eliminate Muda, 2nd ed.; Lean Enterprise Institute: Boston, MA, USA, 1999. [Google Scholar]
  26. Tapping, D.; Shuker, T. Value Stream Management for the Lean Office; Productivity Press: New York, NY, USA, 2003. [Google Scholar]
  27. Mojarro-Magaña, M.; Olguín-Tiznado, J.E.; García-Alcaraz, J.L.; Camargo-Wilson, C.; López-Barreras, J.A.; Pérez-López, R.J. Impact of the planning from the kanban system on the company’s operating benefits. Sustainability 2018, 10, 2506. [Google Scholar] [CrossRef]
  28. Schönemann, M.; Schmidt, C.; Herrmann, C.; Thiede, S. Multi-level modelling and simulation of manufacturing systems for lightweight automotive components. Procedia CIRP 2016, 41, 1049. [Google Scholar] [CrossRef]
  29. González-Reséndiz, J.; Arredondo-Soto, K.C.; Realyvásquez-Vargas, A.; Híjar-Rivera, H.; Carrillo-Gutiérrez, T. Integrating simulation-based optimization for lean logistics: A case study. Appl. Sci. 2018, 8, 2448. [Google Scholar] [CrossRef]
  30. Yazdi, P.G.; Azizi, A.; Hashemipour, M. An empirical investigation of the relationship between overall equipment efficiency (OEE) and manufacturing sustainability in Industry 4.0 with time study approach. Sustainability 2018, 10, 3031. [Google Scholar] [CrossRef]
  31. Dreżewski, R.; Doroz, K. An agent-based co-evolutionary multi-objective algorithm for portfolio optimization. Symmetry 2017, 9, 168. [Google Scholar] [CrossRef]
  32. Chie, B.-T.; Chen, S.-H. Competition in a new industrial economy: Toward an agent-based economic model of modularity. Adm. Sci. 2014, 4, 192–218. [Google Scholar] [CrossRef]
  33. Marchetti, M.A.; François, G.; Faulwasser, T.; Bonvin, D. Modifier adaptation for real-time optimization—Methods and applications. Processes 2016, 4, 55. [Google Scholar] [CrossRef]
  34. Suhadaka, S.N.S.; Amit, N.; NazriAli, M. Facility layout for SME food industry via value stream mapping and simulation. Procedia Econ. Financ. 2015, 31, 797. [Google Scholar] [CrossRef]
  35. Subramanian, A.S.R.; Gundersen, T.; Adams, T.A. II. Modeling and simulation of energy systems: A review. Processes 2018, 6, 238. [Google Scholar] [CrossRef]
  36. Antonellia, D.; Stadnicka, D. Combining factory simulation with value stream mapping: A critical discussion. Procedia CIRP 2018, 67, 30. [Google Scholar] [CrossRef]
  37. Baysan, S.; Kabadurmus, O.; Cevikcan, E.; Satoglu, S.I.; Durmusoglu, M.B. A simulation-based methodology for the analysis of the effect of lean tools on energy efficiency: An application in power distribution industry. J. Clean. Prod. 2019, 211, 895. [Google Scholar] [CrossRef]
  38. Haba, S.A.; Oancea, G. Digital manufacturing of air-cooled single-cylinder engine block. Int. J. Adv. Manuf. Technol. 2015, 80, 747. [Google Scholar] [CrossRef]
  39. Negahban, A.; Smith, J.S. Simulation for manufacturing system design and operation: Literature review and analysis. J. Manuf. Syst. 2014, 33, 241. [Google Scholar] [CrossRef]
  40. Ding, Z.; Gong, W.; Li, S.; Wu, Z. System dynamics versus agent-based modeling: A review of complexity simulation in construction waste management. Sustainability 2018, 10, 2484. [Google Scholar] [CrossRef]
  41. Norton, K.-A.; Gong, C.; Jamalian, S.; Popel, A.S. Multiscale agent-based and hybrid modeling of the tumor immune microenvironment. Processes 2019, 7, 37. [Google Scholar] [CrossRef]
  42. Chamoso, P.; Rodríguez, S.; García-Ortiz, L.; Corchado, J.M. Information extraction from retinal images with agent-based technology. Processes 2018, 6, 254. [Google Scholar] [CrossRef]
  43. Cocco, L.; Tonelli, R.; Marchesi, M. An agent based model to analyze the bitcoin mining activity and a comparison with the gold mining industry. Future Internet 2019, 11, 8. [Google Scholar] [CrossRef]
  44. Thang, X.-J.; Tang, Y.; Xiong, J.; Wang, W.-J.; Zhang, Y.-C. Dynamics of cooperation in minority games in alliance networks. Sustainability 2018, 10, 4746. [Google Scholar] [CrossRef]
  45. Borshchev, A.; Filippov, A. From system dynamics and discrete event to practical agent based modeling: Reasons, techniques, tools. In Proceedings of the 22nd International Conference of the System Dynamics Society, Oxford, UK, 25–29 July 2004. [Google Scholar]
  46. Meng, Q.; Zhu, H.; Li, Z.; Du, J.; Wang, X.; Kim, M.J. How green building product decisions from Customers can be transitioned to manufacturers: An agent-based model. Sustainability 2018, 10, 3977. [Google Scholar] [CrossRef]
  47. Ruiz, N.; Giret, A.; Botti, V.; Feria, V. An intelligent simulation environment for manufacturing systems. Comput. Ind. Eng. 2014, 76, 148. [Google Scholar] [CrossRef]
  48. Heydaryan, S.; Bedolla, J.S.; Belingardi, G. Safety design and development of a human-robot collaboration assembly process in the automotive industry. Appl. Sci. 2018, 8, 344. [Google Scholar] [CrossRef]
  49. Kokareva, V.V.; Malyhin, A.N.; Smelov, V.G. Production processes management by simulation in tecnomatix plant simulation. Appl. Mech. Mater. 2015, 756, 604. [Google Scholar] [CrossRef]
  50. Fiľo, M.; Markovič, J.; Kliment, M.; Trebuňa, P. PLM systems and tecnomatix plant simulation, a description of the environment, control elements, creation simulations and models. Am. J. Mech. Eng. 2013, 1, 165–168. [Google Scholar] [CrossRef]
  51. Siderska, I. Application of tecnomatix plant simulation for modeling production and logistics processes. Bus. Manag. Educ. 2016, 1, 64. [Google Scholar] [CrossRef]
  52. Lu, M.; Wong, L.-C. Comparison of two simulation methodologies in modeling construction systems: Manufacturing-oriented PROMODEL vs. construction-oriented SDESA. Autom. Constr. 2007, 16, 86. [Google Scholar] [CrossRef]
  53. Goodall, P.; Sharpe, R.; West, A. A data-driven simulation to support remanufacturing operations. Comput. Ind. 2019, 105, 48. [Google Scholar] [CrossRef]
  54. Schwab, L.; Gold, S.; Reiner, G. Exploring financial sustainability of SMEs during periods of production growth: A simulation study. Int. J. Prod. Econ. 2018. [Google Scholar] [CrossRef]
  55. Zhang, L.; Li, N.; Jiang, Z.; Fang, F.; Anumba, C. An agent-based modeling approach for understanding the effect of worker-management interactions on construction workers’ safety-related behaviors. Autom. Constr. 2019, 97, 29. [Google Scholar] [CrossRef]
  56. Ohab-Yazdi, S.A.; Ahmadi, A. Using the agent-based model to simulate and evaluate the interaction effects of agent behaviors on groundwater resources, a case study of a sub-basin in the Zayandehroud River basin. Simul. Model. Pract. Theory 2018, 87, 274. [Google Scholar] [CrossRef]
  57. Anylogic. Available online: https://www.anylogic.com (accessed on 5 June 2017).
  58. Ivanov, D. Supply chain simulation and optimization with any logistix: Teaching notes; Berlin School of Economics and Law: Berlin, Germany, 2017. [Google Scholar]
  59. Oliveira, J.B.; Jin, M.; Lima, R.S.; Kobza, J.E.; Montevechi, J.A.B. The role of simulation and optimization methods in supply chain risk management: Performance and review standpoints. Simul. Model. Pract. Theory 2019, 92, 17. [Google Scholar] [CrossRef]
  60. 7 Measures of Performance in Lean KPI Tool. Available online: https:// https://www.adaptivebms.com/tools/ (accessed on 30 June 2018).
  61. Mourtzis, D.; Fotia, S.; Vlachou, E. A lean PSS design and evaluation framework supported by KPI monitoring and context sensitivity tools. Int. J. Adv. Manuf. Technol. 2018, 94, 1623. [Google Scholar] [CrossRef]
  62. Barber, C.; Tietje, B. A research agenda for value stream mapping the sales process. J. Pers. Sell. Sales Manag. 2013, 28, 155. [Google Scholar] [CrossRef]
  63. Atieh, A.M.; Kaylani, H.; Almuhtady, A.; Al-Tamimi, A. A value stream mapping and simulation hybrid approach: Application to glass industry. Int. J. Adv. Manuf. Technol. 2016, 84, 1573. [Google Scholar] [CrossRef]
  64. Stadnicka, D.; Chandima, R.M. Enhancing performance in service organizations: A case study based on value stream analysis in the telecommunications industry. Int. J. Prod. Res. 2017, 55, 6984–6999. [Google Scholar] [CrossRef]
  65. Carmignani, G. Scrap value stream mapping (S-VSM): A new approach to improve the supply scrap management process. Int. J. Prod. Res. 2017, 55, 3559. [Google Scholar] [CrossRef]
  66. Shou, W.J.; Wang, P.W.; Wang, X.; Chong, H.Y. A cross-sector review on the use of value stream mapping. Int. J. Prod. Res. 2017, 55, 3906. [Google Scholar] [CrossRef]
  67. Marodin, G.A.; Saurin, T.A. Implementing lean production systems: Research areas and opportunities for future studies. Int. J. Prod. Res. 2013, 51, 6663. [Google Scholar] [CrossRef]
  68. Cherrafi, A.; Elfezazi, S.; Chiarini, A.; Mokhlis, A.; Benhida, K. The integration of lean manufacturing, six sigma and sustainability: A literature review and future research directions for developing a specific model. J. Clean. Prod. 2016, 139, 828. [Google Scholar] [CrossRef]
  69. Toivonen, T.; Siitonen, J. Value stream analysis for complex processes and systems. Procedia CIRP 2016, 39, 9. [Google Scholar] [CrossRef]
  70. Flatscher, M.; Riel, A. Stakeholder integration for the successful product–process co-design for next-generation manufacturing technologies. Cirp Ann. 2016, 65, 181. [Google Scholar] [CrossRef]
Figure 1. AnyLogic project (a) Design of agent; (b) Design of view areas.
Processes 07 00082 g001
Figure 2. Model graphics
Processes 07 00082 g002
Figure 3. Logic model for work in process part storage (storeWIP), moving and processing (repeated for each workstation).
Processes 07 00082 g003
Figure 4. AnyLogic project (a) Object design; (b) Time information in the database.
Processes 07 00082 g004
Figure 5. Final product (a) General view; (b) A constructive variant.
Processes 07 00082 g005
Figure 6. Simulation results of current situation: (a) Loading degree (per a workstation); (b) Loading degree per all the workstations; (c) Evolution of the number of processed part; (d) Evolution of the finished part.
Processes 07 00082 g006
Figure 7. Simulation results of target situation: (a) Loading degree (per workstation); (b) Loading degree per all the workstations; (c) Evolution of the number of processed parts; (d) Evolution of the finished part.
Processes 07 00082 g007
Table 1. Evaluation of Lean performance using KPI, KPI: key performance indicators.
KPISymbolShort description
Overall Equipment EffectivenessOEEgeneral effectiveness of equipment uses
People ProductivityPPratio between the number of good units made and the number of direct operator hours it takes to make those units
Value Added Per PersonVAPPnumber of direct people involved in the conversion process to add value to the product
Not Right First TimeNRFTnumber de defective units per million
Delivery Schedule AchievementDSAit measures the quantitatively and timely correct delivery of goods ordered by the customer and promised to be delivered
Floor Space UtilisationFSUsales revenue generated per square meter of factory floor space
Stock TurnsSTspeed of inventory rotation
Table 2. Parts and client target takt time for 367 parts/day, measured for 20 days.
Damper typePercentNo. of good partsScrapTotalUM
Adjustable damper98.92%724677253(parts)
Locking damper1.08%76379(parts)
Non-adjustable damper0.00%000(parts)
100.00%7322107332(parts)
Loading degree100%75%
Client Takt target78.6 (s/parts)58.9 (s/parts)
Table 3. Workcenter description.
Work centerWork center descriptionWork centerWork center description
1O1. Checking piston rod4O4. Rod assembly–piston
2O2.1. Component preassembly–A15O5. Basic components assembly
2O2.2. Component preassembly–A26O6. Flaring
2O2.3. Component preassembly–A37O7. Adjustment lever assembly–serious checking
3O3. Piston rod assembly–connecting ring8O8. Final assembly–packing
Table 5. Key performance indicators (KPI) for simulated scenario.
KPIValue before VSMValue after VSM
PP (%)61.1691.66
VAPP (Euro/employees)203.9275
FSU (Euro/m2)30.645.8
Table 4. Degree of loading per operator.
Work CenterCycle time (s)No. of parts (products/day)Degree of loading per operator (%)Current no. of operators/shiftForecast (parts/week)Forecast (parts/day)
119.736725.11.002750550
26.83678.70.332750550
28.936711.30.332750550
225.536732.50.332750550
342.636754.31.002750550
47036789.21.332750550
525.536732.50.332750550
622.536728.70.332750550
725.536732.51.002750550
84536757.31.002750550
2927.00

