Article

Knowledge Mapping of Carbon Footprint Research in a LCA Perspective: A Visual Analysis Using CiteSpace

1
School of Public Economics and Administration, Shanghai University of Finance and Economics, Shanghai 200433, China
2
School of Information Engineering, Jiangsu Open University, Nanjing 210017, China
3
School of Humanities, Shanghai University of Finance and Economics, Shanghai 200433, China
*
Authors to whom correspondence should be addressed.
These two authors contributed equally to this work.
Processes 2019, 7(11), 818; https://doi.org/10.3390/pr7110818
Submission received: 26 August 2019 / Revised: 10 October 2019 / Accepted: 29 October 2019 / Published: 5 November 2019
(This article belongs to the Special Issue Gas, Water and Solid Waste Treatment Technology)

Abstract

:
Carbon emissions are inevitably linked to lifestyle and consumption behaviours, and the concept of “carbon footprinting” is now well-recognised beyond academia. Life cycle assessment (LCA) is one of the primary tools for assessing carbon footprints. The aim of this paper is to present a systematic review of literatures focusing on carbon footprint calculated with life cycle assessment. We used CiteSpace software to draw the knowledge map of related research to identify and trace the knowledge base and frontier terminology. It was found that the LCA application in respects of carbon footprint studies was completed mainly for the following aspect: beef production and dairy industry, seafood and fishery, nutrition, urban structure and energy use. The CiteSpace analysis showed the development path of the above aspects, for example, beef production and dairy industry has been a long-term topic in this kind of research, while the topic of nutrition appeared in recent years. There was also a cluster of literature discussing footprint evaluation tools, such as comparing LCA with input–output analysis. The CiteSpace analysis indicated that earlier methodological literature still plays an important role in recent research. Moreover, through the analysis of burst keywords, it was found that agriculture productions (dairy, meat, fish, crop) as well as global climate issues (greenhouse gases emission, global warming potential) have always been the areas of concern, which matches the result of co-citation analysis. Building materials (low-carbon building, natural buildings, sustainable buildings) and soil issues (soil carbon sequestration, soil organic carbon) are the topics of recent concern, which could arouse the attention of follower-up researchers.

1. Introduction

Greenhouse gas emissions have been an environmental issue of great concern in the past two decades. According to the Intergovernmental Panel on Climate Change (IPCC) report, without action, the global temperature will rise by more than 1.5 °C in the future, while in the past 10,000 years, the climate change was only 1 °C [1]. The emergence of the carbon footprint concept facilitates the measurement of greenhouse gas emissions. The term “carbon footprint” evolved from the ecological footprint proposed by Wackernagel in 1996 [2]. It is a concept formed by the integration of ecological footprint and carbon emissions. With the deepening of the global division of labour and the complexity of the commodity supply chain, the assessment of the environmental impact of modern economic activities has become more complicated. The unique advantages of life cycle assessment (LCA) as a “cradle-to-grave” measurement method are taken seriously by researchers. The concept of the carbon footprint involves the carbon emissions throughout all the stages of a product’s life, which is similar to the core idea of the LCA approach. The combination of the two can be an effective tool for measuring the environmental impact of economic activities. When discussing the relationship between carbon footprint and LCA, carbon footprint can be regarded as either a carbon emission measurement method or a result calculated by this method. When it is regarded as a carbon emission measurement method, the relationship between carbon footprint and LCA can be regarded as a subordinate relationship between measurement methods. It is the application of LCA with a single impact category (climate change). When it is considered as a result of calculation, it can be measured by carbon inventory methods (this method uses the corresponding emission factors to calculate the emissions of various greenhouse gases based on the guidelines for national greenhouse gas inventories compiled by IPCC) [3], input–output method (IOA is a “from top to bottom” analysis method, which reflects the relationship between initial input, intermediate input, total input and intermediate output, final output and total output. It transforms the economic relationship between production sectors or regions into the physical relationship of greenhouse gas emissions, which clearly reflects the exchange process of emissions and distributes them to various sectors or regions, thus making the direct and indirect carbon emission relationship clear) [4] and the LCA method. The relationship between carbon footprint and LCA is the relationship between measurement results and methods. In this paper, the concept of “carbon footprint” is regarded as the measurement result, and the related literature of “carbon footprint” micro-measurement is concerned, that is, carbon footprint research from the perspective of LCA.
Some progress has been made by researchers in this field. The related literature has reviewed this topic from various perspectives such as the expansion of the carbon footprint concept and the application of LCA in earlier literature, city carbon emission [5], diet carbon footprint [6] and the re-examination of LCA [7] in recent literature. Few studies have adopted a knowledge map to carry out a visual analysis of the intellectual structure of the related fields, but a knowledge map is beneficial for showing where knowledge can be found within a group or organization, and how to find those with the most expertise. Specifically, a knowledge map is an emerging bibliometric tool, which can provide a visual knowledge graph of the existing literature and a serialized knowledge spectrum [8]. CiteSpace, a relatively widely used bibliometric tool based on network theory, is a Java application which provides a variety of analysis methods such as co-citation analysis, keyword co-occurrence analysis and collaboration network analysis. Therefore, we utilized this software to visualize the existing literature on carbon footprint research in a LCA perspective, and explored the intellectual structure of this field and its possible development trend by focusing on the scope, core literature, collaboration network and research front.
The rest of this paper is organized in four sections. Section 2 describes the data collection process and illustrates the result of basic analysis. Section 3 establishes the disciplines and terms network, co-citation network and collaboration network to show intellectual structure of the focus topic. Section 4 gives a document co-citation network and keyword co-occurrence network based on the results of Section 3 to analyse the emerging trends of focus topic. In the last section, the key findings are summarized and discussed to implicate further study on carbon footprint in a LCA perspective.

2. Data Collection and Basic Analysis

The literature analysed in this paper is from the core collection of Web of Science, including SCI-EXPANDED and SSCI. In the process of retrieval, we searched the “Article” category published in English by retrieving the keyword “carbon footprint”, “carbon footprints” or “carbon footprinting”, and a total of 6180 papers were identified with their published time ranging from 2003 to 2019. Then we narrowed the results by retrieving the above keywords separately together with “life cycle assessment” or “LCA”, and 1563 papers were identified with their published time ranging from 2006 to 2019 (retrieval on 9 June 2019). The year-by-year distribution of these papers is shown in Figure 1.
Figure 1 shows the number of papers published in corresponding years. The sample literature had an explosive growth in 2008, after which it entered a stage of rapid development. With regard to the relative number, the increase of papers in 2008 compared to a past year reached 500%, and the growth rate (compared to a past year) exceeded 100% (183.33% and 123.53% respectively) in both 2009 and 2010 as well, after which the growth slowed down. In terms of the absolute number, papers had a double-digit growth per year from 2009; the top five countries/regions were the USA (340), People’s Republic of China (PRC) (177), Italy (159), Spain (148) and England (137) (counting first and co-authors); the top five journals were Journal of Cleaner Production (375), International Journal of Life Cycle Assessment (125), Science of the Total Environment (66), Sustainability (64) and Journal of Industrial Ecology (52); the top five authors were VAZQUEZ-ROWE I (18), KUCUKVAR M (18), TATARI O (13), FEIJOO G (13) and HERTWICH EG (13).

3. The Intellectual Structure of the Focus Topic (Carbon Footprint Research in a LCA Perspective)

This paper focuses on the analysis of TYPE II papers through the bibliometric method. The scientometric software, CiteSpace, was utilized to describe the intelligent structure of the focus topic. Firstly, we constructed a subject categories co-occurrence network to identify the fields and research contents involved in the focus topic. Secondly, a co-citation network was established to analyse the features of clusters. Finally, we built a collaboration network to analyse the partnerships between the source regions, institutions and authors.

3.1. The Disciplines and Terms Network Based on the Focus Topic

3.1.1. Noun Term Co-Occurrence Network

Noun term co-occurrence analysis refers to the extraction of noun terms from the titles, keywords and abstracts of the sample papers and the construction of a noun term network for literature analysis in accordance with the criterion that two noun terms are adopted in the same document. When two noun terms appear in the same paper, it is considered that there is a non-negligible relationship between the two terms [9]. The noun term network can display hot topics and topic distribution of a discipline.
We used Citespace to construct the noun term network. Citespace uses three technology means to simplify the process of calculation during the process of network generation. Firstly, Citespace uses the idea of divide-and-conquer algorithms to separate the whole co-citation network into individual networks which are called time slices at the first stage, and integrate them at the second stage after some treatments. In the construction of noun term co-occurrence network, the whole network was divided into 14 individual networks from 2006 to 2019. Secondly, Citespace provides two main criteria to filter data in individual network—citation threshold and the rank of being cited. In the construction of the noun term co-occurrence network, this paper used citation threshold. It contains three specific criteria—citation quantity, together with co-citation frequency and co-citation coefficient (c, cc and ccv) and the selected articles were above the threshold on these indicators. The threshold was set as (2,3,15), (3,3,20), (3,3,20) at three levels in chronological order to form the noun term co-occurrence network, and the rest was determined by linear interpolation. This paper used the criterion of the rank of being cited in later sections as well. Thirdly, Citespace provides minimum spanning tree mode and pathfinder mode to prune the network to highlight the key points. In noun term co-occurrence network, this paper used the minimum spanning tree mode [10].
Next, we extracted noun terms from the sample papers and merged those with the same meaning in the network (singular and plural forms, abbreviation and full name, etc.) to construct a noun term network as shown in the upper right corner of Figure 2. The connections in the network illustrate which words often appear together in the same paper, such as the connections between LCA and terms like climate change and global warm as shown in Figure 2. Table 1 reveals the 12 words with the highest frequency in the network, demonstrating that environmental impact was the most concerned topic in the field, which may be explained by considering that LCA was used to evaluate the environmental impact of carbon footprint. These high-frequency noun terms first appeared between 2008 and 2011 during which the field experienced an explosive development, which is consistent with the previous analysis. For more detailed analysis, we set the thresholding (c, cc, ccv) parameter as (10,10,15), (10,10,20) and (10,10,20) to extract the noun terms in the relatively more important co-cited literature and drew a network diagram, as shown in Figure 3. The font size in Figure 3 represents the frequency of occurrence of noun terms and the node size the centrality of noun terms, which means that when the font size is bigger, the noun term appears more frequently and the square of the yellow box is lager, the centrality of noun term is higher. The centrality measures the number of links between focus noun term and other noun terms, which shows the power of the focus noun term in network, and nodes with higher centrality are called hub nodes. For example, environmental impact not only appeared frequently, but also had high centrality in the network, which implied that environmental impact was a term related to many issues of the focus topic. It can also be understood that the focus topic was about the environmental impact. In addition, greenhouse gas emissions, climate change, global warming and supply chain were also important noun terms.

3.1.2. Subject Categories Co-Occurrence Network

The text file provided by Web of Science contains a Subject Categories (SC) field which represents the name of the discipline to which the included documents belong, and each paper is assigned to one or more such names. This information can be used to analyse which subjects are covered by the literature on carbon footprint assessment in a LCA perspective.
Under the same parameter setting as that of the noun term co-occurrence network, a subject categories network as shown in Figure 4 was constructed. The size of node represents the occurrence number, which means that when the node radius is larger the subject category contains more sample papers, and the several biggest nodes are called landmark nodes. A node with a purple ring is called a pivot node which owns higher value of betweenness centrality. Betweenness centrality is an index to measure the sum of probability of the focus to be on an arbitrary shortest path in a network, which shows the importance of the focus node as a bridge role. As we can see from Figure 4, Environmental Science and Ecology is the most common subject category to which the sample literature belongs, followed by Engineering, Green and Sustainable Science and Technology and Energy and Fuels. Food Science and Technology is a subject category with high centrality. That is to say, the sample papers often contain interdisciplinary contents of these disciplines and other disciplines. The thickness and colour of lines which link two nodes make sense as well. The thicker the line, the deeper the relationship between the two categories, and the darker the line, the earlier the relationship between the two categories is established. Figure 4 illustrates that Environmental Sciences and Ecology has a deep and long-time relationship between Business and Economics.

3.2. The Co-Citation Network based on the Focus Topic

3.2.1. Document Co-Citation Network

Co-citation refers to the relationship between two documents cited by the same later paper. The co-citation relationships between a series of documents form a document co-citation network. Such a network is a useful tool for document analysis, which can provide clues for understanding literature development and is more reliable than simple analysis of citation relationships [11]. We put two years per slice, selected the top 50 levels of the most cited references from each slice and used pathfinder to prune (set as base settings), and then got document co-citation network with clusters shown in Figure 5. As shown in Figure 5, Finnveden [12], Vries [13], Weidema et al. [14], Finkbeiner [15] and Roy [16] have higher centrality. Finnveden [12], Vries [13] and Roy [16] discussed the LCA approach. Finkbeiner [15] deepened the field’s understanding of “carbon footprint”. Weidema et al. [14] analysed the relationship between “carbon footprint” and “LCA”. These documents have been cited together with many different documents and have become the basic literature in the field.
The top 10 most frequently cited documents related to the focus topic are shown in Table 2. The most frequently cited one is International Organization for Standardization (ISO) [17], which provides the international standard for the LCA approach. Since then, LCA has been widely used in the measurement of carbon footprint and all later sample documents have cited ISO [17]. The far-reaching impact of ISO [17] on the subsequent literature can be seen more clearly in Figure 6. The sample documents from 2008 to 2011 were cited relatively frequently, and eight of the top 10 most frequently cited were published during this period. This shows that the literature had experienced an explosive growth in quantity during this period, providing a solid foundation for future research in this field.
References with top cited frequency after ISO [17] can be simply divided into three categories: the research focusing on carbon footprint, LCA and their relationship. The first category includes Hertwich et al. [18], Flysjo et al. [19], Finkbeiner [15] and Galli [20] et al. Hertwich et al. [18] discussed the quantification of greenhouse gas emissions associated with the final consumption of goods and services in 73 countries of 14 regions from a global trade perspective. The analysis indicated that food accounts for 20% of greenhouse gas emissions, the operation and maintenance of residential areas 19% and transportation 17%. Food and services are more important in developing countries, while transportation and food products are growing rapidly with increasing income and are dominant in developed countries. Flysjo et al. [19] adopted the LCA approach to analyse the carbon footprint of dairy production by two different farm systems in New Zealand and Sweden. Finkbeiner [15] explored the significance of discussing the concept of carbon footprint, pointing out that it is not without limitations (even pollution treatment will produce carbon emissions), and then summarized the opportunities and challenges in the relevant research. Galli et al. [20] extended the concept of carbon footprint to ecological, carbon and water footprint, and analysed the similarities and differences between the three, thus defining the concept of “footprint family” and developing an integrated Footprint approach to assess the environmental impact of human behaviours; the second category includes Finnveden et al. [12], Vries et al. [13], Roy et al. [16], etc. Finnveden et al. [12] and Vries et al. [13] are highly cited documents after ISO [17]. Both review the LCA approach and Finnveden et al. [12] is more comprehensive, while Vries et al. [13] only reviews the literature on livestock products. Roy et al. [16] also reviewed the LCA approach, focusing on the topic of food products; the third category includes Weidema et al. [14], Rotz et al. [21], etc. Weidema et al. [14] discussed whether the emergence of the carbon footprint concept would facilitate the development of the LCA approach. He believed that the concept of carbon footprint made the measurement easier and simpler to master than the traditional LCA approach. Therefore, it is very suitable for governments to show consumers the environmental impact of their consumption, which explains that the concept of carbon footprint promotes the application of the LCA approach. Rotz et al. [21] introduced the Dairy Greenhouse Gas model and discussed the specific application of the partial life cycle assessment in the carbon footprint of dairy production systems.
As discussed above, the basic documents in the field has contributed mainly to literature review and definition. Next, we performed cluster analysis on the sample references and the major clusters are shown in Table 3. The second column is the cluster size and the third column the Silhouette index, which is used to measure the cluster quality and ranges from 0 to 1. The closer the index is to 1, the better the cluster quality. The Silhouette scores of all the clusters in Table 3 are above 0.7, indicating that the cluster quality was good. The fourth to sixth columns are cluster labels extracted from abstracts via the LSI, LLR, and MI methods respectively [22]. It can be seen that the most concerned topics in the sample literature were the carbon footprint assessment related to beef production, dairy industry and fishery (cluster#0, cluster#1, cluster#2), as well as urban systems and grain system (cluster#7, cluster#8), based on which other factors in the environment (cluster#4, cluster#5) were discussed in the references. In addition, the literature related to the carbon footprint measurement (cluster#3) and the carbon footprint warning mechanism (cluster#6) also formed clusters.

3.2.2. Author Co-Citation Network

The document co-citation lays a foundation for the analysis of the author co-citation and the journal co-citation relationships. We put one year per slice, selected the top 50 levels of the most cited references from each slice with no pruning, and established the author co-citation network. The network contained 269 authors, among who there were 1116 co-citation relationships. As can be seen from Figure A1 of Appendix A and Table 4, group authors also provided important cited literature for the field. As analysed above, the document published by ISO that provided the LCA standard is a reference a researcher much read if they study this field, and ISO has become the most important group author. In addition, IPCC has also contributed to the research in this field. For instance, it published “The IPCC Guidelines for National Greenhouse Gas Inventories”. Food and Agriculture Organization of the United Nations (FAO), European Commission (EC), British Standards Institution (BSI) are other important group authors. Ecoinvent provides important data resources for the research in this field.
The cited frequency of some group authors was high and that of personal authors on average was not low. The citation count of each of the top 10 cited individuals was more than 100. As shown in Table 5, only C. Cederberg, E.G. Hertwich and I. Vazquez-rowe were among the top 20 personal authors in terms of the number of published papers and citations. The rest of the highly cited authors were widely recognized in the field for one or two high-quality papers. For example, B.P. Weidema, R. Frischknecht and S. Suh became highly cited authors because of the co-authored paper, “Life Cycle Assessment: Part 1: Framework, Goal and Scope Definition, Inventory Analysis, and Applications”, which was published in Environment International. In addition, the key papers of the top five highly cited authors focus on methods, including those by B.P. Weidema and R. Frischknecht, and T. Wiedmann’s “A Review of Recent Multi-Region Input–Output Models Used for Consumption-Based Emission and Resource Accounting”, J.B. Guinee’s “Handbook on Life Cycle Assessment Operational Guide to the ISO Standards”, and M. Lenzen’s “System Boundary Selection in Life-Cycle Inventories Using Hybrid Approaches”.

3.2.3. Journal Co-Citation Network

We set the same parameters as those of the author co-citation network to build a journal co-citation network, in which there were 169 journals and 635 connections. As shown in Figure A2 of Appendix A and Table 6, the most cited journal was Journal of Cleaner Production (1135 citations), which also had a high degree of centrality (0.14). Environmental Science and Technology and Science of the Total Environment were also with high citations and centrality. The second most cited was the International Journal of Life Cycle Assessment with 1037 citations, but its centrality in the network was not high (0.09). That is to say, its co-citations with other journals was relatively low. From the basic analysis, Journal of Cleaner Production, International Journal of Life Cycle Assessment, Science of the Total Environment and Journal of Industrial Ecology were not only the journals with the most publications, but also the most cited ones. In addition, they were the major journals in which papers on the focused topic were published. Table 6 also illustrates the impact factor of each journal in 2018. According to Table 6, journals with higher impact factor were usually those with high citations and centrality in the focus topic. Only Renewable and Sustainable Energy Reviews in Table 6 did not comply with this rule, which may be due to the deviation caused by the time factor.

3.3. The Collaboration Network Based on the Focus Topic

3.3.1. Country Collaboration Network

The collaboration network was analysed at the macroscopic, midscopic and microscopic level, corresponding to the collaborations between countries/regions, institutions and authors respectively. The collaboration between countries was first analysed. We put one year per slice, selected the top 100 levels of the most cited references from each slice with no pruning, and obtained the following country/region collaboration network, where there were 51 countries/regions and 263 connections. We used authors’ affiliation to determine countries associated with the analysed papers. For example, a 2014 article, entitled “Emerging approaches, challenges and opportunities in life cycle assessment”, is an international multi-authors publication, and has co-authors from Switzerland and France respectively, a link has been established between the two countries in country collaboration network and the geographical scope of analysed paper is determined as both Switzerland and France. If two authors of an analysis paper come from the same country, the occurred frequency of the country is recorded twice in Table 7, which means that the unit of measurement of Table 7 is person–time. USA was exceptionally outstanding in the network in that it not only had the largest number of publications (340), but also had actively participated in the collaborations with various countries/regions, thus becoming the node with the highest centrality in the network (the centrality was 0.44). PRC was the only Asian country among the top 10 with the largest number of publications. Although PRC ranked second in terms of the number of publications, its absolute number was only about half of the USA, and its centrality was only 0.1 without so many partners. Referring to the year–colour correspondence bar in Figure A6 of Appendix A, the circle/figure refers to the colour of circle in Figure A3 of Appendix A and represents the corresponding year in which sample literature appeared. It can be seen in Figure A3 that USA was among the first counties/regions to study the carbon footprint in a LCA perspective, and the lighter colour of PRC’s circle indicates that it entered the field later. Australia and Canada ranked sixth and tenth respectively in term of publication number, and were also countries with a large number of publications but low centrality. The rest of the top 10 countries were in Europe, including England, Italy, Spain, Netherlands, Germany, Sweden. This may be because Europe has developed animal husbandry, which makes scholars pay more attention to carbon emissions. Most European countries were similar to the USA in that they had a large number of publications and collaborated with different nodes in the network and their centrality was higher. For example, England published 137 papers and its centrality was 0.31.

3.3.2. Institution Collaboration Network

We set the same parameters as those of the country/region collaboration network to build an institution collaboration network, which contained 274 institutions and 372 connections. Taking into consideration the number of publications and centrality, we identified four representative institutions, namely Chinese Academy of Sciences (29), University of Santiago de Compostela (28), Aarhus University (27) and Wageningen University (19). However, they did not have direct cooperation with each other. Instead, four sub-networks of institution collaboration were formed with each of them as the centre. Tech Univ Denmark had direct cooperation with Chinese Academy of Sciences and Aarhus University, thus becoming a more important part of the institution collaboration network. University of Central Florida, despite being among the top five institutions with the largest number of publications, had only cooperated with six institutions. Therefore, it was not deeply integrated with the institution collaboration network. In general, the network was relatively loose and the research community less mature.

3.3.3. Author Collaboration Network

We set the same parameters as those of the country/region network to build an author collaboration network, where there were 380 authors and 507 connections. Among them, VAZQUEZ-ROWE I and KUCUKVAR M were the two authors who published the largest number of papers. From 2006 to the present, the average number of publications per year on the focus topic was more than one. The two authors were from University of Santiago de Compostela and University of Central Florida, both of which were among the top five research institutions. Similar to the institution collaboration network, the structure of the author cooperation network was also loose, as indicated by the centrality in Table 8 and shown in Figure A4 of Appendix A. As shown in Table 9 and Figure A5 of Appendix A, there were only three large sub-networks, namely the sub-network centred on VAZQUEZ-ROWE I, FEIJOO G and MOREIRA MT, the one centred on KUCUKVAR M, TATARI O and EGILMEZ G and the one with CEDERBERG C and DE BOER IJM as the important nodes. Some authors published more papers, although they cooperated less with others, such as KENDALL A, HEIJUNGS R, etc.

4. The Emerging Trends of Carbon Footprint Research in a LCA Perspective

This paper analysed the emerging trends of the focus topic from the document co-citation and keyword co-occurrence perspectives. First, we reorganized the document co-citation network in Section 3 from the perspective of timeline to analyse the clusters and bursts of documents. Second, we established a keyword co-occurrence network based on the disciplines and terms network in Section 3 from the perspective of time-zone to analyse the bursts and development trend of keywords.

4.1. References Analysis with Citation Bursts

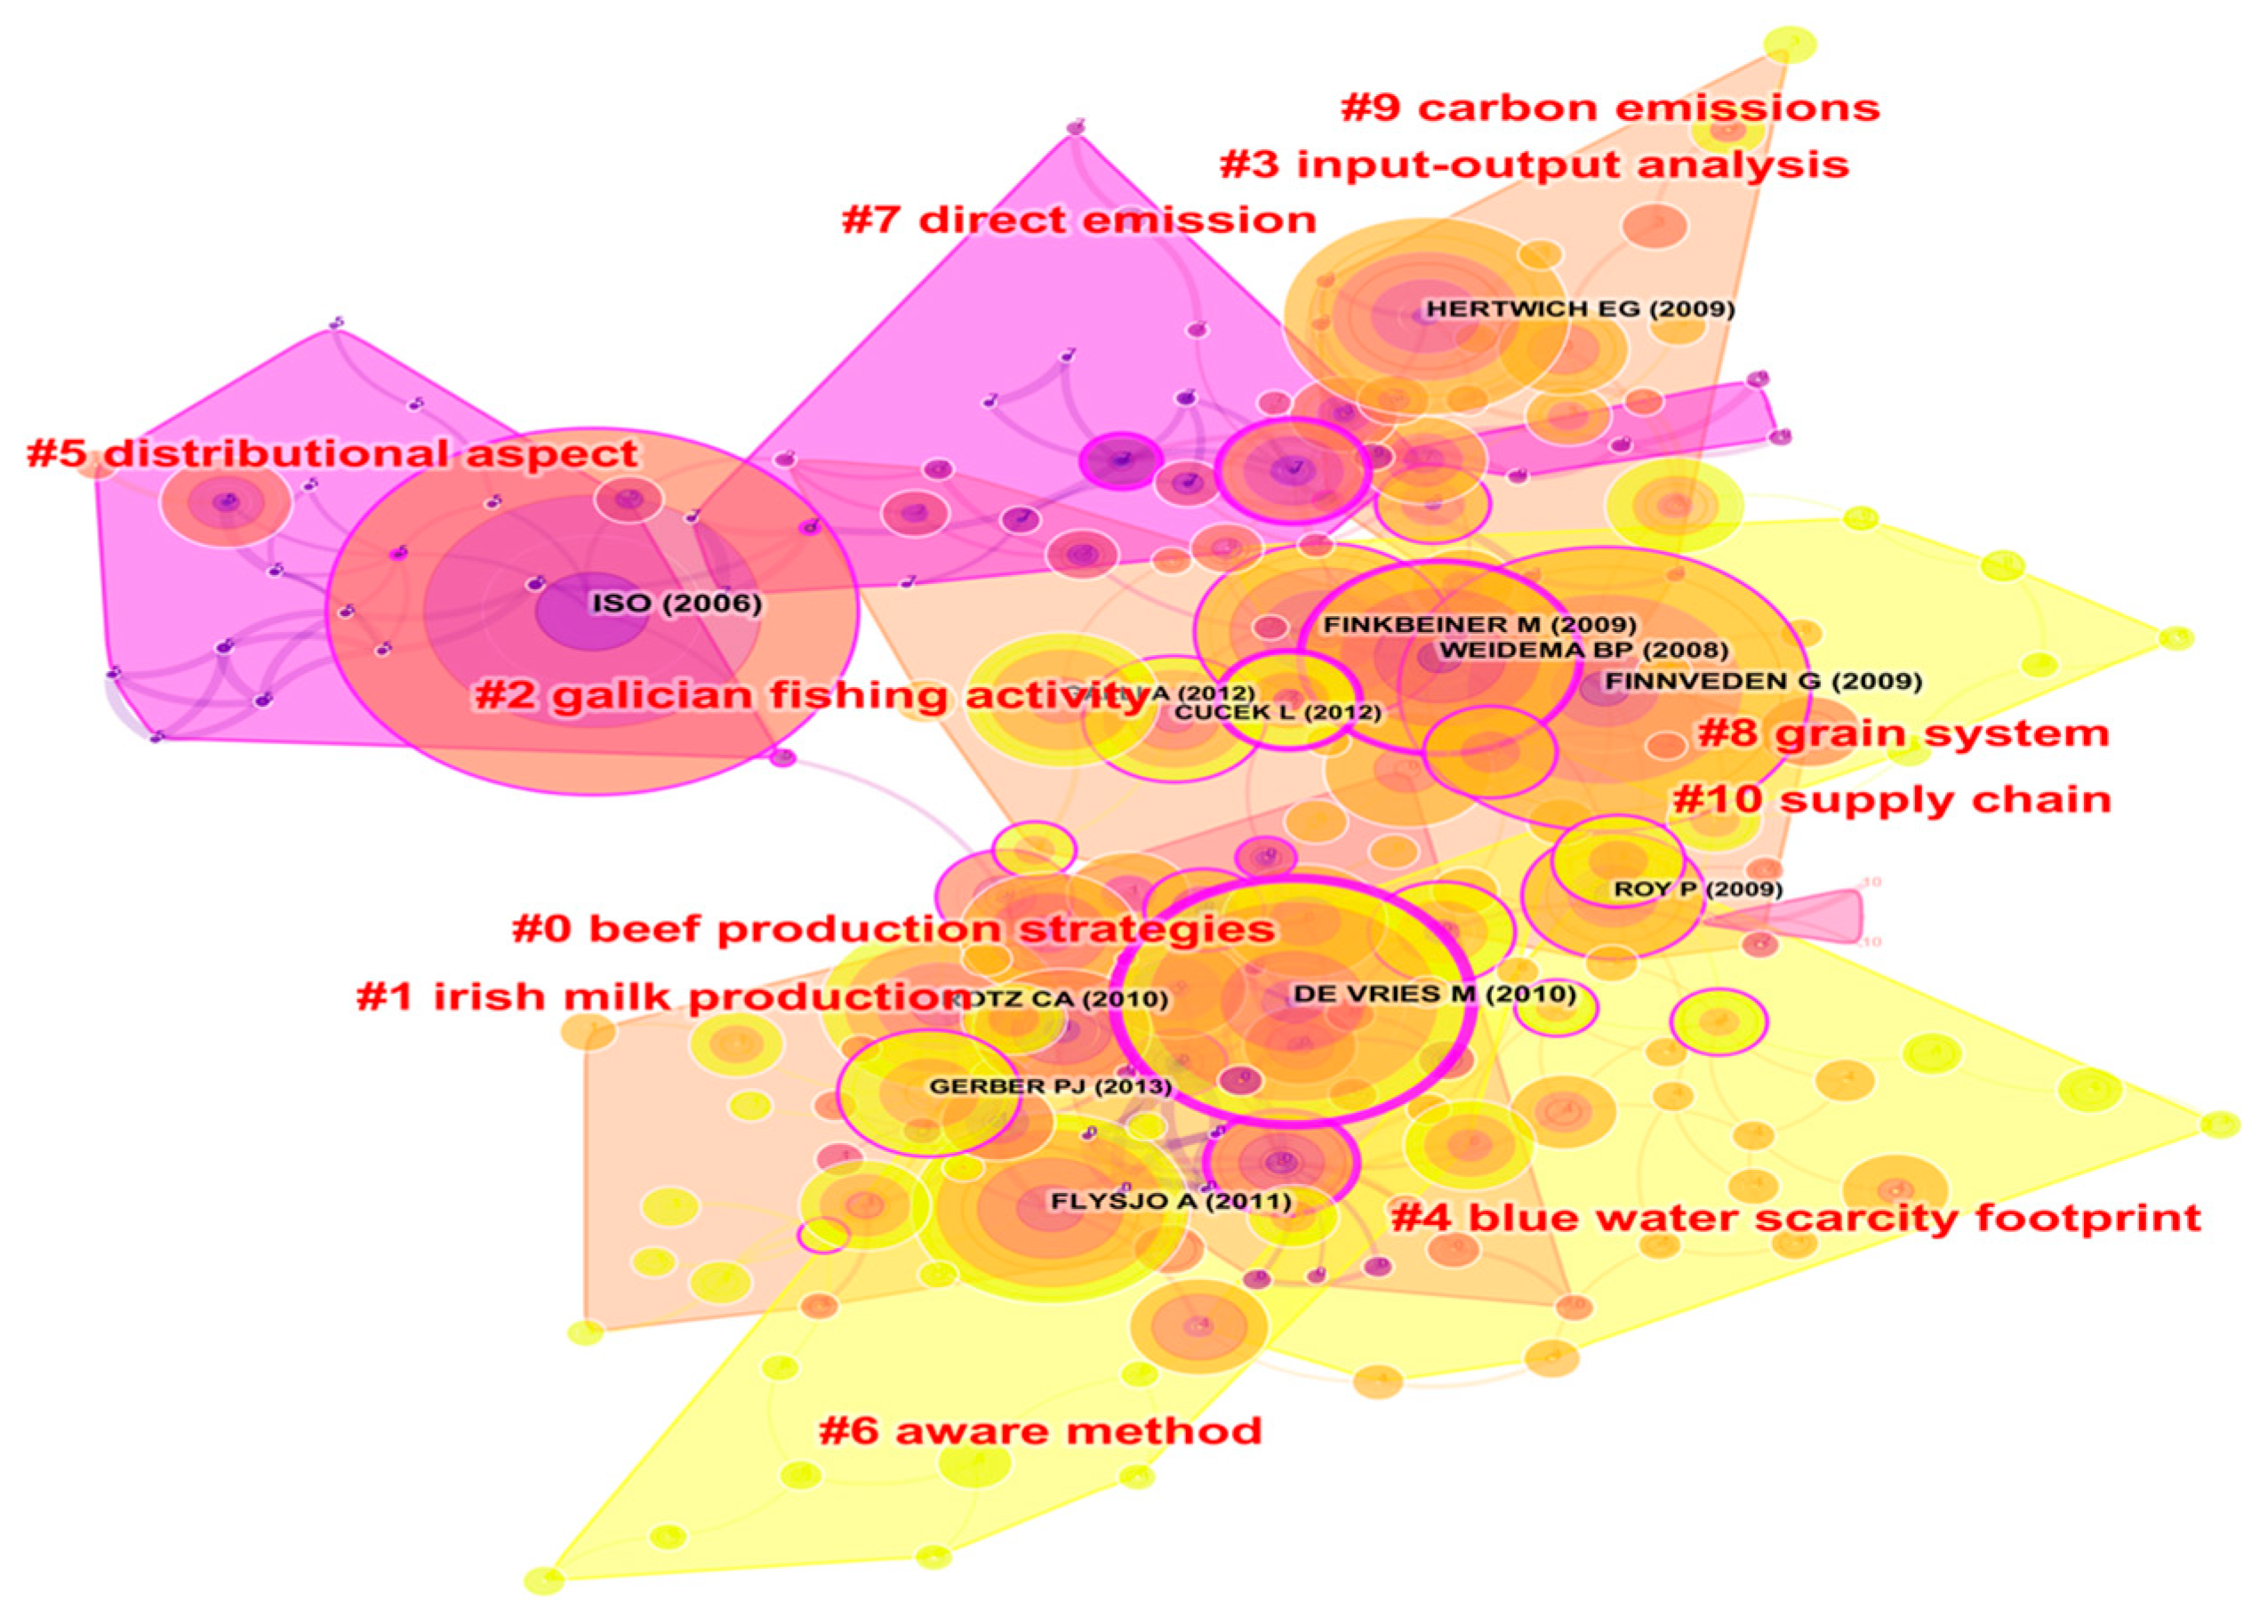
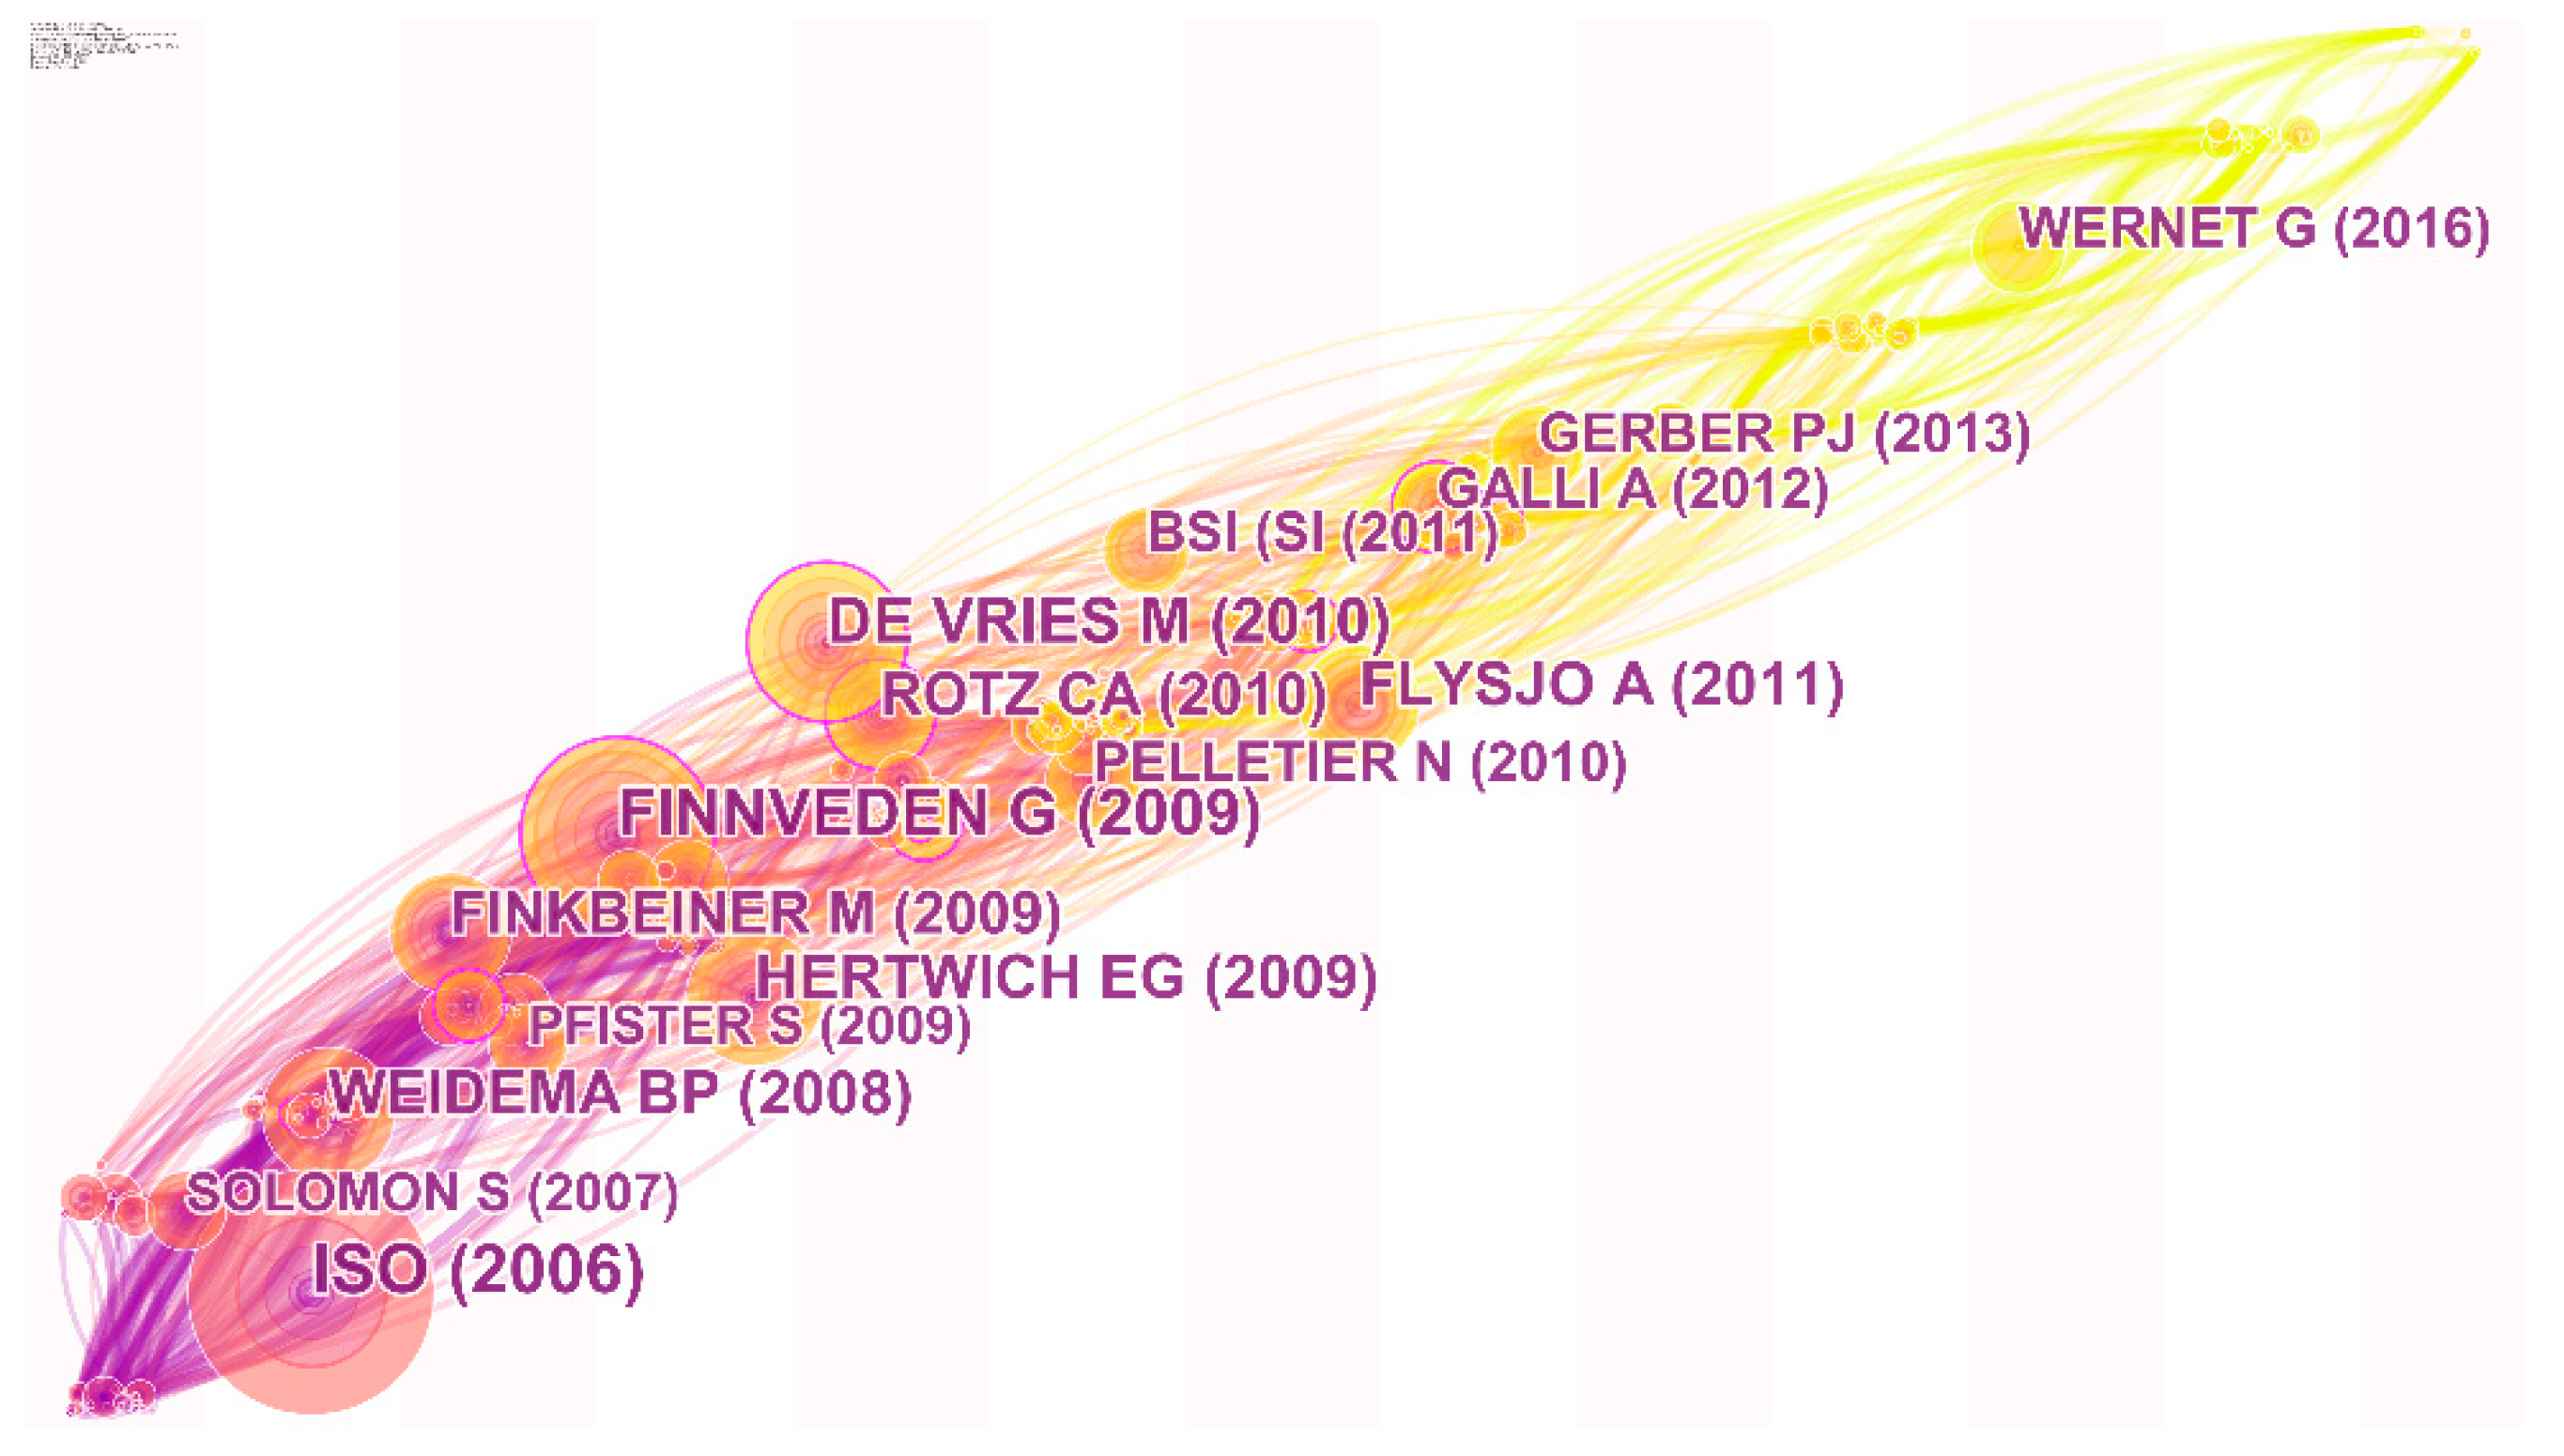
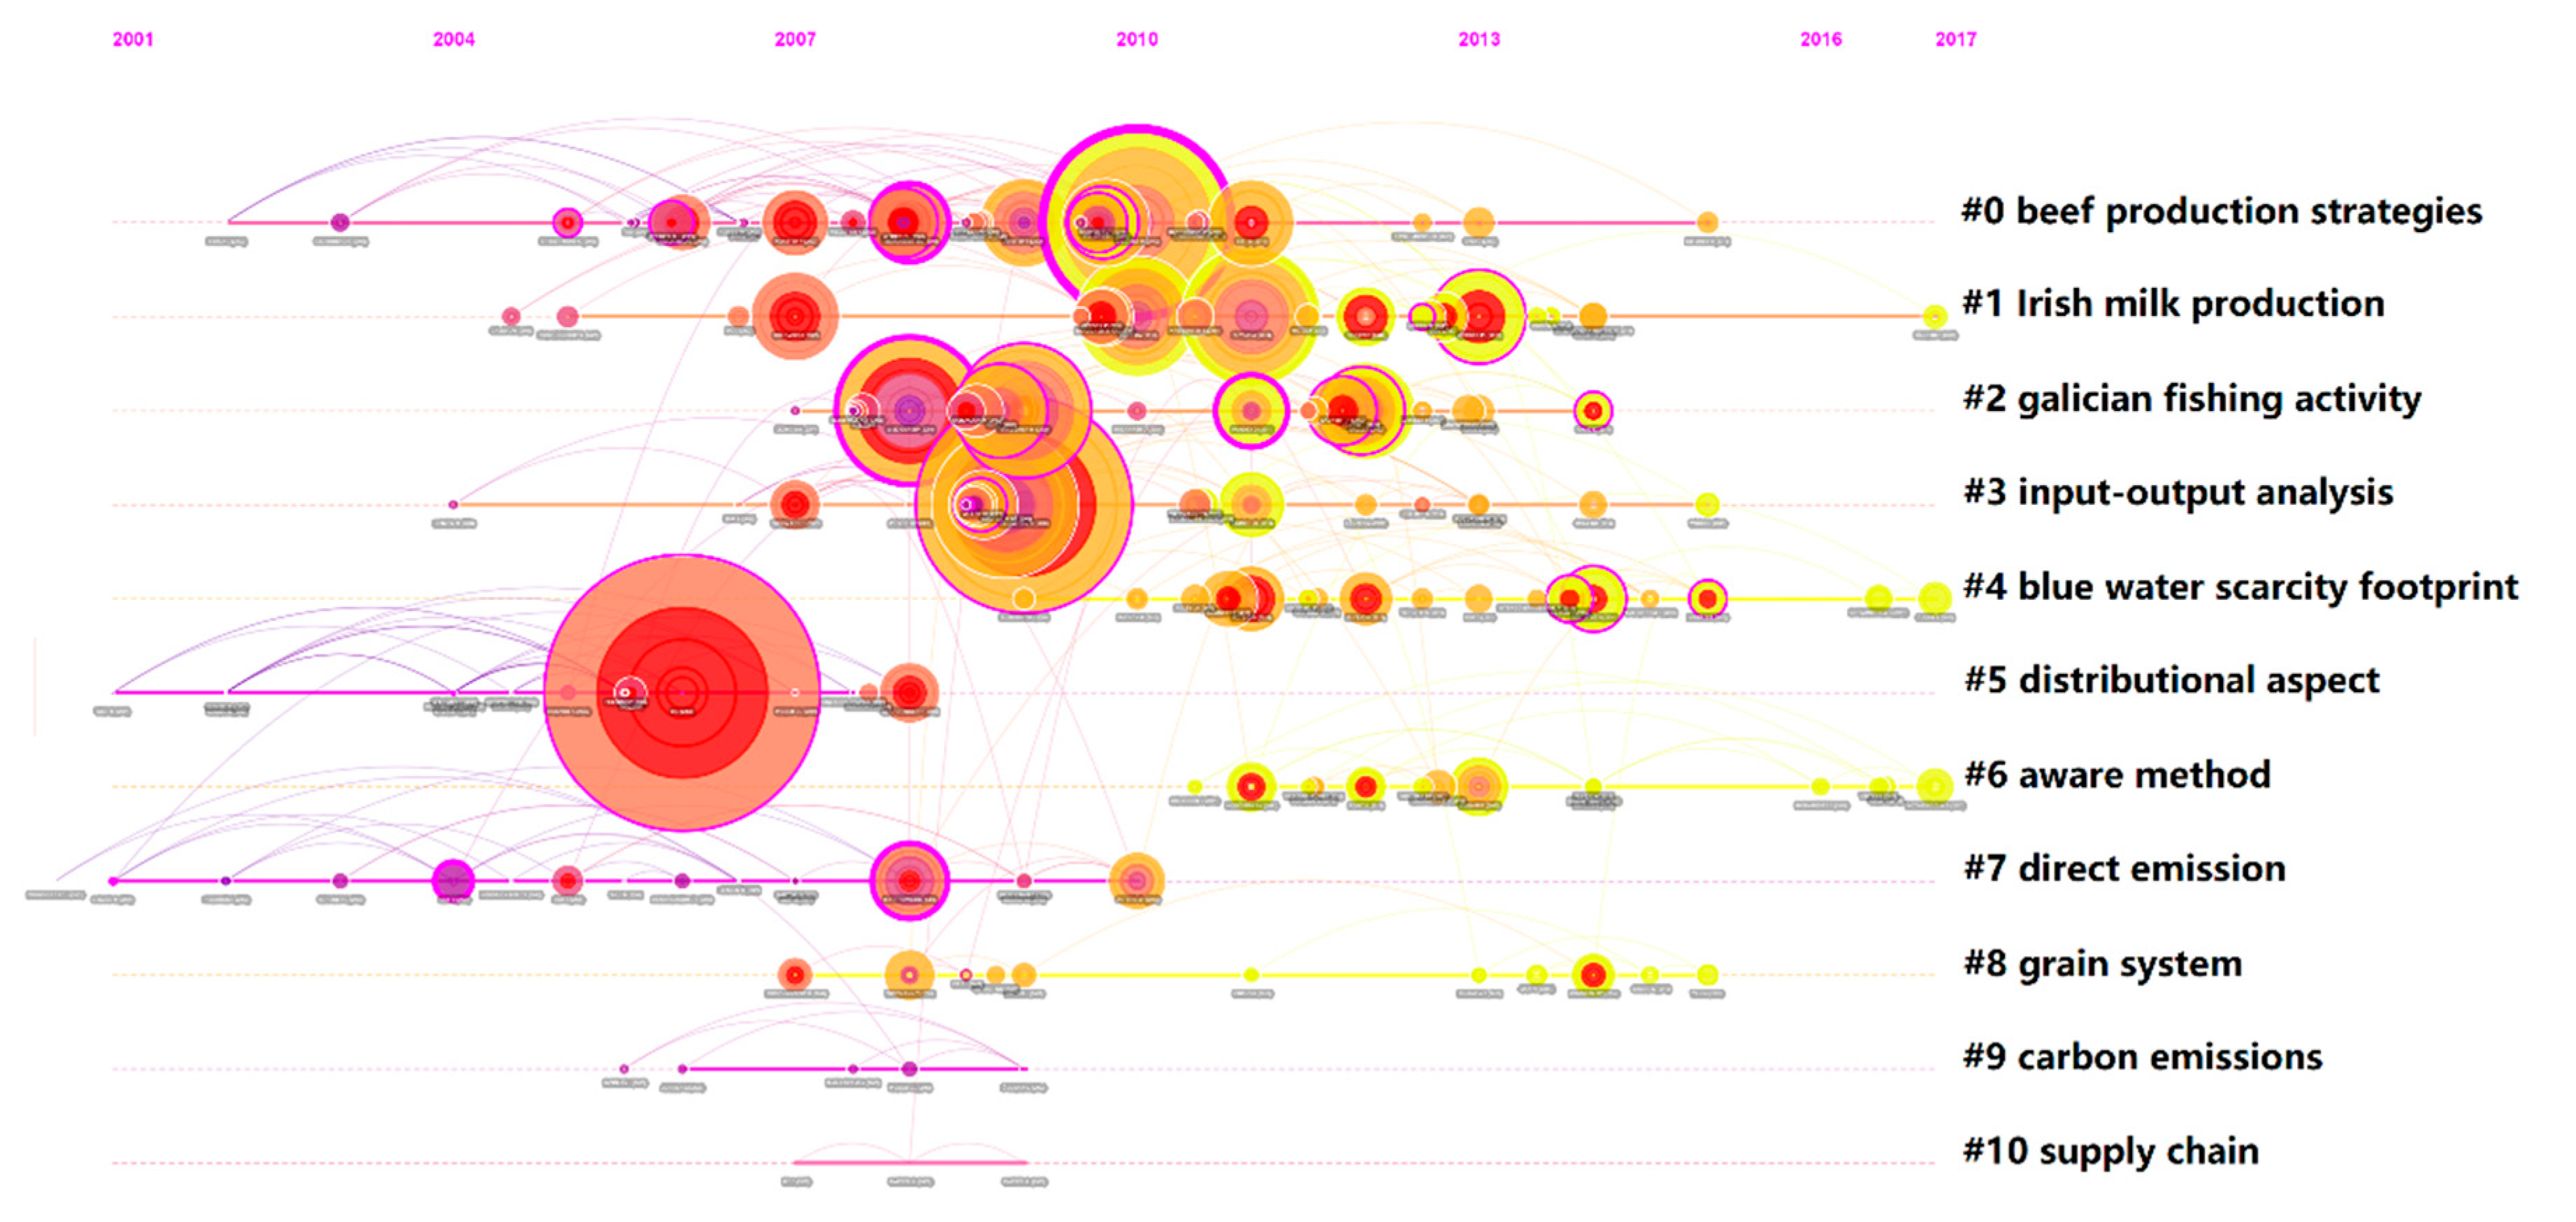
Based on the above efforts, we obtained a document co-citation network from the timeline perspective as shown in Figure 7. As can be seen from the distribution of major clusters along the time axis, beef production and dairy industry, as well as assessment method, are long-term topics in this kind of research. Topics of water footprint, aware method and grain system appeared in recent years.
From the reference bursts as shown in Table 10 [23,24,25,26,27,28,29,30,31,32], the documents widely cited in recent years are S. Hellweg [25] and D. Tilman [29]. S. Hellweg [25] reviewed and summarized the latest LCA methods, arguing that LCA methods could locate environmentally relevant hotspots in complex value chains, but at the expense of simplification and uncertainty. In the future, the LCA approach needs to be more practical and accurate, and its application in the assessment of economic and social aspects should be expanded. D. Tilman [29] discussed the impact of changes in dietary trends on carbon emissions. More and more foods in the diet structure of modern people are refined sugar and fat. If not controlled, such diet structure will lead to a substantial increase in agricultural greenhouse gas emissions. Meanwhile, it will have a negative impact on health. Thus, the paper advocated a healthy alternative diet to solve the diet–environment–health trilemma.

4.2. Keyword Analysis with Citation Bursts

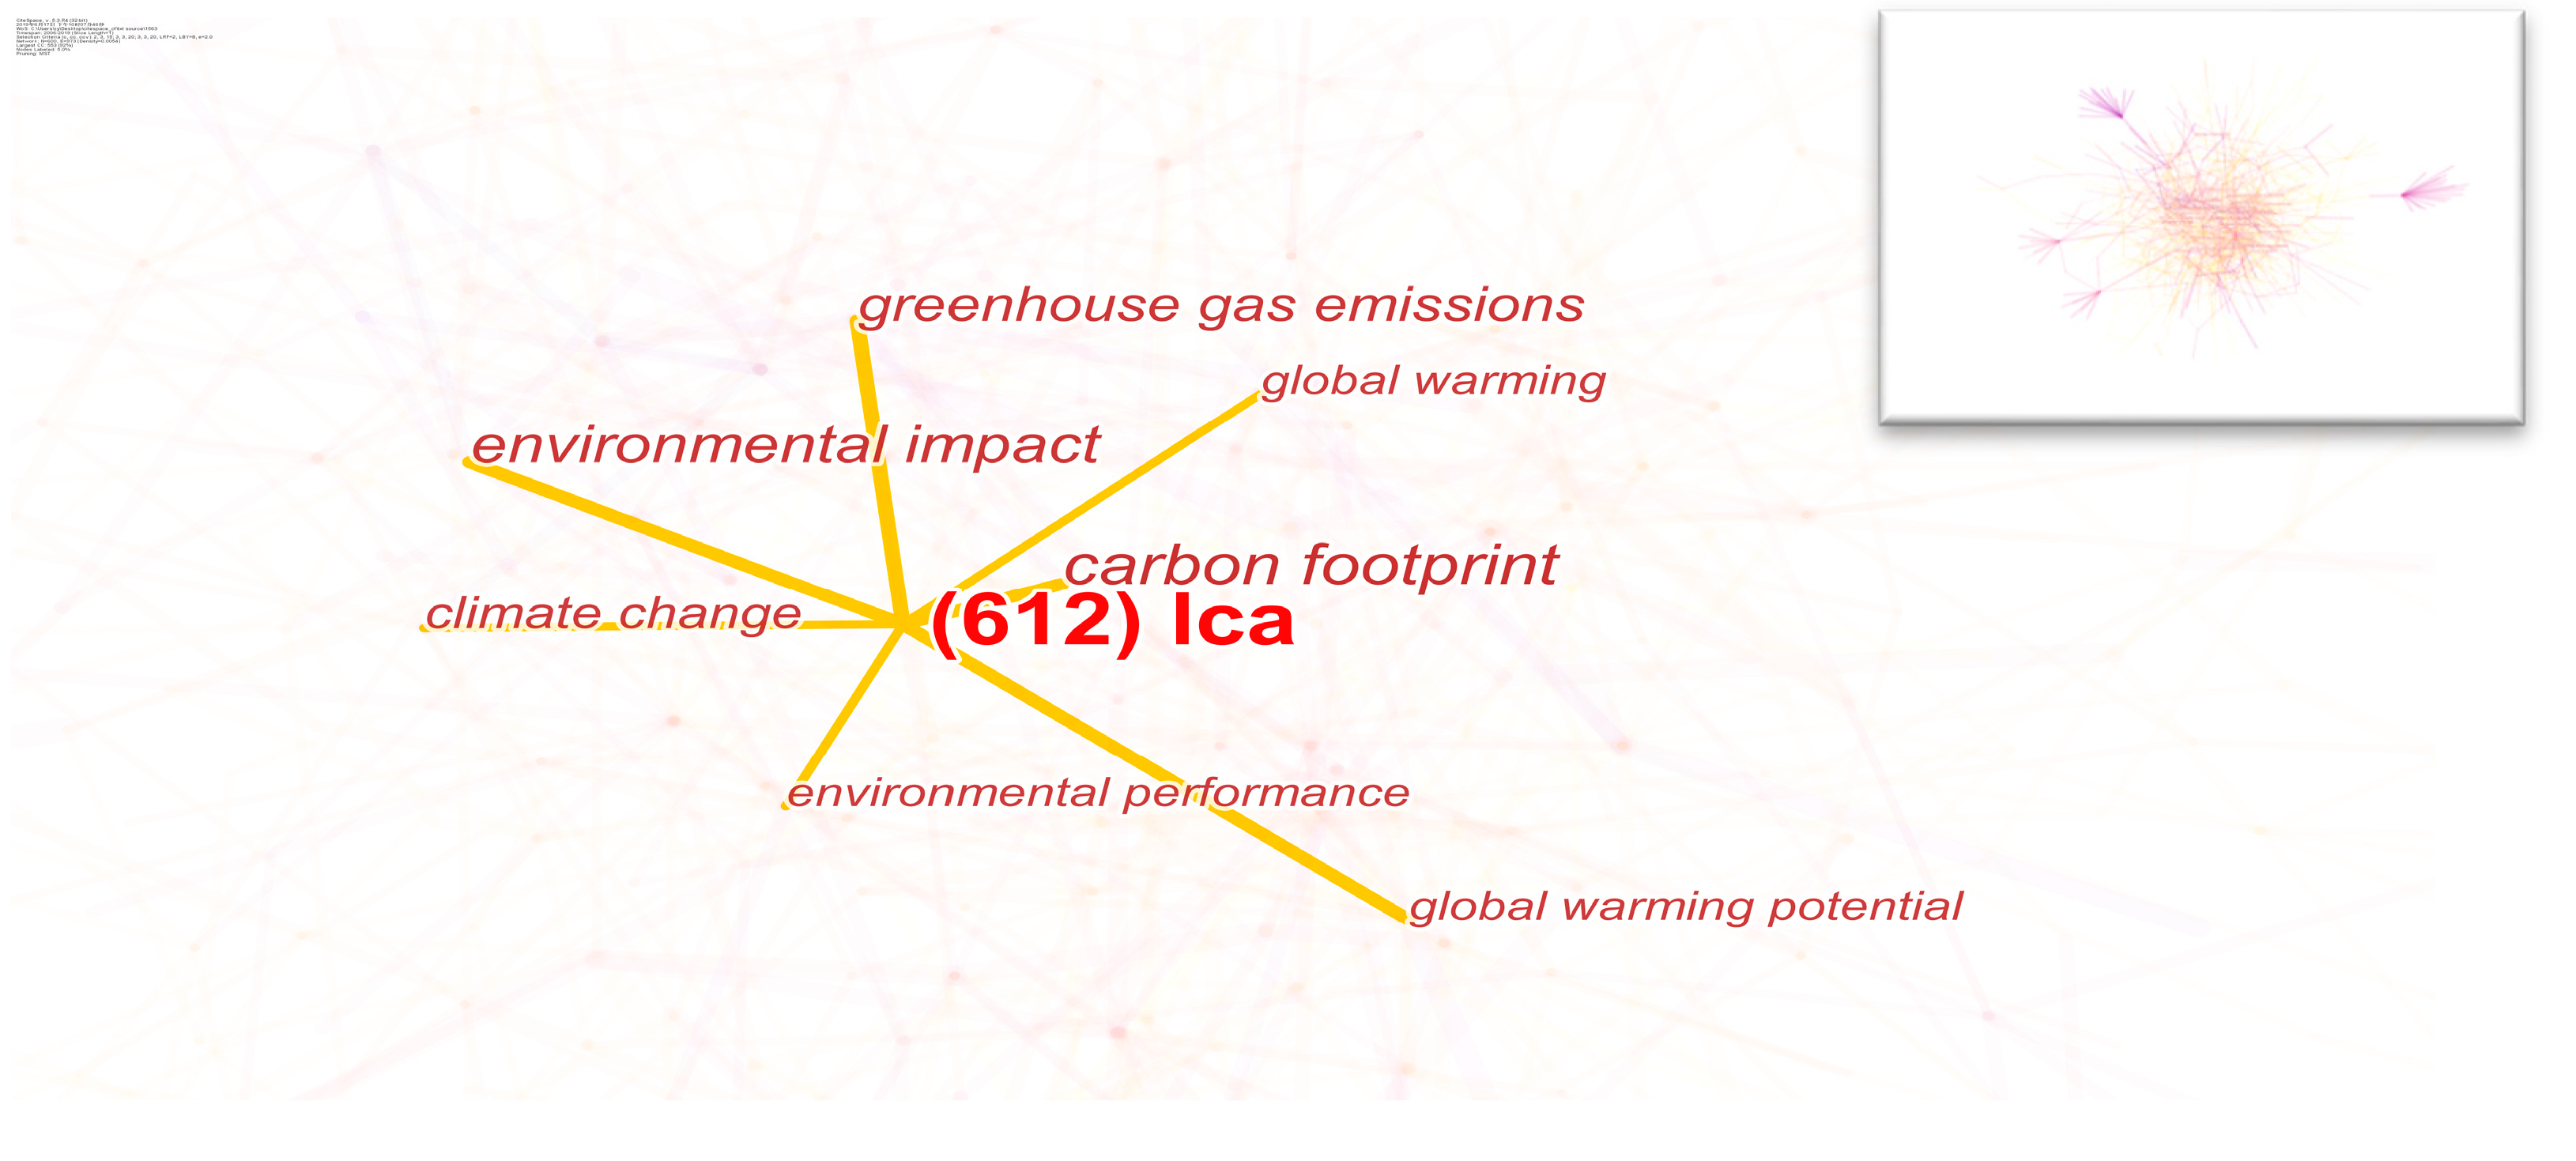
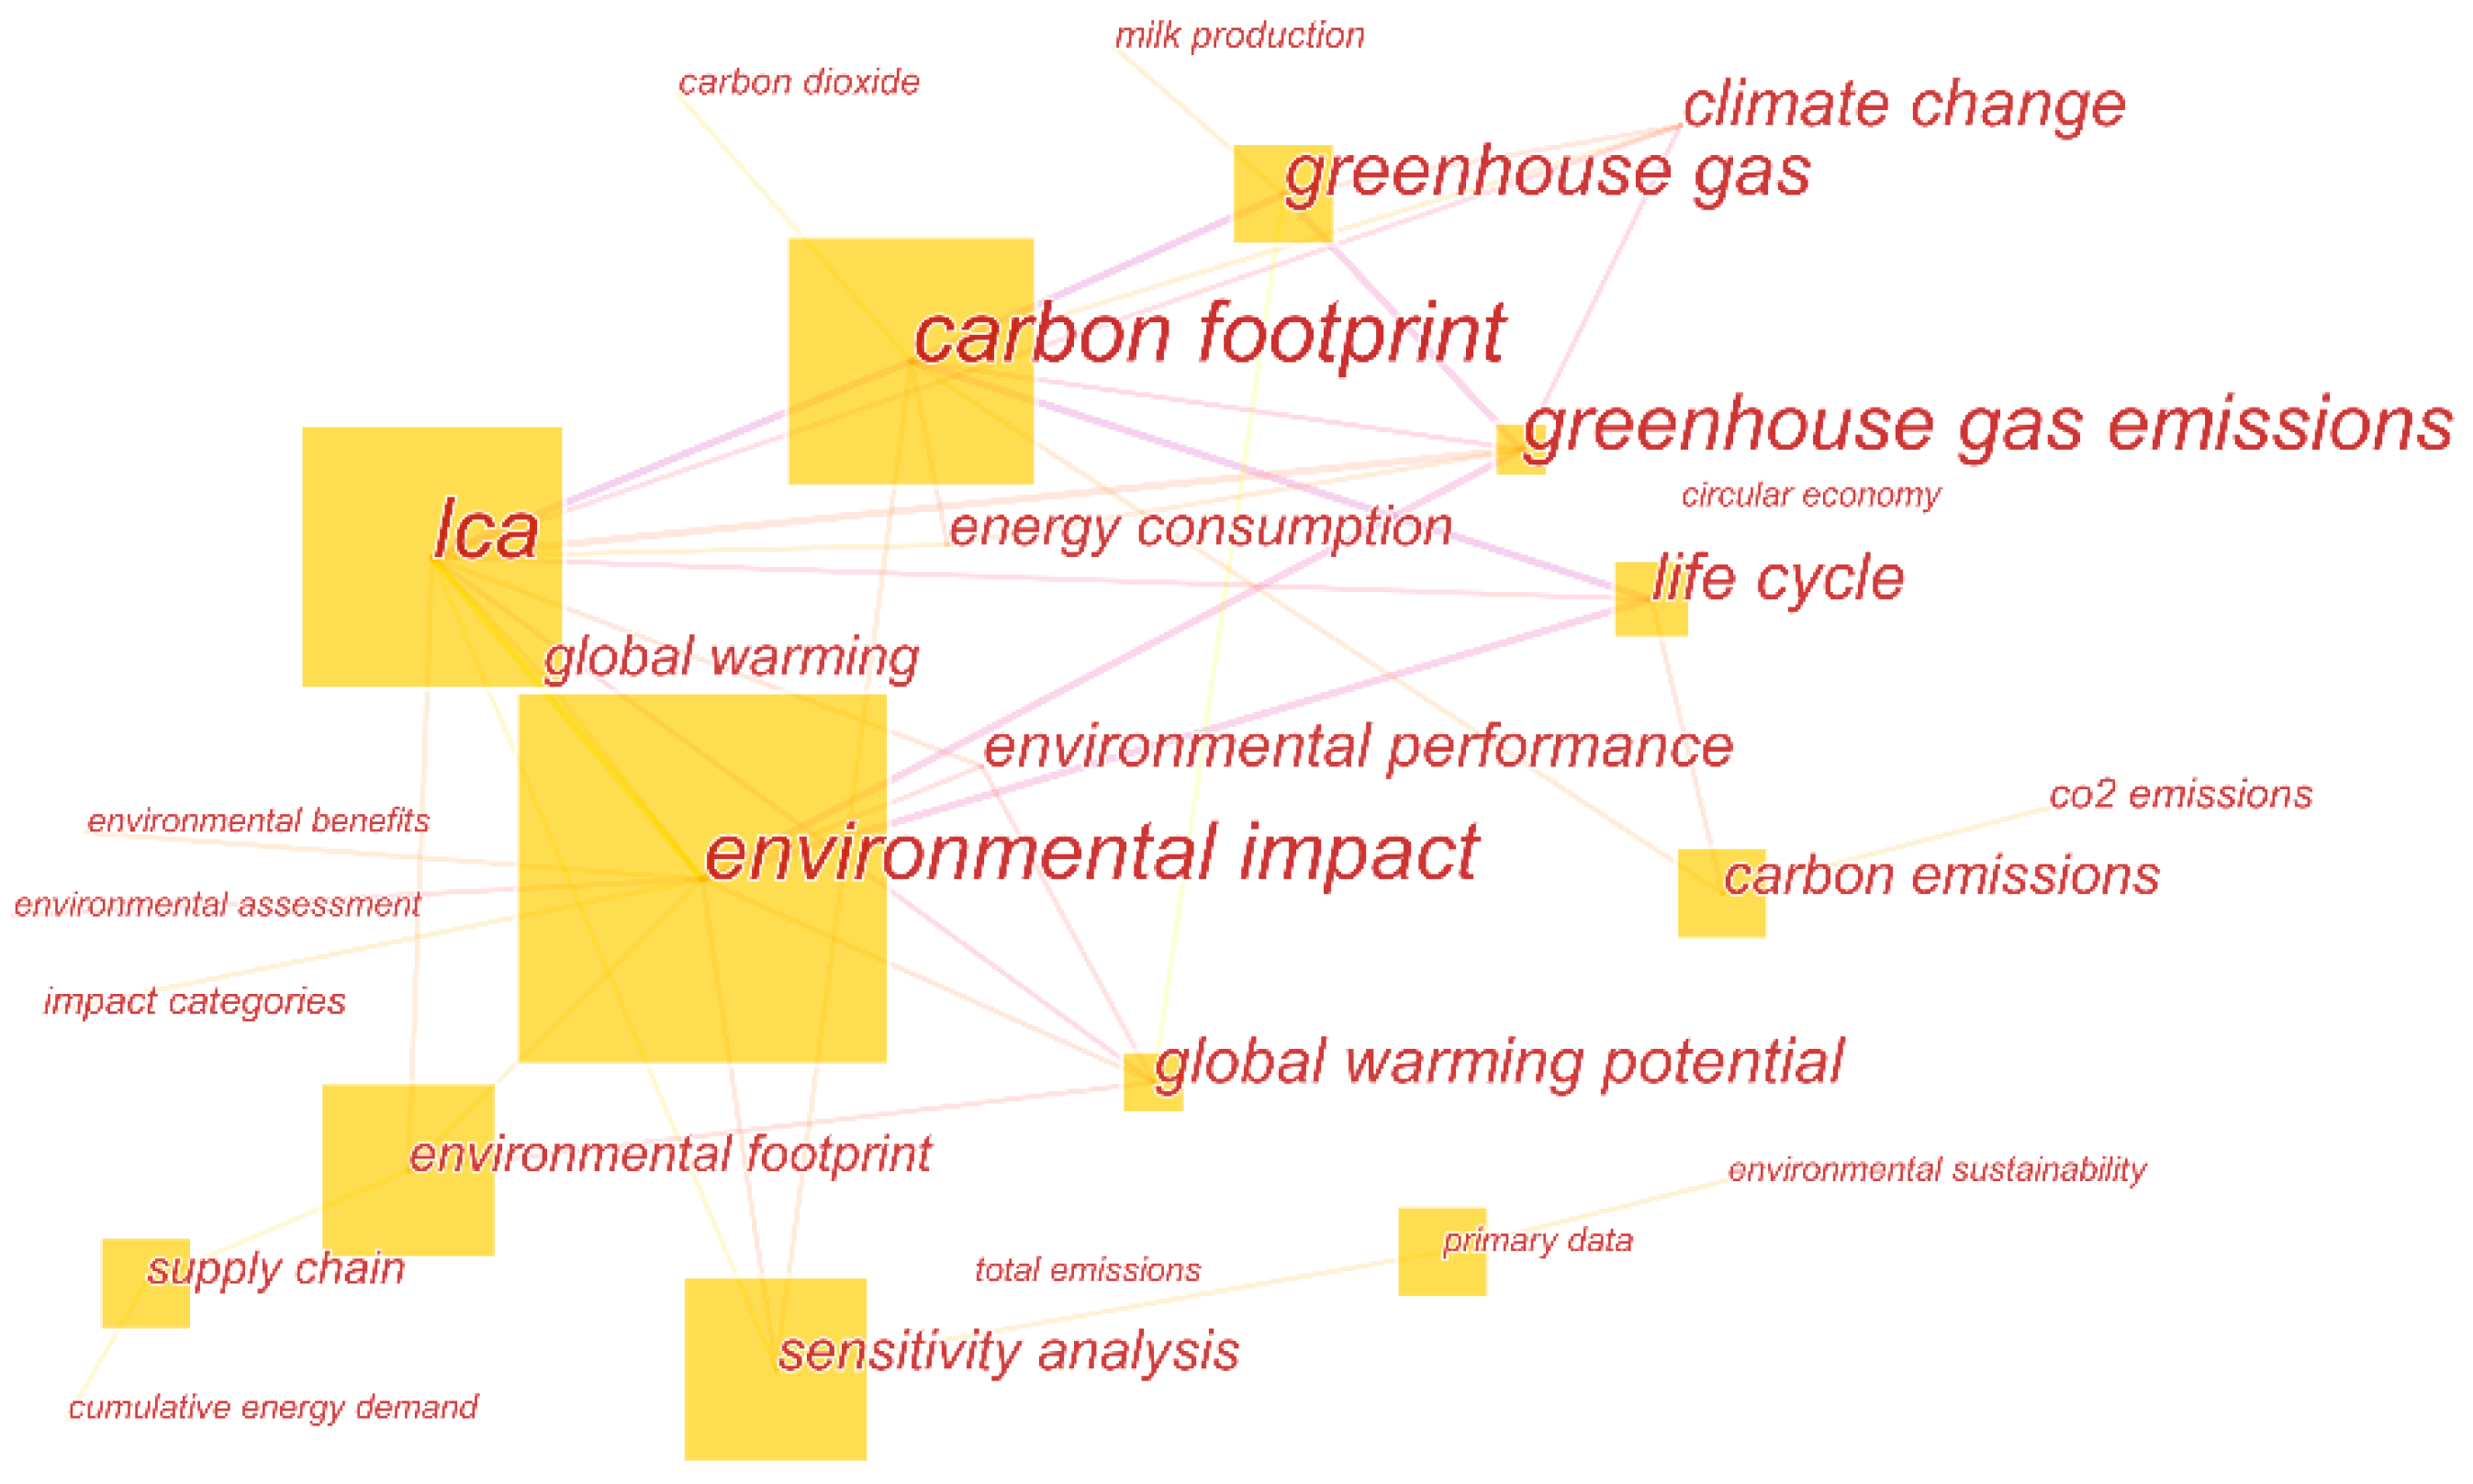
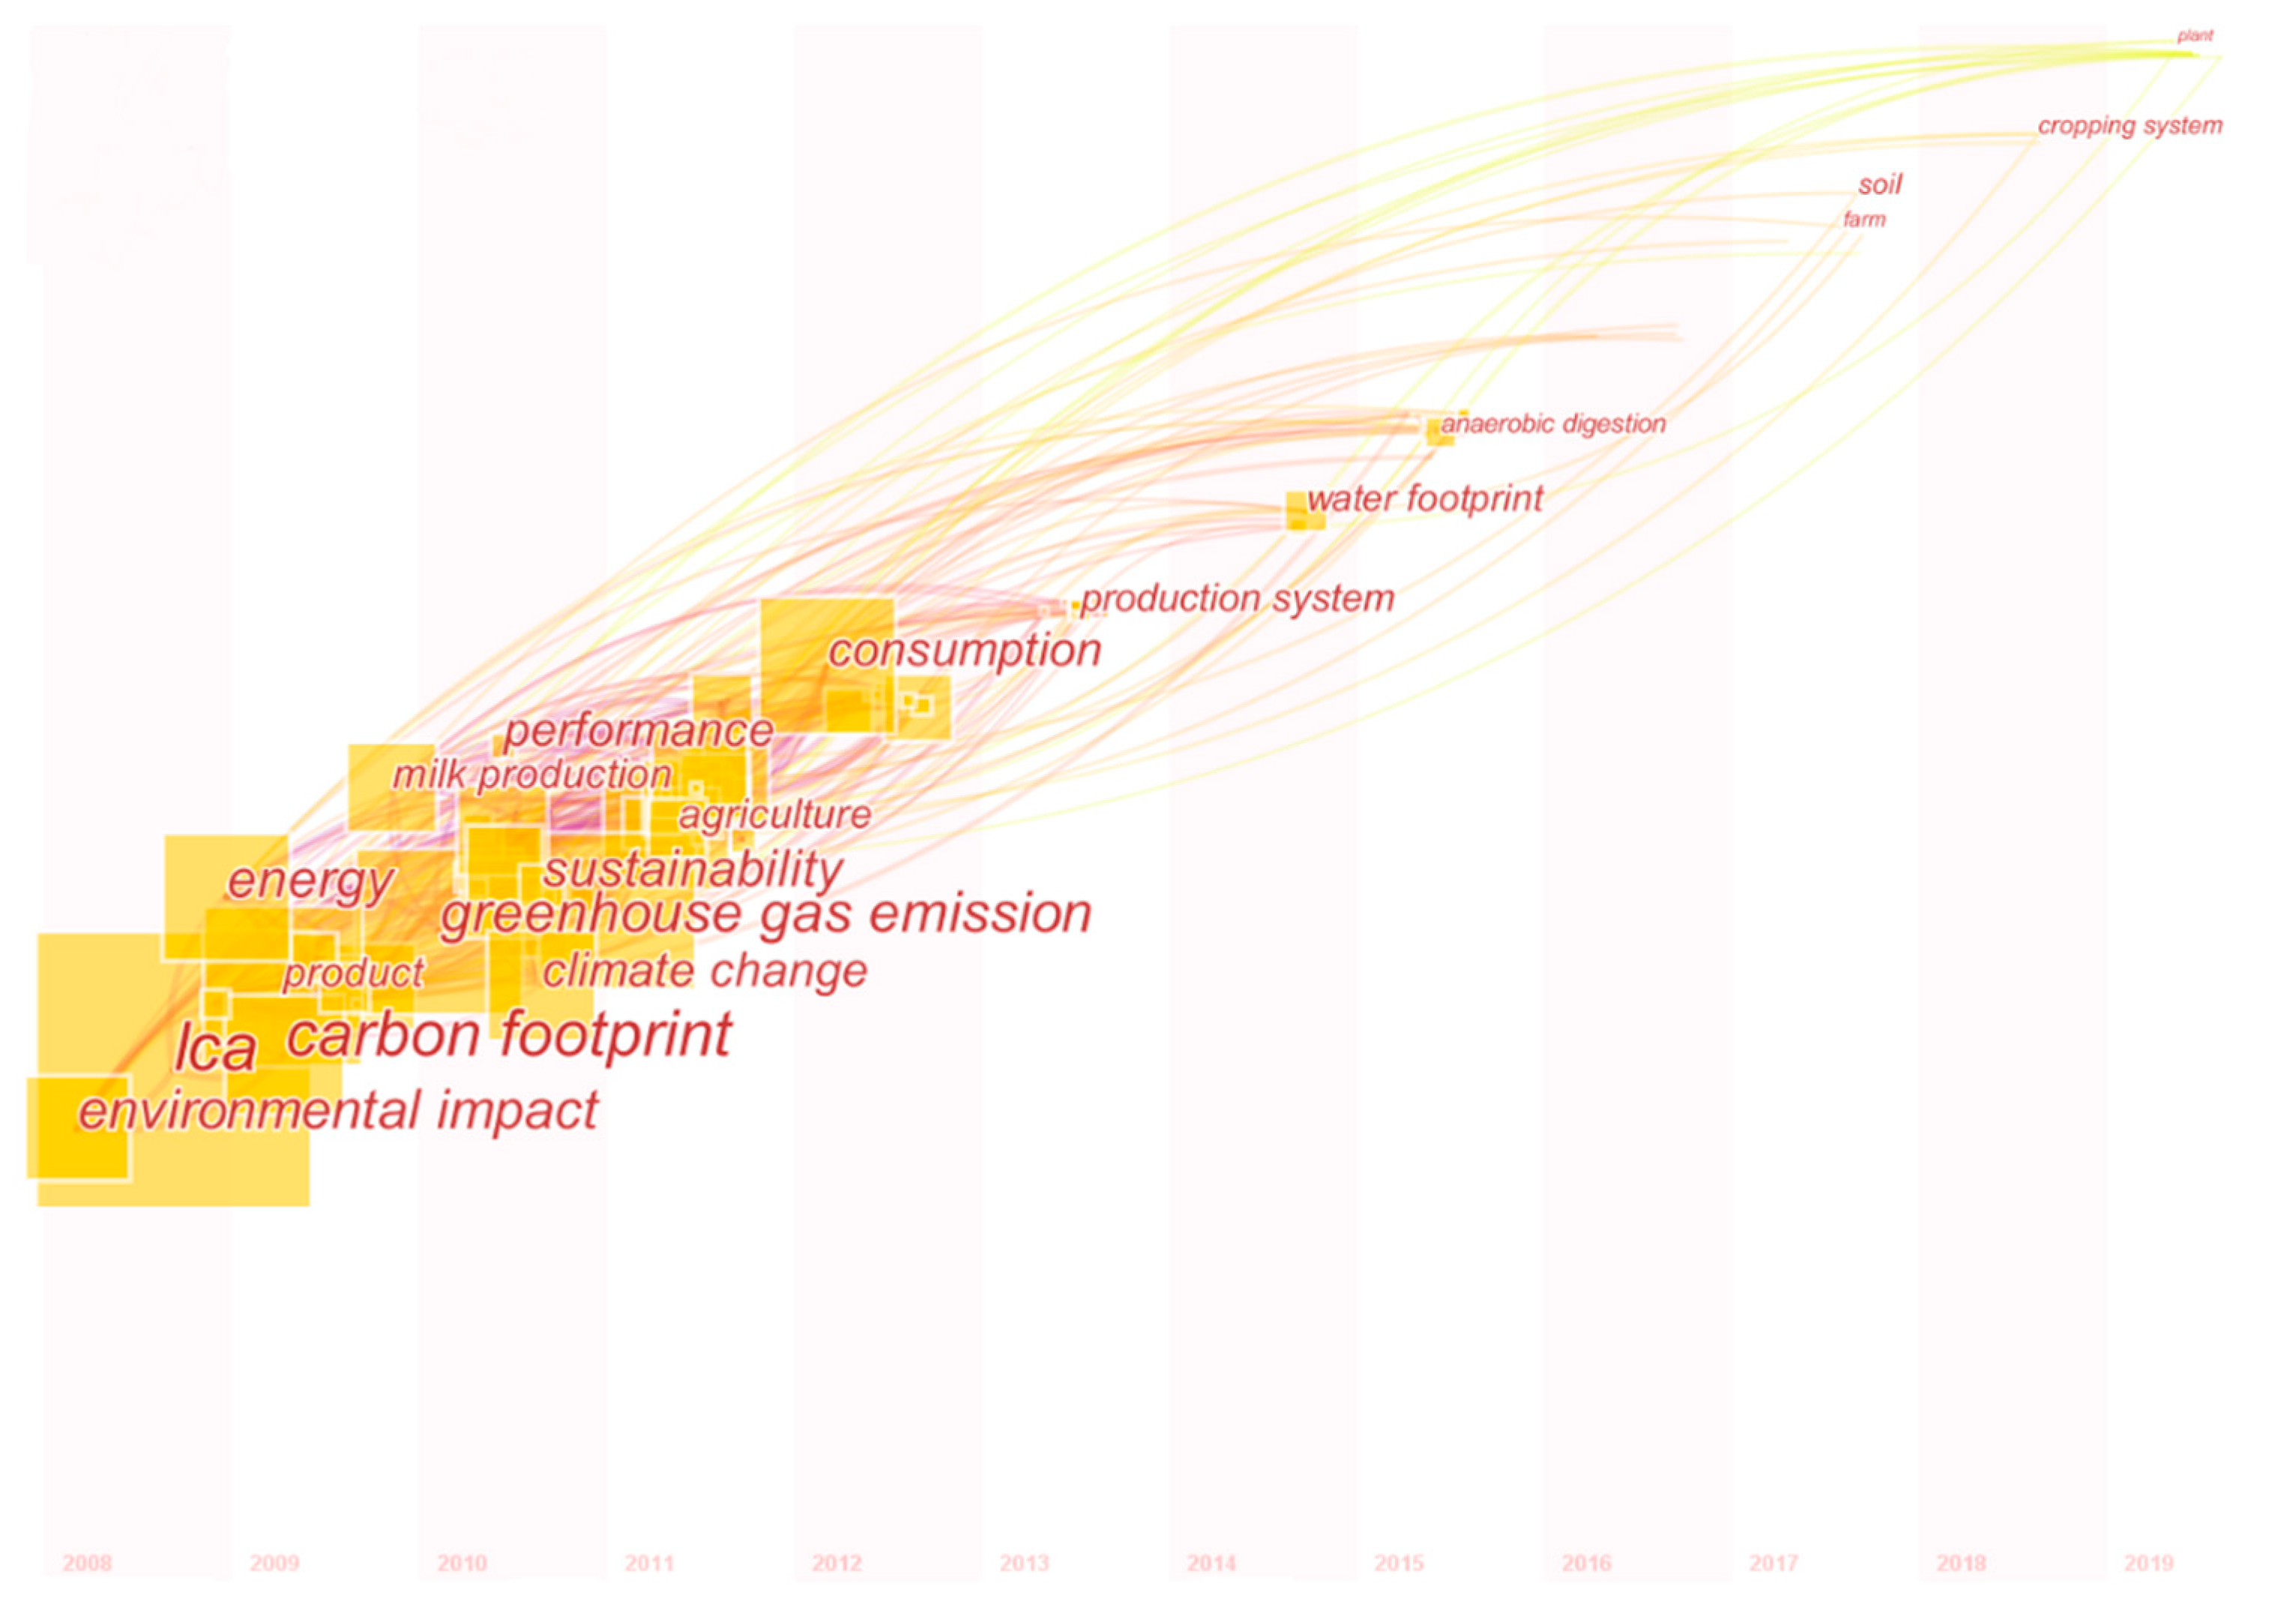
We set the time slicing in CiteSpace as one year per slice and extracted the top 50 cited keywords from each slice before pruning the sliced network in the pathfinder mode to obtain the keyword co-occurrence network; the network in the time-zones is as shown in Figure 8. Most of the high-frequency keywords appeared in the early stages of research, such as the two keywords of this study, namely “LCA” and “carbon footprint”. In line with the analysis of noun terms, “environment impact” was the earliest high-frequency word and the origin and essence of the research in this field, i.e., how to adopt a proper LCA method in accordance with the carbon footprint concept to evaluate the environmental impact of an activity. In recent years, there were fewer new high-frequency keywords, some of which were “water footprint”, “anaerobic digestion” and “plant”. Their emergence indicates that the research in the field has become more extensive and in-depth. “Water footprint” is a horizontal extension of “carbon footprint”, which makes the measurement system more complete. “Plant” and “anaerobic digestion” is an upward and downward extension of the research respectively, with the former focusing on the important sources of carbon emissions and the later ways to improve the environment.
In addition, the keyword bursts can be analysed based on the citation frequency. As shown in Table 11, “inventory”, “industrial ecology” and “sustainable development” became keywords during the period of document bursts in this field and have been keywords for a long time. In recent years, “crop”, “soil” and “China” have become the bursting keywords. “China” has emerged as a keyword mainly because of the rapid development of the Asian research collaboration network in recent years, which has shifted the research focus from Europe and America to Asia. “Crop” became a focus due to the concerns for feed production in farm carbon footprint measurement and for the carbon footprint of crop cultivation [33,34]. “Soil” attracted much attention due to the fact that, like atmosphere, soil is another final destination for carbon. For example, if the soil is of potential for organic carbon sequestration, it is possible that the net greenhouse gas emissions from pasture systems decrease drastically [35].
As indicated by literature and the trend analysis above, the latest hot topics related to the focus topic involve several aspects—the combination of LCA and carbon footprint and its application, carbon footprint measurement of different products, and environmental impact and carbon footprint.
The combination of LCA and carbon footprint and its application. At present, there are still some limitations in the application of quantitative LCA methods to study the environmental impacts caused by resource utilization and waste discharge during product production. For example, social and economic factors are evaluated only via qualitative analysis, and time and space factors are not given sufficient attention [36]. These limitations have not been resolved by the combination of LCA and carbon footprint. At present, some scholars try to do so through the dynamic LCA method [37]. LCA is an approach that has been applied to the measurement of a carbon footprint since the proposal of this concept. In addition to the above limitations, this approach is more suitable for the measurement of specific products at the microscopic level, because it is still difficult to define the boundary at the macro level (such as the carbon footprint of organizations). For instance, it is hard to decide whether the carbon emissions of aircraft manufacturing should be included when calculating the flight carbon footprint. In contrast, the input–output method can offset the calculation errors caused by the complex division of labour, so some researchers have combined the two to develop the hybrid LCA method, which makes the boundary clearer to some extent [38]. However, this method requires high-quality data and technology, so how to better apply LCA in the carbon footprint field will still be a hot topic related to the focus topic in the future.
Carbon footprint measurement for different products. Since LCA is more suitable for calculating carbon footprint at the product level, there is a large body of literature discussing different types of specific products, such as beef and milk which are classic measured products. Both of them are important sources of protein, and other sources of protein, such as fish and shrimp, are also the subject of carbon footprint measurement. Due to the differences in production systems, the environmental friendliness of different protein sources differs remarkably [39]. Crops are another subject of carbon footprint measurement, such as wheat [40], tomatoes [41] and organic farming crops. All of the products mentioned above are related to diet and nutrition, so the adjustment of diet structure has an impact on carbon emissions, and the relationship between food carbon footprint, demographic characteristics and environment will gain more attention. As stated in the section of disciplinary analysis, this is an interdisciplinary field of Environmental Science and Ecology and Food Science and Technology, and a potential point of growth for those disciplines. In recent years, cities as an important source of carbon emissions have also received more and more attention from researchers. Specific research topics include the impact of urban green space projects on carbon emissions [42], and the relationship between citizen behaviours and urban carbon emissions [43]. The carbon footprint of citizen behaviours is primarily related to private driving, housing-related activities, and consumer behaviours. Private driving, which involves the interdisciplinary field of Environmental Science and Ecology and Energy and Fuels, has attracted much attention. With the emergence of electric vehicles [44], it is likely to become one of the hot research directions. In terms of housing-related activities, a concerned aspect of the focus topic is how to use LCA to intervene in the early stages of building design to order to reduce carbon emissions of building construction [45]; the comparison of carbon footprints between environmentally friendly homes and ordinary ones is also one of the hot topics [46]. In addition, the measurement of the carbon footprint of consumer goods is also a concerned aspect of the focus topic, and changes in consumer demand can have an impact on carbon emissions [47]. However, the application of the LCA approach has high requirements on data. The literature on the focus topic studies urban issues only at the micro level. With the application of big data and the advancement of LCA, the use of LCA to measure urban carbon footprint may be one of the future research directions.
Environmental impact and carbon footprint. Carbon footprint was proposed to measure the environmental impact of economic activities, so environmental impact has always been a hot word of the focus topic. Carbon footprint is an indicator or a concept. As a measurement indicator of greenhouse gas emissions, carbon footprint has already adopted the concept of carbon equivalent and taken carbon-free greenhouse gases into consideration. Nevertheless, it still cannot be the sole indicator of environmental impact. However, the concept of carbon footprint has contributed to alleviating the environmental burden. On the one hand, compared with obscure terms like Multi-Region Input–Output Model (MRIO) and LCA, carbon footprint is simple, easy to understand and interesting. The wide spreading and extensive application of this concept may have influenced people’s behaviours of environmental impact [48]. On the one hand, the concept of carbon footprint provides new ideas for assessing other environmental impact factors and has inspired the proposal of water footprint, ecology footprint, energy footprint and even the family of footprints. A growing body of literature is attempting to use a more comprehensive evaluation system to measure the environmental impact of an economic activity based on the combination of LCA and carbon footprint.

5. Conclusions and Discussion

We have conducted a bibliometric analysis of the relevant literature on the focus topic by utilizing CiteSpace, and come to the following conclusions. First, from the time dimension, the burst period of related literature was between 2008 and 2011, after which it was in a stage of stable development. The literature published during the period was not only in a large number, but also highly cited, which has laid a solid foundation for the later research. Second, as for the source of literature, the United States, China, Italy, Spain, the United Kingdom and Australia were the major countries where the research was conducted. These countries/regions have had the most productive authors and institutions, and a considerable number of academic collaborations have been carried out between them. However, as far as institutions and authors are concerned, only a few collaboration sub-networks have been established in the field, and the research community needs further development. As indicated by the co-citation analysis, productive institutions or authors may not be highly cited. For example, the Chinese Academy of Sciences ranks second in terms of the number of publications, but it does not have any highly cited papers. This may be due to the fact that the field has developed for only 16 years and is still in its early stages, and some institutions and authors as newcomers have not received much attention. In addition, group authors (such as ISO and IPCC) have contributed to the development of this field. Finally, regarding the research content, most of the research belongs to the field of Environmental Science and Ecology, and some studies have involved interdisciplinary fields, such as Energy and Fuels. Studies in the related fields had environment impact as their keyword and mainly focused on the discussion of methods or their application. Although a certain research base in this field has been laid, there are still a lot of gaps to be filled.
As the citation bursts analysis showed in Section 4, the application situation of focus topic ranged from farm to city, from Europe and America to Asia, while there were fewer new high frequency keywords in recent years’ literatures. Combined with the more detailed literature interpretation in keywords analysis part in Section 4, we could see that innovation of method may widen the depth of research in this field and breadth of the application situation. As a result, researchers in the field need to pay more attention to the latest development of methods and the expansion of their application. In the literature focusing on the discussion of methods, the technical routes from static to dynamic measurement and from micro to macro measurement were developed based on the clarification of the definition of carbon footprint and the discussion of the LCA methods. Nowadays, LCA has become the mainstream method of carbon footprint measurement. In future research, the effort should be devoted to complete the system of the LCA method on carbon footprint measurement. For example, in the macro-scenario carbon footprint measurement at the urban level, some scholars have combined LCA with the input–output method to form the hybrid LCA method [38]. Hybrid LCA requires great amounts of data and technology. Therefore, the use of computer technology for hybrid LCA analysis is one of the future directions of this field. Moreover, in the literature focusing on the method application, the carbon emission measurement for multi-category products of crops, urban houses and other industries has developed, based on animal husbandry, the classic source of carbon emission. In fact, the design of life cycle inventory was critical in the method application. For example, Europe built The European Platform on Life Cycle Assessment and released the International Life Cycle Data System (ILCD) to be a guidance. How to design different product life cycle lists in different socio-economic environments and how to improve the universality of LCA accounting standard are also the future research contents.
This study still has some space for improvement: (1) Analysing more papers related to carbon footprint, and comparing their results with this study to gain a deeper understanding of the application of LCA in carbon footprint measurement; or analysing more documents related to the footprint family to better understand the characteristics of the carbon footprint indicators through a comparative analysis. (2) Improving the bibliometric technology by, for instance, taking into account the self-citation of literature; solving the problem of considering only the first author in the collaboration analysis; and the combined application of various visualization technologies.

Author Contributions

S.Z. and R.C. drafted the manuscript. S.Z., R.C. and F.S. contributed to the construction of the framework and designed the research methodology. F.S. and Y.X. polished the language. S.Z. and R.C. assisted in data collection and data analysis, S.Z., F.S. and Y.X. revised the manuscript. All authors read and approved the final version of the manuscript.

Funding

This research was funded by the General Project of Philosophy and Social Science Research in Colleges and Universities in Jiangsu Province, grant number No. 2019SJA0678 and the Fundamental Research Funds for the Central Universities, grant number CXJJ-2018-361.

Conflicts of Interest

The authors declare no conflict of interest.

Appendix A

Figure A1. Author co-citation network.
Processes 07 00818 g0a1
Figure A2. Journal co-citation network.
Processes 07 00818 g0a2
Figure A3. Country collaboration network.
Processes 07 00818 g0a3
Figure A4. Institution collaboration network.
Processes 07 00818 g0a4
Figure A5. Author collaboration network.
Processes 07 00818 g0a5
Figure A6. Year–colour correspondence bar.
Processes 07 00818 g0a6

References

  1. IPCC. Glob. Warm. 1.5 °C. 2018. Available online: https://www.ipcc.ch/sr15/ (accessed on 23 June 2019).
  2. Pandey, D.; Agrawal, M.; Pandey, J.S. Carbon footprint: Current methods of estimation. Environ. Monit. Assess. 2011, 178, 135–160. [Google Scholar] [CrossRef]
  3. IPCC. 2019 Refinement to the 2006 IPCC Guidelines for National Greenhouse Gas Inventories. 2019. Available online: https://www.ipcc.ch/report/2019-refinement-to-the-2006-ipcc-guidelines-for-national-greenhouse-gas-inventories/ (accessed on 23 June 2019).
  4. Bourque, P.J. Embodied energy trade balances among regions. Int. Reg. Sci. Rev. 1981, 6, 121–136. [Google Scholar] [CrossRef]
  5. Chen, G.; Shan, Y.; Hu, Y.; Tong, K.; Wiedmann, T.; Ramaswami, A.; Guan, D.; Shi, L.; Wang, Y. Review on city-level carbon accounting. Environ. Sci. Technol. 2019, 53, 5545–5558. [Google Scholar] [CrossRef] [PubMed]
  6. Chai, B.C.; van der Voort, J.R.; Grofelnik, K.; Eliasdottir, H.G.; Klöss, I.; Perez-Cueto, F.J.A. Which Diet Has the Least Environmental Impact on Our Planet? A Systematic Review of Vegan, Vegetarian and Omnivorous Diets. Sustainability 2019, 11, 4110. [Google Scholar] [CrossRef]
  7. Pohl, J.; Hilty, L.M.; Finkbeiner, M. How LCA contributes to the environmental assessment of higher order effects of ICT application: A review of different approaches. J. Clean. Prod. 2019, 219, 698–712. [Google Scholar] [CrossRef]
  8. Chen, C. Searching for intellectual turning points: Progressive Knowledge Domain Visualization. Proc. Nat. Acad. Sci. USA 2004, 101, 5303–5310. [Google Scholar] [CrossRef]
  9. Callon, M.; Law, J.; Rip, A. Mapping the Dynamics of Science and Technology: Sociology of Science in the Real World; Macmillan Press: London, UK, 1986. [Google Scholar]
  10. Chen, C. Predictive effects of structural variation on citation counts. J. Am. Soc. Inf. Sci. Technol. 2012, 63, 431–449. [Google Scholar] [CrossRef]
  11. Chen, C.; Hu, Z.; Liu, S.; Tseng, H. Emerging trends in regenerative medicine: A scientometric analysis in CiteSpace. Expert Opin. Biol. Ther. 2012, 12, 593–608. [Google Scholar] [CrossRef]
  12. Finnveden, G.; Hauschild, M.Z.; Ekvall, T.; Guinée, J.; Heijungs, R.; Hellweg, S.; Koehler, A.; Pennington, D.; Suh, S. Recent developments in Life Cycle Assessment. J. Environ. Manag. 2009, 91, 1–21. [Google Scholar] [CrossRef]
  13. Vries, M.D.; Boer, I.J.M.D. Comparing environmental impacts for livestock products: A review of life cycle assessments. Livest. Sci. 2010, 128, 1–11. [Google Scholar] [CrossRef]
  14. Weidema, B.P.; Thrane, M.; Christensen, P.; Schmidt, J.; Løkke, S. Carbon footprint: A catalyst for life cycle assessment? J. Ind. Ecol. 2008, 12, 3–6. [Google Scholar] [CrossRef]
  15. Finkbeiner, M. Carbon footprinting-opportunities and threats. Int. J. Life Cycle Assess. 2009, 14, 91–94. [Google Scholar] [CrossRef]
  16. Roy, P.; Nei, D.; Orikasa, T.; Xu, Q.; Okadome, H.; Nakamura, N.; Shiina, T. A review of life cycle assessment (LCA) on some food products. J. Food Eng. 2009, 90, 1–10. [Google Scholar] [CrossRef]
  17. ISO. Environmental Management-Life Cycle Assessment-Requirements and Guidelines. 2006. Available online: https://www.iso.org/standard/38498.html (accessed on 23 June 2019).
  18. Hertwich, E.G.; Peters, G.P. Carbon Footprint of Nations: A Global, Trade-Linked Analysis. Environ. Sci. Technol. 2009, 43, 6414–6420. [Google Scholar] [CrossRef] [PubMed] [Green Version]
  19. Flysjö, A.; Henriksson, M.; Cederberg, C.; Ledgard, S.; Englund, J. The impact of various parameters on the carbon footprint of milk production in New Zealand and Sweden. Agric. Syst. 2011, 104, 459–469. [Google Scholar] [CrossRef]
  20. Galli, A.; Wiedmann, T.; Ercin, E.; Knoblauch, D.; Ewing, B.; Giljum, S. Integrating Ecological, Carbon and Water footprint into a “Footprint Family” of indicators: Definition and role in tracking human pressure on the planet. Ecol. Indic. 2012, 16, 100–112. [Google Scholar] [CrossRef]
  21. Rotz, C.A.; Montes, F.; Chianese, D.S. The carbon footprint of dairy production systems through partial life cycle assessment. J. Dairy Sci. 2010, 93, 1266–1282. [Google Scholar] [CrossRef]
  22. Chen, C.; Ibekwe-SanJuan, F.; Hou, J. The structure and dynamics of co-citation clusters: A multiple-perspective co-citation analysis. J. Am. Soc. Inf. Sci. Technol. 2010, 61, 1386–1409. [Google Scholar] [CrossRef]
  23. Suh, S.; Lenzen, M.; Treloar, G.J.; Hondo, H.; Horvath, A.; Huppes, G.; Jolliet, O.; Klann, U.; Krewitt, W.; Moriguchi, Y.; et al. System boundary selection in life-cycle inventories using hybrid approaches. Environ. Sci. Technol. 2004, 38, 657–664. [Google Scholar] [CrossRef]
  24. Steinfeld, H.; Wassenaar, T.; Jutzi, S. Livestock production systems in developing countries: Status, drivers, trends. Rev. Sci. Tech. 2006, 25, 505–516. [Google Scholar] [CrossRef]
  25. Hellweg, S.; Mila, C.L. Emerging approaches, challenges and opportunities in life cycle assessment. Science 2014, 344, 1109–1113. [Google Scholar] [CrossRef] [PubMed]
  26. Kristensen, T.; Mogensen, L.; Knudsen, M.T.; Hermansen, J.E. Effect of production system and farming strategy on greenhouse gas emissions from commercial dairy farms in a life cycle approach. Livest. Sci. 2011, 140, 136–148. [Google Scholar] [CrossRef]
  27. Williams, A.G. Determining the Environmental Burdens and Resource Use in the Production of Agricultural and Horticultural Commodities; Cranfield University and Defra: London, UK, 2006. [Google Scholar]
  28. Wiedmann, T.O.; Suh, S.; Feng, K.; Lenzen, M.; Acquaye, A.; Scott, K.; Barrett, J.R. Application of hybrid life cycle approaches to emerging energy technologies–the case of wind power in the UK. Environ. Sci. Technol. 2011, 45, 5900–5907. [Google Scholar] [CrossRef]
  29. Tilman, D.; Clark, M. Global diets link environmental sustainability and human health. Nature 2014, 515, 518–522. [Google Scholar] [CrossRef] [PubMed]
  30. Laurent, A.; Olsen, S.I.; Hauschild, M.Z. Limitations of carbon footprint as indicator of environmental sustainability. Environ. Sci. Technol. 2012, 46, 4100–4108. [Google Scholar] [CrossRef] [PubMed]
  31. Goedkoop, M.; Heijungs, R.; Huijbregts, M.; De Schryver, A.; Struijs, J.V.Z.R.; Van Zelm, R. A Life Cycle Impact Assessment Method Which Comprises Harmonised Category Indicators at the Midpoint and the Endpoint Level. 2009. Available online: http://www.lcia-recipe.net (accessed on 23 June 2019).
  32. Thomassen, M.A.; Van Calker, K.J.; Smits, M.C.; Iepema, G.L.; de Boer, I.J. Life cycle assessment of conventional and organic milk production in the Netherlands. Agric. Syst. 2008, 96, 95–107. [Google Scholar] [CrossRef]
  33. Thoma, G.; Popp, J.; Nutter, D.; Shonnard, D.; Ulrich, R.; Matlock, M.; SooKim, D.; Neiderman, Z.; Kemper, N.; East, C.; et al. Greenhouse gas emissions from milk production and consumption in the United States: A cradle-to-grave life cycle assessment circa 2008. Int. Dairy J. 2013, 31, S3–S14. [Google Scholar] [CrossRef] [Green Version]
  34. Knudsen, M.T.; Meyer-Aurich, A.; Olesen, J.E.; Chirinda, N.; Hermansen, J.E. Carbon footprints of crops from organic and conventional arable crop rotations–using a life cycle assessment approach. J. Clean. Prod. 2014, 64, 609–618. [Google Scholar] [CrossRef]
  35. Pelletier, N.; Pirog, R.; Rasmussen, R. Comparative life cycle environmental impacts of three beef production strategies in the Upper Midwestern United States. Agric. Syst. 2010, 103, 380–389. [Google Scholar] [CrossRef]
  36. Beloin, S.P.; Heijungs, D.R.; Blanc, I. The ESPA (Enhanced Structural Path Analysis) method: A solution to an implementation challenge for dynamic life cycle assessment studies. Int. J. Life Cycle Assess. 2014, 19, 861–871. [Google Scholar] [CrossRef]
  37. Mery, Y.; Tiruta-Barna, L. An integrated “process modelling-life cycle assessment” tool for the assessment and design of water treatment processes. Int. J. Life Cycle Assess. 2013, 18, 1062–1070. [Google Scholar] [CrossRef]
  38. Fry, J.; Lenzen, M.; Jin, Y.; Wakiyama, T.; Baynes, T.; Wiedmann, T.; Malik, A.; Chen, G.; Wang, Y.; Geschke, A. Assessing carbon footprints of cities under limited information. J. Clean. Prod. 2017, 176, 1254–1270. [Google Scholar] [CrossRef]
  39. Nijdam, D.; Rood, T.; Westhoek, H. The price of protein: Review of land use and carbon footprints from life cycle assessments of animal food products and their substitutes. Food Policy 2012, 37, 760–770. [Google Scholar] [CrossRef]
  40. Casolani, N.; Pattara, C.; Liberatore, L. water and carbon footprint perspective in Italian durum wheat production. Land Use Policy 2016, 58, 394–420. [Google Scholar] [CrossRef]
  41. Ronga, D.; Gallingani, T.; Zaccardelli, M.; Perrone, D.; Francia, E.; Milc, J.; Pecchioni, N. Carbon footprint and energetic analysis of tomato production in the organic vs the conventional cropping systems in Southern Italy. J. Clean. Prod. 2019, 220, 836–845. [Google Scholar] [CrossRef] [Green Version]
  42. Strohbach, M.W.; Arnold, E.; Haase, D. The carbon footprint of urban green space—A life cycle approach. Landsc. Urban. Plan. 2012, 104, 220–229. [Google Scholar] [CrossRef]
  43. Heinonen, J.; Junnila, S. A life cycle assessment of carbon mitigation possibilities in metropolitan areas. In Proceedings of the Conference on Sustainable Building, Helsinki, Finland, 18 December 2010. [Google Scholar]
  44. Onat, N.C.; Kucukvar, M.; Tatari, O. Conventional, hybrid, plug-in hybrid or electric vehicles? State-based comparative carbon and energy footprint analysis in the United States. Appl. Energy 2015, 150, 36–49. [Google Scholar] [CrossRef]
  45. Basbagill, J.; Flager, F.; Lepech, M.; Fischer, M. Application of life-cycle assessment to early stage building design for reduced embodied environmental impacts. Build. Environ. 2013, 60, 81–92. [Google Scholar] [CrossRef]
  46. Blengini, G.A.; Carlo, T.D. The changing role of life cycle phases, subsystems and materials in the LCA of low energy buildings. Energy Build. 2010, 42, 869–880. [Google Scholar] [CrossRef]
  47. Deng, M.; Zhong, S.; Xiang, G. Carbon emission reduction effect of China’s final demand structure change from 2013 to 2020: A scenario-based analysis. Carbon Manag. 2019, 10, 387–404. [Google Scholar] [CrossRef]
  48. Zhong, S.; Chen, J. How environmental beliefs affect consumer willingness to pay for the greenness premium of low-carbon agricultural products in china: Theoretical model and survey-based evidence. Sustainability 2019, 11, 592. [Google Scholar] [CrossRef]
Figure 1. The number of published papers on carbon footprint and life cycle assessment (2006–2018).
Processes 07 00818 g001
Figure 2. Life cycle assessment (LCA) in the whole noun term co-occurrence network.
Processes 07 00818 g002
Figure 3. Streamlined noun term co-occurrence network.
Processes 07 00818 g003
Figure 4. Disciplines shown as a minimum spanning tree network of subject categories.
Processes 07 00818 g004
Figure 5. Document co-citation network with clusters.
Processes 07 00818 g005
Figure 6. Time-zones of document co-citation.
Processes 07 00818 g006
Figure 7. Timelines of co-citation clusters.
Processes 07 00818 g007
Figure 8. Time-zones of keywords.
Processes 07 00818 g008
Table 1. Top 12 highest frequency noun terms.
FrequencyYearNoun Phrases
7012009carbon footprint
6122009LCA
4662008environmental impact
3942009greenhouse gas emissions
2672009greenhouse gas
1582009life cycle
1552008climate change
1312010global warming potential
1082010environmental performance
992010global warming
922008carbon emissions
872011energy consumption
Table 2. Top 10 references based on cited frequency.
ReferencesCitation CountsSource
ISO [17]11514044 ISO
Finnveden et al. [12]89Journal of Environment Management
Vries et al. [13]75Livestock Science
Hertwich et al. [18]62Environment Science and Technology
Flysjo et al. [19]60Agriculture System
Weidema et al. [14]59Journal of Industrial Ecology
Finkbeiner [15]55The International Journal of Life Cycle Assessment
Galli et al. [20]42Ecological Indicators
Rotz et al. [21]52Journal of Dairy Science
Roy et al. [16]39Journal of Food Engineering
Table 3. Major clusters of co-citation references.
Cluster IDSizeSilhouette ScoreLabel (LSI)Label (LLR)Label (MI)
0320.836butterbeef production strategies pigmeat
1230.851production systemsirish milk productionsmallholder dairying
2220.737land useGalician fishing activitygreen competitiveness
3210.872measurementinput-output analysisfootprint analysis
4180.796eutrophicationblue water scarcity footprintwater use and water management
5180.895nutrient recoverydistributional aspectnutrient recycling
6170.882indicatorsaware methoddecision-making units
7170.872buildingdirect emissionurban systems
8110.882crop plantinggrain systemsaline agriculture
Table 4. Top 6 group authors based on cited frequency.
AuthorFrequencyCentrality
ISO (International Organization for Standardization)8750.2
IPCC (Intergovernmental Panel on Climate Change)4880.03
FAO (food and agriculture organization of the united nations)1690.06
EC (European Commission)1500.02
BSI (British Standards Institution)570
Ecoinvent570
Table 5. Top 20 personal authors based on cited frequency.
AuthorFrequencyCentralityAuthorFrequencyCentrality
B.P. Weidema1970.15E.G. Hertwich1230
R. Frischknecht1960.02N. Pelletier1100.06
T. Wiedmann1890.02C.L. Weber990.12
J.B. Guinee1550.03S. Solomon990.01
M. Lenzen1520.06M. Finkbeiner990.03
M. Goedkoop1490.09T. Nemecek920.03
C. Cederberg1360.1M.A. Thomassen870.09
G. Finnveden1280.03M.D. Vries790.01
S. Suh1240.2I. Vazquez-Rowe770.07
A. Flysjo1230.04A. Tukker700.01
Table 6. Top 10 journals based on cited frequency.
JournalFrequencyCentralityImpact Factor
Journal of Cleaner Production11350.146.395
International Journal of Life Cycle Assessment10370.094.868
Environmental Science and Technology7950.157.147
Journal of Industrial Ecology5510.14.826
Journal of Environmental Management4440.044.865
Energy Policy4390.054.880
Ecological Economics3980.044.281
Energy3940.065.537
Science of the Total Environment3930.145.589
Renewable and Sustainable Energy Reviews3900.0510.556
Table 7. Top 10 countries based on occurred frequency.
CountryFrequencyCentralityYear
USA3400.442008
PEOPLES R CHINA1770.12011
ITALY1590.122010
SPAIN1480.182010
ENGLAND1370.312009
AUSTRALIA1110.062010
GERMANY870.12009
NETHERLANDS820.122011
SWEDEN800.092010
CANADA590.042010
Table 8. Top 20 institution based on occurred frequency.
InstitutionFrequencyCentralityInstitutionFrequencyCentrality
Chinese Acad Sci290.28Univ Perugia150.07
Univ Santiago de Compostela280.15Tech Univ Denmark140.28
Aarhus Univ270.13KTH Royal Inst Technol140.04
Univ Cent Florida200.01Univ Sydney140.19
Wageningen Univ190.23Univ Manchester130.01
Univ Calif Davis190.01Texas A and M Univ120.01
China Agr Univ170.06Michigan Technol Univ120
Swedish Univ Agr Sci160.01Norwegian Univ Sci and Technol110.04
Leiden Univ150.2Hong Kong Polytech Univ110.02
Aalto Univ150Univ Ghent110.11
Table 9. Top 20 authors based on occurred frequency.
AuthorFrequencyCentralityAuthorFrequencyCentrality
VAZQUEZ-ROWE I180.01DE BOER IJM90.01
KUCUKVAR M180JUNNILA S80
TATARI O130HALL CR80
FEIJOO G130ONAT NC80
HERTWICH EG130HEINONEN J80
CEDERBERG C120.01YAN MJ70
MOREIRA MT110GABARRELL X70
EGILMEZ G110HOLDEN NM70
KENDALL A100MOGENSEN L70
INGRAM DL100HOSPIDO A70
Table 10. Top 10 references based on citation burst strength.
ReferencesYearStrengthBeginEnd2006–2019
S. Suh [23]20048.561820082011▂▂▃▃▃▃▂▂▂▂▂▂▂▂
H. Steinfeld [24]20067.696320082013▂▂▃▃▃▃▃▃▂▂▂▂▂▂
S. Hellweg [25]20146.963620162019▂▂▂▂▂▂▂▂▂▂▃▃▃▃
T. Kristensen [26]20116.846120142015▂▂▂▂▂▂▂▂▃▃▂▂▂▂
A.G. Williams [27]20066.423120102014▂▂▂▂▃▃▃▃▃▂▂▂▂▂
T.O. Wiedmann [28]20116.386720142015▂▂▂▂▂▂▂▂▃▃▂▂▂▂
D. Tilman [29]20146.3320172019▂▂▂▂▂▂▂▂▂▂▂▃▃▃
A. Laurent [30]20126.271320152017▂▂▂▂▂▂▂▂▂▃▃▃▂▂
M. Goedkoop [31]20096.235920132015▂▂▂▂▂▂▂▃▃▃▂▂▂▂
M.A. Thomassen [32]20086.212120102014▂▂▂▂▃▃▃▃▃▂▂▂▂▂
Table 11. Top 10 keywords based on citation burst strength.
KeywordsStrengthBeginEnd2006–2019
inventory7.404920102015▂▂▂▂▃▃▃▃▃▃▂▂▂▂
crop6.255520162017▂▂▂▂▂▂▂▂▂▂▃▃▂▂
soil5.801420172019▂▂▂▂▂▂▂▂▂▂▂▃▃▃
china5.624820172019▂▂▂▂▂▂▂▂▂▂▂▃▃▃
industrial ecology5.450920102015▂▂▂▂▃▃▃▃▃▃▂▂▂▂
land use change5.312220142015▂▂▂▂▂▂▂▂▃▃▂▂▂▂
perspective5.087720132014▂▂▂▂▂▂▂▃▃▂▂▂▂▂
food product5.087720132014▂▂▂▂▂▂▂▃▃▂▂▂▂▂
global warming potential5.053420102014▂▂▂▂▃▃▃▃▃▂▂▂▂▂
sustainable development4.741920112012▂▂▂▂▂▃▃▂▂▂▂▂▂▂

