Article

Hybrid Integrations of Value Stream Mapping, Theory of Constraints and Simulation: Application to Wooden Furniture Industry

1
Industrial Engineering Department, School of Applied Technical Sciences, German Jordanian University, Amman 11180, Jordan
2
Mechanical Engineering Department, Faculty of Engineering Technology, Al Balqa Applied University, Marka, Amman 11134, Jordan
*
Authors to whom correspondence should be addressed.
Processes 2019, 7(11), 816; https://doi.org/10.3390/pr7110816
Submission received: 19 September 2019 / Revised: 25 October 2019 / Accepted: 31 October 2019 / Published: 5 November 2019
(This article belongs to the Special Issue Synergies in Combined Development of Processes and Models)

Abstract

:
This paper studies manufacturing processes in a wooden furniture manufacturing company. The company suffers from long manufacturing lead times and an unbalanced production line. To identify sources of waste and delay value stream mapping (VSM) and a discrete event simulation model is implemented. VSM is used to visualize and analyze the major processes of the company and provide quantifiable KPIs; the manufacturing lead-time and then Overall Equipment Effectiveness (OEE) settings. A discrete event simulation model is then built to analyze the company on a wider scale and provide the data required to identify bottlenecks. Building on the data gathered from the production lines and the simulation model, two-bottleneck detection methods are used, the utilization method, and the waiting time method. Then based on the comparison of the two methods a third bottleneck detection is utilized; the scenario-based method, to identify the primary and secondary bottlenecks. After the bottlenecks are identified, changes are then evaluated using the simulation model and radar charts were built based on the improved simulation model, which evaluates the effect of changes in the utilization and OEE results. This work managed to neutralize the effect of one of the main bottlenecks and minimize the effect of the other. The manufacturing utilization was increased by 15.8% for the main bottleneck resources followed by 2.4% for the second one. However, it is hard to convince the traditional administration of this small size manufacturing plant to adopt a completely revolutionizing, costly, and risky (at such level) lean manufacturing approach. This paper studies and provides a much lower in cost and verified scheme of enhancement.

1. Introduction

One of the biggest challenges for manufacturing companies is usually cutting cost and improving production as the competitiveness of such companies rely on the balance of reasonable pricing and quality of products. In order to achieve such, it is vital to reduce bottlenecks and waste sources and aim to achieve maximum efficiency. Lean manufacturing is a revolutionary philosophy that identifies non-value-adding activities as waste and ultimately aims to eliminate such activities from all processes [1,2,3,4]. Many tools have been used to achieve lean manufacturing, such as cellular manufacturing, Just in Time (JIT), total productive maintenance (TPM), 5S and Value stream mapping (VSM).
VSM can be defined as all the value-added and non-value-added actions required to bring the product through the necessary flow needed to convert raw material from the suppliers into a final product in the arms of a customer [5]. VSM approaches the entire process flow where first a diagram showing information and material flow or how the actual process operates is built. VSM helps in identifying sources of waste, as well as in discovering and deciding on the lean tools to be used for the elimination of this waste [4,6]. In spite of the effectiveness of lean tools, there are many challenges in their implementation, as they usually require drastic changes to current setups, which proves costly. Therefore, convincing management to commit to lean thinking concepts proves to be a major roadblock. Hence, it is very important to provide a transition phase of proof concept using reliable tools such as discrete event simulations. Then another major step is to provide a capable tool for continuous monitoring and quantifying potential gains and losses once changes are implemented [7,8,9,10].
Theory of Constraints (TOC) emphasizes the importance of identifying and eliminating bottlenecks (constraints) in the manufacturing process–not only to increase productivity but as a tool for measuring and controlling the flow of materials. In order to identify bottlenecks, they have to be defined, a bottleneck has different definitions in the literature, including “A bottleneck is a function that limits output” [11]. “A resource whose capacity is lower than the demand, or the process that limits the throughput” [12]. While Kuo et al. defined it as “The machine whose production rate in isolation is the smallest among all machines in the system” [13]. The next important step is the identification of such constraints. TOC provides an important problem-structuring and -solving methodology, which changes the way of thinking of managers, and it is based on the idea that every system has at least one bottleneck that can be defined as any kind of situation that impedes the system to reach high-performance level in terms of its purposes [14,15,16,17].
Computer simulation of any process is commonly created before launching a new process/line or to predict and control the behavior of a process. Simulation is helpful for gaining a detailed understanding of a system to enhance its performance. Simulation software differs changes that occur in time, so any system where events change in time can be simulated [18]. Building and running the Discrete Event Simulation model sets necessary details, which will be otherwise hidden or lost within the real system. In addition, changes experiments can be performed using the simulation model, rather than with the real-life system, thus eliminating the necessity for expensive real-life experiments [18]. One of the most commonly used simulation software is (ARENA-Rockwell Automation© Wexford, PA, USA); (which was used in the simulation of this study), AutoMod as well as Witness. These softwares are known as “Visual Interactive Modeling”, which provides an animated model showing the movement of entities in the process and representing it in detail [18]. Moreover, the model can be changed at any step and tested when anything is modified.
In this research, instead of trying to apply a costly traditional approach to enhance the production and resource utilization for a furniture wooden production company, we seek to understand and apply an integrated algorithm that utilizes a combination of lean manufacturing tools; VSM, simulation, TOC, and OEE in a hybrid mode to maximize the effectiveness of these lean tools.

1.1. Integrating VSM and Simulation

Integrating VSM and simulation provides a coherent methodology to analyze and evaluate the current and future states of production lines, and to document and identify the areas of improvements and any required redesigns. Afterward, the impact of such improvements or redesigns is assessed to identify the bottlenecks that are most affecting the production [19]. The data collected during the implementation of value stream mapping provides the basis for building the current state simulation models. However, there are key differences between the goals of value stream mapping and simulation, as the value stream map provides a static look into the current state, while simulation provides a dynamic view of the current state and an environment to test the future state through the use of stochastic variables. Therefore, to build a simulation model based on VSM, it is necessary to gather extra data to the ones provided by the VSM such as inter-arrival time and scheduling to define the stochastic variables [20,21,22,23,24]. Ultimately, VSM and simulation provide a holistic look of the system, but VSM is an efficient tool to design a system and visualize it at a certain point in time, while simulation is an efficient tool to analyze the system in real-time and add the 4th dimension to the study, which takes time into perspective [23].

1.2. Integration of VSM and TOC

A value stream consists of all the activities that are value-adding as well as non-value-adding. Identifying value streams helps to understand how the process operates with all the material flow and the information flow through production. Various parameters such as cycle time, rework and scrap, Work-in-Process (WIP) are observed and noted down. It helps to plan improvements that make it easier to meet customer demands [16,25]. The Current State Map (CSM) demonstrates the flow of information and material as a product goes through the manufacturing process. It is created by walking down the production line. The analysis of VSM is conducted to identify bottlenecks and wastes in the manufacturing process. The Future State Map (FSM) chart uses lean manufacturing techniques to eliminate bottlenecks, reduce or eliminate wastes. It is used to identify root causes and provide process improvements. These improvements are then carried out according to an implementation plan which consists of detailed steps and actions needed to improve the production process [26].

1.3. Integration of TOC and Simulation

Simulation can be a very powerful tool in detecting bottlenecks. A simulation model enables the analyst to model either an existing system or a system that was not built yet in real life; moreover, the user is able to test it under different conditions. Since the simulation model is able to visualize material flows and times, it can detect bottlenecks using waiting times and utilization [26]. It was also stated by Simsit et al. that TOC is a philosophy that focuses specifically on the weakest points or rings in the process to improve the system’s performance [15]. The constraint and bottleneck detection in this paper are mainly dependent on the results of the simulation as well as the OEE. The simulation provides us with results such as the waiting times and the utilization, and those are used in the detection of our bottlenecks or system constraints [27].

1.4. Integration of VSM, TOC, and Simulation

VSM is an extremely valuable tool in lean manufacturing and continuous improvement. VSM provides the model and the data, thus increasing the practicality and accuracy of the simulation. While simulation adds the perspective of dynamism and time to VSM. After being simulated, the VSM is no longer just a snapshot; it is a moving picture, which offers insights that may have been missed if VSM alone had been used. Simulation of the VSM allows the team to try out the suggested improvements without causing any interruptions, and it enables the ideas to be tested with less cost and time. VSM and simulation are a natural combination, as each one enhances the other’s value in bottleneck detection and making the production process leaner [3,23,28]. Usually, an accurate model of the current state is achieved through an iterative process to ultimately reach a verified model. This iterative process includes implementing different scenarios, changes, and tests to ultimately determine the primary and secondary bottlenecks for the best improvement [4,17,26,27].

1.5. Overall Equipment Effectiveness (OEE)

A commonly used comprehensive indicator of performance is Overall Equipment Effectiveness (OEE) [29]. It can be defined as a performance metric that can detect production losses [30,31,32]. OEE is used as an assessment method, which aids to reach lean production goals, where a benchmark value or improvement target is set and monitored [29], such that it can be quantified and described as a percentage number that is calculated by multiplying the availability rate, performance, and quality rate. When this percentage is calculated, it indicates how well the equipment/process of a line is utilized. The OEE calculations in this work were based on the equations of availability, performance, and quality.

2. The Company and Its Processes

Madi Furniture & Décor is one of the oldest wood manufacturing plants in Jordan. It was established in 1977 as a family business. The company processes include highly customizable orders for industrial, commercial, and residential markets in Jordan and the Middle East. It carries its operations across two plants in Amman and Aqaba that share most of the processes with a few processes only carried out in one plant and not in the other. The raw materials used are wooden panels, in different types and dimensions, but the most common dimension used is 2.44 × 1.22 m2. The demand for the products differs per period, since there is no constant demand, as it depends on the size of the project to be conducted. The following is a summary of the processes carried out at the company:
  • Cutting: The processes to achieve the dimensions of wood panels or beams needed to manufacture the furniture pieces. It is done using several types of wood saws such as the band saw, table saw, hand-held saw;
  • Edging: Covering the exposed edges of wood panels with strips of wood to make the pieces aesthetically pleasing;
  • Drilling: Drilling holes in the wood or removing certain parts to achieve functional purposes.
  • Wrapping: Wrapping the pieces to be transported with bubble wrap to protect them from damage while being transported;
  • Assembly: A manual and customizable process to reach the finished product that is ready to be shipped to the customer.

3. Methodology

The first step in this work was conducting diagnostic visits to the factory to understand the current state of work and collect initial data by interviewing the engineers and workers. Then the problem is identified, and the objectives are set as establishing a case study utilizing simulation, VSM, and TOC for implementing lean tools within the factory. Next, ABC analysis was conducted to identify the three most profitable products to identify their processes to be studied as a potential improvement. VSMs were created for the three processes and an OEE analysis is conducted in parallel from the collected data. Simulation models were built based on the VSMs, and then the simulation models and OEE data were validated by comparing the results to the real-life values and production figures.
Once the data is validated, bottleneck detection is carried out based on the results of the simulation models. First, the utilization and waiting time methods are used to identify bottlenecks, then the results of the two methods are compared, if results correlated, the primary and secondary bottlenecks are immediately decided. If the results are not correlated, then the scenario-based method is conducted to make the decision.
At the same time, radar charts are created to visualize the resulting data from OEE and bottlenecks as a graphical presentation of multiple quantitative variables comparisons. The best improvement scenario is then suggested based on those results, and further improvements are suggested using future state VSM. Figure 1 explains the complete problem-solving approach utilized in this research work.

ABC Analysis

The ABC analysis was conducted for the data collected from previous orders that go back to a period of a year and a half. This approach was used in order to determine which products contribute to the highest cost and generate the most profit, which is the most important product to be focused on. As shown in Table 1 below, the ABC analysis results show that the three main products ordered and generated the highest profit were Doors, Cupboards, and Claddings. Since the same tools and analysis conducted to study the three main products, in this paper we will only show the results of cupboards, which has the highest percentage of improvements hence less replication can be seen in the results.

4. Results and Discussion

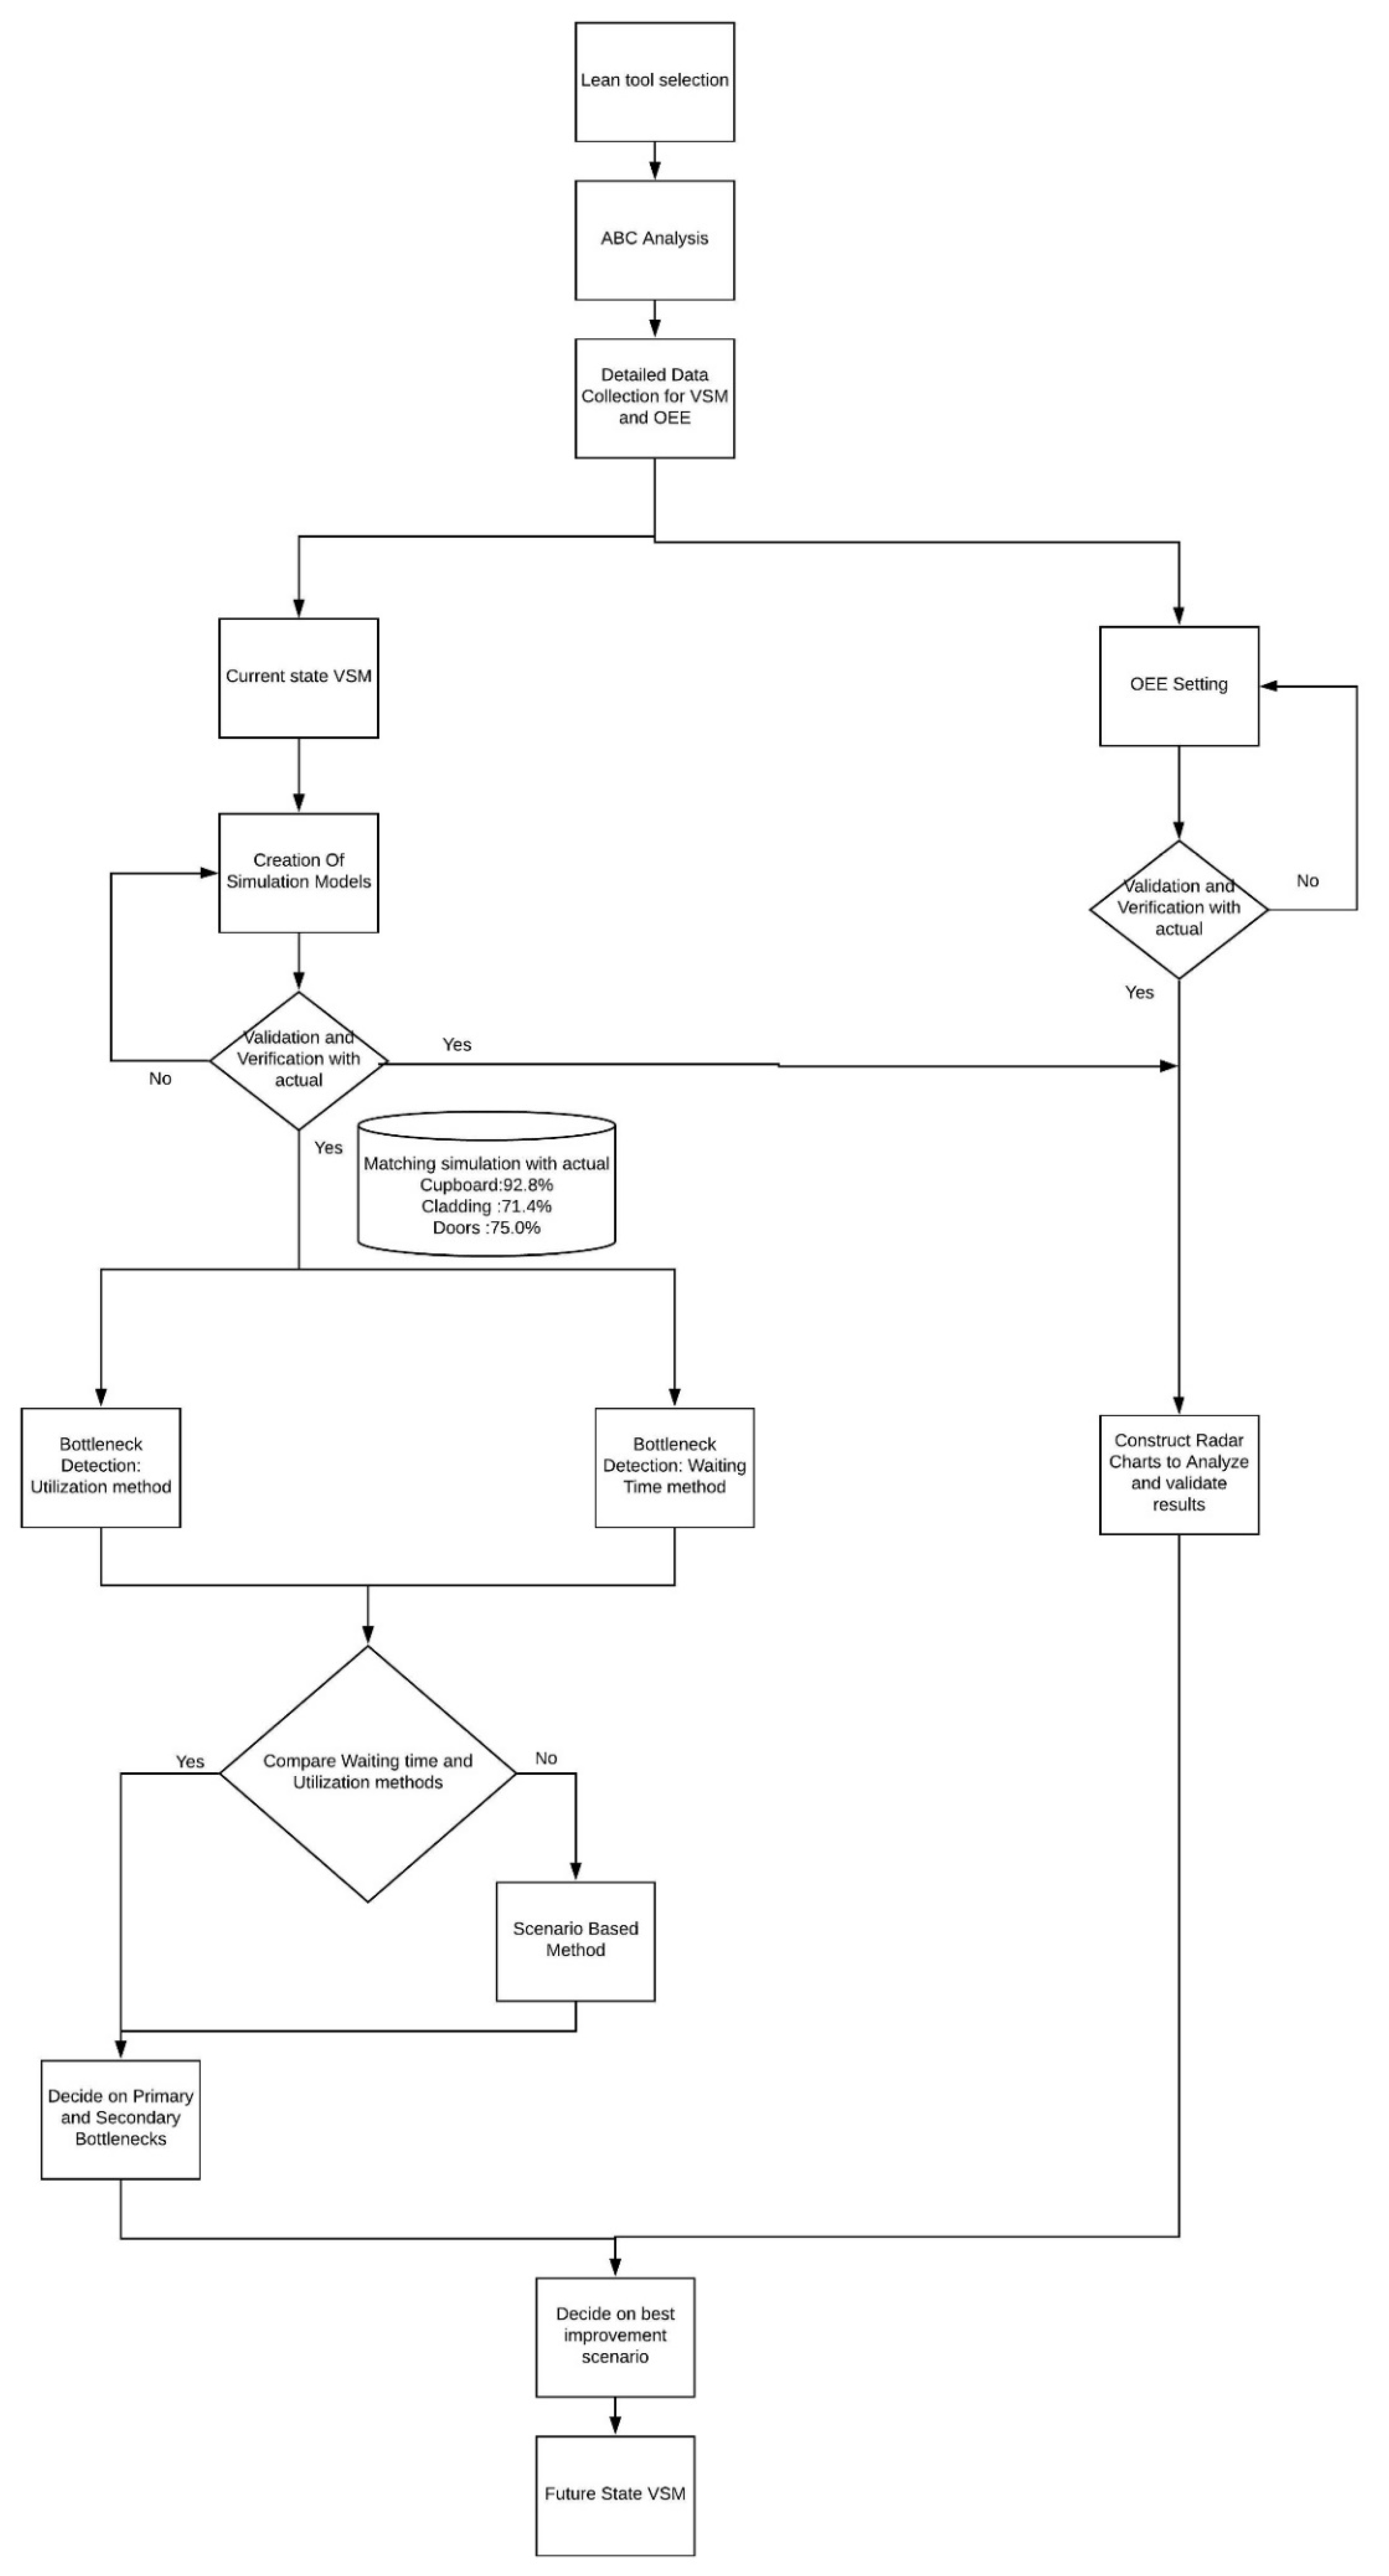
4.1. VSM: Current-State Map

The VSM visualizes process flow for a product or family of products as well as identify production status and any potential alerts (Andons) that might be causing problems to the production system. These Andons might include potential bottlenecks, cycle time problems, capacity limitations, inability to meet schedule, etc.
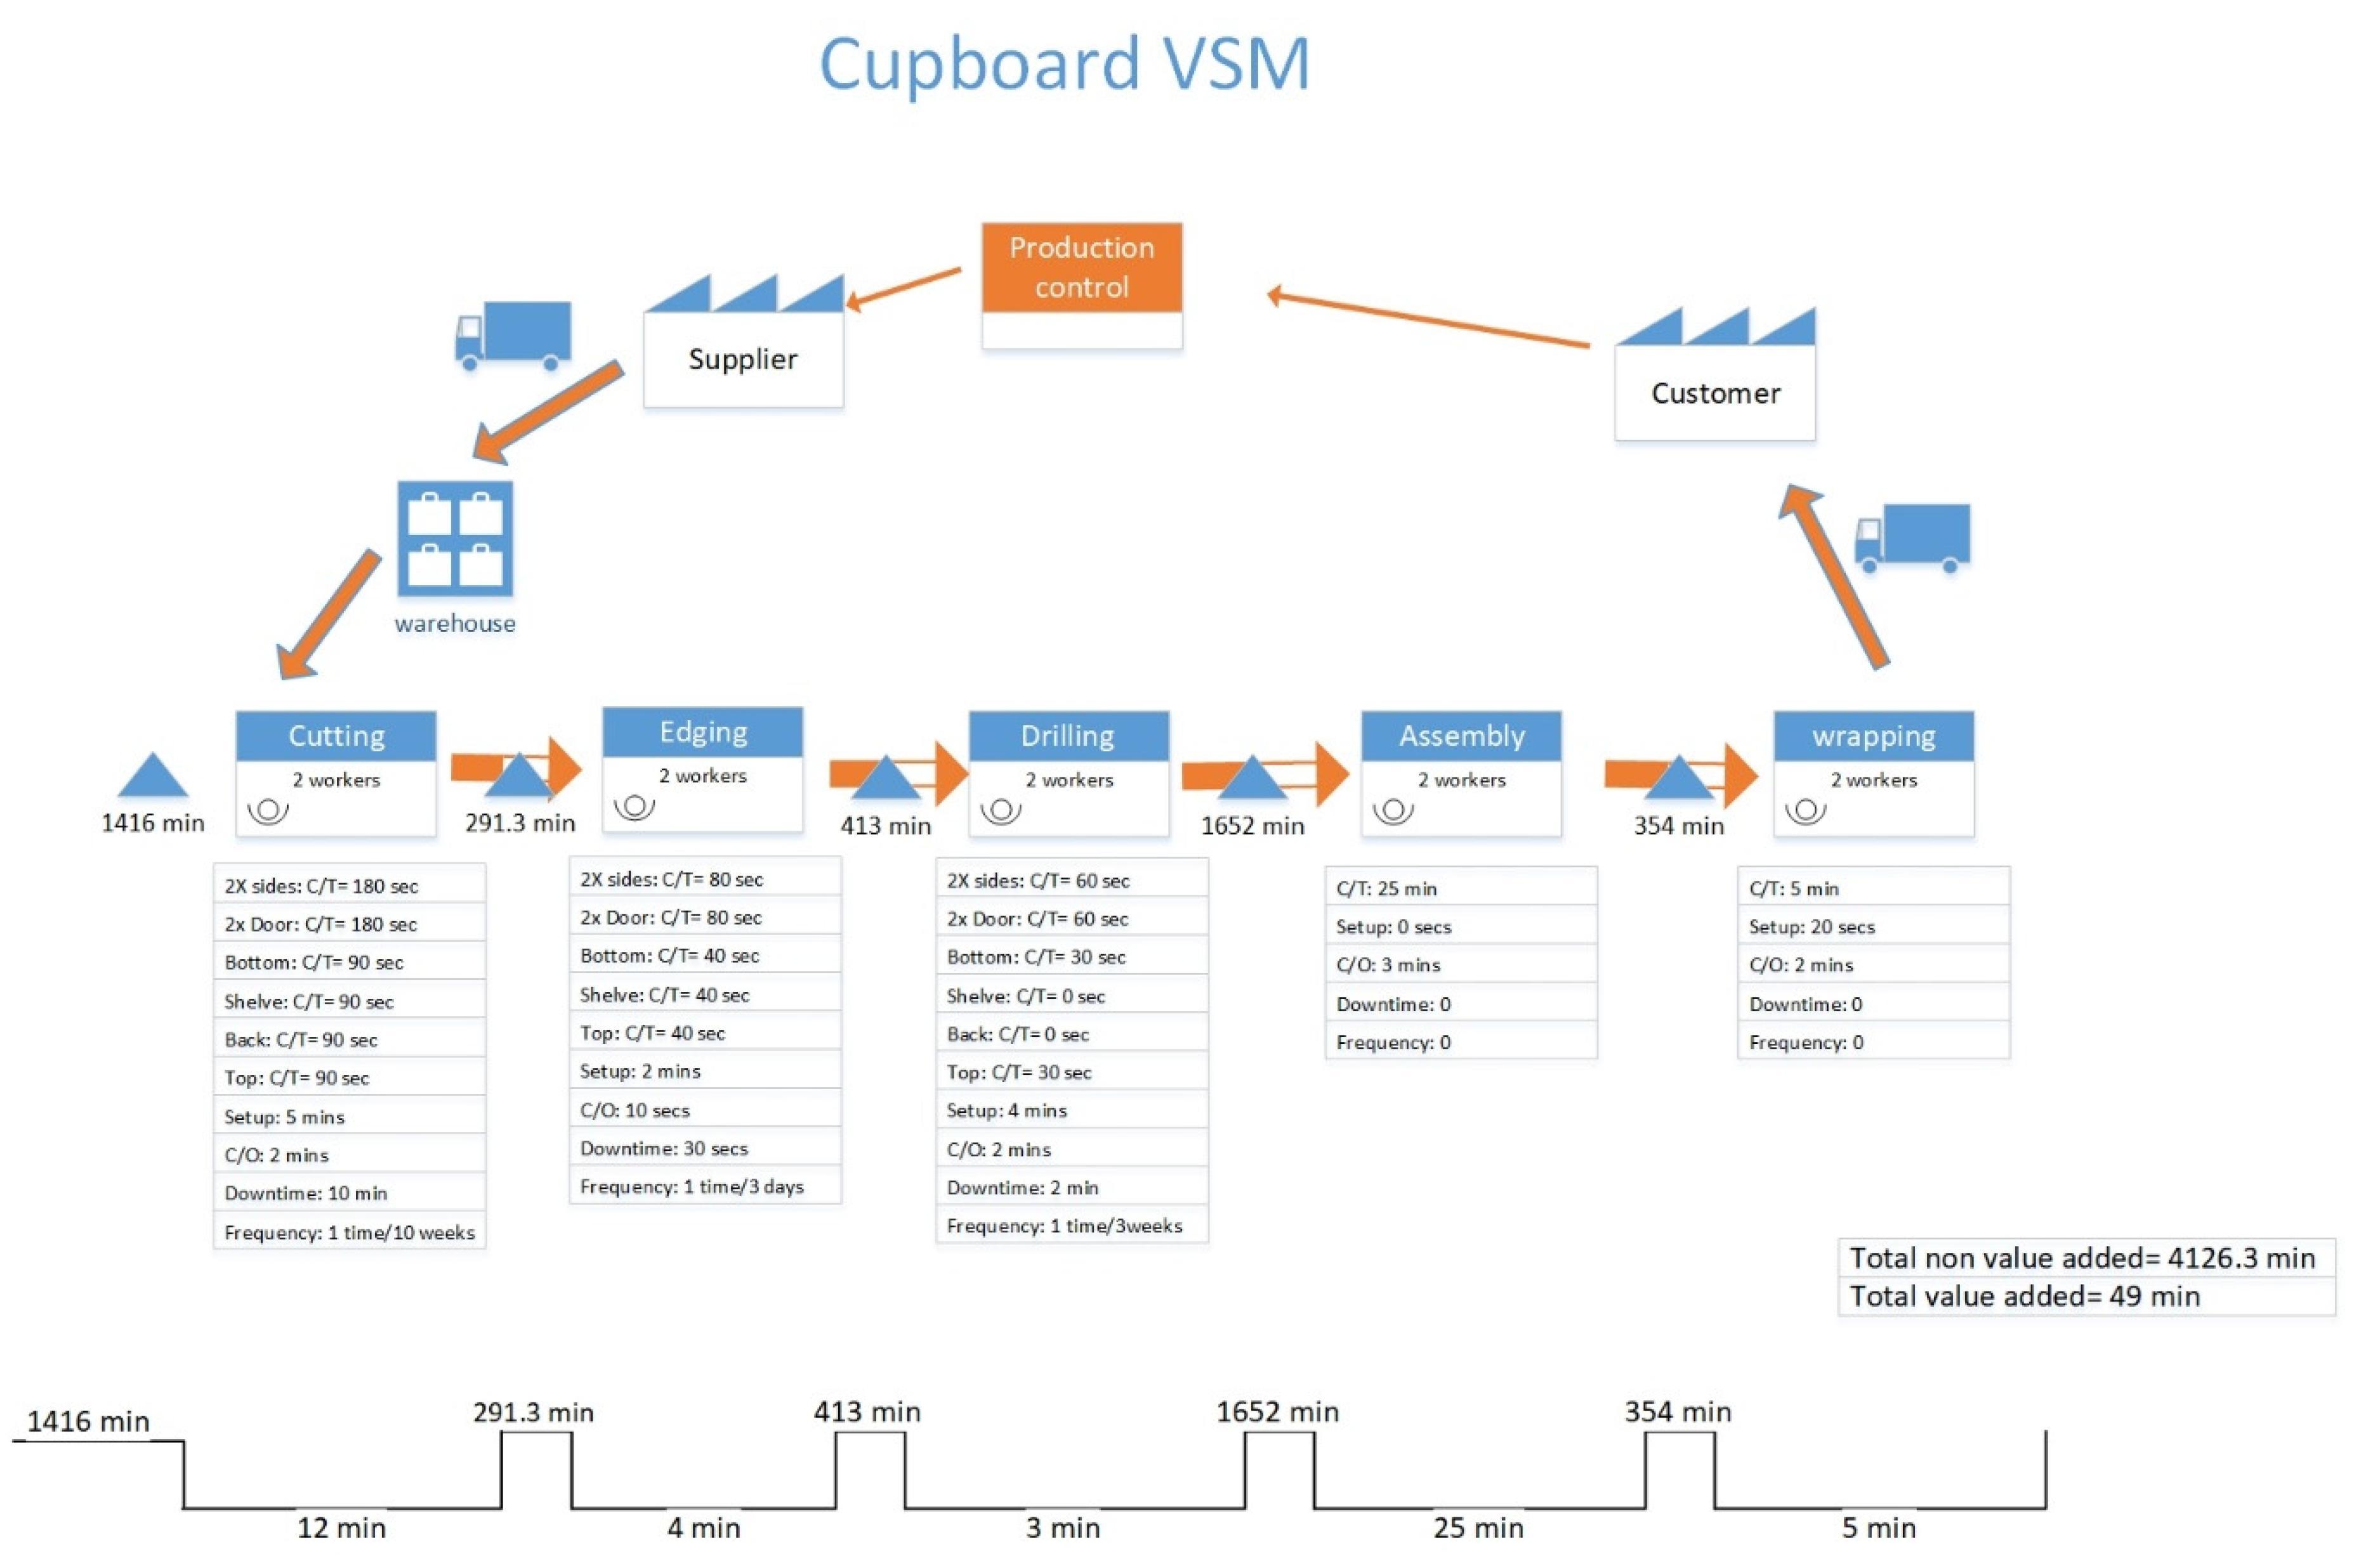
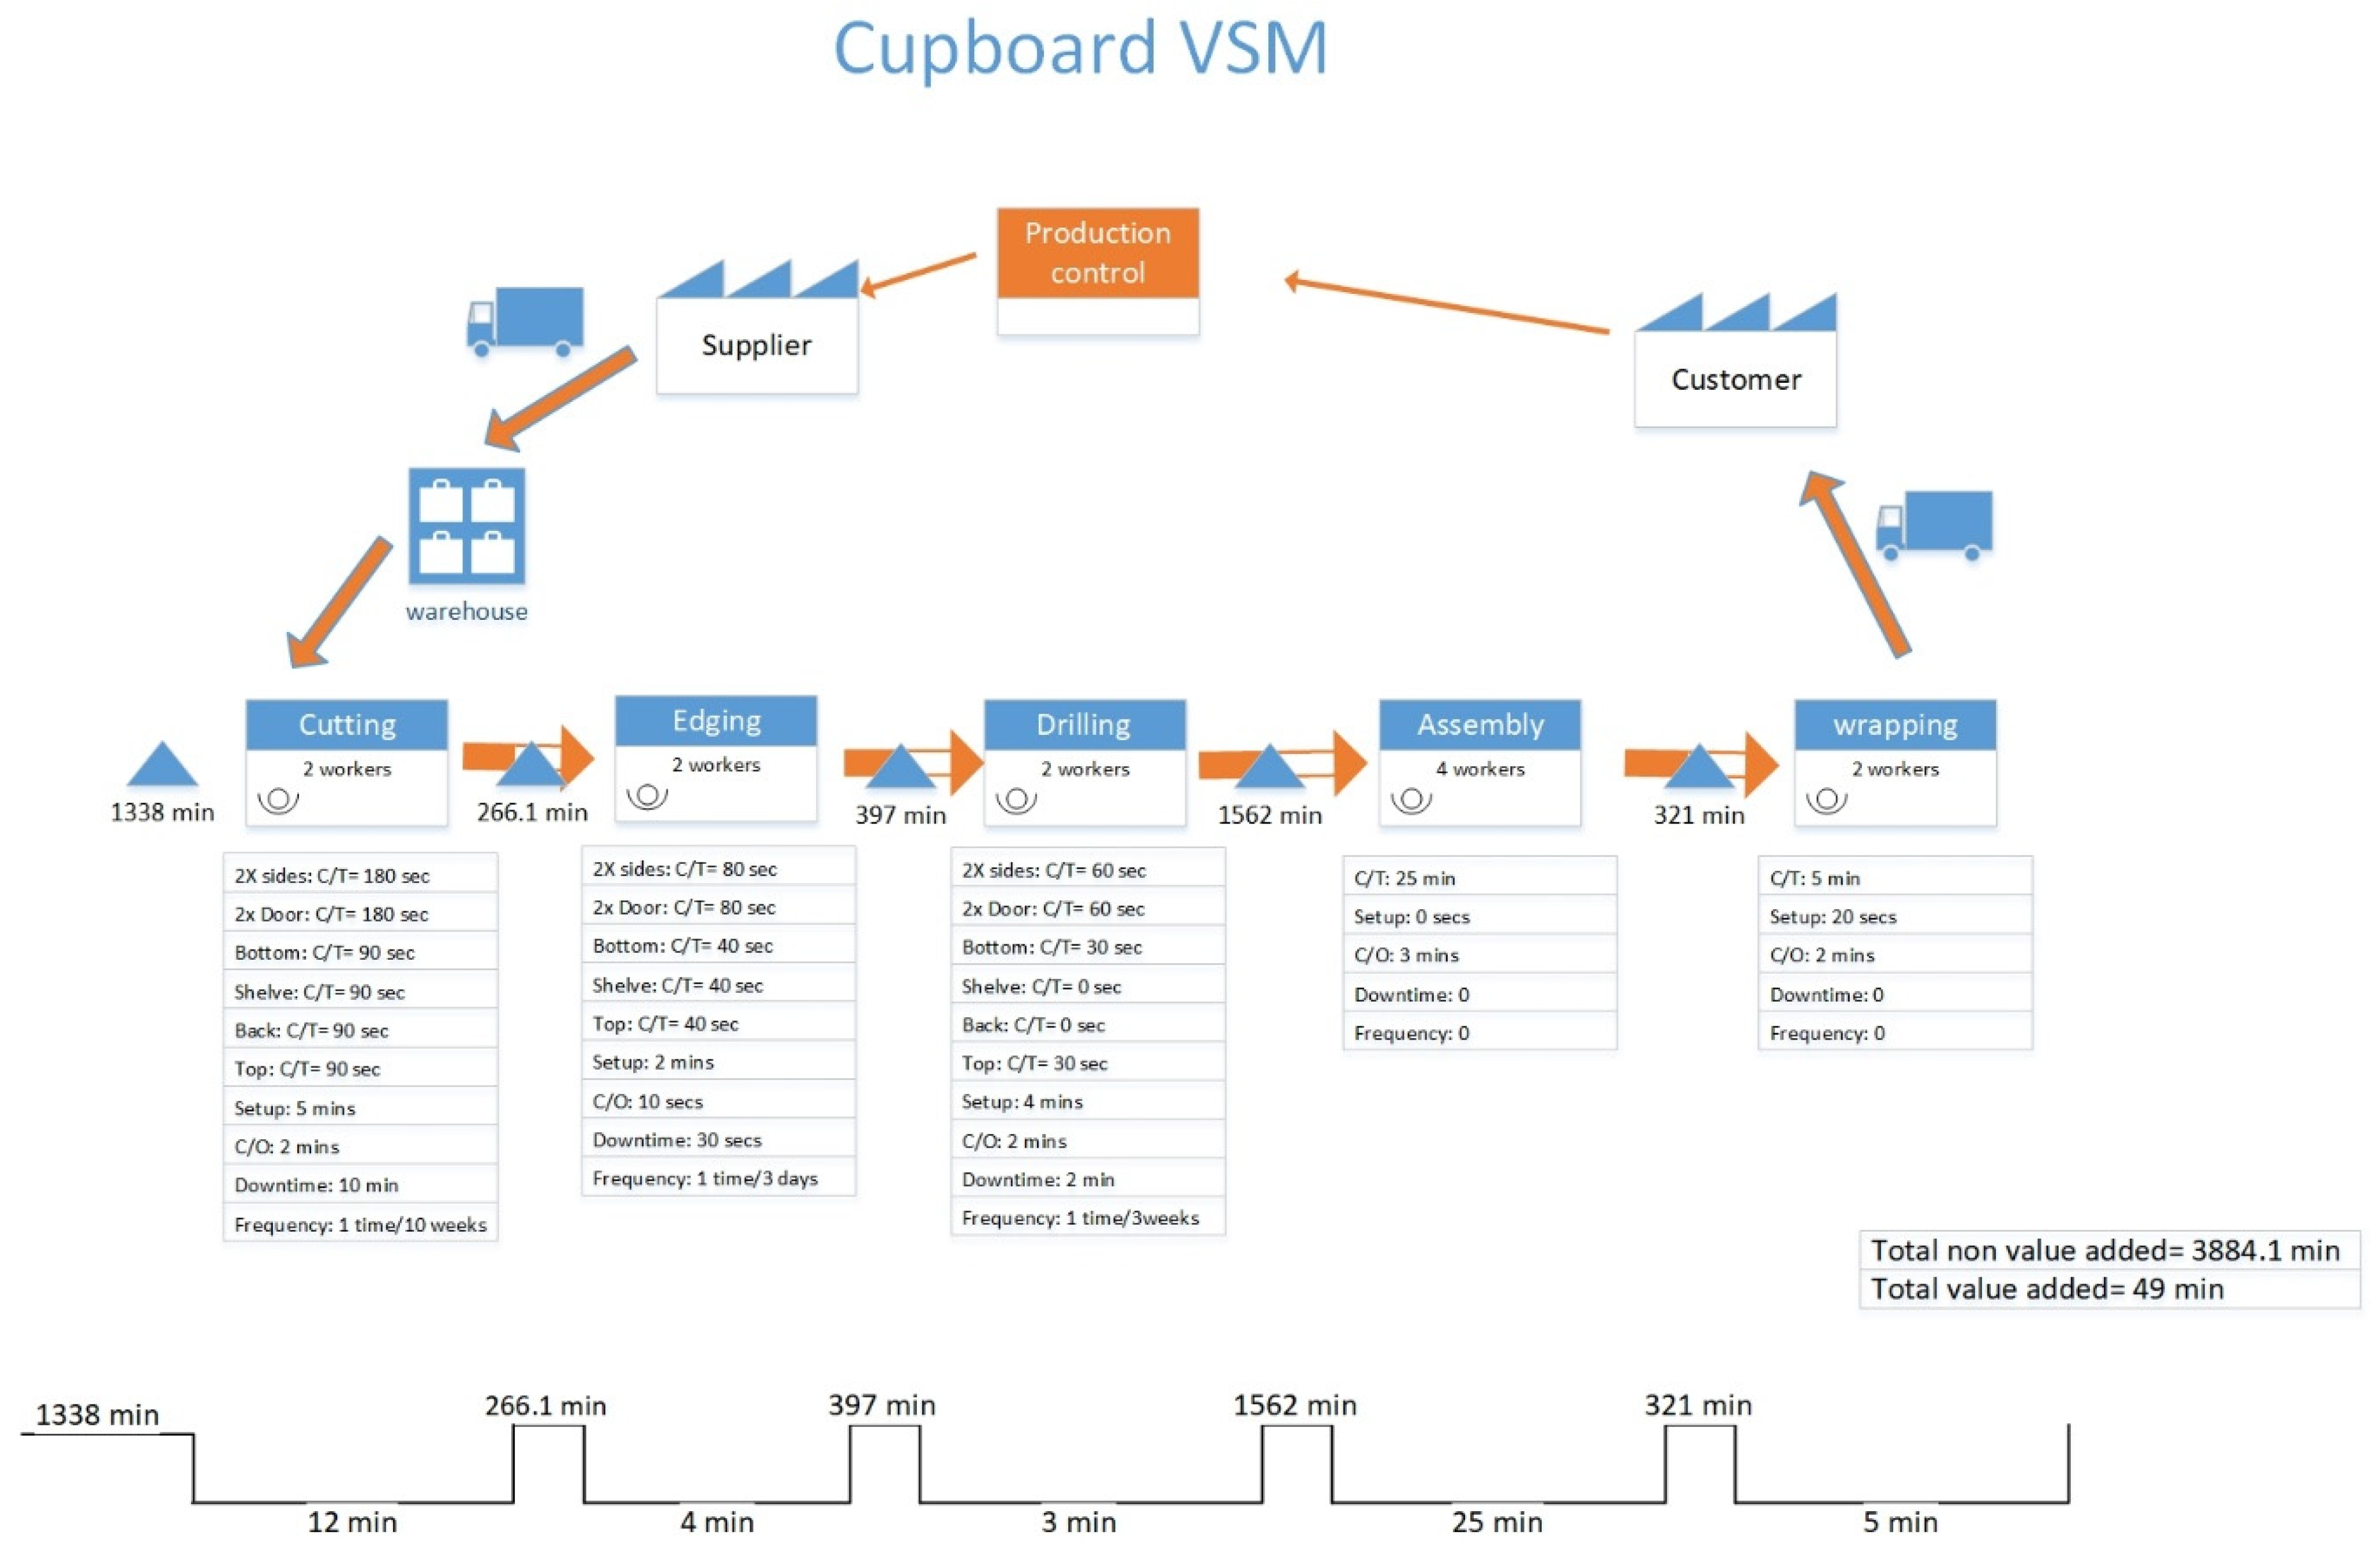
The structure and elements are divided into three parts. On the top, the information moving from right to left shows the customer’s requirements. In the middle, the steps of manufacturing processes are shown in boxes including the process name, the number of workers, the cycle time, setup time, change-over-time, in addition to the breakdowns. The processes are connected with a push arrow. WIP is shown in triangles between the processes. The bottom part of the VSM shows the time-line, which includes the value-added-time needed for each process at the bottom and non-value-added time such as queues and down-times at the top.
The cupboard is made from six main parts: Two sides, two doors, bottom, shelf, back, and top. As shown in the VSM below, the first process is cutting, followed by edging. After the pieces have been edged and sided, they are then moved to the next process. The third and final process is done using the computer numerical control (CNC) router machine, which is responsible for drilling parts. Once all pieces are completed, it is assembled to create the finished cupboards, finally, the finished products are wrapped to be shipped to the customer. From the VSM, it is noticed that the total value-added-time is 49 min and the total non-value-added time is 4126 min, indicating a major area for improvements (Figure 2).

4.2. Simulation Model

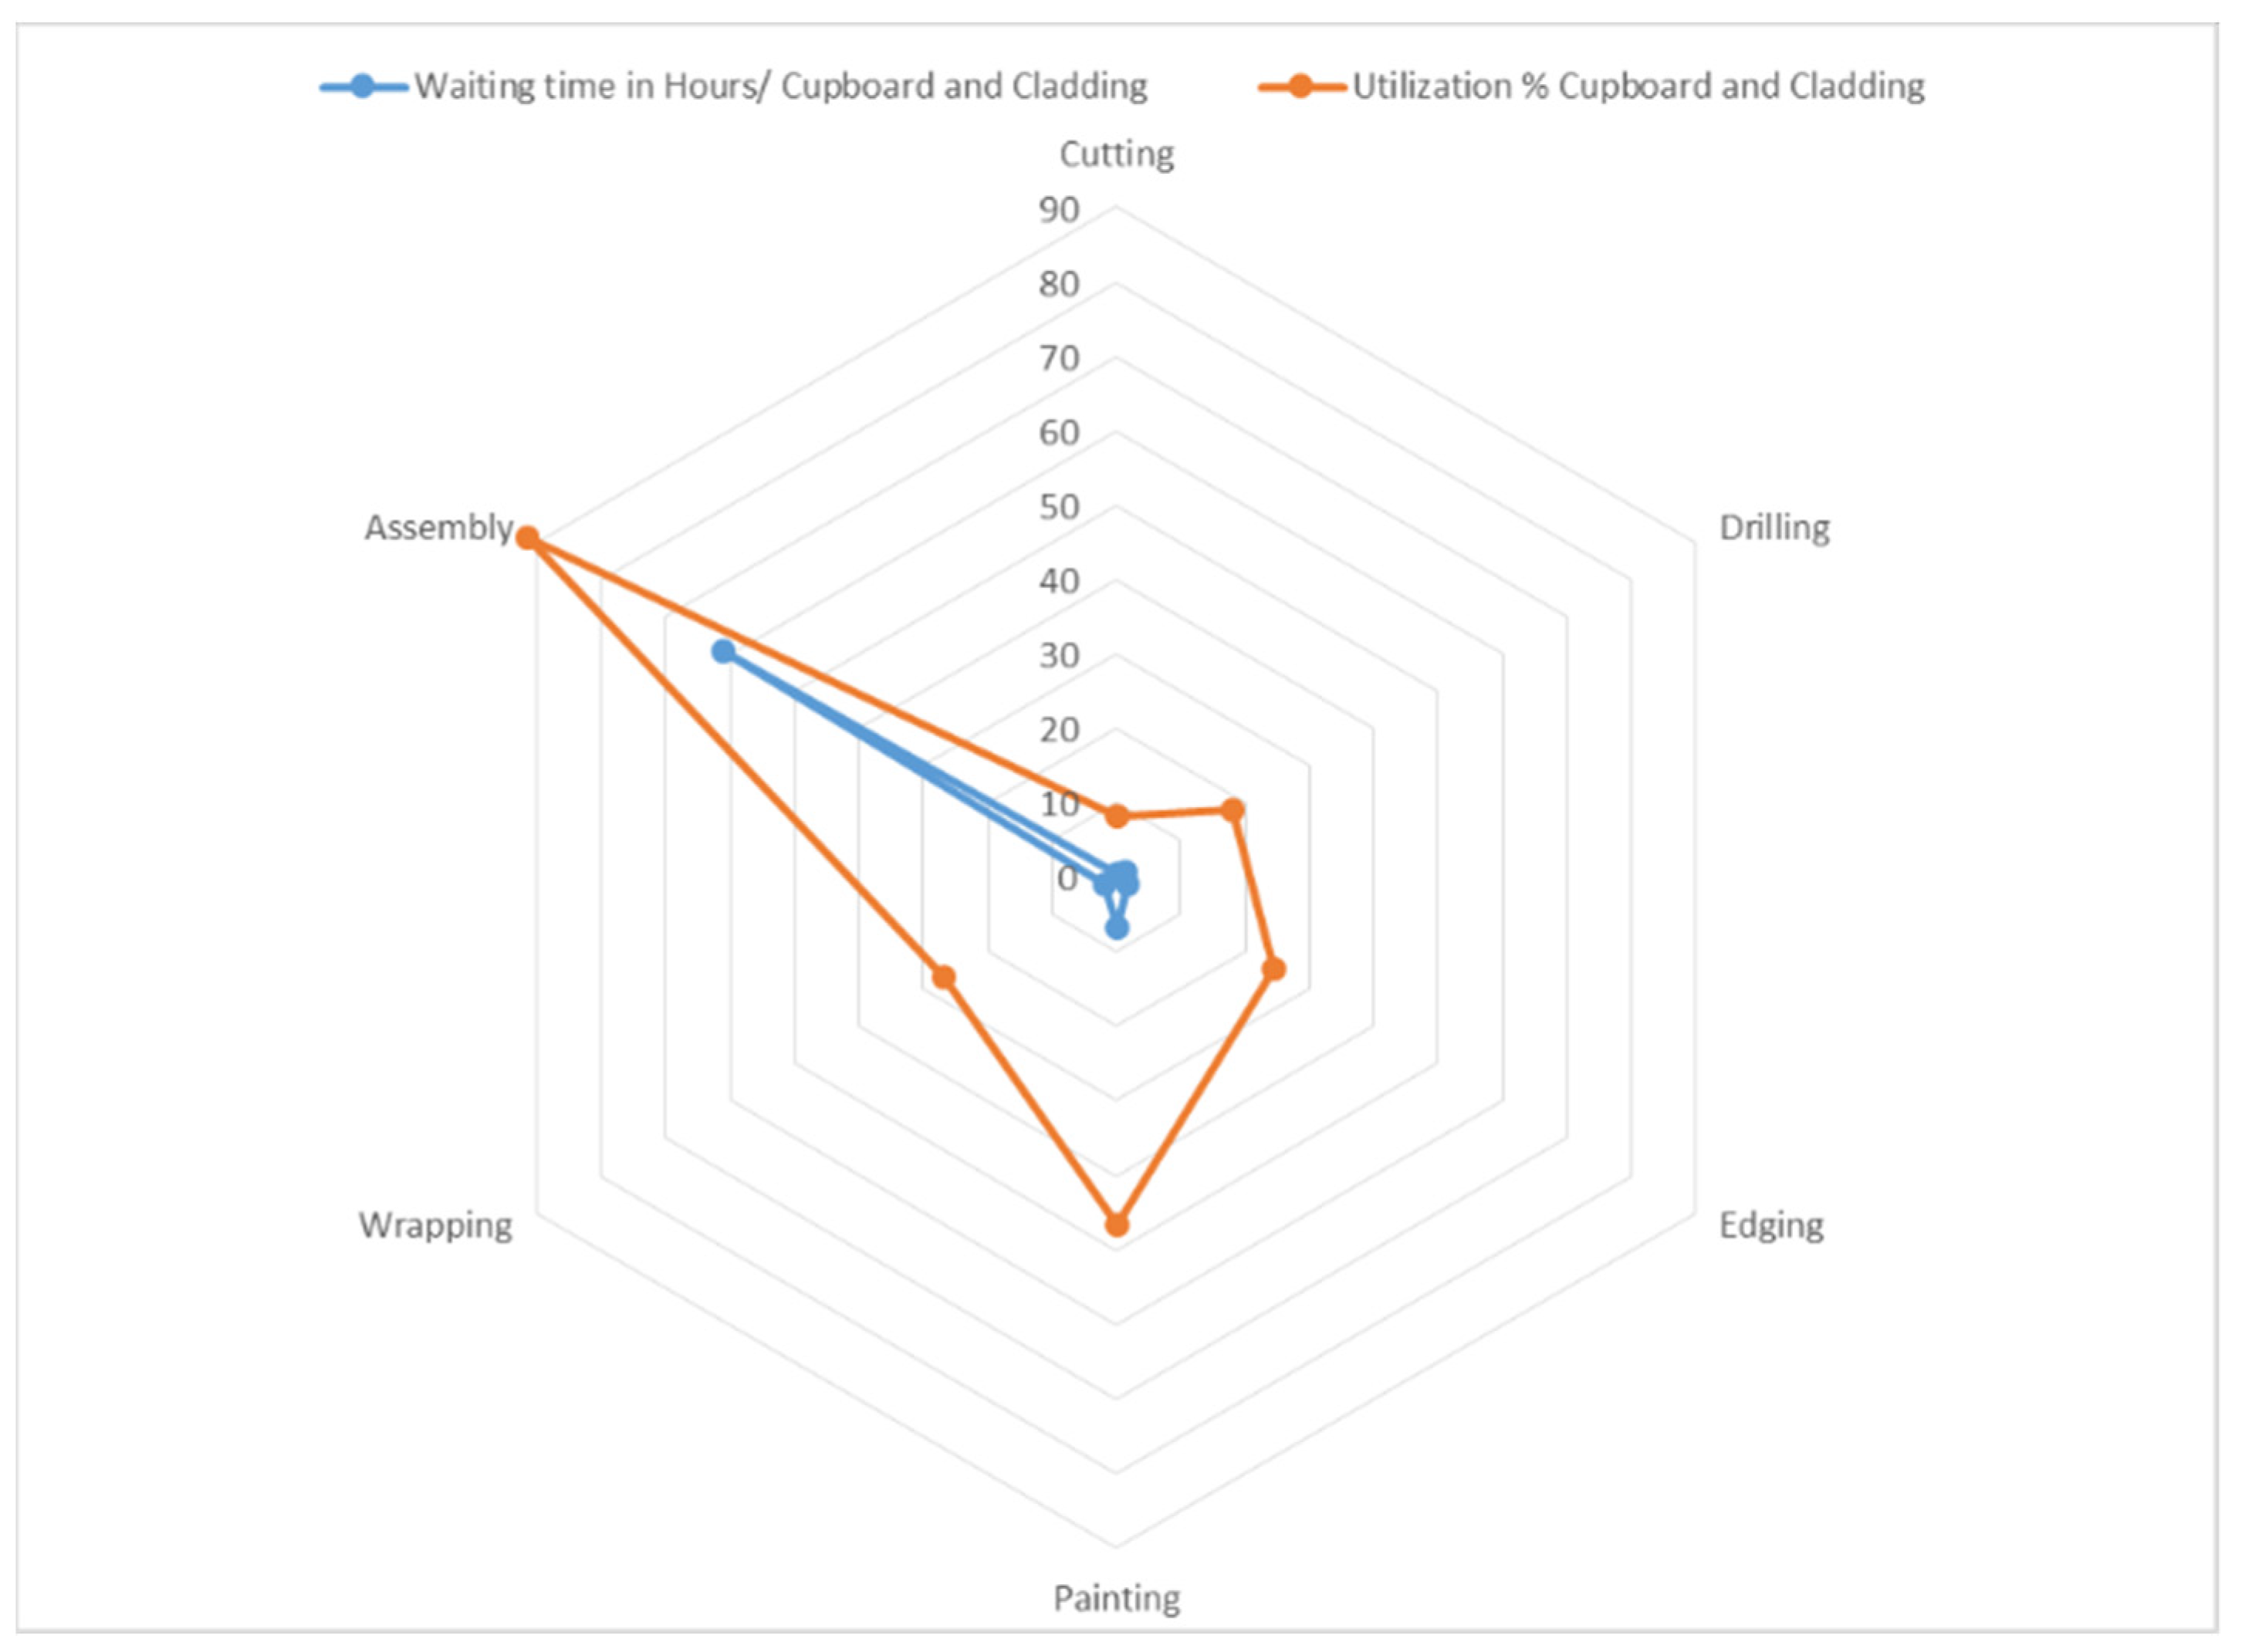
The simulation model provides an accurate estimation of the impact of Andons on the production system. In addition to the other performance measures, the simulation model will mainly evaluate bottlenecks in the production. Three bottleneck detection methods are used in this paper: utilization method, waiting time method, and scenario-based method. Based on the initial results obtained from the model, a number of scenarios will be tested. The algorithm starts with the resource that is maximally utilized and considers improving them by reducing process time and/or adding more resources. Then, the next highest utilization resource is considered, and new scenarios will be created accordingly. All resources identified as Andons in the VSM will be considered in a similar manner. Each scenario runs on the simulation model and then the overall system performance was evaluated. Performance measures including resource utilization, product cycle time, and the ability to meet deadline are used to evaluate system performance. Based on the results obtained, a proposed solution is provided to decision-makers. The last stage would be to examine the impact of the proposed solutions on the production facility, adding new resources to improved flow, and finally to create VSM future state.
The model was built using Rockwell’s Arena 14.7. It is a discrete-event system simulation, where events occur at discrete points of time on the simulation clock. For the simulation part of the analysis, two models were constructed for the analysis of production lines. The first model was concerned with modeling the production line of the doors, while the other model simulated the production lines of the cupboards and cladding, as both share the same resources in the factory. The simulation models were based on the VSMs drew in the previous stage and the data collected previously includes setup time, changeovers, and cycle time, which were recorded through observing workers for production runs and calculating the average of observations, the simulation model input data is shown in Table 2.
Since the cupboard and cladding share the same production resources, one simulation model combining both products was created. Cladding is produced at first, then the entities needed to manufacture the cupboards are released, a separate model set to duplicate three pieces, the first piece is set to make the sides, second to make the doors, and the final piece to make the top, shelve and bottom.
A decision module works as follows: it divides the three entities into their own paths using the expression [(MOD, counter, 3) = 1, (MOD, counter, 3) = 2], this expression sends each entity to one of the three paths depending on the variable value each entity holds, if the module after dividing the variable by 3 is equal to 1, then the entity is sent to the first path, if its equal to 2, then its sent to the second path, and if its none of the above, then its sent to the third path.
A separate module duplicates the entity to 59 other entities that represent the raw materials that the workers load into the cutting machine when the processing starts. The sides are the first pieces to be worked out, they are batched into 3 to be loaded on the cutting machine, similar batching done with the cladding. After all 60 entities leave the cutting module, they pass into two separate modules, which were intended for loading the entities into the cutting machine while the other separate duplicated the entities in two as each board makes two sides.
Next, the entities pass through a signal module which releases the entity needed to produce the cupboard door, the entities pass through the exact steps as the sides passed through and when they’re done a signal is given for the release of the entity required to make the top, bottom and shelve. When all the pieces required to make the 60 cupboards are cut, the sides are released from the holding module so that they can enter the edging process. After all the sides finish with the edging module a signal is sent to release the door pieces and so on. After the top, bottom and shelving pieces are edged, the sides are released for drilling on the CNC machine. the pieces are worked on by fixed sequence, while one entity type is done by the operators at one of the three processes, the other entity types are being held in a hold waiting to be released by a signal.
After all the processing finish on all of the entity types, the cupboards are assembled, 2 batched sides enter a match module along with two batched doors, the output of this batching process is also matched and batched with a top, bottom and a shelve to complete a cupboard. After the cupboards are assembled they pass through a signal to initiate the production of the cladding again. Finally, the cupboards are wrapped so that they can be transported.

4.3. OEE Analysis

OEE analysis was conducted to study the effectiveness of the manufacturing processes as well as the subcomponents of those processes, to be able to compare it to the simulation results and validate it.
Both horizontal and vertical OEEs were calculated for both processes and machines. Total Available Time per shift was set as 570 min. Based on the information provided by the factory management, there is a one-hour break each shift, and there are on average 2 h wasted by employees for personal and minor technical problems, therefore, the planned production time was calculated as the total available time-breaks, and that is equal to 9.5 - 3 = 6.5 h (390 min). After collecting basic information about the shifts and times, the following equations for OEE were used [33]:
Planned Production time = Shift length - Breaks
Run Time = Planned Production Time - Stop Time
Good Count = Total count - Reject Count
Availability = Run Time/Planned Production Time
Performance = (Run Time/Cycle Time)/(Total Available Time/Cycle Time)
Quality= Good Count/Total Count
OEE = Availability × Performance × Quality
To calculate the horizontal OEE for the cupboard, an input table was constructed for each process as shown in Table 3, which are cutting, edging, drilling, assembly, and wrapping. The horizontal calculation results calculate the OEE of the whole manufacturing process. Three OEE values were calculated for the three processes based on the equations outlined above, as shown in Table 4.
In the horizontal OEE Calculation, the OEE for manufacturing Cupboards turned about to be 54.1%. It is also noticeable that the highest factor affecting this factor is the performance of the processes, which could be considered as a potential improvement.
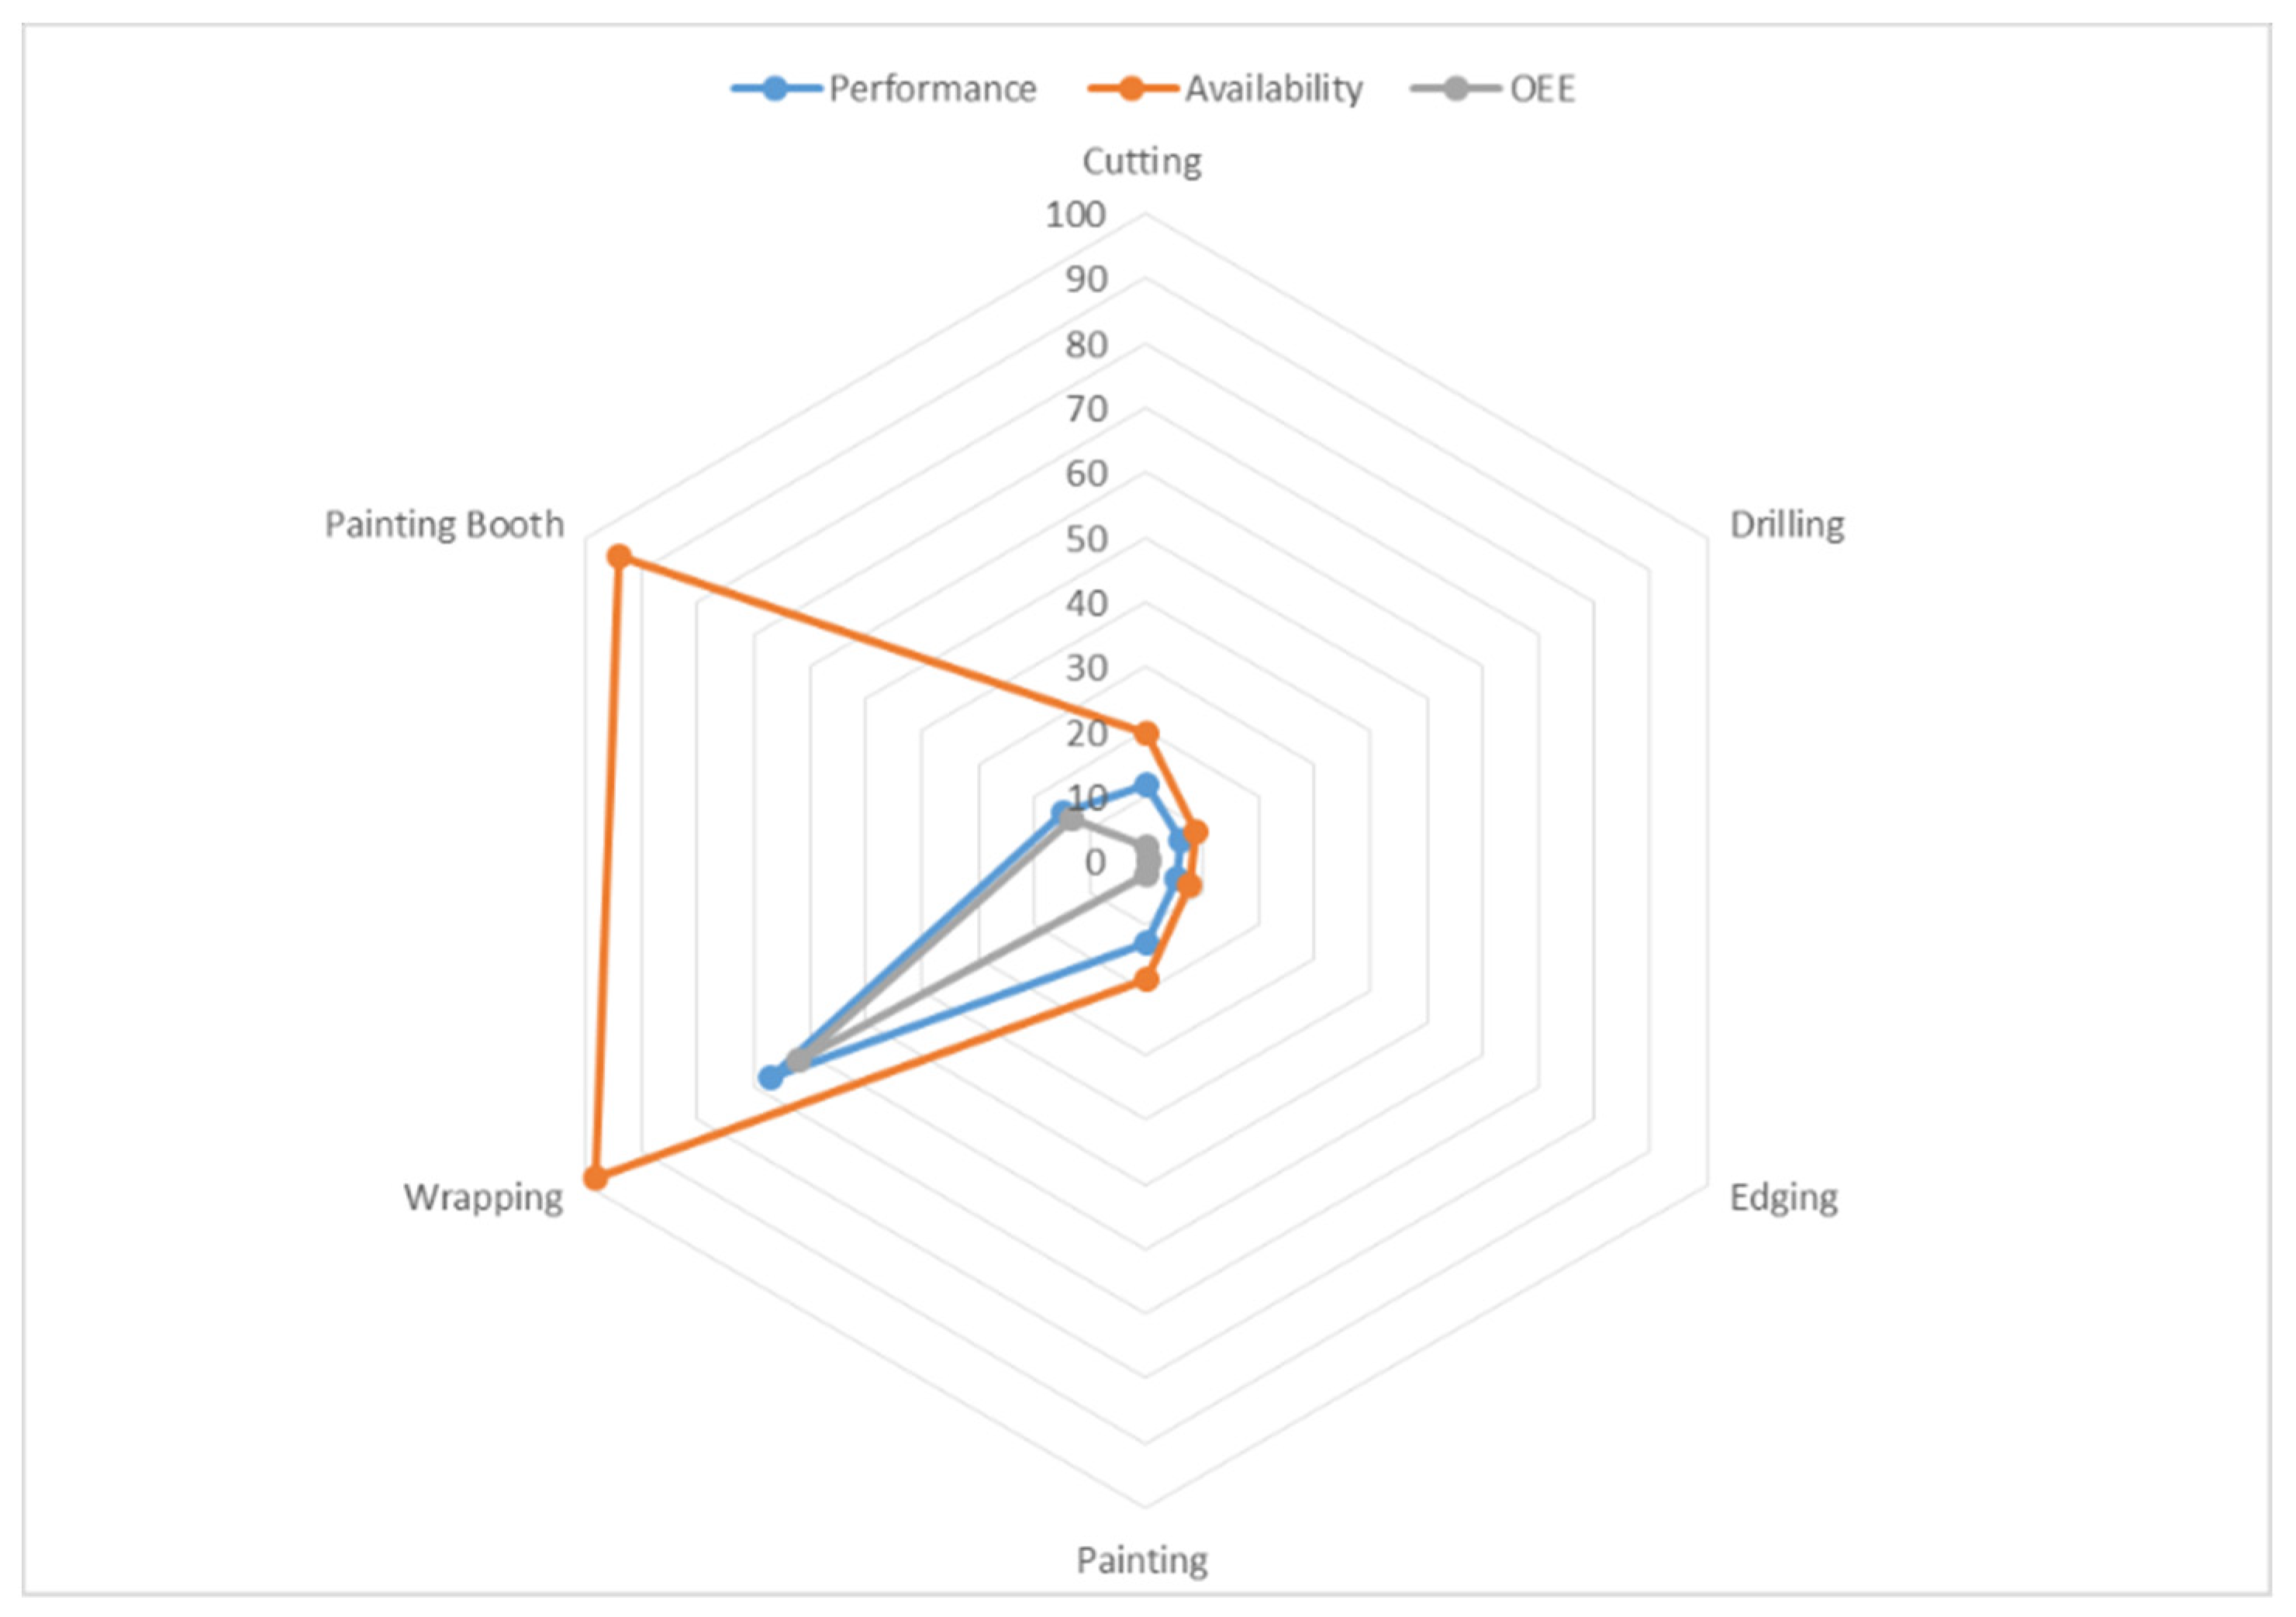
In the Vertical OEE calculation, OEE is calculated for machines that are used in the two or in all the three processes. Depending on our processes, the common machines between the processes are Cutting, Edging, Drilling, Wrapping, Painting as well as the Painting Booth. These processes are not necessarily used in all three processes, some are used in the production of only cupboards and claddings and not doors for example. Table 5 shows the results for the vertical OEE.

4.4. Simulation Model and OEE Validation

After the simulation models were created and the OEE analysis was conducted, the output of these two methods was compared to real-life outputs for calculation verifications and to see if the simulation model can mimic real life. Based on the results shown in Table 6, It shows that the percentage difference is within the acceptable limits even though the system doesn’t 100% mimic the real-life system, hence it can be used for validation. However, the error generated from the difference was taken into consideration when improving the system.
The radar charts shown below were created for different metrics based on the simulation and OEE results, to display how the machines are performing for each metric. Figure 3 shows the utilization for the machines in the cupboard and cladding process, the radar shows that the assembly process has the highest utilization of 91.4%, which also has the highest waiting time of 61 h. Figure 4 illustrates the performance, availability and OEE results for the processes. The wrapping process showed the highest performance value of 67.1%. The availability metric shows that the wrapping and painting booth processes have the highest values of 98.1% and 94% respectively. For OEE results, the wrapping process showed the highest value of 61.9, as seen in Figure 4.

4.5. Bottleneck Detection

After creating and validating the simulation model, three bottleneck detection methods were used on the outputs in order to detect the bottlenecks; the utilization method, the waiting-time method, and the scenario-based method utilization method. Utilization is expressed as the proportion or percentage of the available time that a piece of equipment or a system is operating. Therefore, depending on this definition, a bottleneck would be the resource/machine with the highest utilization percentage. Table 7 shows the utilizations obtained from the simulation model for the resources/machines for the process of manufacturing cupboards and claddings.
The results show that the number of the assembly workers is the primary bottleneck, also the number of operators working on the rest of the process can be considered as the secondary bottleneck, then painters as a tertiary bottleneck. Hence another methodology is utilized, the waiting-time method to compare and verify those results.

4.6. Waiting Time Method

This method determines the bottlenecks, using waiting time data generated by the simulation model. In the Waiting-Time Method, a bottleneck is defined as the workstation, where the parts wait the longest time before processing.
Using the Waiting-Time Method, the primary bottleneck is the Assembly process as shown in Table 8, and the secondary is the Painting process. Then all other processes performed by the operators were found to be the third bottleneck. Based on these results, it can be concluded that the assembly process is the primary bottleneck, but to determine which resource/process, between operators and painting, is the secondary bottleneck we need to use another bottlenecks detection method: the Scenario-Based method.

4.7. Scenario-Based Method

In the Scenario-Based Method, the bottlenecks detected earlier were improved by doubling all resources available for each bottleneck in order to relief the processes by the same percentage. Then simulation was run to generate the data to analyze the effect of this improvement on the processes by comparing the total output. The improvements as output and percentages are shown in Table 9.
The number of operators was doubled for all the processes, this resulted in an improvement of 16% for the assembly operation, 3% for the operators perform the remaining processes, and almost no improvement for the painting processes, thus determining that the assembly process is the primary bottleneck.

4.8. Future State VSM

The future state value stream map is shown in Figure 5, highlight that the processes required to manufacture cupboards are ordered in the same way, increasing the number of workers at the bottleneck processes caused the production line to have higher throughput, the higher production rate caused a reduction in the WIP for all the related processes. The non-value added time decreased from 4126 min to 3884 min hence resulted in 6% improvement.
In this research work, the methodology and approach we used helped a wooden furniture manufacturing company in Jordan that suffers from unbalanced production lines and long manufacturing leading times due to a non-constant demand. we analyzed the operations using VSM and Simulation, then applied OEE and simulation for validation and evaluation. Followed by applying three bottleneck detection methods to decide for primary and secondary bottlenecks and to decide for the best improvement scenario. The future VSM gives a process-oriented view of the enhancement and the reduction in non-value adding time to identify areas of improvement. This proposed solution algorithm which combined a full set of lean tools can be a cornerstone for future improvements in this research stream.

5. Conclusions

The incapability of the factory to satisfy large orders in a short period of time suggests that there are flaws in the production lines in terms of wastes and bottlenecks. To detect the bottlenecks, and improve the output of the production lines, VSM and simulation models along with bottleneck detection methods were used to evaluate the overall system performance and to pinpoint the major problems that hinder our throughput.
Through the implementation of these tools mentioned above, bottlenecks were identified efficiently in the production lines and proved efficient in pinpointing sources of waste in addition to evaluating and quantifying changes to a system before implementation.
Constructing VSMs helped in visualizing each process as a whole, it also provided basic data that acts as the foundation to build simulation models that helped in observing the dynamic changes to the system and how they impact the performance of the factory.
VSMs and simulation are the ideal methods for assessing potential future improvements in the system before implementing them in real life. The results of the simulation model such as the Queue time and the utilizations provided that data needed to identify the primary and secondary bottlenecks in each process. To assess the effectiveness of the factory’s processes. The OEE was calculated to identify the area where improvements should be focused on.
After running the simulation models for a sufficient period of time, the bottlenecks which delayed the performance were pointed out, then improvements scenarios were plugged in and the results were analyzed to see which improvements impacted our performance the most. Additional improvements to the processes were shown in the Future map F-VSM, which shows that combining the tools mentioned above resulted in 6% production improvements.
This work provides a foundation for the understanding of systematic integrations of lean tools. Such that we invoke a process-based integrated hybrid algorithm to analyze the operations in furniture wooden manufacturing company and suggest process/production improvements. Although we have conducted our algorithm in Madi Furniture & Décor company, it is still needing to be applied in other manufacturing sectors and service providers to show and demonstrate its full capabilities as a complete hybrid tool for applying lean manufacturing theory in practice.

Author Contributions

Conceptualization, E.A., A.M.A. and K.A.S.; Data curation, J.D., S.S. and A.M.; Formal analysis, E.A., A.M.A., J.D., S.S. and A.M.; Investigation, E.A., A.M.A. and K.A.S.; Methodology, E.A., A.M.A., K.A.S.; Project administration, E.A. and A.M.A.; Software, E.A. and J.D.; Supervision, E.A. and A.M.A.; Validation, E.A., A.M.A. and K.A.S.; Visualization, J.D., S.S. and A.M.; Writing – original draft, J.D., S.S., A.M. and A.M.A; Writing – review & editing, E.A., A.M.A. and K.A.S.

Funding

This research received no external funding.

Conflicts of Interest

The authors declare no conflict of interest.

References

  1. Baysan, S.; Kabadurmus, O.; Cevikcan, E.; Satoglu, S.I.; Durmusoglu, M.B. A simulation-based methodology for the analysis of the effect of lean tools on energy efficiency: An application in power distribution industry. J. Clean. Prod. 2019, 211, 895–908. [Google Scholar] [CrossRef]
  2. Knoll, D.; Reinhart, G.; Prüglmeier, M. Enabling value stream mapping for internal logistics using multidimensional process mining. Expert Syst. Appl. 2019, 124, 130–142. [Google Scholar] [CrossRef]
  3. Goh, M.; Goh, Y.M. Lean production theory-based simulation of modular construction processes. Autom. Constr. 2019, 101, 227–244. [Google Scholar] [CrossRef]
  4. Stadnicka, D.; Litwin, P. Value stream mapping and system dynamics integration for manufacturing line modelling and analysis. Int. J. Prod. Econ. 2019, 208, 400–411. [Google Scholar] [CrossRef]
  5. Rother, M.; Shook, J. Learning to See: Value Stream Mapping to Add Value and Eliminate Muda; Lean Enterprise Institute: Cambrige, MA, USA, 1999. [Google Scholar]
  6. Tyagi, S.; Choudhary, A.; Cai, X.; Yang, K. Value stream mapping to reduce the lead-time of a product development process. Int. J. Prod. Econ. 2015, 160, 202–212. [Google Scholar] [CrossRef]
  7. Singh, B.; Garg, S.K.; Sharma, S.K. Value stream mapping: Literature review and implications for Indian industry. Int. J. Adv. Manuf. Technol. 2011, 53, 799–809. [Google Scholar] [CrossRef]
  8. Deshkar, A.; Kamle, S.; Giri, J.; Korde, V. Design and evaluation of a Lean Manufacturing framework using Value Stream Mapping (VSM) for a plastic bag manufacturing unit. Mater. Today Proc. 2018, 5, 7668–7677. [Google Scholar] [CrossRef]
  9. Faulkner, W.; Badurdeen, F. Sustainable Value Stream Mapping (Sus-VSM): Methodology to visualize and assess manufacturing sustainability performance. J. Clean. Prod. 2014, 85, 8–18. [Google Scholar] [CrossRef]
  10. Haefner, B.; Kraemer, A.; Stauss, T.; Lanza, G. Quality Value Stream Mapping. Procedia CIRP 2014, 17, 254–259. [Google Scholar] [CrossRef] [Green Version]
  11. Krajewski, L.J.; Ritzman, L.P. Operations Management: Strategy and Analysis, 6th ed.; Prentice Hall: Upper Saddle River, NJ, USA, 2001; ISBN 978-0201615456. [Google Scholar]
  12. Chase, R.B.; Nicholas, J. Aquilano Production & Operations Management: A Life Cycle Approach; Irwin Professional Pub: Chicago, IL, USA, 1992; ISBN 1556237340. [Google Scholar]
  13. Kuo, C.-T.; Lim, J.-T.; Meerkov, S.M. Bottlenecks in serial production lines: A systemtheoretic approach. Math. Probl. Eng. 1996, 2, 233–276. [Google Scholar] [CrossRef]
  14. Costas, J.; Ponte, B.; de la Fuente, D.; Pino, R.; Puche, J. Applying Goldratt’s Theory of Constraints to reduce the Bullwhip Effect through agent-based modeling. Expert Syst. Appl. 2014, 42, 2049–2060. [Google Scholar] [CrossRef]
  15. Şimşit, Z.T.; Günay, N.S.; Vayvay, Ö. Theory of Constraints: A literature review. Procedia Soc. Behav. Sci. 2014, 150, 930–936. [Google Scholar] [CrossRef]
  16. Linhares, A. Theory of constraints and the combinatorial complexity of the product-mix decision. Int. J. Prod. Econ. 2009, 121, 121–129. [Google Scholar] [CrossRef]
  17. Badri, S.A.; Ghazanfari, M.; Shahanaghi, K. A multi-criteria decision-making approach to solve the product mix problem with interval parameters based on the theory of constraints. Int. J. Adv. Manuf. Technol. 2014, 70, 1073–1080. [Google Scholar] [CrossRef]
  18. Negahban, A.; Smith, J.S. Simulation for manufacturing system design and operation: Literature review and analysis. J. Manuf. Syst. 2014, 33, 241–261. [Google Scholar] [CrossRef]
  19. Swallmeh, E.; Tobail, A.; Abo-hamad, W.; Gray, J.; Arisha, A. Integrating simulation modelling and value stream mapping for leaner capacity planning of an emergency department. In Proceedings of the Sixth International Conference on Advances in System Simulation SIMUL 2014, Nice, France, 12–16 October 2014. [Google Scholar]
  20. Xia, W.; Sun, J. Simulation guided value stream mapping and lean improvement: A case study of a tubular machining facility. J. Ind. Eng. Manag. 2013, 6, 456–576. [Google Scholar] [CrossRef]
  21. Jeong, K.Y.; Phillips, D.T. Application of a concept development process to evaluate process layout designs using value stream mapping and simulation. J. Ind. Eng. Manag. 2011, 4, 206–230. [Google Scholar] [CrossRef]
  22. Yang, T.; Kuo, Y.; Su, C.-T.; Hou, C.-L. Lean production system design for fishing net manufacturing using lean principles and simulation optimization. J. Manuf. Syst. 2015, 34, 66–73. [Google Scholar] [CrossRef]
  23. Helleno, A.L.; Pimentel, C.A.; Ferro, R.; Santos, P.F.; Oliveira, M.C.; Simon, A.T. Integrating value stream mapping and discrete events simulation as decision making tools in operation management. Int. J. Adv. Manuf. Technol. 2015, 80, 1059–1066. [Google Scholar] [CrossRef]
  24. Antonelli, D.; Stadnicka, D. Combining factory simulation with value stream mapping: A critical discussion. Procedia CIRP 2018, 67, 30–35. [Google Scholar] [CrossRef]
  25. Aguilar, V.G.; Garrido, P.; González, M. del M. Applying the theory of constraints to the logistics service of medical records of a hospital. Eur. Res. Manag. Bus. Econ. 2016, 22, 139–146. [Google Scholar] [CrossRef]
  26. Atieh, A.M.; Kaylani, H.; Almuhtady, A.; Al-tamimi, O. A value stream mapping and simulation hybrid approach: Application to glass industry. Int. J. Adv. Manuf. Technol. 2015, 84, 1573–1586. [Google Scholar] [CrossRef]
  27. Kaylani, H.; Almuhtady, A.; Atieh, A.M. Novel Approach to enhance the performance of production systems using lean tools. Jordan J. Mech. Ind. Eng. 2016, 10, 215–229. [Google Scholar]
  28. Gurumurthy, A.; Kodali, R. Design of lean manufacturing systems using value stream mapping with simulation: A case study. J. Manuf. Tachnol. Manag. 2011, 22, 444–473. [Google Scholar] [CrossRef]
  29. Sonmez, V.; Testik, M.C.; Testik, O.M. Overall equipment effectiveness when production speeds and stoppage durations are uncertain. Int. J. Adv. Manuf. Technol. 2018, 95, 121–130. [Google Scholar] [CrossRef]
  30. Foulloy, L.; Clivillé, V.; Berrah, L. A fuzzy temporal approach to the Overall Equipment Effectiveness measurement. Comput. Ind. Eng. 2019, 127, 103–115. [Google Scholar] [CrossRef]
  31. Mâinea, M.; Dutǎ, L.; Patic, P.C.; Cǎciulǎ, I. A method to optimize the Overall Equipment Effectiveness. IFAC Proc. Vol. 2010, 43, 237–241. [Google Scholar] [CrossRef]
  32. Ahmad, N.; Hossen, J.; Ali, S.M. Improvement of overall equipment efficiency of ring frame through total productive maintenance: A textile case. Int. J. Adv. Manuf. Technol. 2018, 94, 239–256. [Google Scholar] [CrossRef]
  33. Calculate OEE. Available online: https://www.oee.com/calculating-oee.html (accessed on 8 November 2018).
Figure 1. Problem-solving approach.
Processes 07 00816 g001
Figure 2. Current state VSM.
Processes 07 00816 g002
Figure 3. Cupboard/Cladding Radar Chart.
Processes 07 00816 g003
Figure 4. OEE radar chart.
Processes 07 00816 g004
Figure 5. Future-state VSM.
Processes 07 00816 g005
Table 1. ABC Analysis.
TypeQty.Price/PcsPrice% of Total% Cum of TotalCum % of SKUClass
Doors548617338,1160.40.45.3A
Closet1631127183,7010.20.610.5A
Cladding935175163,6250.20.915.8A
Tables12940051,6000.10.921.1B
Columns9020018,0000.00.926.3B
Skirting3753513,1250.01.031.6B
TV Elevation5150075000.01.036.8B
Counter980072000.01.042.1B
Pantry580040000.01.047.4B
Frame1225030000.01.052.6C
Banquet Seating475030000.01.057.9C
DJ Booth540020000.01.063.2C
Ceiling725017500.01.068.4C
Bench530015000.01.073.7C
Chair1212515000.01.079.0C
Partition525012500.01.084.2C
Sofa430012000.01.089.5C
Shelves16508000.01.094.7C
Joists6201200.01.0100.0C
Table 2. Simulation Model Inputs.
ProcessSetup Time (min)Change Over Time (min)Processing Time (min)Assumptions
Cutting52123 panels/pass
Edging20.24--
Drilling423--
Assembly--325--
Wrapping0.425--
Table 3. OEE inputs.
Cupboard Making Process/Minutes
CuttingEdgingDrillingAssemblyWrappingTotal
Ideal cycle time83.5220437.5
Change over141123232
Breakdowns0.20.160.1000.46
Table 4. OEE Horizontal results.
OEE MetricsResults
Run time (min)357.5
Total Count9.5
Good Count8.9
Availability91.7%
Performance62.7%
Quality94.0%
OEE closet54.1%
Table 5. OEE Vertical Results.
ProcessResults
OEE Cutting2.2%
OEE Edging0.5%
OEE Drilling0.4%
OEE Wrapping2.2%
OEE Painting61.9%
OEE Painting booth13.2%
Table 6. Output Comparison per shift.
ProductActual OutputSimulation OutputPercentage Difference between Simulation VS. ActualOEE OutputPercentage Difference Between OEE VS. Actual
Cupboards13147.6%9.526.0%
Cladding5740.0%620.0%
Doors4433.3%2.516.6%
Table 7. Utilization of resources.
Claddings and Cupboards
ResourceUtilization
Assembly Workers91.2%
Operators 1 and 251.8%
Painters46.5%
Wrappers26.5%
Edging25.3%
Paint booth19.7%
Drilling18.2%
Cutting8.3%
Table 8. Processes Waiting-Time.
Claddings and Cupboards
ProcessWaiting Time in Hours
Assembly59.6
Painting6.7
Wrapping1.9
Edging1.8
Drilling1.5
Cutting0.6
Paint Booth0.1
Table 9. Scenario-based improvement.
Scenario-Based Method/Cupboards and Claddings
ResourceDouble Resources Available System Output before ImprovementSystem Output after ImprovementPercentage Improvement
Operatorsx2148715242.4%
Assembly Workersx21487176615.8%
Paintersx2148714880.2%

