Article

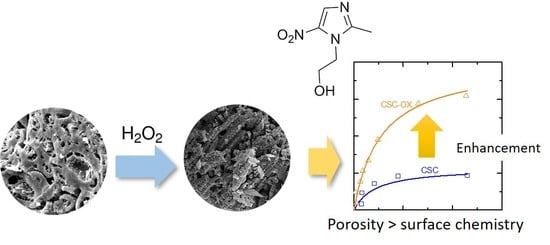
Modifying Nanoporous Carbon through Hydrogen Peroxide Oxidation for Removal of Metronidazole Antibiotics from Simulated Wastewater

by
Teguh Ariyanto
1,2,*,
Rut Aprillia Galuh Sarwendah
1,
Yove Maulana Novirdaus Amimmal
1,
William Teja Laksmana
1 and
Imam Prasetyo
1,2
1
Department of Chemical Engineering, Faculty of Engineering, Universitas Gadjah Mada, Jl Grafika No 2, Yogyakarta 55281, Indonesia
2
Carbon Material Research Group, Department of Chemical Engineering, Faculty of Engineering, Universitas Gadjah Mada, Jl Grafika No 2, Yogyakarta 55281, Indonesia
*
Author to whom correspondence should be addressed.
Processes 2019, 7(11), 835; https://doi.org/10.3390/pr7110835
Submission received: 6 October 2019 / Revised: 2 November 2019 / Accepted: 5 November 2019 / Published: 8 November 2019
(This article belongs to the Special Issue Gas, Water and Solid Waste Treatment Technology)

Abstract

:
This study examined change in pore structure and microstructure of nanoporous carbon after surface oxidation and how it affects the adsorption performance of metronidazole antibiotics. The surface oxidation was performed by hydrogen peroxide at 60 °C. The properties of porous carbon were investigated by N2-sorption analysis (pore structure), scanning electron microscopy (surface morphology), the Boehm titration method (quantification of surface functional group), and Fourier transform infrared spectroscopy (type of surface functional group). The results showed that the oxidation of porous carbon by hydrogen peroxide has a minor defect in the carbon pore structure. Only a slight decrease in specific surface area (8%) from its original value (973 m2g−1) was seen but more mesoporosity was introduced. The oxidation of porous carbon with hydrogen peroxide modified the amount of oxide groups i.e., phenol, carboxylic acid and lactone. Moreover, in the application the oxidized carbon exhibited a higher the metronidazole uptake capacity of up to three-times manifold with respect to the pristine carbon.

Graphical Abstract

1. Introduction

The occurrence of pharmaceutical compounds in the aquatic environment has been a high concern. When water containing pharmaceutical compounds is released into river, it can influence the quality of water and harm the ecosystem balance. Studies showed that pharmaceutical compounds in an aquatic system could have serious effects such as antibiotic-resistant microbes [1], the change of fish reproduction [2], and inhibition of photosynthesis in aquatic organisms [3]. When a waterbody containing antibiotics flows to agriculture land, this could affect the maturity of plants [4]. One of the main sources of pharmaceutical effluents is hospitals which, in Europe, typically discharges pharmaceutical components in the range concentrations of 0.2–11 µg L−1 [5]. This could be even worse in other countries when using improper wastewater treatment, resulting in a higher concentration of pharmaceutical substances released to the environment.
Metronidazole is one of the most used pharmaceutical compounds. This is an antibiotic which hinders the growth of parasitic microbes like bacteria and protozoa [6]. Metronidazole is highly soluble in water and persist even after biodegradation [7]. The molecular structure of metronidazole is given in Figure 1.
Adsorption is a popular technique for removal of contaminants from wastewater. The method has the advantages of a simple design and ease of operation. Among adsorbents, porous carbon has been regarded as the most promising materials, taking advantages of its excellent physical and chemical stability and high specific surface area (500–2000 m2g−1) [8,9,10]. Studies showed porous carbon could work to remove metronidazole from aqueous systems [11,12,13]. The capacity of adsorption of organic compounds is influenced e.g. pore textural properties and surface functional groups of porous carbon [10,14]. Therefore, there is possibility to further increase adsorption capacity by modification of pore- and surface chemistry of nanoporous carbon. A high uptake capacity is beneficial providing longer adsorption time, hence more efficient. However, no detail study yet is presented so far to modify pore- and surface chemistry of porous carbon for adsorption of antibiotic substances.
A presence of functional groups like acidic sites could increases wettability of pore surfaces. To introduce acidic groups onto nanoporous carbon, surface oxidation using sulphuric acid, nitric acid and hydrogen peroxide can be performed [15,16]. Oxidation using strong acids is effective to increase functional groups of oxygen, but this relatively harsh oxidation induces a destruction of pore structures hence remarkably decreasing specific surface area [17,18]. Oxidation of nanoporous carbon using hydrogen peroxide can give a good trade-off between introduction of oxygen-functional groups and change in pore structures. Furthermore, this oxidation method does not require a further step of washing of nanoporous carbon.
This work presents a study of ease modification of nanoporous carbon and its efficacy on metronidazole adsorption. Oxidation was performed by hydrogen peroxide. Effects of this mild oxidation on the pore structure, surface morphology and functional groups and their influence on the performance of metronidazole are described.

2. Materials and Methods

2.1. Material

Nanoporous carbon from coconut shell (CSC) was obtained from PT Home System, Indonesia. CSC was then crushed and sieved to obtain a particle size in the range of 355–710 µm. Hydrogen peroxide solution of 50% was obtained from Merck, Germany. Hydrogen peroxide solution of 30% was prepared by dilution of highly concentrated hydrogen peroxide of 50%. Metronidazole 99% purity was a product of Sigma Aldrich, Singapore.

2.2. Oxidation of Nanoporous Carbon

Fifty milliliters of 30% hydrogen peroxide solution was poured in a three-neck flask. After this, the solution was heated to the desired oxidation temperature of 60 °C. After oxidation was finished (2 h), carbon was separated from the solution and dried overnight in an oven (60 °C).

2.3. Characterization of Nanoporous Carbon

Morphologies of material CSC, both before and after the oxidation process, were probed by scanning electron microscope (SEM) of JSM-6510LA (JEOL, Tokyo, Japan). Pore analysis of nanoporous carbon was performed by using Quantachrome Nova 2000 (Quantachrome Instruments, Boynton Beach, FL, USA) through the nitrogen sorption method. The multipoint Brunauer–Emmett–Teller (BET) method was employed to evaluate the specific surface area (SSA) from the isotherm data. Micropore volume and micropore SSA were evaluated using the t-plot method, which is a correlation between the adsorbed volume of nitrogen and statistical thickness. BET and statistical thickness of the Hasley model are shown in Equations (1) and (2) [19]. Calculation of pore textural parameters were carried out using a software provided by Quantachrome NovaWin version 11.03 (Quantachrome Instruments, Boynton Beach, FL, USA).
P V ( P 0 P ) = 1 V m C + C 1 V m C ( P P 0 )
t ( Å ) = 3.54 [ 5 2.303 log ( P o / P ) ] 1 / 3
where P is the pressure, V is the adsorbed volume of nitrogen, Po is the saturated pressure of nitrogen at 77 K, Vm is the monolayer adsorbed volume of nitrogen, t is the statistical thickness, and C is constant.
The qualitative analysis of functional groups in porous carbon was evaluated through Fourier-Transform Infrared Spectroscopy (FTIR) using Nicolet iS10 (Thermo Fisher Scientific, MA, USA), while the quantitative analysis was performed through the Boehm titration method [20]. Fifty milligrams of carbons were soaked in 50 mL of 0.001 N Na2CO3 (prepared from solid Na2CO3, Merck, Darmstadt, Germany), 0.001 N NaHCO3 (prepared from solid NaHCO3, Merck, Darmstadt, Germany), 0.001 N NaOH (prepared from solid NaOH, Merck, Darmstadt, Germany), for 24 h. Next, the carbons were separated and the solutions of Na2CO3, NaHCO3, and NaOH of the separation’s result were titrated with 0.001 N HCl (prepared from concentrated HCl, Merck, Darmstadt, Germany). The number of functional groups present were determined through a balance of acid in the solution.

2.4. Adsorption of Antibiotic Substances

The metronidazole adsorption was performed through a preparation of metronidazole solution with various concentrations, from 20 to 200 ppm. This initial concentration range was employed to determine the equilibrium curve between the amount of adsorbate in the solid phase and the amount of adsorbate in the liquid phase, until the maximum adsorption capacity was reached. Fifty milliliters of metronidazole solution were put into Erlenmeyer of 125 mL and 50 mg of carbon samples was added for each of the solution samples. The Erlenmeyer was shaken for 24 h in the water bath shaker, (Memmert, Schwabach, Germany) at room temperature. After adsorption, the metronidazole solution was then analyzed by the method described in literature [21]. The solution was mixed with reagents of 1 N HCl, zinc dust, 1% NaNO2 (prepared from solid NaNO2, Merck, Darmstadt, Germany) solution, 2% sulfamic acid solution, 1% N-(1-naphthyl)ethylenediamine dihydrochloride or NEDA (prepared from ~100% NEDA, Merck, Darmstadt, Germany) solution, and 10% NaOH solution until it was colored. The metronidazole concentration in the solution after the adsorption was measured with UV–Vis spectrophotometer Shimadzu UV Mini 1240 (Shimadzu, Kyoto, Japan) with a wavelength of 510 nm. The experimental set-up and adsorption conditions were based on the reports in [22,23].

2.5. Adsorption Model of Antibiotic Substances

Adsorption of metronidazole was modeled using Langmuir and Freundlich isotherm models, as shown in Equations (3) and (4) [19].
Q e = Q m K L C e 1 + K L C e
Q e = K F C e 1 / n
where KL is the Langmuir equilibrium constant (L/mol), Qm is the maximum adsorbate adsorption capacity of the adsorbent (mg adsorbate/g adsorbent), KF is the Freundlich equilibrium constant (mg adsorbate/(g adsorbent (mol/L)n)), n is the correction factor, Qe is the adsorbate adsorption capacity (mg adsorbate/g adsorbent) in the solid state in an equilibrium condition with a concentration of adsorbates in the liquid, and Ce is the adsorbate concentration in the solution (mol/L).
The mass balance of metronidazole in the solution and adsorbent were derived to get the adsorption variable. The variable was used to evaluate the adsorption parameter of Equations (3) and (4). The mass balance derivative of metronidazole for the batch system was written as Equation (5).
( C o C t ) V = ( Q t Q o ) w
In the initial condition, before metronidazole was adsorbed by carbon, Qo = 0, so Equation (5) became Equation (6).
Q e = ( C o C e ) V w
where Co is the initial concentration of metronidazole in the solution (mg adsorbate/L), V is the solution volume (L), and w is the adsorbent mass (g).

3. Results and Discussion

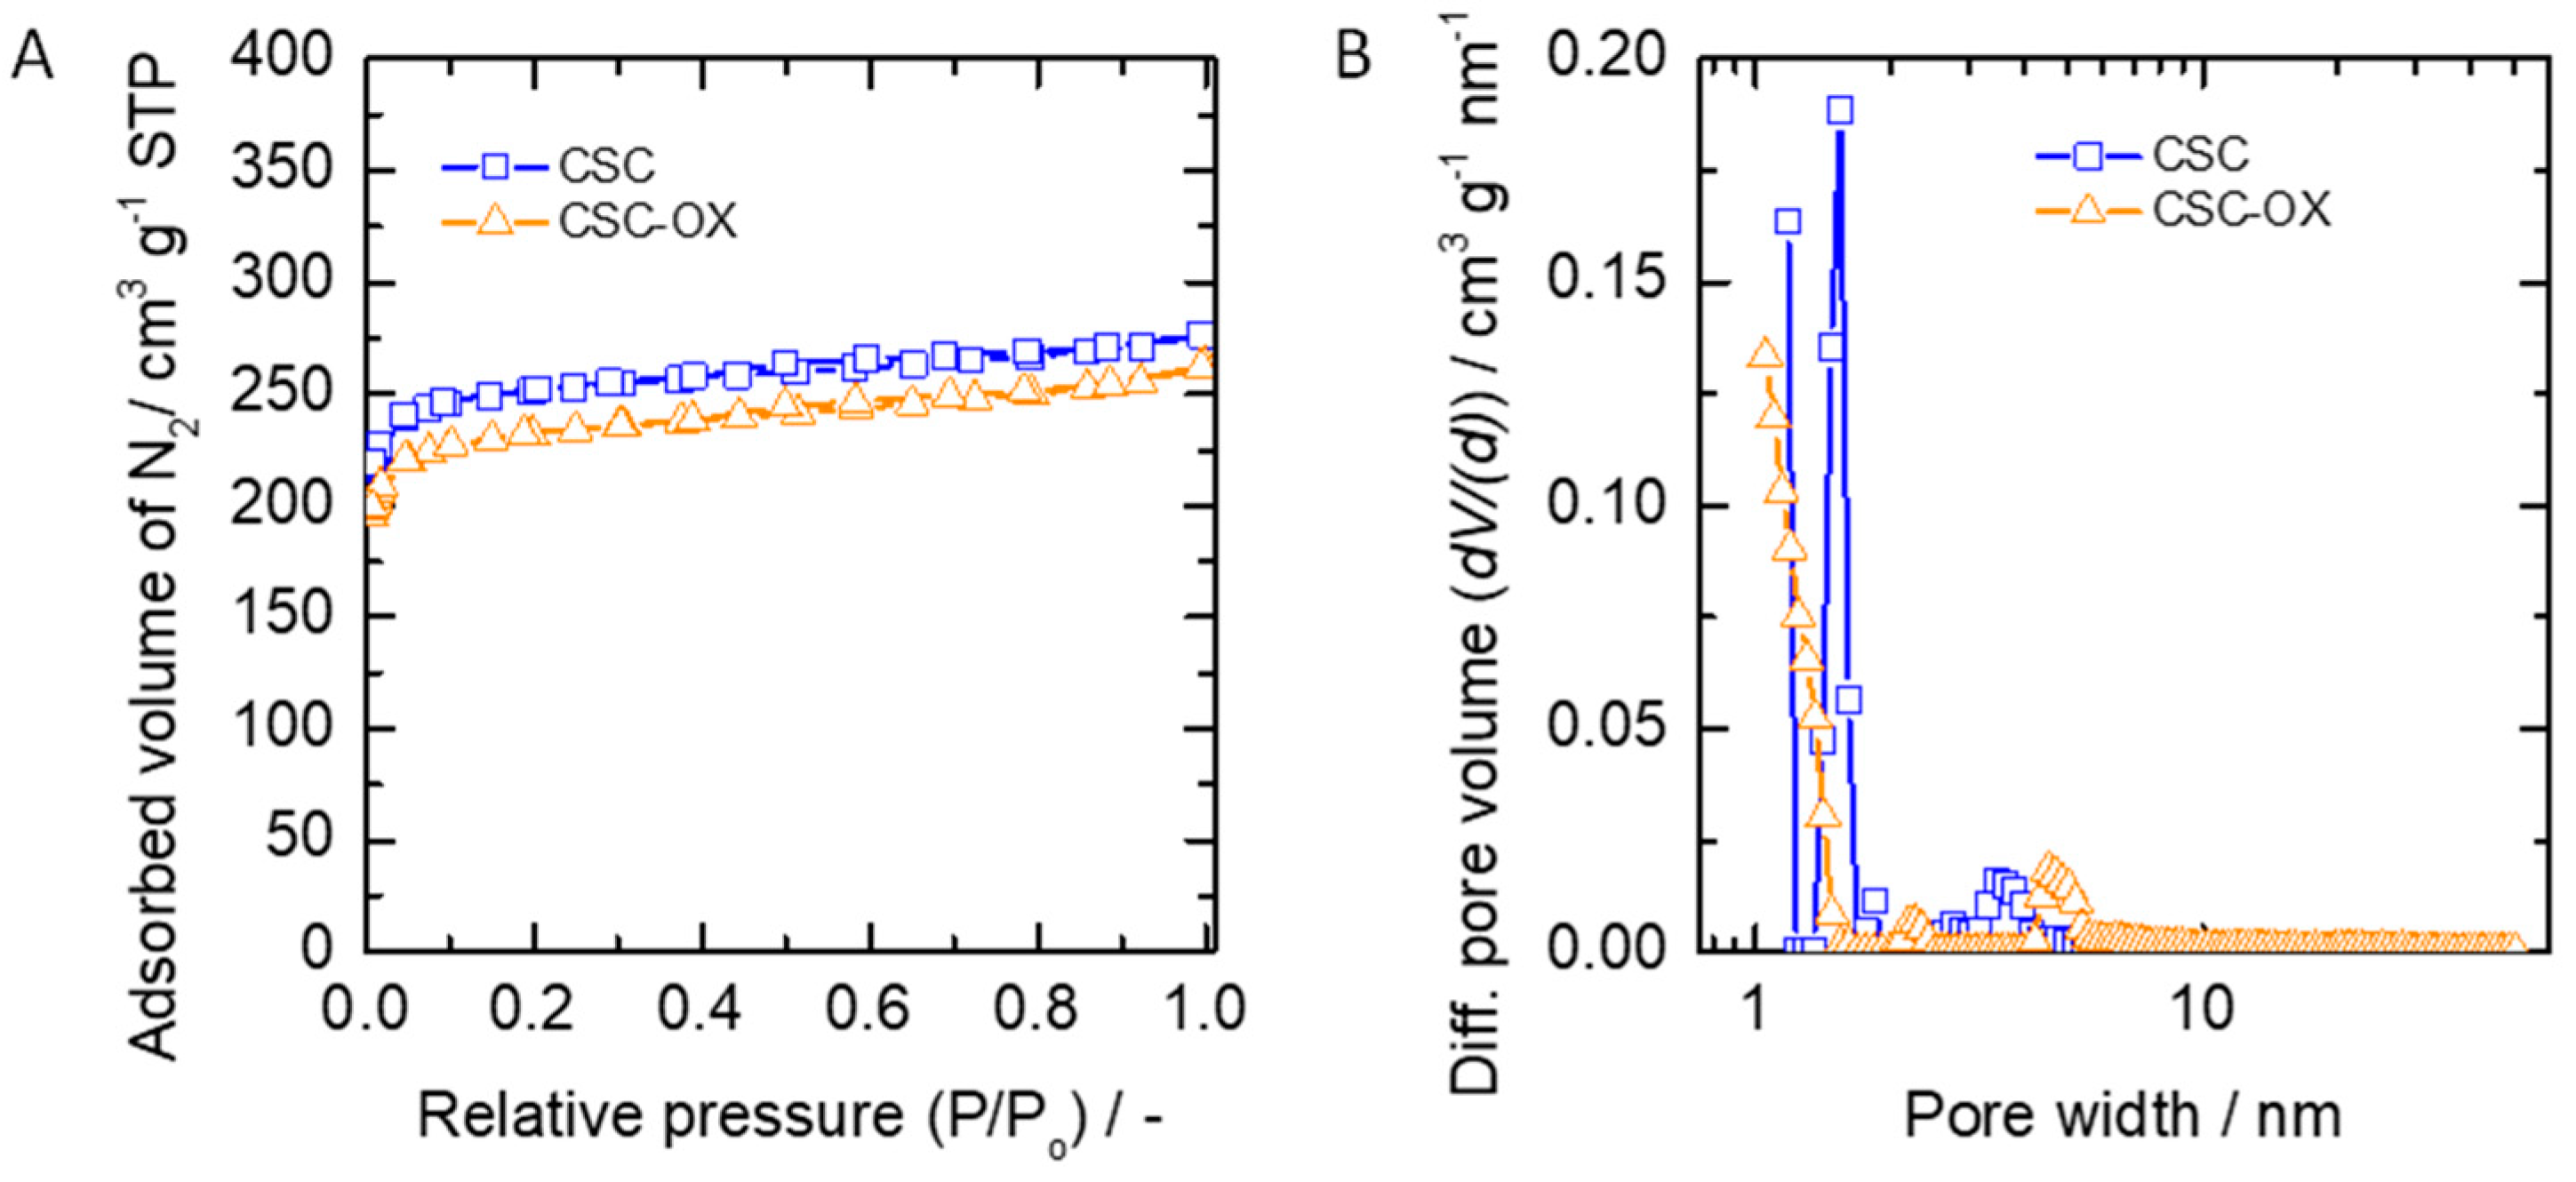
3.1. Pore Structure of Carbon Material

The pore structure of CSC, before and after oxidation with hydrogen peroxide was characterized by low-temperature nitrogen physisorption at 77 K. The sorption isotherms are displayed in Figure 2A. The CSC and CSC-OX feature an identical isotherm of Type I, according to the IUPAC classification [24], indicating that the materials possess substantial pores in a micropore regime. Of note is that the amount of nitrogen adsorbed on the CSC-OX was low. This indicated a decrease in the specific surface area (SSA). The pore-sized distributions (PSDs) determined through the QSDFT model are shown in Figure 2B. PSD of CSC and CSC-OX are dominantly in micropore regime around (<2 nm). When comparing the PSDs of CSC and CSC-OX in the mesopore range (2–50 nm), it could be seen that a higher fraction of mesopores were present in the CSC-OX. These pores were likely created when performing the oxidation process using hydrogen peroxide.
Table 1 shows the pore parameters of the carbon both before and after the oxidation process, which were calculated based on the N2-sorption isotherm data. From the analysis result, the SSA, total pore volume, and percentage of micropore fraction after the oxidation process were decreased when compared to the pristine one. The decreases occurred likely due to the oxidation process. Oxidation causes a removal of the carbon element and the formation of functional groups, which then produce bigger pores [25]. When voids larger than 300 nm are created by the oxidation of pores, they cannot be detected by nitrogen sorption, resulting in a small decrease in the total pore volume from 0.43 to 0.41 cm3 g−1.

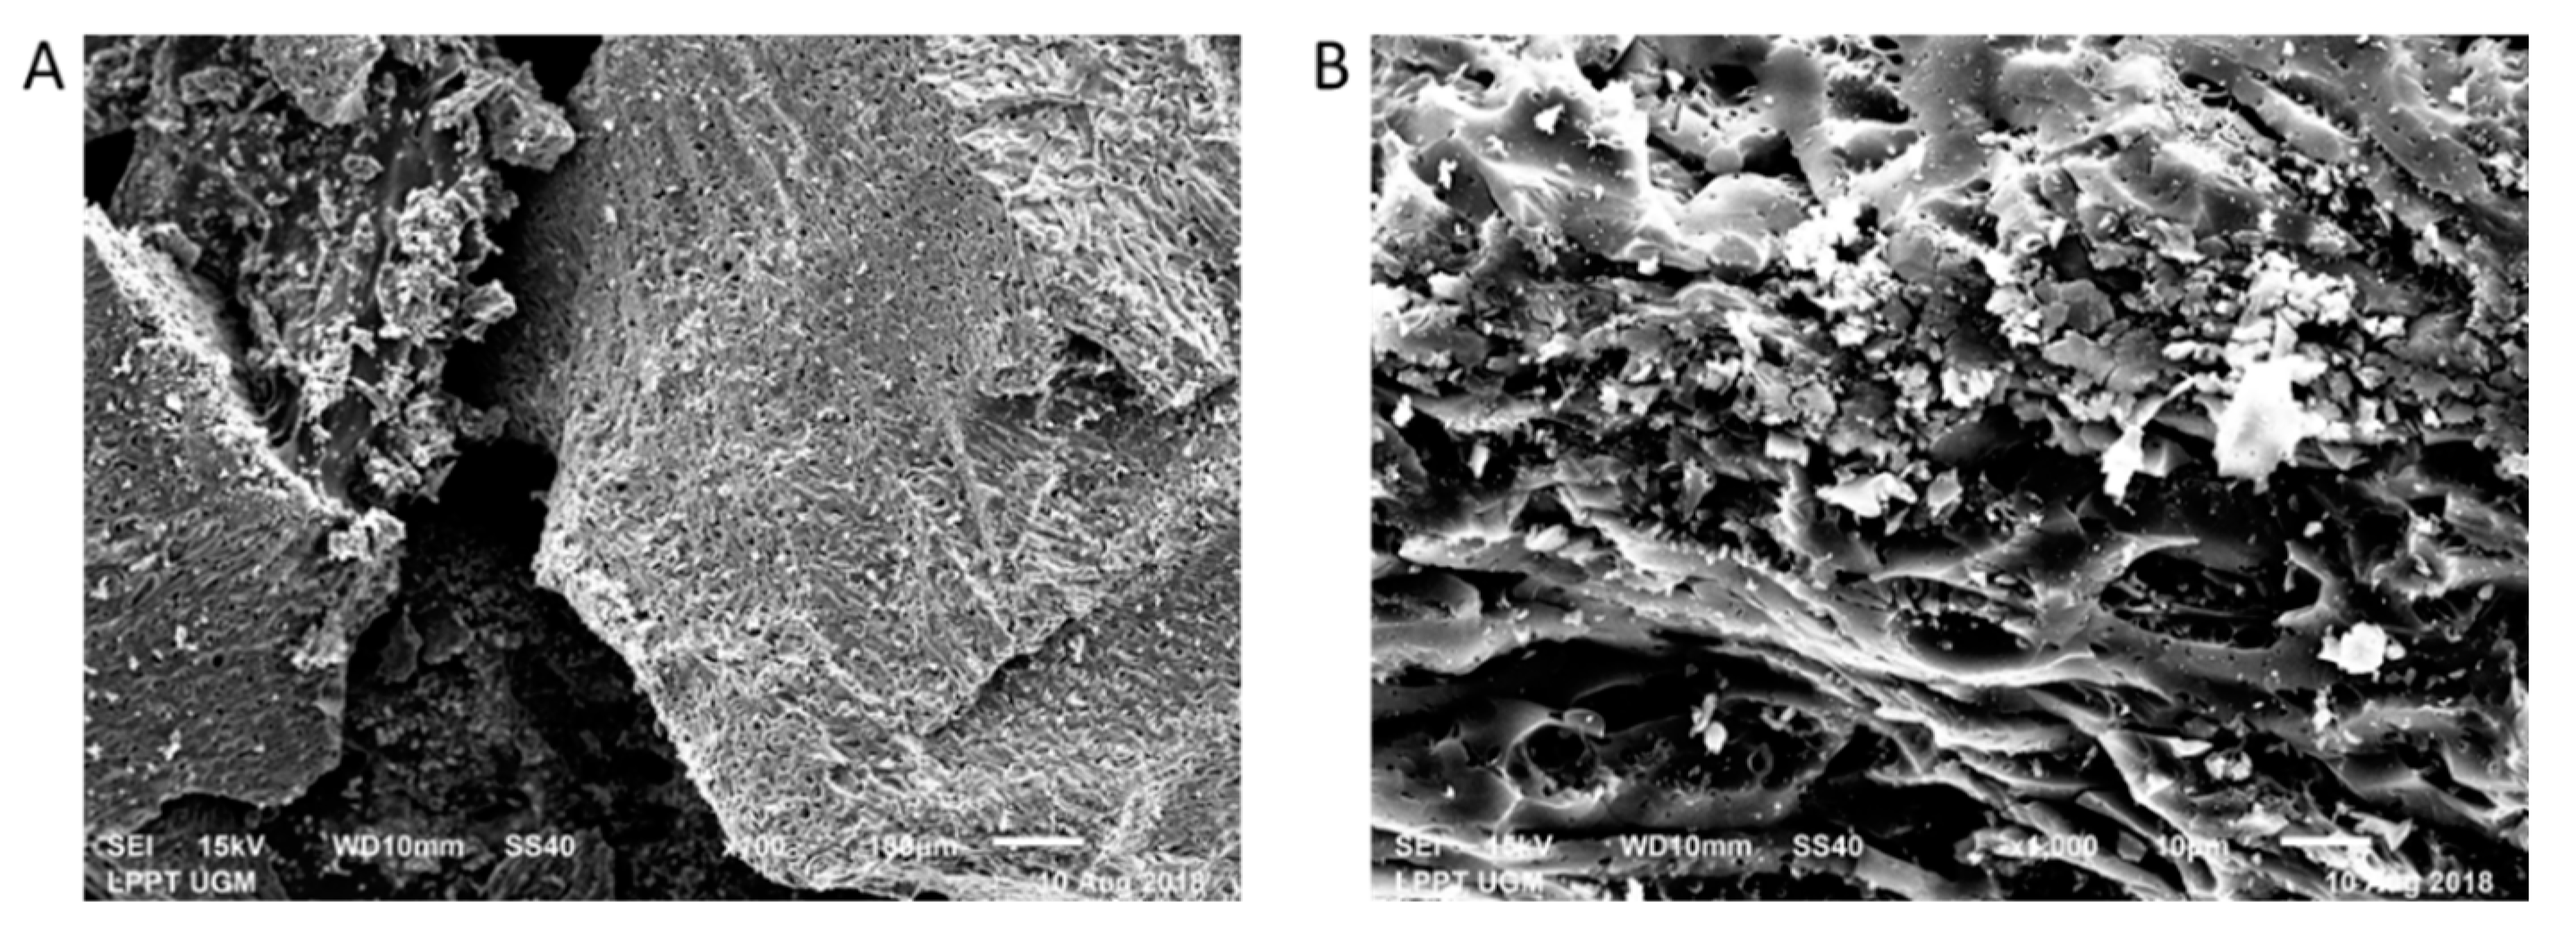
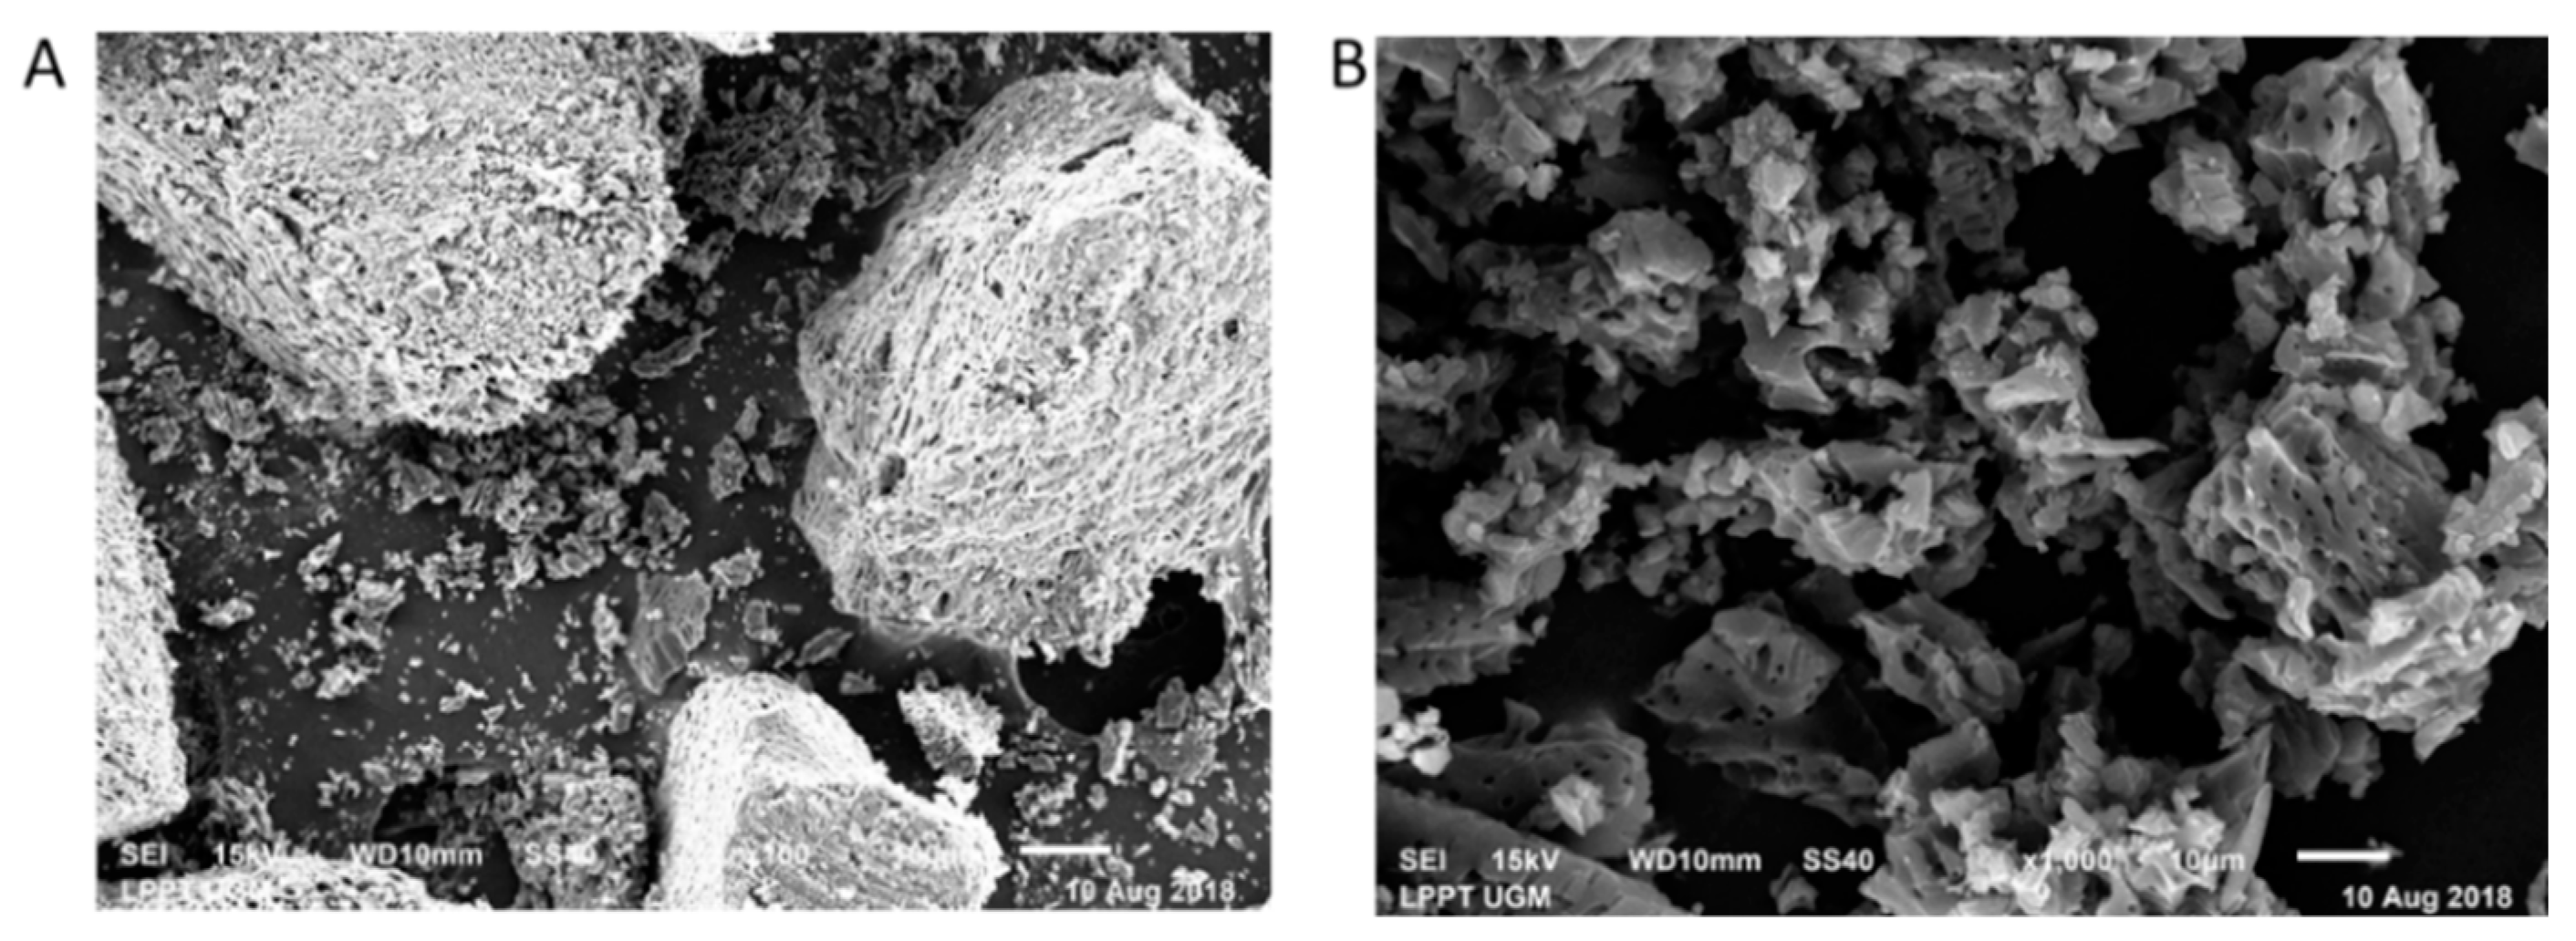
3.2. Surface Morphology

The morphology of CSC before and after oxidation was investigated using scanning electron microscopy. From Figure 3, it can be seen that the microstructures in the CSC’s surface before the oxidation process were different. In the 100 times magnification (Figure 3A), the CSC’s surface was quite rough while in the 1000 times magnification (Figure 3B), the granules looked smoother and no void appears.
In Figure 4, the surface of CSC-OX in the 100 times magnification (Figure 4A) appears rougher and looks even more damaged than before the oxidation process. In the 1000 times magnification (Figure 4B), the granules still looked smooth but some voids started to appear. Compared to CSC, CSC-OX looked rougher and had a bigger void than CSC. The pore structures also looked more crumbled than before. The results indicated that performing the oxidation process could alter the surface morphology.

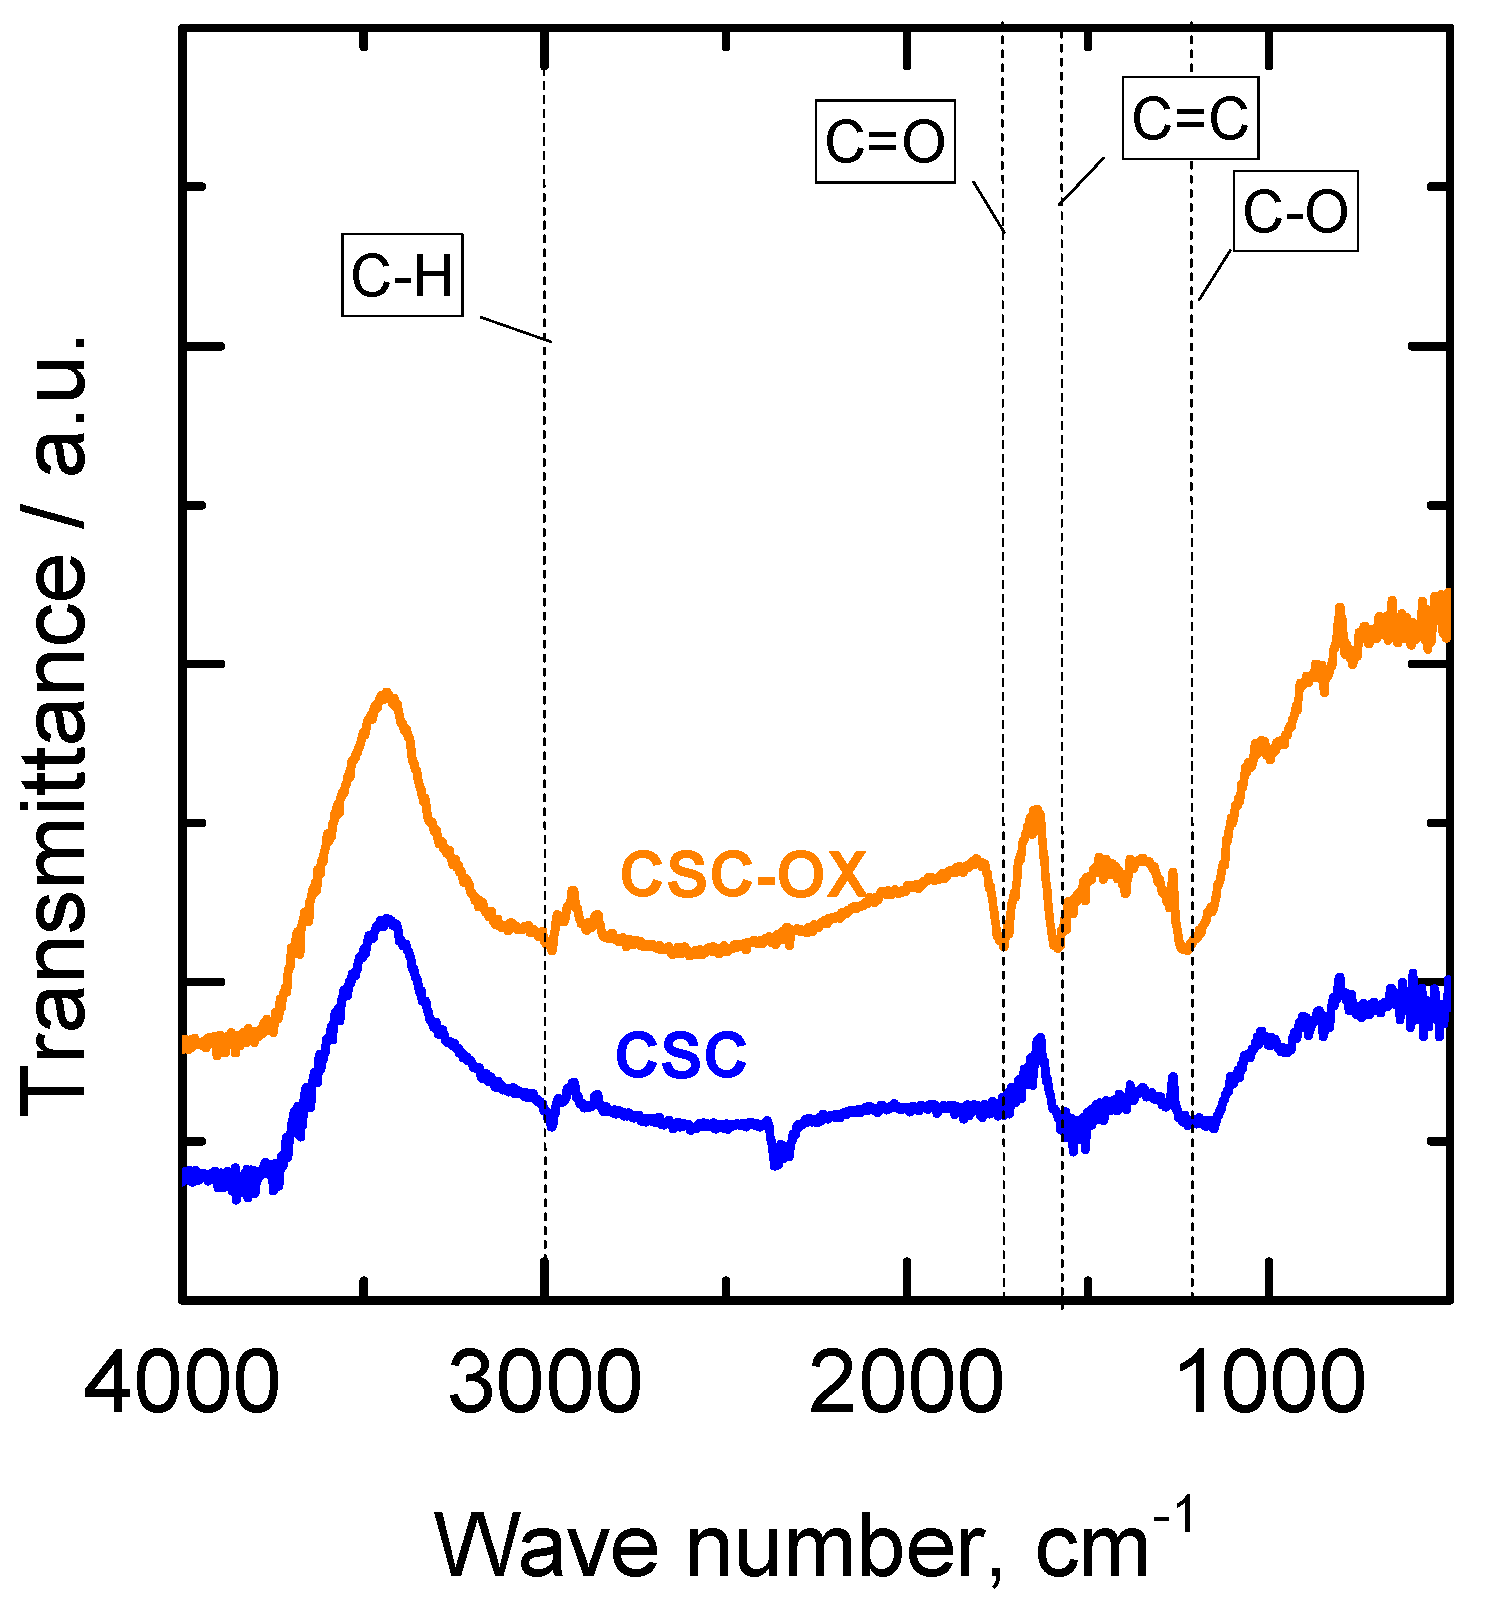
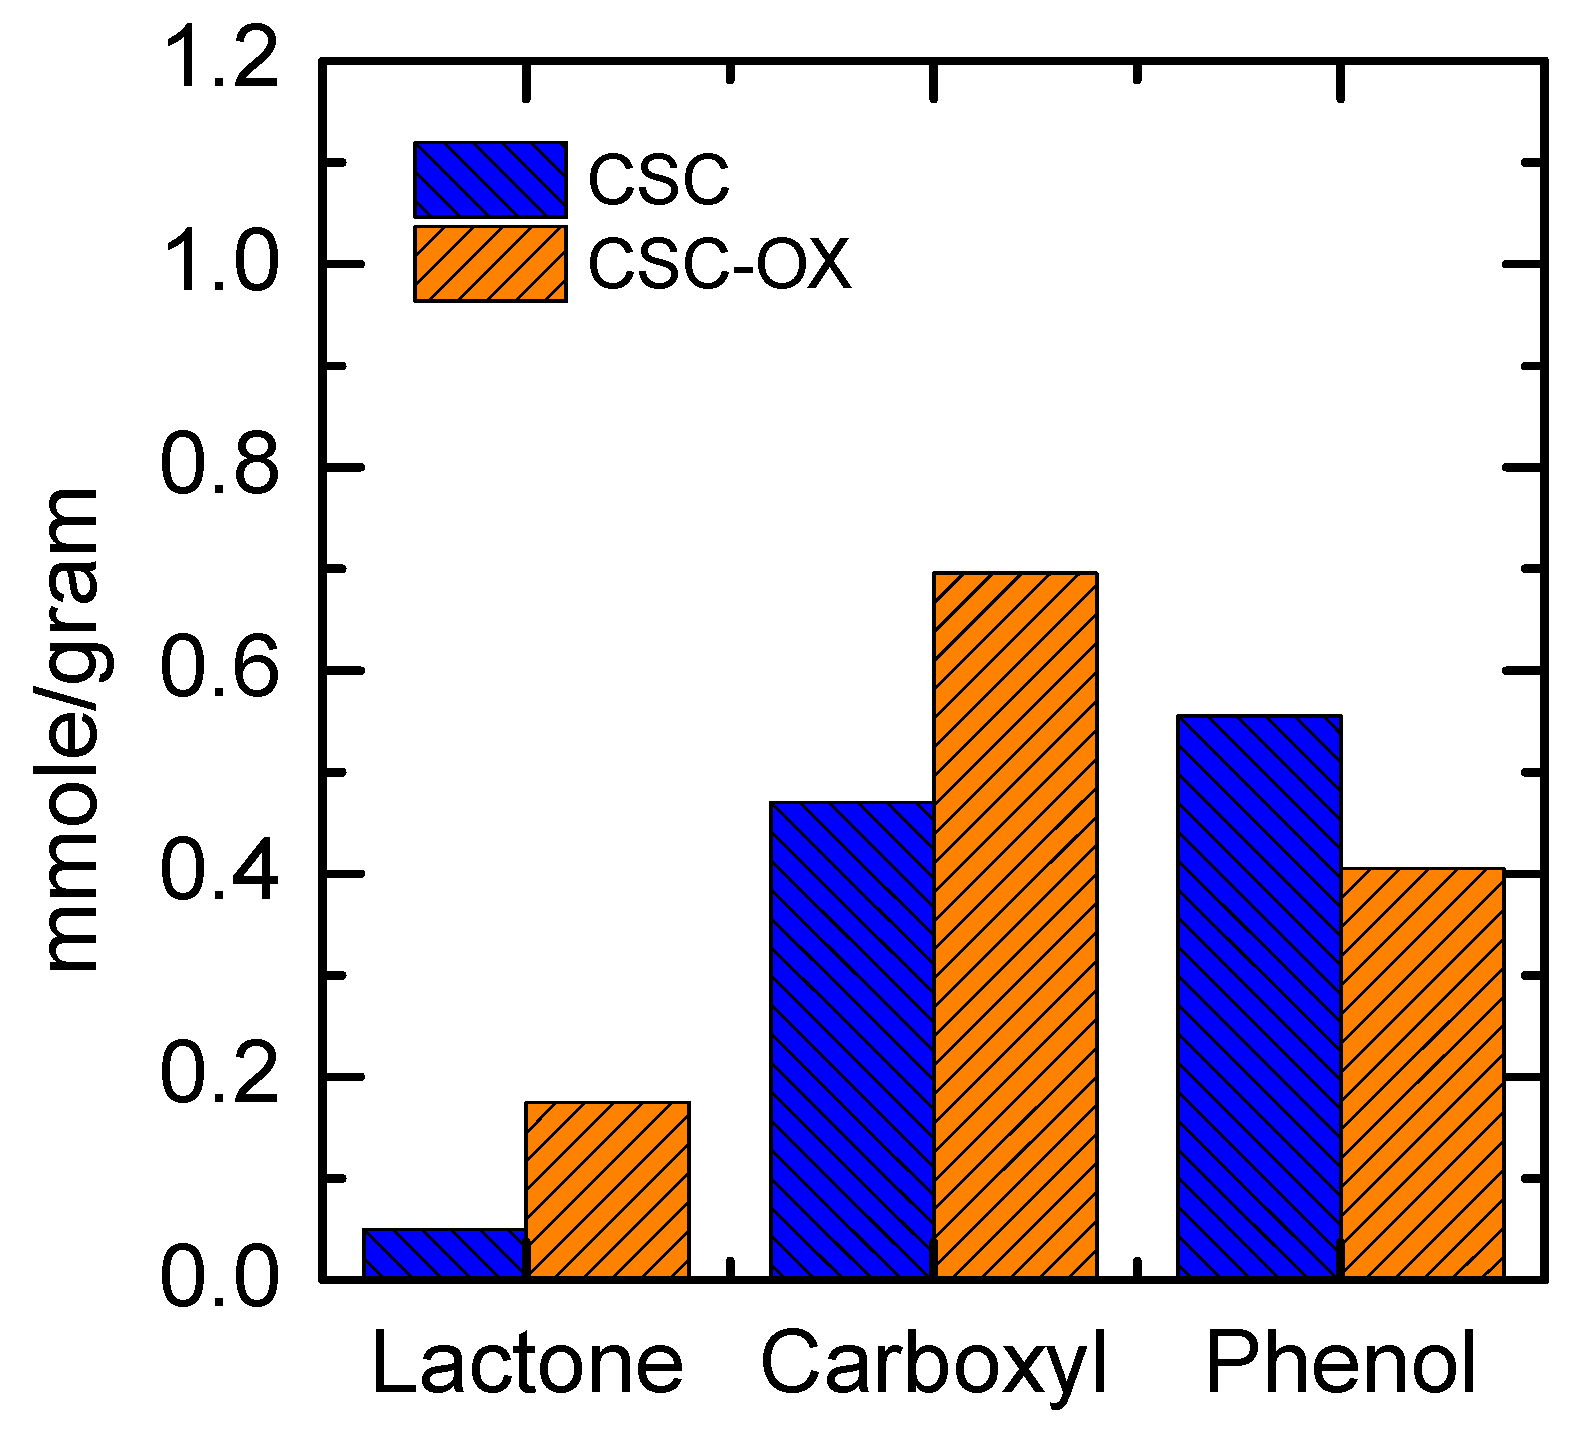
3.3. Oxygen Functional Groups

Functional groups in the porous carbon of CSC and CSC-OX were analyzed qualitatively and quantitatively. The qualitative analysis used Fourier-Transform Infrared spectroscopy (FTIR) while the quantitative analysis used the Boehm Titration.
From Figure 5, in the CSC before oxidation, there are a group of [C–O] showed by the wave number around 1200 cm−1, a group of [C=C] showed by the wave number around 1600 cm−1, and a group of [C–H] showed by the wave number around 3,000 cm−1. These indicate the presence of a phenol group (at ca. 1200 cm−1) and an aromatic ring of carbon structures (at ca. 1600 cm−1). After the oxidation process, there is a new peak in the wave number around 1700 cm−1 which shows that after the oxidation process, the group of [C=O] appeared, which is a carbonyl group. When comparing the CSC and the CSC-OX spectra, it could be noticed that before the oxidation, the carbon already had groups of oxygen functional groups. It is understandable because CSC is formed from biomass of lignocellulose material and contains oxygen elements.
Figure 6 displays the number of oxygen functional groups in CSC and CSC-OX. There are changes in the group of lactones, carboxyl, and phenols due to the oxidation process of carbons. When the oxidation occurs, carbon lose its electron and makes it more positively charged. The occurrence of oxygen and hydrogen molecules in the peroxide solution causes the formation of oxygen groups in the carbon’s surface. It was noticed that carboxylic and lactone groups are more presence in CSC-OX and phenol group is decreasing as the oxidation process takes place.

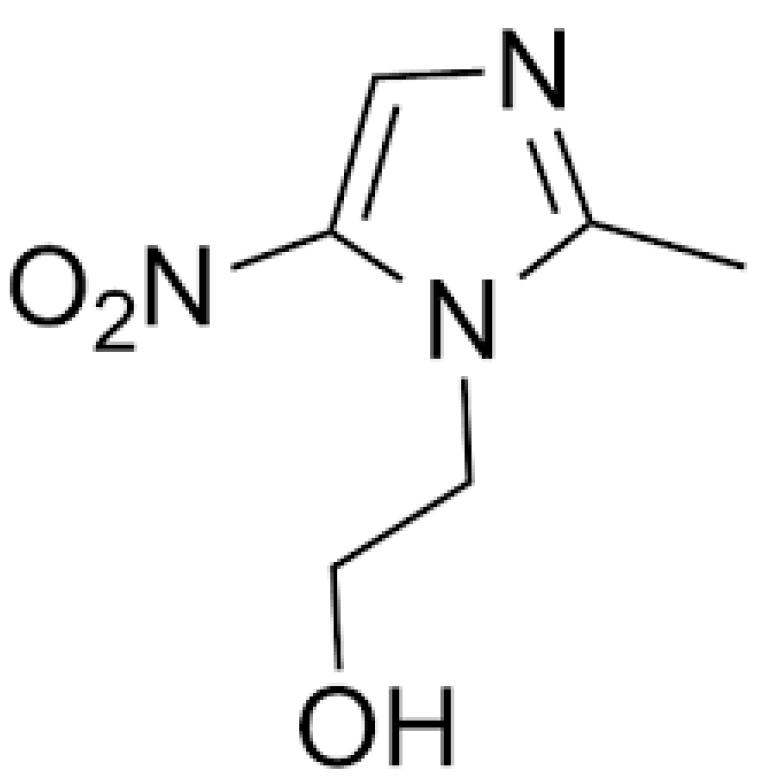
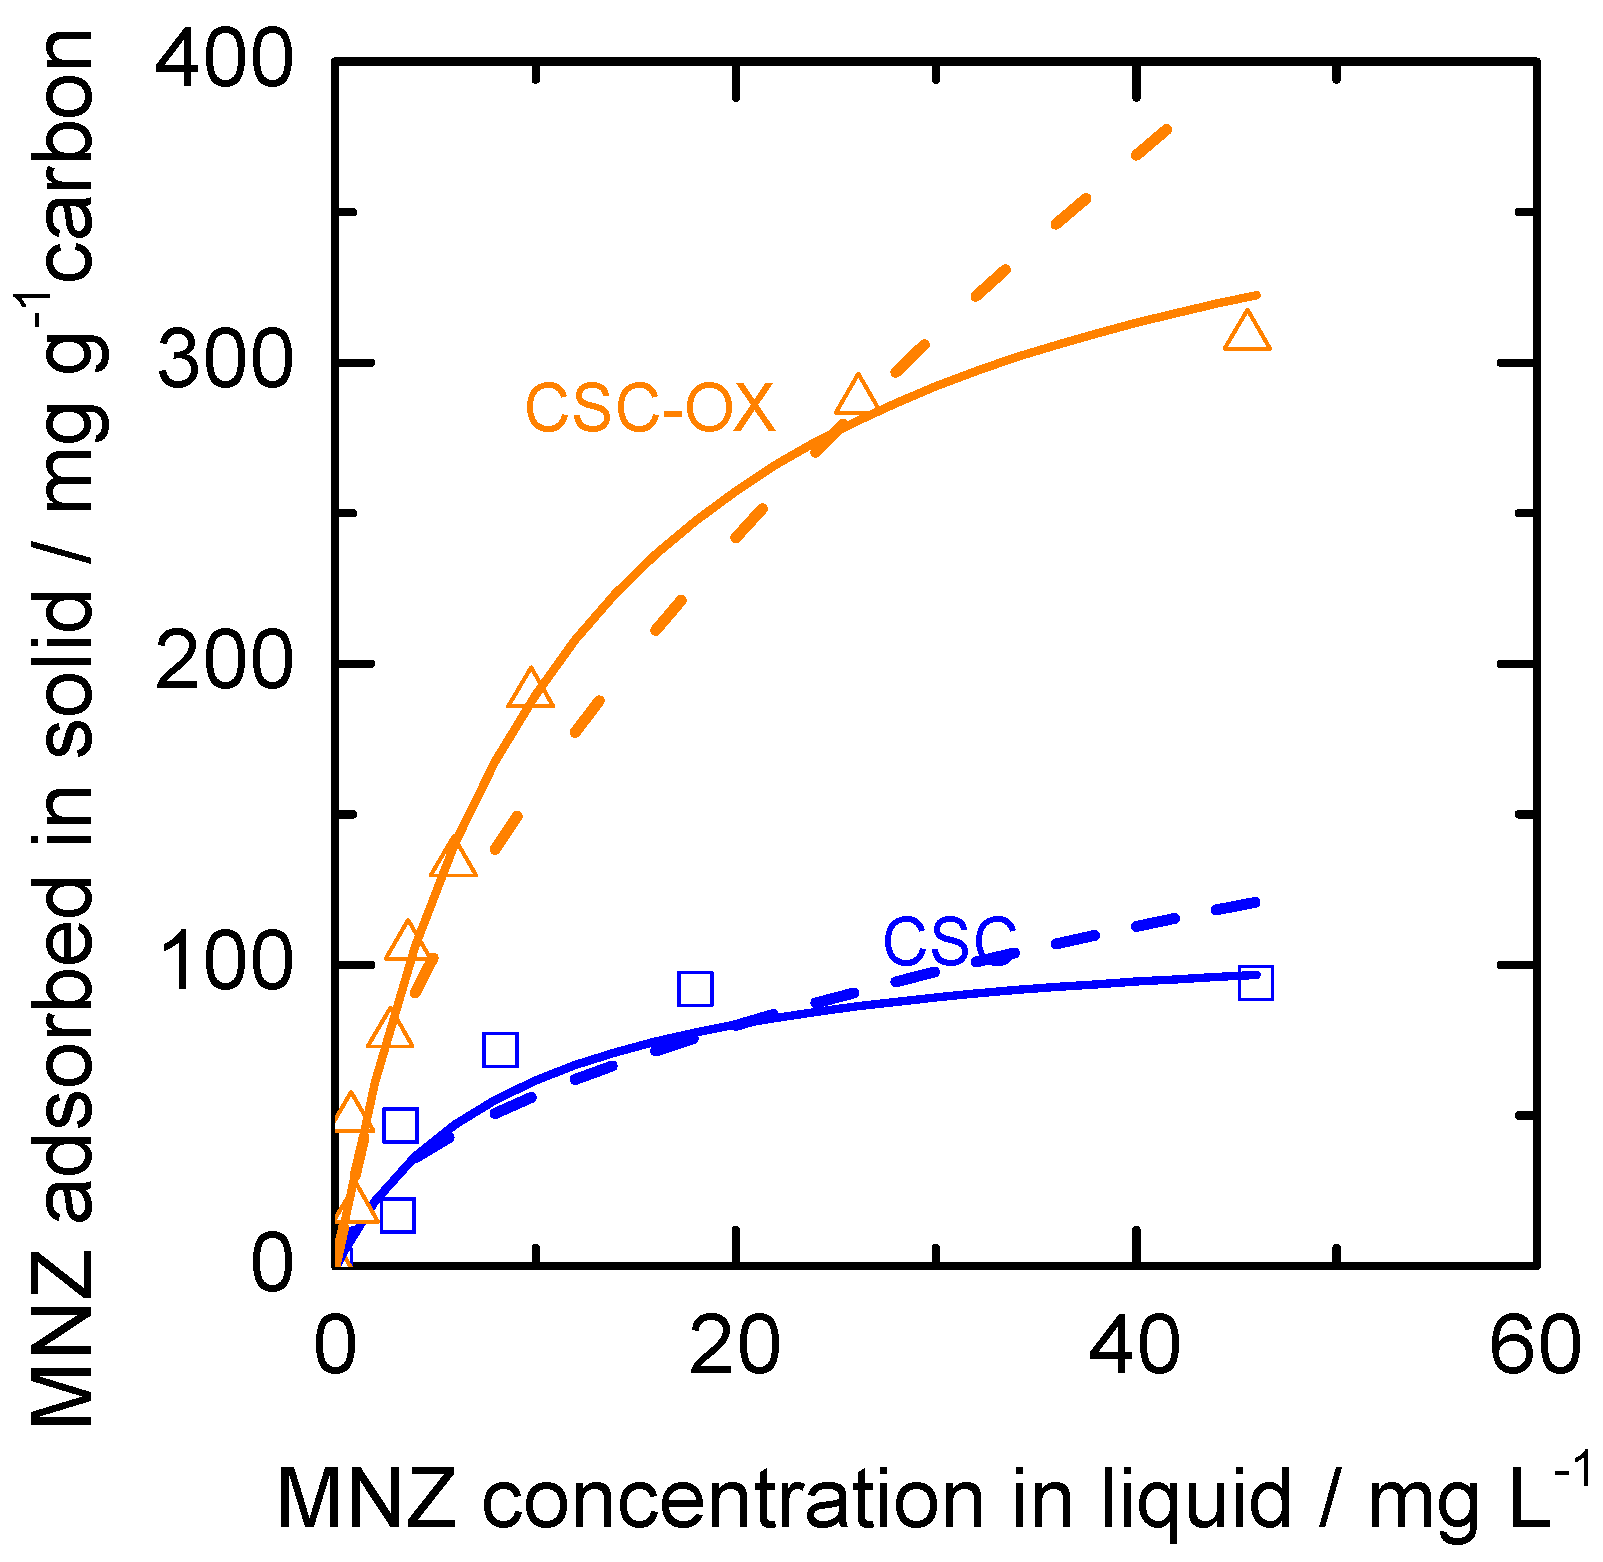
3.4. Metronidazole Adsorption Performance

The oxidation process tended to increase the mesoporosity of porous carbon (shown in Table 1) and also increased the number of oxygen functional groups (Figure 5 and Figure 6). CSC and CSC-OX were then employed for metronidazole adsorption. It can be seen from Figure 7 that the adsorption performance of oxidized carbon is better than the pristine carbon in the term of uptake capacity. At equilibrium of 45 mg/L concentration, adsorbed metronidazole in CSC-OX is ca. 310 mg/g adsorbent while in CSC is only ca. 100 mg/g adsorbent. This shows that modifications of porous carbon through hydrogen peroxide improve the adsorption performance. The high adsorption capacity of nanoporous carbon obtained by the simple oxidation process could compete with other activated carbons, having a range of uptake capacity of 150–300 mg/g adsorbent [11,12].
The distribution of molecular adsorption between the liquid phase and the solid phase could be described with an adsorption isotherm when it is in the equilibrium condition. The parameter that was obtained through the isotherm model is important information in the sorption mechanism; its surface characteristics and also showed adsorbent affinity [26]. The constants values of the metronidazole adsorption models of Langmuir and Freundlich are shown in Table 2. The Langmuir models is more appropriate for metronidazole adsorption models because its R2 is closer to 1. For Langmuir model, the value of the maximum adsorption capacity (Qm) for CSC-OX showcases the 400 mg/g adsorbent which is more than 3-times than that of CSC (ca. 115 mg/g adsorbent). However, the value of Langmuir constant of KL for oxidized carbon is 25% lower with respect to pristine carbon. For this phenomenon, it is likely that an increase in uptake capacity of metronidazole seems to be more related to the change in pore textural property rather than surface chemistry. An increase in the amount of oxygen functional groups in CSC-OX tends to decrease affinity of metronidazole onto surface of pores as can be seen from the decrease of value of Langmuir constant of KL (from 0.12 to 0.09 L/mol). This negative effects of oxygen functional groups to adsorption of organic compounds are also observed from literatures [14,27]. But alternation of porosity in oxidized carbon (see Table 1 and SEM image) likely induces more occupation of pore surfaces as indicated by the increase of the Qm value. Freundlich fitted parameters also agree with the findings. Freundlich constant of KF increases for oxidized carbon but the value of correction factor of n decreases from 2.00 to 1.64.
Figure 7 displays the Langmuir and Freundlich fitted curves of CSC and CSC-OX suggesting that Langmuir model is more fitted to the equilibrium data. Because the Langmuir model is compatible (indicated by value of R2), this shows that the adsorption process happened in a specific homogenous area to the adsorbent that is in the interface layer between adsorbate and adsorbent or called monolayer adsorption [19].

4. Conclusions

Modification of nanoporous carbon was conducted using mild oxidation of hydrogen peroxide. The results showed that the oxidation process alters the porosity of nanoporous carbon and amount of oxygen functional group. After oxidation, a higher amount of oxygen functional groups of porous carbon is seen and only a little decrease in the specific surface area, but more porosity is exhibited. In the application, oxidized carbon showed remarkably higher metronidazole uptake capacity. The increase in the adsorption capacity seems to be more related to the change in pore textural property rather than amount of oxygen functional group.

Author Contributions

Conceptualization, T.A. and I.P.; methodology, T.A. and I.P.; formal analysis, R.A.G.S. and Y.M.N.A.; investigation, R.A.G.S. and Y.M.N.A.; resources, T.A. and I.P.; writing—original draft preparation, T.A.; writing—review and editing, T.A. and I.P.; visualization, W.T.L.; supervision, T.A. and I.P; funding acquisition, T.A.

Funding

This research and APC were funded by program of Rekognisi Tugas Akhir (RTA), Universitas Gadjah Mada, grant number 2129/UN1/DITLIT/DIT-LIT/LT/2019.

Acknowledgments

The authors thank the PT Home System Indonesia for providing the porous carbon synthesized from coconut shell as a gift.

Conflicts of Interest

The authors declare no conflict of interest.

References

  1. Gadipelly, C.; Pérez-González, A.; Yadav, G.D.; Ortiz, I.; Ibáñez, R.; Rathod, V.K.; Marathe, K.V. Pharmaceutical industry wastewater: Review of the technologies for water treatment and reuse. Ind. Eng. Chem. Res. 2014, 53, 11571–11592. [Google Scholar] [CrossRef]
  2. Kidd, K.A.; Blanchfield, P.J.; Mills, K.H.; Palace, V.P.; Evans, R.E.; Lazorchak, J.M.; Flick, R.W. Collapse of a fish population after exposure to a synthetic estrogen. Proc. Natl. Acad. Sci. USA 2007, 104, 8897–8901. [Google Scholar] [CrossRef] [PubMed] [Green Version]
  3. Escher, B.I.; Baumgartner, R.; Koller, M.; Treyer, K.; Lienert, J.; McArdell, C.S. Environmental toxicology and risk assessment of pharmaceuticals from hospital wastewater. Water Res. 2011, 45, 75–92. [Google Scholar] [CrossRef] [PubMed] [Green Version]
  4. Yakubu, O.H. Pharmaceutical wastewater effluent-source of contaminants of emerging concern: Phytotoxicity of metronidazole to soybean (Glycine max). Toxics 2017, 5, 10. [Google Scholar] [CrossRef] [PubMed]
  5. Munoz, M.; Garcia-Muñoz, P.; Pliego, G.; Pedro, Z.M.D.; Zazo, J.A.; Casas, J.A.; Rodriguez, J.J. Application of intensified Fenton oxidation to the treatment of hospital wastewater: Kinetics, ecotoxicity and disinfection. J. Environ. Chem. Eng. 2016, 4, 4107–4112. [Google Scholar] [CrossRef] [Green Version]
  6. Goolsby, T.A.; Jakeman, B.; Gaynes, R.P. Clinical relevance of metronidazole and peripheral neuropathy: A systematic review of the literature. Int. J. Antimicrob. Agents 2018, 51, 319–325. [Google Scholar] [CrossRef] [PubMed]
  7. Lanzky, P.F.; Halting-Sørensen, B. The toxic effect of the antibiotic metronidazole on aquatic organisms. Chemosphere 1997, 35, 2553–2561. [Google Scholar] [CrossRef]
  8. Prasetyo, I.; Rochmadi, R.; Wahyono, E.; Ariyanto, T. Controlling synthesis of polymer-derived carbon molecular sieve and its performance for CO2/CH4 separation. Eng. J. 2017, 21, 83–94. [Google Scholar] [CrossRef]
  9. Amelia, S.; Sediawan, W.B.; Prasetyo, I.; Munoz, M.; Ariyanto, T. Role of the pore structure of Fe/C catalysts on heterogeneous Fenton oxidation. J. Environ. Chem. Eng. 2019, 102921. [Google Scholar] [CrossRef]
  10. Ariyanto, T.; Kurniasari, M.; Laksmana, W.T.; Prasetyo, I. Pore size control of polymer-derived carbon adsorbent and its application for dye removal. Int. J. Environ. Sci. Technol. 2019, 16, 4631–4636. [Google Scholar] [CrossRef]
  11. Carrales-Alvarado, D.H.; Ocampo-Pérez, R.; Leyva-Ramos, R.; Rivera-Utrilla, J. Removal of the antibiotic metronidazole by adsorption on various carbon materials from aqueous phase. J. Colloid Interface Sci. 2014, 436, 276–285. [Google Scholar] [CrossRef] [PubMed]
  12. Çalişkan, E.; Göktürk, S. Adsorption characteristics of sulfamethoxazole and metronidazole on activated carbon. Sep. Sci. Technol. 2010, 45, 244–255. [Google Scholar] [CrossRef]
  13. Ilomuanya, M.; Nashiru, B.; Ifudu, N.; Igwilo, C. Effect of pore size and morphology of activated charcoal prepared from midribs of Elaeis guineensis on adsorption of poisons using metronidazole and Escherichia coli O157:H7 as a case study. J. Microsc. Ultrastruct. 2017, 5, 32. [Google Scholar] [CrossRef] [PubMed]
  14. Liu, G.; Li, X.; Campos, L.C. Role of the functional groups in the adsorption of bisphenol A onto activated carbon: Thermal modification and mechanism. J. Water Supply Res. Technol. AQUA 2017, 66, 105–115. [Google Scholar] [CrossRef]
  15. Peng, Y.; Liu, H. Effects of oxidation by hydrogen peroxide on the structures of multiwalled carbon nanotubes. Ind. Eng. Chem. Res. 2006, 45, 6483–6488. [Google Scholar] [CrossRef]
  16. Rehman, A.; Park, M.; Park, S.-J. Current progress on the surface chemical modification of carbonaceous materials. Coatings 2019, 9, 103. [Google Scholar] [CrossRef]
  17. Moreno-Castilla, C.; Ferro-Garcia, M.A.; Joly, J.P.; Bautista-Toledo, I.; Carrasco-Marin, F.; Rivera-Utrilla, J. Activated carbon surface modifications by nitric acid, hydrogen peroxide, and ammonium peroxydisulfate treatments. Langmuir 1995, 11, 4386–4392. [Google Scholar] [CrossRef]
  18. Ros, T.G.; Van Dillen, A.J.; Geus, J.W.; Koningsberger, D.C. Surface oxidation of carbon nanofibres. Chem. A Eur. J. 2002, 8, 1151–1162. [Google Scholar] [CrossRef]
  19. Do, D.D. Adsorption Analysis: Equilibria and Kinetics, 2nd ed.; Imperial College Press: London, UK, 1998; ISBN 1860941303. [Google Scholar]
  20. Allwar, A. Characteristics of pore structures and surface chemistry of activated carbons by physisorption, FTIR And Boehm methods. IOSR J. Appl. Chem. 2012, 2, 9–15. [Google Scholar] [CrossRef]
  21. Saffaj, T.; Charrouf, M.; Abourrche, A.; Aboud, Y.; Bennamara, A.; Berrada, M. Spectrophotometric determination of metronidazole and secnidazole in pharmaceutical preparations based on the formation of dyes. Dyes Pigments 2006, 70, 259–262. [Google Scholar] [CrossRef]
  22. Sarwendah, R.A.G. Oksidasi Karbon Berpori dari dari Tempurung Kelapa dengan Hidrogen Peroksida serta Pengaruhnya untuk Adsorpsi Metronidazol. Bachelor’s Thesis, Universitas Gadjah Mada, Yogyakarta, Indonesia, 2018. [Google Scholar]
  23. Amimmal, Y.M.N. Oksidasi Karbon Berpori dari Kayu Mlanding dengan Hidrogen Peroksida serta Pengaruhnya untuk Adsorpsi Metronidazol. Bachelor’s Thesis, Universitas Gadjah Mada, Yogyakarta, Indonesia, 2018. [Google Scholar]
  24. Thommes, M.; Kaneko, K.; Neimark, A.V.; Olivier, J.P.; Rodriguez-Reinoso, F.; Rouquerol, J.; Sing, K.S.W. Physisorption of gases, with special reference to the evaluation of surface area and pore size distribution (IUPAC Technical Report). Pure Appl. Chem. 2015, 87, 1051–1069. [Google Scholar] [CrossRef] [Green Version]
  25. Hasse, B.; Glasel, J.; Kern, A.M.; Murzin, D.Y.; Etzold, B.J.M. Preparation of carbide-derived carbon supported platinum catalysts. Catal. Today 2015, 249, 30–37. [Google Scholar] [CrossRef]
  26. Li, Z.; Jia, Z.; Ni, T.; Li, S. Adsorption of methylene blue on natural cotton based flexible carbon fiber aerogels activated by novel air-limited carbonization method. J. Mol. Liq. 2017, 242, 747–756. [Google Scholar] [CrossRef]
  27. Ania, C.O.; Parra, J.B.; Pis, J.J. Influence of oxygen-containing functional groups on active carbon adsorption of selected organic compounds. Fuel Process. Technol. 2002, 79, 265–271. [Google Scholar] [CrossRef]
Figure 1. Molecular structure of metronidazole.
Processes 07 00835 g001
Figure 2. (A) N2-sorption isotherm sorption. (B) The pore size distribution of carbon evaluated by the N2-QSDFT method. In Figure 2A, P is the pressure and Po is the saturated pressure of nitrogen at 77 K.
Processes 07 00835 g002
Figure 3. SEM micrograph of CSC at 100× magnification (A) and 1000× magnification (B).
Processes 07 00835 g003
Figure 4. SEM micrograph of CSC-OX at 100× magnification (A) and 1000× magnification (B).
Processes 07 00835 g004
Figure 5. CSC and CSC-OX’s FTIR analysis
Processes 07 00835 g005
Figure 6. Analysis result of the acid group before and after the oxidation process with the Boehm titration method of CSC and CSC-OX.
Processes 07 00835 g006
Figure 7. Adsorption isotherm of metronidazole on CSC and CSC-OX (data: square and triangle; Langmuir-fitted curve—full line; Freundlich-fitted curve—dash line).
Processes 07 00835 g007
Table 1. Analysis result of surface area with the nitrogen sorption method.
No.Carbon TypeSSA a (m2/g)Total Pore Volume b (cm3/g)Percentage of Micropore SSA c (%)Percentage of Micropore Volume c (%)
1.CSC9730.439584
2.CSC-OX8950.419480
a Specific surface area; b Pore volume at 0.995 P/Po; c Determined by the t-plot method.
Table 2. Constant value of various fitting model of metronidazole adsorption.
No.MaterialLangmuir ModelFreundlich Model
KL, L/molQm, mg Adsorbate/g AdsorbentR2KF mg Adsorbate/(g Adsorbent (mol/L)n)nR2
1.CSC0.12114.940.9017.992.000.64
2.CSC-OX0.09400.000.9539.031.640.85

