Article

Accelerated Solvent Extraction for Effective Isolation of Sea Fennel Phenolic Antioxidants and Antimicrobials


Department of Food Technology and Biotechnology, Faculty of Chemistry and Technology, University of Split, R. Boškovića 35, HR-21000 Split, Croatia
*
Authors to whom correspondence should be addressed.
Processes 2026, 14(9), 1459; https://doi.org/10.3390/pr14091459
Submission received: 19 March 2026 / Revised: 23 April 2026 / Accepted: 28 April 2026 / Published: 30 April 2026
(This article belongs to the Special Issue Analysis and Processes of Bioactive Components in Natural Products)

Abstract

Sea fennel is a halophyte plant recognised as a valuable source of phenolics with good antioxidant and antimicrobial potential. In this study, accelerated solvent extraction (ASE) was optimised to improve the recovery of phenolic compounds from sea fennel, particularly hydroxycinnamic acids, which are known to be dominant. The effect of the applied extraction temperature (20–120 °C) and used solvent (20–80% hydroethanolic mixtures) on total phenolic content (TPC) was systematically evaluated. Individual phenolic composition, antioxidant activity, and antimicrobial properties were measured in the top four samples. TPC was determined spectrophotometrically, while individual compounds were analysed by chromatography. Antioxidant (reducing and free-radical scavenging) activity was assessed using three assays, while the minimum inhibitory concentrations and minimum bactericidal concentrations were determined using the microdilution method against five bacterial strains. Both temperature and solvent composition significantly influenced phenolic extraction efficiency. The highest TPC and concentrations of chlorogenic acid and its derivatives were obtained at 60 °C using 60–80% ethanol (664 and 673 mg of gallic acid equivalents/g of dry extract), while higher temperatures generally resulted in reduced phenolic yield. Extracts obtained under optimal ASE conditions exhibited enhanced antioxidant activity and moderate antimicrobial effects, particularly against Gram-positive bacteria, which demonstrates that accelerated solvent extraction represents an efficient approach for obtaining sea fennel extracts rich in valuable bioactives with potential use in different industries.

1. Introduction

The interest in nutraceuticals and dietary supplements originated from plants that grow worldwide. As a result, producers of plant extracts are increasingly focusing on the selection and optimisation of extraction procedures, which would bring consistent quality and reduced batch-to-batch variability [1]. In addition, environmental aspects are becoming more relevant. The ecological footprint can be reduced by reducing solvent consumption and energy use, using green solvents, and lowering the overall negative environmental impact of extraction processes [2,3]. Green extraction approaches such as accelerated solvent extraction (ASE), which is a type of pressurised liquid extraction (PLE), can significantly reduce both solvent and sample amount in comparison to conventional extraction techniques and result in extracts with a high share of biologically active compounds [4,5,6]. This makes ASE a promising extraction technique with a wide range of applications. It has been used for the extraction of a great number of natural compounds, especially the ones from plants such as phenolics and alkaloids [7,8]. For example, Repajić et al. [9] optimised ASE for the recovery of polyphenols and pigments from wild nettle leaves, determining, among other parameters, the optimal temperature for achieving the highest yields. Extracts obtained under optimised conditions contained significantly higher concentrations of phenolic compounds, especially the dominant chlorogenic acid, and exhibited greater antioxidant activity compared to extracts obtained by ultrasound-assisted extraction (UAE). In another study, Rodríguez-Pérez et al. [10] optimised both microwave-assisted extraction (MAE) and ASE for obtaining phenolic compounds from moringa leaves, showing that extracts obtained by optimised ASE yielded twice the number of phenolics. The efficacy of ASE for extracting antioxidants from rosemary, marjoram and oregano was improved by Hossain et al. [11] through the determination of the optimal temperature and solvent ratio for each plant. The optimised extracts compared to conventional solid/liquid extracts again showed higher yields of phenolics, especially phenolic acids, as well as significantly higher antioxidant activity. Diemer et al. [12] investigated temperature and solvent ratio parameters for ASE of caffeoylquinic acids from forced chicory roots, optimising parameters for both the best yield and antioxidant activity. In all cases, extracted compounds can be used in various applications, including food, pharmaceuticals, and cosmetics.
Since the climate changes are more obvious and there is a deficit in agricultural arable land, researchers are considering new sources of bioactive compounds. Halophytes are recognised as one of them [13,14], since these plant species grow in environments with high salinity and severe drought [14]. Among them, sea fennel (Crithmum maritimum L.), commonly found on cliffs and rocks of the Mediterranean, European Atlantic and Black Sea coast [15,16], has been widely used for years due to its health benefits in various purposes [17,18,19,20,21]. It is well known for its bioactive properties due to the high content of chlorogenic acid [22,23,24]. Even though there are several studies on bioactive compounds from sea fennel [22,23,25,26,27,28], only a few have investigated the influence of the applied extraction method and its parameters on the yield and profile of isolated compounds [29,30,31,32]. The novelty of this study, compared to previously published work, lies in the investigation of a specific chemotype of sea fennel growing in Croatia, with particular emphasis on its chemical composition. In addition, the study explores the application of advanced extraction techniques and the use of GRAS solvents, with ethanol employed as the extraction solvent in this work. In our previous work [29], microwave-assisted extraction (MAE), ultrasound-assisted extraction (UAE), and conventional solvent extraction (CSE) were compared, but ASE was not included. The study by Maoloni et al. [30] investigated phenolic extracts from different parts of sea fennel using methanol, while in this study, ethanol was used as a GRAS alternative. However, their work did not include optimisation of the extraction process, and the applied conditions (e.g., extraction temperature of 68 °C) were not clearly justified or supported by references. In addition, Cristina et al. [31] compared UAE and supercritical fluid extraction (SFE), but ASE was not considered. Therefore, this study aims to determine the optimal ASE conditions for the extraction of phenolics, especially chlorogenic acids, from sea fennel. To maximise the recovery of these compounds, solvent composition and extraction temperature were systematically optimised. Total phenolic content was determined by spectrophotometric analysis, and individual phenolics were detected by high-performance liquid chromatography (HPLC). In addition, antioxidant and antimicrobial activity were measured to evaluate and compare the bioactivity effects of the obtained extracts.

2. Materials and Methods

2.1. Plant Material

Harvesting of the sea fennel was performed in June on the island of Čiovo, Croatia (43°30′ N 16°17′ E). To remove dirt, fresh plant material was washed with tap water, while leaves were manually removed and stored at −18 °C. The plant material was freeze-dried (FreeZone 2.5 L, −50 °C, Labconco, Kanzas City, MO, USA) and ground to a powder using a commercial (coffee) grinder (Delimano, Croatia) right before extraction. Ethanol, 96%, p.a. was purchased from Kemika (Zagreb, Croatia), while formic acid p.a., ACS reagent and acetonitrile ≥99.92% were purchased from Sigma-Aldrich (St. Louis, MO, USA).

2.2. Accelerated Solvent Extraction (ASE)

Dionex ASE 350 extractor (Thermo Fisher Scientific Inc., Sunnyvale, CA, USA) was used for the preparation of sea fennel extracts. The percentage of ethanol and extraction temperature were optimised as shown in Table 1.
To prevent metal frit clogging and the entry of sample particles into the extracts, 22 mL stainless steel cells were fitted with cellulose filters (Dionex, Thermo Fisher Scientific Inc., Sunnyvale, CA, USA). To 1 g of plant material, 2 g of diatomaceous earth (Thermo Fisher Scientific Inc.) was added, and an additional 1 g was added to fill the cells. The extraction process started with filling the extraction cell with the selected solvent until the pressure reached 10.34 MPa (1500 Psi). Depending on the selected extraction temperature, the heating time was automatically determined by the instrument. Static extraction was performed for 5 min for all the samples. During the heating and static extraction, when the pressure reached 11.72 MPa (1700 Psi), the static valve opened, releasing a small amount of solvent. The static phase was followed by a rinse with 60% of the cell volume of fresh solvent. The process ended with purging all the cells and lines with nitrogen for 90 s. To avoid cross-contamination between samples, the system was thoroughly flushed after each extraction. Extractions were performed in duplicate, and extracts were collected in 60 mL glass vials with Teflon-lined septa and stored at +4 °C for 24 h to precipitate tannins. Using a rotary evaporator (Laborota 4000 efficient G3, Heildoph GmbH, Schwabach, Germany), ethanol from the combined extracts was evaporated, after which the extracts were freeze-dried and stored protected from the sunlight with desiccant. The extracts were diluted with 50% ethanol to concentrations between 0.01 and 10 mg/mL, depending on the method’s sensitivity, for further analysis.

2.3. Phenolic Content

2.3.1. Total Phenolic Content—Spectrophotometric Analysis

Total phenolic content was measured using the Folin–Ciocalteu method [33]. Extract in the amount of 25 µL at 10 mg/mL was placed in a cuvette, and 1.975 mL of distilled water and 125 µL of Folin–Ciocalteu reagent were added and mixed. After 5 min, 375 µL of sodium carbonate was added. The mixture was kept in the dark for 2 h before the absorbance at 765 nm was measured. The total phenolic content (TPC) of the samples was calculated using a gallic acid standard curve and expressed as mg/g of dry extract.

2.3.2. Response Surface Analysis

A regression-based response surface approach was applied to evaluate the combined effect of extraction temperature and ethanol concentration. A second-order polynomial model, including linear, quadratic, and interaction terms, was fitted using the experimental data, and the response surface was constructed within the studied experimental range.

2.3.3. Individual Phenolics—Chromatographic Analysis

The analysis of the individual phenolic compounds was conducted by the UltiMate 3000 high-performance liquid chromatography (HPLC) system (Thermo Fisher Scientific Inc., Sunnyvale, CA, USA) with a diode-array detector. The separation of the compounds was achieved on a Hypersyl Gold C18 column (100 × 3.0 mm, 3 μm; Thermo Fisher Scientific Inc.). The column was heated at 35 °C, and the flow rate was 1.5 mL/min. The mobile phase A (aqueous) was 1% formic acid in water, and mobile phase B (organic) was 90% acetonitrile and 10% of mobile phase A. The elution was isocratic for 5 min at 0% B. The gradient then increased to 18% B over 15 min, held for 5 min, increased to 20% over the next 5 min and then ramped to 100% B in 1 min to elute all remaining peaks. The absorbance was recorded at 260, 275, 320 and 350 nm. Peaks were identified by comparing the absorbance spectra and retention times of external phenolic standards. Quantification was performed using a calibration curve of external standards. Results were expressed in mg of compound per g of dry extract (mg/g).

2.4. Antioxidant Activity

The first assay is based on the reduction in the 2,2-diphenyl-1-picrylhydrazyl radical (DPPH) by the antioxidants present in the system [34]. An amount of 2 mL of DPPH reagent solution was added to a cuvette, and the absorbance was measured at 517 nm (AC(0)). A total of 50 µL of extracts with a concentration of 1 mg/mL were added to the solution in the cuvette. The absorbance of the reaction solution was measured again after 1 h (AA(T)). Results were expressed as mM Trolox equivalents (TE)/g equivalents using the calibration curve.
The FRAP (Ferric Reducing Antioxidant Power) assay is based on the reduction in the colourless [Fe3+-(2,4,6-tris(2-pirydyl)-s-triazine)2]3+ to the bright blue coloured [Fe2+-(TPTZ)2]2+ complex [35]. FRAP reagent in the amount of 3 mL was added to a cuvette, and the absorbance was measured at 593 nm. A total of 100 µL of extracts with a concentration of 1 mg/mL were added to the solution in the cuvette. The absorbance of the reaction solution was measured again after 4 min. The final value was calculated by subtracting the sample absorbance from the reagent absorbance. Results were expressed as mM Trolox equivalents (TE)/g equivalents using the calibration curve.
The ORAC (Oxygen Radical Absorbance Capacity) method is used to measure the ability of antioxidants to protect the fluorescent probe (fluorescein) from free radical damage, particularly peroxyl radicals produced by the spontaneous decomposition of AAPH [2,2′-azobis(2-amidino-propane) dihydrochloride] [36]. Fluorescence measurements were performed using a Synergy HTX Multimode Reader spectrofluorimeter (BioTek, Charlotte, VT, USA); excitation was measured at 495 nm and emission at 520 nm. Before the experiment, the instrument was heated to 37 °C so that the rate of radical generation was constant. For the measurements, 150 µL of fluorescein solution and 25 µL of the samples were mixed in black microplate wells and thermostated at 37 °C. After 30 min, 25 µL of AAPH solution was added, and the fluorescence intensity was measured every minute for 80 min. Results were expressed as mM Trolox equivalents (TE)/g using the calibration curve.

2.5. Antimicrobial Activity

For the antimicrobial activity, bacterial strains were used as follows: Enterococcus faecalis ATCC 29212, Listeria monocytogenes ATCC 7644, Bacillus cereus ATCC 14579, Escherichia coli ATCC 25922, and Pseudomonas aeuriginosa ATCC 27853. The minimum inhibitory concentration (MIC) and minimum bactericidal concentration (MBC) were determined using the microdilution method for sea fennel extracts dissolved in 50% ethanol at a concentration of 10 mg/mL. The MIC method was performed according to the method previously described by Skroza et al. [37] In brief, 100 µL of the diluted extracts (mixture of Mueller–Hinton broth (MHB) and extracts in a 1:1 ratio) were added to the first wells of the 96-well microtiter plate and diluted twofold in the next wells. After the addition of the 50 µL inoculum (106–107 colony-forming units (CFU)/mL), each plate was shaken for 1 min on a microtiter plate shaker at 600 rpm (plate shaker thermostat PST-60 HL, Biosan, Riga, Latvia). The positive control (50 µL inoculum and 50 µL broth), the negative control (50 µL broth and 50 µL extract), the blank sample (100 µL broth), and 50% ethanol was evaluated. After 24 h at 37 °C, 20 µL of the bacterial metabolic activity indicator, 2-p-iodophenyl-3-p-nitrophenyl-5-phenyl tetrazolium chloride (INT) (2 mg/mL) was added. The MIC values were visually determined as the lowest concentration of the extract at which no suppression of bacterial growth was detected by the reduction in INT to red formazan. The MBC was determined as the lowest concentration at which no microbial growth was detected in the wells where the MIC was determined, and in the wells with higher concentrations of the extract [36]. All measurements were repeated in triplicate, and the mean values are given in the tables/figures.

2.6. Statistical Analysis

TPC results were analysed using two-way ANOVA to evaluate the effects of extraction temperature and ethanol concentration. Antioxidant activities (DPPH, FRAP and ORAC) of selected extracts (3A, 3B, 6C and 3D) were compared using one-way ANOVA. Normality and homogeneity of variance were checked by Shapiro–Wilk and Levene tests. When necessary, Welch’s ANOVA followed by the Games-Howell post hoc test was applied. Results are presented as mean ± SD, and differences were considered significant at p < 0.05. Statistical analysis was performed using Jamovi software (Version 2.7.17).

2.7. Greenness Assessment Method

The greenness of the accelerated solvent extraction (ASE) procedure was evaluated using the Analytical GREEnness (AGREE) metric, introduced by the authors of [38,39], which is based on the 12 principles of green analytical chemistry. The assessment was focused on the extraction step, considering sample preparation and extraction conditions, while instrumental analysis was not included in the evaluation. The overall greenness score was calculated using the default weighting system implemented in the AGREE software (version v.0.5.2020).

3. Results and Discussion

3.1. Total Phenolic Content (TPC)

Total phenolic content was measured in the samples extracted at various conditions: using different ethanol–water mixtures (20, 40, 60, and 80%) and at different temperatures (20, 60, and 120 °C). The main objective was to determine the best conditions for maximum extraction yield of sea fennel phenolics, especially chlorogenic acids (CGAs), which are the dominant phenolics in sea fennel samples. At all tested temperatures, higher ethanol concentrations led to higher TPC values. The highest phenolic content was observed with 60–80% ethanol, suggesting that this range is the most effective for the extraction (Figure 1). Ashim et al. [32] investigated phenolic content in sea fennel water and hydroethanolic (80%) extracts and also reported higher amounts of these compounds in ethanolic extracts. The same trend was also recorded for flavonoids. It is well known that chlorogenic acid (CGA) and its derivatives are the dominant phenolics in sea fennel, and their solubility is known to be better in ethanol than pure water [40]. Besides mono-CGAs, sea fennel is also a great source of di-CGAs [32] which are, in general, less polar and more soluble in hydroalcoholic mixtures [41]. This could be a reason for a higher share of phenolics in samples prepared at the same temperature (case of extractions at 20 and 60 °C) and using solvents with a higher amount of ethanol.
A significant effect on phenolic extraction efficiency was also observed with temperature. At 20 °C, the TPC increased proportionally with the ethanol content, reaching a maximum at 80% (sample 1D with 611.1 mg/g) (Figure 1). TPC increases evenly at all ethanol contents at 60 °C, reaching a maximum of 673.2 mg/g in 80% ethanol (sample 3D), but the results become less persistent at 120 °C. For example, at 60% ethanol, TPC is higher (sample 6C with 664.4 mg/g) than at 80% ethanol (sample 6D with 603.9 mg/g). This is probably due to the degradation of some phenolic compounds at higher temperatures. These results of the optimisation experiments lead to the conclusion that 60 °C is the optimal temperature for phenolics’ extraction, especially in the combination with 60–80% ethanol as an extraction solvent. The increase in temperature to 120 °C reduces phenolic yield, especially at higher ethanol concentrations, suggesting phenolic degradation [41,42]. This was also statistically proven. Repajić et al. [9] optimised ASE for the recovery of polyphenols, including dominant chlorogenic acid, from wild nettle leaves and their results showed the highest yield with the highest used temperature (110 °C), differing from our results. These discrepancies could be due to the use of different plant material, solvent (they used 96% ethanol), number of cycles (3 or 4 vs. 1) and static time (10 min vs. 5 min). In this study, two-way ANOVA revealed a significant effect of extraction temperature and ethanol concentration on total phenolic content. A significant interaction between temperature and ethanol concentration was also observed (p < 0.001), indicating that the effect of temperature depended on solvent composition.

3.2. Response Surface Analysis

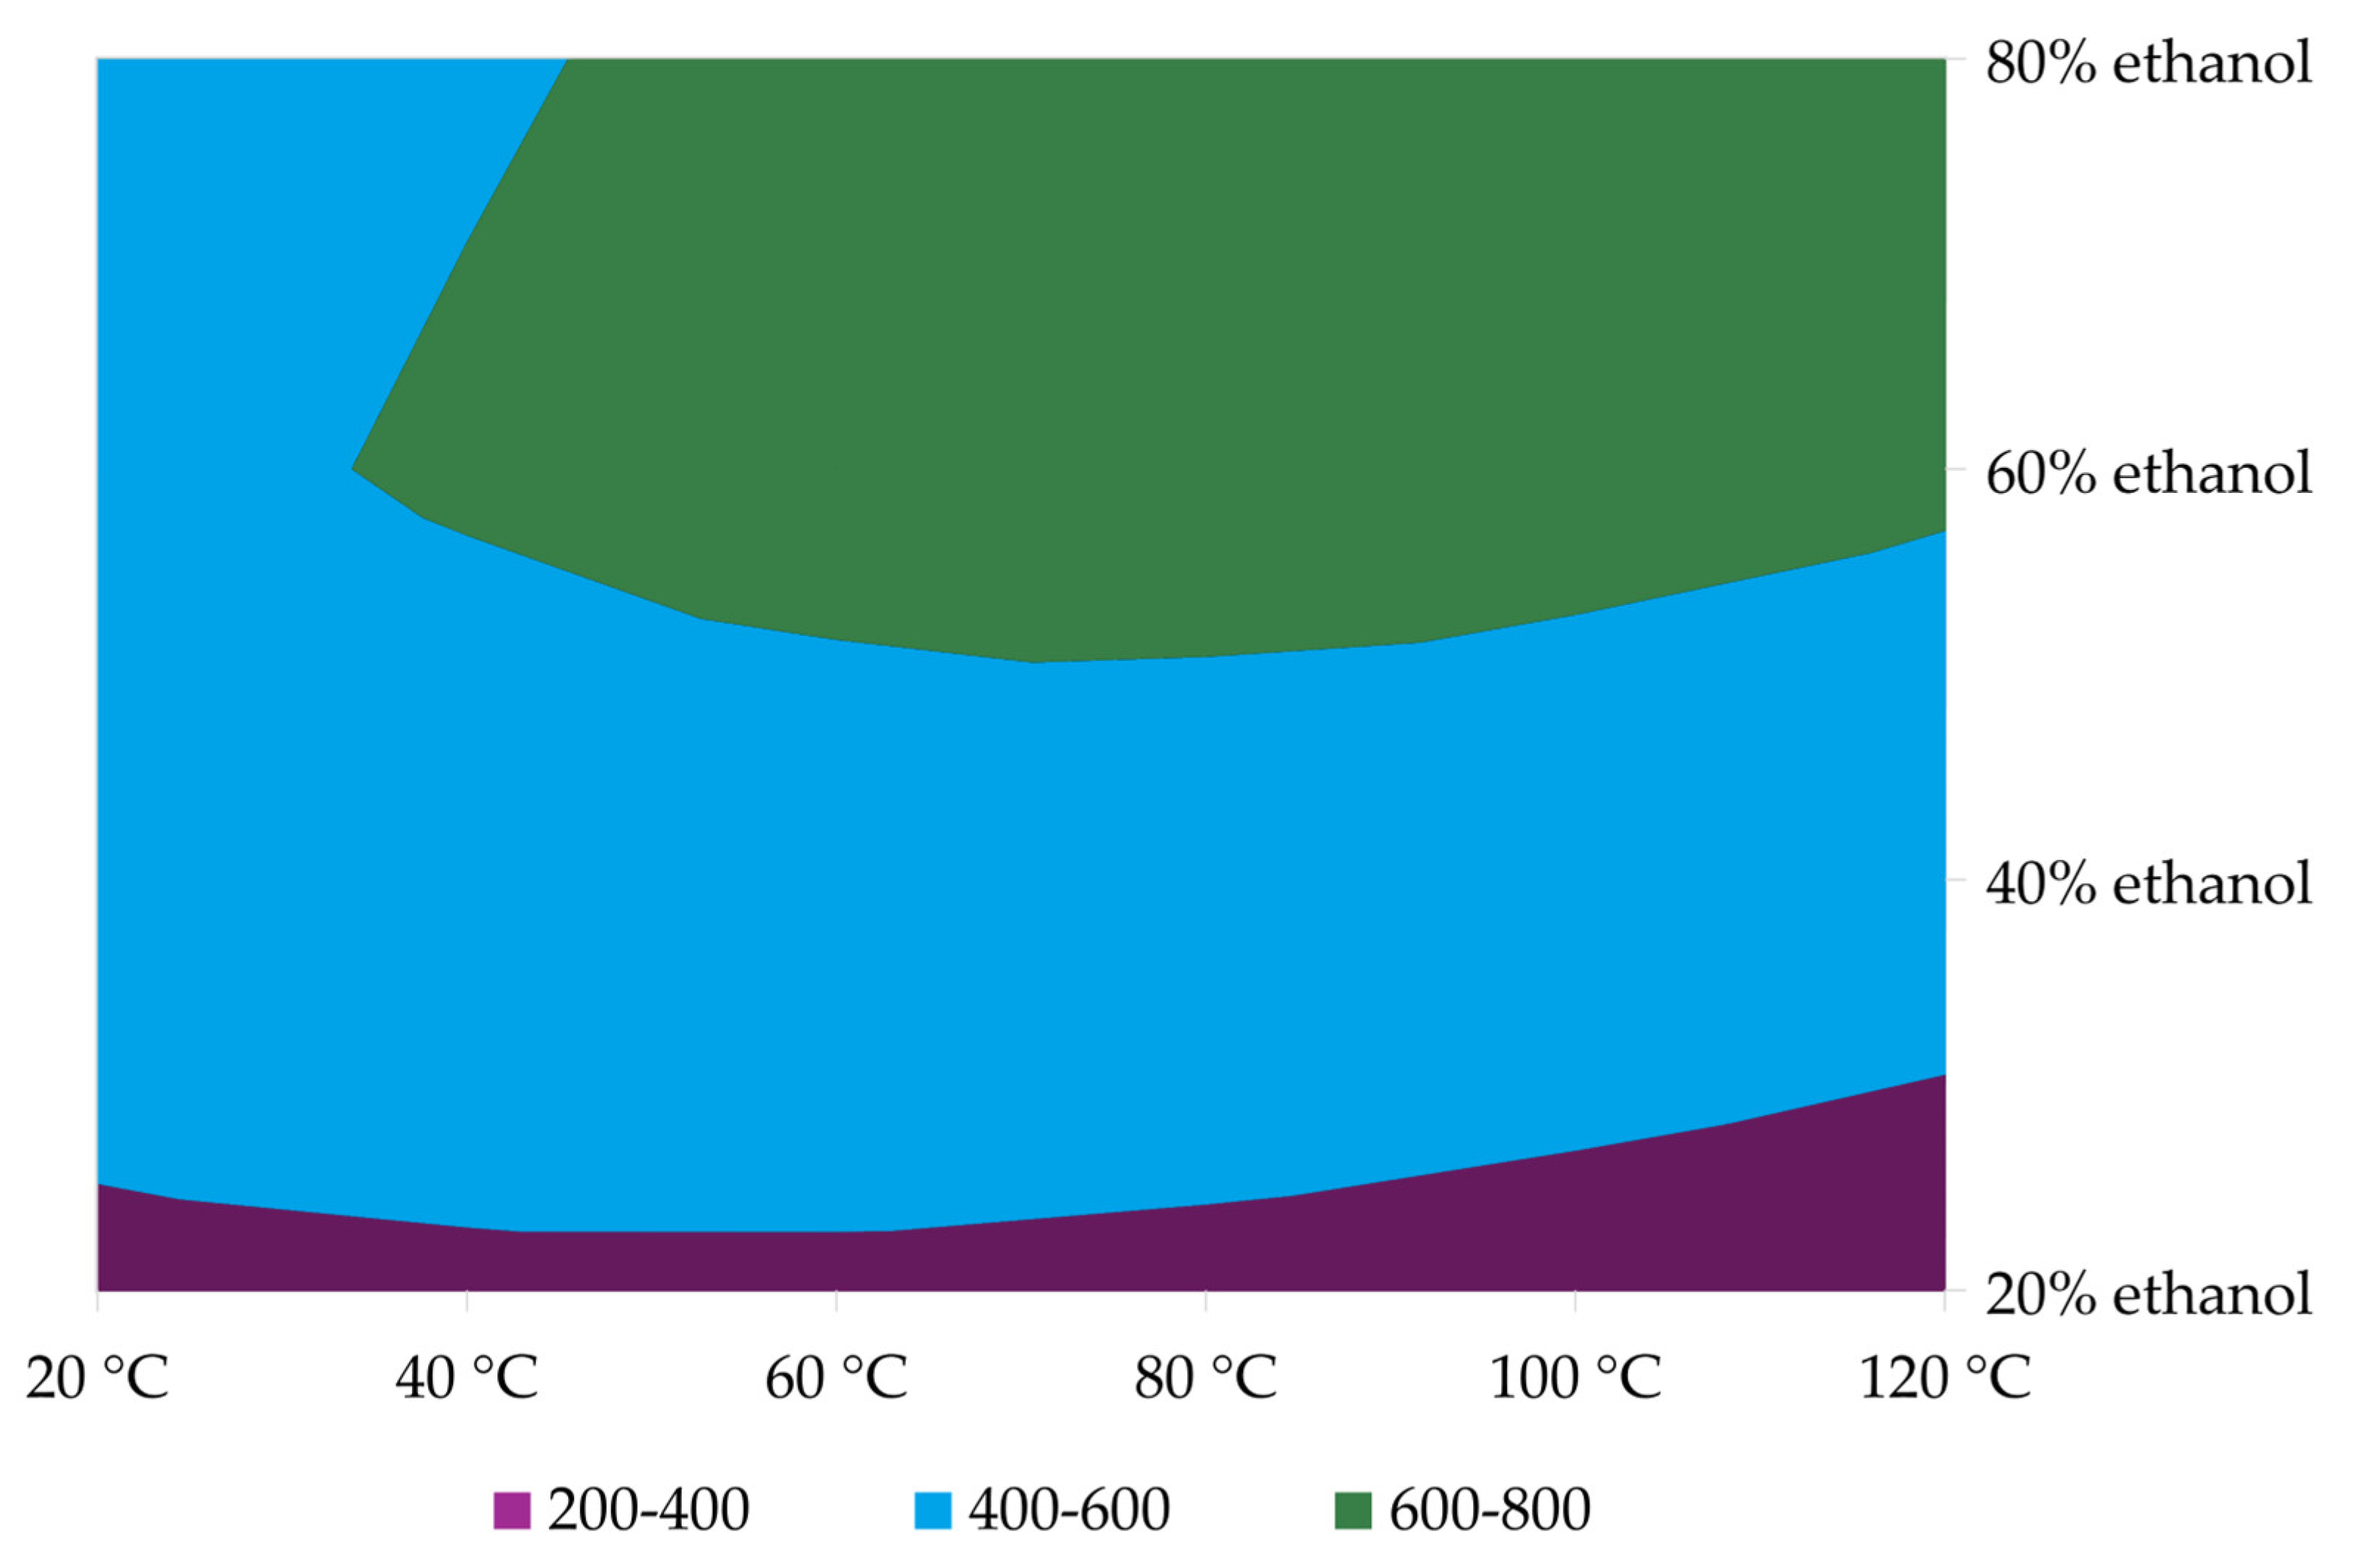
A regression-based response surface model was applied to evaluate the combined effect of extraction temperature and ethanol concentration on total phenolic content. The model showed a good fit to the experimental data (R2 = 0.90, p < 0.001). The response surface (Figure 2) indicates that ethanol concentration had a stronger influence on extraction efficiency, with higher values observed at increased ethanol levels. Temperature showed a less pronounced effect within the studied range, although a slight increase in response can be observed at moderate temperatures.

3.3. HPLC Analysis of Individual Phenols

Four combinations of temperatures and solvent mixture ratios with the highest TPC (samples 3A, 3B, 3D, and 6C) were analysed for the individual phenolics by HPLC (Table 2). Sea fennel is known for its richness in hydroxycinnamic acids [22,23], and CGA is the most prevalent among the secondary metabolites [29,43,44,45]. Of the analysed samples, CGA had concentrations from 7.87 mg/g in sample 6A (120 °C, 20% ethanol) to 29.25 mg/g in sample 3D (60 °C, 80% ethanol) (Table 2). This indicates that moderate thermal conditions at 60 °C, coupled with a high ethanol concentration of 80%, are optimal for the extraction of CGA, whereas higher temperatures (120 °C) may potentially reduce extraction efficiency due to likely thermal degradation [41,42]. These findings are in line with our previous results where the concentration of CGA in sea fennel samples was as follows: 8.68 mg/g (conventional extraction), 9.78 mg/g (UAE), and 10.67 mg/g (MAE) [25].
Various studies have investigated the effect of extraction temperature on the stability of phenolic compounds and have reported different results [46,47,48]. Liazid et al. [47] investigated the stability of 22 phenolics from different subgroups under microwave-assisted extraction at various temperatures and concluded that the type and position of hydroxyl substituents have a strong impact on compound stability (a higher number of substituents corresponds to higher degradation). Benzoic acids, such as gallic acid and p-hydroxybenzoic acid, which were also detected in sea fennel samples in this study, showed the highest extraction yield at 100 °C, while at higher temperatures their degradation was observed. According to our results, at 120 °C, the gallic acid yield in extracts was the highest, which could be related to the solvent used. The authors also reported a negative effect of temperatures above 50 °C on caffeic acid stability, whereas in our study, its content was highest in extracts prepared at the highest temperature. The reason for this discrepancy could lie in the fact that chlorogenic acids (CGAs) are esters of caffeic and quinic acid, so the observed increase in caffeic acid may be a result of thermal decomposition of CGAs. Additionally, the use of different solvent systems should not be neglected.
Compound extraction efficiency is also influenced by the extraction solvent [49] used and its polarity [50]. These differences may also reflect the initial abundance of individual compounds in plant tissue, in addition to their extraction behaviour. Galanakis et al. concluded that phenolic compounds generally prefer solvents with intermediate polarity, such as alcohols, rather than highly polar solvents such as water. However, they also reported that compounds such as gallic, cinnamic, and coumaric acids may preferentially dissolve in water. A low correlation between activity coefficients and compound polarity was observed, while the authors also highlighted the strong influence of compound stereochemistry and intermolecular interactions between the compound and the solvent [50]. In the study by Kaczorova et al. [49], p-hydroxybenzoic acid was present only in ethanolic extracts, whereas ferulic and rosmarinic acids were found only in aqueous extracts. The content of chlorogenic and caffeic acids in the water extract was significantly higher than in the ethanolic extract (3 vs. 0.02 and 12 vs. 3 µmol/g, respectively), while rutin was not detected in the water extract. Another study reported that an increase in the ethanol proportion in the tested solvent systems had a negative effect on the extraction efficiency of most phenolic compounds [51], which further highlights the complexity of extraction efficiency, as it depends on the raw material, reaction conditions, and the characteristics of the compounds being isolated, as well as on the properties of the used extraction solvent.
Sea fennel extracts obtained by ultrasound-assisted extraction at different ethanol concentrations (0, 10, 20, 40, 80 and 100%; v/v) were studied by Cristina et al. [31] who reported the highest share of total phenolics in extracts prepared with 40% of ethanol. The extraction process of CGAs was also studied by Chadmi et al. [52] and the authors reported the highest concentration of CGA in chicory extracts obtained using 70% of ethanol. Changes in the share of ethanol in the hydroalcoholic mixture follow a parabolic trend, and lower results were detected in the extract obtained by pure ethanol. On the other hand, temperature did not have an impact on the extraction of phenolics in ethanolic extracts, while extraction with water was strongly influenced by temperature, with higher amounts of CGA found in extracts prepared using higher temperatures. Jeon et al. [40] also reported that the solubility of CGA increases with temperature. Neochlorogenic acid (nCGA) has also shown this type of extraction behaviour, with a concentration of 0.70 mg/g in both 3A (60 °C, 20% ethanol) and 3D (60 °C, 80% ethanol). The highest concentration of cryptochlorogenic acid (cCGA) (3.60 mg/g) was noticed in sample 3D (60 °C, 80% ethanol). In the sample 6C (120 °C, 60% ethanol) it significantly decreased. These findings indicate that moderate heat and high ethanol content provide optimal extraction conditions that favour both the solubility and stability of hydroxycinnamic acids. Higher concentrations of nCGA and cCGA than those reported in studies using UAE, MAE and conventional extraction techniques, suggest that ASE may provide more efficient recovery of these acids under the applied conditions [29,43]. In the study of Ashim et al. [32], a slightly higher amount of detected hydroxycinnamic acids was also found in ethanolic extracts (22.99 mg/g) compared to water extract, and CGA accounted for 61.3% of the total phenolics in samples. The authors also detected a higher amount of caffeic acid in the ethanol extract, which was also consistent with results obtained in this study.
The highest concentrations of rutin (R) were observed at 60 °C with 80% ethanol, reaching 2.27 mg/g (Table 3), respectively. These results follow the pattern seen in the case of hydroxycinnamic acids. The moderate heat and especially higher ethanol content are also the optimal combination for the extraction of flavonoids which was also confirmed by previous reports [32]. In contrast, smaller phenolic acids like gallic acid (GA), protocatechuic acid (PCA), and p-hydroxybenzoic acid (PHBA) were not significantly affected by the change in the extraction conditions. In all analysed samples, their concentrations were more or less consistent. This is likely because of their simple structures and hydrophilic nature, which make them less sensitive to changes in temperature or ethanol concentration.

3.4. Antioxidant Activity

The antioxidant activity of extracts varies based on solvent use and the applied extraction temperature. The highest DPPH radical scavenging activity was observed in sample 3D (60 °C, 80% ethanol; 0.51 ± 0.02 mM TE/g), followed by sample 6C (120 °C, 60% ethanol; 0.39 ± 0.03 mM TE/g), while the lowest activity was recorded in sample 3B (60 °C, 40% ethanol; 0.06 ± 0.01 mM TE/g). A similar trend was observed for reducing power, measured through the FRAP assay, where increasing ethanol content resulted in higher values. The strongest reducing capacity was again recorded at 60 °C with 80% ethanol (sample 3D, 2.18 ± 0.04 mM TE/g). Unlike results from these two antioxidant assays, the ORAC assay showed the highest activity at 60 °C with 40% ethanol (sample 3B, 5.03 ± 0.25 mM TE/g), while lower ethanol content resulted in weaker activity (Table 3).
The observed heterogeneity among the results is a consequence of the different mechanisms of antioxidant action in the methods used, which were selected for that very reason. Since the antioxidant properties of samples cannot be adequately described using a single method, this study employed three different assays to evaluate antioxidant capacity. The FRAP assay is a simple and reproducible test, with results that are linearly correlated with the molar concentration of antioxidants. It is a redox-based method involving a single electron transfer (ET) mechanism and directly measures the total reducing power of antioxidants. In contrast, the DPPH radical scavenging assay is a hydrogen atom transfer (HAT)-based method and one of the most widely used spectrophotometric assays for assessing the antiradical capacity of samples. It provides information on the ability of antioxidants to prevent reactive radical species from reaching other components in biological and food systems. Since spectrophotometric methods can often be affected by chromatic interference, the ORAC method, which involves biologically relevant peroxyl radicals, was also used [53,54,55].
The results of our previous study [53] reported that the antioxidant activity of phenolics (namely phenolic acids, which are the main compounds detected in sea fennel) depends on compound structure and concentration, including the type, number, and arrangement of substituents, but also on the antioxidant method used. The study did not include chlorogenic acid; however, gallic acid exhibited the highest reducing activity, while the lowest antiradical values were observed in the ORAC assay. Although the number of samples was relatively low (n = 4), a statistically significant correlation was observed only between total phenolic content and FRAP values (p = 0.0048), which is expected given the similar reduction-based mechanisms of both methods. This result suggests that the relationship between phenolic content and antioxidant activity depends on the method used. FRAP is based on electron transfer and therefore reflects total reducing capacity more directly, while DPPH and ORAC are based on different mechanisms, which may explain the lack of correlation. In addition, the lack of a clear relationship with chlorogenic acid indicates that antioxidant activity is influenced by the overall phenolic profile, rather than a single compound.
Overall, the results suggest that higher ethanol content improves extraction of compounds responsible for reducing power detected by FRAP method and free radical scavenging ability measured against DPPH radical. Ashim et al. [32] demonstrated more promising radical scavenging activity against DPPH of sea fennel water extracts compared to those obtained by 80% of ethanol, while reducing activity was higher for ethanolic extracts. Cristina et al. [31] confirmed higher reducing and free radical scavenging activity in sea fennel extracts with the highest share of total phenolics, with an obvious trend in correlation of phenolic content and antioxidant properties. Xu et al. [56] investigated antioxidant activities of CGA isomers, including three caffeoylquinic acid isomers (chlorogenic, criptochlorogenic and neochlorogenic acids), but their study confirmed good antioxidant activity of the tested compounds. However, significant differences in the activity of tested compounds were not observed, indicating that the position of esterification on the quinic moiety had no effect on its properties. On the other hand, dicaffeoylquinic acids had better antioxidant activities. Moderate ethanol concentrations may favour compounds contributing to peroxyl radical scavenging activity, as the highest score was detected for sample 3B (60 °C, 40% ethanol). If we compare the results of individual phenolics with these findings, higher concentrations of hydroxycinnamic acids as well as other phenolics like rutin, can be associated with increased scavenging activity and reducing potential of the samples. Since the antioxidant properties of the sea fennel are strongly linked to phenolic content [57,58], especially present hydroxycinnamic acids [16,28,59,60,61], these compounds likely play a major role in the overall antioxidant potential of the tested extracts.
One-way ANOVA showed significant differences among the selected extracts in all antioxidant assays (p < 0.01). For DPPH activity, all extracts differed significantly from each other, with the highest activity observed in sample 3D, followed by 6C, 3A and 3B. In the FRAP assay, sample 3A showed significantly lower reducing power compared to the other extracts, while no significant difference was observed between 6C and 3D. Regarding ORAC values, samples 3B and 6C exhibited higher activity compared to 3A, whereas no significant difference was found between 3B and 6C; sample 6C also showed higher activity than 3D.
Overall, DPPH and FRAP results indicated the highest activity in extracts obtained with higher ethanol content, particularly sample 3D, while ORAC values were more pronounced in samples extracted with moderate ethanol concentrations (3B and 6C). These findings suggest that antioxidant activity depends not only on total phenolic content but also on the specific phenolic profile and the dominant reaction mechanism of each assay.

3.5. Antibacterial Activity

The antibacterial activity of the tested samples was evaluated against both Gram-positive and Gram-negative food-borne pathogens and spoilage bacteria, with notable differences in bacterial susceptibility. Among the Gram-positive bacteria, L. monocytogenes appeared to be one of the most susceptible species, as samples 6C and 3D showed the strongest inhibitory effect with MIC and MBC values of 0.62 mg/mL (Table 4). Samples 3A and 3B were also effective against these pathogenic bacteria, but at twice the concentration (1.25 mg/mL). A strong activity against E. faecalis was noticed for the samples 6C and 3D, while samples 3A and 3B were not active. For B. cereus, only sample 3A was not active, while the MIC values provided by the other samples were 1.25 mg/mL.
However, Gram-negative bacteria showed a higher level of resistance to the samples tested. For example, only samples 3B and 6C showed antimicrobial activity against E. coli (MIC value was 2.5 mg/mL), while samples 3A and 3D showed no effect on inhibiting the growth of this Gram-negative pathogenic bacterium at the concentration tested. Of the separated extracts, samples 3B, 6C and 3D were effective against the spoilage bacterium P. aeruginosa with MIC values of 1.25 mg/mL, but higher MBC (2.5 mg/mL). Sample 3A again showed the weakest activity with an MIC value of 2.5 mg/mL and was unable to achieve a complete bactericidal effect. The results show that Gram-negative bacteria were more resistant to the tested compounds, likely because their outer membrane protects them from antimicrobial agents.
Samples 6C and 3D showed the best antibacterial activity overall, especially against G-positive bacteria, with lower MIC and MBC values. Although their efficacy against G-negative species was significantly reduced, the MIC values indicate that slightly higher concentrations still achieve inhibition against some bacterial species. Comparing the antimicrobial activity with the phenolic content and antioxidant activity, these two samples, sample 6C and 3D, stand out again. The highest content of total phenols, as well as the presence of CGA and its derivatives, could be one of the reasons for the good antimicrobial effect.
Although sea fennel has been extensively researched, there is still a lack of scientific work on the antimicrobial activity of hydroethanolic extracts. The scientific papers mainly focus on the good antimicrobial activity of the essential oil and the non-polar extracts against numerous types of microorganisms [44,57,58,62,63,64].
The greater activity against Gram-positive microorganisms compared to Gram-negative ones is due to differences in cell membrane structure. Gram-positive bacteria have a single cytoplasmic phospholipid bilayer surrounded by a thick peptidoglycan layer, while Gram-negative bacteria have an additional outer membrane that serves as a permeability barrier. Lipophilic compounds in essential oils, such as terpenes and phenolic compounds, readily penetrate and disrupt the cytoplasmic membrane of Gram-positive bacteria, increasing membrane permeability, causing leakage of intracellular contents, and resulting in cell death. In contrast, the outer membrane of Gram-negative bacteria, which is rich in lipopolysaccharides, limits the penetration of these compounds into the bacterial cell. The most meritorious compounds are CGA and its derivatives, as well as rutin and quercetin derivatives, which have been shown to have strong antimicrobial properties against pathogenic bacteria such as S. aureus, B. subtilis, B. cereus, E. coli, E. faecalis, and S. typhimurium and against the spoilage bacterium P. aeruginosa. Previous studies have shown that the antimicrobial efficacy of sea fennel extracts strongly depends on the extraction solvent and the resulting phenolic profile, with hydroethanolic extracts generally exhibiting higher activity than aqueous extracts [32]. Souid et al. [65] confirmed a high antimicrobial potential of the sea fennel essential oils [62] but also indicated a high antimicrobial potential of the hydroethanolic extract against Gram-negative bacteria (E. coli, S. enterica and E. aerogenes) and Gram-positive bacteria (E. faecalis and S. aureus), even at the lowest tested concentration 0.25 mg/mL. Orhotohwo et al. [64] also confirmed antimicrobial activity of sea fennel extract and showed inhibitory activity against E. coli and S. aureus regardless of the plant areas (flowers, seeds, leaves or vapours), while Ashim et al. [32] concluded that sea fennel water extract does not possess antimicrobial activity, while its ethanolic extracts were active against S. aureus and Listeria innocua.
Compared to these studies, the antimicrobial activity observed in this work can be considered moderate, due to differences in extraction conditions and phenolic composition, particularly the dominance of hydroxycinnamic acids. Furthermore, the higher susceptibility of Gram-positive bacteria observed in this study is consistent with previously reported trends for plant-derived phenolic extracts.

3.6. Greenness Assessment Method

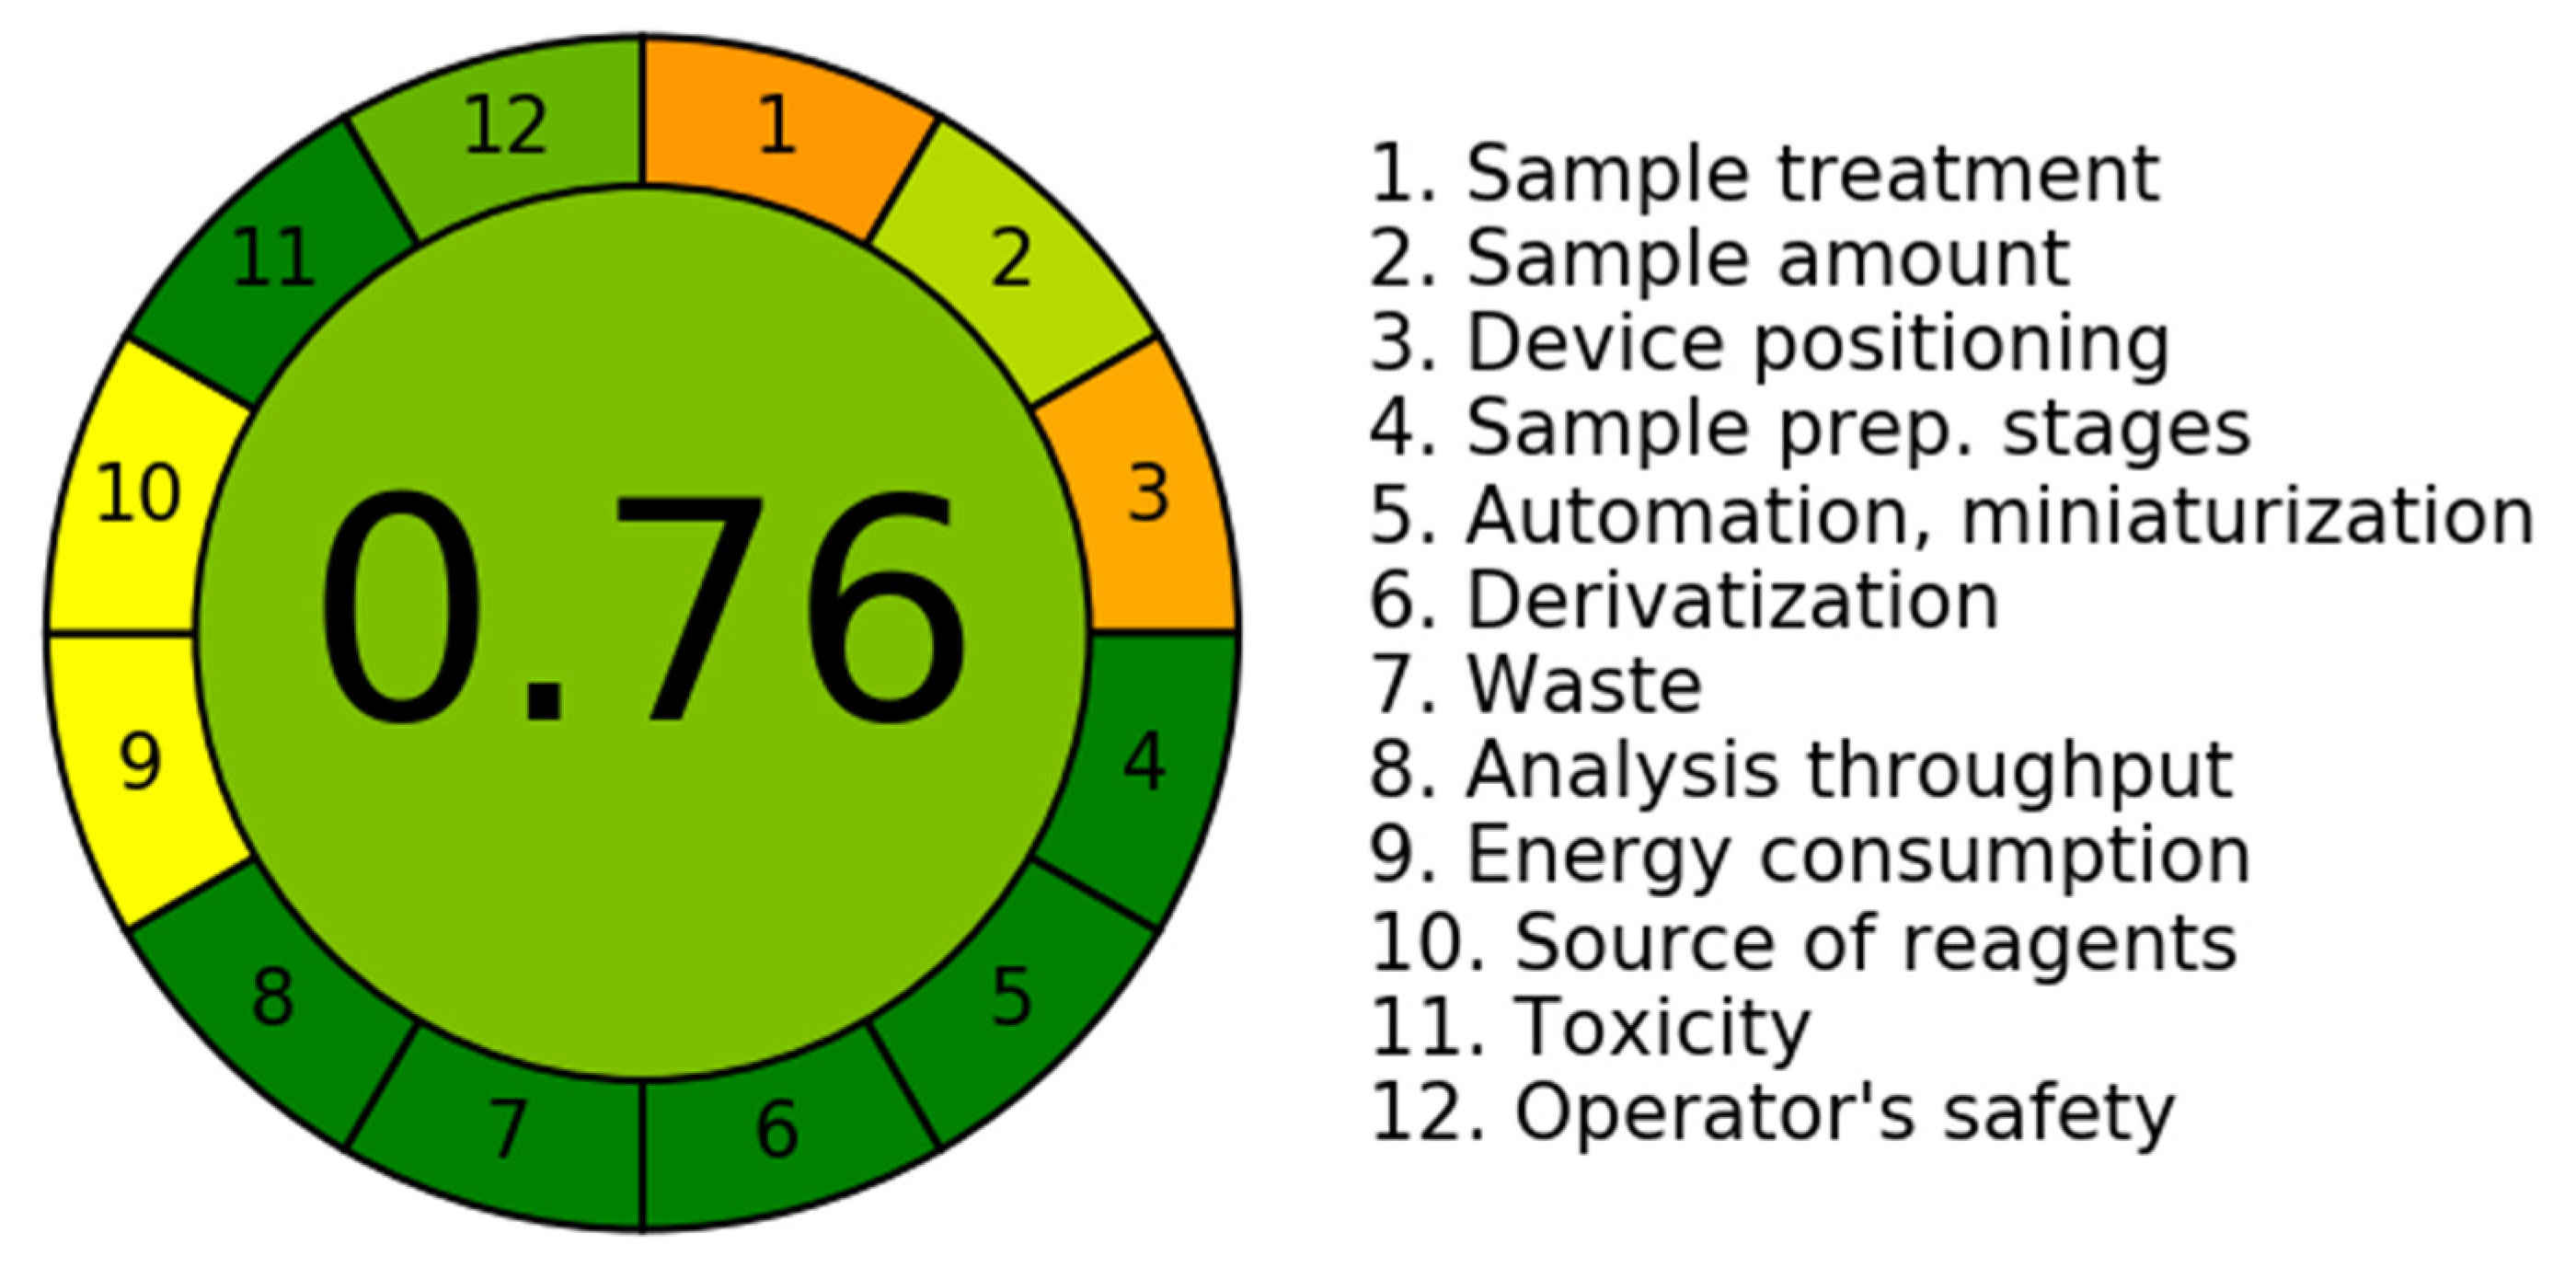
The greenness of the accelerated solvent extraction (ASE) procedure was evaluated using the AGREE tool, and the obtained score was 0.76, which indicates a fairly good level of compliance with green analytical chemistry principles (Figure 3). This is mainly related to the use of ethanol and water as extraction solvents, as well as shorter extraction time and lower solvent consumption compared to conventional extraction methods. The automated nature of ASE also contributes to easier handling and better reproducibility.
On the other hand, some steps in the procedure still limit the overall greenness. Sample preparation (drying and grinding) is required, and the analysis is performed off-line. In addition, the use of higher temperatures and pressure increases energy consumption. Overall, ASE can still be considered a more sustainable option than conventional extraction, especially due to reduced solvent use and shorter extraction time.

4. Conclusions

This study showed that accelerated solvent extraction (ASE) can be successfully applied for the extraction of the phenolics from sea fennel. The results showed that the applied extraction parameters, primarily temperature and ethanol content in the solvent system, affect extraction efficiency. Moderate temperature of 60 °C combined with higher ethanol content (60–80%) resulted in the highest TPC and concentrations of hydroxycinnamic acids, especially CGA and its derivatives, as well as rutin. Prolonged extraction reduced the efficiency of key compound recovery, likely due to thermal degradation. Extracts richer in hydroxycinnamic acids and other phenolics, such as rutin, generally show higher free radical scavenging activity, which again confirms their undoubted role in the overall activity of the samples. Higher ethanol concentrations at 60 °C favoured the extraction of chlorogenic acid and its derivatives, which was reflected in stronger DPPH and FRAP activity. In contrast, extracts obtained at intermediate ethanol levels showed higher ORAC values, indicating that different phenolic profiles may contribute differently to the antioxidant assay applied. The antimicrobial activity of the extracts was moderate and more pronounced against Gram-positive bacteria, as expected. Overall, the presented results confirm that ASE is a practical approach for obtaining phenolic-rich and bioactive sea fennel, with reduced solvent consumption and extraction time, which makes it a justified choice in their potential use in food, pharmaceutical or cosmetic industries. Although this study provides a systematic evaluation of ASE conditions, the optimisation was carried out using a relatively simple experimental approach, which may not fully capture all interactions between variables. In addition, biological activity was assessed only on selected extracts, which makes it harder to fully relate the phenolic composition to the observed bioactivity. Future work should therefore include a broader set of samples and a more detailed analysis of individual compounds and their contribution to the overall activity.

Author Contributions

Conceptualization, I.G.M.; methodology, P.B., S.R., D.S. and I.G.M.; software, S.R.; validation, P.B., S.R. and D.S.; formal analysis, P.B., S.R., D.S. and I.G.M.; investigation, P.B., S.R., D.S. and I.G.M.; resources, P.B., S.R., D.S. and I.G.M.; data curation, S.R., D.S. and I.G.M.; writing—original draft preparation, S.R., D.S. and I.G.M.; writing—review and editing, P.B., S.R., D.S. and I.G.M.; visualisation, S.R.; supervision, I.G.M.; project administration, S.R. and I.G.M.; funding acquisition, S.R. and I.G.M. All authors have read and agreed to the published version of the manuscript.

Funding

This research was funded by the project GREEN4MED (IP-UNIST-27) granted by the European Union—“NextGenerationEU”.

Data Availability Statement

The data presented in this study are available on request from the corresponding author.

Acknowledgments

The authors are also thankful for the scientific-research equipment financed via the EU grant “Functional integration of the University of Split, PMFST, PFST and KTFST through the development of the scientific and research infrastructure” (KK.01.1.1.02.0018).

Conflicts of Interest

The authors declare no conflicts of interest.

Abbreviations

The following abbreviations are used in this manuscript:
ASEAccelerated Solvent Extraction
PLEPressurised Liquid Extraction
HPLCHigh Performance Liquid Chromatography
TPCTotal Phenolic Content
GAEGallic Acid Equivalent
DPPH2,2-diphenyl-1-picrylhydrazyl
FRAPFerric Reducing Antioxidant Power
ORACOxygen Radical Absorbance Capacity
AAPH2,2′-azobis(2-amidino-propane) dihydrochloride
TETrolox Equivalent
MICMinimum Inhibitory Concentration
MBCMinimum Bactericidal Concentration
CFUColony-Forming Units
INTp-iodonitrotetrazolium chloride
CGAchlorogenic acid
nCGAneochlorogenic acid (3-O-caffeoylquinic acid)
cCGAcryptochlorogenic acid (4-O-caffeoylquinic acid)
UAEUltrasound-Assisted Extraction
MAEMicrowave-Assisted Extraction
GAgallic acid
SYRACsyringic acid
3HCAo-coumaric acid (3-hydroxycinnamic acid)
CNAcinammic acid
PCAprotocatechuic acid
PHBAp-hydroxybenzoic acid (4-hydroxybenzoic acid)
Rrutin
CAcaffeic acid

References

  1. Handa, S.S.; Khanuja, S.; Longo, G.; Rakesh, D.D. Extraction Technologies for Medicinal and Aromatic Plants; International Centre for Science and High Technology: Trieste, Italy, 2008. [Google Scholar]
  2. Picot-Allain, C.; Mahomoodally, M.F.; Ak, G.; Zengin, G. Conventional versus Green Extraction Techniques—A Comparative Perspective. Curr. Opin. Food Sci. 2021, 40, 144–156. [Google Scholar] [CrossRef] [Scilit]
  3. Mustafa, A.; Turner, C. Pressurized Liquid Extraction as a Green Approach in Food and Herbal Plants Extraction: A Review. Anal. Chim. Acta 2011, 703, 8–18. [Google Scholar] [CrossRef] [Scilit] [PubMed]
  4. Dobroslavić, E.; Elez Garofulić, I.; Šeparović, J.; Zorić, Z.; Pedisić, S.; Dragović-Uzelac, V. Pressurized Liquid Extraction as a Novel Technique for the Isolation of Laurus nobilis L. Leaf Polyphenols. Molecules 2022, 27, 5099. [Google Scholar] [CrossRef] [Scilit] [PubMed]
  5. Mottaleb, M.A.; Sarker, S.D. Accelerated Solvent Extraction for Natural Products Isolation. Methods Mol. Biol. 2012, 864, 75–87. [Google Scholar] [CrossRef] [Scilit]
  6. Osorio-Tobón, J.F. Recent Advances and Comparisons of Conventional and Alternative Extraction Techniques of Phenolic Compounds. J. Food Sci. Technol. 2020, 57, 4299–4315. [Google Scholar] [CrossRef] [Scilit]
  7. Alhallaf, W.; Bishop, K.; Perkins, L.B. Optimization of Accelerated Solvent Extraction of Phenolic Compounds from Chaga Using Response Surface Methodology. Food Anal. Methods 2022, 15, 2777–2790. [Google Scholar] [CrossRef] [Scilit]
  8. Gomes, S.V.F.; Portugal, L.A.; dos Anjos, J.P.; de Jesus, O.N.; de Oliveira, E.J.; David, J.P.; David, J.M. Accelerated Solvent Extraction of Phenolic Compounds Exploiting a Box-Behnken Design and Quantification of Five Flavonoids by HPLC-DAD in Passiflora Species. Microchem. J. 2017, 132, 28–35. [Google Scholar] [CrossRef] [Scilit]
  9. Repajić, M.; Cegledi, E.; Kruk, V.; Pedisić, S.; Çinar, F.; Kovačević, D.B.; Žutić, I.; Dragović-Uzelac, V. Accelerated Solvent Extraction as a Green Tool for the Recovery of Polyphenols and Pigments from wild Nettle Leaves. Processes 2020, 8, 803. [Google Scholar] [CrossRef] [Scilit]
  10. Rodríguez-Pérez, C.; Gilbert-López, B.; Mendiola, J.A.; Quirantes-Piné, R.; Segura-Carretero, A.; Ibáñez, E. Optimization of Microwave-assisted Extraction and Pressurized Liquid Extraction of Phenolic Compounds from Moringa oleifera Leaves by Multiresponse Surface Methodology. Electrophoresis 2016, 37, 1938–1946. [Google Scholar] [CrossRef] [Scilit]
  11. Hossain, M.B.; Barry-Ryan, C.; Martin-Diana, A.B.; Brunton, N.P. Optimisation of Accelerated Solvent Extraction of Antioxidant Compounds from Rosemary (Rosmarinus officinalis L.), Marjoram (Origanum majorana L.) and Oregano (Origanum vulgare L.) Using Response Surface Methodology. Food Chem. 2011, 126, 339–346. [Google Scholar] [CrossRef] [Scilit]
  12. Diemer, E.; Chadni, M.; Grimi, N.; Ioannou, I. Optimization of the Accelerated Solvent Extraction of Caffeoylquinic Acids from Forced Chicory Roots and Antioxidant Activity of the Resulting Extracts. Foods 2022, 11, 3214. [Google Scholar] [CrossRef] [Scilit] [PubMed]
  13. Lopes, M.; Sanches-Silva, A.; Castilho, M.; Cavaleiro, C.; Ramos, F. Halophytes as Source of Bioactive Phenolic Compounds and Their Potential Applications. Crit. Rev. Food Sci. Nutr. 2023, 63, 1078–1101. [Google Scholar] [CrossRef] [Scilit] [PubMed]
  14. Arya, S.S.; Devi, S.; Ram, K.; Kumar, S.; Kumar, N.; Mann, A.; Kumar, A.; Chand, G. Halophytes: The Plants of Therapeutic Medicine. In Ecophysiology, Abiotic Stress Responses and Utilization of Halophytes; Springer: Singapore, 2019; pp. 271–287. [Google Scholar]
  15. Maleš, Ž.; Žuntar, I.; Nigović, B.; Plazibat, M.; Vundać, V.B. Quantitative Analysis of the Polyphenols of the Aerial Parts of Rock Samphire—Crithmum maritimum L. Acta Pharm. 2003, 53, 139–144. [Google Scholar]
  16. Meot-Duros, L.; Magné, C. Antioxidant Activity and Phenol Content of Crithmum maritimum L. Leaves. Plant Physiol. Biochem. 2009, 47, 37–41. [Google Scholar] [CrossRef] [Scilit]
  17. Franke, W. Vitamin C in Sea Fennel (Crithmum maritimum), an Edible Wild Plant. Econ. Bot. 1982, 36, 163–165. [Google Scholar] [CrossRef] [Scilit]
  18. Renna, M. Reviewing the Prospects of Sea Fennel (Crithmum maritimum L.) as Emerging Vegetable Crop. Plants 2018, 7, 92. [Google Scholar] [CrossRef] [Scilit]
  19. Radman, S.; Brzović, P.; Radunić, M.; Rako, A.; Šarolić, M.; Ninčević Runjić, T.; Urlić, B.; Generalić Mekinić, I. Vinegar-Preserved Sea Fennel: Chemistry, Color, Texture, Aroma, and Taste. Foods 2023, 12, 3812. [Google Scholar] [CrossRef] [Scilit]
  20. Renna, M.; Gonnella, M.; Caretto, S.; Mita, G.; Serio, F. Sea Fennel (Crithmum maritimum L.): From Underutilized Crop to New Dried Product for Food Use. Genet. Resour. Crop Evol. 2017, 64, 205–216. [Google Scholar] [CrossRef] [Scilit]
  21. Renna, M.; Gonnella, M. The Use of the Sea Fennel as a New Spice-Colorant in Culinary Preparations. Int. J. Gastron. Food Sci. 2012, 1, 111–115. [Google Scholar] [CrossRef] [Scilit]
  22. Radman, S.; Mastelić, L.; Ljubenkov, I.; Lazarevski, S.; Politeo, O.; Podrug, R.; Prga, I.; Čorić, I.; Popović, M.; Bratinčević, M.V.; et al. Sea Fennel (Crithmum maritimum L.) Flowers as an Emerging Source of Bioactive Compounds. Pol. J. Food Nutr. Sci. 2024, 74, 221–231. [Google Scholar] [CrossRef] [Scilit]
  23. Nartea, A.; Orhotohwo, O.L.; Fanesi, B.; Lucci, P.; Loizzo, M.R.; Tundis, R.; Aquilanti, L.; Casavecchia, S.; Quattrini, G.; Pacetti, D. Sea Fennel (Crithmum maritimum L.) Leaves and Flowers: Bioactive Compounds, Antioxidant Activity and Hypoglycaemic Potential. Food Biosci. 2023, 56, 103417. [Google Scholar] [CrossRef] [Scilit]
  24. Generalić Mekinić, I.; Šimat, V.; Ljubenkov, I.; Burčul, F.; Grga, M.; Mihajlovski, M.; Lončar, R.; Katalinić, V.; Skroza, D. Influence of the Vegetation Period on Sea Fennel, Crithmum maritimum L. (Apiaceae), Phenolic Composition, Antioxidant and Anticholinesterase Activities. Ind. Crop. Prod. 2018, 124, 947–953. [Google Scholar] [CrossRef] [Scilit]
  25. Kraouia, M.; Nartea, A.; Maoloni, A.; Osimani, A.; Garofalo, C.; Fanesi, B.; Ismaiel, L.; Aquilanti, L.; Pacetti, D. Sea Fennel (Crithmum maritimum L.) as an Emerging Crop for the Manufacturing of Innovative Foods and Nutraceuticals. Molecules 2023, 28, 4741. [Google Scholar] [CrossRef] [Scilit] [PubMed]
  26. Houta, O.; Akrout, A.; Neffati, M.; Amri, H. Phenolic Contents, Antioxidant and Antimicrobial Potentials of Crithmum maritimum Cultivated in Tunisia Arid Zones. J. Biol. Act. Prod. Nat. 2011, 1, 138–143. [Google Scholar] [CrossRef] [Scilit]
  27. Martins-Noguerol, R.; Pérez-Ramos, I.M.; Matías, L.; Moreira, X.; Francisco, M.; García-González, A.; Troncoso-Ponce, A.M.; Thomasset, B.; Martínez-Force, E.; Moreno-Pérez, A.J.; et al. Crithmum maritimum Seeds, a Potential Source for High-Quality Oil and Phenolic Compounds in Soils with No Agronomical Relevance. J. Food Compos. Anal. 2022, 108, 104413. [Google Scholar] [CrossRef] [Scilit]
  28. Generalić Mekinić, I.; Blažević, I.; Mudnić, I.; Burčul, F.; Grga, M.; Skroza, D.; Jerčić, I.; Ljubenkov, I.; Boban, M.; Miloš, M.; et al. Sea Fennel (Crithmum maritimum L.): Phytochemical Profile, Antioxidative, Cholinesterase Inhibitory and Vasodilatory Activity. J. Food Sci. Technol. 2016, 53, 3104–3112. [Google Scholar] [CrossRef] [Scilit]
  29. Veršić Bratinčević, M.; Kovačić, R.; Popović, M.; Radman, S.; Generalić Mekinić, I. Comparison of Conventional and Green Extraction Techniques for the Isolation of Phenolic Antioxidants from Sea Fennel. Processes 2023, 11, 2172. [Google Scholar] [CrossRef] [Scilit]
  30. Maoloni, A.; Pirker, T.; Pferschy-Wenzig, E.M.; Aquilanti, L.; Bauer, R. Characterization of Potentially Health-Promoting Constituents in Sea Fennel (Crithmum maritimum) Cultivated in the Conero Natural Park (Marche Region, Central Italy). Pharm. Biol. 2023, 61, 1030–1040. [Google Scholar] [CrossRef] [Scilit]
  31. Cristina, C.; Lucia, P.; Sara, S.; Francesco, S.; Nobile Matteo Alessandro, D.; Amalia, C. Study of the Efficacy of Two Extraction Techniques from Crithmum maritimum and Salicornia europaea. J. Food Nutr. Res. 2018, 6, 456–463. [Google Scholar] [CrossRef] [Scilit]
  32. Ashim, A.; Ismaiel, L.; Fanesi, B.; Nartea, A.; Maoloni, A.; Orhotohwo, O.L.; Darko, H.S.O.; Lucci, P.; Aquilanti, L.; Pacetti, D.; et al. Food-Grade Polar Extracts from Sea Fennel (Crithmum maritimum L.) By-Products: Unlocking Potential for the Food Industry. Foods 2025, 14, 2304. [Google Scholar] [CrossRef] [Scilit]
  33. Amerine, M.A.; Ough, C.S. Methods Analysis of Musts and Wines, 2nd ed.; Wiley: New York, NY, USA, 1980. [Google Scholar]
  34. Katalinić, V.; Možina, S.S.; Skroza, D.; Generalić, I.; Abramovič, H.; Miloš, M.; Ljubenkov, I.; Piskernik, S.; Pezo, I.; Terpinc, P.; et al. Polyphenolic Profile, Antioxidant Properties and Antimicrobial Activity of Grape Skin Extracts of 14 Vitis vinifera Varieties Grown in Dalmatia (Croatia). Food Chem. 2010, 119, 715–723. [Google Scholar] [CrossRef] [Scilit]
  35. Benzie, I.F.F.; Strain, J.J. The Ferric Reducing Ability of Plasma (FRAP) as a Measure of “Antioxidant Power”: The FRAP Assay. Anal. Biochem. 1996, 239, 70–76. [Google Scholar] [CrossRef] [Scilit]
  36. Čagalj, M.; Skroza, D.; Razola-Díaz, M.D.C.; Verardo, V.; Bassi, D.; Frleta, R.; Mekinić, I.G.; Tabanelli, G.; Šimat, V. Variations in the Composition, Antioxidant and Antimicrobial Activities of Cystoseira compressa During Seasonal Growth. Mar. Drugs 2022, 20, 64. [Google Scholar] [CrossRef] [Scilit]
  37. Skroza, D.; Šimat, V.; Smole Možina, S.; Katalinić, V.; Boban, N.; Generalić Mekinić, I. Interactions of Resveratrol with Other Phenolics and Activity against Food-Borne Pathogens. Food Sci. Nutr. 2019, 7, 2312–2318. [Google Scholar] [CrossRef] [Scilit]
  38. Pena-Pereira, F.; Wojnowski, W.; Tobiszewski, M. AGREE—Analytical GREEnness Metric Approach and Software. Anal. Chem. 2020, 92, 10076–10082. [Google Scholar] [CrossRef] [Scilit] [PubMed]
  39. Pena-Pereira, F.; Tobiszewski, M.; Wojnowski, W.; Psillakis, E. Corrigendum to: A Tutorial on AGREEprep an Analytical Greenness Metric for Sample Preparation. Adv. Sample Prep. 2022, 4, 100045. [Google Scholar] [CrossRef] [Scilit]
  40. Jeon, H.J.; Lee, B.S.; Park, C. Extraction of Chlorogenic Acid Using Single and Mixed Solvents. Molecules 2025, 30, 481. [Google Scholar] [CrossRef] [Scilit]
  41. Wianowska, D.; Gil, M. Critical Approach to PLE Technique Application in the Analysis of Secondary Metabolites in Plants. TrAC Trends Anal. Chem. 2019, 114, 314–325. [Google Scholar] [CrossRef] [Scilit]
  42. Frosi, I.; Montagna, I.; Colombo, R.; Milanese, C.; Papetti, A. Recovery of Chlorogenic Acids from Agri-Food Wastes: Updates on Green Extraction Techniques. Molecules 2021, 26, 4515. [Google Scholar] [CrossRef] [Scilit]
  43. Pereira, C.G.; Barreira, L.; da Rosa Neng, N.; Nogueira, J.M.F.; Marques, C.; Santos, T.F.; Varela, J.; Custódio, L. Searching for New Sources of Innovative Products for the Food Industry within Halophyte Aromatic Plants: In Vitro Antioxidant Activity and Phenolic and Mineral Contents of Infusions and Decoctions of Crithmum maritimum L. Food Chem. Toxicol. 2017, 107, 581–589. [Google Scholar] [CrossRef] [Scilit]
  44. Pedreiro, S.; Figueirinha, A.; Cavaleiro, C.; Cardoso, O.; Donato, M.M.; Salgueiro, L.; Ramos, F. Exploiting the Crithmum maritimum L. Aqueous Extracts and Essential Oil as Potential Preservatives in Food, Feed, Pharmaceutical and Cosmetic Industries. Antioxidants 2023, 12, 252. [Google Scholar] [CrossRef] [Scilit]
  45. Generalić Mekinić, I.; Politeo, O.; Ljubenkov, I.; Mastelić, L.; Popović, M.; Veršić Bratinčević, M.; Šimat, V.; Radman, S.; Skroza, D.; Ninčević Runjić, T.; et al. The Alphabet of Sea Fennel: Comprehensive Phytochemical Characterisation of Croatian Populations of Crithmum maritimum L. Food Chem. X 2024, 22, 101386. [Google Scholar] [CrossRef] [Scilit] [PubMed]
  46. Cheng, Y.; Qu, S.; Wang, Z.; Xue, F.; Li, F. Controlled Extraction of Flavonoids From Radix scutellariae by Subcritical Water. Clean 2016, 44, 299–303. [Google Scholar] [CrossRef] [Scilit]
  47. Liazid, A.; Palma, M.; Brigui, J.; Barroso, C.G. Investigation on Phenolic Compounds Stability during Microwave-Assisted Extraction. J. Chromatogr. A 2007, 1140, 29–34. [Google Scholar] [CrossRef] [Scilit] [PubMed]
  48. Volf, I.; Ignat, I.; Neamtu, M.; Popa, V.I. Thermal Stability, Antioxidant Activity, and Photo-Oxidation of Natural Polyphenols. Chem. Pap. 2014, 68, 121–129. [Google Scholar] [CrossRef] [Scilit]
  49. Kaczorová, D.; Karalija, E.; Dahija, S.; Bešta-Gajević, R.; Parić, A.; Ćavar Zeljković, S. Influence of Extraction Solvent on the Phenolic Profile and Bioactivity of Two Achillea Species. Molecules 2021, 26, 1601. [Google Scholar] [CrossRef] [Scilit]
  50. Galanakis, C.M.; Goulas, V.; Tsakona, S.; Manganaris, G.A.; Gekas, V. A Knowledge Base for The Recovery of Natural Phenols with Different Solvents. Int. J. Food Prop. 2013, 16, 382–396. [Google Scholar] [CrossRef] [Scilit]
  51. Waszkowiak, K.; Gliszczyńska-Świgło, A. Binary Ethanol–Water Solvents Affect Phenolic Profile and Antioxidant Capacity of Flaxseed Extracts. Eur. Food Res. Technol. 2016, 242, 777–786. [Google Scholar] [CrossRef] [Scilit]
  52. Chadni, M.; Isidore, E.; Diemer, E.; Ouguir, O.; Brunois, F.; Catteau, R.; Cassan, L.; Ioannou, I. Optimization of Extraction Conditions to Improve Chlorogenic Acid Content and Antioxidant Activity of Extracts from Forced Witloof Chicory Roots. Foods 2022, 11, 1217. [Google Scholar] [CrossRef] [Scilit]
  53. Skroza, D.; Šimat, V.; Vrdoljak, L.; Jolić, N.; Skelin, A.; Čagalj, M.; Frleta, R.; Generalić Mekinić, I. Investigation of Antioxidant Synergisms and Antagonisms among Phenolic Acids in the Model Matrices Using FRAP and ORAC Methods. Antioxidants 2022, 11, 1784. [Google Scholar] [CrossRef] [Scilit]
  54. Spiegel, M.; Kapusta, K.; Kołodziejczyk, W.; Saloni, J.; Żbikowska, B.; Hill, G.A.; Sroka, Z. Antioxidant Activity of Selected Phenolic Acids–Ferric Reducing Antioxidant Power Assay and QSAR Analysis of the Structural Features. Molecules 2020, 25, 3088. [Google Scholar] [CrossRef] [Scilit]
  55. Apak, R.; Özyürek, M.; Güçlü, K.; Çapanoğlu, E. Antioxidant Activity/Capacity Measurement. 1. Classification, Physicochemical Principles, Mechanisms, and Electron Transfer (ET)-Based Assays. J. Agric. Food Chem. 2016, 64, 997–1027. [Google Scholar] [CrossRef] [Scilit]
  56. Xu, J.G.; Hu, Q.P.; Liu, Y. Antioxidant and DNA-Protective Activities of Chlorogenic Acid Isomers. J. Agric. Food Chem. 2012, 60, 11625–11630. [Google Scholar] [CrossRef] [Scilit]
  57. Jallali, I.; Zaouali, Y.; Missaoui, I.; Smeoui, A.; Abdelly, C.; Ksouri, R. Variability of Antioxidant and Antibacterial Effects of Essential Oils and Acetonic Extracts of Two Edible Halophytes: Crithmum maritimum L. and Inula crithmoides L. Food Chem. 2014, 145, 1031–1038. [Google Scholar] [CrossRef] [Scilit] [PubMed]
  58. Correia, I.; Antunes, M.; Tecelão, C.; Neves, M.; Pires, C.L.; Cruz, P.F.; Rodrigues, M.; Peralta, C.C.; Pereira, C.D.; Reboredo, F.; et al. Nutritive Value and Bioactivities of a Halophyte Edible Plant: Crithmum maritimum L. (Sea Fennel). Plants 2024, 13, 427. [Google Scholar] [CrossRef] [Scilit]
  59. Liang, N.; Kitts, D.D. Role of Chlorogenic Acids in Controlling Oxidative and Inflammatory Stress Conditions. Nutrients 2015, 8, 16. [Google Scholar] [CrossRef] [Scilit]
  60. Sato, Y.; Itagaki, S.; Kurokawa, T.; Ogura, J.; Kobayashi, M.; Hirano, T.; Sugawara, M.; Iseki, K. In Vitro and in Vivo Antioxidant Properties of Chlorogenic Acid and Caffeic Acid. Int. J. Pharm. 2011, 403, 136–138. [Google Scholar] [CrossRef] [Scilit]
  61. Saqib, M.; Iqbal, S.; Mahmood, A.; Akram, R. Theoretical Investigation for Exploring the Antioxidant Potential of Chlorogenic Acid: A Density Functional Theory Study. Int. J. Food Prop. 2016, 19, 745–751. [Google Scholar] [CrossRef] [Scilit]
  62. Ruberto, G.; Baratta, M.T.; Deans, S.G.; Dorman, H.J.D. Antioxidant and Antimicrobial Activity of Foeniculum vulgare and Crithmum maritimum Essential Oils. Planta Med. 2000, 66, 687–693. [Google Scholar] [CrossRef] [Scilit]
  63. Meot-Duros, L.; Le Floch, G.; Magné, C. Radical Scavenging, Antioxidant and Antimicrobial Activities of Halophytic Species. J. Ethnopharmacol. 2008, 116, 258–262. [Google Scholar] [CrossRef] [Scilit] [PubMed]
  64. Orhotohwo, O.L.; Nartea, A.; Lucci, P.; Jaiswal, A.K.; Jaiswal, S.; Pacetti, D. Application of Sea Fennel’s Bioactive Compounds in the Development of Edible Films and Coatings: A Review. Food Biosci. 2024, 61, 104843. [Google Scholar] [CrossRef] [Scilit]
  65. Souid, A.; Della Croce, C.M.; Frassinetti, S.; Gabriele, M.; Pozzo, L.; Ciardi, M.; Abdelly, C.; Hamed, K.B.; Magné, C.; Longo, V. Nutraceutical Potential of Leaf Hydro-Ethanolic Extract of the Edible Halophyte Crithmum maritimum L. Molecules 2021, 26, 5380. [Google Scholar] [CrossRef] [Scilit] [PubMed]
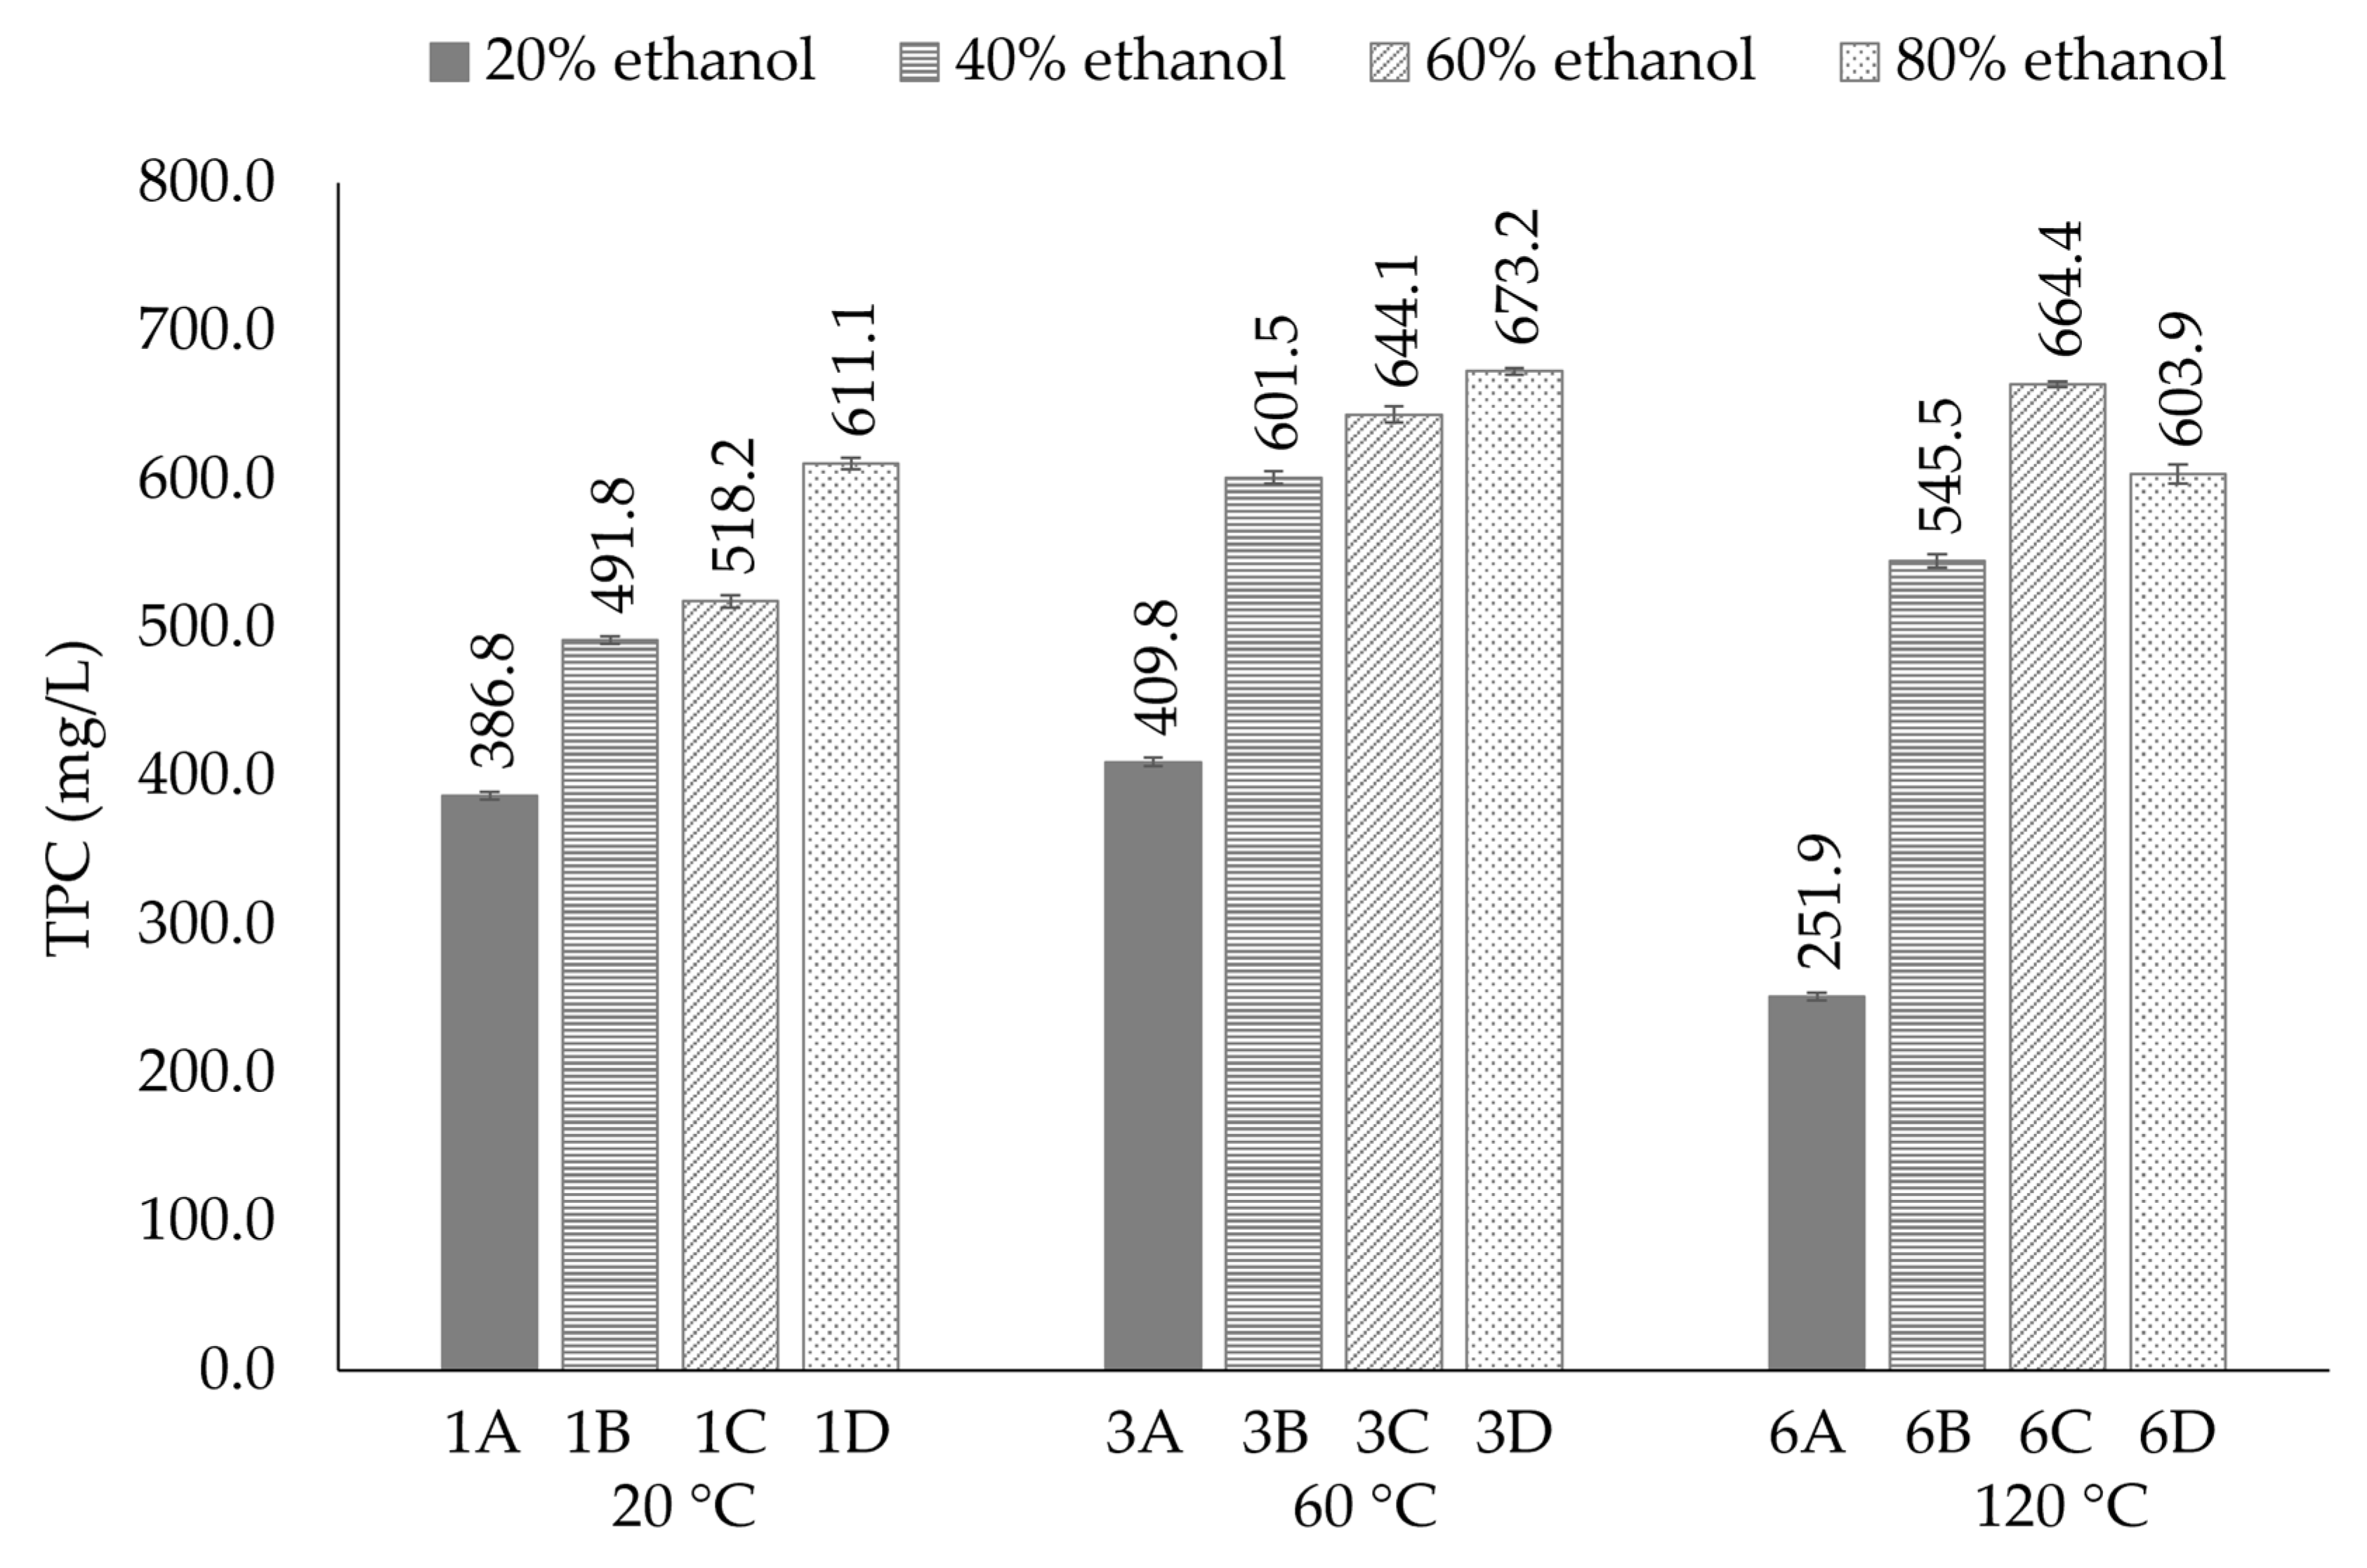
Figure 1. Graphical representation of the results for total phenolics (TPC) in sea fennel extracts obtained by accelerated solvent extraction at different extraction conditions (temperature and ethanol content). Results are expressed in mg/g of dry extract.
Processes 14 01459 g001
Figure 2. Response surface showing the combined effect of extraction temperature and ethanol concentration on total phenolic content.
Processes 14 01459 g002
Figure 3. Results of the AGREE analysis for the extraction method performed. The background colour of each segment reflects the relative score assigned to each criterion, with green indicating higher scores, yellow moderate, orange lower, and red the lowest scores (not observed in this case).
Processes 14 01459 g003
Table 1. Accelerated solvent extraction conditions and sample codes. Sample codes represent specific combinations of extraction temperature and ethanol concentration, where numbers indicate temperature levels and letters denote ethanol content.
Ethanol Content (%) in
Hydroalcoholic Mixture
Extraction Temperature (°C)
20406080100120
201A2A3A4A5A6A
401B2B3B4B5B6B
601C2C3C4C5C6C
801D2D3D4D5D6D
Table 2. Concentrations (mg/g) of individual phenolics in sea fennel extracts with the highest yield of phenolics obtained by Accelerated Solvent Extraction.
CompoundConcentration (mg/g of Dry Weight) ± SD 1
3A
(60 °C,
20% Ethanol)
3B
(60 °C,
40% Ethanol)
6C
(120 °C,
60% Ethanol)
3D
(60 °C,
80% Ethanol)
nCGA0.70 ± 0.000.66 ± 0.000.61 ± 0.000.70 ± 0.00
CGA26.53 ± 0.0224.37 ± 0.0220.80 ± 0.0229.25 ± 0.06
cCGA1.78 ± 0.011.62 ± 0.002.23 ± 0.013.60 ± 0.09
RA0.23 ± 0.02nd0.56 ± 0.060.25 ± 0.01
GA0.26 ± 0.010.27 ± 0.010.28 ± 0.010.27 ± 0.00
SYRAC0.96 ± 0.000.87 ± 0.011.26 ± 0.011.49 ± 0.00
3HCA0.21 ± 0.001.31 ± 0.000.18 ± 0.000.17 ± 0.05
CNA0.26 ± 0.010.21 ± 0.000.23 ± 0.000.25 ± 0.00
PCA0.16 ± 0.000.21 ± 0.000.19 ± 0.010.17 ± 0.00
PHBA0.13 ± 0.000.13 ± 0.000.13 ± 0.000.13 ± 0.00
R1.75 ± 0.151.78 ± 0.141.40 ± 0.172.27 ± 0.13
CA0.19 ± 0.010.18 ± 0.000.25 ± 0.020.19 ± 0.01
1 SD—standard deviation, nCGA—neochlorogenic acid; CGA—chlorogenic acid; cCGA—cryptochlorogenic acid; GA—gallic acid; SYRAC—syringic acid; 3HCA—o-coumaric acid; CNA—cinammic acid; PCA—protocatechuic acid; PHBA—p-hydroxybenzoic acid; R—rutin; CA—caffeic acid, nd- not detected.
Table 3. Antioxidant capacity of selected sea fennel extracts. Values are expressed as mean ± standard deviation. Different superscript letters (a–c) within the same column indicate statistically significant differences between samples (p < 0.05), determined by one-way ANOVA followed by Games–Howell post hoc test when appropriate.
Sample
(Extraction Conditions)
DPPH
(mM TE/g)
FRAP
(mM TE/g)
ORAC
(mM TE/g)
3A (60 °C, 20% ethanol)0.25 ± 0.03 c1.19 ± 0.02 c3.84 ± 0.26 b
3B (60 °C, 40% ethanol)0.06 ± 0.01 b2.01 ± 0.02 b5.19 ± 0.51 a
6C (120 °C, 60% ethanol)0.39 ± 0.03 b2.17 ± 0.04 a5.03 ± 0.25 a
3D (60 °C, 80% ethanol)0.51 ± 0.02 a2.18 ± 0.04 a4.36 ± 0.19 ab
Table 4. Antimicrobial activity (MIC/MBC; mg/mL) of sea fennel extracts obtained by Accelerated Solvent Extraction at different extraction conditions.
SampleE. faecalisB. cereusL. monocytogenesE. coliP. aeruginosa
3A (60 °C, 20% ethanol)nd/ndnd/nd1.25/2.5nd/nd2.5/nd
3B (60 °C, 40% ethanol)nd/nd1.25/2.51.25/2.52.5/nd1.25/2.5
6C (120 °C, 60% ethanol)1.25/1.251.25/2.50.62/0.622.5/nd1.25/2.5
3D (60 °C, 80% ethanol)1.25/1.252.5/2.50.62/0.62nd/nd1.25/2.5
nd—not detected.
Disclaimer/Publisher’s Note: The statements, opinions and data contained in all publications are solely those of the individual author(s) and contributor(s) and not of MDPI and/or the editor(s). MDPI and/or the editor(s) disclaim responsibility for any injury to people or property resulting from any ideas, methods, instructions or products referred to in the content.