Article

Modelling Oxygen Transport, Microcarrier Aggregation, and Hydrodynamic Constraints in Stirred Bioreactors for Scalable Developmental Engineering

Department of Chemical Engineering, Loughborough University, Leicestershire LE11 3TU, UK
*
Author to whom correspondence should be addressed.
Processes 2026, 14(8), 1219; https://doi.org/10.3390/pr14081219
Submission received: 20 March 2026 / Revised: 5 April 2026 / Accepted: 8 April 2026 / Published: 10 April 2026
(This article belongs to the Section Biological Processes and Systems)

Abstract

Developmental engineering (DE) is a bottom-up strategy for generating functional tissues from modular tissues (MTs), offering potential advantages over conventional top-down approaches. However, scalable MT production remains constrained by limited understanding of scaffold aggregation, oxygen transport, and hydrodynamic effects in bioreactors. This study integrates theoretical simulations with empirical correlations to analyze these factors and provide a systematic basis for MT production. Microcarrier aggregates were modelled to evaluate minimum oxygen concentration (Cmin). Results indicate that larger microcarrier diameters (dmc) are associated with increased Cmin due to longer diffusion distances. Aggregate geometry and packing configuration, including hexagonal close packing and the “kissing number,” influenced oxygen distribution and may explain observed Cmin plateaus. Hydrodynamic behaviour was assessed using the Zwietering correlation and Kolmogorov turbulence scaling. Denser microcarrier aggregates required higher minimum stirring speeds (Nmin), while larger dmc increased susceptibility to shear. Increased agitation intensity and more aggressive impeller designs reduced Nmin but were associated with potential cell damages. Higher medium density (e.g., 20% FBS) reduced shear stress and energy dissipation. A unified framework integrating oxygen diffusion, aggregate geometry, microcarrier properties, and hydrodynamics is proposed to estimate oxygen limitation and cell damage, highlighting trade-offs relevant to MT production in DE.

1. Introduction

Developmental engineering (DE) has emerged as a promising bottom-up scheme for generating functional tissues through the progressive assembly of modular tissues (MTs) [1,2]. In this approach, MTs are formed by culturing multiple cell types on microscale three-dimensional (3D) modular scaffolds (MSs), which are subsequently assembled in a controlled, layer-by-layer manner [3]. In contrast to conventional top-down tissue engineering approaches that rely on pre-fabricated macroscopic scaffolds, DE offers a potentially scalable route to tissue fabrication by mitigating mass transport limitations—particularly oxygen diffusion—that constrain tissue size, viability, and functional maturation [4].
Despite its conceptual advantages, the practical implementation of DE at larger scales remains challenging, primarily due to the lack of robust and reproducible bioprocesses for generating MTs in sufficient quantities. While suitable microscale MSs can be fabricated using established biomaterials processing techniques [5,6], the culture of cells on these scaffolds to produce MTs with consistent size, morphology, and cellular functionality remains a key limitation. Variability in MT characteristics under bioreactor conditions poses a significant bottleneck, potentially affecting downstream assembly and overall tissue performance. Addressing these challenges is therefore essential for advancing DE towards practical applications in regenerative medicine and cell-based therapies.
Microcarriers—typically spherical beads with diameters below 500 μm—are widely used as microscale substrates for the expansion of adherent mammalian cells [7]. By providing a high surface-area-to-volume ratio, they enable high-density cultures in wave and stirred-tank bioreactors and are integral to many industrial bioprocesses [8,9]. As a result, microcarrier-based technologies have become a cornerstone of the biopharmaceutical industry, supported by advances in cell culture systems and increasing demand for cell-based products [10,11].
Given the similarities between microcarriers and MSs used in DE, particularly in terms of size, and compatibility with adherent cell culture, microcarrier-based systems offer a relevant framework for MT production. However, a major challenge in these systems is microcarrier aggregation during culture. In conventional bioprocessing, aggregation is generally considered undesirable because it can lead to heterogeneities in mass transport and culture conditions [12,13]. Increased diffusion distances within aggregates can limit the transport of oxygen and nutrients, resulting in spatial gradients that negatively affect cell proliferation, differentiation, and viability. Oxygen transport is especially critical, as diffusion distances exceeding approximately 200 μm are associated with hypoxic conditions that can alter cellular behaviour [14,15]. Since individual microcarriers typically range from 80 to 250 μm in diameter, aggregation might produce structures that exceed this threshold, potentially leading to hypoxic regions and reduced cell viability [16].
In the context of DE, however, controlled aggregation of MS-supported MTs may offer potential advantages. Aggregated MTs with defined sizes and morphologies could serve as intermediate building blocks for hierarchical tissue assembly, while retaining aspects of modularity. Nevertheless, the relationship between aggregate structure and functional outcomes remains insufficiently understood. In particular, there is a lack of quantitative insight into how aggregate geometry, packing configuration, and hydrodynamic conditions influence oxygen transport and, consequently, MT viability and performance.
Although strategies such as optimising seeding conditions, microcarrier concentration, and agitation parameters have been explored to limit excessive aggregation in conventional systems [12], their application to MT production in DE remains unclear. Previous studies have shown that impeller design and agitation speed can influence aggregate size and cell distribution [17], yet quantitative links between aggregate morphology and oxygen availability within MT aggregates are still not established [18].
This study seeks to address these limitations by systematically examining the effects of microcarrier aggregation on oxygen transport and cell culture performance. A computational modelling framework was employed to simulate microcarrier cluster formation and to evaluate the influence of aggregate geometry on the minimum oxygen concentration (Cmin). The analysis considered factors such as microcarrier size, packing configuration, and aggregate morphology, alongside hydrodynamic parameters including agitation conditions, impeller design, material properties, and medium characteristics.
By integrating oxygen transport modelling with hydrodynamic considerations, this work aims to provide a more quantitative understanding of how aggregation influences mass transport and cellular outcomes in microcarrier-based cultures. Rather than viewing aggregation solely as a limitation, this study explores its potential role as a controllable parameter within defined boundaries. These findings are intended to inform the rational design and optimization of bioprocesses for MT production, thereby contributing to the development of suitable strategies for DE-based tissue fabrication.

2. Methodology

2.1. Modeling Oxygen Diffusion in 3D Tissue Constructs

To simulate oxygen diffusion through the cells cultured on individual or aggregated microcarriers, the parameters used for different cell types, microcarriers, and media are listed in Appendix A. The thickness of each cell was assumed to be 10 mm (t = 10 µm) based on 2D cell culture experimentations. The cell culture media were treated as Newtonian fluids according to the properties of these media used for mammalian cell cultures, and the microcarriers were assumed to be non-porous, perfectly spherical particles, which are commonly used for cell cultures [7,8,9]. Microcarrier oxygen permeability is usually negligible for most of the microcarriers used; thus, each simulation evaluated the most demanding diffusion pathway, defined as transport occurring entirely through oxygen-consuming cells or tissues [10,11]. McMurtrey developed a diffusion model to describe nutrient concentration within tissue constructs [19]. Based on a modified form of Fick’s second law (Equation (1)), analytical solutions are derived for both steady-state and transient diffusion in 3D constructs. Oxygen concentration (C) was modelled as a function of tissue thickness (t), diffusion coefficient (D), the cellular oxygen consumption rate (φ), and the overall tissue thickness (T). The term φ (Equation (2)) is defined as the product of the single-cell oxygen consumption rate (sOCR) and the cell density within the tissue constructs (ρcells).
C t = φ D × 2 C T 2
φ = s O C R × ρ c e l l s
Equation (3) represents the solution reported by McMurtrey for oxygen diffusion from the surface to the centre of a spherical tissue construct under quasi-steady-state conditions, where C(r) is the Oxygen concentration, r is the depth of the tissue, R is the maximum depth or thickness of the tissue, C0 the oxygen concentration at the deepest point of the tissue (R). A one-dimensional (1D) diffusion model was considered sufficient, as multiple studies have demonstrated its accuracy for describing oxygen transport in bioprocesses [20,21,22].
C ( r ) = φ 6 D × ( r 2 R 2 ) + C 0
The model simulated the stationary phase of cell growth, as this phase contains the highest cell numbers and therefore the greatest likelihood of microcarrier aggregation [23]. During this phase, both the number of viable cells and the cell density were assumed to remain constant, with ρcell = 1.00 × 10¹² cells/m3 [24,25]. By assuming that all oxygen is consumed at the deepest point of the tissue (C0 = 0), C0 represents the minimum oxygen concentration required to sustain all cells within a tissue of maximum depth R. The potential effects of hyperoxia [26,27] were not considered in this model, which is the ideal scenario simulated. A full derivation of Equation (3) is provided in Appendix B.

2.2. Geometric Modelling of Microcarrier Aggregation and Diffusion Distance Estimation

Equation (3) shows that oxygen concentration is dependent on R, which was hypothesised to be determined by the morphology and size of aggregated microcarriers during cell cultures. To estimate R, the model represented aggregated microcarriers in a 3D space. Assuming identical spherical microcarriers are simulated, the centre-to-centre distance between two tangential microcarriers is equal to the diameter of a single microcarrier (dmc). This distance is also referred to as the Euclidean distance (E) and is calculated from the coordinates of the centres of any two spheres, i and j, as defined in Equation (4).
E = d m c = ( x i x j ) 2 + ( y i y j ) 2 + ( z i z j ) 2
In this framework, R is defined as the distance from the centroid of an aggregate, composed of n microcarriers, to the surrounding culture medium. The centroid ( x ¯ ,   y ¯ ,   z ¯ ), representing the geometric centre of the aggregate, corresponds to the location furthest from the oxygen source in the surrounding medium in all directions. Accordingly, for an aggregate consisting of n microcarriers with radius ( r m c ), R was calculated using Equation (5), assuming that cells form a confluent monolayer on the surface of each microcarrier.
I f   E 0   a n d   min 1 i n { E } > r m c   w h e r e   j = c e n t r o i d   c o o r d i n a t e s   a n d i = a l l   m i c r o c a r r i e r   c o o r d i n a t e s , R min 1 i n { | max 1 i n x i x ¯ | , | min 1 i n x i x ¯ | , | max 1 i n y i y ¯ | , | min 1 i n y i y ¯ | , | max 1 i n z i z ¯ | , | min 1 i n z i z ¯ | } + r m c + t c e l l
This equation is only applicable when the centroid lies outside all microcarriers ( min 1 i n { E } > r m c ) , as cells cannot grow within the microcarriers under the non-porous microcarrier assumption. If the centroid lies within a microcarrier ( min 1 i n { E } < r m c ) , the model relocates it to the nearest point on the microcarrier surface using a normalised vector (Equation (6)). The resulting surface coordinates are then substituted for the centroid coordinates in Equation (5) to calculate the updated value of R.
I f   E 0   a n d   min 1 i n { E } < r m c   w h e r e   j = c e n t r o i d   c o o r d i n a t e s   a n d i = a l l   m i c r o c a r r i e r   c o o r d i n a t e s , x s u r f = ( x ¯ min 1 i n { E } × r m c ) + r m c ,   y s u r f = ( y ¯ min 1 i n { E } × r m c ) + r m c ,   z s u r f = ( z ¯ min 1 i n { E } × r m c ) + r m c
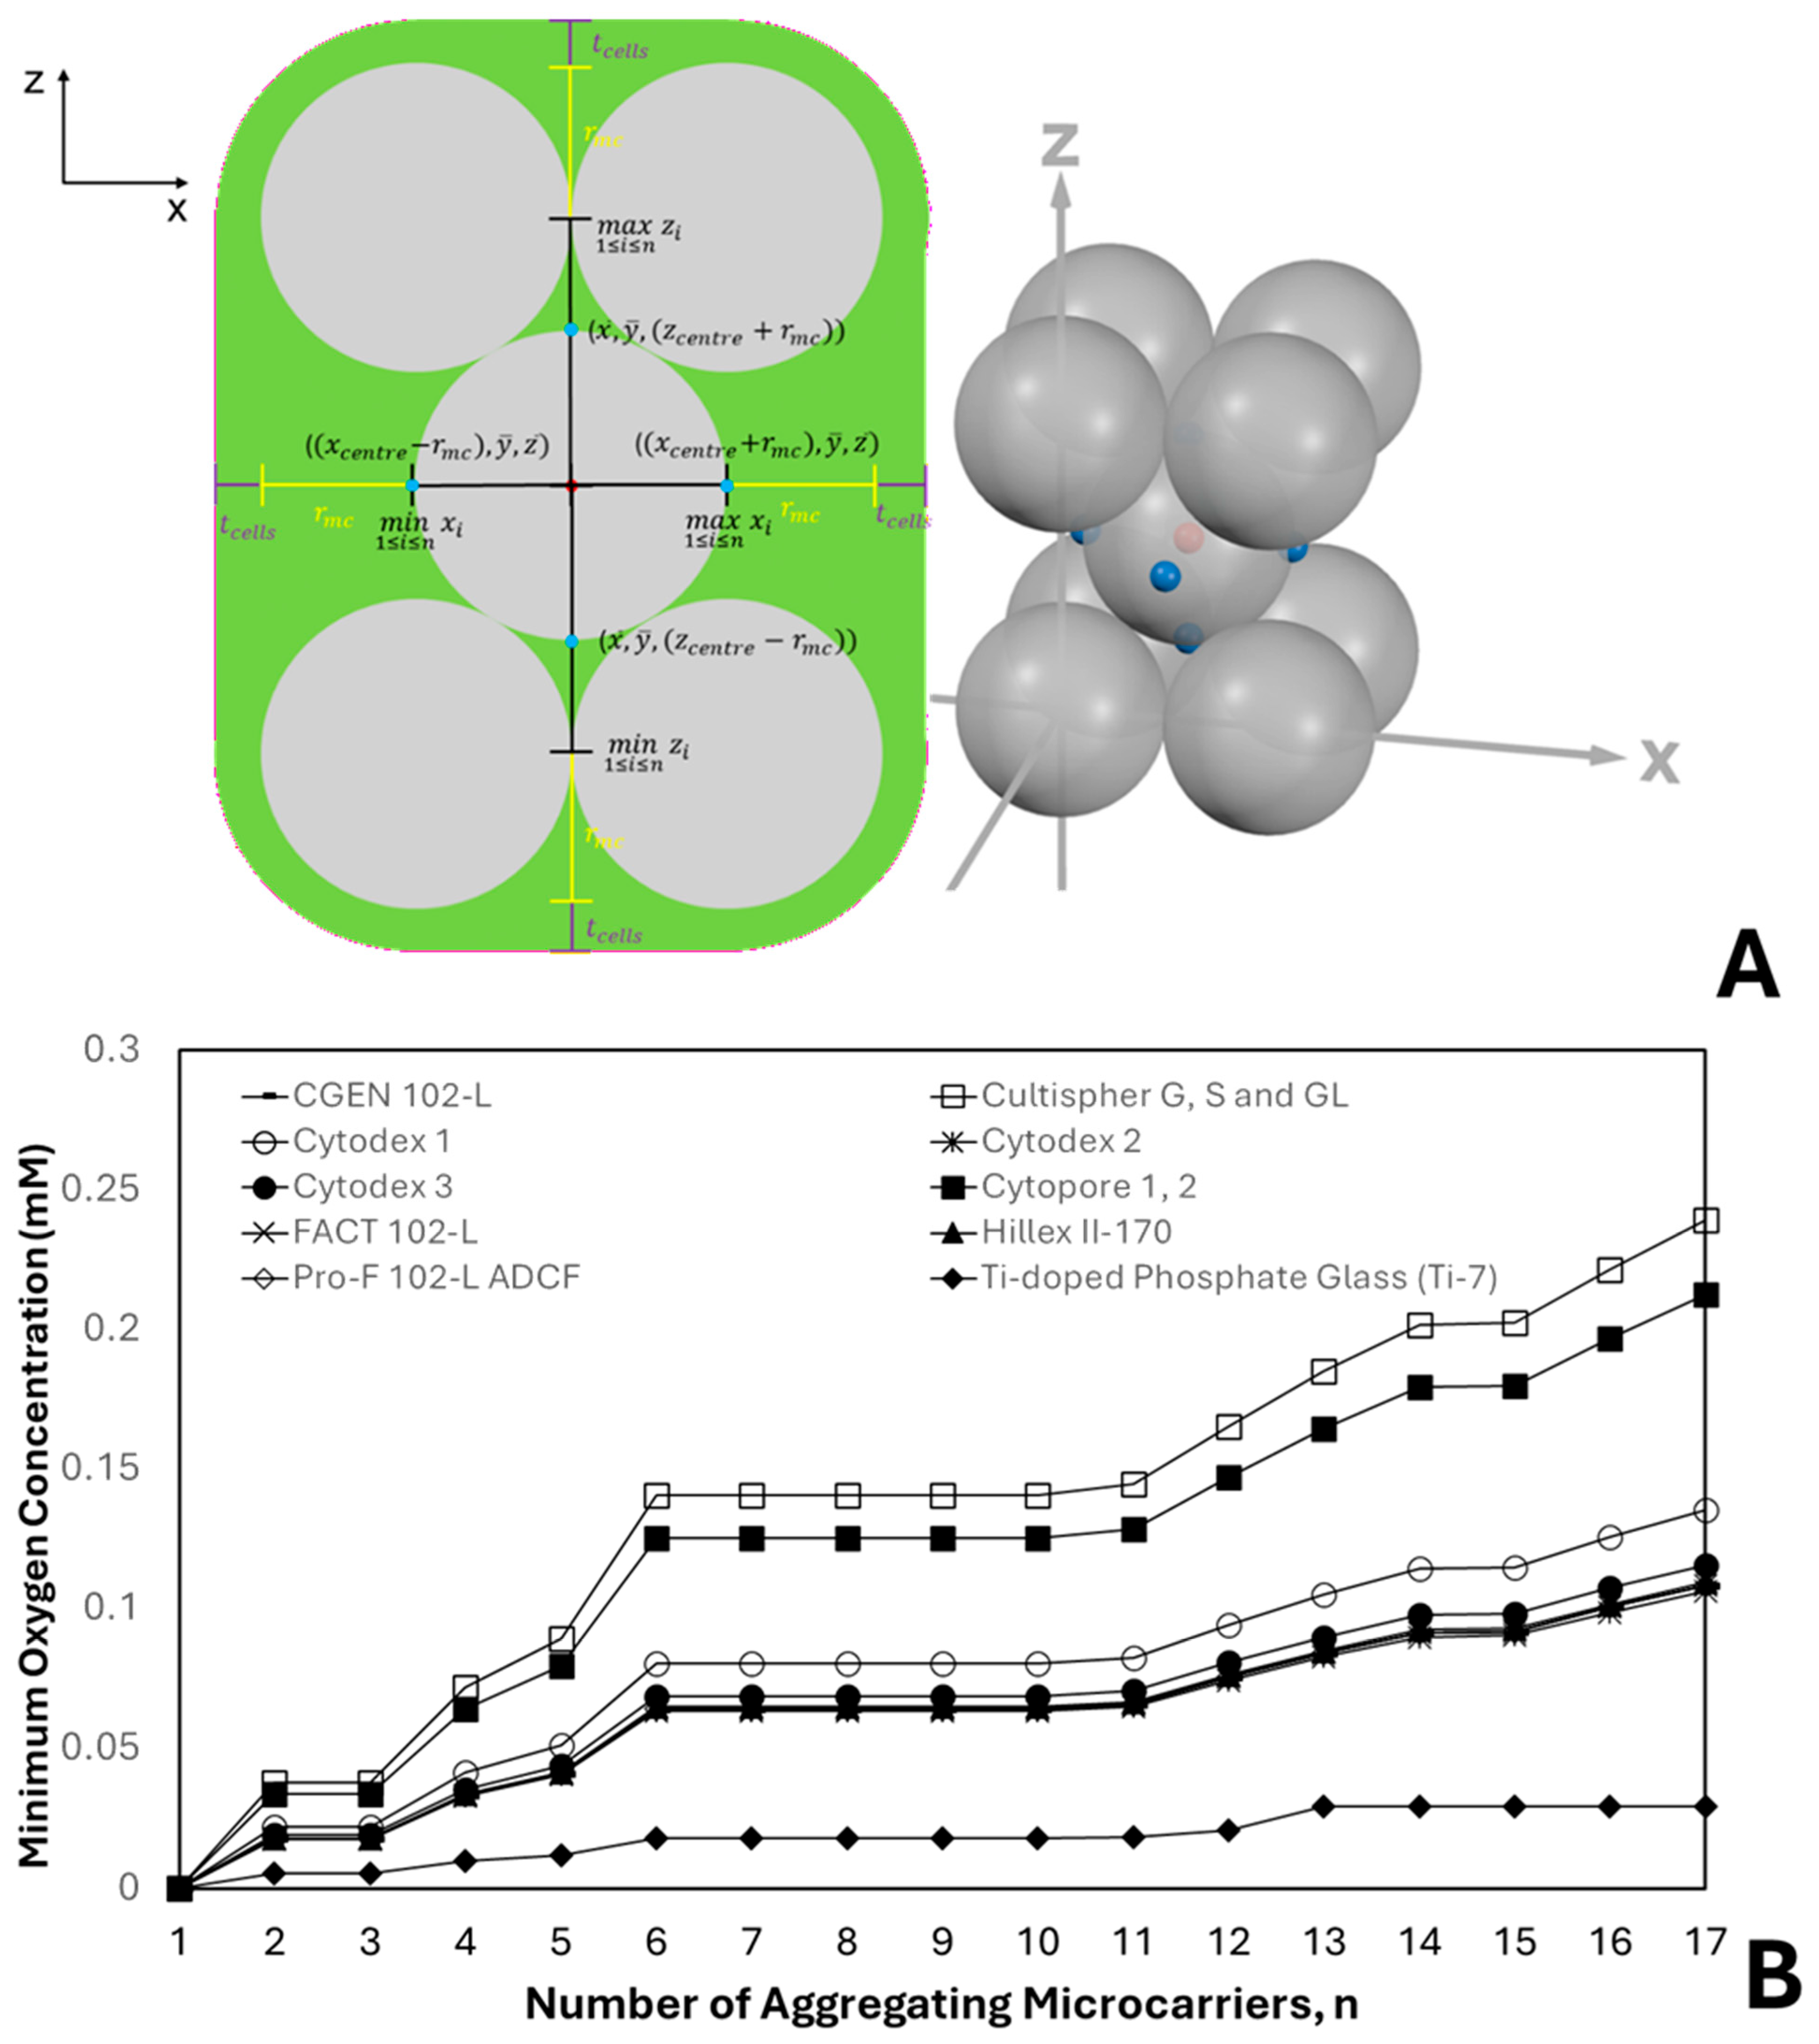
Equations (5) and (6) are valid when the centroid does not coincide with a microcarrier centre ( E 0 ), in which case the nearest centroid position can be extrapolated. When E = 0 , however, the model repositions the centroid along the ± x ,   ± y and ± z axes and evaluates each case to determine the maximum value of R (Figure 1A). This procedure is implemented using Equation (7), where L denotes the number of layers within an aggregate, represented by the number of distinct z-coordinates.
I f   E = 0   w h e r e   j = c e n t r o i d   c o o r d i n a t e s   a n d   i = a l l   m i c r o c a r r i e r   c o o r d i n a t e s , R max 1 i n { | max 1 i n x i ( x c e n t r e + r m c ) | , | min 1 i n x i ( x c e n t r e r m c ) | , | max 1 i n y i ( y c e n t r e + r m c ) | , | min 1 i n y i ( y c e n t r e r m c ) | , | max 1 i n z i ( z c e n t r e + r m c ) | , | min 1 i n z i ( z c e n t r e r m c ) | } + t c e l l + { r m c   i f   L 2 0   i f   L = 1
Excluding experimental observations, which appear largely random, there is limited precedent regarding the orientation and sequence of microcarrier aggregation beyond overall size distributions [17,18]. Consequently, two key assumptions were adopted: (1) denser microcarrier packing results in a greater diffusion distance to the centroid, and therefore (2) the worst-case aggregation sequence is the one that produces the densest packing. The first assumption restricted the geometric variations of microcarrier aggregates to the three known dense packing arrangements for identical, perfect spheres: hexagonal close packing (HCP), face-centred cubic (FCC), and body-centred cubic (BCC) packing [28,29]. The second assumption substantially reduced the number of possible aggregation sequences, enabling the simulations to construct aggregates either conventionally (layer-by-layer along the +z axis) or alternately (adding microcarriers on either side of a central layer along the ±z axis) to allow cell growth in each packing configuration.
Equation (8) was used to calculate the volume of individual aggregates (Vaggregate) based on microcarrier morphology and the packing fraction ( η ). The packing fraction η is defined as the ratio of the volume occupied by solid particles (microcarriers) to the volume of the corresponding unit cell (microcarriers plus viable cells). BCC packing has a packing fraction of 0.68 ( i . e . ,     η BCC = 0.68 ), whereas both HCP and FCC packing are denser, each achieving a packing fraction of 0.74 ( i . e . ,     η HCP = η FCC = 0.74 ) [28,29]. This calculation slightly overestimates aggregate volume because it assumes microcarriers are separated by twice the cell thickness ( E = 2 r mc + 2 t cells ). The overall aggregate density ( ρ aggregate ) was then determined from the volume fractions of the microcarriers and attached cells, together with their respective material densities.
n × ( r m c + t c e l l s ) 3 η = V a g g r e g a t e

2.3. Modeling Hydrodynamics and Cell–Microcarrier Interactions in Stirred Bioreactors

It is established that increasing the revolutions per minute (RPM) of the impellers or using more aggressive impeller designs in stirred reactors leads to smaller, more favourable aggregations [17]. Similarly, microcarrier type and the hydrodynamic properties of the medium can significantly affect aggregation geometry and overall culture performance [30,31]. However, these factors also influence other culture conditions, including microcarrier suspension, cell damage, and mixing efficiency. To quantify these effects, the model employs experimental correlations and equations. The Zwietering correlation (Equation (9)) is a widely accepted method for predicting solids suspension and provides the minimum stirring speed, N m i n , required to prevent any particle from remaining stationary at the bottom of the vessel for more than 2 s [32,33]. All symbols retain their standard meanings, except for the empirically derived constant S, which depends on impeller and reactor design, and the mass fraction of microcarriers in the medium, X. The diameter of the aggregate ( d a g g r e g a t e ) was obtained from each simulation as the largest aggregation for a given n, estimated using the maximum Feret’s diameter (m). Values for S were based on a flat-bottomed, cylindrical vessel with four baffles of width 1/10 the tank diameter and a liquid height equal to the tank diameter [34,35]. All relevant data are provided in Appendix C.
N m i n = ( S × v m e d i a 0.1 × d a g g r e g a t e 0.2 × [ g × ( ρ a g g r e g a t e ρ m e d i a ) ρ m e d i a ] 0.45 × X 0.13 d i m p e l l e r 0.85 )
Based on the agitation speed, the power requirement in Watts (P) was calculated using Equation (10), where P0 is the power number—an empirically derived constant that varies with impeller type and flow regime. For turbulent flow, P0 is constant, with values listed in Appendix C. In the transient region, however, P0 depends on both impeller type and geometry, with the full calculation detailed in Appendix D. An agitator efficiency η e f f i e n c y of 80% was assumed for all simulations [35].
P = P 0 × ρ m e d i a × ( N ) 3 × d i m p e l l e r 5 η e f f i e n c y
Promoting turbulent flow enhances mass transfer and ensures homogeneity within the culture, improving nutrient distribution and facilitating waste removal. Maintaining homogeneity is critical for producing large scale cultures with higher specific growth rates over extended periods [36]. According to Nienow [37], the Reynolds number for Newtonian fluids in a stirred bioreactor is defined as:
R e = ρ m e d i a × N × d i m p e l l e r 2 μ m e d i a
where all symbols have their usual meanings. For turbulent flow in a bioreactor, Re > 2 × 10⁴ [37]. Equation (11) determines the flow regime around the impeller; in larger reactors, greater energy dissipation can create stagnant regions. However, the model assumes turbulence throughout the reactor, as Re > 2 × 10⁴ exceeds the threshold, and impeller geometry is scaled accordingly [37].
While turbulence improves mass transfer and homogeneity, it also generates kinetic energy that can damage cells. Kolmogorov’s universal equilibrium theory of local isotropic turbulence was used to calculate the smallest characteristic eddy size ( λ K ) as a function of the medium’s kinematic viscosity ( υ m e d i a ) and the total energy dissipated per unit mass of fluid ( ε T ) [34]. Equation (12) provides this calculation, comparing λ K to the diameter of the selected microcarrier to assess cell damage risk. Values of λ K below 2 3 d m c moderately reduce cell growth, while values below 1 2 d m c are detrimental to cell health and can disrupt the cell membrane [38,39].
λ K = ( υ m e d i a 3 ε T ) 1 4               w h e r e               ε T = P ρ m e d i a × V

3. Results and Discussions

3.1. Influence of Aggregate Geometry and Microcarrier Size on Oxygen Limitation

Equations (1)–(7) were applied to simulate the number of microcarriers (n) within an aggregate and evaluate the resulting minimum oxygen concentration across different microcarrier types. As shown in Figure 1B, the simulations demonstrate that Cmin increases with increasing individual microcarrier diameter within aggregates. For example, Cultisphere G, S, and GL (dmc = 255 μm) reached peak Cmin values of ~0.24 mM at n = 17, whereas Cytodex 1 (dmc = 190 μm) reached only ~0.14 mM at the same aggregation number. This outcome is consistent with Equation (3), as larger dmc increases the aggregate radius (R), which is related to Cmin, and aligns with experimental trends reported by Preissmann et al. [40] and Rafiq et al. [41].
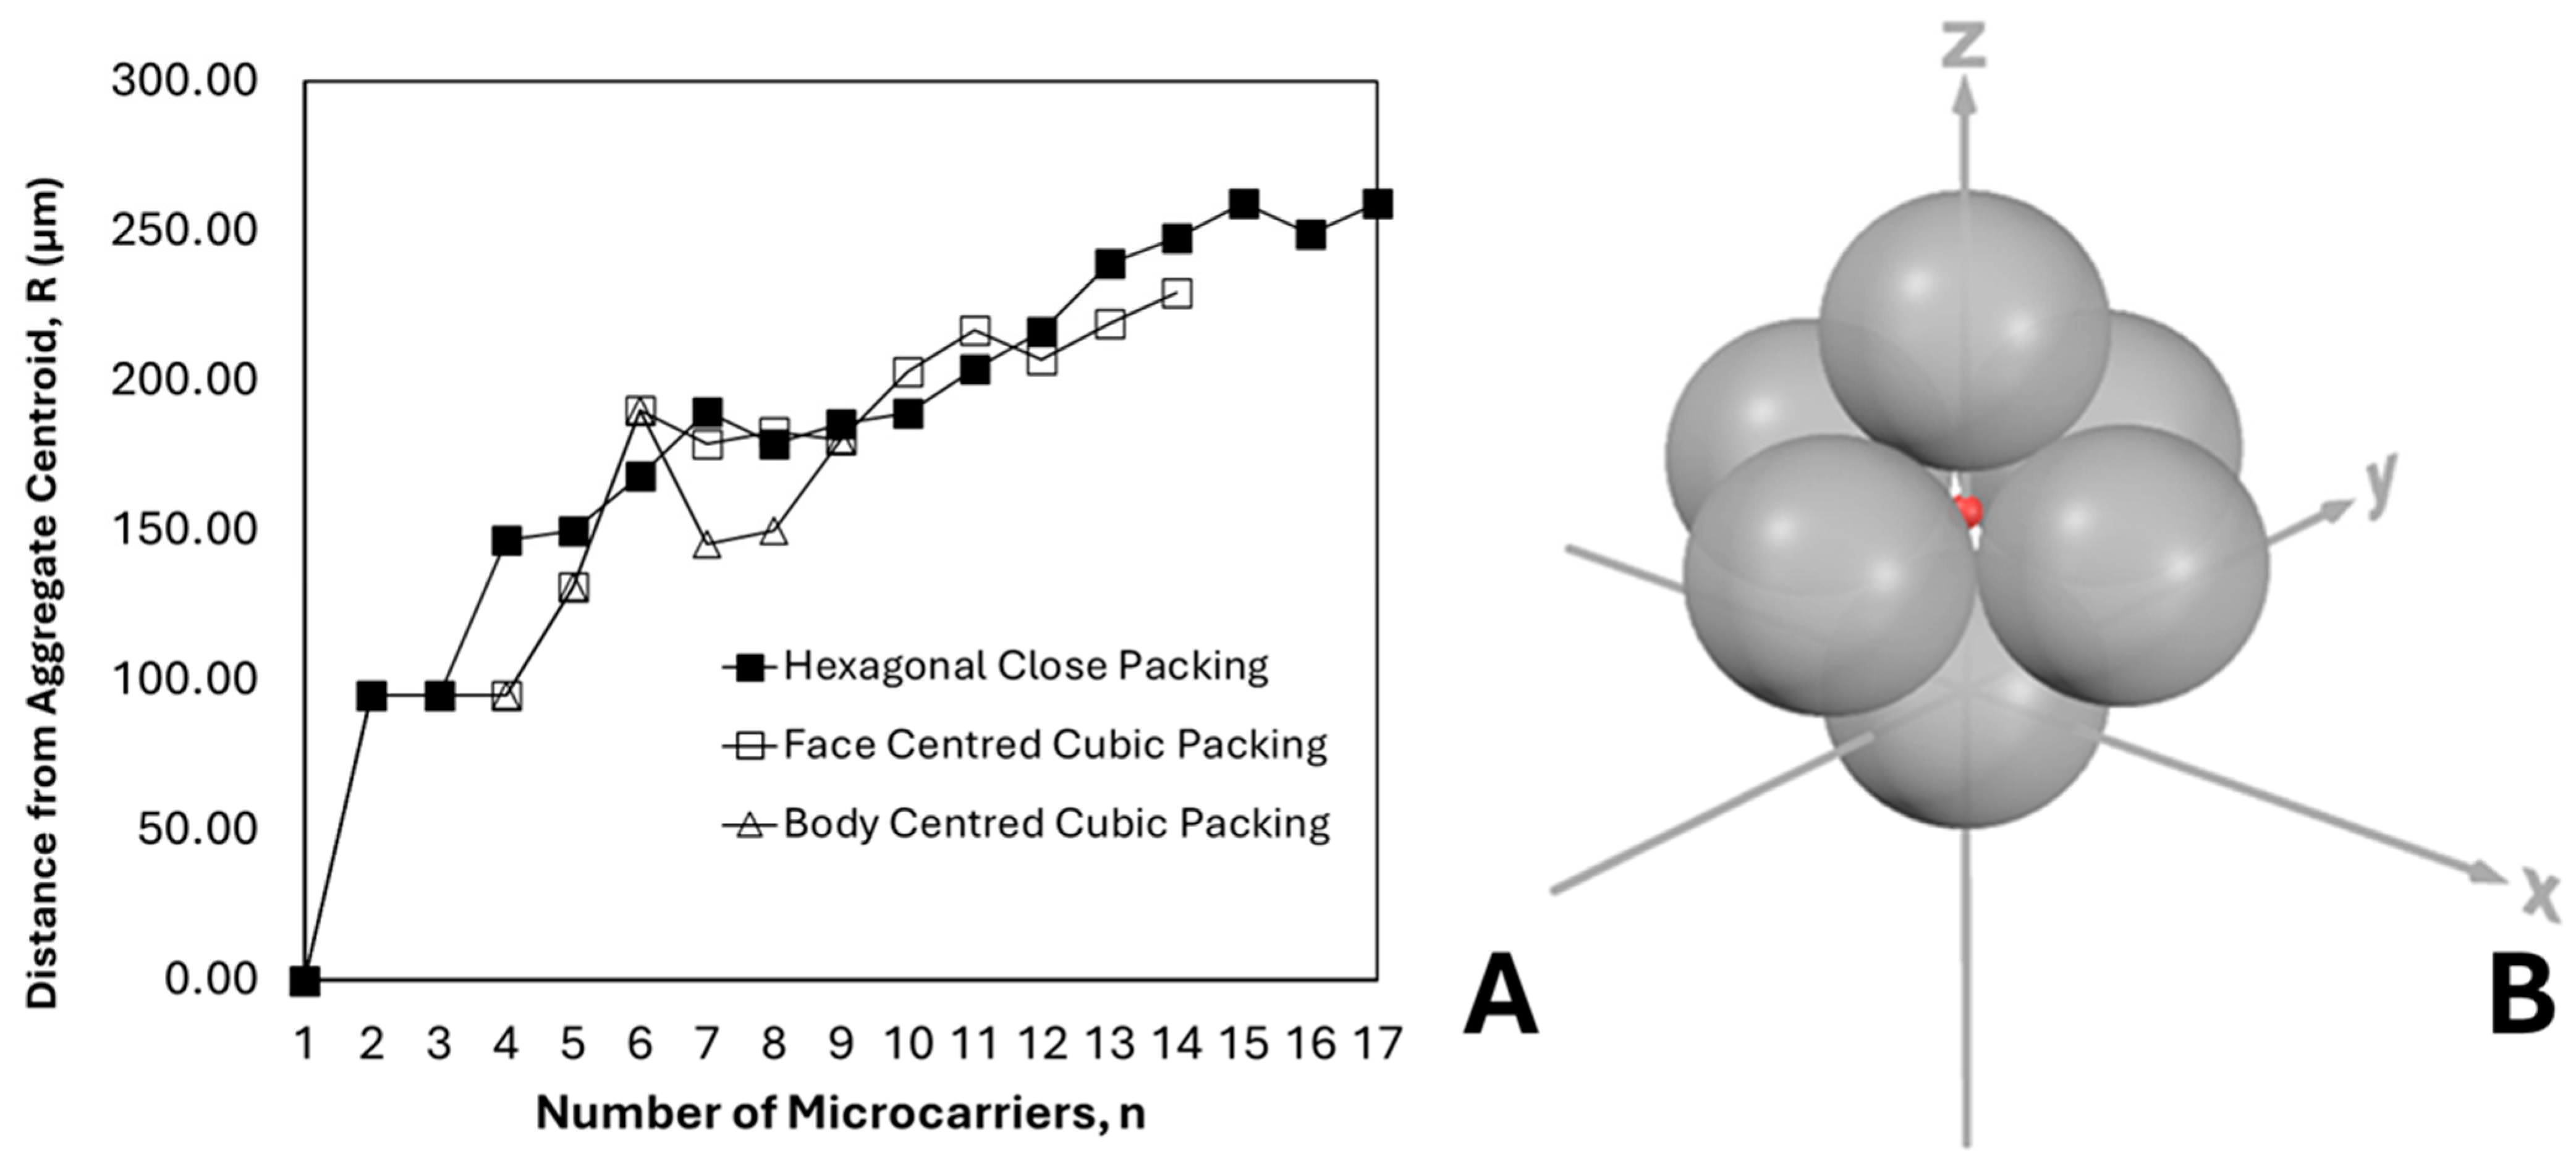
Beyond simple size effects, the simulations demonstrate that C m i n is strongly governed by aggregate geometry and packing configuration. While larger microcarriers are generally associated with higher C m i n , the increase in C m i n does not scale proportionally with n , indicating a significant dependence on how the microcarriers are arranged within the aggregate. This effect was first observed in Figure 1B for 2 ≤ n ≤ 3. When n = 1, the diffusion radius R was equal to tcell due to the assumption of a confluent cell monolayer. In contrast, when n = 2, cell bridging occurred between adjacent microcarriers, displacing the centroid into the interstitial “valley” between the particles. Similarly, at n = 3, the densest packing configuration was achieved, with tangential microcarriers arranged within a single layer or plane. As a result, for any configuration forming a single layer, or for any orientation where 2 ≤ n ≤ 3, oxygen must diffuse through a cell mass with an effective diffusion length of tcell + rmc. The addition of a fourth microcarrier enabled the formation of a multilayer tetrahedral structure in a hexagonal close-packed configuration, resulting in an increase in C m i n . Figure 2A presents the corresponding R values for all packing configurations, plotted against their respective number of the microcarriers in each aggregate or the unit cell numbers. Similarly, the incorporation of a fifth microcarrier permitted the formation of a third layer, yielding a triangular bipyramidal structure (also consistent with an HCP configuration) and a further increase in C m i n . However, the model predicts a plateau in C m i n   for 6 n 10   (Figure 1B), arising from the formation of a square bipyramidal structure (Figure 2B). This plateau indicates that increasing n   does not necessarily lead to higher C m i n   when aggregates adopt the densest packing configurations. Importantly, this observation might be applicable to modular tissue cultures for developmental engineering, as it suggests that larger modular tissues can be formed through the controlled aggregation of modular scaffolds. In particular, increasing the number of modular scaffolds ( n ) within specific ranges (e.g., 6 n 10 ) might not necessarily reduce oxygen availability, since C m i n can remain effectively constant under these packing configurations.
Figure 1B further illustrates variations in C m i n gradients for aggregates with 11 n 17 across different microcarrier types. For Ti-doped phosphate glass (Ti-7) microcarriers, a plateau in C m i n is observed, indicating the emergence of a dominant aggregation geometry at n = 13 . This configuration corresponds to the kissing number, defined as the minimum number (12) of identical spheres that can simultaneously contact and surround a central sphere. In contrast, Cytodex 2 microcarriers—whose diameter is approximately 98.2% larger—exhibit an increase of approximately 28.9% in C m i n over the range 13 n 17 . These results demonstrate that the microcarrier diameter influences C m i n both directly, as described by Equation (3), and indirectly by governing packing configurations that determine aggregate geometry. These findings establish an interesting mechanistic relationship between microcarrier size, aggregate geometry, and oxygen limitation, suggesting the possibility of culturing larger modular tissues through the controlled aggregation of suitable modular scaffolds without an associated increase in hypoxic risk.

3.2. Effects of Microcarrier Properties and Aggregation on Suspension and Cell Damage

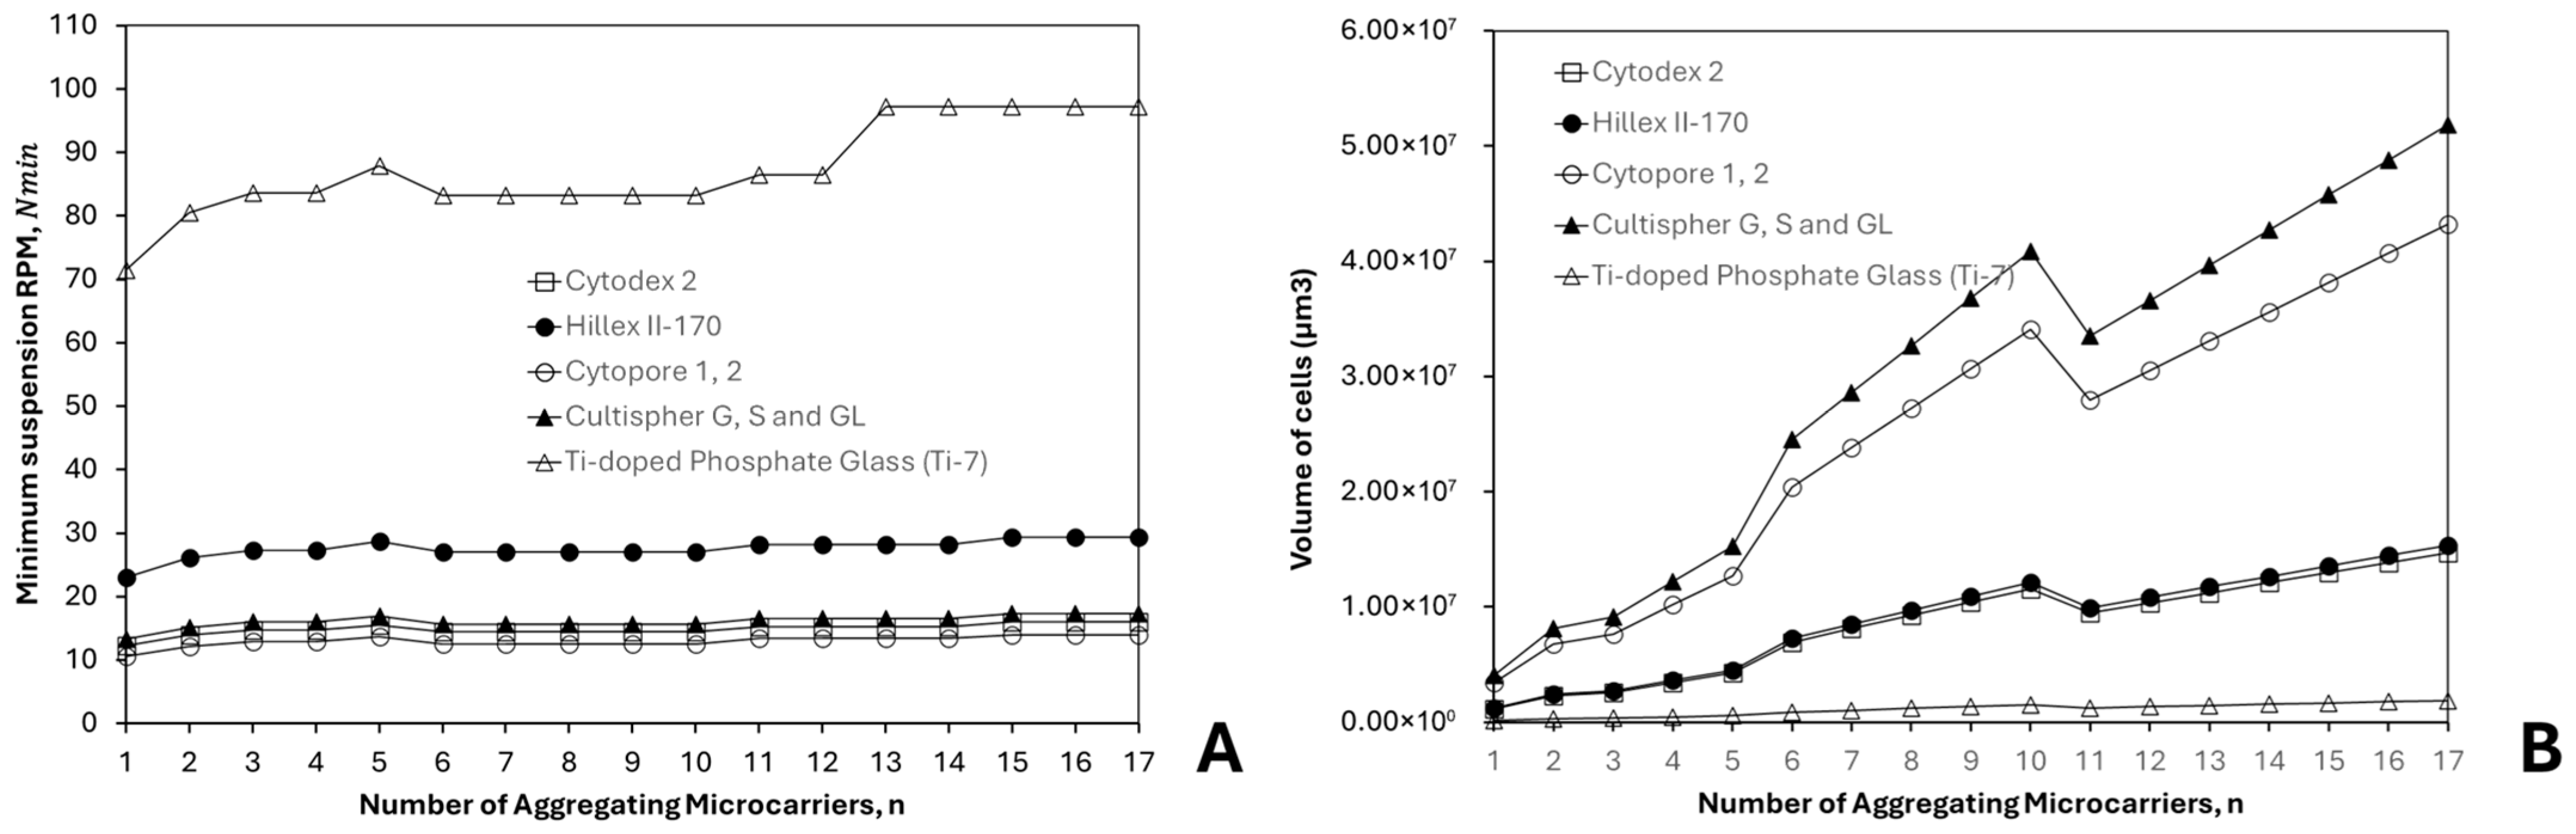
Figure 3A illustrates the influence of microcarrier density on the minimum stirring speed required for suspension, as predicted by the Zwietering correlation (Equation (9)). Aggregates with lower packing fractions contained a higher proportion of microcarriers relative to cells, resulting in a greater effective aggregate density and explaining the observed reduction in N m i n for 6 n 10 . In addition, increasing microcarrier density led to higher suspension requirements overall. For instance, Ti-doped phosphate glass microcarriers ( ρ m c = 2.75 × 10 3 kg   m 3 ) required stirring speeds of approximately 70–100 RPM to remain suspended, whereas other microcarriers typically required only 10–30 RPM. Among the latter, Hillex II-170 exhibited relatively higher N m i n values, attributable to its denser polystyrene core compared with biopolymer-based microcarriers such as dextran, cellulose, and gelatin. Consequently, biopolymer microcarriers are often preferred, as lower N m i n values are associated with reduced energy consumption and a lower risk of shear-induced cell damage. In addition, their biodegradability and inherent biocompatibility promote efficient cell attachment and facilitate enzymatic cell harvesting [42]. However, their natural origin can introduce batch-to-batch variability and susceptibility to premature degradation, which may result in inconsistent culture performance [18,43].
Figure 3B illustrates the combined effects of microcarrier diameter and the number of microcarriers per aggregate ( n ) on the cell population per aggregate, represented by the calculated total cell volume (Equation (8)). In contrast to Figure 1B, which exhibits a plateau in C m i n between 6 n 10 , Figure 3B shows a continued increase in cell population with increasing n . This divergence indicates that larger cellular volumes can be accommodated within aggregates without a corresponding increase in the effective diffusion path length ( R ). These results therefore support the earlier conclusion that maximal cell populations can be achieved through controlled aggregation while maintaining oxygen transport constraints within acceptable limits.
Although cell population generally increases with increasing n , a pronounced reduction is observed at n = 11 . This occurs because the densest packing configuration transitions from body-centred cubic to face-centred cubic packing (Figure 2A), which increases the packing fraction and consequently reduces the accessible microcarrier surface area available for cell attachment. It should be noted, however, that the model may overestimate cell growth, as it assumes that cells readily bridge gaps between tangential microcarriers or between microcarriers aligned along the same axis, as demonstrated in related experimental studies [44]. Moreover, although aggregates formed from smaller microcarriers ( d m c ) display lower maximum cell populations as a result of their reduced absolute surface area for cell attachment (Figure 3B), they possess higher surface area-to-volume ratios, which can facilitate more efficient cell culture on a mass basis. This trend is consistent with observations reported by Ng et al. [45]. Nevertheless, the same study also demonstrated that larger microcarriers may support more than threefold higher cell-per-bead loading, an effect attributed in part to microcarrier porosity. Such internal structural features are not incorporated into the present model and may therefore contribute to discrepancies between predicted and experimentally observed cell densities.
Table 1 summarises the influence of different stirring speeds or energy inputs required to suspend various types of microcarriers in DMEM cell culture medium supplemented with 0% or 20% fetal bovine serum (FBS) in stirred tank reactors with an impeller-to-tank diameter ratio of 0.33 ( 0.33 d t a n k ) on the potential damage to cells cultured on the suspended microcarriers, as evaluated using Equation (12). The results clearly indicate that increasing microcarrier diameter reduces the rotational speed (RPM) required to induce a risk of cell damage. For instance, at 94 RPM, Cytopore 1 and 2 ( d m c 240 μ m ) fall within the high Kolmogorov risk regime, whereas Cytodex 2 ( d m c 167.5 μ m ) remains within the low-risk category. This size-dependent susceptibility to shear-induced damage is consistent with previous experimental and theoretical studies [34,39,46]. Additionally, increasing the medium density ( ρ media ) reduces the minimum stirring speed required for suspension, as smaller density differences between microcarriers and the medium lower the hydrodynamic forces. This also decreases the total energy dissipation ( ε T ), thereby reducing the risk of cell damage. Table 1 illustrates this effect: for all microcarriers, the RPM at which cell damage occurs is higher in DMEM supplemented with 20% FBS ( ρ media @ 20 % = 1.02 × 10 3 kg / m 3 ) compared to DMEM without FBS ( ρ media @ 0 % = 1.00 × 10 3 kg / m 3 ). Liste-Calleja et al. [31] similarly reported improved cell densities and viabilities for HEK-293 cultures in higher FBS concentrations, attributing this primarily to enhanced nutrient availability. However, the present model suggests an additional hydrodynamic contribution, where increased medium density mitigates shear-induced damage, further supporting improved culture outcomes.

3.3. Effects of Agitation and Impeller Design on Cell Damage Risk

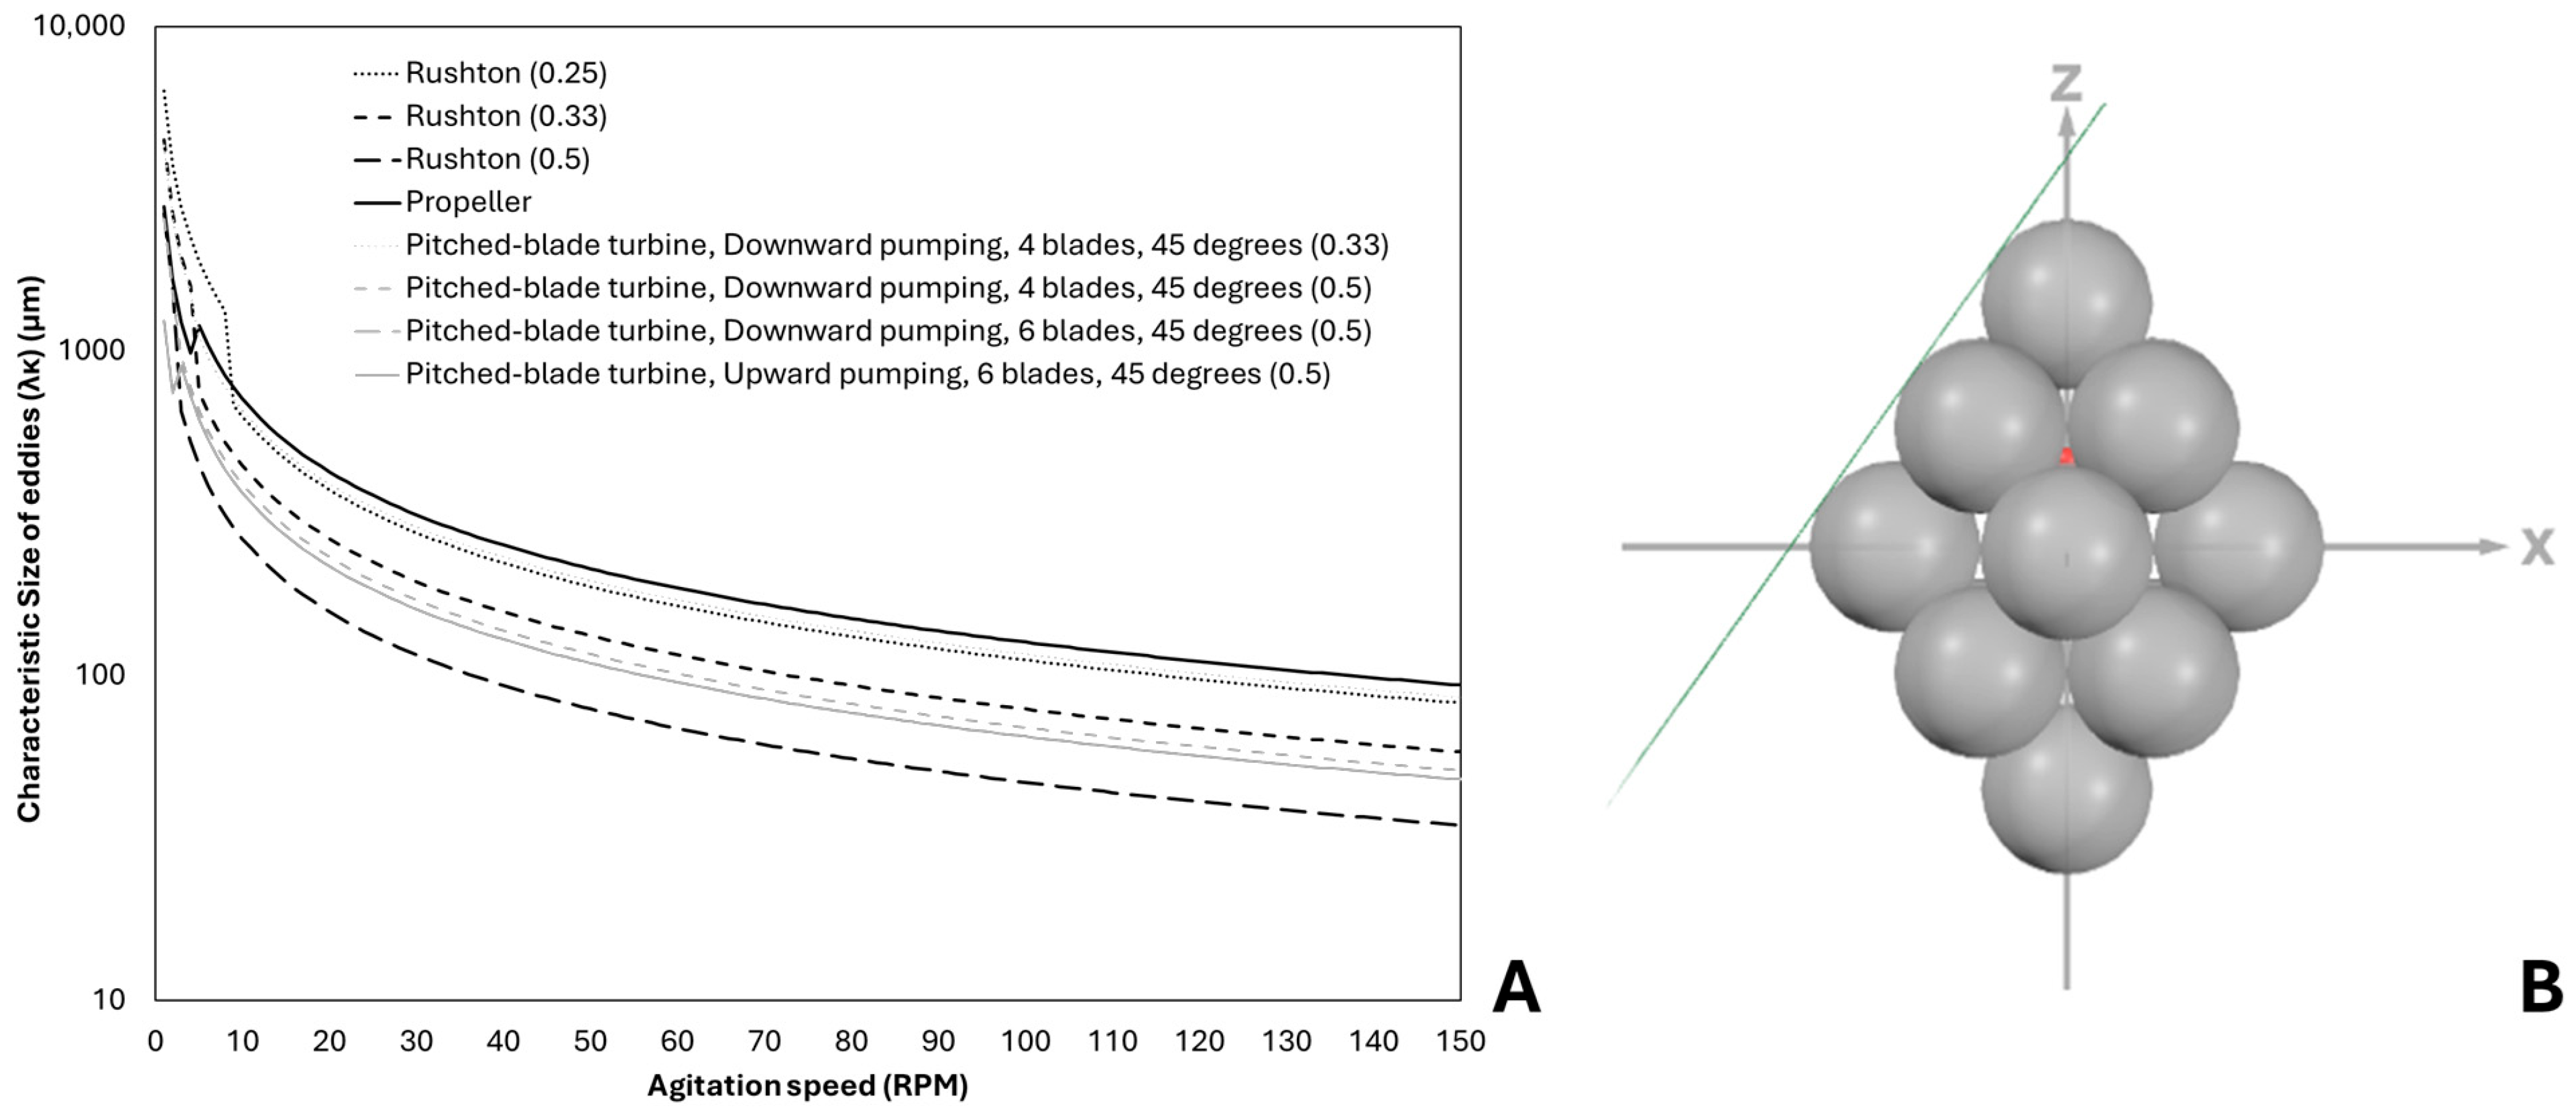
The effect of energy input in stirred tank bioreactors on physical damage to the cells cultured on microcarriers was also evaluated by converting agitation speed into power dissipation and eddy characteristics, which were subsequently related to the Kolmogorov length scale (Equations (10)–(12)). Figure 4A illustrates the variation in λk as a function of impeller type, impeller diameter (dimpeller), and RPM. Increasing RPM leads to a reduction in λk, reflecting higher energy dissipation and the breakdown of larger eddies into smaller turbulent structures. At lower RPM values, a local decrease in λk is observed for each impeller configuration. This behavior arises because the Reynolds number surpasses the turbulent transition threshold, prompting a change in the impeller power number, as described by Nienow [37]. Smaller eddies generate steep velocity gradients at the microcarrier surfaces, thereby increasing the likelihood of cell damage [47]. While comparisons between eddy size and cell diameter are commonly used to assess shear-induced damage [46], in microcarrier-based cell culture systems λk should instead be evaluated relative to the microcarrier diameter, as this represents the most conservative or “worst-case” hydrodynamic condition [34].
Figure 4A further demonstrates the reduction in λk with increasing impeller diameter. For instance, a Rushton impeller with dimpeller = 0.25 dtank generates eddies of approximately 86.8 μm at maximum RPM. In contrast, a Rushton impeller with dimpeller = 0.5 dtank produces a comparable eddy size at only 47 RPM ( λ K @ 150 R P M ≈ 87.14 μm), and at its maximum RPM generates eddies less than half that size. Although this trend is supported by Cherry and Papoutsakis [48] and Grein et al. [46], both studies also report that cell damage may result from microcarrier–microcarrier and microcarrier–impeller collisions, the frequency of which increases with agitation speed. Consequently, relying solely on the Kolmogorov length scale as an indicator of cell damage oversimplifies the combined effects of RPM and impeller geometry. For example, increasing dimpeller enlarges the impeller surface area, thereby increasing the probability of microcarrier–impeller interactions and associated mechanical damage.
As summarised in Figure 4A, simulations based on Equations (10)–(12) and Appendix D indicate that λk varies with impeller type. The Rushton impeller generated the smallest eddies (λk at 150 RPM = 36.50 μm), owing to its flat, vertical blades, which promote high turbulence intensity, elevated local shear stresses, and predominantly radial flow [49]. For this reason, Rushton impellers are widely applied in fermentation processes, where bacterial cells—characterised by small size and relatively robust cell walls—can better tolerate low λk conditions [34]. In comparison, the six-blade, 45° pitched-blade turbine operating in upward pumping mode produced the second smallest eddies ( λ K @ 150 R P M = 36.50   μ m ). The inclined blade configuration results in comparatively lower turbulence intensity and energy dissipation than the Rushton design [50]. Although the λk profiles for upward and downward pumping turbines of identical diameter are effectively the same, Ibrahim et al. [51] reported that downward pumping configurations are particularly advantageous in shear-sensitive microcarrier-based cell culture systems.
More aggressive impeller geometries, characterised by larger diameters and flatter blades, generally exhibit lower minimum agitation speeds (Nmin) because the turbulent energy dissipation rate (εT) is higher. However, these designs also demand greater power input as a consequence of increased drag and hydrodynamic resistance [52,53]. Simulation results derived from Equations (9)–(11), summarised in Table 2, indicate that increasing dimpeller reduces both Nmin and the agitation speed required to reach fully turbulent conditions (Nturbulence), owing to improved bulk circulation and higher power transmission to the fluid. Consistent with this observation, Ramírez et al. [53] reported that larger impellers generate elevated shear stresses, which in turn decrease the extent of cell aggregation, as also noted by Zhang et al. [17].

3.4. Model Assumptions, Limitations, and Applicability

Although the model incorporates both theoretical formulations and empirically derived correlations, it demonstrates strong agreement with experimental observations. For instance, the Zwietering correlation has been reported to exhibit a strong confidence interval of 95 ± 13% [32]. Similarly, deviations in the impeller power number are relatively minor, with Rushton impellers showing a reported relative error of approximately 3.4% [54]. Nevertheless, the model assumes a uniform microcarrier diameter, which may not reflect practical conditions. Manufacturing techniques such as emulsion solvent evaporation are known to produce broad particle size distributions [55]. This variability is particularly pronounced in bio-based microcarriers, including Cultispher G, S, and GL (dmc ± 125 μm), compared with more uniform synthetic alternatives such as Hillex II-170 (dmc ± 10 μm).
Because mammalian cells are highly sensitive to hydrodynamic stress, bioprocesses for their cultivation commonly employ surface aeration as a low-shear oxygen transfer strategy [56]. In this approach, oxygen diffuses from the headspace into the culture medium across the free liquid surface rather than being introduced through sparging or dispersed bubbles. The present model assumes that surface aeration alone is adequate to sustain cell growth; however, this assumption is often not valid at industrial scale [57]. Although the model does not provide quantitative predictions for gassed systems, their effects are extensively reported in the literature. Sparged or bubbled systems increase the gas–liquid interfacial area, thereby enhancing the volumetric mass transfer coefficient (kLa) [58]. Improved oxygen transfer supports higher cell densities and enables larger microcarrier aggregates to receive sufficient oxygen to their core. Gas sparging can also promote turbulence and assist in microcarrier suspension in low-viscosity media—an effect not accounted for in the Zwietering correlation [34]. However, excessive gas flow rates may generate cavities behind impeller blades, decreasing effective fluid–impeller contact and consequently requiring higher agitation speeds to maintain suspension and mixing. Furthermore, bubbled systems pose a risk of cell damage due to steep velocity gradients generated during bubble rise and rupture [59,60]. The use of more aggressive impeller geometries can mitigate some of these effects by reducing bubble size, lowering associated shear damage, and improving the surface-area-to-volume ratio, thereby achieving higher kLa values [61].
In each simulation, the calculated R value was used to represent the most conservative diffusion pathway—namely, a route assumed to remain in continuous contact with cells rather than passing through a microcarrier. Accordingly, the minimum oxygen concentration was determined under the assumption that oxygen consumption occurred along the entire diffusion distance without interruption by non-consuming regions. This conservative framework enabled accurate estimation of R for microcarrier aggregates with spherical and cubic geometries (Figure 1A). However, minor deviations arose for microcarrier aggregates with triangular or tetrahedral morphologies. The limitation becomes more evident in Figure 4B, where a large diamond-shaped aggregate is shown. In this configuration, the true shortest diffusion pathway follows an angular trajectory rather than a straight line, meaning the model slightly overestimates R relative to the physical system. Despite this, modest overestimation is advantageous in practice, as it yields a Cmin value marginally above the actual cellular oxygen requirement, thereby providing a conservative safety margin.

4. Conclusions

This study utilised theoretical simulations to characterise microcarrier aggregation morphologies in three-dimensional space and to develop a framework for analysing the influence of aggregation on oxygen transport. The modelling framework assumes a uniform mammalian cell thickness of 10 µm, a Newtonian culture medium, and non-porous, spherical microcarriers, with oxygen transport occurring exclusively through the cell or tissue layer to represent the most diffusion-limited condition. The results indicate that the minimum oxygen concentration is strongly dependent on packing configuration. Within a defined range, this suggests that aggregates composed of a larger number of microcarriers (n) may be formed without a proportional increase in the effective diffusion path length (R). In parallel, a combination of literature evaluation and supplementary simulations was used to examine the influence of mixing and agitation in stirred bioreactors on aggregation behaviour. Increased agitation speeds and impeller designs with larger diameters and flatter blade geometries were associated with improved mixing efficiency and reduced minimum suspension speed (Nmin), although these conditions may also elevate the risk of shear-induced cellular damage. Additionally, media with higher density and viscosity were found to mitigate mechanical stress on cells, whereas increased microcarrier density required higher agitation rates to maintain suspension, thereby intensifying hydrodynamic forces. These observations highlight the coupled effects of hydrodynamics, microcarrier aggregation behaviour, and oxygen transport, and suggest that predictive modelling may be useful for evaluating aggregation under controlled conditions.
However, several limitations should be acknowledged. The study is based on theoretical modelling and has not yet been validated experimentally, and therefore the predicted aggregate geometries and oxygen distributions remain to be confirmed. The simulations also rely on simplifying assumptions regarding aggregate structure, uniformity, and mass transport, which may not fully capture the heterogeneity and dynamic behaviour observed in practical bioreactor systems. In addition, the interaction between hydrodynamic forces, cell growth, and matrix production within aggregates was not explicitly considered, which may influence both aggregation stability and oxygen transport. Future work should focus on experimental validation using controlled stirred bioreactor systems, combined with quantitative imaging techniques to measure aggregate size distributions and oxygen profiles. Further refinement of the modelling framework, including incorporation of force-balance analysis and, where appropriate, coupling with population balance models and hydrodynamic characterization, would improve its applicability. Such developments may support a more controlled assessment of microcarrier aggregation behaviour and its implications for cell culture performance under defined operating conditions.

Author Contributions

Conceptualization, T.S.; methodology, B.L. and T.S.; formal analysis, T.S. and B.L.; investigation, B.L.; writing—original draft preparation, B.L. and T.S.; writing—review and editing, T.S.; supervision, T.S. All authors have read and agreed to the published version of the manuscript.

Funding

This research received no external funding.

Data Availability Statement

Excel files containing the implemented equations and calculations can be made available upon reasonable request. No new data were created or analyzed in this study.

Conflicts of Interest

The authors declare no conflicts of interest.

Abbreviations

The following abbreviations are used in this manuscript:
SymbolDescriptionUnits
C 0 Initial oxygen concentration in the media m M
C m i n Minimum oxygen concentration in the media to move across the diffusion distance to the centroid m M
N m i n Minimum stirring speed for suspension R P M
N t u r b u l e n c e Minimum agitation speed for turbulence R P M
P 0 Power number N / A
T m a x The maximum tissue depth μ m
V a g g r e g a t e s Overall volume of aggregate μ m 3
V c e l l s Volume of cells per aggregate μ m 3
c i m p e l l e r Distance of impeller from tank bottom m
d a g g r e g a t e Aggregate diameter (Feret’s diameter) μ m
d i m p e l l e r Impeller diameter m
d m c Microcarrier diameter μ m
d t a n k Diameter of stirred tank m
k L a Mass transfer coefficient s 1
n i m p e l l e r Number of blades N / A
r m c Radius of microcarrier μ m
t c e l l Cell thickness μ m
w i m p e l l e r Impeller width m
x ¯ Centroid X-coordinate in aggregation space N / A
x s u r f Centroid relocated to microcarrier surface X-coordinate in aggregation space N / A
y ¯ Centroid Y-coordinate in aggregation space N / A
y s u r f Centroid relocated to microcarrier surface Y-coordinate in aggregation space N / A
z ¯ Centroid Z-coordinate in aggregation space N / A
z s u r f Centroid relocated to microcarrier surface Z-coordinate in aggregation space N / A
γ ˙ Shear rate s 1
ε T Total energy dissipation per unit mass of fluid m 2 / s 3
η e f f i c i e n c y Agitator efficiency %
λ K Smallest characteristic eddy size μ m
μ m e d i a Dynamic viscosity of media P a . s
ν m e d i a   Kinematic viscosity of media m 2 s
ρ a g g r e g a t e Aggregate density k g m 3
ρ c e l l Cell density c e l l s m 3
ρ m c Microcarrier density k g m 3
ρ m e d i a   Density of media k g m 3
Azimuthal diffusion distance r a d
C Oxygen concentration in the media m M
D Diffusion coefficient m 2 s
E Euclidean distance μ m
N Stirring speed R P M
P Power W a t t s
R Diffusion distance to the centroid μ m
R e Reynolds number N / A
S Empirically derived constant based on impeller design and reactor geometry N / A
T Tissue thickness m
X Mass fraction of microcarriers N / A
g Gravitational acceleration m / s
i Index of summation for microcarrier/Microcarrier sequence number N / A
j Microcarrier sequence number N / A
k Shear rate constant N / A
n Number of microcarriers within an aggregate N / A
r Radial diffusion distance μ m
s O C R Single cell oxygen consumption rate m o l s c e l l
t Time h o u r s
x X-coordinate in aggregation space N / A
y Y-coordinate in aggregation space N / A
z Z-coordinate in aggregation space N / A
η Packing fraction N / A
θ Polar diffusion distance r a d
τ Shear stress P a
φ Metabolic consumption of oxygen m o l m 3 s

Appendix A

Appendix A.1. Summary of Model Microcarrier Types and Corresponding Parameters Available Within the Simulation

Microcarrier Type d m c ( μ m ) ρ m c ( k g m 3 ) MatrixReferences
Cytodex 1 190 ± 58 1.03 × 10 3 Dextran (positively charged)[19,62,63]
Cytodex 2 167.5 ± 32.5 1.04 × 10 3 Cotton cellulose[19,62,63]
Cytodex 3 175 ± 36 1.04 × 10 3 Dextran (collagen coated)[19,62,63]
Hillex II-170 170 ± 10 1.12 × 10 3 Polystyrene (cationic trimethyl ammonium coated)[64]
Pro-F 102-L ADCF 169 ± 44 1.02 × 10 3 Plastic (ProNectin F® coated)[63]
FACT 102-L 169 ± 44 1.02 × 10 3 Polystyrene (collagen coated)[63]
CGEN 102-L 169 ± 44 1.02 × 10 3 Polystyrene (collagen coated)[63]
Cytopore 1, 2 240 ± 40 1.03 × 10 3 Cellulose[19,62,63]
Cultispher G, S and GL 255 ± 125 1.04 × 10 3 Gelatin[17,19,62]
Ti-doped Phosphate Glass (Ti-7) 84.5 ± 21.5 2.75 × 10 3 Phosphate Glass and Titanium[65]

Appendix A.2. Summary of Model Medium and Corresponding Parameters Simulated [66]

Media ρ m e d i a ( k g m 3 ) μ m e d i a ( P a · s ) ν m e d i a ( m 2 s )
Water ( 37   ° C ) 9.93 × 10 2 6.91 × 10 4 6.96 × 10 7
Water ( 25   ° C ) 9.98 × 10 2 1.00 × 10 3 1.00 × 10 6
DMEM (high glucose & 0% FBS (v/v)) 1.00 × 10 3 7.31 × 10 4 7.31 × 10 7
DMEM (high glucose & 5% FBS (v/v)) 1.00 × 10 3 8.62 × 10 4 8.60 × 10 7
DMEM (high glucose & 10% FBS (v/v)) 1.01 × 10 3 9.30 × 10 4 9.22 × 10 7
DMEM (high glucose & 20% FBS (v/v)) 1.02 × 10 3 1.05 × 10 3 1.03 × 10 6

Appendix B. Full Derivation for Oxygen Diffusion Through Tissues

Equation (A1) details a modified Fick’s second law of diffusion for one-dimensional oxygen transport through a slab of cells with tissue thickness ‘ T ’, using the diffusion coefficient ‘ D ’ and the metabolic consumption of oxygen ‘ φ ’ [19]. φ is defined by Equation (A2) as a function of the oxygen consumption rate of a single cell ‘ s O C R ’ and the cell density within the tissue construct ‘ ρ c e l l s ’. The proposed simulation models the stationary phase of cell growth (steady state) so that the number of viable cells and thus, the cell density are approximately constant: ρ c e l l = 1.00 × 10 12   c e l l s / m 3 [24,25].
C t = φ D × 2 C T 2
φ = s O C R × ρ
To obtain the oxygen concentration at any point within the tissue, several boundary conditions must be applied. Firstly, the concentration of oxygen in the media ( C o ) at the surface of the microcarrier ( x = 0 ) is well-supplied and mixed so that it remains constant. Secondly, at the maximal tissue thickness ( T = T m a x ), oxygen is fully metabolised by the cells. Applying these conditions and integrating twice for steady-state conditions results in Equation (A3). Steady state formulae were required to mirror the stationary phase as it has the greatest number of cells and thus, the longest diffusion distance.
C ( x ) = φ T 2 2 D φ T x D + C o
For modelling purposes, microcarriers were assumed to be perfectly spherical with cells growing between microcarriers (cell-bridging) and evenly as confluent monolayers on the microcarrier surface [18]. Consequently, spherical coordinates are applied to Equation (A1) by the Laplacian operator; thus, oxygen diffusion in the radial ( r ), polar ( θ ) and azimuthal ( ) directions are incorporated into Equation (A4) [19].
C t = ( 1 r 2 × r ( r 2 × D × C r ) ) + ( 1 r 2 sin θ × θ ( sin θ × D × C θ ) ) + ( 1 r 2 sin 2 θ × 2 C 2 )
Several studies have highlighted oxygen diffusion in one-dimension is dominant providing accurate estimates for bioprocesses and nutrient transport [20,21,22]. However, by assuming polar and azimuthal symmetry, Equation (4) was simplified to Equation (A5) representing oxygen concentration varying with time as a function of radial diffusion. Additionally, at steady state ( C t = 0 ), the metabolic consumption of the cells is equal to the number of oxygen molecules diffusing into the tissue.
φ = ( 1 r 2 × r ( r 2 × D × C r ) )
It was assumed that the maximum consumption occurs at the deepest point of the tissue or aggregate ( r = 0 ) and thus, the oxygen concentration at the point in contact with the media ( r = R ) was constant. Equation (A5) was integrated twice to give Equation (A6) which represents the concentration of oxygen along the radius of the tissue.
C ( r ) = φ 6 D × ( r 2 R 2 ) + C o
To calculate the minimum oxygen supply ( C m i n ) required to reach the deepest part of the tissue ( r = 0 ) Equation (A6) was rearranged to Equation (A7) assuming that all oxygen is consumed at this point ( C ( 0 ) = 0 ). Equation (A7) highlights the rather well-accepted relationship between the minimum oxygen concentration required to reach all cells within a tissue ( C m i n ) and the metabolic consumption ( φ ), diffusivity ( D ) and the maximum diffusion distance ( R ).
C m i n = φ 6 D × ( R 2 )

Appendix C. Geometric Parameters for Flat-Bottom, Cylindrical Vessel with Four Baffles of Width 1/10 the Tank Diameter and a Liquid Height Equal to the Tank Diameter Bioreactors Used for in Equation (9) [34,35]

Impeller Type d i m p e l l e r d t a n k c i m p e l l e r d t a n k S P 0  at Turbulent Flow
Rushton0.250.2512.006.00
0.330.175.806.00
0.330.256.706.00
0.330.508.006.00
0.500.254.256.00
0.500.173.906.00
Propeller0.330.256.600.90
Pitched-blade turbine, Downward pumping, 4 blades, 45 degrees0.330.205.701.27
0.330.256.201.27
0.330.336.801.27
0.330.5011.501.27
0.500.255.801.27
Pitched-blade turbine, Downward pumping, 6 blades, 45 degrees0.500.255.701.64
Pitched-blade turbine, Upward pumping, 6 blades, 45 degrees0.500.256.901.64

Appendix D. Power Requirements Based on Agitation Speed for Transient Regions

The impeller width (estimated as 20% of impeller diameter) ( w i m p e l l e r ), diameter ( d i m p e l l e r ), the number of blades ( n i m p e l l e r ) and the angle of blades are all needed for sub-turbulent calculations. Correlations for P 0 in the transient regime are detailed in Equations (A8)–(A11) [35]. An initial agitator efficiency ( η e f f i e n c y ) of 80% was assumed for preliminary calculations.
P = P 0 × ρ m e d i a × ( N ) 3 × d i m p e l l e r 5 η e f f i e n c y
For Rushton impellers:
P 0 ( w i m p e l l e r d i m p e l l e r ) 1.45
For three to six bladed pitched-blade turbines (assumed same correlation for propellers):
P 0 ( n i m p e l l e r d i m p e l l e r ) 0.8
For four bladed pitched-blade turbines:
P 0 ( w i m p e l l e r d i m p e l l e r ) 0.65

References

  1. Blatchley, M.R.; Anseth, K.S. Middle-out methods for spatiotemporal tissue engineering of organoids. Nat. Rev. Bioeng. 2023, 1, 329–345. [Google Scholar] [CrossRef] [Scilit] [PubMed]
  2. Almeida, A.M.; Mazeda, J.; Pinho, A.R.; Gomes, M.C.; Mano, J.F. The future of automated tissue engineering: Robotic-assisted strategies for complex 3D tissue bottom-up assembly. Adv. Mater. Technol. 2025, 10, 70000. [Google Scholar] [CrossRef] [Scilit]
  3. Cho, S.; Discher, D.E.; Leong, K.W.; Vunjak-Novakovic, G.; Wu, J.C. Challenges and opportunities for the next generation of cardiovascular tissue engineering. Nat. Methods 2022, 19, 1064–1071. [Google Scholar] [CrossRef] [Scilit]
  4. Kasoju, N.; Sunilkumar, A. Convergence of tissue engineering and sustainable development goals. Biotechnol. Sustain. Mater. 2024, 1, 20. [Google Scholar] [CrossRef] [Scilit]
  5. Gomes, V.; Salgueiro, S.P. From small to large-scale: A review of recombinant spider silk and collagen bioproduction. Discov. Mater. 2022, 2, 3. [Google Scholar] [CrossRef] [Scilit]
  6. Chen, L.; Zhang, Y.; Chen, Z.; Dong, Y.; Jiang, Y.; Hua, J.; Liu, Y.; Osman, A.I.; Farghali, M.; Huang, L.; et al. Biomaterials technology and policies in the building sector: A review. Environ. Chem. Lett. 2024, 22, 715–750. [Google Scholar] [CrossRef] [Scilit]
  7. Major, G.S.; Doan, V.K.; Longoni, A.; Bilek, M.M.; Wise, S.G.; Rnjak-Kovacina, J.; Yeo, G.C.; Lim, K.S. Mapping the microcarrier design pathway to modernise clinical mesenchymal stromal cell expansion. Trends Biotechnol. 2024, 42, 859–876. [Google Scholar] [CrossRef] [Scilit] [PubMed]
  8. Li, F.; Vijayasankaran, N.; Shen, A.; Kiss, R.; Amanullah, A. Cell culture processes for monoclonal antibody production. mAbs 2010, 2, 466–479. [Google Scholar] [CrossRef] [Scilit]
  9. Wu, C.Y.; Stoecklein, D.; Kommajosula, A.; Lin, J.; Owsley, K.; Ganapathysubramanian, B.; Di Carlo, D. Shaped 3D microcarriers for adherent cell culture and analysis. Microsyst. Nanoeng. 2018, 4, 21. [Google Scholar] [CrossRef] [Scilit]
  10. Dong, B.; Wang, R.; Guan, Y.; Zhao, X.; Li, R.; Xu, Q.; Tang, N. Engineering AQP1-deficient DF-1 suspension cells for high-yield IBDV production and vaccine scale-up. Vaccines 2025, 14, 52. [Google Scholar] [CrossRef] [Scilit]
  11. Zhou, X.; Zheng, H.; Wu, Y.; Yin, H.; Mao, X.; Li, N.; Guo, H.; Chang, Y.; Jiang, X.; Ai, Q.; et al. Scalable production of muscle and adipose cell-laden microtissues using edible macroporous microcarriers for 3D printing of cultured fish fillets. Nat. Commun. 2025, 16, 1740. [Google Scholar] [CrossRef] [Scilit]
  12. Maillot, C.; De Isla, N.; Loubiere, C.; Toye, D.; Olmos, E. Impact of microcarrier concentration on mesenchymal stem cell growth and death: Experiments and modeling. Biotechnol. Bioeng. 2022, 119, 3537–3548. [Google Scholar] [CrossRef] [Scilit]
  13. Daňková, V.; Exnerová, A.; Vágnerová, H.; Pavlík, V.; Nešporová, K. Generation of bioactive stem cell-derived secretome in 3D bioreactor system: Towards cell-free therapy in veterinary medicine. Biomolecules 2025, 16, 2. [Google Scholar] [CrossRef] [Scilit] [PubMed]
  14. Rouwkema, J.; Koopman, B.F.J.M.; Van Blitterswijk, C.A.; Dhert, W.J.A.; Malda, J. Supply of nutrients to cells in engineered tissues. Biotechnol. Genet. Eng. Rev. 2009, 26, 163–178. [Google Scholar] [CrossRef] [Scilit] [PubMed]
  15. Xue, Y.; Georgakopoulou, T.; Van der Wijk, A.E.; Józsa, T.I.; Van Bavel, E.; Payne, S.J. Quantification of hypoxic regions distant from occlusions in cerebral penetrating arteriole trees. PLoS Comput. Biol. 2022, 18, e1010166. [Google Scholar] [CrossRef] [Scilit]
  16. Yang, J.; Guertin, P.; Jia, G.; Lv, Z.; Yang, H.; Ju, D. Large-scale microcarrier culture of HEK293T cells and Vero cells in single-use bioreactors. AMB Express 2019, 9, 70. [Google Scholar] [CrossRef] [Scilit] [PubMed]
  17. Zhang, B.; Lu, Q.; Dai, G.; Zhou, Y.; Ye, Q.; Zhou, Y.; Tan, W.S. Enhancing mesenchymal stem cells cultivated on microcarriers in spinner flasks via impeller design optimization for aggregated suspensions. Bioresour. Bioprocess. 2023, 10, 89. [Google Scholar] [CrossRef] [Scilit]
  18. Koh, B.; Sulaiman, N.; Fauzi, M.B.; Law, J.X.; Ng, M.H.; Idrus, R.B.H.; Yazid, M.D. Three dimensional microcarrier system in mesenchymal stem cell culture: A systematic review. Cell Biosci. 2020, 10, 75. [Google Scholar] [CrossRef] [Scilit]
  19. McMurtrey, R.J. Analytic models of oxygen and nutrient diffusion, metabolism dynamics, and architecture optimization in three-dimensional tissue constructs with applications and insights in cerebral organoids. Tissue Eng. Part C Methods 2016, 22, 221–249. [Google Scholar] [CrossRef] [Scilit]
  20. Brown, D.A.; MacLellan, W.R.; Laks, H.; Dunn, J.C.Y.; Wu, B.M.; Beygui, R.E. Analysis of oxygen transport in a diffusion-limited model of engineered heart tissue. Biotechnol. Bioeng. 2007, 97, 962–975. [Google Scholar]
  21. Napitupulu, G.; Nagi, A.; Putri, M.R.; Radjawane, I.M. The one-dimensional numerical model: An application to oxygen diffusion in mitochondria cell. ComTech Comput. Math. Eng. Appl. 2023, 14, 101–118. [Google Scholar] [CrossRef] [Scilit]
  22. Krogh, A. The number and distribution of capillaries in muscles with calculations of the oxygen pressure head necessary for supplying the tissue. J. Physiol. 1919, 52, 409. [Google Scholar] [CrossRef] [Scilit] [PubMed]
  23. Ferrari, C.; Balandras, F.; Guedon, E.; Olmos, E.; Chevalot, I.; Marc, A. Limiting cell aggregation during mesenchymal stem cell expansion on microcarriers. Biotechnol. Prog. 2012, 28, 780–787. [Google Scholar] [CrossRef] [Scilit]
  24. Botte, E.; Mancini, P.; Magliaro, C.; Ahluwalia, A. A sense of proximity: Cell packing modulates oxygen consumption. APL Bioeng. 2023, 7, 036111. [Google Scholar] [CrossRef] [Scilit] [PubMed]
  25. Watanabe, I.; Okada, S. Stationary phase of cultured mammalian cells (L5178Y). J. Cell Biol. 1967, 35, 285–294. [Google Scholar] [CrossRef] [Scilit] [PubMed]
  26. Alva, R.; Mirza, M.; Baiton, A.; Lazuran, L.; Samokysh, L.; Bobinski, A.; Stuart, J.A. Oxygen toxicity: Cellular mechanisms in normobaric hyperoxia. Cell Biol. Toxicol. 2023, 39, 111–143. [Google Scholar] [CrossRef] [Scilit]
  27. Balestra, C.; Mrakic-Sposta, S.; Virgili, F. Oxygen variations—Insights into hypoxia, hyperoxia and hyperbaric hyperoxia—Is the dose the clue? Int. J. Mol. Sci. 2023, 24, 13472. [Google Scholar] [CrossRef] [Scilit]
  28. Dunlap, R.A. The symmetry and packing fraction of the body centered tetragonal structure. Eur. J. Phys. Educ. 2012, 3, 19–24. [Google Scholar]
  29. Mukherji, D.; Strunz, P.; Piegert, S.; Gilles, R.; Hofmann, M.; Hölzel, M.; Rösler, J. The hexagonal close-packed (hcp)⇆ face-centered cubic (fcc) transition in Co-Re-based experimental alloys investigated by neutron scattering. Metall. Mater. Trans. A 2012, 43, 1834–1844. [Google Scholar] [CrossRef] [Scilit]
  30. Merten, O.W. Advances in cell culture: Anchorage dependence. Philos. Trans. R. Soc. B Biol. Sci. 2015, 370, 20140040. [Google Scholar] [CrossRef] [Scilit]
  31. Liste-Calleja, L.; Lecina, M.; Cairó, J.J. HEK293 cell culture media study: Increasing cell density for different bioprocess applications. BMC Proc. 2013, 7, P51. [Google Scholar] [CrossRef] [Scilit]
  32. Aida, M.; Murakami, Y.; Shono, A. Estimation of the just suspension speed of mixed particles in a solid-liquid stirred tank. J. Chem. Eng. Jpn. 2023, 56, 2197949. [Google Scholar] [CrossRef] [Scilit]
  33. Zwietering, T.N. Suspending of solid particles in liquid by agitators. Chem. Eng. Sci. 1958, 8, 244–253. [Google Scholar] [CrossRef] [Scilit]
  34. Doran, P.M. Bioprocess Engineering Principles, 2nd ed.; Elsevier: Waltham, MA, USA, 2013. [Google Scholar]
  35. Hall, S. Blending and agitation. In Branan’s Rules of Thumb for Chemical Engineers; Elsevier: Amsterdam, The Netherlands, 2012; pp. 257–279. [Google Scholar]
  36. Van Hemert, P.; Kilburn, D.G.; Van Wezel, A.L. Homogeneous cultivation of animal cells for the production of virus and virus products. Biotechnol. Bioeng. 1969, 11, 875–885. [Google Scholar] [CrossRef] [Scilit]
  37. Nienow, A.W. Hydrodynamics of stirred bioreactors. Appl. Mech. Rev. 1998, 51, 3–32. [Google Scholar] [CrossRef] [Scilit]
  38. Croughan, M.S.; Hamel, J.F.; Wang, D.I.C. Hydrodynamic effects on animal cells grown in microcarrier cultures. Biotechnol. Bioeng. 1987, 29, 130–141. [Google Scholar] [CrossRef] [Scilit]
  39. Croughan, M.S.; Sayre, E.S.; Wang, D.I.C. Viscous reduction of turbulent damage in animal cell culture. Biotechnol. Bioeng. 1989, 33, 862–872. [Google Scholar] [CrossRef] [Scilit] [PubMed]
  40. Preissmann, A.; Wiesmann, R.; Buchholz, R.; Werner, R.G.; Noé, W. Investigations on oxygen limitations of adherent cells growing on macroporous microcarriers. Cytotechnology 1997, 24, 121–134. [Google Scholar] [CrossRef] [Scilit]
  41. Rafiq, Q.A.; Coopman, K.; Nienow, A.W.; Hewitt, C.J. Systematic microcarrier screening and agitated culture conditions improves human mesenchymal stem cell yield in bioreactors. Biotechnol. J. 2016, 11, 473–486. [Google Scholar] [CrossRef] [Scilit] [PubMed]
  42. Huang, L.; Abdalla, A.M.; Xiao, L.; Yang, G. Biopolymer-based microcarriers for three-dimensional cell culture and engineered tissue formation. Int. J. Mol. Sci. 2020, 21, 1895. [Google Scholar] [CrossRef] [Scilit]
  43. Reddy, M.S.; Ponnamma, D.; Choudhary, R.; Sadasivuni, K.K. A comparative review of natural and synthetic biopolymer composite scaffolds. Polymers 2021, 13, 1105. [Google Scholar] [CrossRef] [Scilit]
  44. Sun, T.; Xiang, Y.; Turner, F.; Bao, X. Integrated experimental and mathematical exploration of modular tissue cultures for developmental engineering. Int. J. Mol. Sci. 2024, 25, 2987. [Google Scholar] [CrossRef] [Scilit]
  45. Ng, Y.C.; Berry, J.M.; Butler, M. Optimization of physical parameters for cell attachment and growth on macroporous microcarriers. Biotechnol. Bioeng. 1996, 50, 627–635. [Google Scholar] [CrossRef] [Scilit]
  46. Grein, T.A.; Loewe, D.; Dieken, H.; Weidner, T.; Salzig, D.; Czermak, P. Aeration and shear stress are critical process parameters for the production of oncolytic measles virus. Front. Bioeng. Biotechnol. 2019, 7, 78. [Google Scholar] [CrossRef] [Scilit]
  47. Ebrahimian, A.; Schalk, M.; Dürkop, M.; Maurer, M.; Bliem, R.; Kühnel, H. Seed train optimization in microcarrier-based cell culture post in situ cell detachment through scale-down hybrid modeling. Bioengineering 2024, 11, 268. [Google Scholar] [CrossRef] [Scilit] [PubMed]
  48. Cherry, R.S.; Papoutsakis, E.T. Shear and mixing effects on cells in agitated microcarrier tissue culture reactors. In Proceedings of the Space Bioreactor Science Workshop, NASA Lyndon B. Johnson Space Center, Houston, TX, USA, 1 December 1987. [Google Scholar]
  49. Jenish, I.; Appadurai, M.; Raj, E.F. CFD analysis of modified Rushton turbine impeller. Int. J. Sci. Manag. Stud. 2021, 4, 8–13. [Google Scholar] [CrossRef] [Scilit]
  50. Cherry, R.S.; Papoutsakis, E.T. Hydrodynamic effects on cells in agitated tissue culture reactors. Bioprocess Eng. 1986, 1, 29–41. [Google Scholar] [CrossRef] [Scilit]
  51. Ibrahim, S.; Nienow, A.W. Suspension of microcarriers for cell culture with axial flow impellers. Chem. Eng. Res. Des. 2004, 82, 1082–1088. [Google Scholar] [CrossRef] [Scilit]
  52. Bernauer, S.; Eibl, P.; Witz, C.; Khinast, J.; Hardiman, T. Analyzing the effect of using axial impellers in large-scale bioreactors. Biotechnol. Bioeng. 2022, 119, 2494–2504. [Google Scholar] [CrossRef] [Scilit]
  53. Ramírez, L.A.; Pérez, E.L.; García Díaz, C.; Camacho Luengas, D.A.; Ratkovich, N.; Reyes, L.H. CFD and experimental characterization of a bioreactor: Analysis via power curve, flow patterns and kLa. Processes 2020, 8, 878. [Google Scholar] [CrossRef] [Scilit]
  54. Kaiser, S.C.; Werner, S.; Jossen, V.; Kraume, M.; Eibl, D. Development of a method for reliable power input measurements in conventional and single-use stirred bioreactors at laboratory scale. Eng. Life Sci. 2017, 17, 500–511. [Google Scholar] [CrossRef] [Scilit]
  55. Zhou, Z.; Wu, W.; Fang, J.; Yin, J. Polymer-based porous microcarriers as cell delivery systems for applications in bone and cartilage tissue engineering. Int. Mater. Rev. 2021, 66, 77–113. [Google Scholar] [CrossRef] [Scilit]
  56. Verdú-Navarro, F.; Moreno-Cid, J.A.; Weiss, J.; Egea-Cortines, M. Cascade oxygen control enhances growth of Nicotiana benthamiana cell cultures in stirred-tank bioreactors. Plants 2025, 14, 2879. [Google Scholar] [CrossRef] [Scilit] [PubMed]
  57. Birmingham, J. Impact of Surface Aeration on Scale-Up with Aerobic Bioreactors. Ph.D. Thesis, University of Delaware, Newark, DE, USA, 2014. [Google Scholar]
  58. Flagiello, D.; Parisi, A.; Lancia, A.; Di Natale, F. A review on gas–liquid mass transfer coefficients in packed-bed columns. ChemEngineering 2021, 5, 43. [Google Scholar] [CrossRef] [Scilit]
  59. Uyar, B.; Ali, M.D.; Uyar, G.E.O. Design parameters comparison of bubble column, airlift and stirred tank photobioreactors for microalgae production. Bioprocess Biosyst. Eng. 2024, 47, 195–209. [Google Scholar] [CrossRef] [Scilit]
  60. Walls, P.L.; McRae, O.; Natarajan, V.; Johnson, C.; Antoniou, C.; Bird, J.C. Quantifying the potential for bursting bubbles to damage suspended cells. Sci. Rep. 2017, 7, 15102. [Google Scholar] [CrossRef] [Scilit] [PubMed]
  61. Mesa, D.; Brito-Parada, P.R. Bubble size distribution in aerated stirred tanks: Quantifying the effect of impeller-stator design. Chem. Eng. Res. Des. 2020, 160, 356–369. [Google Scholar] [CrossRef] [Scilit]
  62. Chen, X.Y.; Chen, J.Y.; Tong, X.M.; Mei, J.G.; Chen, Y.F.; Mou, X.Z. Recent advances in the use of microcarriers for cell cultures and their ex vivo and in vivo applications. Biotechnol. Lett. 2020, 42, 1–10. [Google Scholar] [CrossRef] [Scilit]
  63. Serra, A.T.; Serra, M.; Silva, A.C.; Brckalo, T.; Seshire, A.; Brito, C.; Wolf, M.; Alves, P.M. Scalable culture strategies for the expansion of patient-derived cancer stem cell lines. Stem Cells Int. 2019, 2019, 8347595. [Google Scholar] [CrossRef] [Scilit]
  64. Mel, M.; Karim, M.I.A.; Yusuf, S.A.M.; Hashim, Y.Z.H.Y.; Ahmad Nor, Y. Comparing BRIN-BD11 culture producing insulin using different type of microcarriers. Cytotechnology 2010, 62, 423–430. [Google Scholar] [CrossRef] [Scilit]
  65. De Silva Thompson, D.; Peticone, C.; Burova, I.; Shipley, R.J.; Knowles, J.C.; Kim, H.W.; Micheletti, M.; Wall, I.B. Assessing behaviour of osteoblastic cells in dynamic culture conditions using titanium-doped phosphate glass microcarriers. J. Tissue Eng. 2019, 10, 2041731419825772. [Google Scholar] [CrossRef] [Scilit]
  66. Poon, C. Measuring the density and viscosity of culture media for optimized computational fluid dynamics analysis of in vitro devices. J. Mech. Behav. Biomed. Mater. 2022, 126, 105024. [Google Scholar] [CrossRef] [Scilit] [PubMed]
Figure 1. (A) Cross-section (left) and 3D rendering of nine microcarriers (n = 9) (grey) arranged in body-centred cubic (BCC) packing configuration. The microcarrier surfaces and the gaps between them are colonised by cells (green). The centroid of the structure is indicated in red (with coordinates x ¯ ,   y ¯ ,   z ¯ ) and the six possible surface migration points are highlighted in blue. (B) Comparison of the influence of the number of microcarriers in different aggregates—each composed of the same type of microcarrier—on the minimum oxygen concentration at the centre of the aggregates required to sustain cell survival.
Processes 14 01219 g001
Figure 2. (A) Comparison of the influence of the number of microcarriers in aggregates with different packing configurations—hexagonal close packing (HCP), face-centred cubic (FCC), and body-centred cubic (BCC)—each composed of the same type of Cultispher G, S, or GL microcarrier, on the oxygen diffusion distance from the surrounding cell culture medium to the aggregate centroid (excluding the monolayer cell thickness on the microcarrier surfaces). (B) Three-dimensional (3D) rendering of a square bipyramidal structure formed by six microcarriers ( n = 6 ) arranged in BCC and FCC packing configurations. The centre of the aggregate is highlighted in red.
Processes 14 01219 g002
Figure 3. (A) Comparison of the influence of the number of microcarriers in different aggregates—each composed of the same type of microcarrier—on the minimum stirring speed (RPM) or energy input in stirred tank reactors required to prevent the aggregates from remaining motionless at the bottom of the reactor for more than two seconds. (B) Comparison of the influence of the number of microcarriers in different aggregates—each composed of the same type of microcarrier—on the volume of monolayer cells colonizing the surfaces of the microcarriers within the aggregates.
Processes 14 01219 g003
Figure 4. (A) Comparison of the influence of minimum stirring speed (RPM) or energy input in stirred tank reactors, under different impeller types and impeller-to-tank diameter ratios, on the resulting Kolmogorov length scales. (B) Three-dimensional (3D) rendering of fifteen microcarriers ( n = 15 ) arranged in a body-centred cubic (BCC) packing configuration, with ‘cell bridging’ represented as tangential connections (green). The relocated centroid in the positive z -direction is indicated in red, together with the calculated maximum diffusion distance ( R ).
Processes 14 01219 g004
Table 1. Influence of different stirring speeds (RPM) or energy inputs required to suspend various types of microcarriers in DMEM cell culture medium supplemented with 0% or 20% fetal bovine serum (FBS) in stirred tank reactors with an impeller-to-tank diameter ratio of 0.33 ( 0.33 d t a n k ) on the potential damage to cells cultured on the suspended microcarriers. Cell damage was estimated by comparing the resulting Kolmogorov length scales ( λ K ) with the microcarrier diameters. Based on this comparison, the potential levels of cell damage were categorised as low ( 2 3 d m c < λ K d m c ) , medium ( 1 2 d m c < λ K 2 3 d m c ) , and high ( λ K 1 2 d m c ) .
DMEM (0% FBS (v/v))DMEM (20% FBS (v/v))
Kolmogorov Risk
Microcarrier TypeLowModerateHighLowModerateHigh
Cytodex 26010315184144212
Hillex II-1705910114883142208
Cytopore 1, 23764945290131
Cultispher G, S and GL3559864883121
Ti-doped Phosphate Glass (Ti-7)149256375209359>400
Table 2. Influence of different impeller types and impeller-to-tank diameter ratios on the critical stirring speeds (RPM) or energy inputs required for the culture of Mesenchymal Stem Cells (MSCs) using Cytodex 3 microcarriers suspended in a 6 m3 flat-bottom cylindrical stirred tank reactor equipped with four baffles (baffle width = 0.1 d t a n k ), an impeller clearance of 0.25 d t a n k , and a liquid height equal to d t a n k [34,35].
Impeller Type d i m p e l l e r d t a n k N m i n N t u r b u l e n c e
Rushton0.25
0.33
0.50
19.78
18.53
12.90
16.25
9.92
4.23
Propeller0.3318.259.92
Pitched-blade turbine, Downward
pumping, 4 blades, 45 degrees
0.33
0.50
17.14
13.09
9.92
4.23
Pitched-blade turbine, Downward
pumping, 6 blades, 45 degrees
0.5010.974.23
Pitched-blade turbine, Upward
pumping, 6 blades, 45 degrees
0.5013.284.23
Disclaimer/Publisher’s Note: The statements, opinions and data contained in all publications are solely those of the individual author(s) and contributor(s) and not of MDPI and/or the editor(s). MDPI and/or the editor(s) disclaim responsibility for any injury to people or property resulting from any ideas, methods, instructions or products referred to in the content.