Article

An Electric-Field-Based Detection System for Metallic Contaminants in Powdered Food

1
Department of Smart Agriculture Systems, Chungnam National University, Daejeon 34134, Republic of Korea
2
Department of Smart Agricultural System Machinery Engineering, Chungnam National University, Daejeon 34134, Republic of Korea
3
Neo Lab Tech, Daejeon 34344, Republic of Korea
4
Department of National Public Policy, Graduate School, Chungnam National University, Daejeon 34134, Republic of Korea
*
Authors to whom correspondence should be addressed.
Processes 2026, 14(6), 922; https://doi.org/10.3390/pr14060922
Submission received: 3 February 2026 / Revised: 5 March 2026 / Accepted: 11 March 2026 / Published: 13 March 2026
(This article belongs to the Special Issue Development of Innovative Processes in Food Engineering)

Abstract

Metallic contaminants in powdered foods represent a serious safety concern. Therefore, effective detection is crucial for food safety. This study aimed to develop an electric-field-based detection system and quantitatively evaluate its performance. An alternating (+/−) electrode array (gap 1–2 mm) was designed, and resonance analysis identified 15 kHz with a 2 mm gap as the optimal operating condition. Using an IGBT-based high-voltage source, 1.35 kV was selected to ensure stable operation without partial discharge. A real-time algorithm based on a minimum current-change threshold was implemented, and detection responses to stainless steel (SUS), aluminum (Al), and copper (Cu) particles in three size classes (<0.5, 0.5–1.0, and 1.0–2.0 mm) were evaluated using hit/miss modeling and logistic regression to obtain probability-of-detection (POD) curves and limits of detection (LOD). The system achieved POD ≥ 0.9 for 1.0–2.0 mm particles; in the 0.5–1.0 mm range, observed POD values were 84%, 90%, and 68% for SUS, Al, and Cu, respectively. Safety was assessed by COMSOL-based localized heating simulation validated by infrared thermography and by ozone monitoring for real-time operation. Compared with conventional inspection approaches, the proposed system provides a compact, cost-effective architecture while reporting inspection-oriented reliability metrics (POD/LOD) for process-line deployment.

1. Introduction

Powdered agricultural products have excellent storage stability, can be consumed directly or after simple reconstitution with water, and are highly portable in powder form [1]. Since the COVID-19 pandemic, growing interest in health and immune function has heightened the perceived importance of self-care, and this shift has contributed to increased demand for powdered agricultural products [2]. However, in recent years, multiple reports have described metallic contaminants in such products at levels dozens of times higher than regulatory limits, raising consumer concern about product quality and safety [3]. The main detected metallic particles include stainless steel (SUS), copper (Cu), and aluminum (Al). Stainless-steel contaminants are often present as fine iron (Fe) particulates generated by friction between raw materials and roll mills or cutting blades during size-reduction processes, whereas non-ferrous metallic contaminants such as Cu and Al may originate from the inner surfaces of primary packaging materials [4]. Metallic contaminants introduced at either the raw-material or processing stage may not be completely removed during the pre-treatment and manufacturing of powdered agricultural products and can remain in the final product, leading to quality deterioration after distribution and potential health risks for consumers. Indeed, previous studies have reported risks associated with metal ion release from ingested stainless-steel particles [5], adverse symptoms such as vomiting, nausea, kidney disease, and diarrhea following excessive copper intake [6], and cases of acute appendicitis caused by metallic foreign bodies [7], all of which underscore the potential health hazards posed by metallic contaminants in foods.
To address these issues, various metal detection and separation systems have been commercialized and implemented in food-processing lines, and they are recognized as core technologies for quality-control systems in powdered agricultural products. Balanced-coil [8] and multi-scan [9] metal detection systems use a high-frequency alternating magnetic field generated by coils. When metallic contaminants are present within the sensing region, eddy currents are induced in the metal, and the resulting signal is used to determine the presence of metallic contaminants and to reject contaminated products during the discharge process. Although metal detection is widely implemented, small-scale processors often face barriers to adoption and sustained operation due to resource constraints (time, cost, and access to technical expertise), which can limit implementation of inspection and verification programs [10]. In addition, the eddy-current signal decreases markedly as the size of the metallic contaminant decreases, which makes it inherently challenging to detect very small particles [11]. For these reasons, small-scale processors more commonly rely on magnetic separators. Magnetic separators employ permanent magnets or electromagnets with field strengths of approximately 10,000 Gauss to directly attract metallic contaminants with ferromagnetic properties and separate them from the product stream [12]. Because metallic contaminants can be physically removed before packaging, this approach is intuitively straightforward and is regarded as providing high detection accuracy. Nevertheless, metallic particles that adhere to the magnets during processing must be removed manually, necessitating periodic interruptions of the production line and thereby reducing productivity and operational efficiency [13]. Moreover, magnetic separation is inherently limited to ferromagnetic metals such as iron and some stainless steels, and is ineffective for non-ferrous metals such as aluminum and copper, which are non-magnetic and therefore difficult to detect and remove [14].
These technical limitations persist despite the efforts of food companies to reduce foreign matter contamination and, when combined with the economic constraints of raw-material suppliers and small-scale processors, make it difficult to fully eliminate the risk of metallic contamination in powdered agricultural products [15]. In powder-processing operations, the particulate nature of the raw materials also facilitates the deep embedding of metallic contaminants within the product bulk, such that relying solely on end-of-line detection and removal is insufficient for robust control. Therefore, there is a clear need for new detection and removal technologies that can be implemented in small-scale processing enterprises and can respond to a wide range of metallic contaminants, including both ferrous and non-ferrous metals. In this context, the present study proposes an electric-field-based vertical free-fall detection system for metallic contaminants. The objectives were (i) to design an electric-field-based detection module that utilizes current changes induced by the passage of metallic contaminants through an electric field as the detection signal, (ii) to establish power supply operating conditions optimized to the characteristics of the electrode plates, and (iii) to experimentally evaluate detection performance under powdered agricultural product processing conditions using inspection-oriented metrics, including probability of detection (POD) and limit of detection (LOD), as a function of particle size and metal type. Here, POD denotes the probability of detecting a particle of a given size under specified conditions, and LOD denotes the smallest particle size that satisfies a predefined detection decision criterion. POD and LOD were selected because they provide quantitative, inspection-relevant descriptors of reliability and sensitivity that support validation/verification of detection performance under fixed operating conditions. By reporting POD/LOD, the proposed system can be interpreted using the same logic as common inspection checks using defined test pieces and sensitivity targets, while also enabling quantitative comparison between different powder matrices.

2. Materials and Methods

2.1. Sample Preparation

The commercial powdered agricultural products distributed in Korea were classified into coarse and fine particle-size groups, and perilla powder (Cheongjeong Foods, Incheon, Republic of Korea) and turmeric powder (HelloGreen, Seoul, Republic of Korea) were selected as representative samples for each group, respectively. Perilla seed powder was prepared by collecting the fraction passing through a 10-mesh sieve, and turmeric powder was prepared by collecting the fraction passing through a 60-mesh sieve (HJS-10 and HJS-60; Heungjin, Gimpo, Republic of Korea). Both powders were stored at 4 °C and removed from cold storage only immediately before experiments.
Metallic contaminants were prepared using stainless steel (SUS), aluminum (Al), and copper (Cu). Stainless-steel and aluminum particles were obtained as machining chips, which were further ground and screened to obtain particles smaller than 2 mm. Copper particles were prepared by stripping the insulation from copper electrical wires, cutting the exposed conductor into segments shorter than 2 mm, and then subjecting them to an additional grinding step.
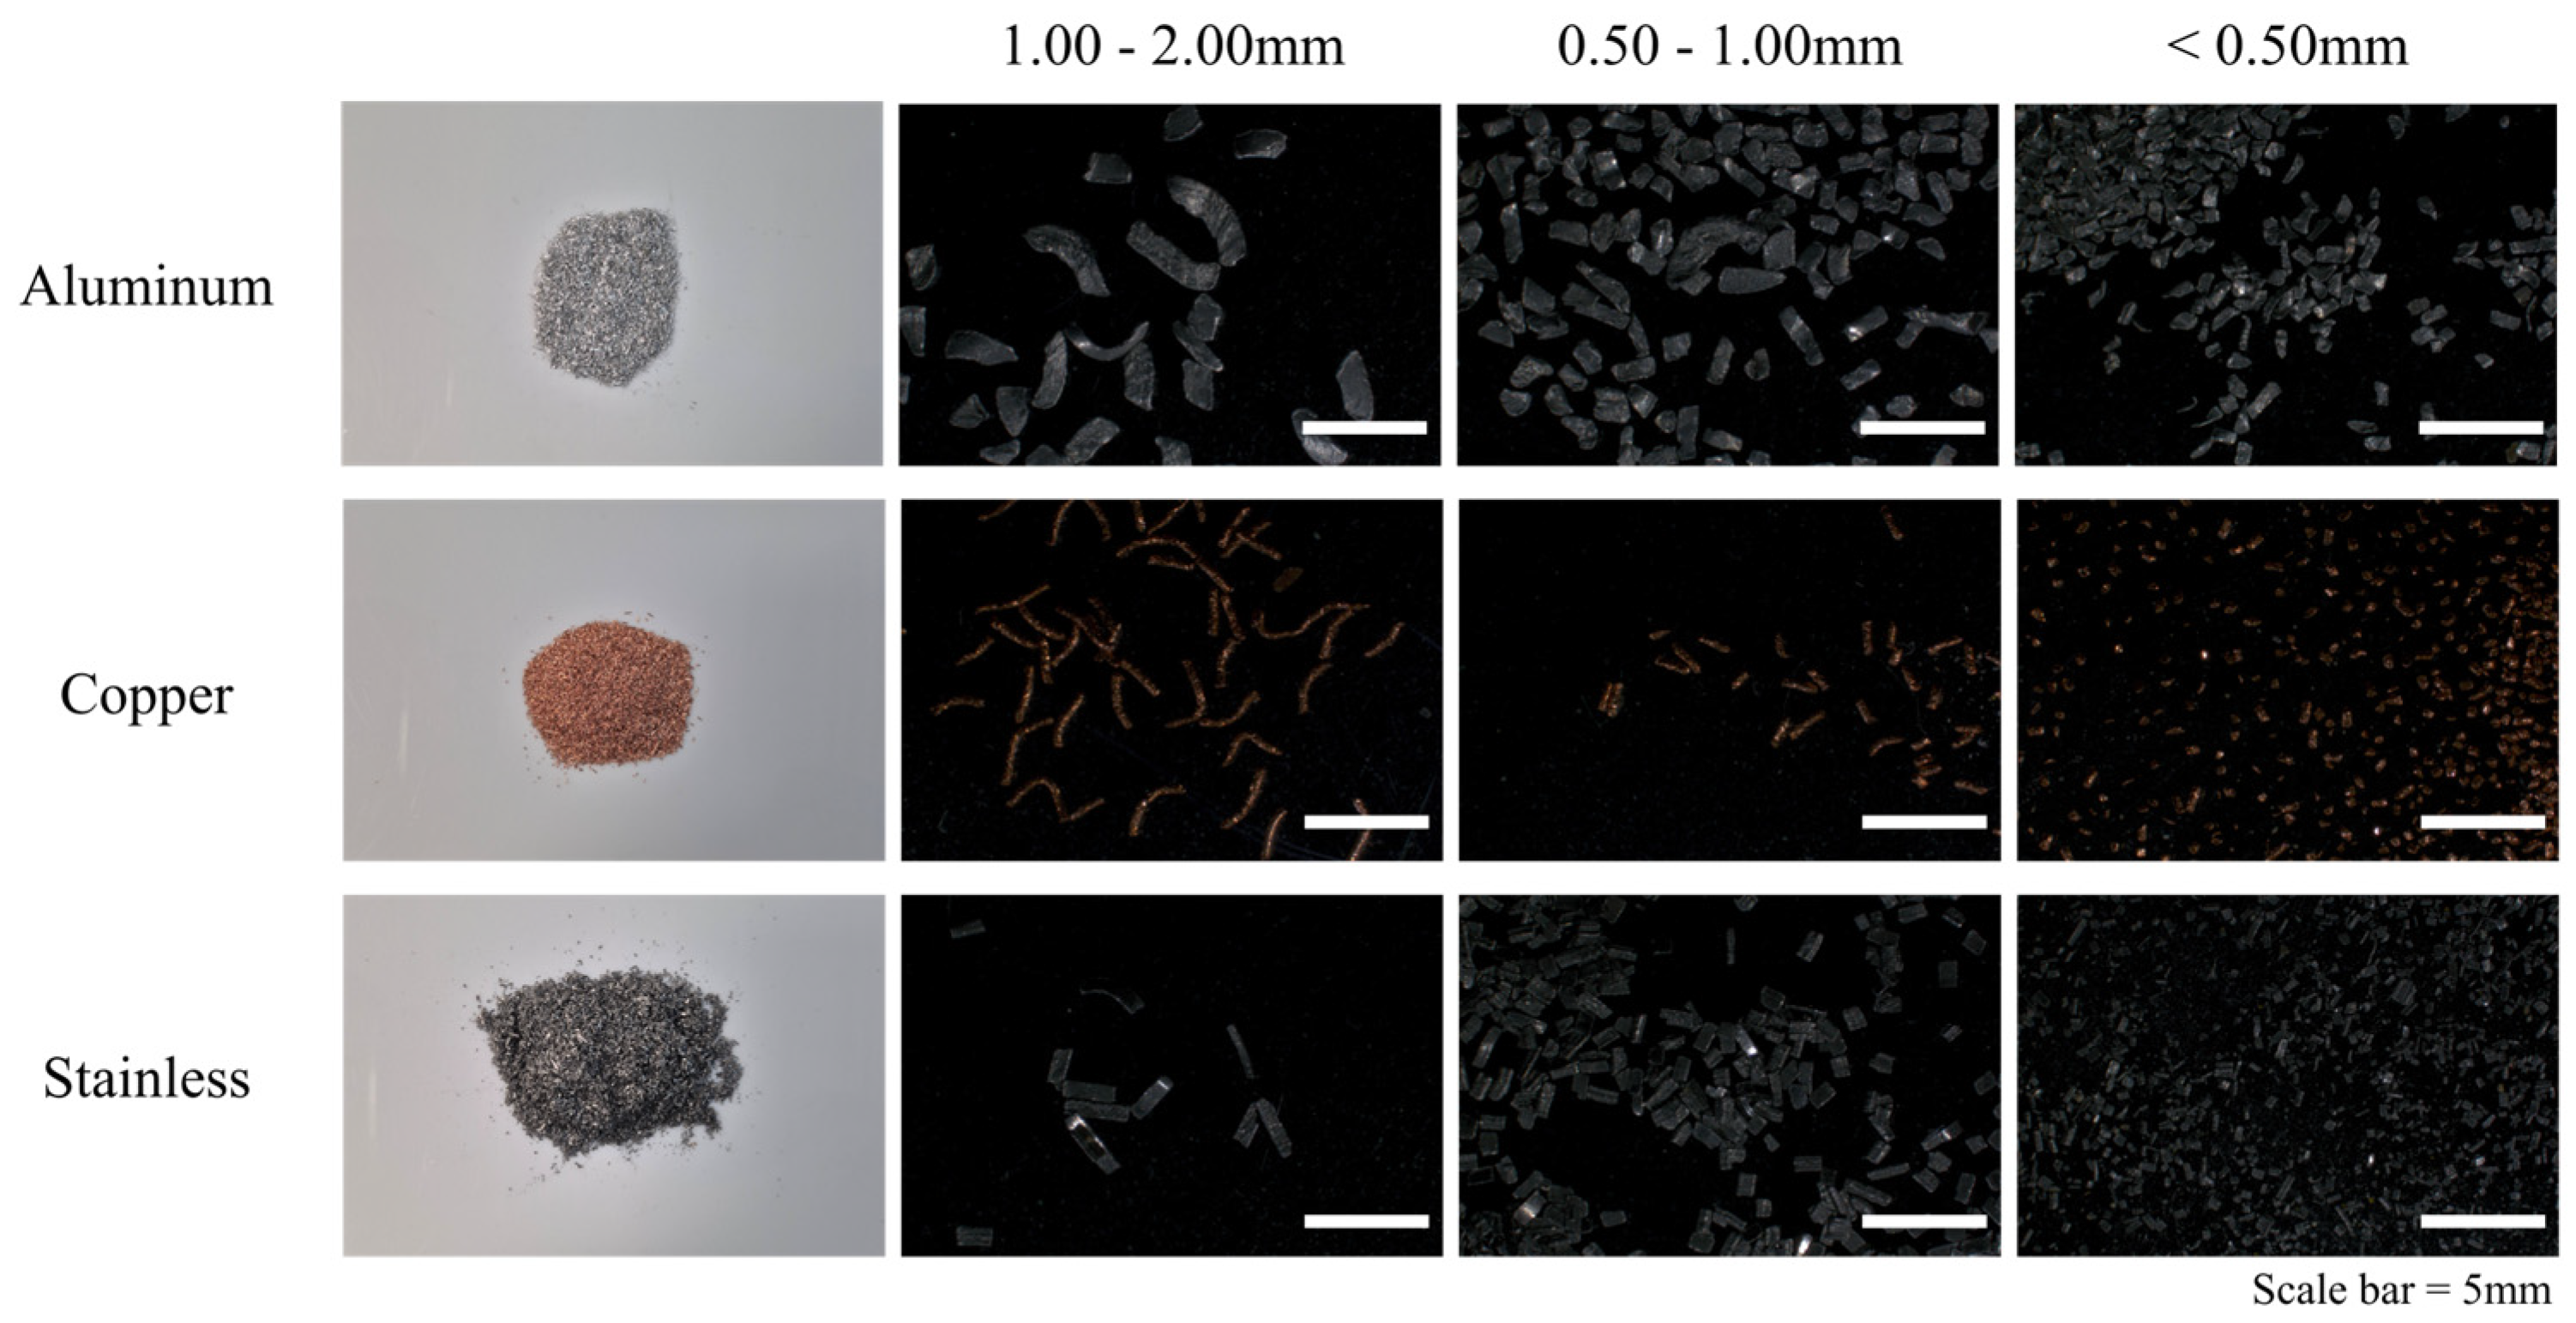
Size classification of the prepared metal particles was performed using stainless steel test sieves with nominal apertures of 2.00, 1.00, and 0.50 mm (HJS-10, HJS-18, HJS-35; Heungjin, Gimpo, Republic of Korea). Dried particles were evenly spread on the upper sieve, and a combination of horizontal shaking and light tapping was applied for 30–45 s per round, which was repeated 2–3 times. At the end of each round, the back of each sieve was gently tapped to facilitate particle transfer to the lower sieve or collection pan, and residues on the sieves and pan were removed between rounds to prevent cross-contamination. Based on the sieve fractionation results, particles were classified into three size classes: 1.00–2.00 mm (passing 2.00 mm and retained on 1.00 mm), 0.50–1.00 mm (passing 1.00 mm and retained on 0.50 mm), and <0.50 mm (passing 0.50 mm and retained in the pan). Representative images for each size class are shown in Figure 1 and were acquired using a Leica microscope system equipped with a DMC5400 camera (Leica Microsystems, Wetzlar, Germany).
For each metal type (SUS, Al, Cu) and each particle-size class (<0.50, 0.50–1.00, and 1.00–2.00 mm), spiked samples were prepared separately by adding 1 mg of the corresponding metal particles to 100 g of powder (10 mg/kg). The spiking level was selected based on the Ministry of Food and Drug Safety of Korea regulation on metallic foreign matter in foods [16].

2.2. Electric-Field-Based Detection Unit: Design and Configuration

2.2.1. Feeding Unit and Conveying Line

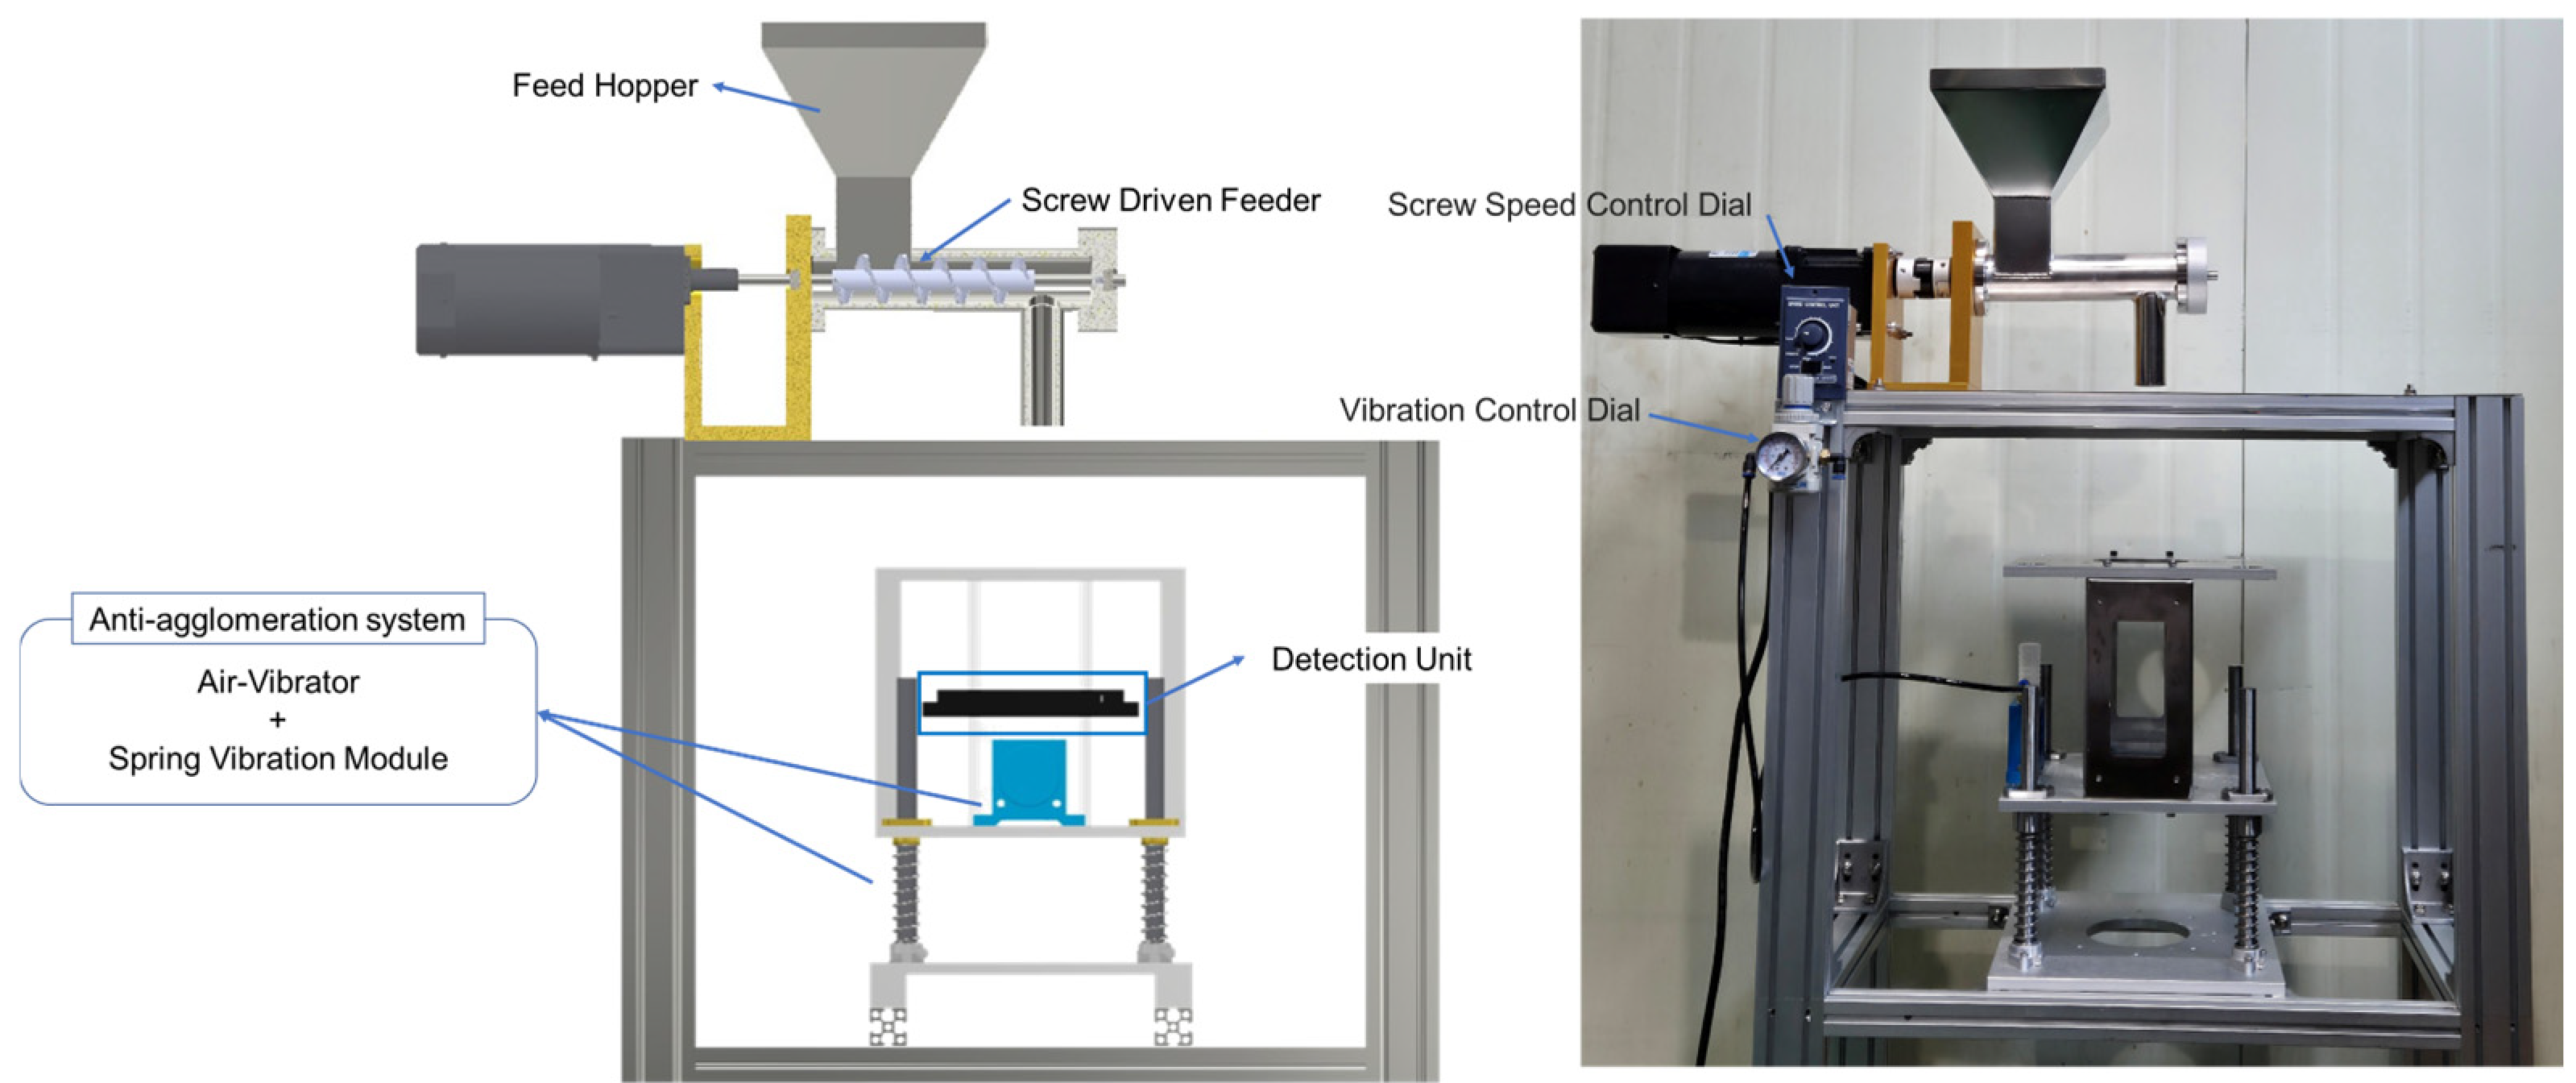
The feeding and conveying line consisted of a hopper, a screw feeder, and a spring-type anti-agglomeration system designed to relieve powder accumulation on the detection electrodes. The screw feeder was designed with a pitch of 30 mm and operated with variable rotational speed control, enabling stable adjustment of the powder throughput in the range of 7–10 kg/h.
The spring-type anti-agglomeration system comprised an air vibrator and a spring module, which imparted localized vibration to the electrode housing (detection unit) to rapidly break down powder build-up and bridging on the electrode surfaces. This configuration reduced the residence time of powder within the electrode gap and suppressed the formation of a continuous powder layer, thereby maintaining a near-monolayer passage of particles through the electric field. Vibration transfer was controlled using a spring decoupling structure that confined the transmission path and minimized propagation of vibration to the main frame.
The detection unit was installed in a straight section downstream of the screw discharge so that the powder layer passing between the electrodes maintained an approximately constant thickness as it traversed the electrode gap. A schematic and photograph of the feeding and conveying line are shown in Figure 2.

2.2.2. AC High-Voltage Power Supply

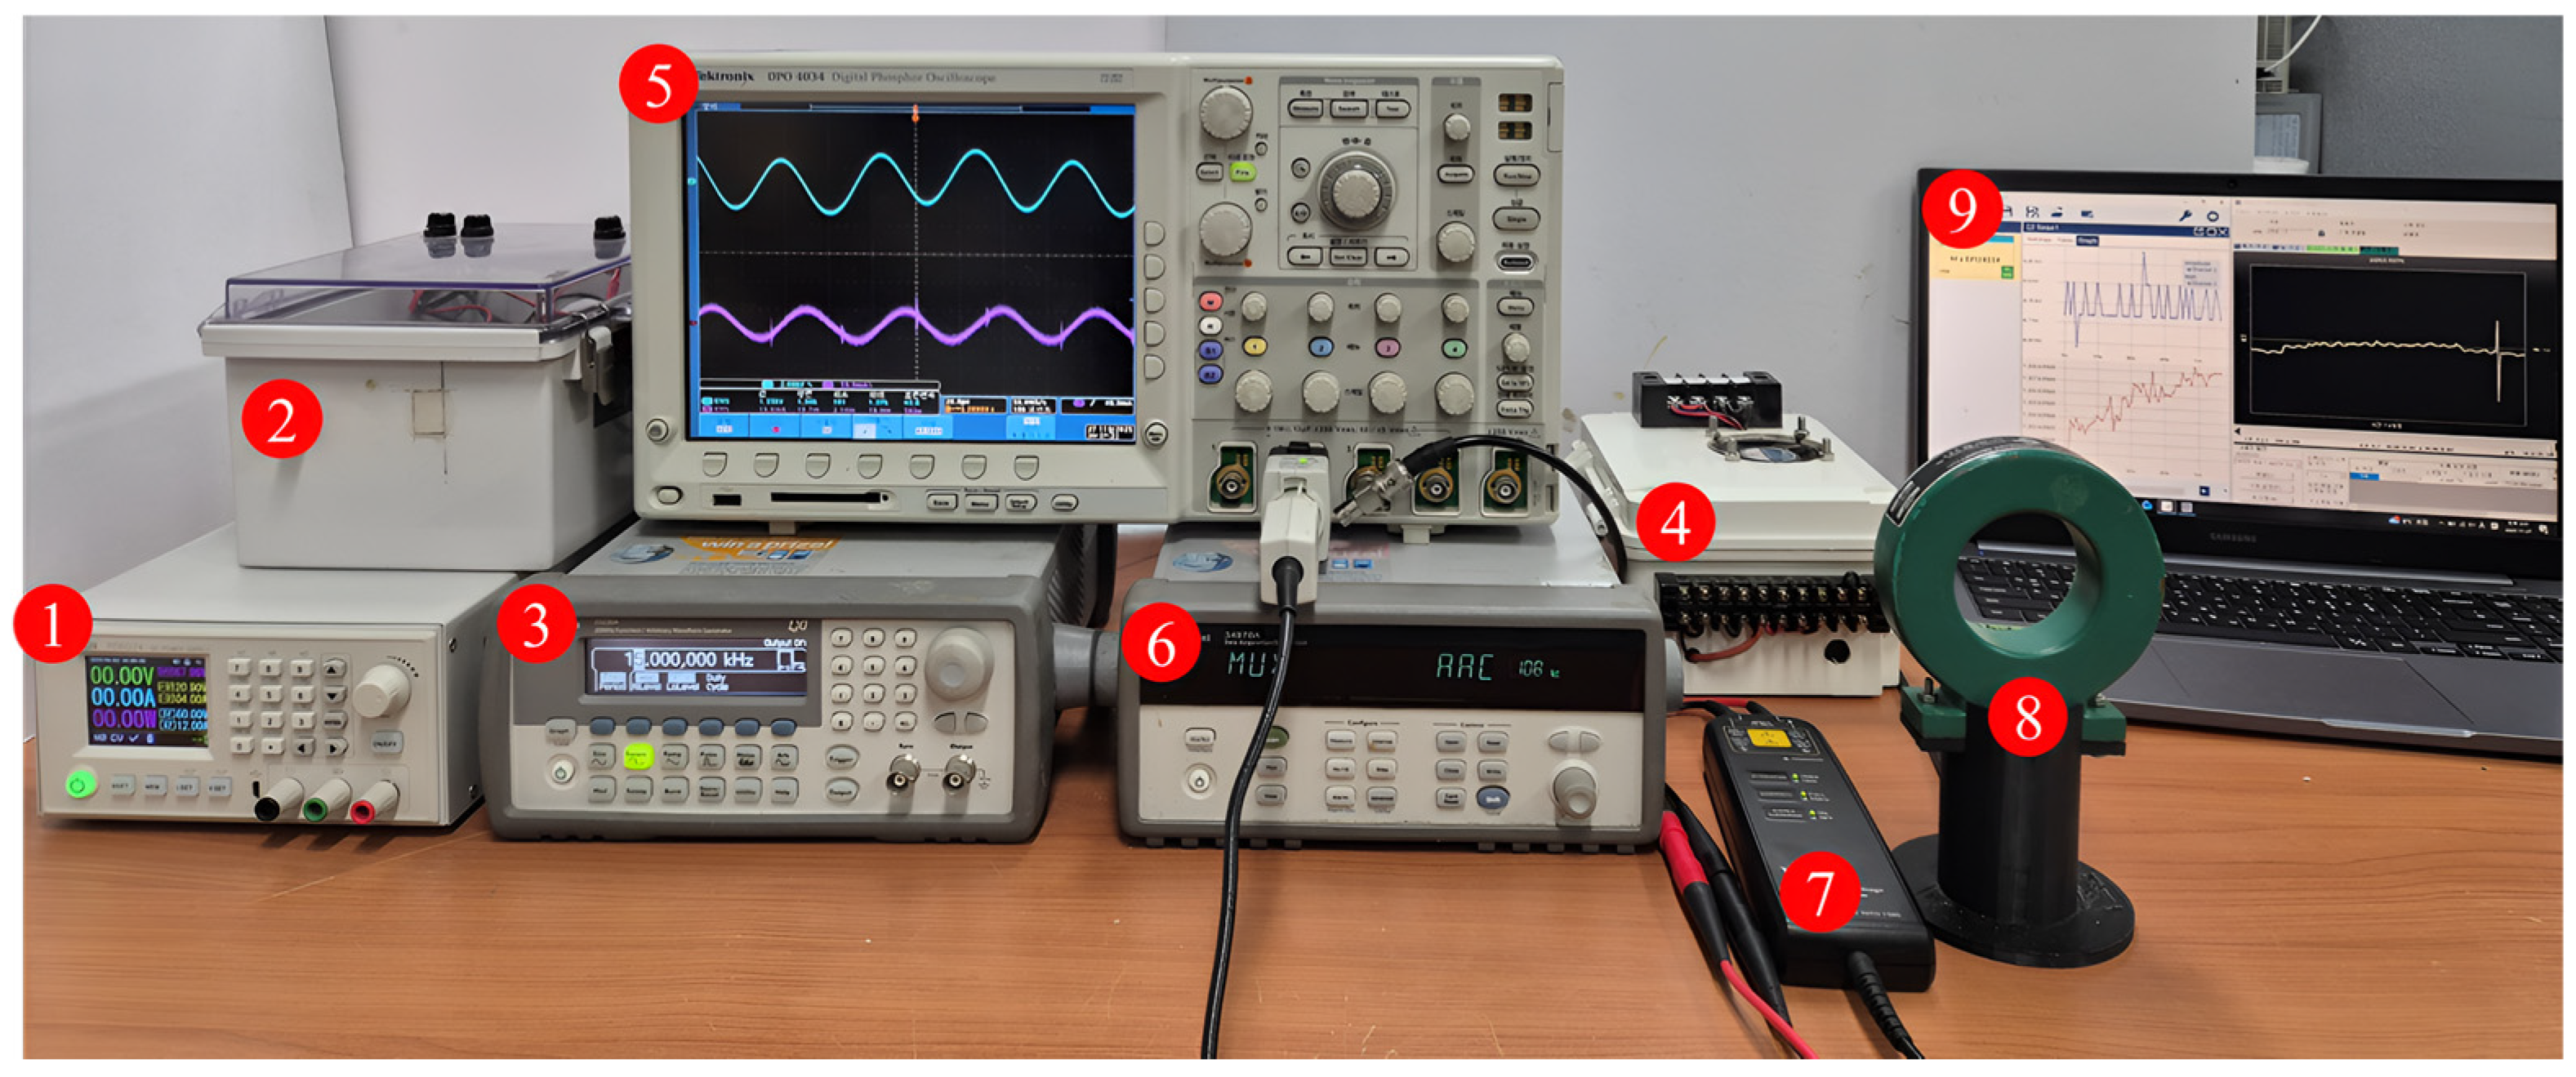
An insulated-gate bipolar transistor (IGBT)-based power supply was used to generate a high-frequency pulsed square-wave electric field for metallic contaminant detection. This configuration allowed control of the electric-field strength between the electrodes and enabled evaluation of detection performance as a function of the applied field intensity to determine optimal operating conditions. In addition, the IGBT-based stage enabled controlled high-voltage switching and stable excitation of the electrode–transformer network at the selected operating frequency, which is essential for maintaining voltage stability at the electrodes. During practical operation, metallic particle passage and intermittent discharge events can introduce rapid load variations; the IGBT-based driving stage mitigates voltage droop and fluctuation under such dynamic conditions, thereby improving electric-field stability. The overall layout of the power supply is shown in Figure 3.
The power supply unit consisted of (1) a DC power supply (RD6024, Hangzhou Ruideng Technology, Hangzhou, China), (2) a custom-built IGBT (insulated gate bipolar transistor) module, (3) a function generator (33220A, Agilent, Santa Clara, CA, USA), and (4) a high-voltage flyback transformer (FLYLABURN, Information Unlimited, Amherst, NH, USA). The DC power supply provided the input voltage to the IGBT module, while the function generator controlled the IGBT gate signal by adjusting the operating frequency (up to 20 kHz) and duty cycle, thereby producing a high-frequency pulsed square-wave output. The output of the IGBT module was stepped up by the flyback transformer to a maximum high voltage of 2000 V and applied to the electrode plates.
The high-voltage waveform applied to the electrodes was measured using (7) a differential probe (PR-60, B&K Precision, Yorba Linda, CA, USA), and the electrode current was monitored using (8) a current monitor (Model 150, Pearson Electronics, Palo Alto, CA, USA). Voltage and current waveforms were acquired with (5) an oscilloscope (DPO4034, Tektronix, Beaverton, OR, USA), and the same trigger pulse was simultaneously fed to (6) a data acquisition unit (DAQ; 34970A, Agilent, Santa Clara, CA, USA) to synchronize the time base. On the (9) PC, Keysight KickStart v.2 software (Keysight, Santa Rosa, CA, USA) was used for voltage logging and real-time waveform visualization, while Agilent BenchLink Data Logger (Agilent, Santa Clara, CA, USA) was used to acquire and display electrode current data in real time.

2.2.3. Design of the Detection Unit

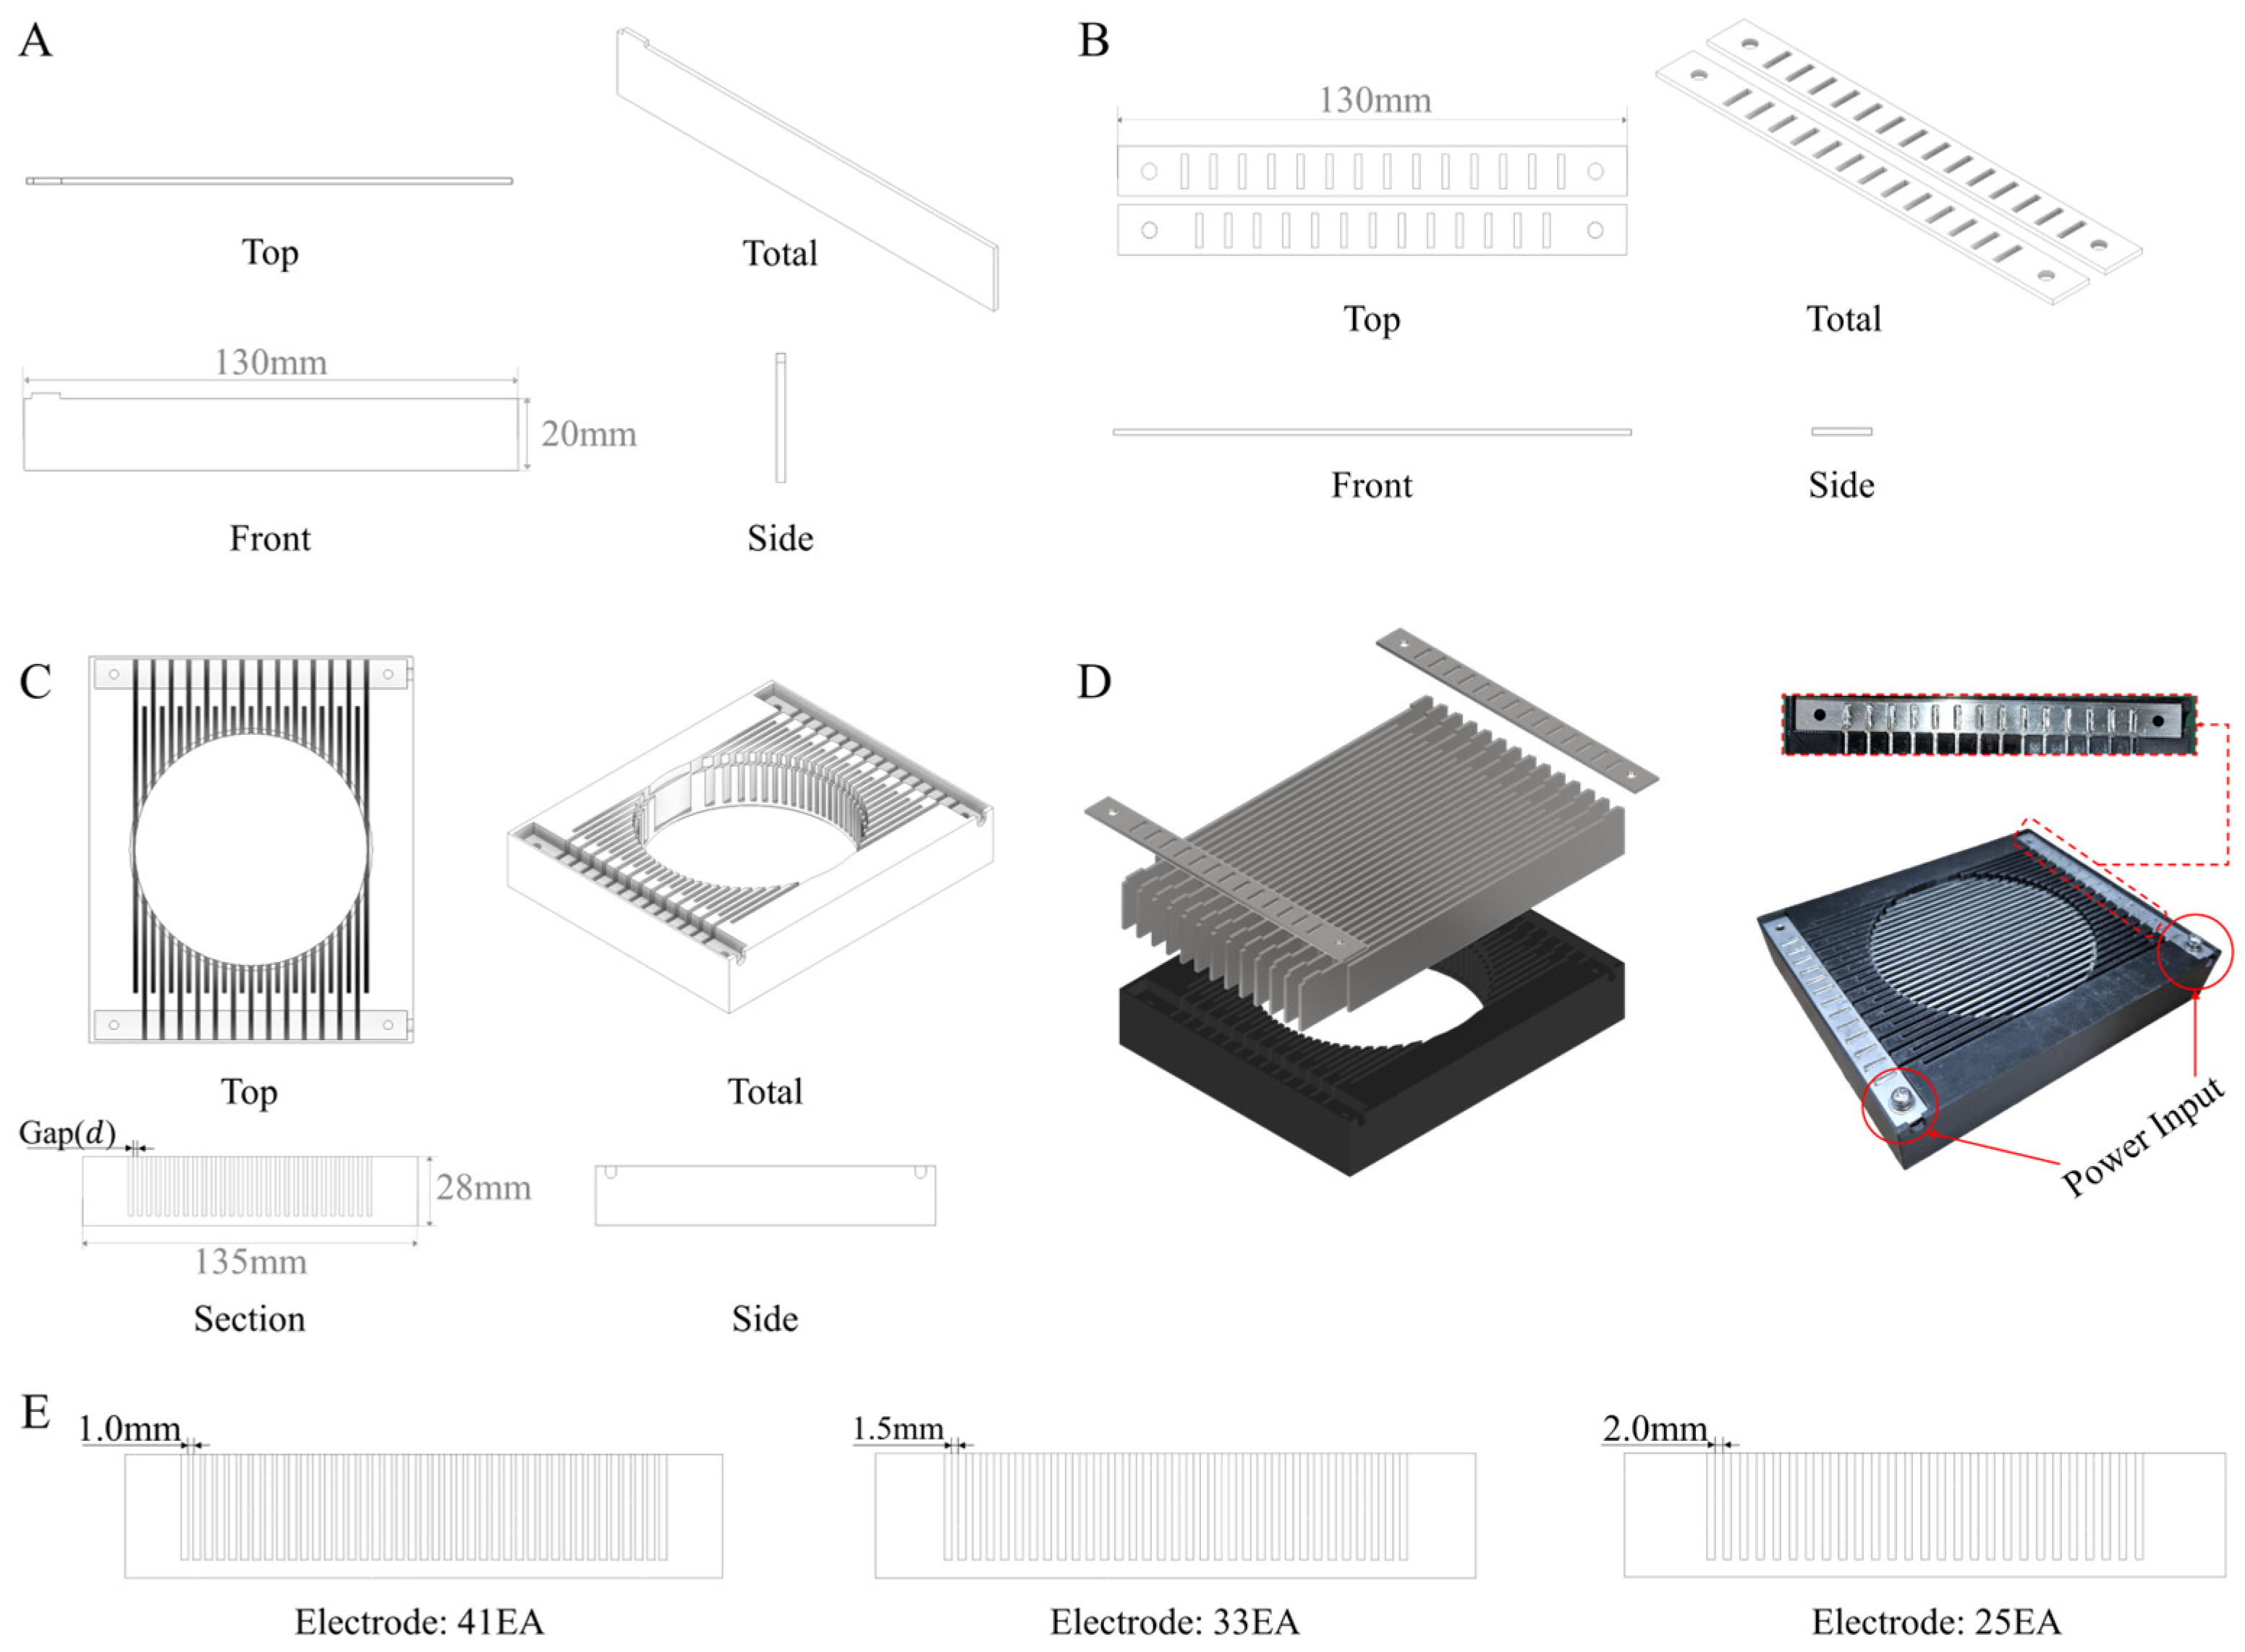
The detection electrodes were fabricated by machining 1.5 mm-thick stainless-steel plates and arranging them in an alternating (+/−) polarity configuration so that a strong transverse electric field was formed across the powder flow direction. The effective area of each electrode was designed as 130 mm × 20 mm, and three electrode gap conditions were compared with inter-electrode distances d ∈ {1.0, 1.5, 2.0} mm. The electrode frame was fabricated from a PLA insulating structure to provide electrical insulation and ensure sufficient dielectric clearance, and a dedicated power supply plate was designed to feed the +/− electrodes. The connection between the power supply plate and the electrodes was fixed by laser welding to minimize local discharge and plasma generation at the contact points.
The electrical characteristics of the electrode assembly as a function of gap distance were approximated using the equivalent parallel-plate capacitance, as expressed in Equation (1):
C κ ε 0 ε r A d
where κ is the fringe-field correction factor, ε0 is the vacuum permittivity, εᵣ is the effective relative permittivity of the powder-filled gap, A is the effective electrode area, and d is the inter-electrode distance [17,18].
The detection principle is based on capturing current spikes ΔI in the electrode current I(t) that occur when metallic particles pass through the electrode gap. Physically, a metallic particle entering the gap becomes polarized in the applied AC electric field, and the induced surface-charge redistribution perturbs the local electric-field distribution. This transiently perturbs the effective impedance of the electrode region by (i) changing the effective capacitance (displacement-current component) and (ii) increasing the effective loss/conductance when the particle approaches one or both electrodes, forming a transient increase in effective conductance [19].
As a result, I(t) exhibits a spike-like excursion ΔI superimposed on the steady-state current at the operating frequency. In this study, both the RMS current at the operating frequency and the time-domain ΔI were monitored, and a detection decision was issued when the normalized amplitude ΔI/σbaseline exceeded a predefined threshold θ. Detection sensitivity is governed by the magnitude of the impedance perturbation, which increases with particle size and electrical conductivity; consequently, highly conductive non-ferrous particles (Al and Cu) tend to yield larger ΔI responses than SUS under identical conditions, while sub-millimeter particles produce weaker perturbations that more readily approach the baseline-noise level.
In addition, fast Fourier transform (FFT) analysis was performed to compare the resonance characteristics across electrode gaps (d = 1.0, 1.5, and 2.0 mm), and the operating frequency and electrode spacing were selected based on resonance matching and voltage stability criteria. The electrode layout and structure are shown in Figure 4.

2.2.4. FFT-Based Optimization of Power Supply and Electrode Spacing

To investigate the relationship between the IGBT-based power supply and electrode spacing in terms of power stability, the equivalent resistance Req and capacitance Ceq of the designed electrode assembly were measured using an LCR meter (IM3533, Hioki, Nagano, Japan), and the natural resonance frequency of the electrode system was calculated. The theoretical resonance frequency of the electrode assembly, fres, was defined as in Equation (2):
f r e s 1 2 π L e q · C e q
where Leq is the equivalent leakage inductance of the secondary side of the flyback transformer, and Ceq is the capacitance of the electrode assembly.
To quantitatively evaluate the resonance quality between the theoretical electrode resonance and the power source spectrum, and to estimate the resonance bandwidth, the quality factor Qres and the bandwidth BWres were defined as in Equations (3) and (4):
Q r e s = 1 R e q L e q C e q
B W r e s = f r e s Q r e s
where Qres is an indicator of selectivity and damping: higher values correspond to sharper resonance and higher selectivity, but also greater sensitivity to variations in load, temperature, and powder packing fraction, as well as a narrower allowable bandwidth [20,21]. The parameter BWres represents the frequency range around fres within which the power source components can effectively interact with the resonant system.
The output spectrum of the power supply was obtained by measuring the electrode voltage spectrum V(f) using the FFT function of the oscilloscope. The maximum peak frequency, excluding the DC component, was defined as the source frequency fsrc [22,23]. The matching between the drive frequency and the theoretical resonance frequency was then evaluated based on half of the resonance bandwidth, as expressed in Equation (5):
f s r c B W r e s 2 f r e s f s r c + B W r e s 2
In addition, a dimensionless resonance matching index (RMI) was newly defined to compare the degree of resonance matching among electrode gaps. RMI normalizes the detuning between the source frequency and the resonance frequency with respect to the 3 dB bandwidth (half-width) of the resonant system, as given in Equation (6):
R M I = B W r e s 2 f s r c f r e s
where RMI ≥ 1 indicates a matched condition where fres lies within the half-bandwidth of the resonant system, while RMI < 1 is classified as a mismatched condition. For the electrode-gap sweep d ∈ {1.0,1.5,2.0} mm, the parameters Req, Ceq, fres, Qres, BWres, fsrc, and RMI were calculated using the above procedure. For each electrode gap, Req and Ceq were measured in triplicate (n = 3) and are reported as mean ± SD. The derived parameters (fres, Qres, BWres, fsrc, and RMI) were calculated using the mean values.

2.3. Real-Time Monitoring System and Detection Algorithm

2.3.1. Materials and Data Preparation

After optimizing the electrode geometry and power supply conditions via FFT analysis, real-time monitoring tests were conducted to evaluate the detection performance of the system under these optimal conditions. Test particles consisted of aluminum (Al), copper (Cu), and stainless steel (SUS) in three size classes classified by sieve fractionation: 1.00–2.00, 0.50–1.00, and <0.50 mm. For each combination of metal type and particle-size class, the number of trials was set to n = 150. For every event, a timestamp and metadata describing the power supply conditions (frequency, voltage, and waveform type) were synchronized and recorded, before being used for the evaluation of the detection algorithm.

2.3.2. Feature Extraction and Event Classification

The real-time detection algorithm was designed to reliably extract current spikes ΔI from the electrode current waveform that are induced by the passage of metallic particles through the electric field. Based on preliminary experiments in which metallic particles were passed through the detection region without powder, the absolute current-change threshold was set to ΔImin = 0.25 mA. This value was sufficiently larger than the baseline noise of the power supply while still allowing stable capture of spikes generated by all three metals (Al, Cu, SUS).
For each raw current waveform I(t) acquired from the DAQ and oscilloscope, a metal-free baseline segment was first selected, and its mean μ and standard deviation σbaseline were computed. The instantaneous current deviation ΔI(t) and the corresponding z-score z(t) were then defined as in Equations (7) and (8):
I ( t ) = I ( t ) μ
Z ( t ) = I ( t ) σ b a s e l i n e
where μ denotes the mean current in the metal-free baseline segment, and σbaseline is the standard deviation of the current within that segment.
Candidate events were extracted by searching for local maxima that satisfied predefined criteria on minimum peak height, peak width, and slew rate. Among these candidate peaks, only those simultaneously meeting both ΔI(t) ≥ 0.25 mA and z(t) ≥ θ were labeled as metallic detection events, where θ is a dimensionless z-score threshold representing the acceptable outlier level relative to the baseline noise and controlling the sensitivity of the algorithm.
In implementation, the metal-free baseline segment was chosen as a ∼25 s window in which the noise level was stable, and only regions satisfying ∣I(t) − μ∣ ≤ kσσbaseline with kσ = 3 were accepted as baseline candidates. Event termination was defined as the time point at which the z-score returned to ∣z(t)∣ < 0.5. Peaks separated by less than 0.4 s were merged and treated as a single event. Candidate peaks were further filtered by requiring a signal-to-noise ratio SNR = ΔIpeakbaseline ≥ 2. Among these, events with ΔIpeak ≥ 1 mA or SNR ≥ 10 were additionally tagged as “strong” events.
Waveforms with durations longer than 3 s, or those exhibiting slowly varying changes with a ratio of peak depth to area ≥ 0.8, were regarded as slow drifts caused by system start-up or powder inflow and were removed as artifacts. Baseline recovery after the passage of a metallic particle was confirmed when the residual current ∆I(t) remained below 0.2 mA for at least 0.5 s, which distinguished single-particle events from slow baseline shifts associated with powder loading. To prevent multiple counting of a single physical event as several peaks, hysteresis was introduced by imposing a retriggering time and a minimum inter-peak interval after each detected event. Peaks occurring within this time window were merged into a single event so that each metallic particle passage was counted only once.

2.3.3. Estimation of POD and LOD

To evaluate the detection performance of the developed system and to quantify the accuracy and confidence intervals of the real-time detection model, the probability of detection (POD) and the limit of detection (LOD) were estimated [24,25]. For each condition (material × particle-size class), binary responses from n = 150 trials (detection = 1, non-detection = 0) were modeled using logistic regression as a function of particle diameter d. The basic model was defined as in Equation (9):
l o g i t { P O D d } = β 0 + β 1 d
where d denotes the representative particle diameter for the corresponding size class, and the parameters β0 and β1 were estimated by maximum likelihood (MLE). Standard errors of the parameters were obtained from the negative inverse of the Hessian matrix of the log-likelihood function.
The limit of detection at a target detection probability q (LODq; e.g., q = 0.90, 0.95) was defined as the inverse-function solution for the smallest d satisfying POD(d) = q and was calculated as in Equation (10):
L O D q = l o g i t q β 0 β 1
Uncertainty in the estimated detection limits (LODq) was quantified using (i) a delta-method approximation based on the Hessian and (ii) a nonparametric bootstrap procedure (>2000 resamples) to compute bias-corrected 95% confidence intervals. For each condition, POD(d) curves were plotted with LOD90 and LOD95.

2.4. Safety Evaluation Methodology

2.4.1. Local Heating Simulation

The potential for localized heating caused by metallic particles passing between the electrodes was evaluated numerically, and the trend in maximum temperature rise was quantified. The coupled electro-thermal problem was solved using the finite element method (FEM) in COMSOL Multiphysics v.6.3, where the model was formulated as a multiphysics system linking the electric field, Joule heating, and transient heat transfer. The governing equations and variables used in the analysis are summarized below.
The local electric field in the vicinity of the particle was approximated from the applied voltage and effective electrode gap as in Equation (11):
E l o c = η V d
where Eloc is the local electric field near the particle and adjacent electrode surface (V·m−1), η is a field-enhancement correction factor accounting for edge curvature and surface roughness, V is the applied voltage between the electrodes (V), and d is the effective electrode spacing (m). The current density inside the conductive metallic particle was expressed as in Equation (11b):
J = σ p · E l o c
where J is the current density vector inside the particle (A·m−2), and σp is the electrical conductivity of the particle material (S·m−1). The corresponding volumetric heat generation rate within the particle due to Joule heating was given by Equation (11c):
q = J · E l o c = σ p E l o c 2
where q′′′ is the volumetric heat generation rate inside the particle (W·m−3). Equation (11a–c) thus describes how the heat generation depends on the variables V, d, η, and σp.
The temperature field was governed inside the particle by a heat diffusion equation with a volumetric heat source term, and in the surrounding medium by a pure heat-conduction equation, as expressed in Equation (12a,b):
ρ p c p , p T t = k p 2 T + q   (particle)
ρ m c p , m T t = k m 2 T   (surrounding medium)
where T is the temperature (K), ρp and ρm are the densities of the metallic particle and surrounding medium, respectively (kg·m−3), cp,p and cp,m are the specific heats at constant pressure (J·kg−1·K−1), and kp and km are the thermal conductivities of the metallic particle and effective surrounding medium (W·m−1·K−1), respectively. A convective boundary condition was imposed at the particle surface, as given in Equation (13):
k T · n = h T T
where k is the thermal conductivity at the boundary, n is the outward unit normal vector, h is the convective heat transfer coefficient (W·m−2·K−1), and T is the reference temperature of the surrounding fluid. The initial condition was T(x,0) = T0, with the initial temperature T0 set to 20 °C.
For post-processing, the local temperature rise and the maximum temperature rise inside the particle were defined as in Equation (14a,b):
Δ T x , t = T x , t T 0
T m a x t = max x V p { T ( x , t ) T 0 }
where Vp denotes the volume domain of the metallic particle. The time evolution of ΔTmax (t) was used as a key indicator of thermal safety.
When solving the Joule heating coupled heat transfer problem numerically in COMSOL, the internally assembled weak form of the transient heat equation can be written as in Equation (15):
V ρ c p T t w d V + V k T · w d V =   V p q w d V + S h h T T w d S
where w is the test function, V is the overall computational domain, Vp is the particle domain where volumetric heat generation occurs, and Sh is the convective boundary surface.
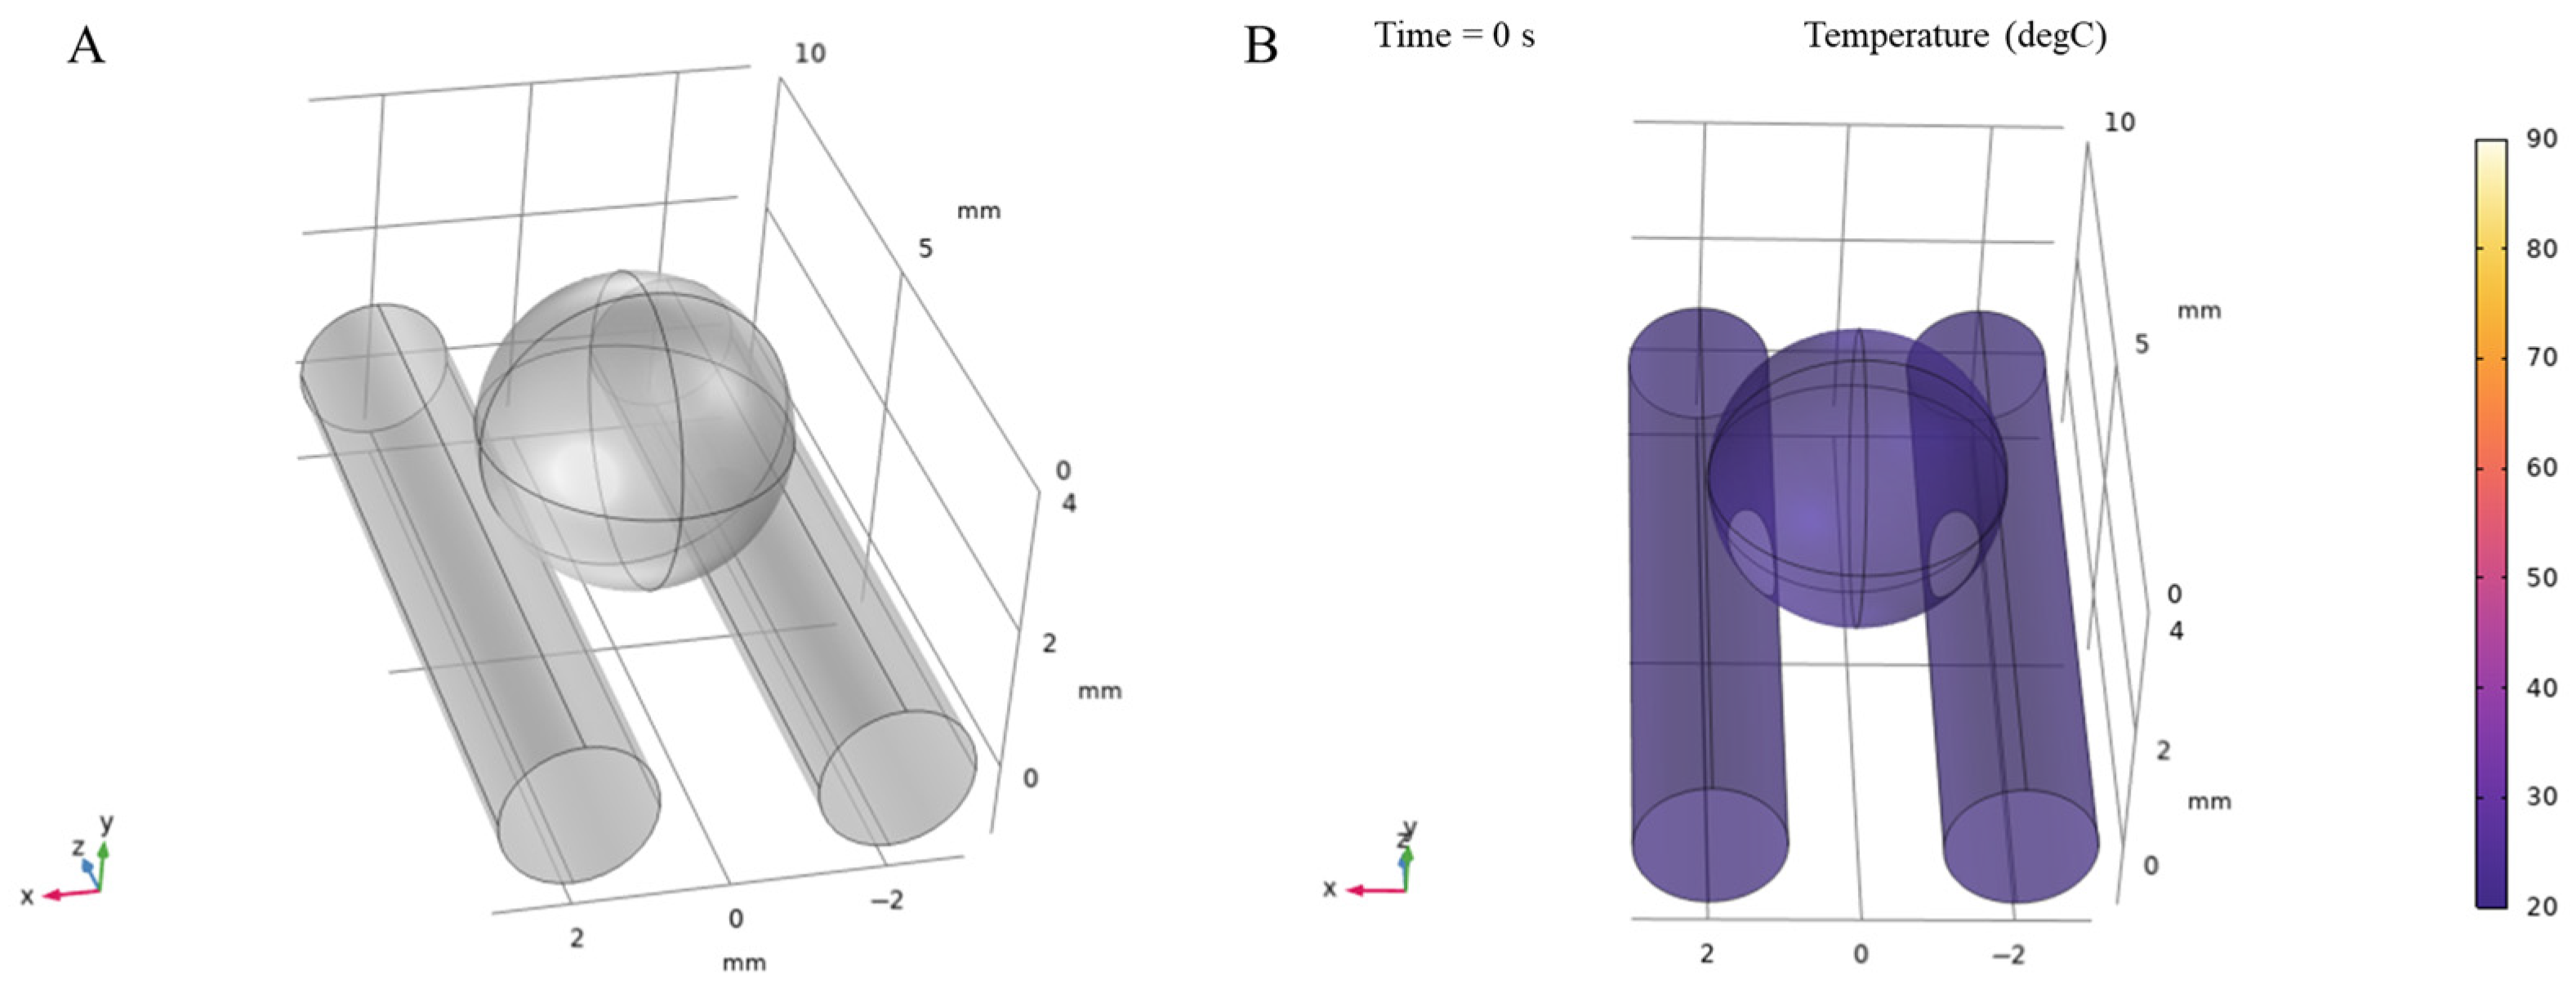
The computational geometry for the numerical simulation is shown in Figure 5. Two parallel cylindrical electrodes (diameter 2 mm, length 10 mm) and a single spherical metallic particle (diameter 4 mm) were arranged such that the particle was tangent to both electrodes (Figure 5A). The initial temperature of both the electrodes and the particle was set to T0 = 20 °C (Figure 5B). The system was operated in a current-driven mode by imposing a normal current density of Jn = 0.2 A/mm2 on the electrode surfaces, and the resulting electric field and Joule heating were analyzed under these conditions. The properties of the metallic particle were specified by its electrical conductivity σp, thermal conductivity kp, specific heat cp,p, and density ρp. The surrounding medium was modeled using an effective thermal conductivity km and convective coefficient h, with material properties taken from the built-in COMSOL material library. The temporal behavior of ΔTmax(t) was examined to assess the local heating safety of the proposed electric-field-based detection system.

2.4.2. Local Heating and Ozone Generation Evaluation

In this study, two safety indicators were considered: (1) local heating caused by metallic particles and (2) the potential for ozone generation due to plasma formation. Local heating was first evaluated under the same conditions as those used in the numerical simulation. A thermal imaging camera (TIS60+, Fluke, Everett, WA, USA) was used to reproduce the condition in which a metallic particle bridges the central region between the electrodes, and the temperature distribution around the particle–electrode contact area was recorded over time. From the acquired thermal images, the maximum temperature within a predefined region of interest (ROI) was extracted, and the corresponding temperature rise relative to the initial temperature was calculated to obtain the measured temperature increase, ΔTmeas(t). The temporal profile of ΔTmeas(t) was then compared with the numerically predicted ΔTmax(t) from Section 2.4.1 to verify the agreement between the simulated local heating behavior and the actual temperature response.
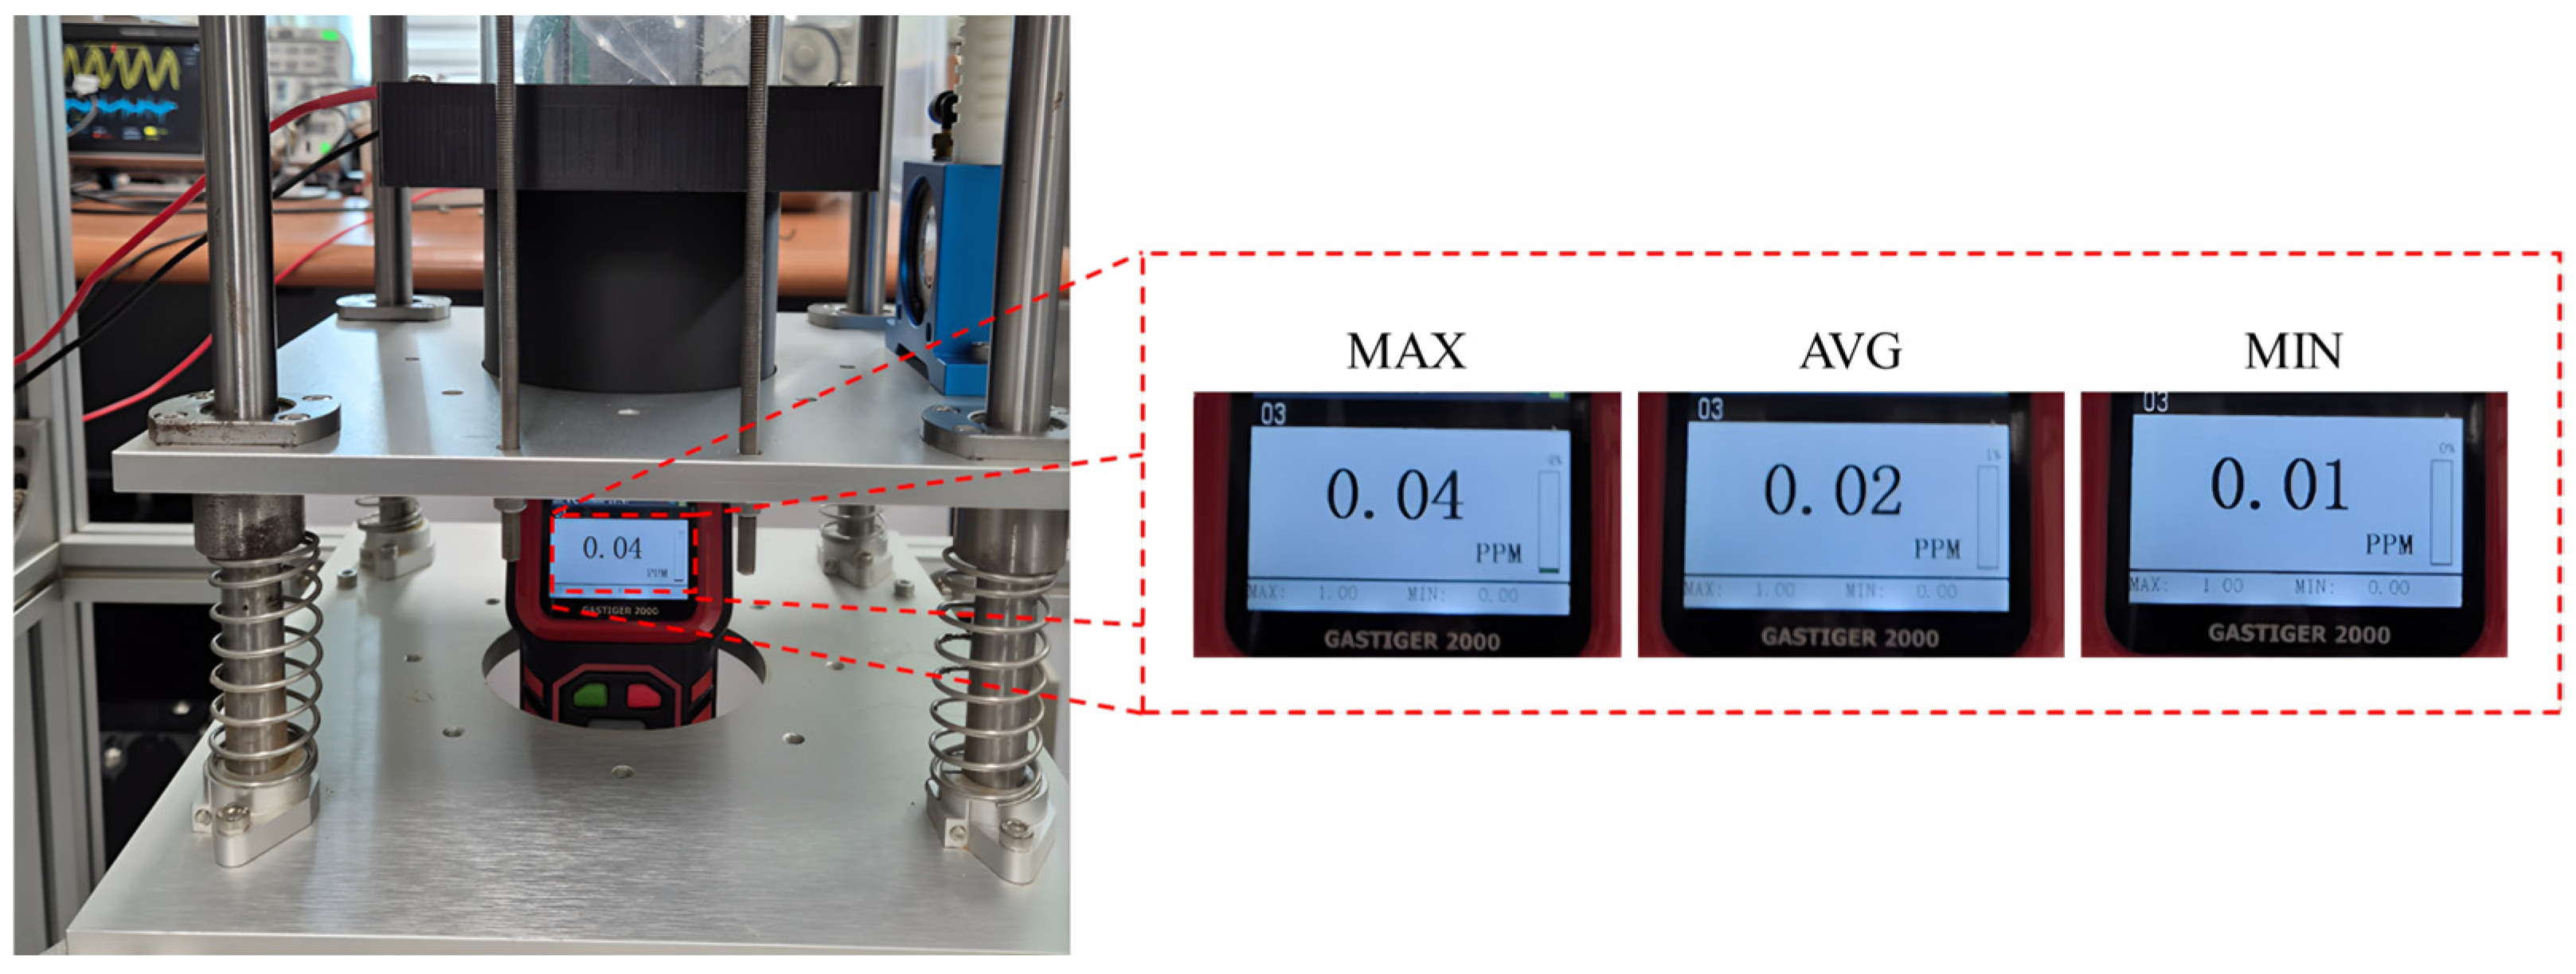
The potential for ozone generation was evaluated to determine whether local discharge (plasma) induced by the applied electric field in air, with or without metallic particles, could lead to ozone formation. For this purpose, an ozone detector (GAS TIGER 2000, Wandi, Shenzhen, China) was installed at the lower part of the detection unit, while a forced airflow was supplied from the upper side to maintain a steady air flow inside the apparatus. Background ozone concentration was first monitored for a fixed period with no electric field applied. Subsequently, ozone concentration was measured under the standard operating condition of this study, with the electric field continuously applied, to assess any increase in ozone level attributable to discharge-induced ozone generation.

3. Results and Discussion

3.1. Optimization of Power Supply and Design Conditions for the Electric-Field-Based Detection Unit

The performance of the electric-field-based metallic contaminant detection system developed in this study is strongly influenced by electrode gap, driving frequency, and applied voltage, which together determine the electric field distribution and detection sensitivity. Therefore, the equivalent capacitance and resonance characteristics of the electrode assembly were evaluated in conjunction with FFT analysis of the power supply spectrum to assess the degree of frequency matching, and these results were used to optimize the electrode gap and driving-frequency conditions. Subsequently, under the selected gap and frequency conditions, the stability of the electric field and the detection response were evaluated as a function of applied voltage to determine the optimal operating voltage for the detection unit.

3.1.1. Optimization of Driving Frequency as a Function of Electrode Gap

Measurement of the electrode–power coupling parameters using an LCR meter indicated that, for electrode gaps of d ∈ {1.0, 1.5, 2.0} mm, the equivalent capacitances and resistances of the electrode assemblies were Ceq = 1097.47/687.18/539.75 pF and Req = 5.46/8.04/10.64 kΩ, respectively. As the electrode gap increased, the effective separation between plates grew relative to the electrode area, resulting in a decrease in Ceq and a corresponding increase in Req, which affects the resonance behavior [26]. When combined with the effective leakage inductance Leq on the secondary side of the flyback transformer, the equivalent resonance frequencies fres for the three electrode gaps were calculated to be approximately 5.05, 6.39, and 7.21 kHz for d = 1.0, 1.5, and 2.0 mm, respectively (Table 1). This behavior is consistent with a typical LC resonant system [27], in which the resonance frequency increases as the capacitance decreases with increasing gap.
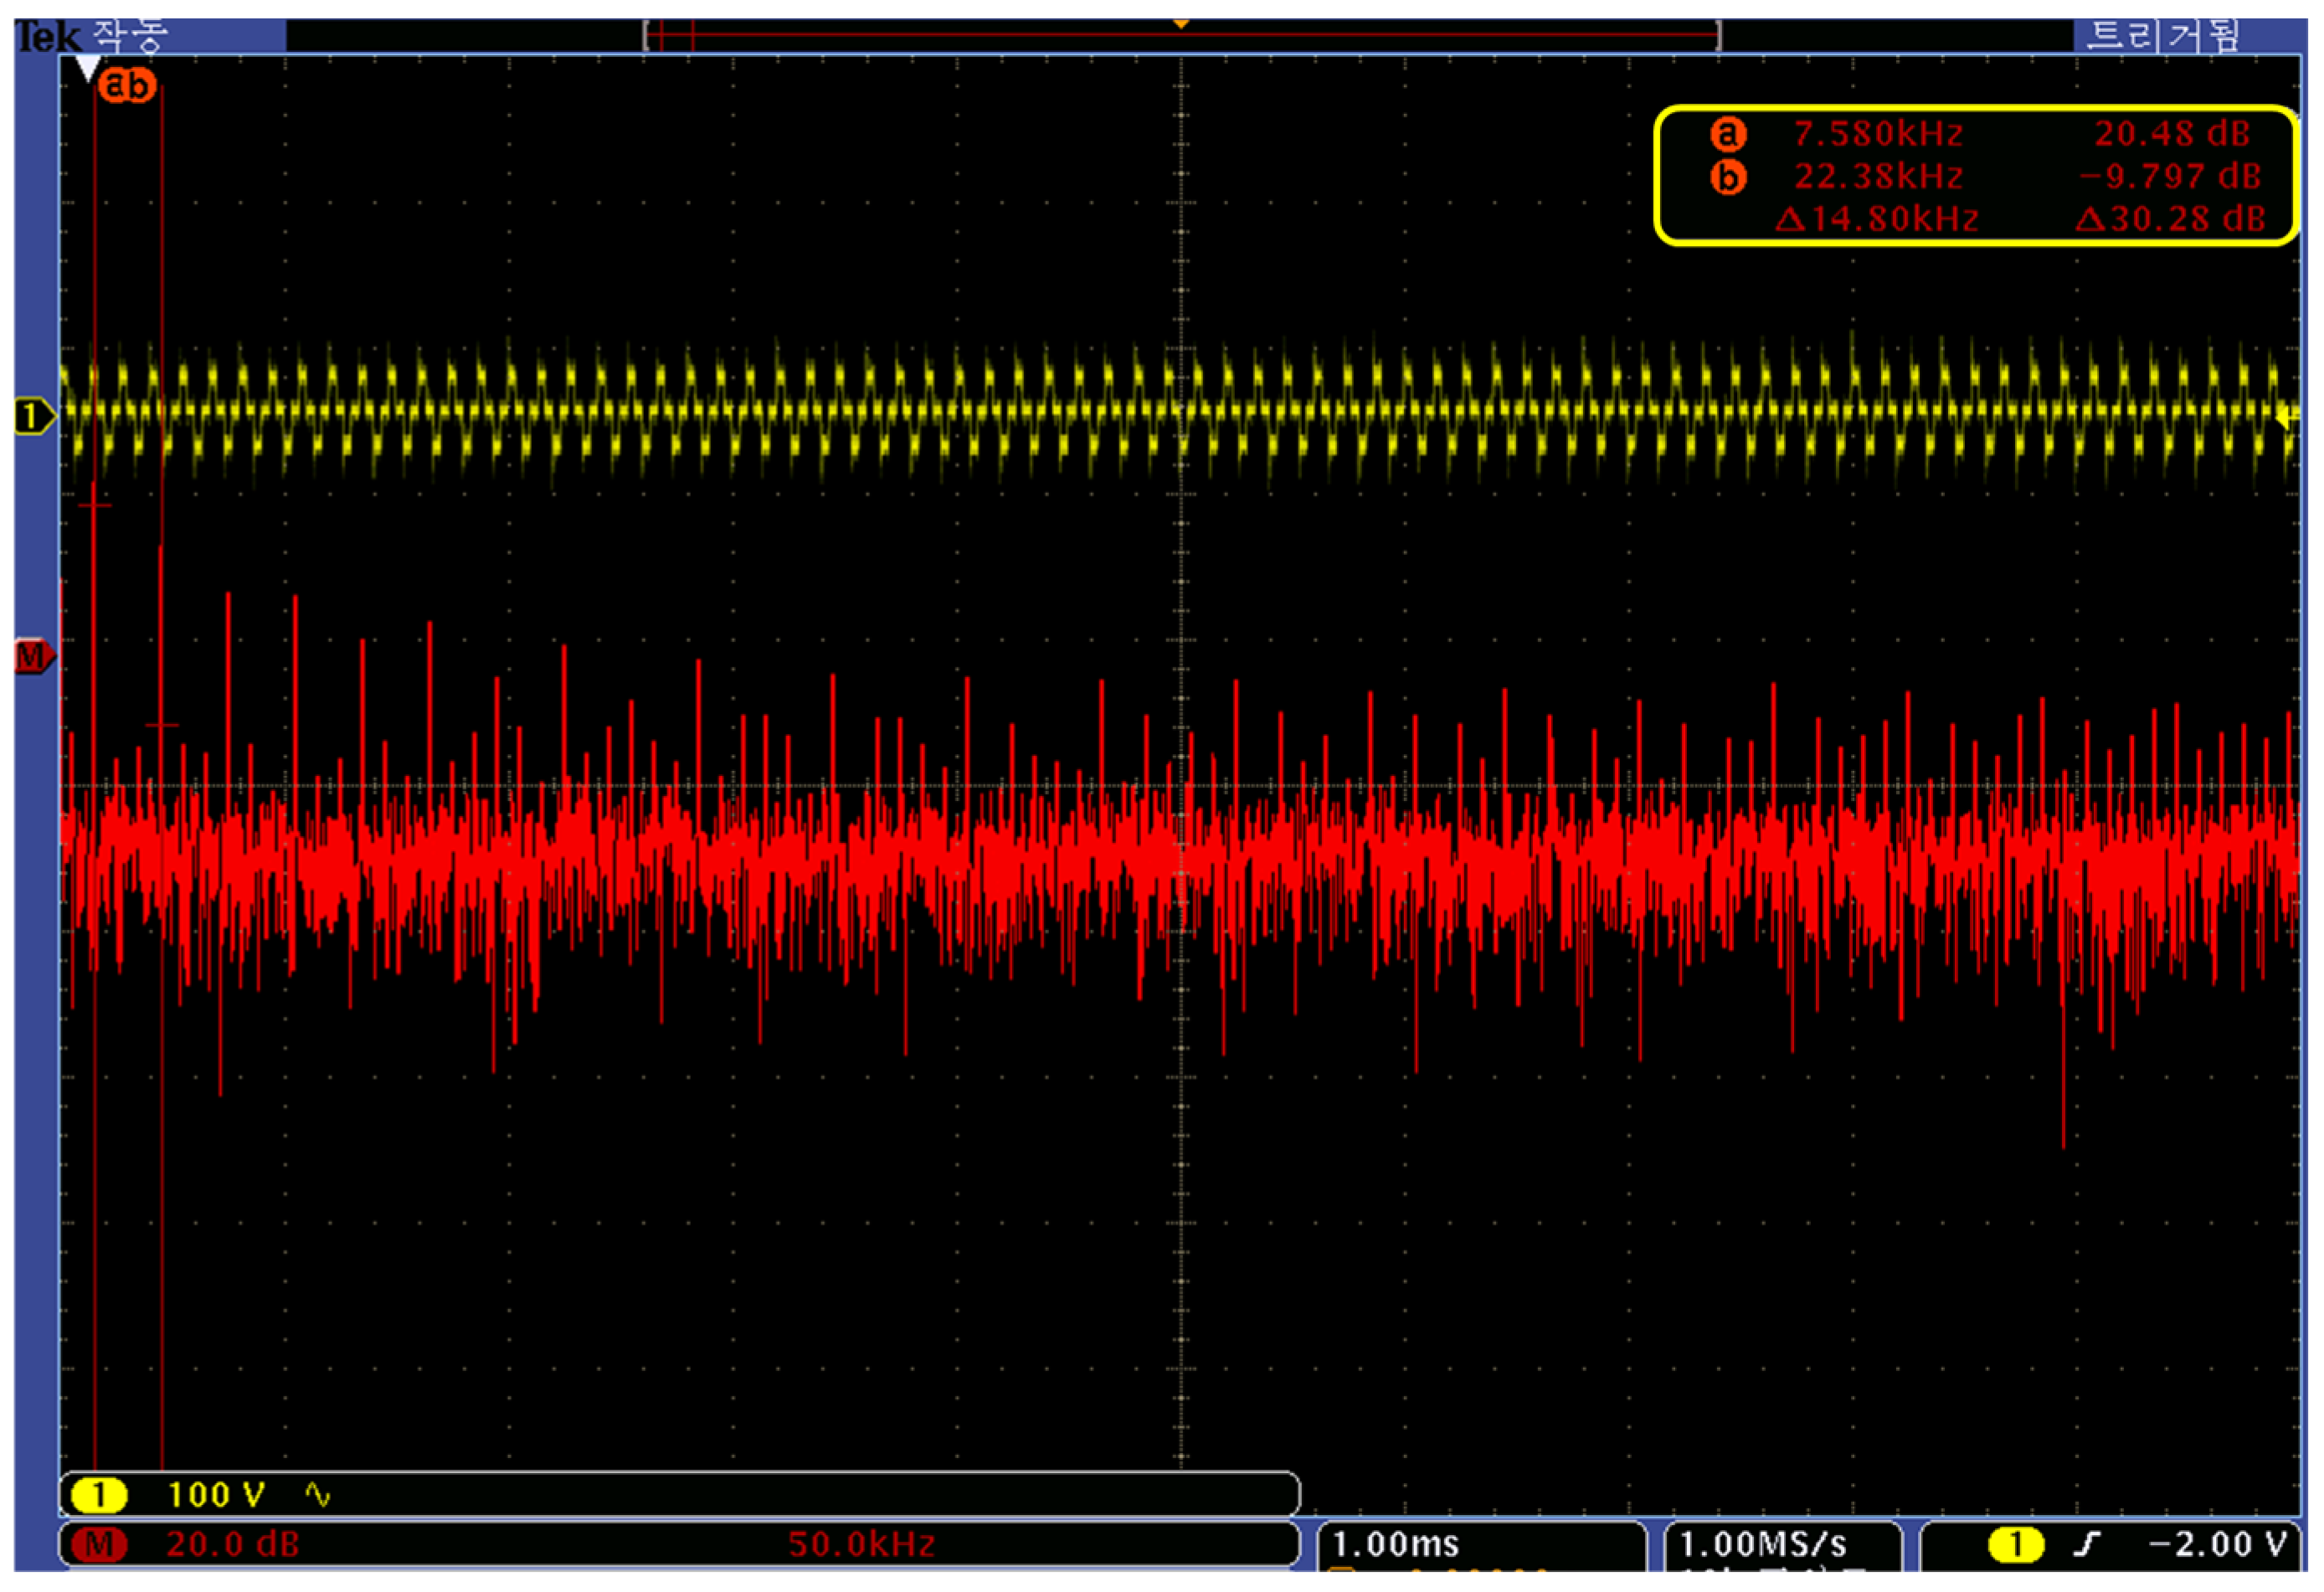
The frequency components of the voltage output from the power supply were analyzed using the FFT function of the oscilloscope. The main spectral peak was observed at 7.58 kHz, and the third harmonic peak appeared at 22.38 kHz. Accordingly, the source frequency was defined as fsrc = 7.58 kHz, and the corresponding FFT result is shown in Figure 6.
For each electrode gap d ∈ {1.0, 1.5, 2.0} mm, the quality factor Qres, resonance bandwidth BWres, and resonance matching index (RMI) were calculated from the measured Ceq, Req, and Leq values (Table 2). The RMI values for the 1.0 and 1.5mm gaps were 0.190 and 0.600, respectively, indicating mismatched conditions (RMI < 1) in which the resonance frequency lies outside the half-bandwidth of the resonant system. In contrast, the 2.0 mm gap yielded an RMI of 2.57, satisfying the matched condition (RMI ≥ 1). In particular, for d = 2.0 mm, the difference between the source and resonance frequencies, |fsrc − fres| = 0.37 kHz, was smaller than half the resonance bandwidth, BWres/2 = 0.95 kHz, confirming that fsrc lies within the resonant half-band.
These results indicate that, under a nominal 7.58 kHz source component, the electrode assembly with a 2.0 mm gap provides the best frequency matching between the power supply and the resonant system and is thus favorable for stable voltage application and current response within the resonance band [28]. Accordingly, the electrode gap in the developed detection system was fixed at d = 2.0 mm. The driving frequency of the power source was then selected based on an additional voltage-stability assessment under this optimized gap condition.
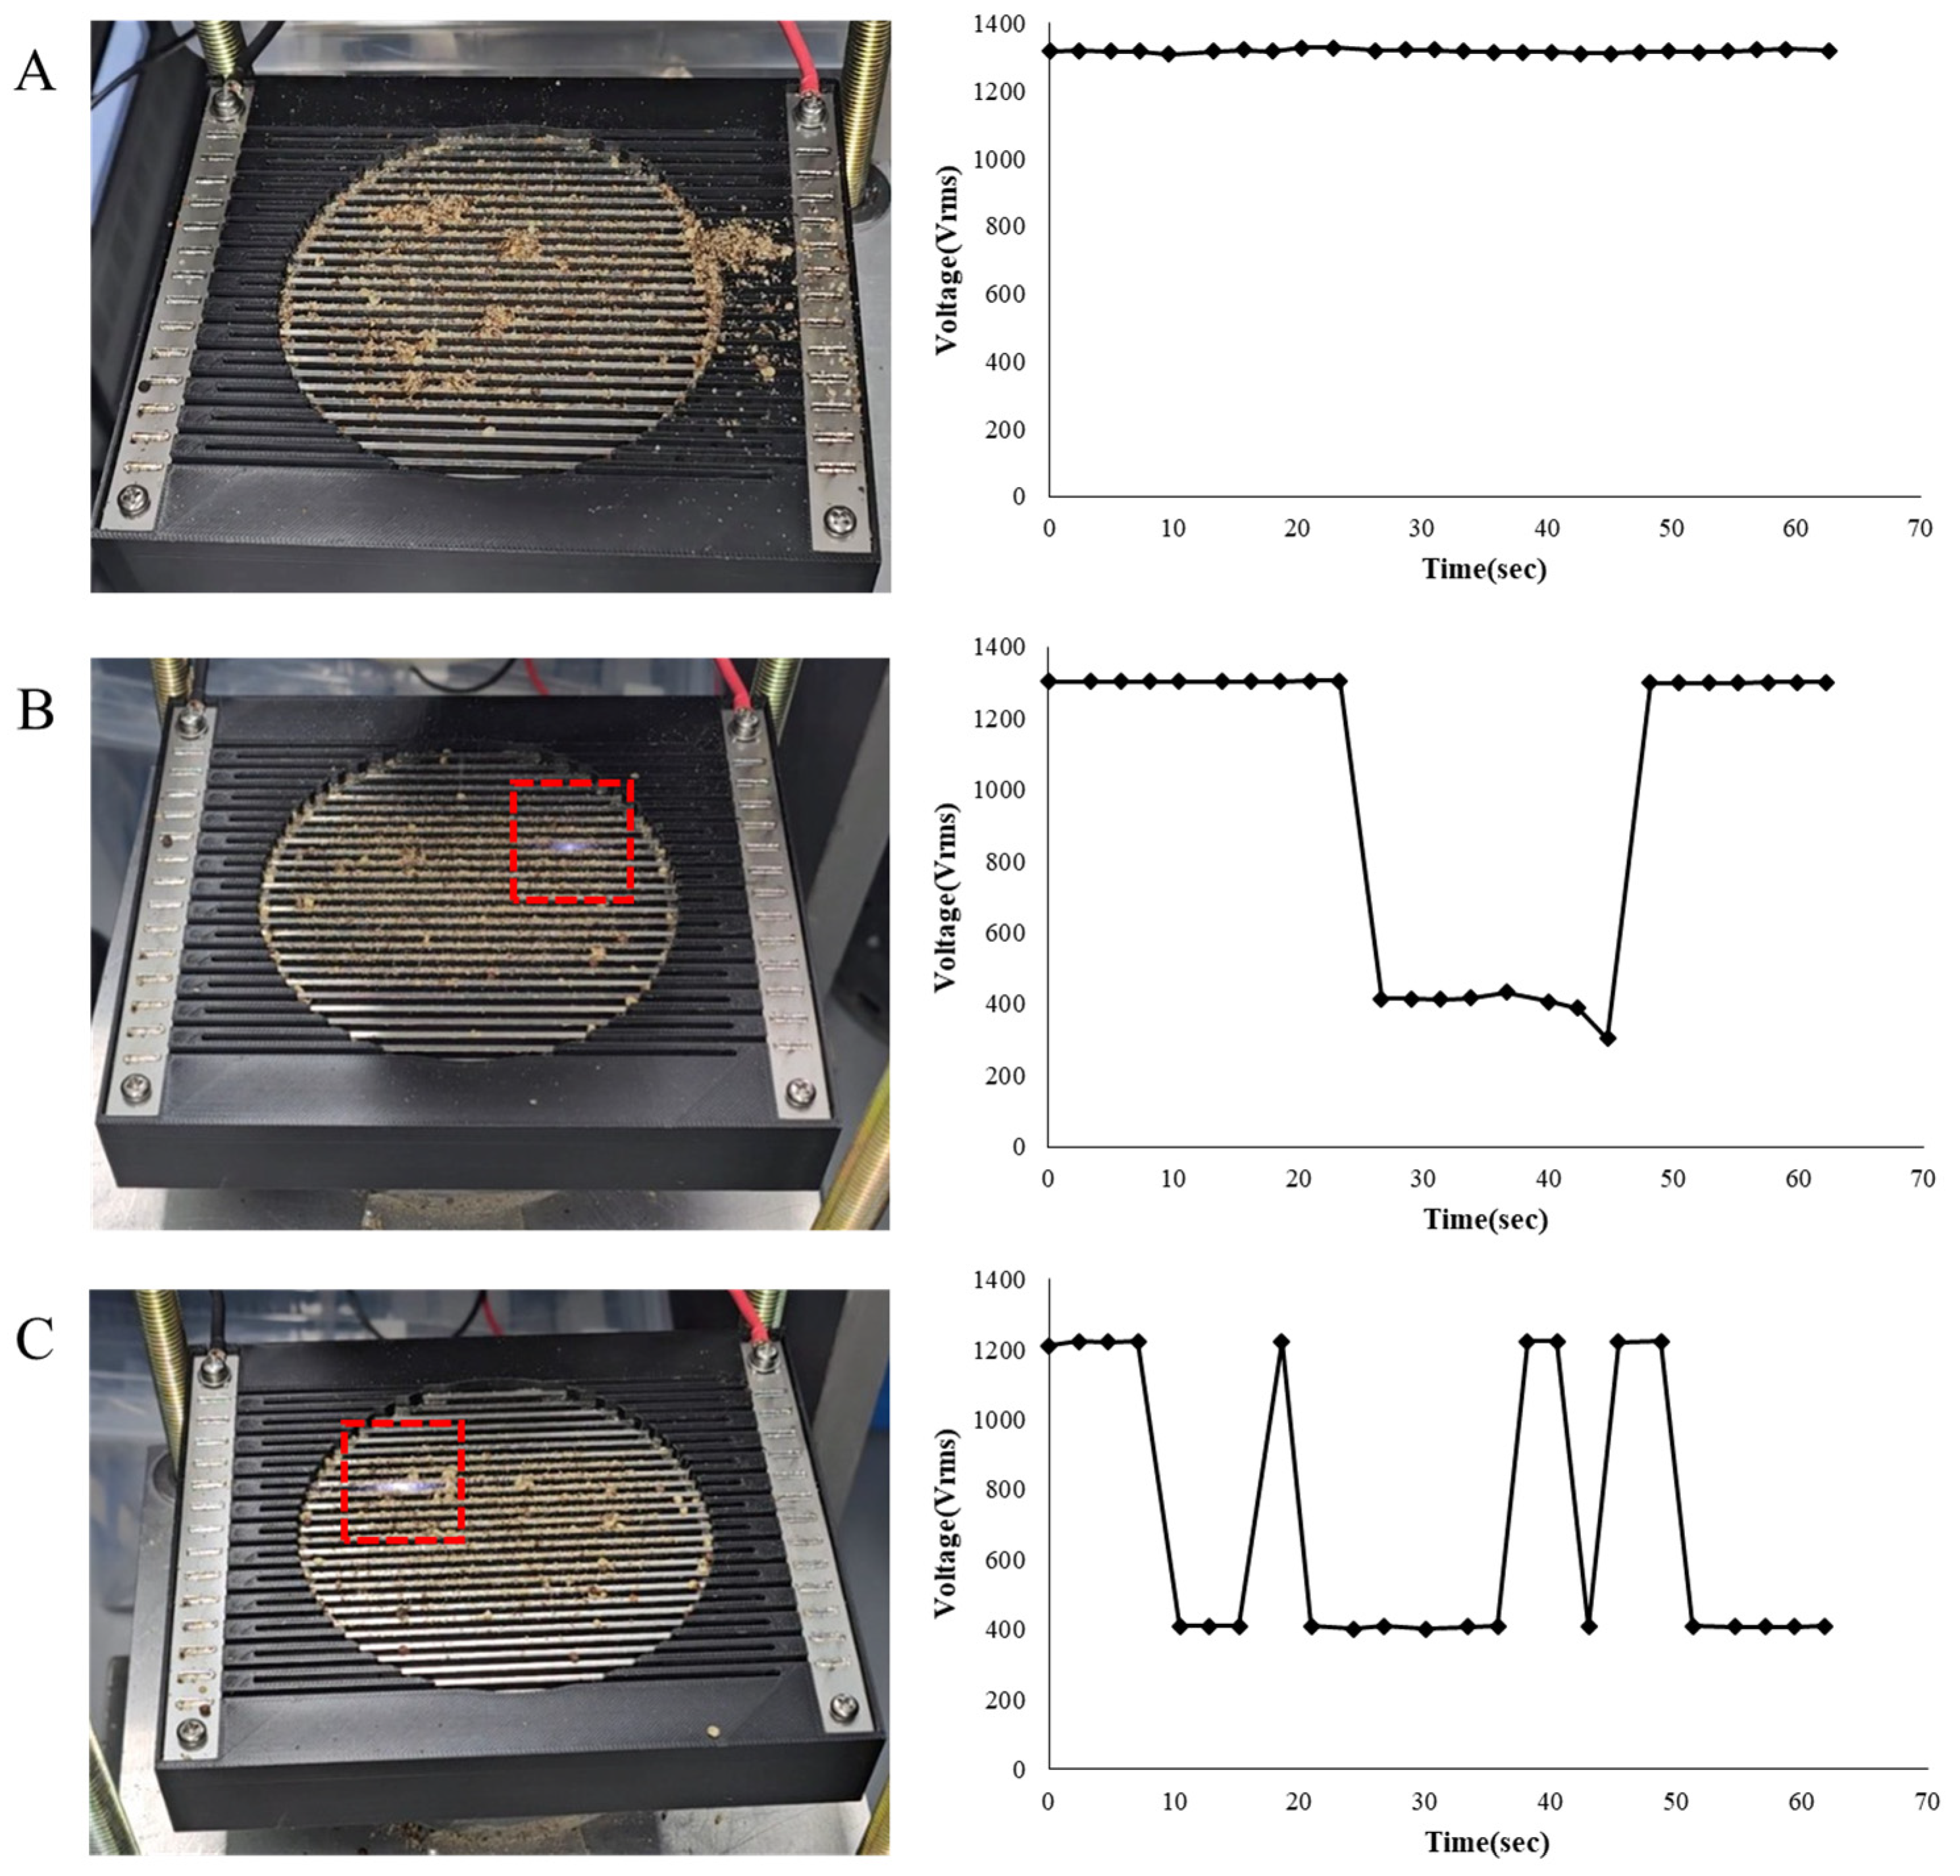
Accordingly, the electrode design was finalized with a gap of d = 2.0 mm based on the resonance-band matching analysis. Since the stability of the applied electric field in resonant systems is strongly influenced by the driving-frequency range and its proximity to the effective resonance, we subsequently assessed whether operation within the identified resonance band provides stable voltage delivery and robust system behavior under practical operating conditions [29,30]. As shown in Figure 7, operation at 15 kHz maintained the target voltage with minimal fluctuation, whereas 16–17 kHz resulted in pronounced voltage droop accompanied by intermittent self-sustained discharges near the electrode region. Therefore, 15 kHz was selected as the most suitable driving frequency to ensure stable operation at d = 2.0 mm.

3.1.2. Optimization of Applied Voltage Conditions

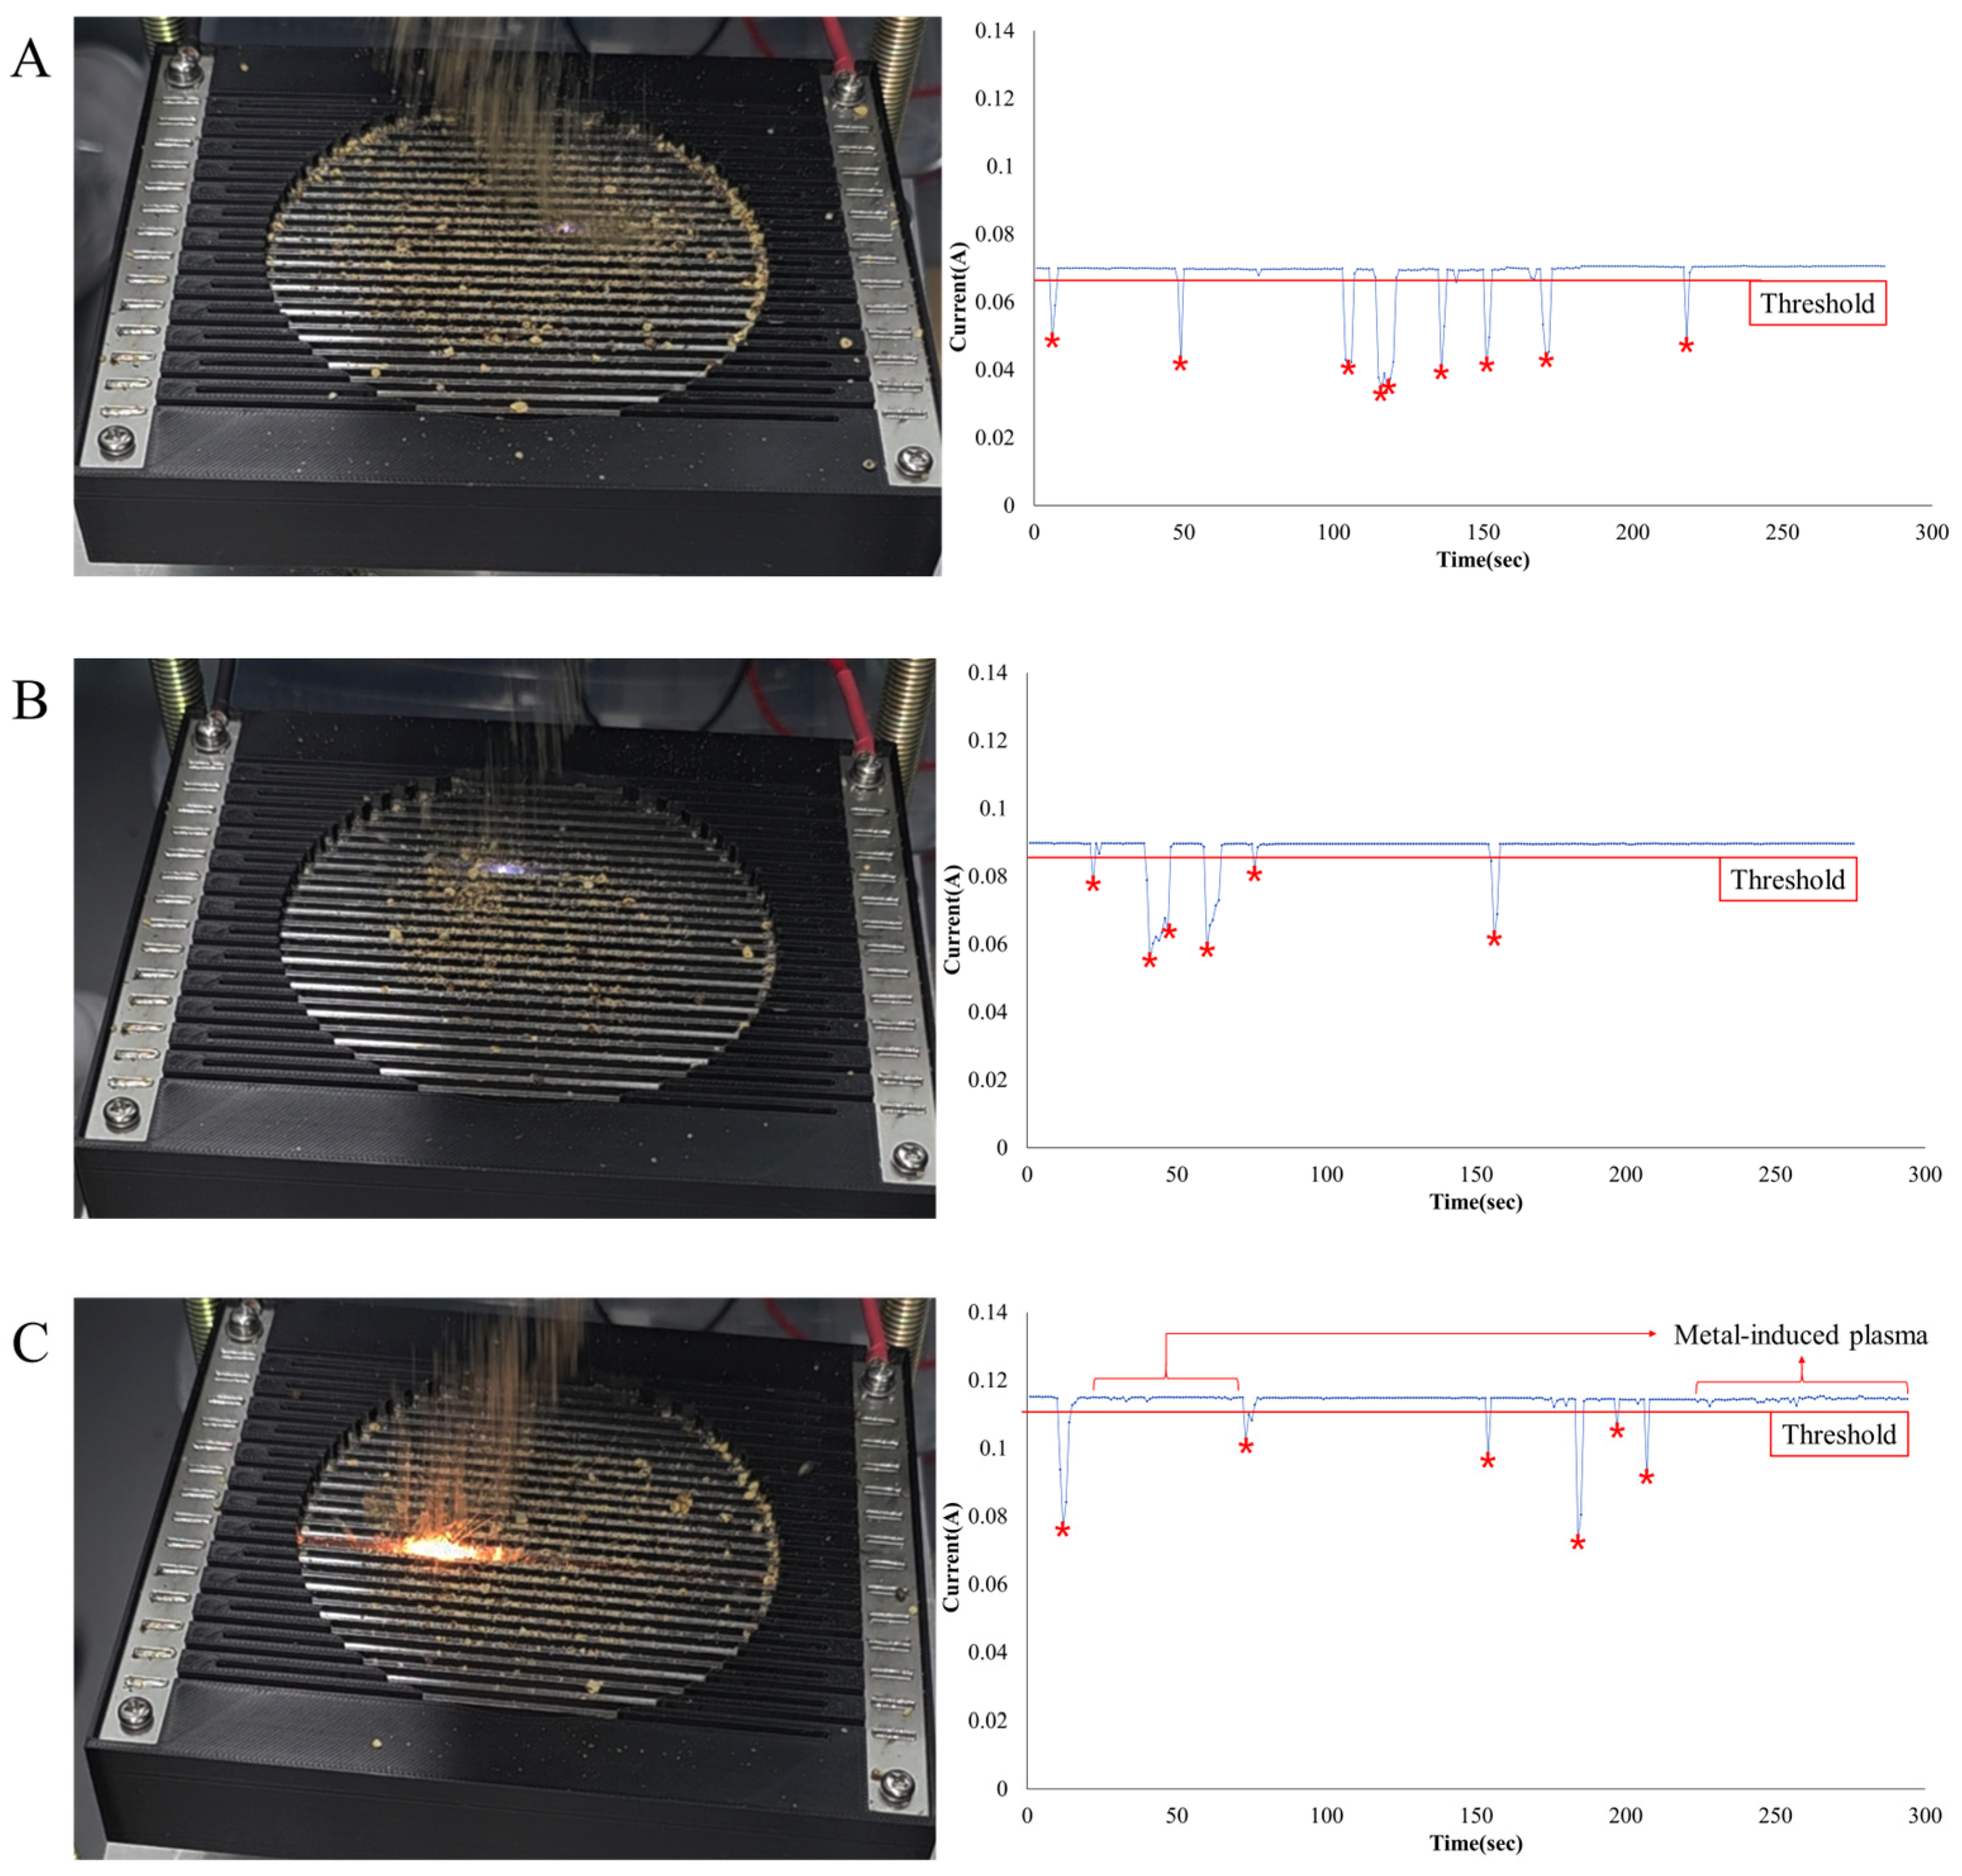
After fixing the electrode gap at d = 2 mm and the driving frequency at 15 kHz as the baseline design conditions for the detection unit, the optimal applied voltage was determined by evaluating electric-field stability and metallic-particle detection responses under different voltage levels. For this purpose, 10 stainless-steel (SUS) particles in the 1–2 mm size range were mixed with 100 g of perilla powder and introduced into the system, while the electrode voltage was varied among 1.35, 1.50, and 1.80 kV. The resulting current waveforms were processed by the real-time detection algorithm, and, for each voltage condition, the number of labeled spikes and the stability of the baseline current were compared.
At 1.35 kV, only short ΔI spikes appeared in the current waveform when metallic particles passed through the electric field, with no observable post-discharge, and the baseline current remained stable throughout the observation period (Figure 8A). At 1.50 kV, the electric field became less stable, and weak intermittent plasma discharges occasionally occurred between the electrodes after particle passage. Metallic particles passing during these discharge events produced spikes that overlapped with discharge-induced noise, causing some particle events to be missed; under this condition, the algorithm labeled only about six metallic events (Figure 8B). At 1.80 kV, self-sustained discharges were initiated after particle passage, leading to visible plasma formation between the electrodes. The higher field intensity caused the plasma to persist for longer durations, and discharge spikes dominated the current waveform, reducing the number of metallic events detected by the algorithm to only about five, with metallic-induced spikes being difficult to distinguish from discharge noise (Figure 8C).
Overall, increasing the applied voltage strengthened the local electric field and promoted partial and self-sustained discharges, which in turn increased baseline fluctuations and noise spikes and paradoxically reduced the number of correctly detected metallic-particle events. In contrast, at 1.35 kV, the baseline remained stable without discharge while most SUS (1–2 mm) particles were detected above the threshold. Therefore, 1.35 kV was identified as an operating voltage that provides sufficient current response for metallic particles while effectively suppressing discharge. All subsequent POD analyses and detection-performance evaluations were conducted under the standard conditions of electrode gap d = 2 mm, driving frequency 15 kHz, and applied voltage 1.35 kV.

3.2. Performance Evaluation of Real-Time Detection Algorithm

3.2.1. Evaluation Framework and Powder Matrix Consideration

The detection accuracy of the system was evaluated for each metal under the standard operating conditions of electrode gap d = 2 mm, driving frequency 15 kHz, and applied voltage 1.35 kV. For each particle-size class (<0.5, 0.5–1.0, and 1.0–2.0 mm), 50 trials were conducted per metal, resulting in 150 trials per metal, in accordance with the hit/miss POD analysis framework described in ASTM E2862-18 [31]. In each trial, the presence or absence of a metallic detection event (detection = 1, non-detection = 0) was recorded.
Regarding the influence of powder matrix (perilla vs. turmeric), POD/LOD outcomes were not meaningfully different between perilla (coarser) and turmeric (finer) powders under the same operating conditions and the same decision rule. This is attributed to the anti-agglomeration/anti-bridging feeding and flow-stabilization design that minimized clumping and residence-time bias in the electrode region. In addition, detection events were dominated by transient current spikes induced by metallic particles traversing the electric field, whereas the powder matrix itself did not produce spike-like current excursions in the absence of metallic particles under the tested conditions. Therefore, within the controlled powder-handling regime of this study, differences in powder granularity did not translate into a measurable shift in POD/LOD.

3.2.2. POD/LOD Results by Metal Type and Particle Size

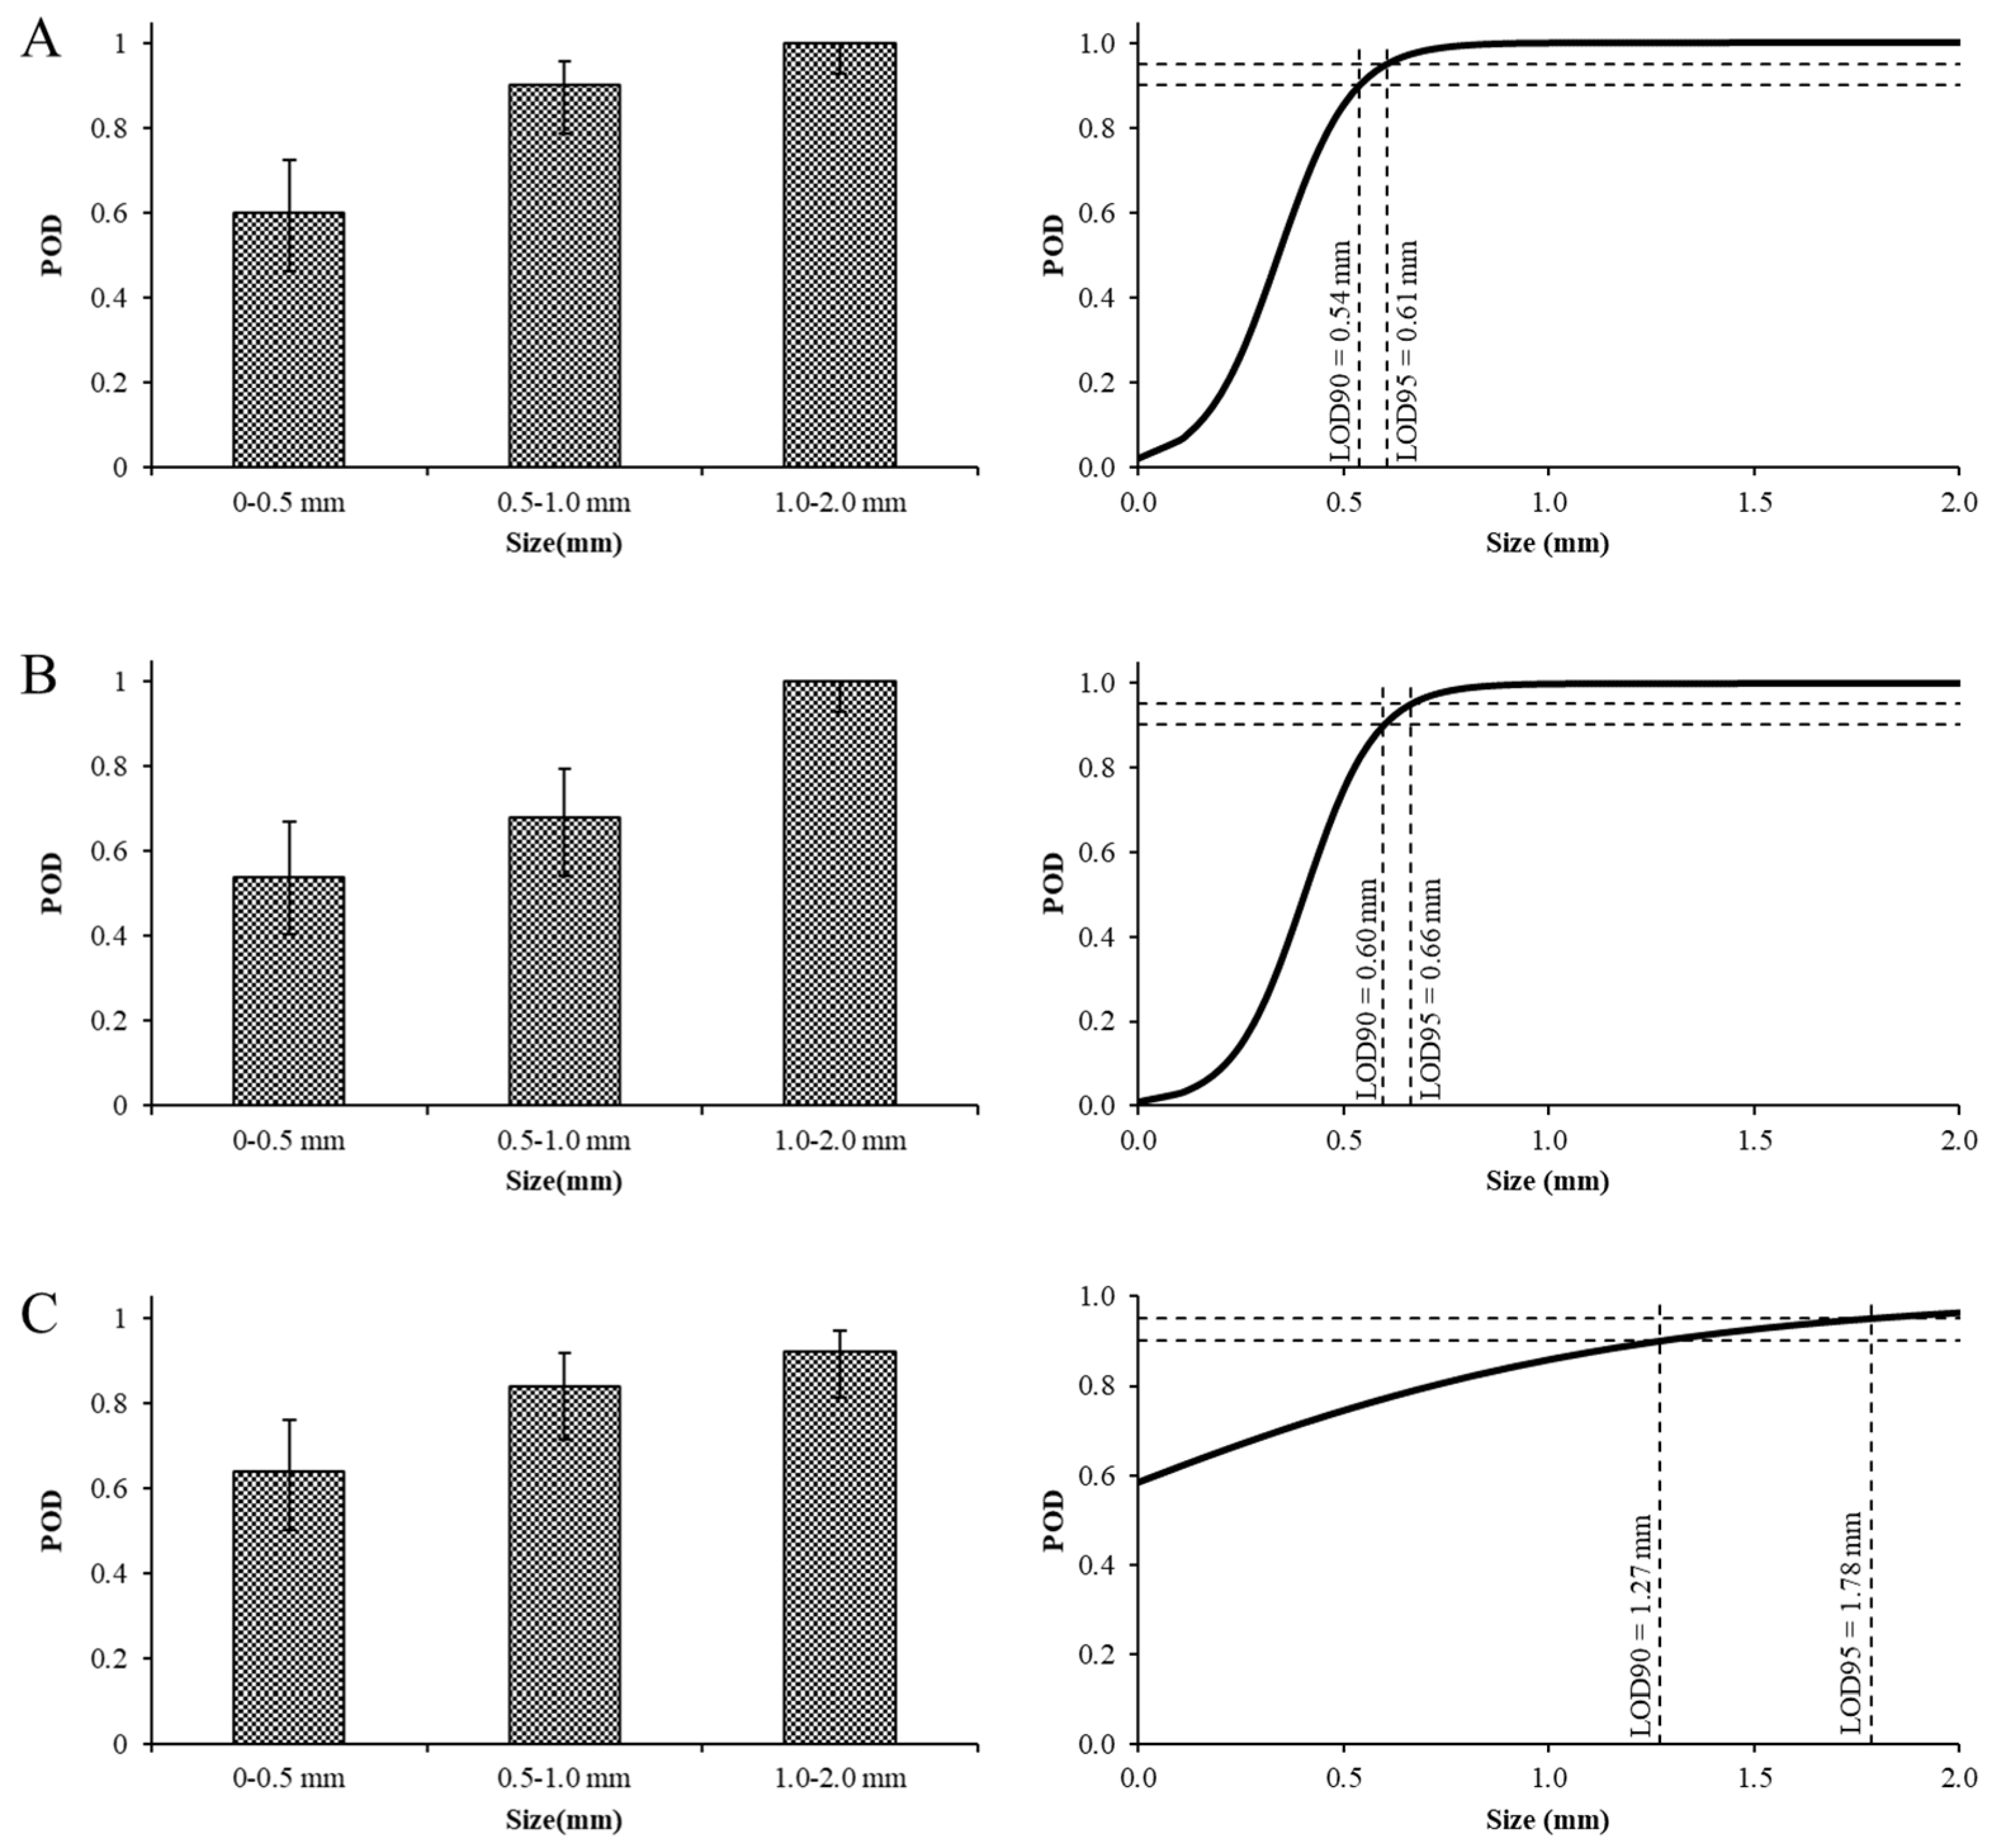
For each metal, the observed probability of detection (POD) and the continuous POD(d) curves as a function of particle diameter were estimated, and the corresponding LOD90 and LOD95 values were obtained (Figure 9). For logistic regression, bin midpoints (0.25, 0.75, and 1.50 mm) were used as representative diameters; sensitivity analysis using alternative mappings is summarized in Appendix A (Table A2), which supports the robustness of the reported POD/LOD estimates.
For aluminum (Al), the observed POD values in the three size classes were 60% (30/50), 90% (45/50), and 100% (50/50), yielding an overall POD of 83.3% (125/150). For copper (Cu), the POD values were 54% (27/50), 68% (34/50), and 100% (50/50), corresponding to an overall POD of 74.0% (111/150). For stainless steel (SUS), the POD values were 64% (32/50) for <0.5 mm, 84% (42/50) for 0.5–1.0 mm, and 92% (46/50) for 1.0–2.0 mm, with an overall POD of 80.0% (120/150). For all three metals, POD increased monotonically with particle size, and in the 1.0–2.0 mm range, the POD exceeded 0.9 for all materials, reaching 1.0 for Al and Cu.
The POD(d) curves and material-specific LOD90 and LOD95 values show distinct trends among the three metals. For Al, the POD(d) curve rises steeply within the 0.5–1.0 mm range and approaches saturation below 1 mm, with both LOD90 and LOD95 estimated to be below 1.0 mm (e.g., LOD90 ≈ 0.54 mm and LOD95 ≈ 0.61 mm) (Figure 9A), indicating the highest sensitivity among the tested materials. For Cu, the POD at 0.5–1.0 mm is 68%, lower than that of Al, and the POD(d) curve increases more gradually; LOD90 and LOD95 are also below 1.0 mm (e.g., LOD90 ≈ 0.60 mm and LOD95 ≈ 0.66 mm) but are somewhat larger than those of Al (Figure 9B). For SUS, the POD of 84% in the 0.5–1.0 mm range is reasonably high; however, the rise in the POD(d) curve is shifted toward larger sizes compared with Cu, resulting in LOD90 ≈ 1.27 mm and LOD95 ≈ 1.78 mm (Figure 9C).
These results indicate that, under the standard operating conditions, the proposed electric-field-based detection system provides high detection reliability for all three metals in the 1.0–2.0 mm range, whereas in the 0.5–1.0 mm range, the best performance is obtained for Al, while Cu and especially SUS exhibit higher detection limits. This trend can be interpreted as reflecting differences in electrical conductivity between highly conductive non-ferrous metals (Al and Cu) and SUS. To further improve sensitivity for SUS and Cu, optimization of electrode geometry, electric-field distribution, and detection thresholds will likely be required.

3.3. Safety Evaluation Results

3.3.1. Local Heating Simulation and Verification

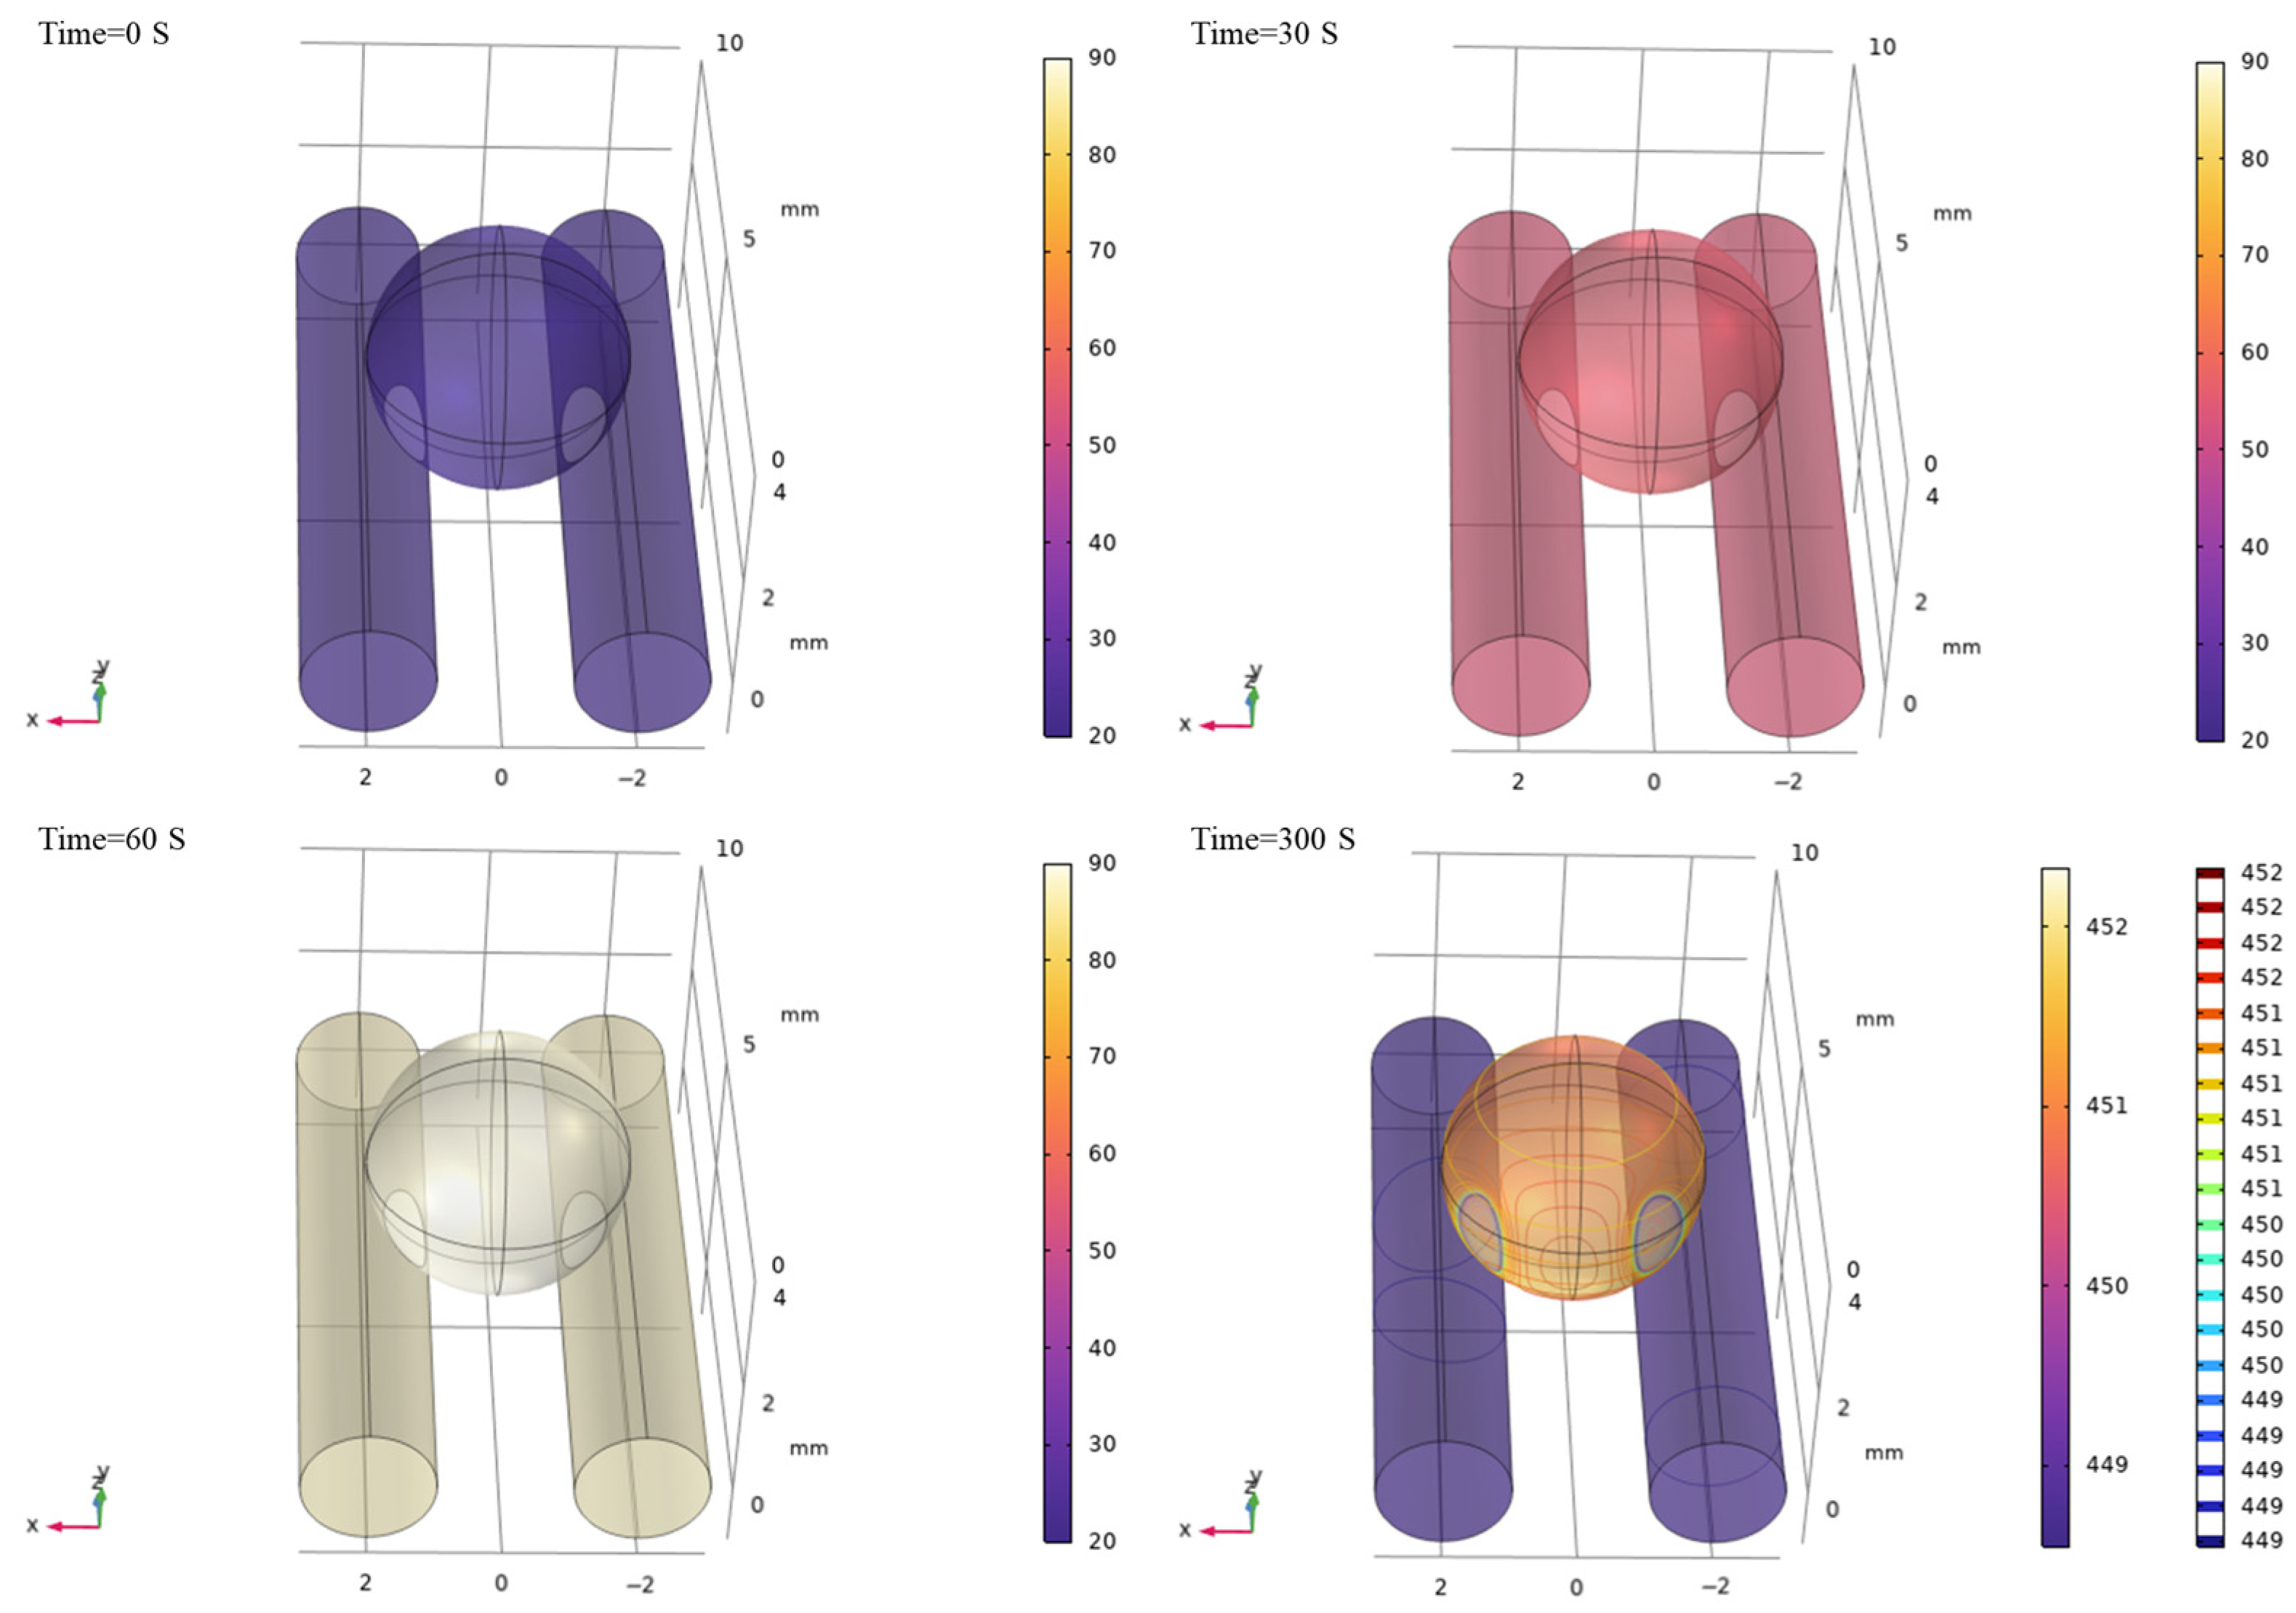
The simulated local heating behavior in the vicinity of the contact region between the electrode and metallic particle is shown in Figure 10. Starting from an initial temperature of T0 = 20 °C, the temperature at the particle–electrode contact region reached approximately 50 °C at t = 30 s. At t = 60 s, heat generated at the contact region had diffused into the particle, and the local maximum temperature increased to about 90 °C. Under continued heating up to t = 300 s, the maximum temperature increased to approximately 451 °C, and the adjacent electrode surface near the contact region reached a similar temperature.
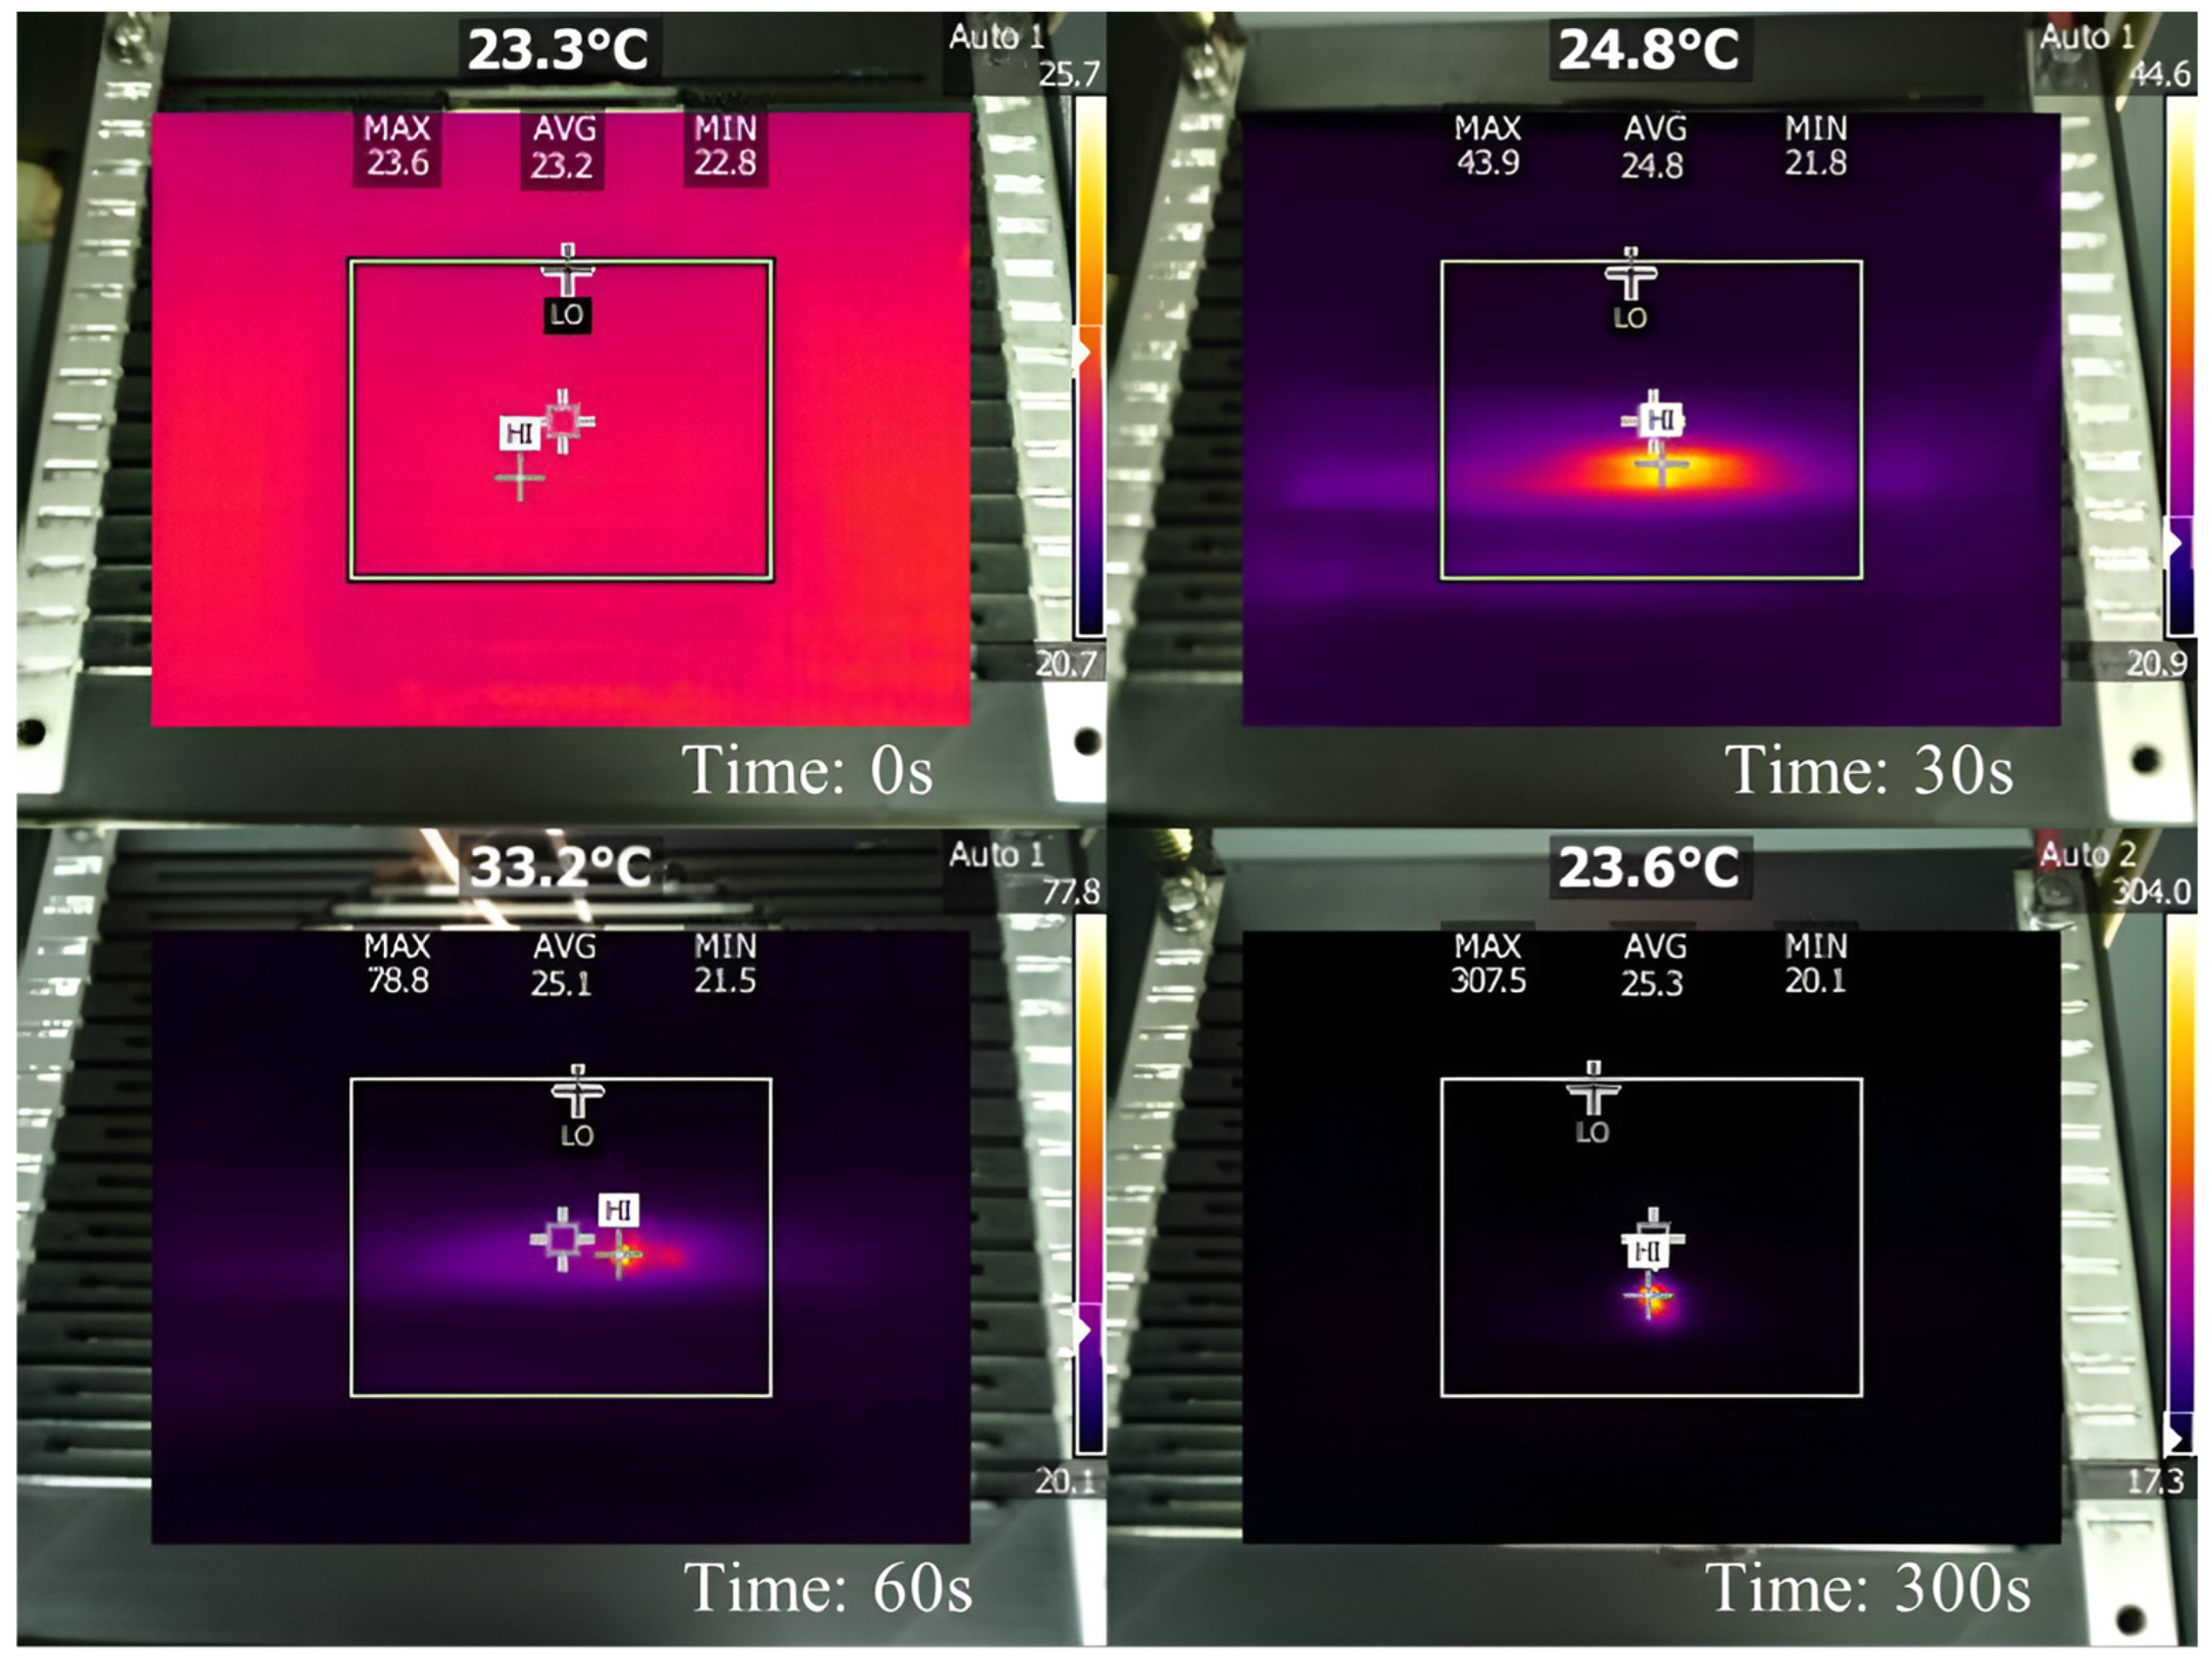
The corresponding temperature evolution measured at the scale of the actual device using an infrared thermal camera is presented in Figure 11. At the start of measurement (t = 0 s), the average electrode surface temperature was approximately 23 °C. After a metallic particle produced a spark between the electrodes, localized heating patterns emerged at the central region where the particle bridged the electrodes, and the maximum temperature at this location increased to 43.9 °C at t = 30 s. At t = 60 s, the maximum temperature in the same region further increased to 78.8 °C, and in the thermal images, this high-temperature zone appeared as an elliptical or spot-like area confined around the particle position. By t = 300 s, the maximum temperature recorded by the thermal camera reached 307.5 °C. However, at all time points, the average (AVG) and minimum (MIN) temperatures displayed on the thermal images remained in the range of 20–30 °C over most of the electrode surface.
Comparison of the simulation and thermal-imaging results in terms of temperature–time profiles shows that both exhibit a rapid temperature rise within the first 60 s, followed by a more gradual increase, indicating a nonlinear heating behavior. In the simulation, which focused solely on the local electrode–particle region, the maximum temperature reached approximately 451 °C at 300 s, whereas in the actual device, the maximum temperature saturated at a lower level of about 307.5 °C at the same time. The numerical analysis thus provided an upper bound for local heating under a worst-case scenario in which a metallic particle remains in prolonged contact with the electrode, while the thermal imaging measurements under realistic operating conditions confirmed that the resulting heat remains confined to a limited local region and does not spread over the entire electrode surface or into the surrounding powder bed. During normal operation, particles traverse the electrode gap in free-fall and are not mechanically retained between the electrodes; therefore, sustained bridging/contact over hundreds of seconds is unlikely. In practice, prolonged-contact scenarios can be further prevented by terminating the high-voltage output (and/or stopping the feed/line) immediately after a detection event, thereby avoiding sustained discharge heating. In addition, by quantifying the time required for the local electrode area to reach a critical temperature, the results can be used to design a power-shutoff interlock logic that is linked to detection events.

3.3.2. Evaluation of Ozone Generation

Under the standard operating conditions (electrode gap d = 2 mm, driving frequency 15 kHz, applied voltage 1.35 kV), ozone concentration was monitored using an ozone detector installed at the lower part of the detection unit while the electric field was continuously applied for 1 h without introducing metallic particles or powder (Figure 12). Based on the minimum, average, and maximum values over the 1 h period, the ozone concentration remained at 0.01 ppm (minimum), 0.02 ppm (average), and 0.04 ppm (maximum). No clear upward trend with time was observed during the measurement period, and no short-term peaks appeared immediately after the electric field was switched on or off.
When compared with external reference standards, these concentrations are lower than the World Health Organization (WHO) 2021 outdoor air guideline value for ozone, which recommends an 8 h mean of 60 µg·m−3 (approximately 0.05 ppm) [32]. They are also below the U.S. ozone National Ambient Air Quality Standards (NAAQS) 8 h standard of 0.070 ppm [33] and the California 1 h ozone standard of 0.09 ppm [34]. Even assuming that an operator remains near the device for more than 1 h, the observed average concentration (0.02 ppm) corresponds to less than about 40% of these environmental and occupational guideline values, suggesting a very low level of health risk. In addition, at 1.35 kV, no spontaneous or self-sustained plasma discharges were observed, and the ozone concentration remained low and stable over time without accumulation. These findings indicate that, under the established standard operating conditions (2 mm, 15 kHz, 1.35 kV), operation of the electric-field-based detection unit does not pose a significant additional ozone exposure risk.

3.4. Integration of the Real-Time Detection System and Field Feasibility

3.4.1. Custom GUI and Field Implementation

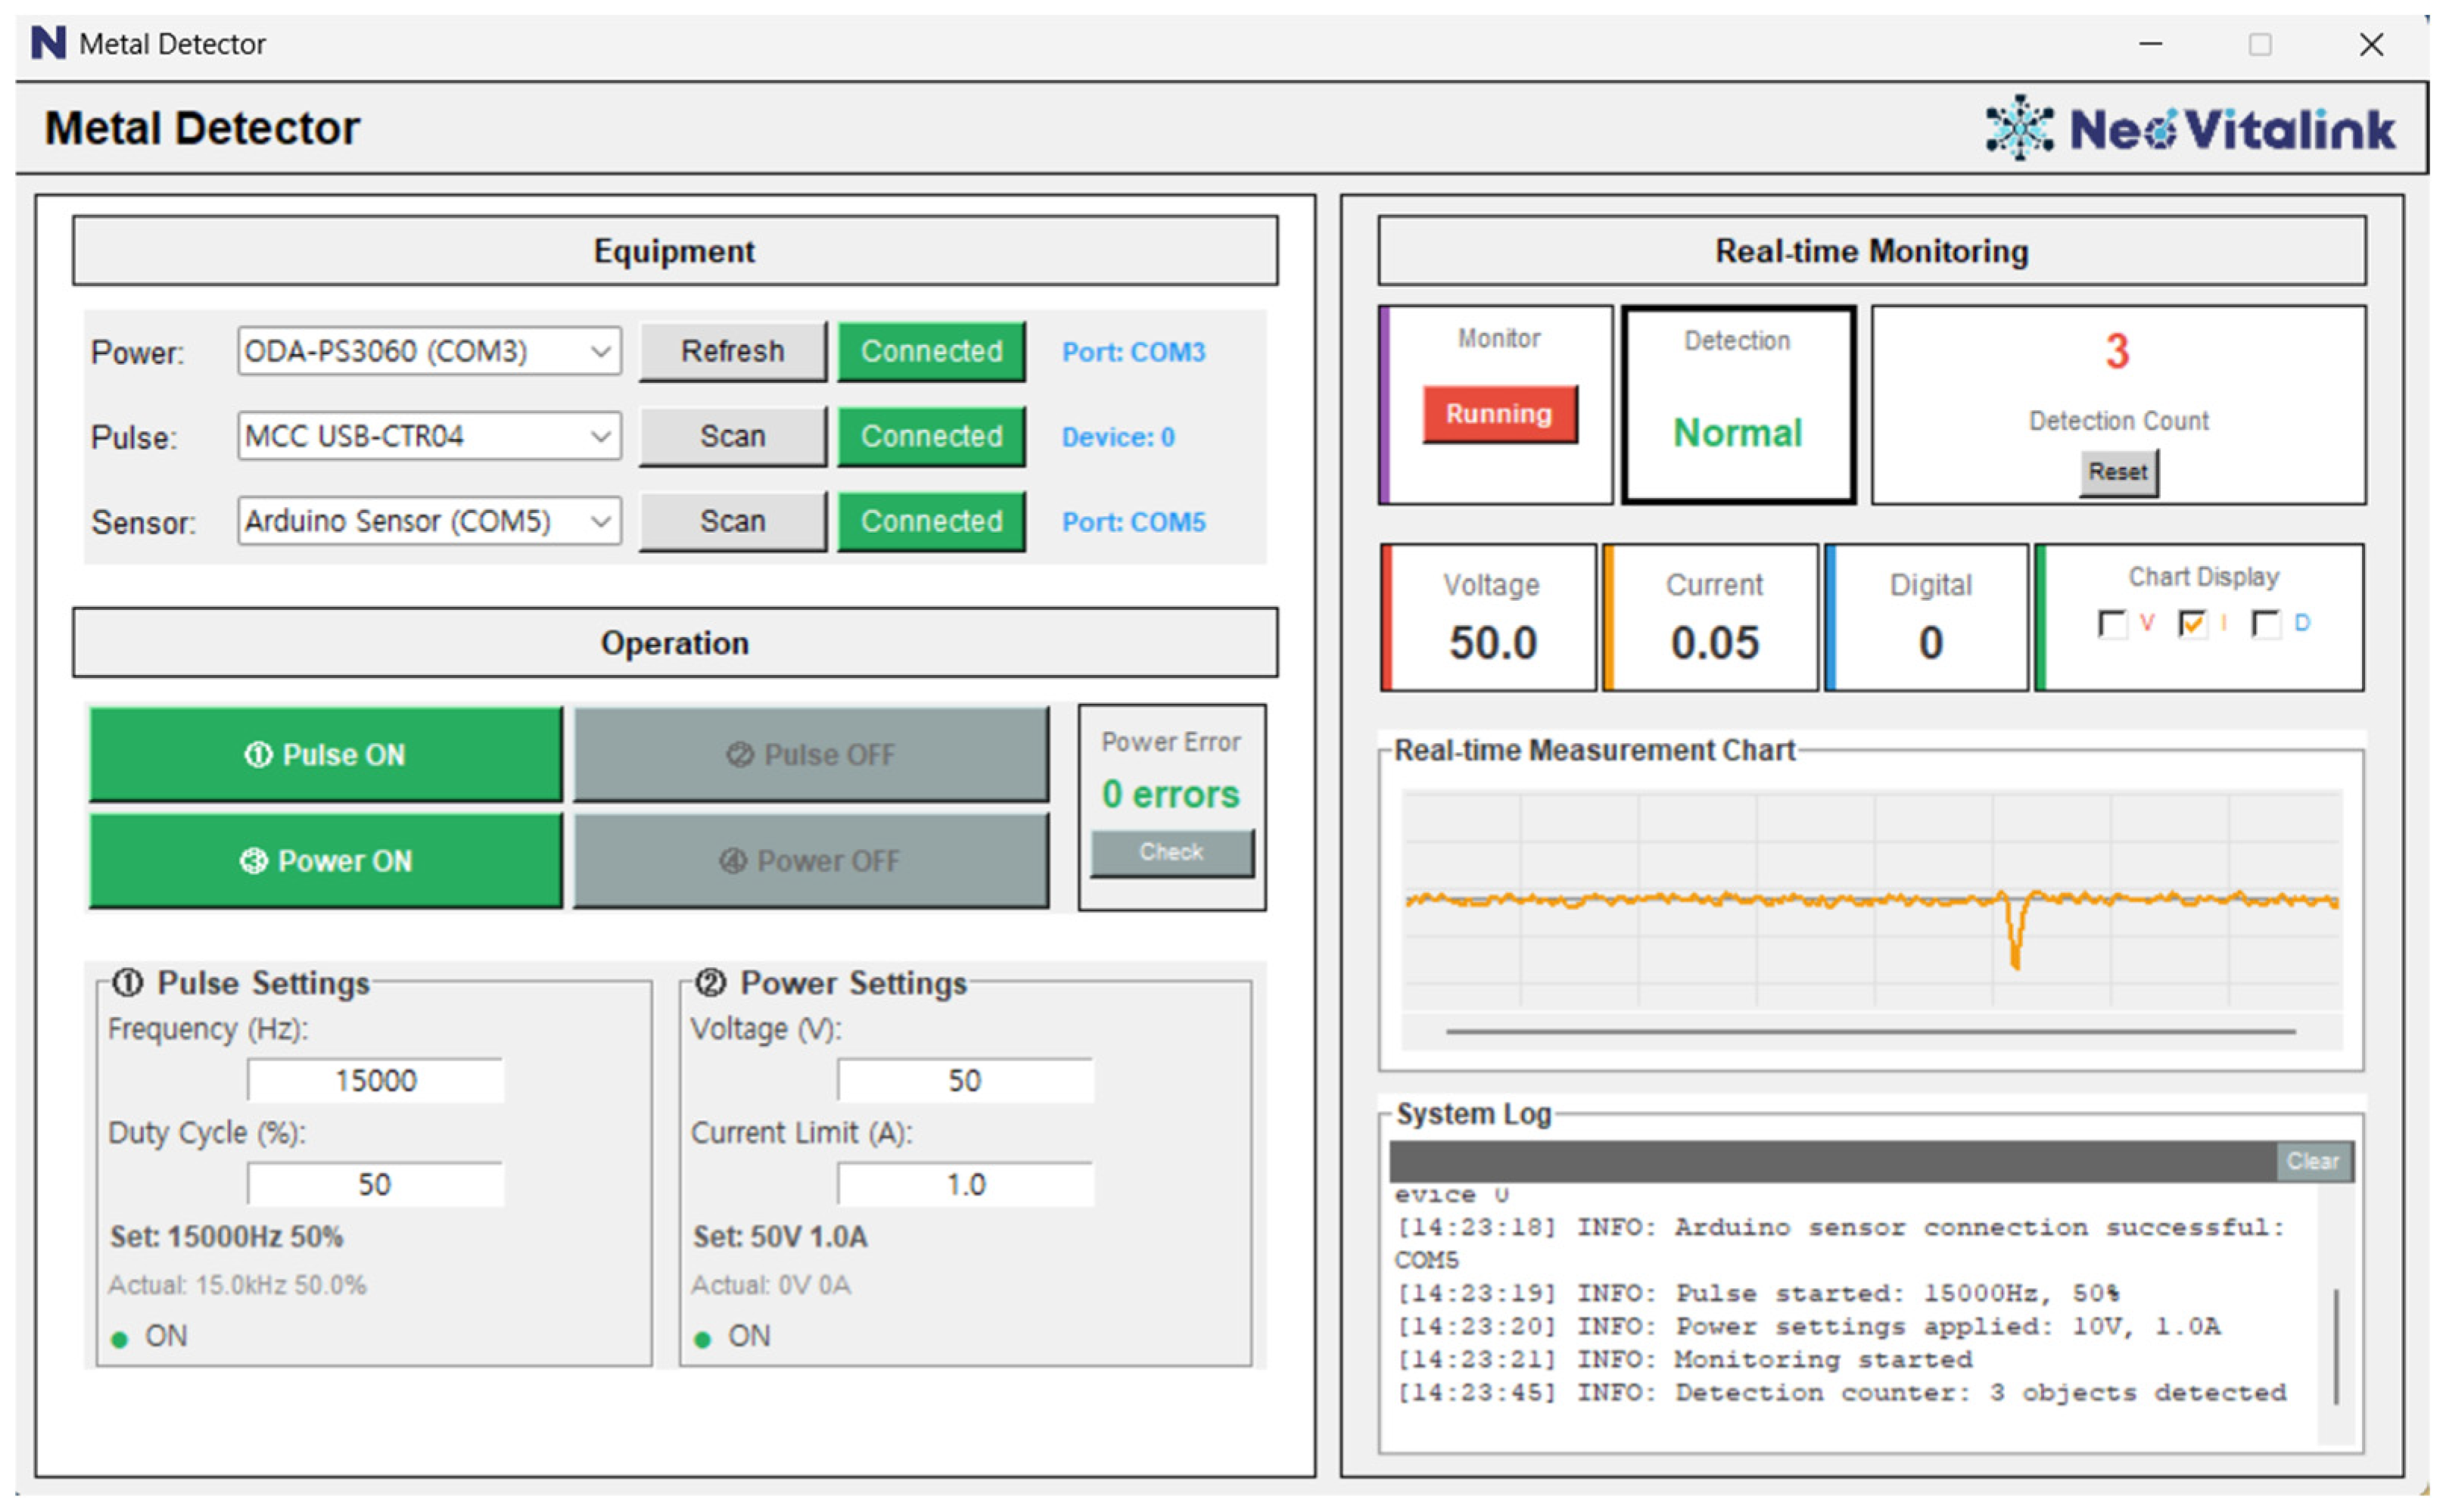
To enable practical operation and monitoring of the electric-field-based metallic contaminant detection system in processing environments, a dedicated GUI integrating power control and data acquisition/visualization functions was developed (Figure 13). The Equipment panel displays the connection status of the pulse driver, high-voltage power supply, and sensor module, and provides port scanning and connect/disconnect functions for each device, thereby minimizing setup time. The Operation panel allows one-click control of Pulse ON/OFF and Power ON/OFF to improve operational convenience.
In the Pulse/Power Settings panel, the user can configure the driving frequency (e.g., 15 kHz), duty ratio, applied voltage, and current limits, while simultaneously viewing both the setpoints and measured values to intuitively verify whether the power conditions are within the desired range. The Real-time Monitoring area displays voltage, current, and detection count in real time and visualizes the baseline current and ΔI events as time-series plots, allowing immediate confirmation of events labeled by the real-time detection algorithm. The System Log window records key events—such as device connection status, parameter changes, and detection counts—in chronological order, and all logs and measurement data are automatically saved in CSV format to ensure reproducibility and traceability.
This GUI implementation enables the performance validated by the detection algorithm and POD analysis to be reproduced in the field, and consolidates power-condition adjustment, system health checks, and detection record management into a single interface, thereby reducing the operational, training, and maintenance burden for small-scale processors. Furthermore, by linking the GUI with safety logic that automatically shuts off power when local overheating, overcurrent, or abnormal spike patterns are detected, the time limits identified in the safety evaluation can be directly incorporated into operational control, providing a pathway toward enhanced system safety.

3.4.2. Comparison with Existing Detection Systems

The proposed electric-field-based detector differs from conventional approaches in that it senses transient current-spike responses (ΔI) generated when conductive metallic particles traverse a narrow alternating-electrode gap together with the powder stream. This configuration enables compact installation in short vertical sections of a processing line and, in principle, allows detection of both ferrous and non-ferrous metals using the same sensing mechanism.
A variety of foreign-matter detection and separation technologies are currently used or under development for powdered-food processing, including screens/sieves, magnetic bars, inductive metal detectors, X-ray inspection systems, and optical/NIR-based sorters [35,36,37,38,39]. Because each technology exhibits distinct trade-offs in detection targets, sensitivity, installation requirements, operating burden, and throughput, Table 3 summarizes representative systems and their strengths and constraints in the context of powder processing. In this comparison, the present system is positioned as an in-line event detector for conductive metallic particles, offering compact integration and broad metal coverage.
Despite these advantages, several practical limitations remain for industrial implementation. First, throughput is currently constrained by the narrow electrode gap required for stable electric-field interaction, particularly for cohesive powders prone to bridging and clogging. Although the vibrating motor mitigates large agglomerates, bridging/clogging risk is expected to be higher than that of open-area systems. Second, because the detection principle relies on current-spike responses, the method is inherently limited to conductive metallic contaminants and is not intended for non-metallic foreign bodies.
Future work will therefore focus on improving throughput and robustness by enlarging the effective flow cross-section (e.g., wider channels or parallel/multi-channel electrode modules) and by adopting anti-bridging feeding/discharge designs to maintain stable mass flow through the sensing zone.

4. Conclusions

In this study, an electric-field-based metallic contaminant detection system was designed, and its performance was comprehensively evaluated in terms of electrode–power conditions, detection accuracy, and safety. Analysis of the electrode–power resonance characteristics demonstrated that an electrode gap of 2 mm provided the best matching between the power source (15 kHz) and the resonant circuit, and voltage screening experiments confirmed that only 1.35 kV yielded a stable baseline and clear current spikes associated with particle passage without partial discharge or self-sustained plasma. Accordingly, d = 2 mm, f = 15 kHz, and V = 1.35 kV were established as the optimal operating conditions for the detection unit. Under these conditions, application of the real-time detection algorithm resulted in observed POD values for SUS of 64/84/92% for <0.5/0.5–1.0/1.0–2.0 mm, 60/90/100% for Al, and 54/68/100% for Cu, indicating that detection probability increased with particle size. In particular, all three metals achieved POD ≥ 0.9 in the 1.0–2.0 mm range, demonstrating high detection reliability in this size class. Logistic POD–LOD analysis further estimated that the LOD90 and LOD95 for the highly conductive Al were located at the smallest diameters, whereas SUS exhibited the largest LOD values, clearly revealing material-dependent detection limits governed by electrical conductivity.
From a safety perspective, coupled electro-thermal simulations were used to evaluate local temperature rise under a conservative worst-case condition in which a metallic particle remains continuously bridged between the electrodes. Comparison of the simulated and thermographically measured temperature profiles confirmed that even when discharges occurred with metallic particles of 2 mm or larger spanning the electrodes, the maximum temperature at t ≈ 60 s was around 78.8 °C, indicating a finite safety margin before significant changes in powder properties or damage to the detection unit become a major concern. These results suggest that implementing an interlock logic that shuts off power or stops the line within 60 s after a detection event would further enhance the thermal safety of the system. At t = 300 s, the simulation predicted a maximum local temperature of approximately 450 °C, whereas infrared measurements under the same conditions exhibited saturation at about 300 °C, confirming that, in the actual system, heat is more strongly limited by dissipation to surrounding structures via convection and radiation. In addition, during 1 h of continuous operation, the ozone concentration remained in the range of 0.01–0.04 ppm, indicating that application of the electric field does not substantially increase ozone exposure risk under the established operating conditions.
Overall, the proposed electric-field-based metallic contaminant detection system demonstrated high detection reliability for 1.0–2.0 mm particles (POD ≥ 0.9 for all tested metals) and acceptable safety within the tested operating window, supporting its feasibility as a prototype detection module for small-scale powdered food processing lines. In the present work, the practical implementation level corresponds to real-time detection and monitoring based on current-spike events under fixed operating conditions (d = 2 mm, f = 15 kHz, and V = 1.35 kV). As a next step, we will integrate the detection module with an automatic rejection/removal mechanism to realize a practical in-line system.
Further improvement is needed to enhance sensitivity in the sub-millimeter range, particularly for <0.5 mm particles and for SUS, where the estimated detection limits are higher than those for highly conductive non-ferrous metals. Future work will therefore focus on optimizing electrode geometry, electric-field distribution, and decision thresholds to improve fine-particle detection, integrating an automatic removal/rejection module with interlock-based safety control, and validating continuous in-line performance across a wider variety of powdered foods.

Author Contributions

Conceptualization, S.H.L., H.C. (Hojong Chang); Software, J.K.K., H.C. (Hyun Choi); Investigation, J.K.K., J.H.S., S.Y.J., H.C. (Hyun Choi); Writing—Original Draft, J.K.K.; Writing—Review and Editing, S.H.L., H.C. (Hojong Chang); Supervision, J.H.S., S.Y.J., H.C. (Hyun Choi). All authors have read and agreed to the published version of the manuscript.

Funding

This research was funded by the Ministry of Agriculture, Food and Rural Affairs (RS-2024-00404647).

Data Availability Statement

Data presented in this study are available in the article.

Acknowledgments

This work was carried out with the support of the High Value-Added Food Technology Development Program of the Korea Institute of Planning and Evaluation for Technology in Food, Agriculture and Forestry (IPET).

Conflicts of Interest

Author Hyun Choi was employed by the company Neo Lab Tech, Daejeon, Korea. The remaining authors declare that the research was conducted in the absence of any commercial or financial relationships that could be construed as a potential conflict of interest.

Abbreviations

The following abbreviations are used in this manuscript:
PODProbability of Detection
LODLimit of Detection
FFTFast Fourier Transform
RMIResonance Matching Index
ROIRegion of Interest
SNRSignal-to-Noise Ratio
SDStandard Deviation

Appendix A

Table A1. Mean ± SD (n = 3) of derived resonance parameters for each electrode gap, used to quantify propagated variability from the measured Ceq and Req reported in Table 1.
Gap d (mm)QresBWres (kHz)|fsrc − fres| (kHz)RMI
1.05.2548 ± 0.04810.9618 ± 0.008812.5255 ± 0.0000230.1904 ± 0.00174
1.54.5098 ± 0.06171.4163 ± 0.019381.1924 ± 0.0002320.5939 ± 0.00813
2.03.8451 ± 0.16261.8744 ± 0.079280.3726 ± 0.0002672.5151 ± 0.106
Table A2. Sensitivity of LOD90 and LOD95 to representative diameter mapping (drep) used in logistic POD–LOD estimation.
Mappingdrep 1AlCuSUS
<0.5 20.5–1.01.0–2.0LOD90LOD95LOD90LOD95LOD90LOD95
Midpoint0.250.751.50.5380.6060.5960.6611.2711.784
Geometric mean0.350.7071.4140.6920.8331.0111.2301.1611.568
Lower bound0.20.510.4810.5970.7310.9060.8191.123
Upper bound0.5120.9791.1761.4281.7361.6432.216
1 drep is representative diameter. 2 The <0.5 mm bin is open-ended; therefore, drep was varied (0.20–0.50 mm) for sensitivity analysis. Unit: mm.

References

  1. Jiang, H.; Zhang, N.; Xie, L.; Li, G.; Chen, L.; Liao, Z. A Comprehensive Review of the Rehydration of Instant Powders: Mechanisms, Influencing Factors, and Improvement Strategies. Foods 2025, 14, 2883. [Google Scholar] [CrossRef]
  2. Arora, I.; White, S.; Mathews, R. Global Dietary and Herbal Supplement Use during COVID-19—A Scoping Review. Nutrients 2023, 15, 771. [Google Scholar] [CrossRef]
  3. Korea Consumer Agency (KCA). Metallic Foreign Bodies (Metal Powder) Found in Spices Over the Permitted Limits. Press Release. 27 August 2020. Available online: https://www.kca.go.kr/eng/sub.do?menukey=6007&mode=view&no=1002986014 (accessed on 30 January 2026).
  4. Cárcel-Carrasco, J.; Pascual-Guillamón, M.; Salas-Vicente, F. Composition of some metallic fragments found in food that are undetectable by magnetic or eddy currents equipment: A case study. LWT 2022, 153, 112358. [Google Scholar] [CrossRef]
  5. Trafiałek, J.; Kaczmarek, S.; Kolanowski, W. The risk analysis of metallic foreign bodies in food products. J. Food Qual. 2016, 39, 398–407. [Google Scholar] [CrossRef]
  6. Royer, A.; Sharman, T. Copper Toxicity. In StatPearls; StatPearls Publishing: Treasure Island, FL, USA, 2025. Available online: https://www.ncbi.nlm.nih.gov/books/NBK557456/ (accessed on 30 January 2026).
  7. Kim, J.H.; Lee, D.S.; Kim, K.M. Acute Appendicitis Caused by Foreign Body Ingestion. Ann. Surg. Treat. Res. 2015, 89, 158. [Google Scholar] [CrossRef]
  8. Haimovich, H.; Marelli, D.; Sarlinga, D. A Signal Processing Method for Metal Detection Sensitivity Improvement in Balance-Coil Metal Detectors for Food Products. In Proceedings of the 2020 IEEE International Conference on Industrial Technology (ICIT 2020), Buenos Aires, Argentina, 26–28 February 2020; pp. 645–651. [Google Scholar] [CrossRef]
  9. Payne, K.; O’Bryan, C.A.; Marcy, J.A.; Crandall, P.G. Detection and Prevention of Foreign Material in Food: A Review. Heliyon 2023, 9, e19574. [Google Scholar] [CrossRef] [PubMed]
  10. Taylor, E. HACCP in small companies: Benefit or burden? Food Control 2001, 12, 217–222. [Google Scholar] [CrossRef]
  11. Chen, H.; Liou, B.-K.; Dai, F.-J.; Chuang, P.-T.; Chen, C.-S. Study on the risks of metal detection in food solid seasoning powder and liquid sauce to meet the core concepts of ISO 22000:2018 based on the Taiwanese experience. Food Control 2020, 111, 107071. [Google Scholar] [CrossRef]
  12. Schwaminger, S.P.; Fraga-García, P.; Eigenfeld, M.; Becker, T.M.; Berensmeier, S. Magnetic Separation in Bioprocessing Beyond the Analytical Scale: From Biotechnology to the Food Industry. Front. Bioeng. Biotechnol. 2019, 7, 233. [Google Scholar] [CrossRef]
  13. Park, B.K.; Kim, S.H.; Ye, E.Y.; Lee, H.J.; Seo, S.J.; Kwon, S.H.; Heo, M.J. A study on the safety of powdered agricultural products in Incheon. J. Food Hyg. Saf. 2020, 35, 136–145. [Google Scholar] [CrossRef]
  14. Nakai, Y.; Mishima, F.; Akiyama, Y.; Nishijima, S. Development of magnetic separation system for powder separation. IEEE Trans. Appl. Supercond. 2010, 20, 941–944. [Google Scholar] [CrossRef]
  15. Fitzsimmons, J.A.; Kinchla, A.J.; Allingham, C. Assessing the cost barrier for small and medium food processing businesses to meet Preventive Controls for Human Foods standards. PLoS ONE 2024, 19, e0306618. [Google Scholar] [CrossRef] [PubMed]
  16. Ministry of Food and Drug Safety (MFDS). Food Code (Standards and Specifications for Foods). MFDS Notice No. 2020-24. 14 April 2020. Available online: https://www.law.go.kr/LSW//admRulLsInfoP.do?admRulId=37260&efYd=0 (accessed on 19 January 2026).
  17. Mandrić Radivojević, V.; Rupčić, S.; Srnović, M.; Benšić, G. Measuring the dielectric constant of paper using a parallel plate capacitor. Int. J. Electr. Comput. Eng. Syst. 2018, 9, 1–10. [Google Scholar] [CrossRef]
  18. Ortigueira, M.D.; Martynyuk, V.; Kosenkov, V.; Batista, A.G. A New Look at the Capacitor Theory. Fractal Fract. 2023, 7, 86. [Google Scholar] [CrossRef]
  19. Haus, H.A.; Melcher, J.R. Electromagnetic Fields and Energy; Massachusetts Institute of Technology (MIT) OpenCourseWare: Cambridge, MA, USA, 1989; Available online: http://ocw.mit.edu (accessed on 3 March 2026).
  20. Lv, B.; Li, R.; Fu, J.; Wu, Q.; Zhang, K.; Chen, W.; Wang, Z.; Ma, R. Analysis and modeling of Fano resonances using equivalent circuit elements. Sci. Rep. 2016, 6, 31884. [Google Scholar] [CrossRef]
  21. Paulson, J.G.; Ray, M.W. Exploration of the Q Factor for a Parallel RLC Circuit. Am. J. Phys. 2022, 9, 903–907. [Google Scholar] [CrossRef]
  22. Chai, L.; Qi, J.; Teng, Y.; Hong, L.; Wang, L. Experimental study and design of RLC resonant circuit. In Proceedings of the 2024 5th International Seminar on Artificial Intelligence, Networking and Information Technology (AINIT 2024), Nanjing, China, 29–31 March 2024; pp. 2024–2027. [Google Scholar] [CrossRef]
  23. Huang, Y.; Yan, K.; Li, Q.; Song, X.; Zhang, D.; Zhang, Q. Very-high-frequency resonant flyback converter with integrated magnetics. Electronics 2024, 13, 4363. [Google Scholar] [CrossRef]
  24. Subair, S.M.; Balasubramaniam, K.; Rajagopal, P.; Kumar, A.; Rao, B.P.; Jayakumar, T. Finite element simulations to predict probability of detection (PoD) curves for ultrasonic inspection of nuclear components. Procedia Eng. 2014, 86, 461–468. [Google Scholar] [CrossRef]
  25. Virkkunen, I.; Koskinen, T.; Papula, S.; Sarikka, T.; Hänninen, H. Comparison of â versus a and Hit/Miss POD-Estimation Methods: A European Viewpoint. J. Nondestruct. Eval. 2019, 38, 89. [Google Scholar] [CrossRef]
  26. Kewei, H.; Jie, L.; Xiaolin, H.; Ningjun, F. Analysis and simulation of the influence of transformer parasitics to low power high voltage output flyback converter. In Proceedings of the 2008 IEEE International Symposium on Industrial Electronics (ISIE 2008), Cambridge, UK, 30 June–2 July 2008; pp. 305–310. [Google Scholar] [CrossRef]
  27. Salem, M.; Jusoh, A.; Idris, N.R.N.; Das, H.S.; Alhamrouni, I. Resonant power converters with respect to passive storage (LC) elements and control techniques—An overview. Renew. Sustain. Energy Rev. 2018, 91, 504–520. [Google Scholar] [CrossRef]
  28. Zhou, H.; Liu, J.; Fang, Z.; Zhang, P.; Zhang, B.; Ma, M.; Zeng, J. Control Strategy for Resonant Inverter in High Frequency AC Power Distribution System with Harmonic Suppression and Transient Performance Improvement. Energies 2022, 15, 8992. [Google Scholar] [CrossRef]
  29. Yang, Z.; Zhou, Q. A Stability Improvement Control Strategy Research for LLC Resonant Converter with Single Neuron PI-I Double Closed Loop Control. Ain Shams Eng. J. 2024, 15, 102934. [Google Scholar] [CrossRef]
  30. Jakubowski, T.; Holub, M.; Kalisiak, S. Resonant Inverter with Resonance Frequency Tracking for DBD Plasma Reactor Supply. Eur. Phys. J. Appl. Phys. 2013, 61, 24304. [Google Scholar] [CrossRef]
  31. ASTM E2862-18; Standard Practice for Probability of Detection Analysis for Hit/Miss Data. ASTM International: West Conshohocken, PA, USA, 2018. Available online: https://www.astm.org/e2862-18.html (accessed on 3 February 2026).
  32. World Health Organization (WHO). WHO Global Air Quality Guidelines: Particulate Matter (PM2.5 and PM10), Ozone, Nitrogen Dioxide, Sulfur Dioxide and Carbon Monoxide; WHO: Geneva, Switzerland, 2021; Available online: https://iris.who.int/server/api/core/bitstreams/551b515e-2a32-4e1a-a58c-cdaecd395b19/content (accessed on 10 March 2026).
  33. U.S. Environmental Protection Agency (EPA). Ozone National Ambient Air Quality Standards (NAAQS). Available online: https://www.epa.gov/ground-level-ozone-pollution/ozone-national-ambient-air-quality-standards-naaqs (accessed on 10 March 2026).
  34. California Air Resources Board (CARB). Air Quality Standards for Ozone. Available online: https://ww2.arb.ca.gov/resources/fact-sheets/air-quality-standards-ozone (accessed on 10 March 2026).
  35. Peng, L.; Feng, H.; Wang, Z.; Wang, H.; Yang, H.; Huang, H. Screening Mechanism and Properties of a Cantilevered Vibrating Sieve for Particles Processing. Appl. Sci. 2019, 9, 4911. [Google Scholar] [CrossRef]
  36. Mishima, F.; Terada, T.; Akiyama, Y.; Izumi, Y.; Okazaki, H.; Nishijima, S. Research and Development of Superconducting Magnetic Separation System for Powdered Products. IEEE Trans. Appl. Supercond. 2008, 18, 824–827. [Google Scholar] [CrossRef]
  37. Okabe, S.; Sasada, I. Development of a Planar-Type High Sensitivity Metallic Contaminant Detector. AIP Adv. 2017, 7, 56680. [Google Scholar] [CrossRef]
  38. Haff, R.P.; Toyofuku, N. X-ray Detection of Defects and Contaminants in the Food Industry. Sens. Instrum. Food Qual. Saf. 2008, 2, 262–273. [Google Scholar] [CrossRef]
  39. Yin, J.; Hameed, S.; Xie, L.; Ying, Y. Non-Destructive Detection of Foreign Contaminants in Toast Bread with Near-Infrared Spectroscopy and Computer Vision Techniques. J. Food Meas. Charact. 2021, 15, 189–198. [Google Scholar] [CrossRef]
Figure 1. Representative images of metal particles (Al, Cu, SUS) by size class. Classes: 1.00–2.00 mm, 0.50–1.00 mm, <0.50 mm. Scale bar = 5 mm.
Processes 14 00922 g001
Figure 2. Schematic (left) and photograph (right) of the feeding/transport system showing the hopper, screw feeder with anti-agglomeration module, and the position of the detection unit.
Processes 14 00922 g002
Figure 3. Power and measurement setup for the electric-field detection system with real-time data acquisition: (1) DC power supply, (2) custom-built IGBT module, (3) function generator, (4) flyback module, (5) oscilloscope, (6) data acquisition (DAQ) unit, (7) differential probe, (8) current monitor, and (9) PC for real-time monitoring of voltage and current signals.
Processes 14 00922 g003
Figure 4. Electrode and frame design for the detection unit. (A) Drawing and shape of a single stainless-steel electrode. (B) Power bus plate used to feed all electrodes simultaneously at the top. (C) PLA insulating frame that holds and aligns the electrode plate. (D) Assembly layout and photograph of the complete electrode module, including the power-feed plate and laser-welded contact surface. (E) Electrode plates with gaps of 1.0, 1.5, and 2.0 mm, and the corresponding number of electrodes for each gap.
Processes 14 00922 g004
Figure 5. Electrode–particle model used in COMSOL. (A) Geometry and coordinate system showing one spherical metal particle in contact. (B) Initial temperature field at t = 0 s (all domains at T0 = 20 °C).
Processes 14 00922 g005
Figure 6. FFT spectrum of the applied voltage, showing the fundamental source frequency peak at ~7.58 kHz and the third harmonic near 22.38 kHz.
Processes 14 00922 g006
Figure 7. Voltage stability comparison at d = 2.0 mm for selecting the driving frequency. Photographs (left) and measured output voltage (right) obtained at (A) 15 kHz, (B) 16 kHz, and (C) 17 kHz under identical conditions; red dashed boxes indicate representative regions where intermittent self-sustained discharges were observed.
Processes 14 00922 g007
Figure 8. Current response and plasma behavior at different applied voltages: (A) 1.35 kV, (B) 1.50 kV, and (C) 1.80 kV. The left images show the interaction between SUS particles and the electrode plate and the resulting plasma shape/intensity, and the graphs on the right show the corresponding current waveforms and detection threshold.
Processes 14 00922 g008
Figure 9. POD and LOD results by particle size for each metal: (A) aluminum, (B) copper, and (C) stainless steel. For each metal, the left panel shows observed POD in three size classes (<0.5, 0.5–1.0, 1.0–2.0 mm; n = 50 per bin) with 95% Wilson confidence intervals, and the right panel shows the fitted POD(d) curve with LOD90 and LOD95, indicated by vertical dashed lines.
Processes 14 00922 g009
Figure 10. Simulated temperature evolution of the electrode–particle system at t = 0, 30, 60, and 300 s under current-driven excitation (color scale in °C).
Processes 14 00922 g010
Figure 11. Infrared thermography of the detection electrode during operation, showing the maximum surface temperature.
Processes 14 00922 g011
Figure 12. Experimental setup for ozone concentration measurement under the standard operating conditions (electrode gap d = 2 mm, 15 kHz, 1.35 kV), showing the ozone detector installed beneath the detection unit (left) and the recorded maximum, average, and minimum ozone concentrations over 1 h of continuous operation (0.04, 0.02, and 0.01 ppm, respectively; (right)).
Processes 14 00922 g012
Figure 13. Custom GUI for operating and monitoring the electric-field-based metal contamination detection system.
Processes 14 00922 g013
Table 1. Measured electrical parameters of electrode plates and calculated resonance frequency as a function of electrode gap.
Gap d (mm)Ceq (pF) 2Req (kΩ) 2fres (kHz) 1
1.01097.47 ± 0.015.46 ± 0.055.05
1.5687.18 ± 0.058.04 ± 0.116.39
2.0539.75 ± 0.0410.64 ± 0.457.21
1 flyback secondary equivalent leakage inductance was assumed constant as Leq = 903.431 mH. 2 Ceq and Req were measured in triplicate and are reported as mean ± SD (n = 3). fres was calculated using the mean Ceq and a fixed Leq; the resulting variation in fres across replicates was <0.3 Hz.
Table 2. Calculated Q-factor, bandwidth, and resonance matching index (RMI) of electrode plates for each gap distance.
Gap d (mm)QresBWres (kHz)|fsrc − fres| (kHz) 1RMI 2
1.05.250.9622.530.19
1.54.511.4171.190.59
2.03.841.8750.372.57
1 Source frequency was fixed at fsrc = 7.58 kHz. 2 Qres, BWres, and RMI were calculated from the mean values of Ceq and Req (Table 1) with fixed Leq and fsrc. The propagated uncertainty from the measured Ceq and Req to the derived resonance parameters was small; therefore, Table 2 reports mean values, while mean ± SD values are provided in Appendix A (Table A1).
Table 3. Comparison between the proposed system and existing detection systems.
SystemForeign BodiesAdvantagesLimitations
Sieves/screensOversized particles, stones,
insects
Simple,
low cost,
easy to retrofit
Fine metal dust passes,
mesh can clog and is difficult to clean
Magnetic separators
(bar/grid)
Ferrous metal objectsRobust,
no product effect
Remove only ferrous metals,
magnets require cleaning
Inductive metal detectorsFerrous, non-ferrous,
stainless steel
High sensitivity,
inline use possible
Only conductive or magnetic bodies detected,
very small particles can cause missed alarms
X-ray inspectionDense foreign bodies
(metal, glass, stone, bone)
Detects dense foreign bodies, sealed package inspection possibleHigh cost,
shielding and safety issues,
sufficient density contrast needed
NIR/hyperspectral imagingGlass, wood, plastics,
some metals
Non-contact,
fast imaging
rich spectral information
Expensive,
complex data analysis,
dust clouds degrade signal
Present workConductive metal particles
(ferrous and non-ferrous)
Compact electrodes, relatively low cost,
small particles detectable
Throughput limited,
non-metal undetectable,
clogging/bridging risk
Disclaimer/Publisher’s Note: The statements, opinions and data contained in all publications are solely those of the individual author(s) and contributor(s) and not of MDPI and/or the editor(s). MDPI and/or the editor(s) disclaim responsibility for any injury to people or property resulting from any ideas, methods, instructions or products referred to in the content.