Article

Parameters Optimization and Deformation Energy Modelling of Bulk Hemp Seeds Processing Under Uniaxial Compression Loading


Department of Mechanical Engineering, Faculty of Engineering, Czech University of Life Sciences Prague, 165 20 Prague, Czech Republic
*
Author to whom correspondence should be addressed.
Processes 2026, 14(4), 631; https://doi.org/10.3390/pr14040631
Submission received: 5 January 2026 / Revised: 8 February 2026 / Accepted: 9 February 2026 / Published: 11 February 2026
(This article belongs to the Special Issue Development of Innovative Processes in Food Engineering)

Abstract

This study adopted statistical optimization designs to identify the optimum input processing factors for estimating oil output parameters and deformation energy. The mechanical properties—namely, hardness and the secant modulus of elasticity—were also examined. Based on the full quadratic model, including the significant and non-significant terms, the optimal input processing factors were determined to be a heating temperature of 60 °C, a heating time of 52.5 min, and a sample pressing height of 60 mm, with R2 values ranging from 0.68 to 0.95. The linear models with only the significant terms predicted a mass of oil of 33.36 g, an oil yield of 21.5%, an oil expression efficiency of 65.47%, anda deformation energy of 1080.82 J. The hardness and secant modulus of elasticity values ranged from 3.65 to 7.09 kN/mm and 123.98 to 150.39 MPa, indicating that the varying input processing factors had a significant effect on the stiffness of the bulk hemp seeds. The tangent curve model showed reliability in estimating the theoretical deformation energy, which was closer to the experimental deformation energy. These findings are useful for modelling and optimizing the mechanical behaviour of oilseeds using a mechanical screw press to enhance oil extraction efficiency.

1. Introduction

Hemp or industrial hemp (Cannabis sativa L.) is a multipurpose plant grown for many applications, including biofuel production [1,2,3]. It is a species in the Cannabaceae family in which the level of tetrahydrocannabinol (THC) is very low, according to the provisions under the Common Agricultural Policy (CAP) [4,5]. In the EU, the THC content is not allowed to exceed 0.3% of dry matter [4]. Hemp has been cultivated for millennia, dating back to approximately 10,000 years [6,7,8,9]. The hemp plant has been grown across Europe for centuries, mainly for textiles, ropes, and other industrial applications, with cultivation increasing from 20,540 ha in 2015 to 33,020 ha in 2022. In the same period, the production of hemp increased from 97,130 tonnes to 179,020 tonnes. France is the largest producer, accounting for more than 60% of EU production, followed by Germany (17%) and the Netherlands (5%) [4,5,10]. The global industrial hemp market size was estimated at USD 5.49 billion in 2023 and is projected to reach USD 16.82 billion by 2030, growing at a CAGR (Compound Annual Growth Rate) of 17.5% from 2024 to 2030 [11]. The rising product demand from application industries such as food and beverages, personal and animal care worldwide drives the growth. The top five hemp-producing countries in the world are China, Canada, the United States, France, and Chile [12]. Hemp cultivation is beneficial for the environment and biodiversity due to its short cropping period, high resistance to harmful organisms, lower water requirement compared to other fibre plants, and its ability to be grown across a wide range of weather and geographical conditions [13,14,15].
Hemp seeds, an edible hemp product, are notable for their oil (25–35%), protein (20–25%), carbohydrates (25–30%), insoluble fibre (10–15%), and an average phytate content of 2.80 g/100 g, which are of vital nutritional and bioactive importance [13,16]. Dehulled hemp seeds can contain up to 50% oil, with polyunsaturated fatty acids making up 80% of their total fatty acid content [13,17,18]. Hemp seeds are rich in polyunsaturated fatty acids, including omega-6 fatty acids, such as linoleic acid (18:2), and omega-3 fatty acids, particularly α-linolenic acid (18:3) [16]. In addition, hemp seeds are known to support overall health and exhibit anti-inflammatory properties. Omega-3 and omega-6 fatty acids offer protection against heart disease, alleviate joint inflammation, aid in treating dermatitis, and help maintain skin moisture and balance [16,19].
The oil extraction process can be performed at room temperature (cold pressing) or at elevated temperatures (hot pressing); the latter provides higher oil yield, but oil properties can be compromised [20]. Currently, both conventional and advanced technologies are employed for oil extraction [21,22]. Traditional extraction methods such as screw press, Soxhlet extraction and hydrodistillation have been used for extended periods. However, these methods are cost-effective in terms of machinery requirements, time-consuming extraction process, high energy requirement, greenhouse gas (GHG) emissions, considerable residual oil in oil press cakes, and inferior oil quality [21,23,24]. Advanced methods, including enzyme-assisted, pulsed electric field pretreatment, microwave-assisted extraction, microwave-assisted hydrodistillation, supercritical fluid extraction, ultrasound-assisted hydrodistillation, and sonication-assisted hydrodistillation, are preferred to the conventional methods due to the lower requirement of the organic solvent, short extraction time, higher percentage oil recovery, and retention of heat-sensitive compound quality of extract [21,25,26,27,28,29,30,31]. Particularly, to extract oil from hemp seeds, the screw press extraction, Soxhlet extraction, microwave-assisted solvent extraction, and supercritical CO2 have been utilized [16,32,33,34,35,36]. The geometric configuration of the screw press, operating parameters of the screw press, and physical and mechanical properties of the oilseeds affect the technological flow of obtaining the oil. These operating factors include moisture content, screw rotational speed, pressure, heating temperature, heating time, species, and seed pretreatment methods [37,38]. Due to the dynamic and complex mechanisms involved in screw press operation, the compression loading test offers a better understanding of how to improve screw press performance in relation to operating factors.
The uniaxial compression process has been used to extract oil from oil-bearing plant seeds/kernels such as flax, hemp, rape, pumpkin, hazelnut, sunflower, and jatropha under cold- and hot-pressing conditions [39,40,41,42,43,44,45]. To understand the mechanical properties, oil recovery efficiency and deformation energy requirement of the oilseeds/nuts based on their experimental and theoretical force–deformation curves in relation to the varying input processing factors such as compressive force, speed, heating temperature, heating time, diameter of pressing vessel, samples pressing height, and moisture content, it is ideal to use the uniaxial compression process. This process has not been adequately explored for hemp seeds coupled with optimization statistical techniques. The statistical optimization technique using response surface methodology, combined with an experimental design such as Box–Behnken, has been recently employed by several researchers to optimize input processing factors and their corresponding output parameters [20,25,46,47,48,49,50,51,52,53,54,55].
Therefore, the objectives of the study were to determine the optimal input processing factors (heating temperature, heating time, and samples pressing height) with the corresponding responses (mass of oil, oil yield, oil expression efficiency, and experimental deformation energy) of bulk hemp seeds under a uniaxial bulk compression test based on Box–Behnken experimental design, to describe regression models of the responses based on a response surface statistical regression technique, and to determine the theoretical deformation energy based on the utilization of the tangent curve mathematical model.

2. Materials and Methods

2.1. Samples

Bulk hemp seeds (samples) were used for the study. The samples were purchased from Vitalcountry.cz, Plzenská, Štěnovice, Czech Republic. The samples were packaged in transparent plastic bags and stored under laboratory conditions before the experiments.

2.2. Determination of Moisture Content

The moisture content of the samples was determined by the hot-air oven drying method, with samples dried for 17 h at 105 °C [56]. The moisture content of the samples in percentage wet basis (% w.b.) was calculated using Equation (1) [43,57].
M C = m b m a m b × 100
where M C is the moisture content of samples (% w.b.), m a and m b are the masses of the samples before and after oven drying.

2.3. Determination of Oil Content

The oil content of the samples was determined following the Soxhlet extraction procedure [43,58,59,60]. Approximately 10 g of the samples was ground using a mini-grinder (BSH Hausgerate GmbH, Munich, Germany). The ground sample was packed into a cellulose thimble measuring 25 mm × 80 mm. Cotton wool was placed over the thimble to keep the ground sample intact before putting it into the Soxhlet extractor, which was then attached to a 250 mL round-bottom flask containing 250 mL of petroleum ether. A reflux condensor was placed atop the Soxhlet extractor to condense the solvent vapour. The solvent was heated to reflux using a heating device for 24 h. The extracted oil, after 24 h, was dried in a standard oven (MEMMERT GmbH + Co. KG, Buechenbach, Germany) at 50 °C for 4 h to remove the residual solvent [61]. The oil content of the samples was calculated using Equation (2) [43,58,59,60].
O C = m O m b × 100
where O C is the oil content (%), m O is the mass of oil extracted (g) and m b is the initial mass of the ground sample.

2.4. Box–Behnken Experimental Design

The input processing factors (heating temperature, heating time, and pressing height) were set at three levels each and designed using STATISTICA 13 (version 13.0) with the Box–Behnken experimental design (BBD) [62]. The heating temperatures were 40, 50, and 60 °C, the heating time values were 30, 45, and 60 min, and the pressing height values were 60, 80, and 100 mm. The overall design generated 17 experimental runs (Table 1), comprising 12 combinations of factors and 5 replications at the centre points using Equation (3) [46,50,53].
N = 2 k × k 1 + C 0 2 × 3 3 1 + 5 = 17
where k is the number of input factors and C 0 is the number of central points. The factors levels stated above were coded from −1 (low value) to +1 (high value) with 0 being the centre value according to Equation (4) [53,63,64].
x i = X i X 0 X
where x i is the coded value of the i-th variable, X i is the uncoded value of the i-th test variable, X 0 is the uncoded value of the i-th test variable at the centre point, and X is the step change in the real value of the variable i corresponding to the variation in a unit for the dimensionless value of the variable i. The second-order polynomial regression model, defining the responses as a function of the input processing factors, is expressed in Equation (5).
Y = β 0 + i = 1 k β i X i + i = 1 k β i i X i 2 + i 1 < j k j k β i j X i X j
where Y is the response variable; β 0 ,   β i , β i i , and β i j are the regression coefficients of the intercept, linear, quadratic, and interaction terms, respectively; X i and X j are the independent variables, and k is the number of factors.

2.5. Pretreatment of Samples Using Standard Oven

The hemp seed samples were preheated according to the design presented in Table 1 using standard oven (MEMMERT GmbH + Co. KG, Buechenbach, Germany). The fan and the restrictor air flap in the oven were set at 30% to control the air circulation during the drying process.

2.6. Compression Tests of Samples After Pretreatment

The universal compression testing machine (TEMPOS spol. s.r.o., Opava, Czech Republic (Machine Service); ZDM 50, VEB Werkstoffprufmaschinen, Leipzig, Germany), Czech Republic) of a maximum load of 500 kN and a pressing vessel of diameter 60 mm with a plunger were used for extracting the hemp seed oil (Figure 1a–c) following the Box–Behnken design (Table 1). Based on preliminary tests, the maximum input force required for the hemp seed samples was set at 300 kN at a pressing speed of 5 mm/min.

2.6.1. Oil Yield

The oil yield was determined using Equation (6) [25,63,65].
O Y D = M O L M S P × 100
where O Y D is oil yield (%) and M O L is the mass of oil determined as the difference between the mass of the seedcake and the initial mass of the sample M S P (g).

2.6.2. Oil Expression Efficiency

The oil expression efficiency was determined using Equation (7) [66].
O E E = O Y D O C T × 100
where O E E is the oil expression efficiency (%) and O C T is the percentage oil content (%) in the hemp seed sample determined by Soxhlet extraction.

2.6.3. Deformation Energy

The deformation energy was determined using Equation (8) [67,68,69].
E N G = n = 0 n = i 1 F n + 1 + F n 2 × x n + 1 x n
where E N G is the deformation energy (J), F n + 1 + F n and x n + 1 x n are the compressive force (N) and deformation (mm), n is the number of data points, and i is the number of sections in which the axis deformation was divided.

2.6.4. Force and Deformation

The force F R (N) and deformation D F (mm) values were obtained directly from the output data of the compression tests.

2.6.5. Hardness

The hardness of the samples was calculated using Equation (9) [57,70,71].
H D N = F R C D F X
where H D N is the hardness (kN/mm), F R C is the force (N), and D F X is the deformation (mm).

2.6.6. Strain

The strain of the samples was calculated using Equation (10) [57,70,71].
ε S T = D F X H I N
where ε S T is the strain (dimensionless) and H I N is the initial height of the sample (mm).

2.6.7. Compressive Stress or Pressure

The compressive stress of the samples was calculated using Equation (11) [57,70,71].
σ S S = F R C A P V
where σ S S is the compressive stress (MPa) and A P V is the area of the pressing vessel, which was calculated to be 2827.43 mm2.

2.6.8. Secant Modulus of Elasticity

The secant modulus of elasticity of the samples was calculated based on Hooke’s law using Equation (12) [57,70,71].
S M E L = σ S S ε S T
where S M E L is the secant modulus of elasticity (MPa).

2.7. Utilization of Tangent Curve Model

The tangent curve model (Equation (13)) [45] was used to describe the experimental force–deformation curves and energy of bulk hemp seed samples as a function of the input processing factors.
F D X = A D × tan B D × X n
where F D X is the compression force (N), X is the deformation of the bulk oilseeds (mm), A D is the force coefficient of mechanical behaviour (N), B D is the deformation coefficient of mechanical deformation behaviour (mm−1), and n is the model’s fitting exponent (dimensionless).

2.8. Validation and Statistical Analysis

Validation tests were conducted through additional compression tests based on the optimal input processing factors. The experimental data obtained were evaluated statistically using STATISTICA 13 (version 13.0) [60] by employing the response surface regression technique at a 0.05 significance level. The theoretical fitting of the experimental force–deformation curves and the statistical metrics were done using MathCAD 14 (PTC Software, Needham, MA, USA) [45,72]. The graphical illustrations were also done by the above-mentioned statistical packages.

3. Results

3.1. Calculated Moisture Content and Oil Content

The moisture and oil contents of the hemp seed samples were determined to be 7.49 ± 0.08 (% w.b.) and 32.84 ± 0.70%, respectively. There might be a reduction in the moisture content during the pretreatment process before the oil extraction under the linear compression test, which was not estimated. However, from the literature, a high moisture of about 20% is present in all oilseeds, control of moisture or optimum adjustment is essential for efficient oil extraction, and both higher and lower moisture content levels could result in an increase or a decrease in the percentage oil yield [73,74,75,76,77,78]. For instance, Moslavac et al. [73] mentioned that the lowest moisture content of 5.52% produced the highest oil yield of rapeseeds in comparison with sunflower seeds, where the highest amount of oil yield was achieved at a seed moisture content of 6.77%, which was also in agreement with the study reported by Bambgoye and Adejumo [77] on sunflower seeds. Most importantly, too low moisture content in oilseeds leads to poor plasticity and elasticity of the material to be pressed into powder, and, as a consequence, this effect prevents maintaining the operating pressure in the pressing chamber during oil extraction [78,79,80]. The moisture content found in this present study falls within the optimum levels reported in the literature mentioned above for different oilseeds before oil extraction.

3.2. Calculated Responses from the Box–Behnken Design (BBD)

Using equations (Equations (5)–(7)), the calculated responses from the BBD experimental runs were the mass of oil ( M O L ), oil yield ( O Y D ), oil expression efficiency ( O E E ), and deformation energy ( E N G ) (Table 2). The O E E depends on the M O L , O Y D , and oil content ( O C ) of the seeds, hence, the need to estimate all the oil output parameters. Based on the twelve factor combinations (runs 1 to 12) without any repetitions at the centre points, the highest amount of O E E of 67.27% was obtained at run 6 (heating temperature, H T P : 60 °C, heating time, H T M : 45 min and pressing height, P H T of 60 mm), followed by run 10 ( H T P : 50 °C, H T M : 60 min and P H T of 60 mm) producing an amount of 65.12% and then run 4 ( H T P : 60 °C, H T M : 60 min and P H T of 80 mm) generating 65.55%. However, the five repetitions of the input factors at the centre points yielded an average O E E of 61.97 ± 4.08%. The corresponding mean E N G was 913.74 ± 55.04 J. It was observed that the highest deformation energies of 1179.6 and 1143.53 J were obtained from run 8 ( H T P : 40 °C, H T M : 45 min and P H T of 100 mm) and run 7 ( H T P : 60 °C, H T M : 45 min and P H T of 100 mm) with O E E amounts of 65.12% and 59.74% respectively.

3.3. Calculated Mechanical Properties from the Force–Deformation Curves

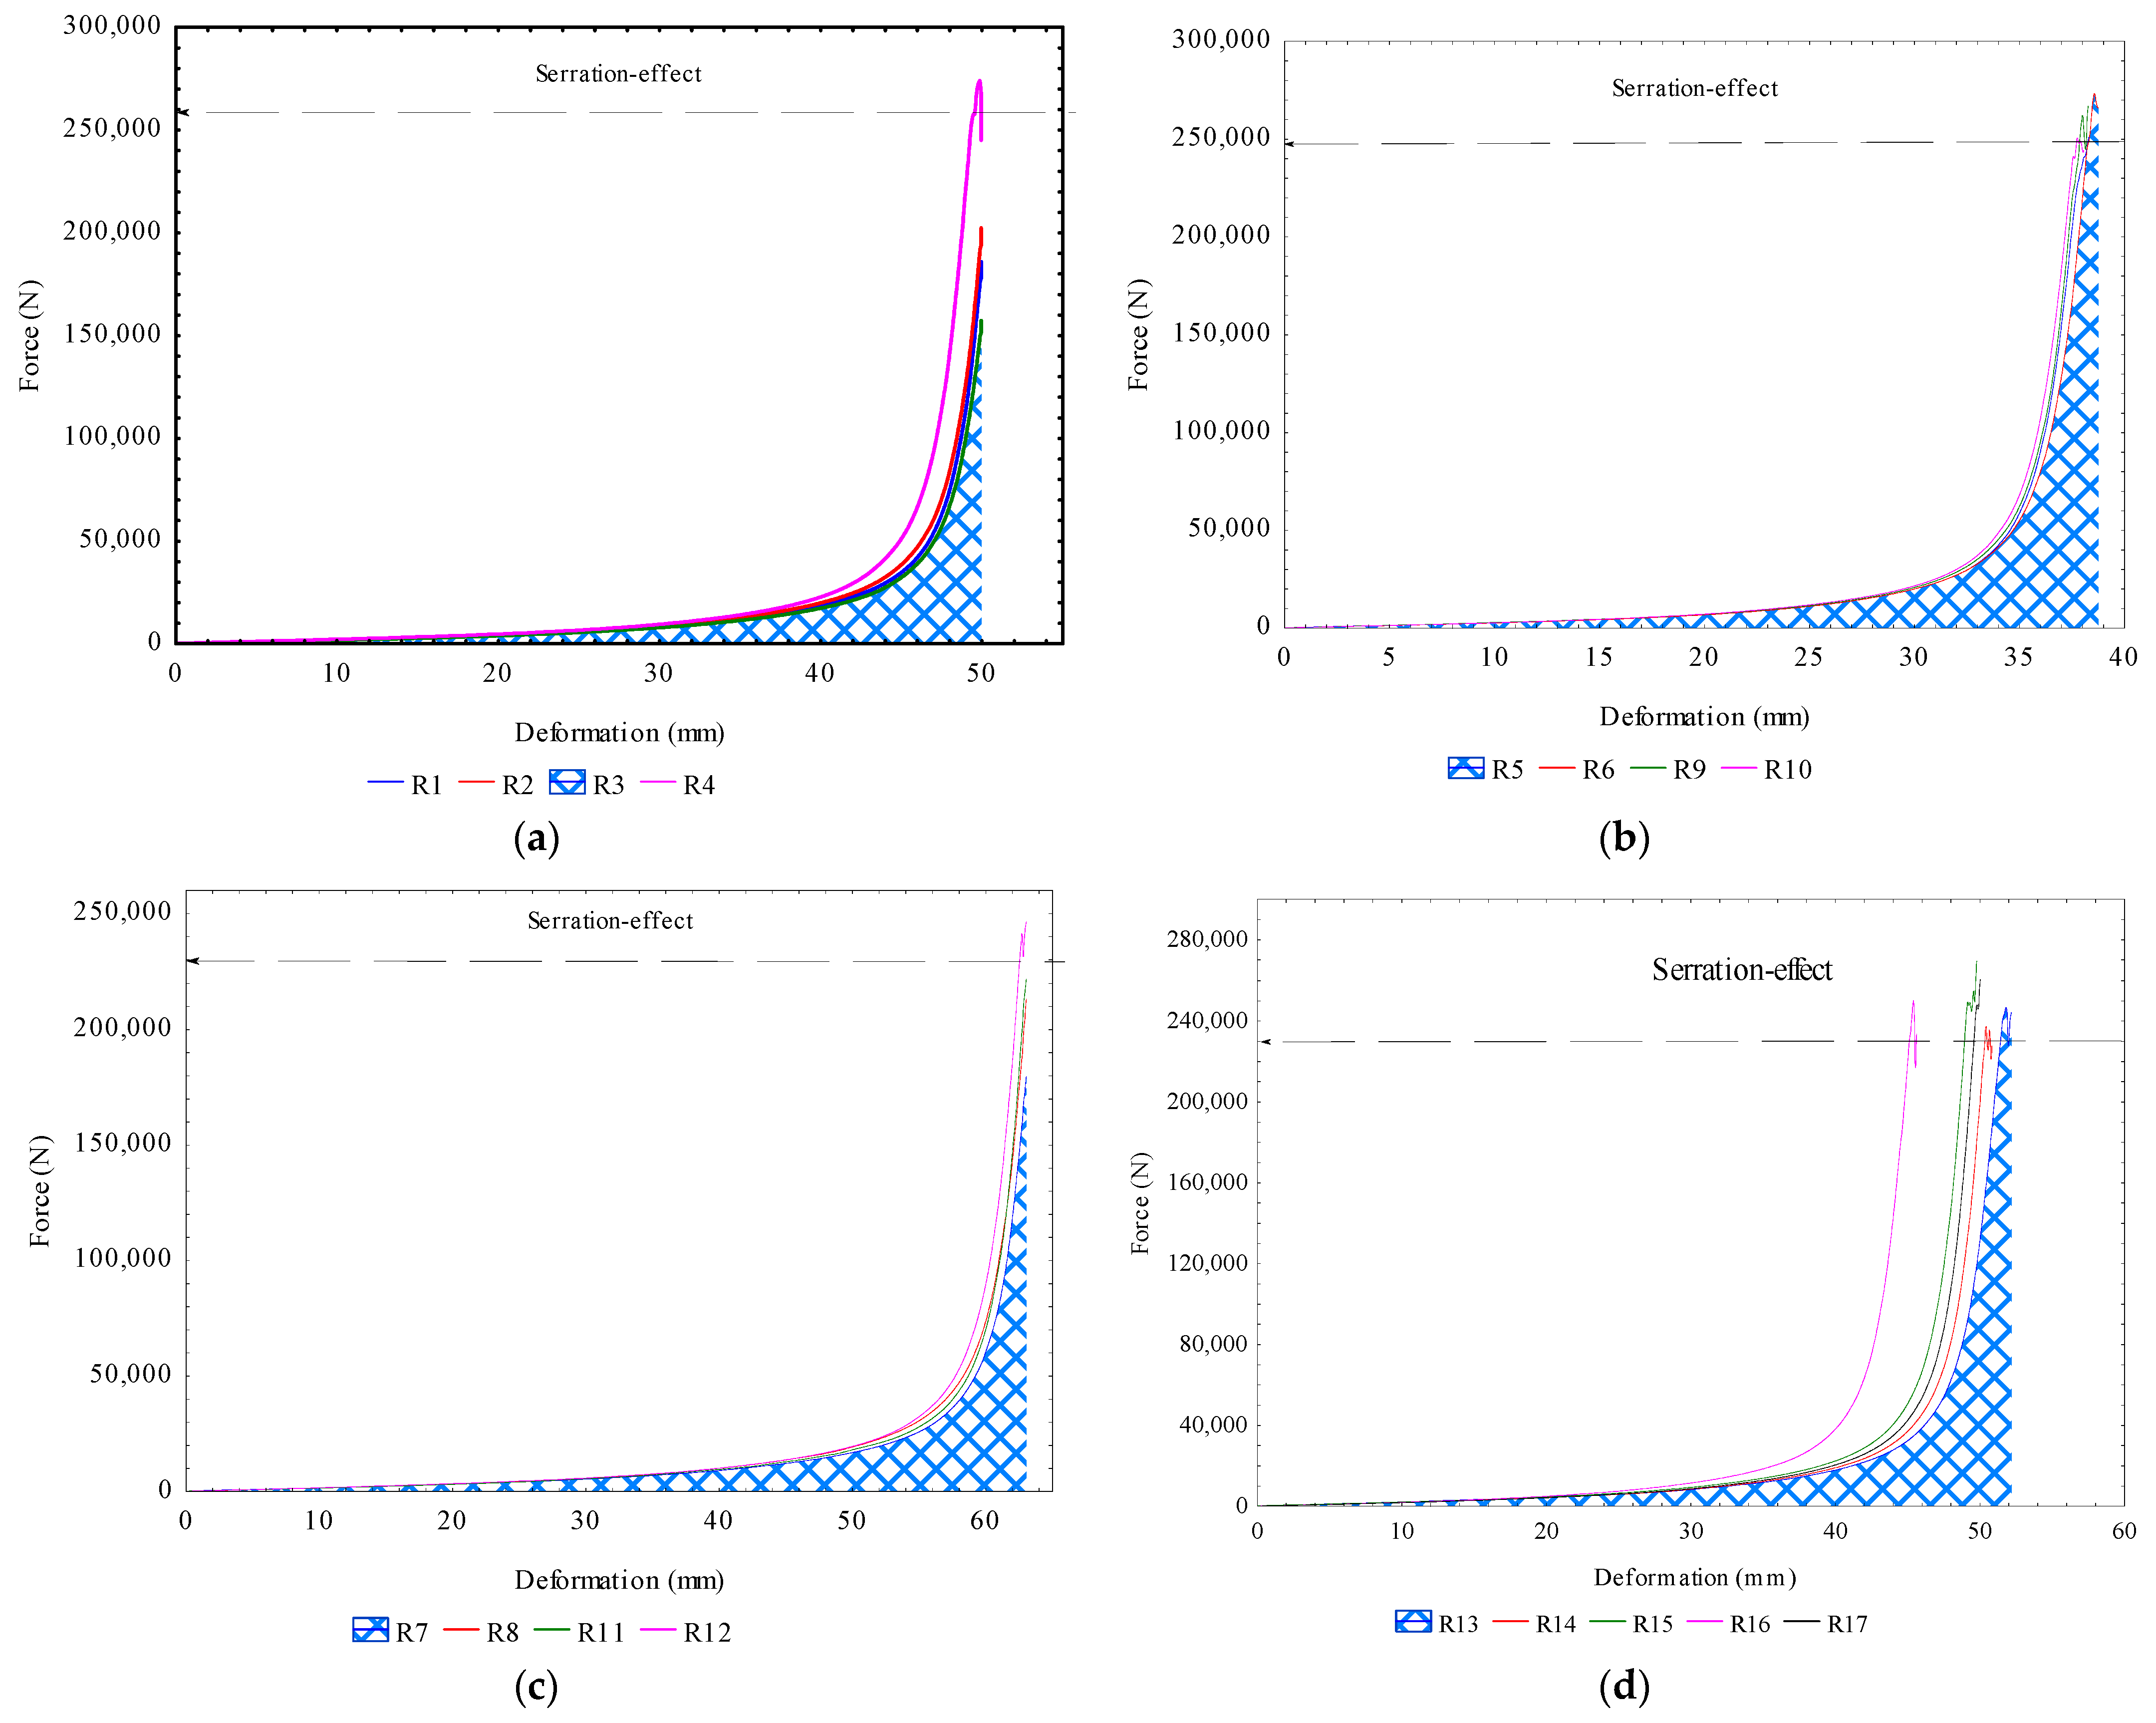
Each experimental run generated the force–deformation curve, which was used to determine the mechanical properties, namely the force, F R C ; deformation, D F X ; hardness, H D N ; strain, ϵ S T ; compressive stress, σ S S ; and secant modulus of elasticity, S M E L of the hemp seed samples using equations (Equations (8)–(11)) (Table 3). The area under the force-deformation curve (Figure 2a–d) is the deformation energy for extracting the oil under bulk compression tests [64,65,66]. The H D N depends on the F R C and the D F X ratio (Equation (9)), whereas the E S M is derived from the stress and strain ratio (Equation (12)). The E S M is used for materials that exhibit a non-linear relationship. It thus explains the material’s stiffness, which is calculated over a specific operating range up to a chosen point on the non-linear curve [71]. Considering the mean values of the input factors centre points (runs 13–17) and the individual input factors combinations (runs 1–12), the overall H D N and S M E L values ranged from 3.65 to 7.09 kN/mm and 123.98 to 150.39 MPa, indicating that the varying input processing factors had a significant effect on the stiffness of the bulk hemp seed samples. It is important to note that, beyond the maximum F R C , a serration effect occurred (Figure 2a–d), characterized by the ejection of seedcake through the pressing holes, mainly due to higher pressure, which led to vibration of the compression machine. Other factors such as moisture content, pressing speed, vessel diameter, and the quality of raw material, thus contribute to the serration effect [44,68,69]. Usually, the serration effect does not produce a significant amount of oil; hence, the compression process must be discontinued to prevent energy wastage. Knowledge of the mechanical properties of oilseeds under uniaxial compression is relevant for determining the pressure threshold in the screw press and understanding the design and optimization mechanisms [42,68,69,70,75].

3.4. ANOVA Analysis of Calculated Responses and Their Regression Coefficients

The ANOVA results for the response surface regression analysis of the calculated parameters (mass of oil, oil yield, oil expression efficiency, and deformation energy) are provided in Table 4, Table 5, Table 6 and Table 7. The coefficients for the intercept, linear, quadratic, and interaction terms for the input processing factors (heating temperature, heating time and sample pressing height) in each parameter model showed both significant (p-value < 0.05) and non-significant (p-value > 0.05) results. The mass of oil model parameter, the intercept, heating temperature, and the sample pressing height were significant, whereas the other terms were non-significant. For the oil yield and oil expression efficiency model parameters, only the intercept and the heating temperature were significant, whereas the other terms were non-significant. The deformation energy model parameter showed that the intercept and the sample pressing height were significant, whereas the other terms were non-significant. The coefficient of determination (R2) of the results ranging from 0.68 to 0.95 confirmed that the models were adequate for prediction.
The coefficients of the full quadratic and reduced models are described in Equations (14)–(21). The full quadratic models’ coefficients, including both significant and non-significant terms for the intercept, linear, quadratic, and interactions (Equations (14), (16), (18) and (20)), help identify the optimal input factors. The adequacy of the full quadratic models was determined by the lack of fit p-values, which were greater than 0.05 (Table 4, Table 5, Table 6 and Table 7). A similar evaluation of the quadratic model was reported in the studies by Todorovic et al. [20], Chanioti and Tzia [63], and Ocholi et al. [64]. The reduced model coefficients comprising only the significant terms (Equations (15), (17), (19) and (21)) are effective for prediction and experimental validation. For M O L (Equation (15)), the dominant effect was the H T P and P H T , whereas for O Y D (Equation (17)) and O E E (Equation (19)), the dominant effect was the H T P , and for E N G (Equation (21)), the dominant effect was the P H T .
M O L g = 26.20 + 1.52 × H T P 0.17 × H T P 2 + 0.67 × H T M 1.04 × H T M 2 + 5.64 × P H T + 1.29 × P H T 2 0.87 × H T P × H T M + 0.49 × H T P × P H T 0.36 × H T M × P H T
M O L g = 26.20 + 1.52 × H T P + 5.64 × P H T
O Y D % = 20.35 + 1.15 × H T P 0.19 × H T P 2 + 0.56 × H T M 0.75 × H T M 2 0.76 × P H T + 0.90 × P H T 2 0.67 × H T P × H T M + 0.21 × H T P × P H T 0.26 × H T M × P H T
O Y D % = 20.35 + 1.15 × H T P
O E E % = 61.96 + 3.51 × H T P 0.57 × H T P 2 + 1.69 × H T M 2.29 × H T M 2 2.30 × P H T + 2.74 × P H T 2 2.05 × H T P × H T M + 0.63 × H T P × P H T 0.79 × H T M × P H T
O E F % = 61.96 + 3.51 × H T P
E N G J = 913.76 + 24.94 × H T P + 38.82 × H T P 2 8.57 × H T M 38.22 × H T M 2 + 167.06 × P H T + 35.49 × P H T 2 + 32.25 × H T P × H T M + 7.30 × H T P × P H T + 24.19 × H T M × P H T
E N G J = 913.76 + 167.06 × P H T

3.5. Profiles of Predicted Values Based on Optimal Input Factors and Desirability

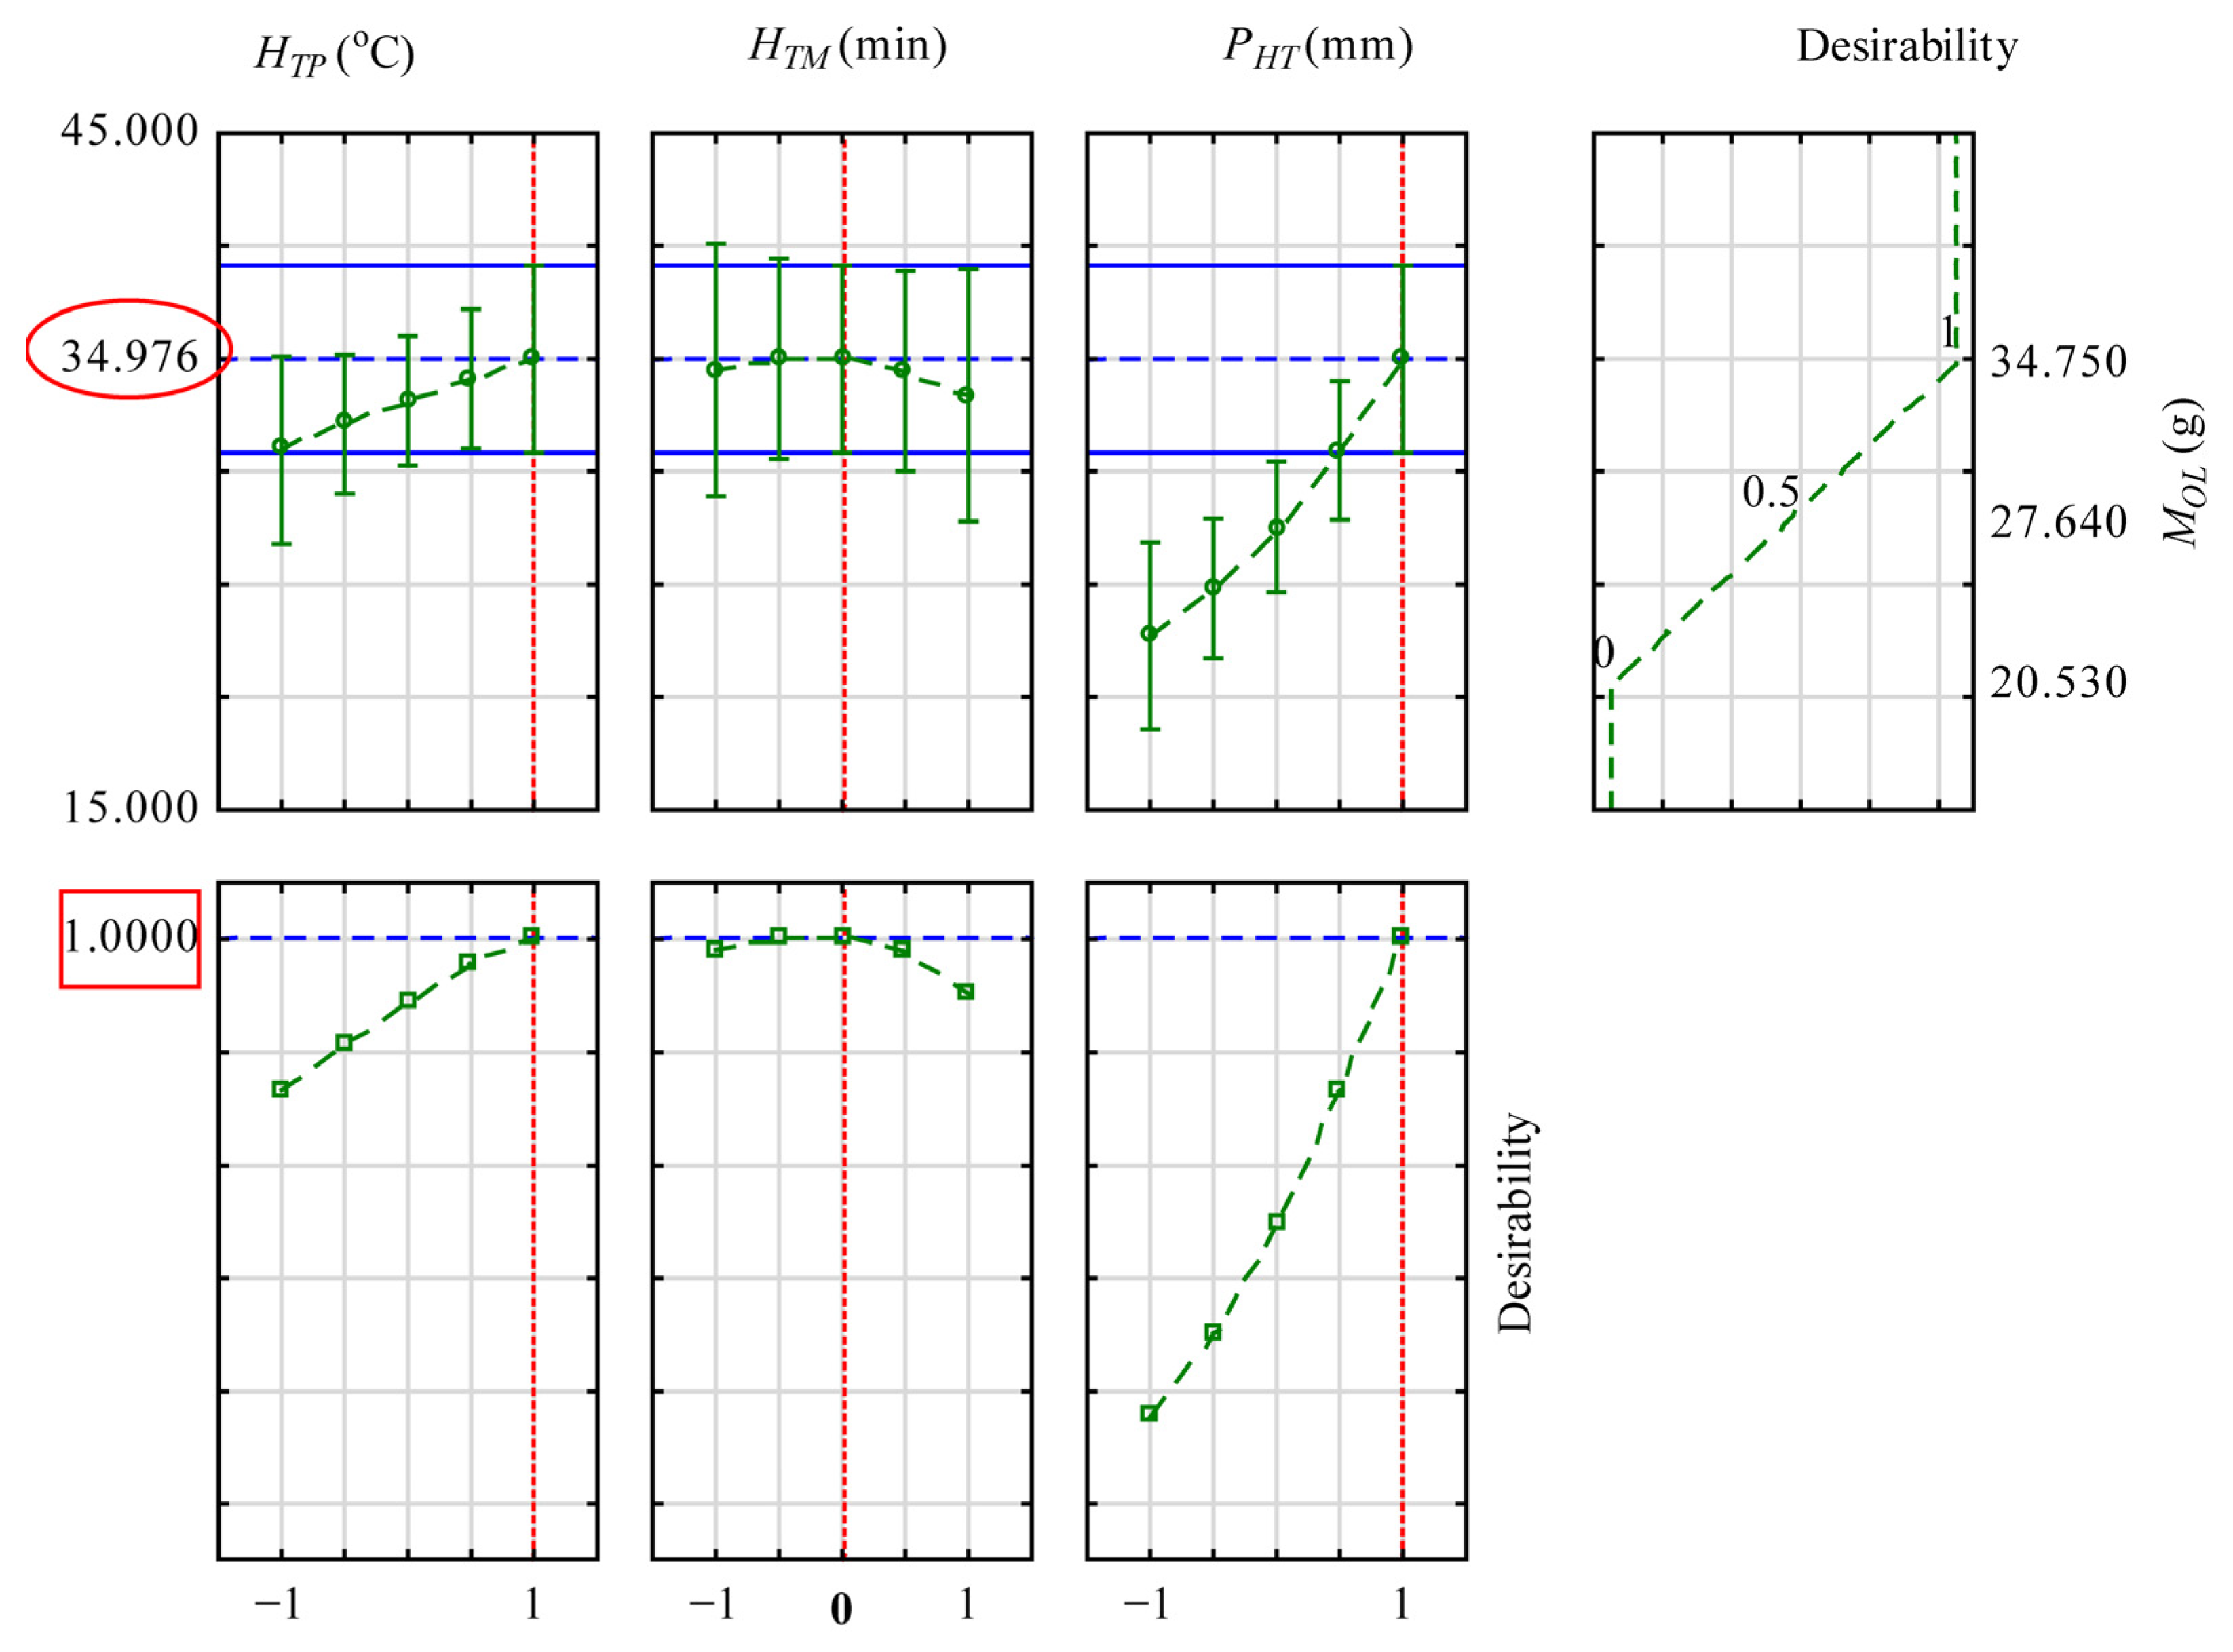
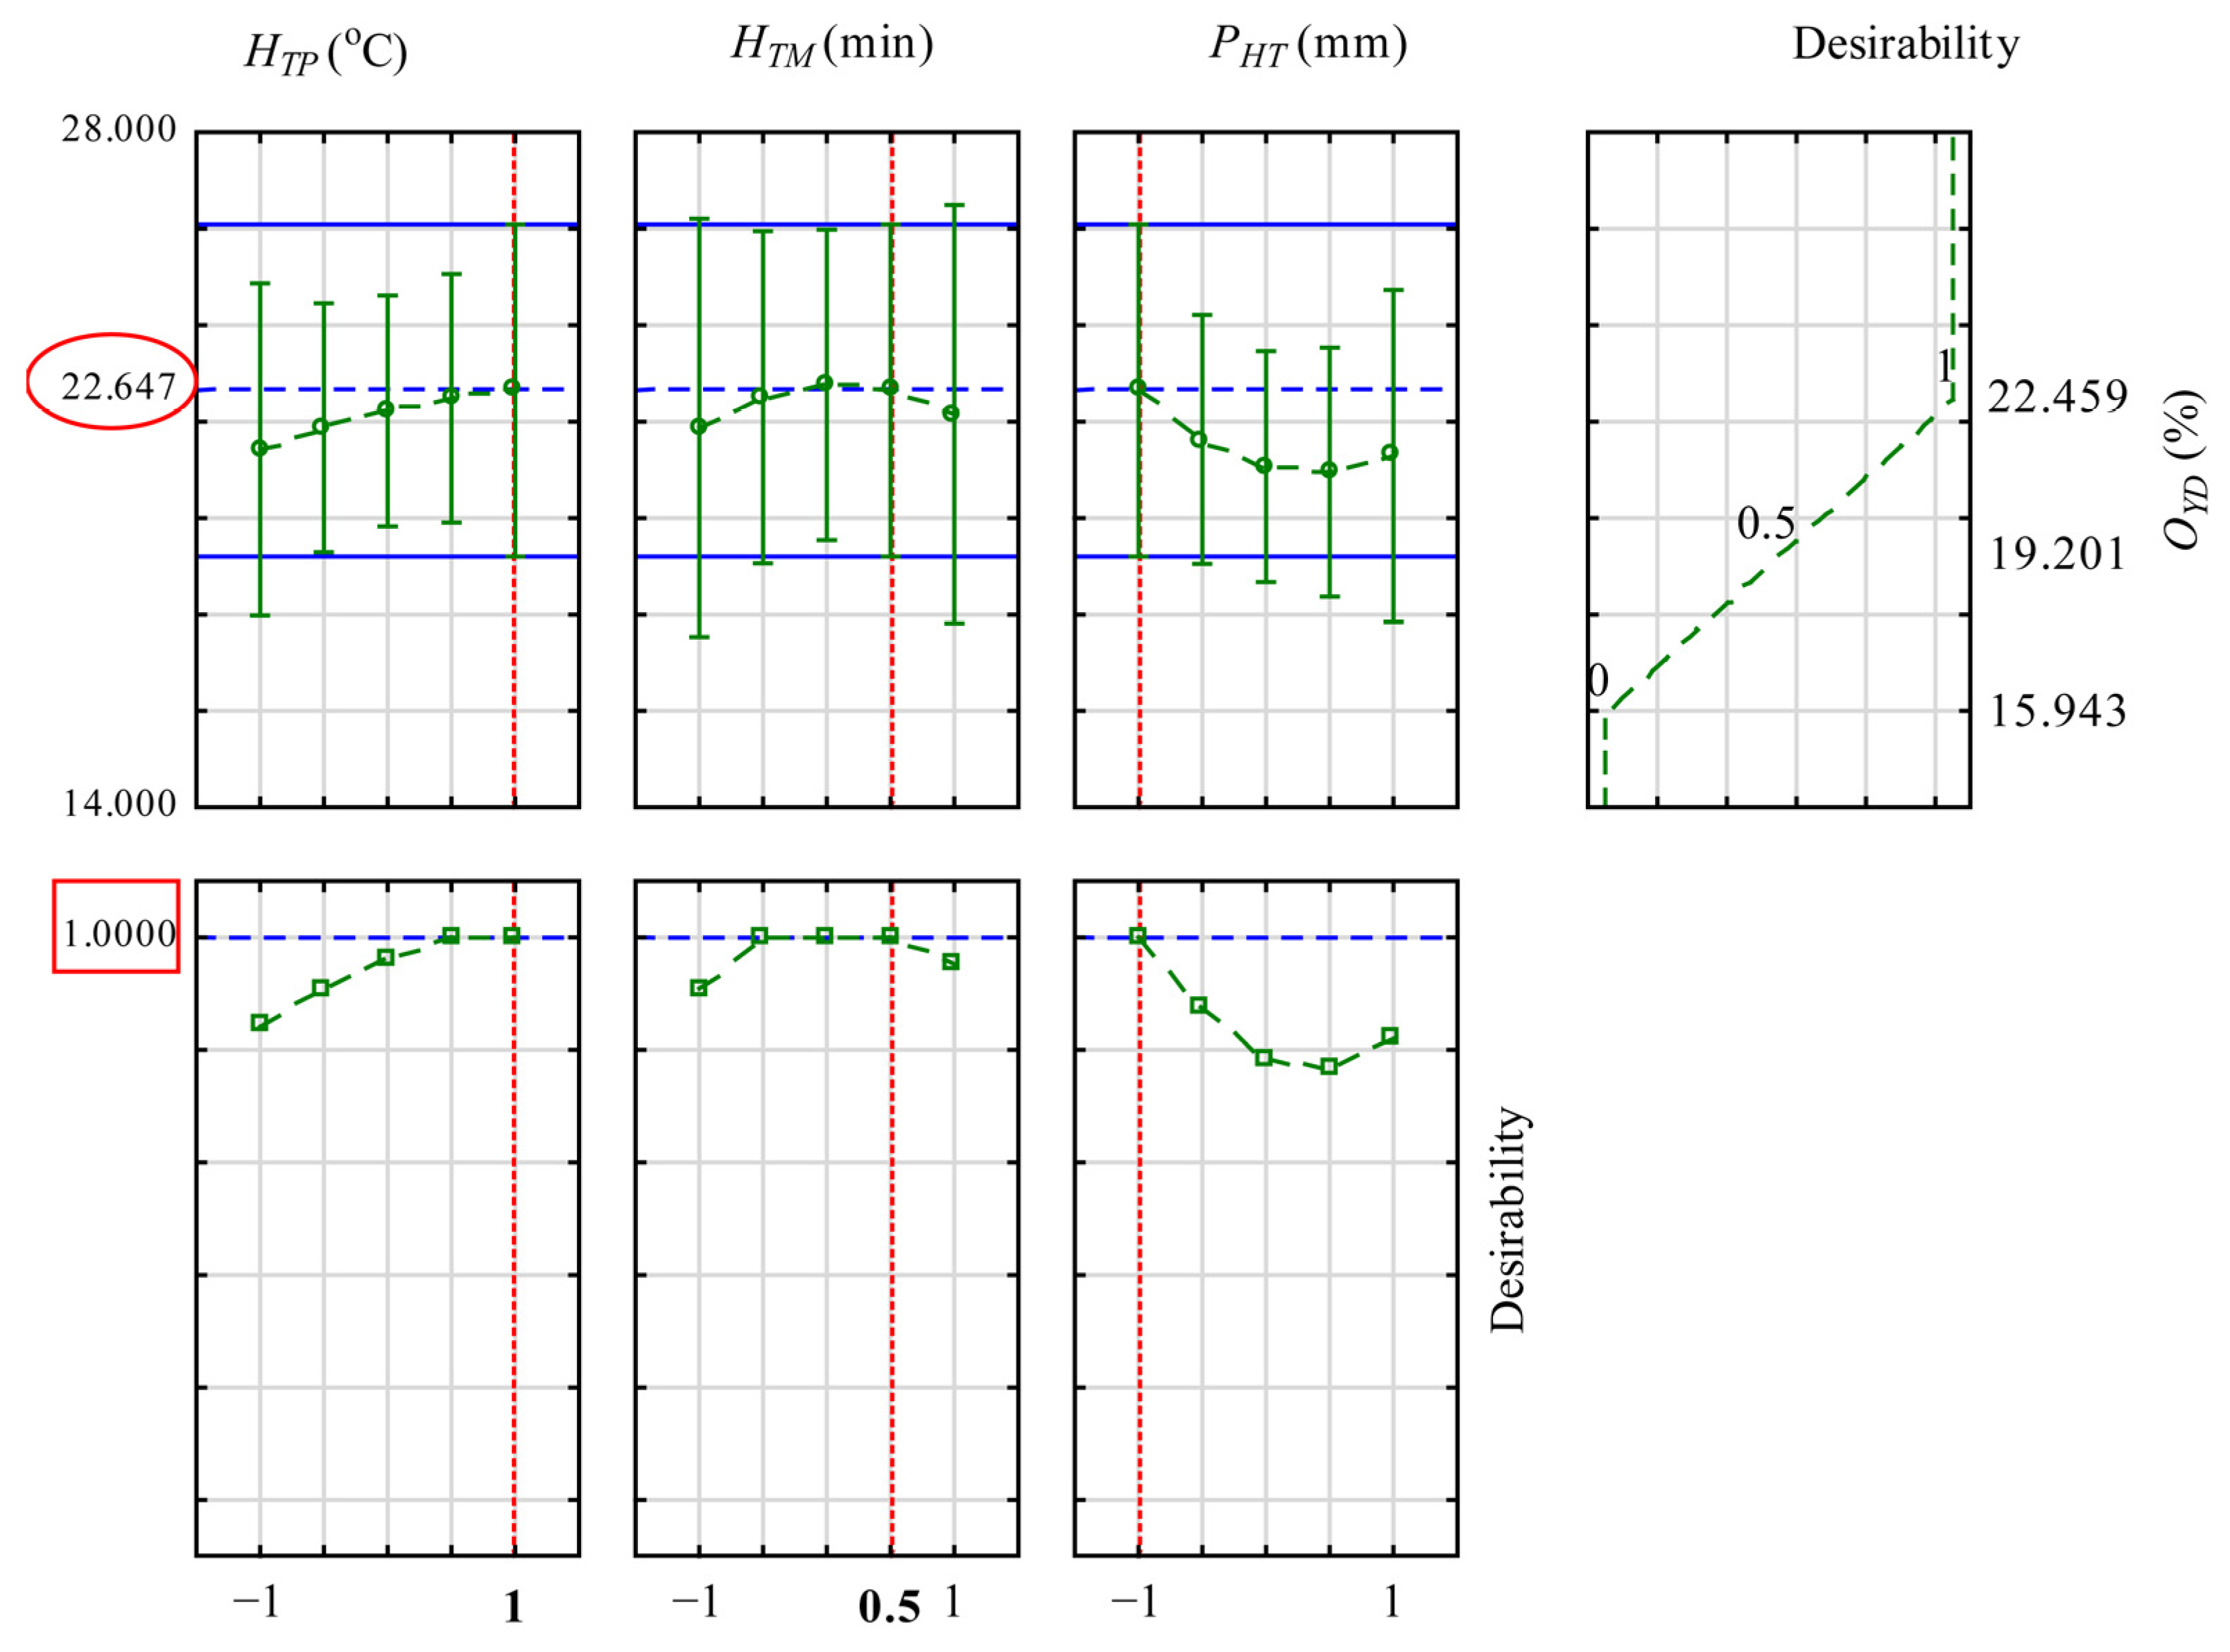
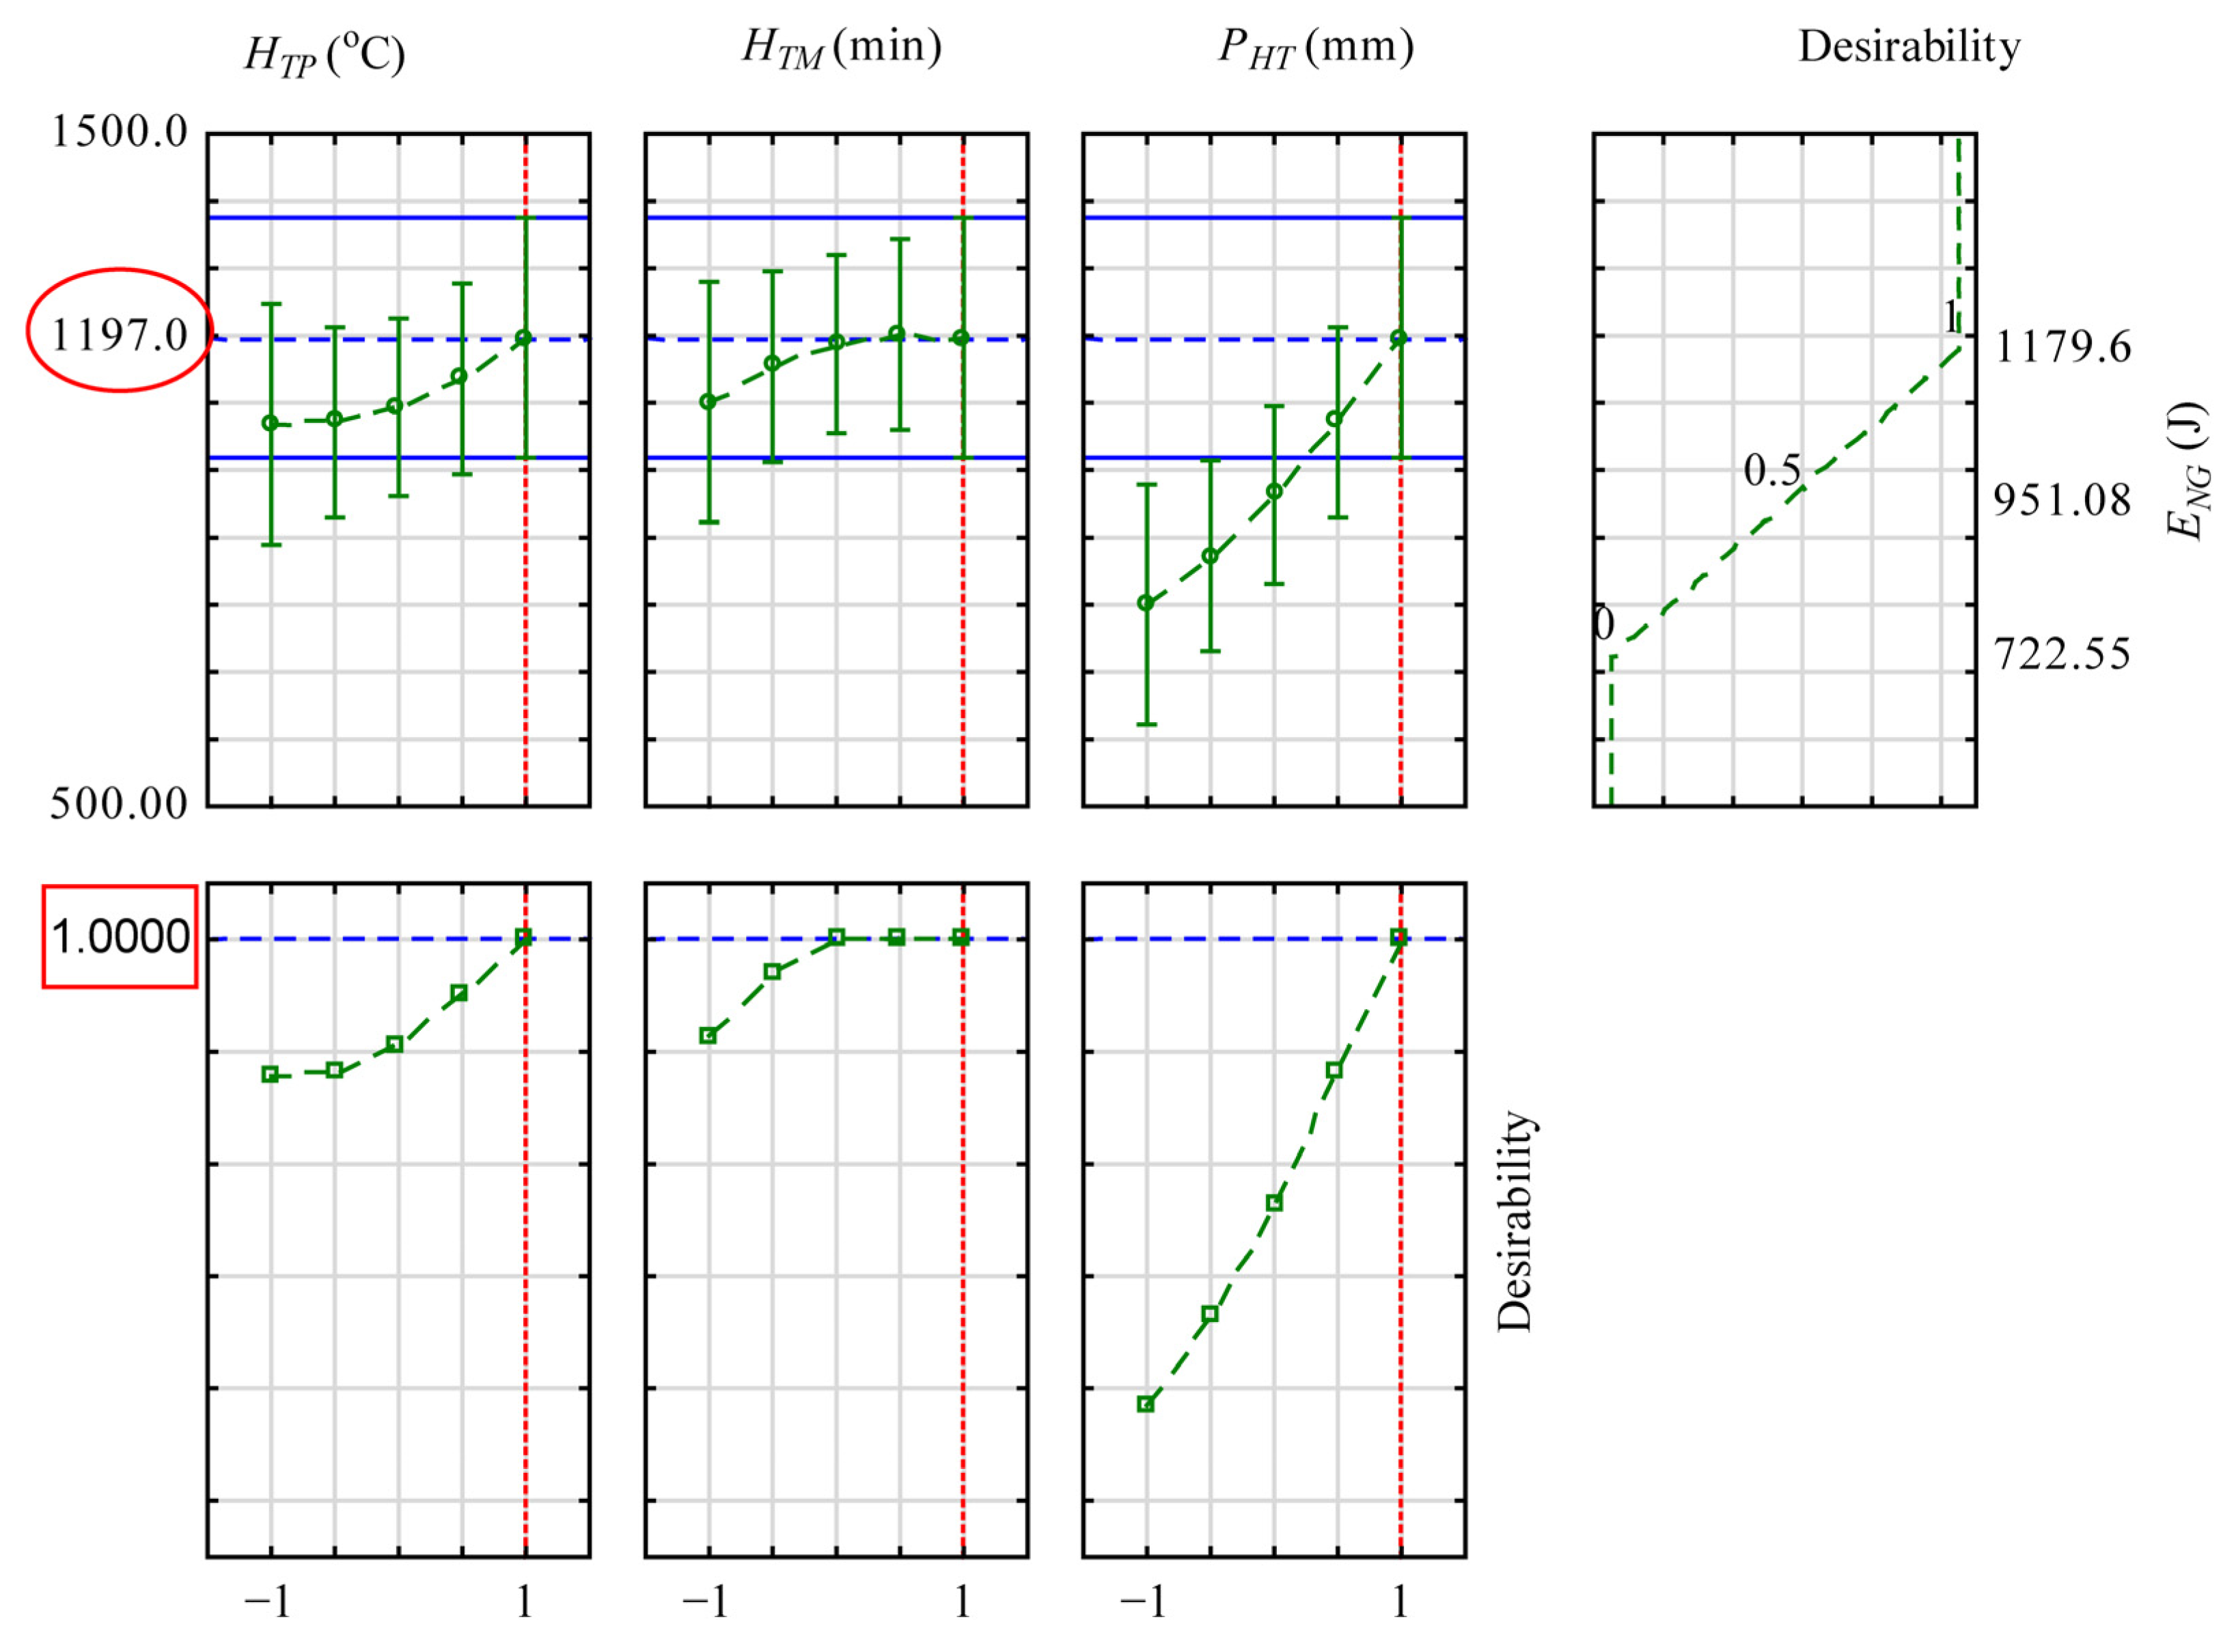
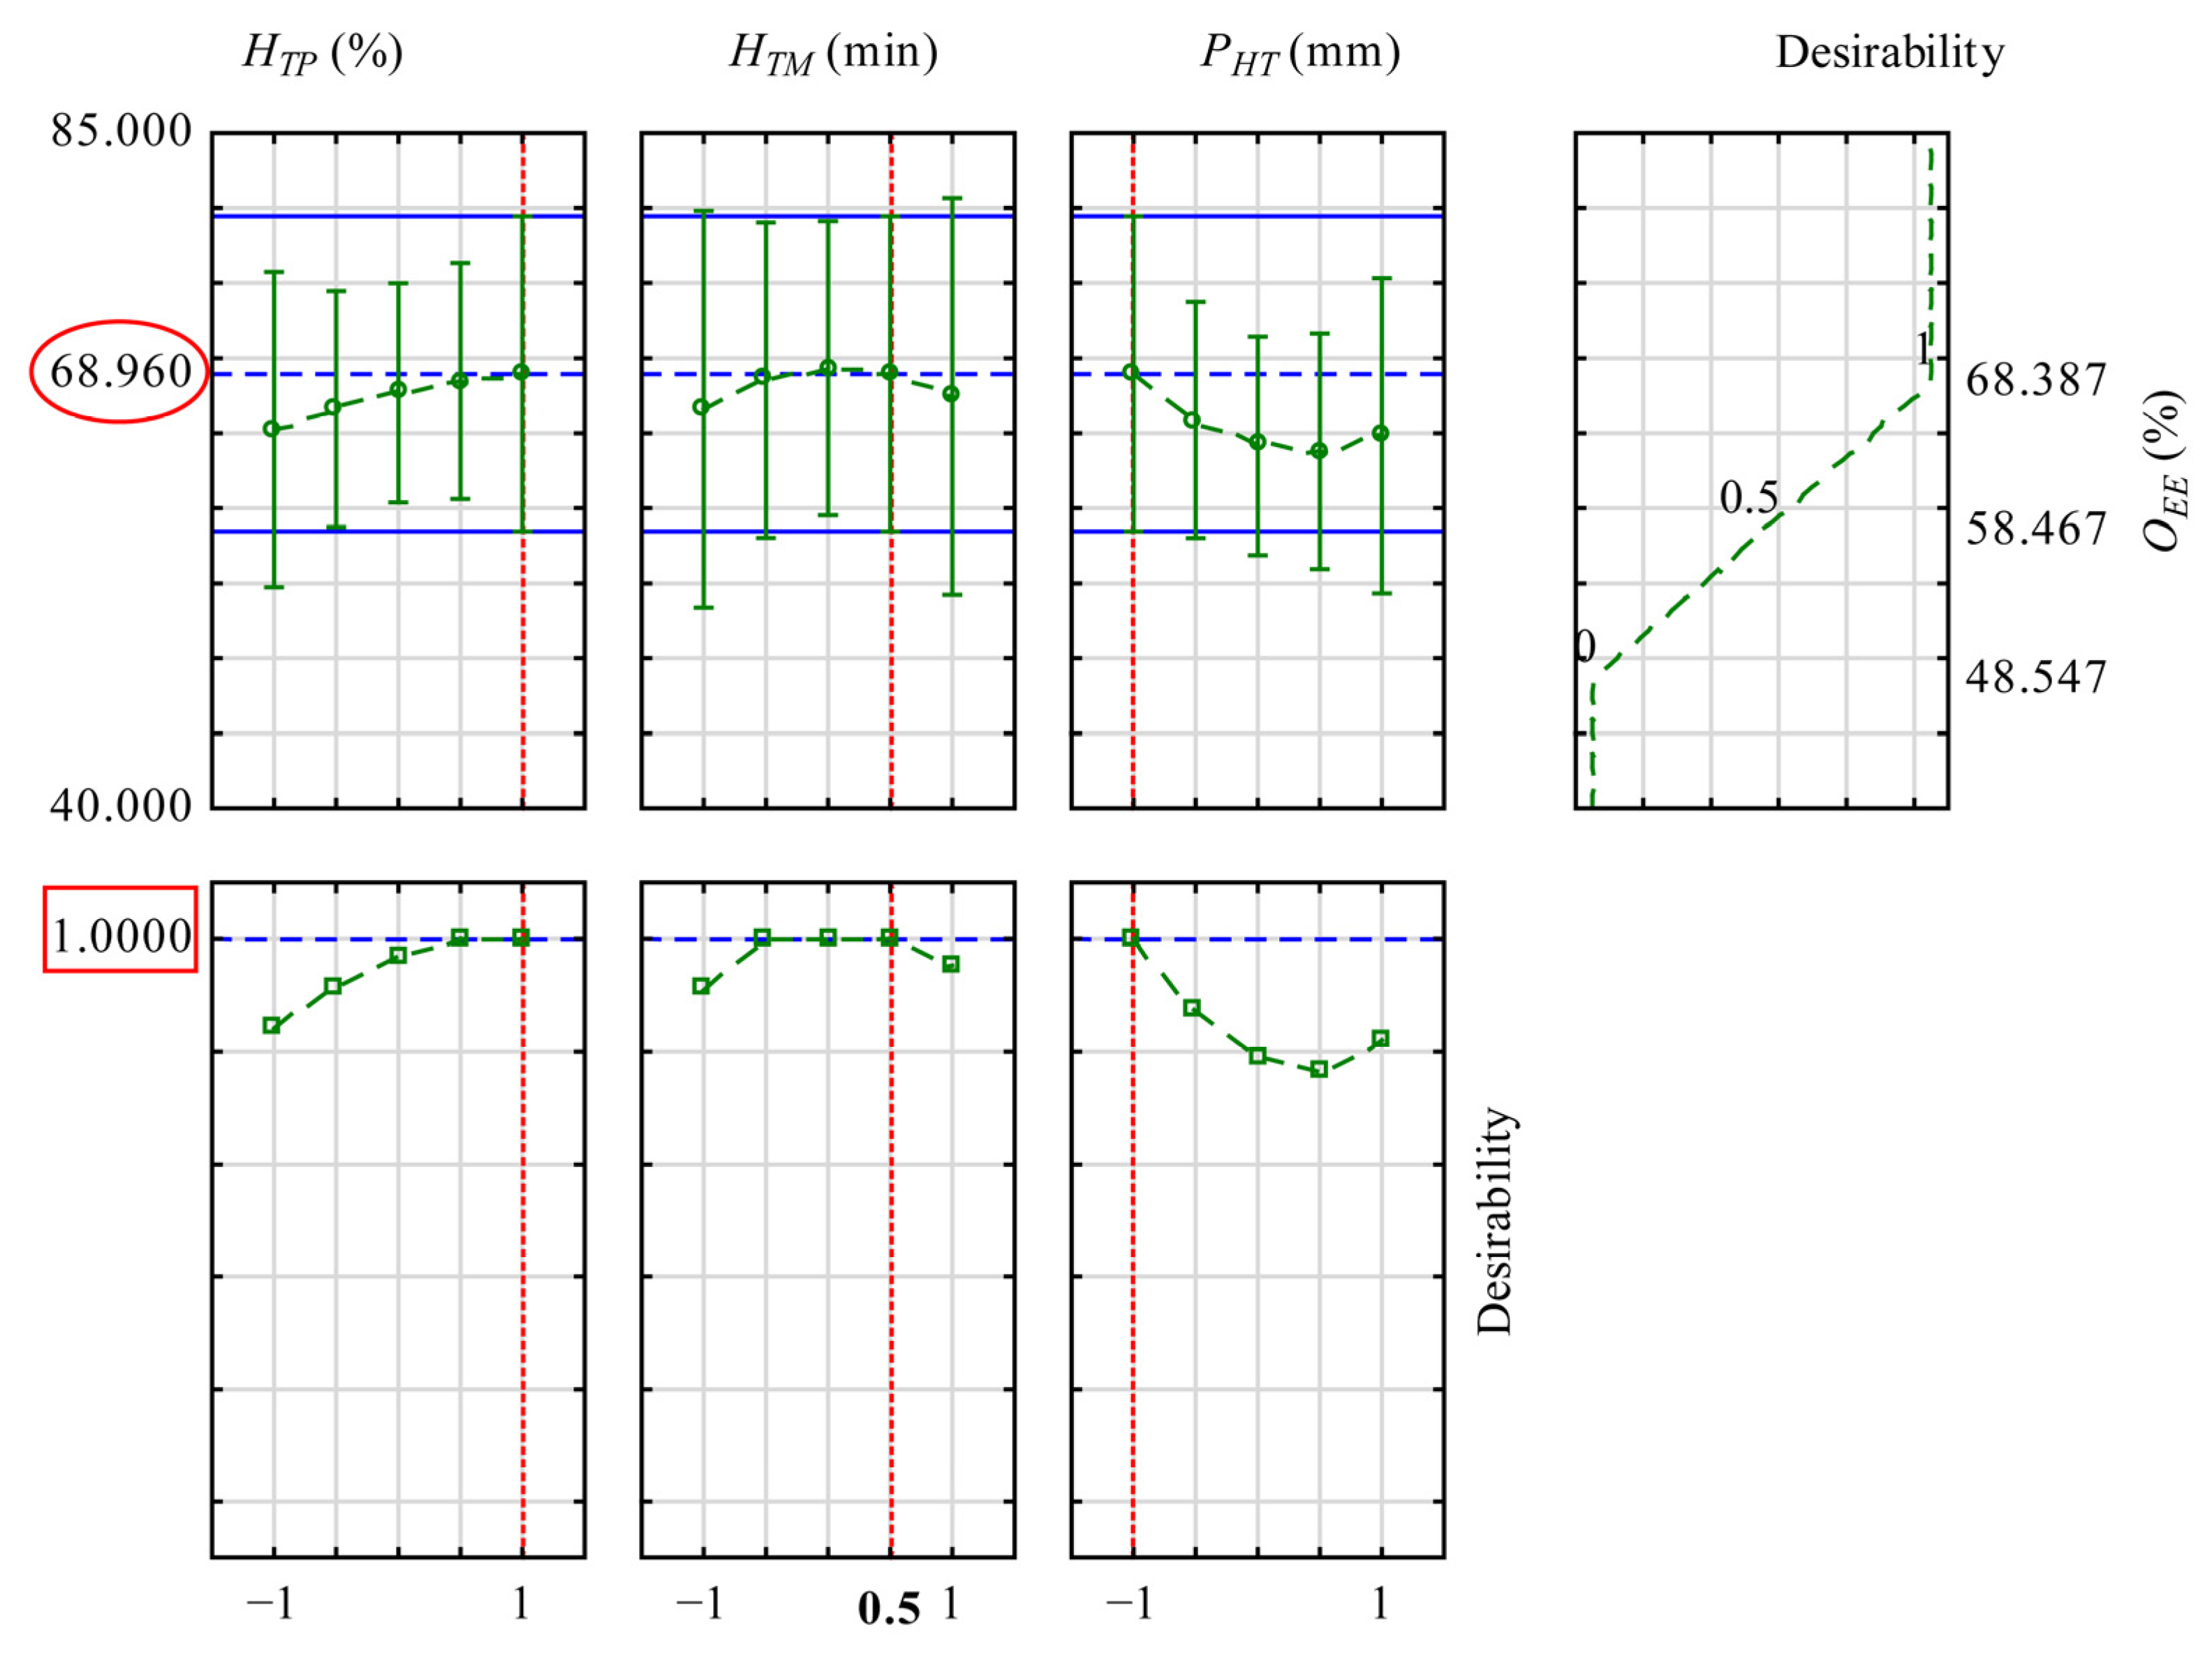
The predicted and desirability profiles of the full quadratic models are illustrated in Figure 3, Figure 4, Figure 5 and Figure 6, respectively. The M O L regression model (Equation (14)) predicted an amount of 34.976 g with the optimal H T P : 60 °C (+1), H T M : 45 min (0), and P H T : 100 mm (+1), giving a desirability value of 1 (Figure 3). The O Y D model (Equation (16)) predicted an amount of 22.647% with optimal H T P : 60 °C (+1), H T M : 52.5 min (0.5), and P H T : 60 mm (−1), achieving the desirability value of 1 (Figure 4). The O E E regression model (Equation (18)) predicted an amount of 68.96% with optimal H T P : 60 °C (+1), H T M : 52.5 min (0.5), and P H T : 60 mm (−1) achieving the desirability value of 1 (Figure 5). The E N G regression model (Equation (20)) predicted an amount of 1197 (J) with optimal H T P : 60 °C (+1), H T M : 60 min (+1), and P H T : 100 mm (+1), giving the desirability value of 1 (Figure 6). The desirability value of 1 was identified in all cases, implying that all responses simultaneously achieved their individual optima without any trade-offs [63,64]. However, the reduced regression models (Equations (15), (17), (19) and (21)), which considered only the significant terms from the full quadratic models, produced M O L of 33.36 g, O Y D of 21.5%, O E E of 65.47%, and E N G of 1080.82 J. The differences between the full quadratic model and the reduced model predictions were determined using absolute and relative differences (Table 8). For all the model responses, relative differences were below 10%, indicating close agreement between the two regression models.

3.6. Observed, Predicted, Residuals, and Percentage Error

The residuals between the observed and predicted values from the full quadratic models (Equations (11), (13), (15) and (17)) for the individual experimental runs, along with their percentage errors, are presented in Table 9 and Table 10. A positive residual means the model underpredicts the observed value, whereas a negative residual means the model overpredicts the observed value. However, randomly distributed residuals around the zero line and the lower percentage errors between 0.14 and 10.52 indicate a good model performance [47].

3.7. Theoretical Force–Deformation Curves and Deformation Energy

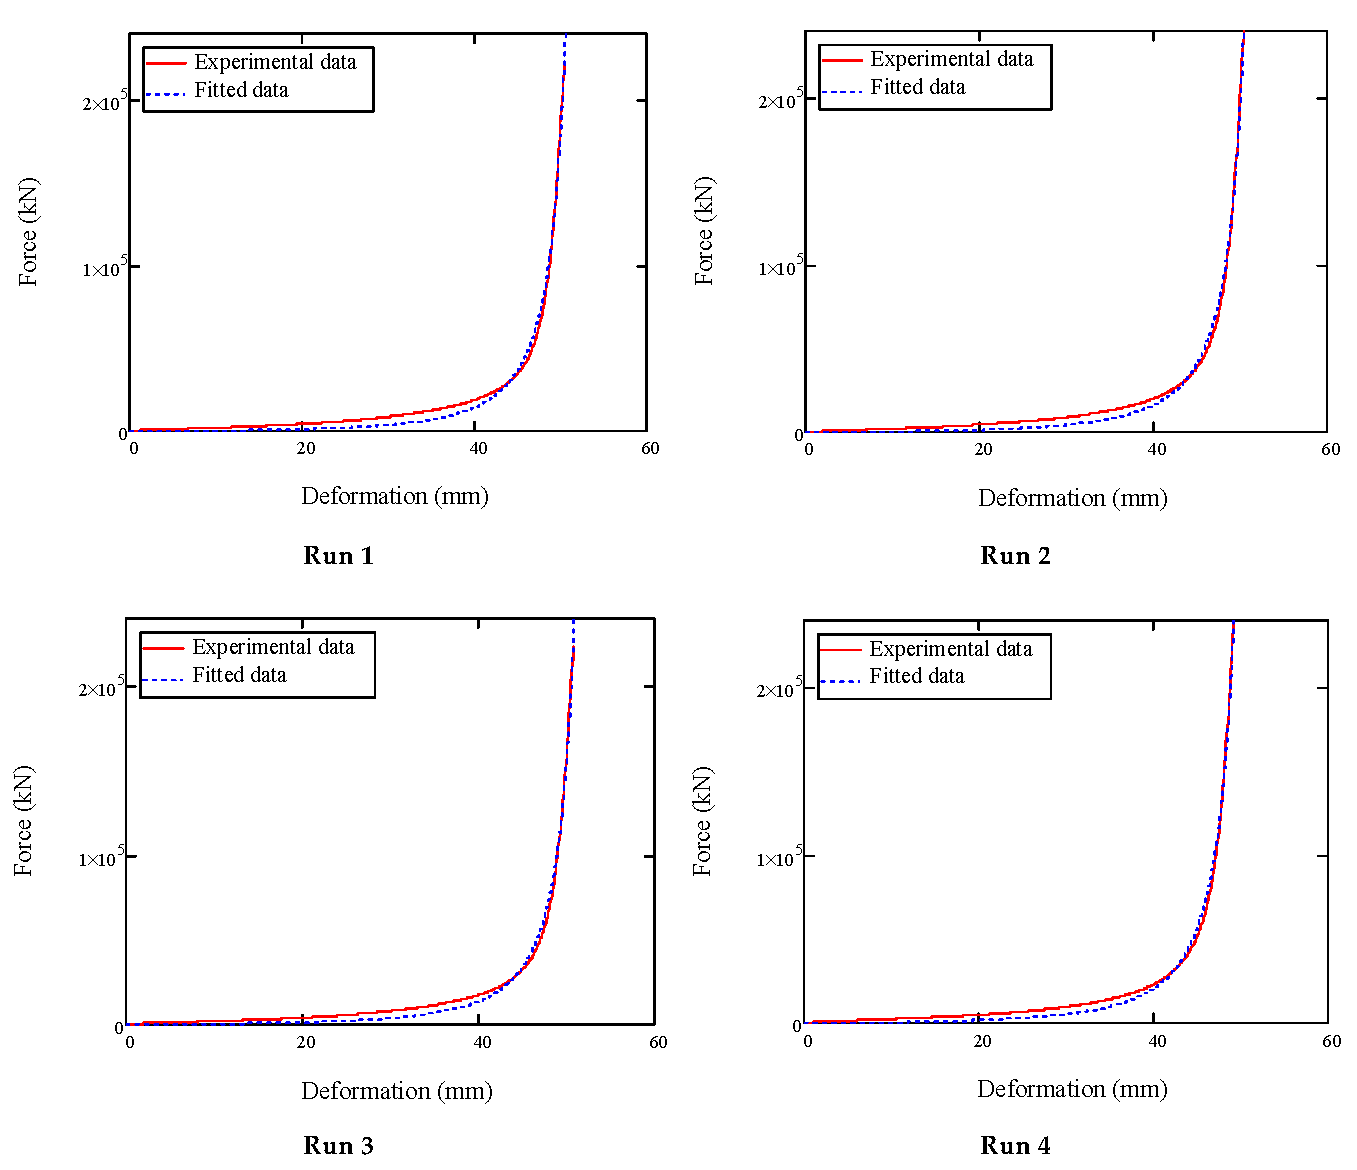
The determined tangent model (Equation (13) coefficients and statistical metrics are presented in Table 11, and the experimental and theoretical fitted curves for runs 1–4 are shown in Figure 7, as a representation for experimental runs 5–17. The force coefficients of mechanical behaviour, A D (kN) ranged from 2.504 to 4.26 kN while the deformation coefficients of mechanical behaviour, B D ranged from 0.023 to 0.039 (mm−1). The optimal exponent for the tangent model was 2, which determines the shape or steepness of the force–deformation curve. The force coefficient of the mechanical behaviour influences the slope of the deformation characteristic, whereas the deformation coefficient of mechanical behaviour influences the range of deformation. These two coefficients indicate the initial rigidity of the pressing process [45,81,82]. Statistical significance of the tangent model is confirmed when the F-value is less than the F-critical value or the p-value is greater than 0.05 with Mathcad’s fitting curve [45,81,82]. This suggests that the tangent model’s parameters accurately fit the data points. Conversely, if the F-value is greater than F-critical or the p-value is less than 0.05, the results are typically considered not statistically significant, indicating that the tangent model’s parameters cannot reliably fit the data points. The results of the tangent model’s fitting curve showed very high coefficients of determination (R2) ranging from 0.992 to 0.999, indicating that it can precisely describe the relationship between force and deformation curves of bulk agricultural materials, such as oilseeds, under bulk compression tests.
Based on the theoretically fitted curves, the theoretical deformation energies were calculated (Table 12) using the integral form of Equation (13), as expressed in Equation (22) for n = 2.
F X d x A × tan B × X B × X B
The percentage errors between the experimental and theoretical deformation energies ranged from 1.35 to 28.31%, suggesting that the varying input processing factors influence the coefficients of the tangent model. However, the efficiency of the tangent model ranged from 98.65% to 71.69%, confirming its suitability for describing the mechanical behaviour of oilseeds [45,81,82].

3.8. Validation of Optimal Input Factors with Corresponding Responses

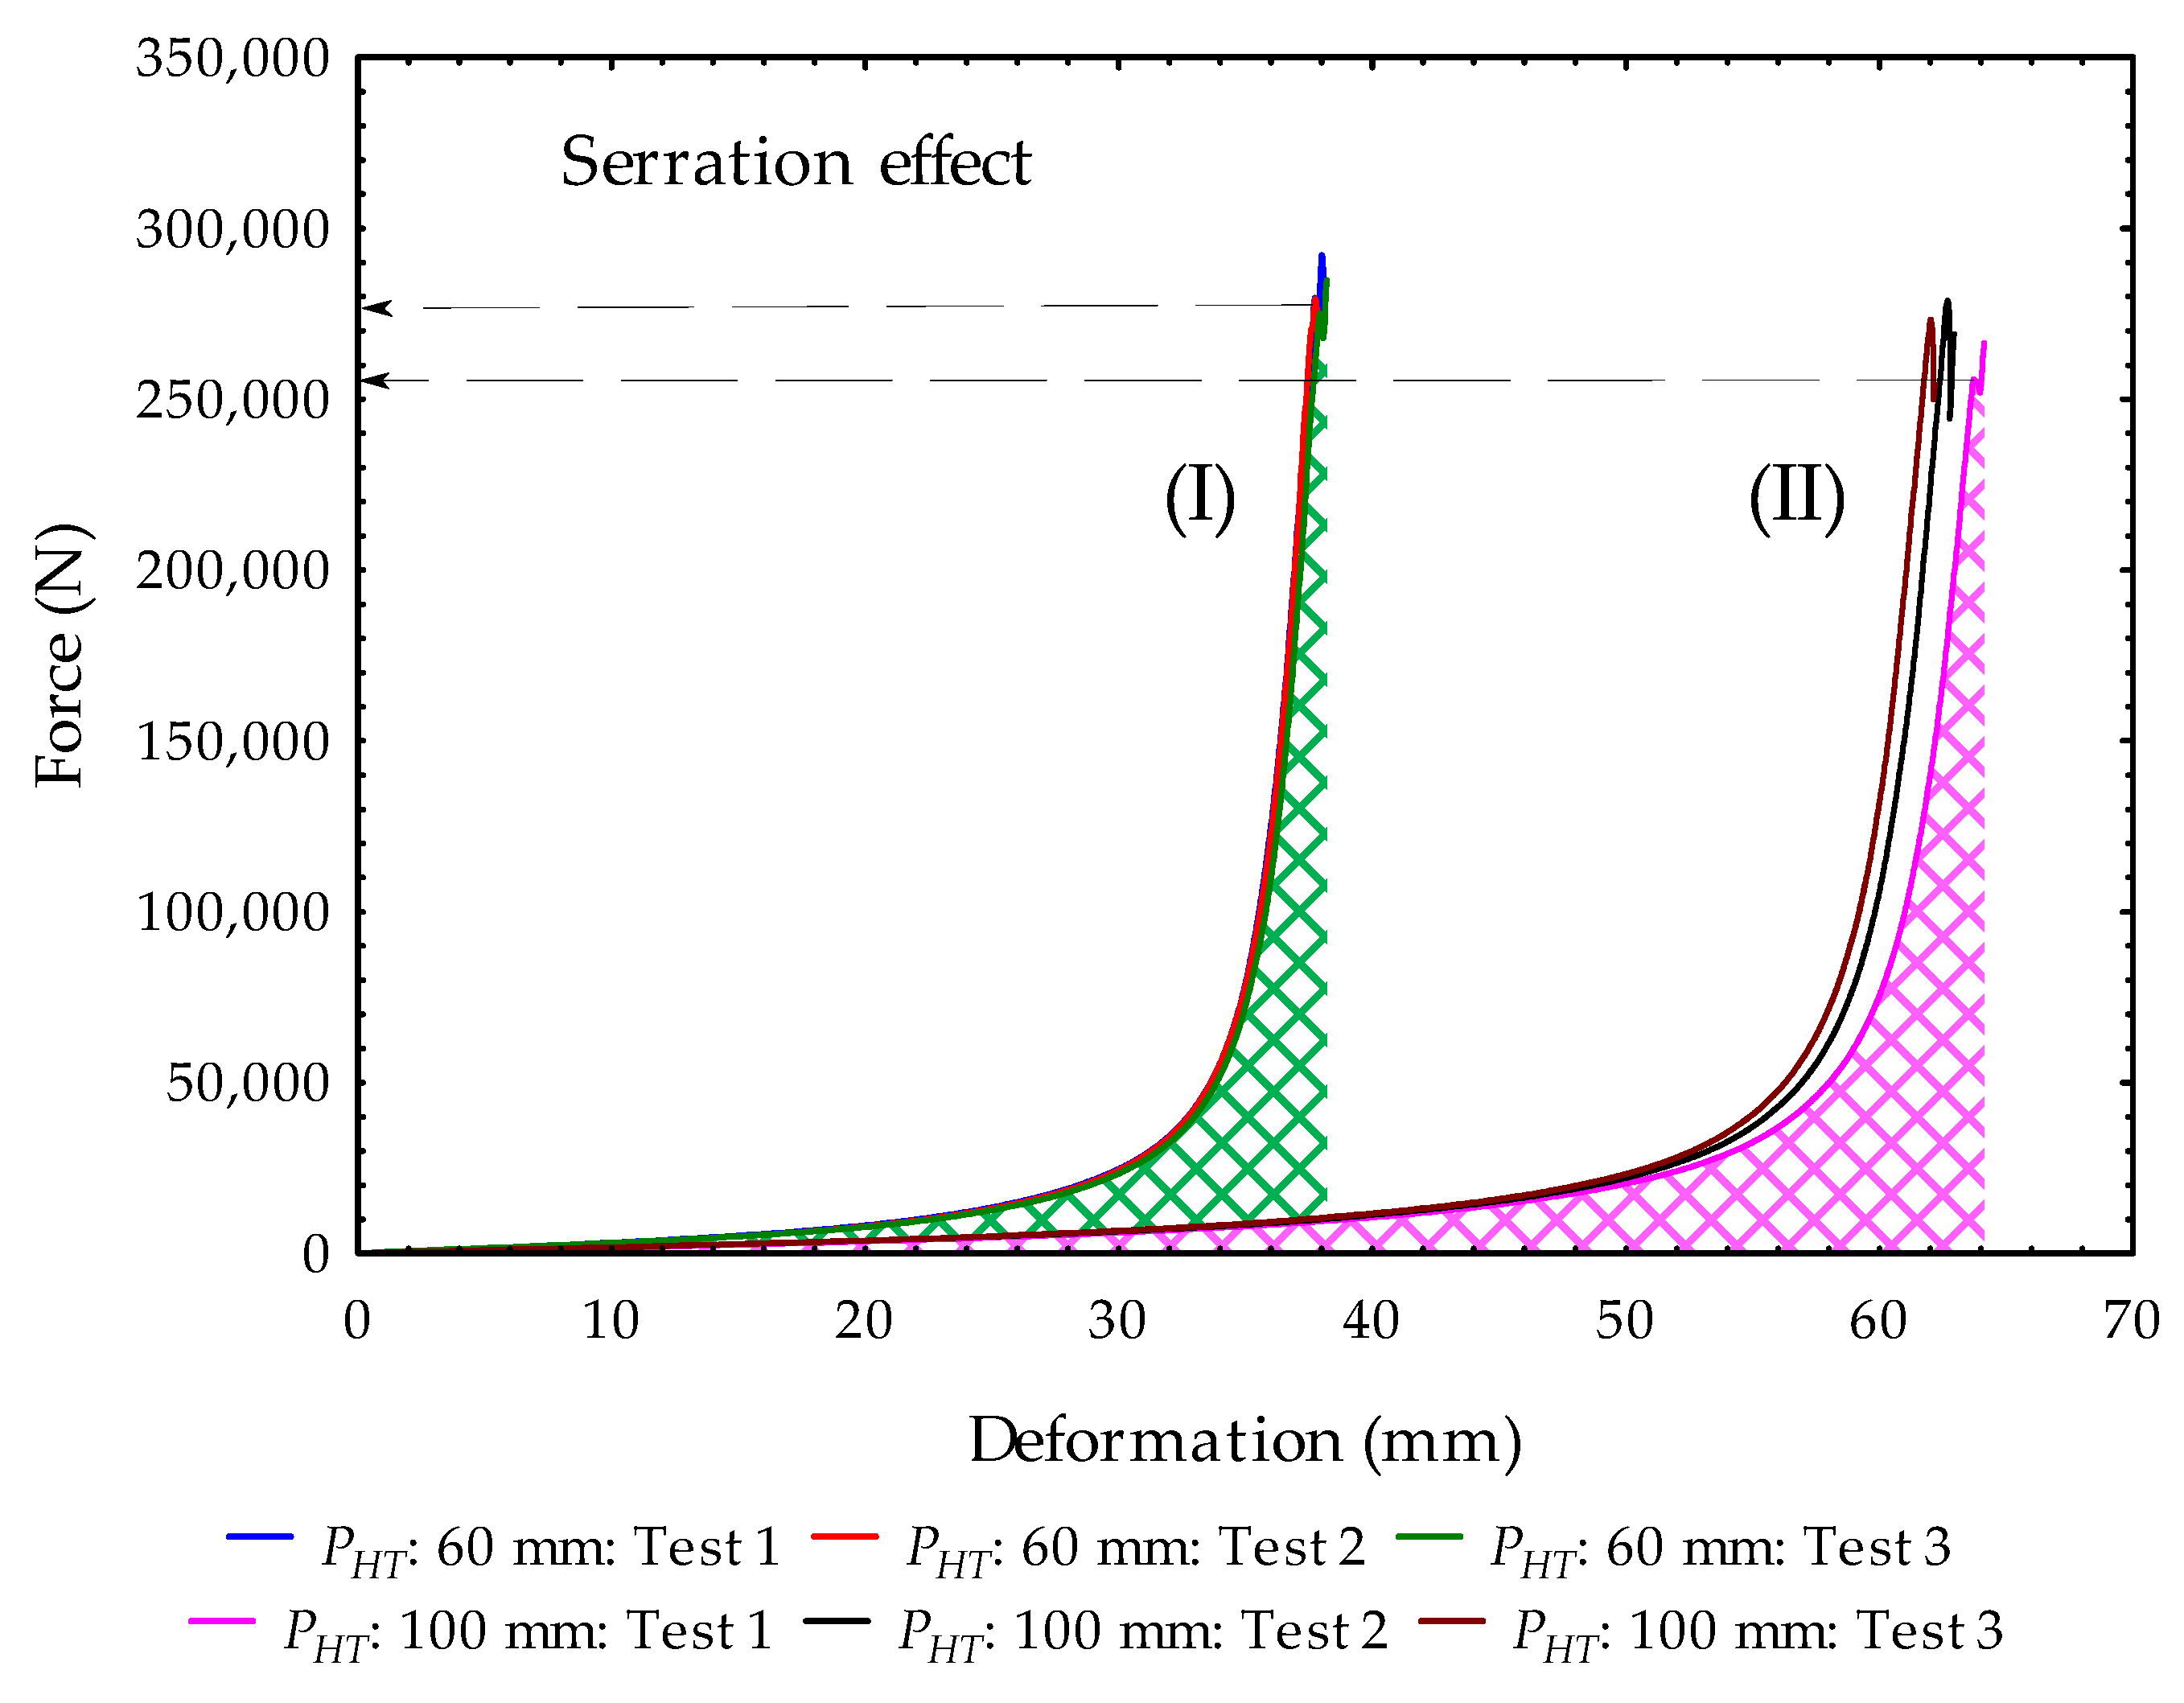
The results of the validation tests of the optimal input processing factors highlighted in Section 3.5 are presented in Table 13 and Table 14 and Figure 8. The extracted oil is shown in the Supplementary Materials (Figure S1). The validation tests were triplicated, and the mean, standard deviation, and percentage coefficient of variation were estimated. In the preceding Section 3.5, Figure 3, Figure 4, Figure 5 and Figure 6, the optimal input processing factors for the responses (mass of oil, M O L ; oil yield, O Y D ; oil expression efficient, O E E ; and experimental deformation energy, E N G ) were identified. For the mass of oil, the optimal input processing factors were similar to those in experimental run 8 (Table 2); therefore, a validation test was not conducted. On the other hand, the validation test showed that the optimal input processing factors for oil yield were similar to those for oil expression efficiency, whereas that of the experimental deformation energy differed. It is important to note that the responses mentioned above, in addition to the mechanical properties (force, F R C ; deformation, D F X ; hardness, H D N ; strain, ϵ S T ; compressive stress, σ S S ; and secant modulus of elasticity, S M E L ) can be estimated for each validation optimization test, as shown in Table 13 and Table 14 and Figure 8. Overall, the optimal input processing factors for (I) (Figure 8): H T P : (+1: 60 °C); H T M : (0.5: 52.5 min) and P H T : (−1: 60 mm) produced the highest amount of O Y D : 22.64 ± 0.26%, O E E : 68.93 ± 0.79% with the minimum E N G : 862.88 ± 7.52 J compared to the optimal input processing factors for (II) (Figure 8): H T P : (+1: 60 °C); H T M : (+1: 60 min) and P H T : (+1: 100 mm), which produced lower amounts of O Y D : 21.12 ± 0.37% and O E E : 64.32 ± 1.12% but with the highest amount of E N G : 1247.03 ± 22.13 J. The coefficient of variation in all cases ranged from 0.87 to 1.77% confirming the validity of the validation tests relative to Equation (18). Furthermore, the results of the mechanical properties showed higher amounts of the hardness H D N , compressive stress σ S S , and secant modulus of elasticity S M E L for optimal input processing factors (I) compared to (II), which showed lower amounts, indicating that the higher levels of the input processing factors do not necessarily cause higher rigidity during the oil extraction process. The theoretically fitted curves using Equation (13) compared with the experimental data (Table 13) are shown in the Supplementary Materials (Figures S1 and S2). Equation (13) coefficients and statistical metrics are also presented in Supplementary Materials Tables S1–S3. The percentage error between the experimental and theoretical deformation energies ranged from 18.59 to 20.82%, whereas the coefficient of determination for the fitting curves were between 0.995 and 0.996, all confirming the reliability of the use of the tangent curve (Equation (13)) for describing bulk agricultural materials under compression tests.

4. Discussion

The determined optimal operating factors for achieving oil expression efficiency of 68.96% based on (Equation (18)) were the heating temperature H T P of 60 °C, heating time H T M of 52.5 ≈ 53 min, and sample pressing height P H T of 60 mm using the pressing vessel of diameter 60 mm at a constant pressing speed of 5 mm/min. The pressing vessel cross-sectional area was calculated to be 2827.43 mm2. In all the compression tests, the force values ranged from 222.72 to 278.08 kN. Using Equation (11), the corresponding pressure values ranged from 78.77 to 98.35 N/mm2 = MPa. The validation tests through a triplicate experiment produced the mean and standard deviation values of 68.93 ± 0.79% with a coefficient of variation of 1.15% confirming the validity of Equation (18) in determining the oil expression efficiency of hemp seed samples by utilizing the Box–Behnken experimental design coupled with the response surface regression technique [20,25,46,47,48,49,50,51,52,53,54,63,64]. The experimental deformation energy, required to achieve 68.96% oil expression efficiency, was 862.88 ± 7.52 J with a coefficient of variation of 0.87%. An oil expression efficiency of approximately 69% indicates that 31% of the residual oil remains in the seedcake, requiring further extraction processes or repetitive compression tests to recover it [83]. In general, the higher residual oil content in the seedcake can be attributed to the oilseed moisture content, roasting temperature, heating time, species, quality, and the extraction process [16,32,33,34,35,36,37,38]. These operating factors thus affect the mechanical properties of the oilseeds, which can be grouped into hardness H D N and compressive stress σ S S . The hardness is related to the fracture strength of materials [84], whereas the compressive stress relates to the pressure that is applied in the mechanical screw press [38,85]. In this study, the estimated optimal pressure value was 98.35 ± 0.91 MPa, valid only for the conditions of the compression tests stated above. However, exceeding this pressure value resulted in the serration effect, with negligible oil flow, which agrees with studies reported in the literature [44,68,69].
In general, the results of this study thus relate to the industrial oil extraction using a mechanical screw press or expeller [38,65]. For oil recovery optimization, pressure is a key variable, and the general hypothesis is that higher pressure leads to higher temperature generation and higher oil recovery efficiency [38,85,86,87]. Notably, Bogaert et al. [38] indicated that for different functional sections of the screw press (feed, compression, and mixing/relaxation sections) in relation to the screw geometry, higher pressure will result in higher oil extraction and the formation of hard cake. In contrast, in the mixing section, pressure falls to zero, and the press cake becomes friable or easily crumbled.
Furthermore, roasting or heating treatments can induce oilseed drying, increase cell wall porosity, and reduce oil viscosity, thereby increasing oil liberation and extractability [75,88,89,90,91]. Singh et al. [75] reported that a high heating temperature decreased the oil yield of canola seeds using a single-chamber oil expeller. The authors explained that high temperatures caused the barrel to choke, altering the moisture content and seed structure during heating process. Again, the authors indicated that the residual oil in canola seedcake decreased and then increased with increasing moisture content and heating time. The maximum or optimum expeller extraction efficiencies of 91.66% and 88.12% of canola seeds were achieved at 5.81% wet basis moisture content, 10 min heating time, 85 °C heating temperature, 6 mm die clearance, and 312 mm screw speed, as reported by Singh et al. [75]. Babiker et al. [88] also reported that roasting hemp seeds increased oil yield and significantly reduced moisture content with increasing heating time. Karrar et al. [89] observed that the oil yield of unroasted gurum seeds increased remarkably from 27.65% to 31.45%, 34.03%, and 36.35% for samples roasted at 140 °C, 160 °C, and 180 °C, respectively, under conventional oven roasting. However, high roasting temperatures can alter the polyphenolic compounds, and the final nutritional quality of the oils, and can induce significant colour changes [90,91].

5. Conclusions

The oil extraction from bulk hemp seeds under uniaxial compression tests, using the Box–Behnken experimental design and response surface regression, revealed the following findings. The maximum force of 278.08 ± 2.58 kN was required for achieving the oil expression efficiency of 68.96% at the optimal heating temperature H T P of 60 °C, heating time, H T M of 53 min, and sample pressing height P H T of 60 mm. The maximum force value corresponds to a compressive stress or pressure value of 98.35 MPa. This result is valid for the pressing vessel with a diameter of 60 mm and a pressing speed of 5 mm/min, where there was no serration effect, that is, seedcake ejection through the pressing holes, with a negligible oil yield. The polynomial models of a second order showed the full or complete models for predicting the responses: mass of oil M O L (34.98 g); oil yield O Y D (22.65%); oil expression efficiency O E E (68.96%), and experimental deformation energy E N G (1197 J) based on the lack-of-fit p-values, which were greater than the probability level of 0.05. The full polynomial regression models achieved a desirability value of 1, and the coefficient of determination (R2) ranged from 0.68 to 0.95, indicating the models’ adequacy. The tangent curve model showed a good fit for describing the experimental maximum force–deformation curves, with (R2) values closer to 1 in determining the theoretical deformation energy for all experimental runs. However, the theoretical deformation energies obtained from the tangent curve model compared to the experimental deformation energies showed percentage errors between 1.35 and 28.31%, indicating that the varying input processing factors ( H T P , H T M and P H T ) tend to affect the coefficients of the tangent curve model (force coefficient of mechanical behaviour, deformation coefficient of mechanical behaviour, and fitting exponent). In a future study, the findings will be validated in a mechanical screw press to estimate residual oil in the seedcake in relation to oil expression efficiency and specific energy requirements.

Supplementary Materials

The following supporting information can be downloaded at: https://www.mdpi.com/article/10.3390/pr14040631/s1, Figure S1: Extracted oils at optimal input processing factors: (I): H T P : Heating temperature (+1: 60 °C); H T M : Heating time (0.5: 52.5 min); and P H T : Initial pressing height of sample (−1: 60 mm) and (II): H T P : Heating temperature (+1: 60 °C); H T M : Heating time (+1: 60 min); and P H T : Initial pressing height of sample (+1: 100 mm). Figure S2: Experimental and fitted data of the force–deformation curves of bulk hemp seeds for triplicated tests (I), (II), and (III) at optimal input processing factors for (*): H T P : Heating temperature (+1: 60 °C); H T M : Heating time (0.5: 52.5 min); and P H T : Initial pressing height of sample (–1: 60 mm) and Figure S3: Experimental and fitted data of the force–deformation curves of bulk hemp seeds for triplicated tests (I), (II), and (III) at optimal input processing factors for (**): H T P : Heating temperature (+1: 60 °C); H T M : Heating time (+1: 60 min); and P H T : Initial pressing height of sample (+1: 100 mm); Table S1: Determined coefficients of the tangent curve model and statistical metrics to describe the force–deformation curves of bulk hemp seeds at optimal input processing factors; Table S2: Determined amounts of experimental and theoretical energies of bulk hemp seeds at optimal input processing factors: * ( H T P : (+1: 60 °C); H T M : (0.5: 52.5 min) and P H T : (–1: 60 mm)) and Table S3: Determined amounts of experimental and theoretical energies of bulk hemp seeds at optimal input processing factors: ** ( H T P : (+1: 60 °C); H T M : (+1: 60 min) and P H T : (+1: 100 mm)).

Author Contributions

A.K.: Conceptualisation, Methodology, Supervision, Project administration, Funding acquisition, Formal analysis, Visualization, Validation, Writing—Original Draft, Writing—Review and Editing. M.M.: Investigation, Data curation, Formal analysis, Writing—Original Draft, Writing—Review and Editing. S.H.K.: Investigation, Data curation, Formal analysis, Writing—Original Draft, Writing—Review and Editing. S.S.S.: Investigation, Data curation, Formal analysis, Writing—Original Draft, Writing-Review and Editing. All authors have read and agreed to the published version of the manuscript.

Funding

The study was supported financially by the Internal Grant Agency of the Czech University of Life Sciences Prague (IGA Project Number—2024:31130/1312/3108).

Data Availability Statement

The original contributions presented in the study are included in the article, further inquiries can be directed to the corresponding author.

Conflicts of Interest

The authors declare no conflicts of interest.

References

  1. Dudziec, P.; Warminski, K.; Stolarski, M.J. Industrial hemp as a multipurpose crop: Last achievements and research in 2018–2023. J. Nat. Fibers 2024, 21, 2369186. [Google Scholar] [CrossRef]
  2. Kolodziej, J.; Pudelko, K.; Mankowski, J. Energy and biomass yield of industrial hemp (Cannabis sativa L.) as influenced by seeding rate and harvest time in Polish agro-climatic conditions. J. Nat. Fibers 2023, 20, 2159609. [Google Scholar] [CrossRef]
  3. Andre, C.M.; Hausman, J.-F.; Guerriero, G. Cannabis sativa: The plant of the thousand and one molecules. Front. Plant Sci. 2016, 7, 19. [Google Scholar] [CrossRef]
  4. Hemp—Agriculture and Rural Development—European Commission. Available online: https://agriculture.ec.europa.eu/farming/crop-productions-and-plant-based-products/hemp_en (accessed on 5 December 2025).
  5. Pisanti, S.; Malfitano, A.M.; Ciaglia, E.; Lamberti, A.; Ranieri, R.; Cuomo, G.; Abate, M.; Faggina, G.; Proto, M.C.; Fiore, D.; et al. Cannabidiol: State of the art and new challenges for therapeutic applications. Pharmacol. Ther. 2017, 175, 133–150. [Google Scholar] [CrossRef] [PubMed]
  6. Michels, M.; Brinkmann, A.; MuBhoff, O. Economic, ecological and social perspectives of industrial hemp cultivation in Germany: A qualitative analysis. J. Environ. Manag. 2025, 389, 126117. [Google Scholar] [CrossRef] [PubMed]
  7. Berardo, M.E.V.; Mendieta, J.R.; Villamonte, M.D.; Colman, S.L.; Nercessian, D. Antifungal and antibacterial activities of Cannabis sativa L. resins. J. Ethnopharmacol. 2024, 318, 116839. [Google Scholar] [CrossRef] [PubMed]
  8. Pieracci, Y.; Ascrizzi, R.; Terreni, V.; Pistelli, L.; Flamini, G.; Bassolino, L.; Fulvio, F.; Montanari, M.; Paris, R. Essential oil of Cannabis sativa L.: Composition of yield and chemical composition of 11 hemp genotypes. Molecules 2021, 26, 4080. [Google Scholar] [CrossRef]
  9. Schultes, R.E.; Klein, W.M.; Plowman, T.; Lockwood, T.E. Cannabis: An example of taxonomic neglect. In Cannabis and Culture; De Gruyter Mouton: Berlin, Germany, 1975; pp. 21–38. [Google Scholar]
  10. Cortes, J.G.; Ryu, B.R.; Pauli, C.; Barroso, L.R.; Park, S.H. Industrial applications of hemp fibre in Europe and evolving regulatory landscape. J. Nat. Fibers 2024, 21, 2435047. [Google Scholar] [CrossRef]
  11. Industrial Hemp Market Size & Share, Industry Report 2024–2030. Available online: https://www.grandviewresearch.com/industry-analysis/industrial-hemp-market (accessed on 5 December 2025).
  12. The World’s Top 5 Hemp-Producing Countries—CBD World News. Available online: https://cbdworldnews.com/2020/10/18/the-worlds-top-5-hemp-producing-countries/ (accessed on 5 December 2025).
  13. Oyarzun, M.; Saalbrink, J.; Bonilla, J.C.; Gouseti, O.; Jensen, P.E.; Risbo, J. Simultaneous extraction of hempseed oil bodies and protein concentrate through mild phytate-driven water-only fractionation. Future Foods 2025, 13, 100864. [Google Scholar] [CrossRef]
  14. Yano, H.; Fu, W. Hemp: A sustainable plant with high industrial value in food processing. Foods 2023, 12, 651. [Google Scholar] [CrossRef]
  15. Small, E. Cannabis: A Complete Guide; CRC Press Taylor and Francis Group: Boca Raton, FL, USA, 2017. [Google Scholar]
  16. Muangrat, R.; Kaikonjanat, A. Comparative evaluation of hemp seed oil yield and physicochemical properties using supercritical CO2, accelerated hexane, and screw press extraction techniques. J. Agric. Food Res. 2025, 19, 101618. [Google Scholar] [CrossRef]
  17. Alonso-Esteban, J.I.; González-Fernández, M.J.; Fabrikov, D.; de Cortes Sánchez-Mata, M.; Torija-Isasa, E.; Guil-Guerrero, J.L. Fatty acids and minor functional compounds of hemp (Cannabis sativa L.) seeds and other Cannabaceae species. J. Food Compos. Anal. 2023, 115, 104962. [Google Scholar] [CrossRef]
  18. Farinon, B.; Molinari, R.; Costantini, L.; Merendino, N. The seed of industrial hemp (Cannabis sativa L.): Nutritional quality and potential functionality for human health and nutrition. Nutrients 2020, 12, 1935. [Google Scholar] [CrossRef]
  19. Abdollahi, M.; Sefidkon, F.; Calagari, M.; Mousavi, A.; Mahomoodally, M.F. A comparative study of seed yield and oil composition of four cultivars of hemp (Cannabis sativa L.) grown from three regions in northern Iran. Ind. Crops Prod. 2020, 152, 112397. [Google Scholar] [CrossRef]
  20. Todorovic, Z.B.; Mitrovic, P.M.; Zlatkovic, V.; Grahovac, N.L.; Bankovic-Ilic, I.B.; Troter, D.Z.; Marjanovic-Jeromela, A.M.; Veljkovic, V.B. Optimization of oil recovery from oilseed rape by cold pressing using statistical modeling. J. Food Meas. Charact. 2024, 18, 474–488. [Google Scholar] [CrossRef]
  21. Gaikwad, R.K.; Mondal, I.H.; Dash, K.K.; Shaikh, A.M.; Béla, K. Effectiveness of sustainable oil extraction techniques: A comprehensive review. J. Agric. Food Res. 2025, 19, 101546. [Google Scholar] [CrossRef]
  22. Devi, M.P.; Ghosh, S.K.; Bhowmick, N.; Chakrabarty, S. Essential oil: Its economic aspect, extraction, importance, uses, hazards and quality. In Value Addition of Horticultural Crops: Recent Trends and Future Directions; Springer: New Delhi, India, 2015; pp. 269–278. [Google Scholar]
  23. Kant, R.; Kumar, A. Review on essential oil extraction from aromatic and medicinal plants: Techniques, performance and economic analysis. Sustain. Chem. Pharm. 2022, 30, 100829. [Google Scholar] [CrossRef]
  24. Rakhee Mishra, J.; Sharma, R.K.; Misra, K. Characterization techniques for herbal products. In Management of High Altitude Pathophysiology; Academic Press: Cambridge, MA, USA, 2018; pp. 171–202. [Google Scholar]
  25. Ali, M.K.; Jon, P.H.; Shourove, J.H.; Rahman, O.; Islam, G.M.R. Optimization of sonication-assisted hydrodistillation for essential oil extraction from Citrus macroptera peel: A comparative study of RSM and ANN. Appl. Food Res. 2025, 5, 101446. [Google Scholar] [CrossRef]
  26. Jadhav, J.J.; Jadeja, G.C.; Desai, M.A. Ultrasound-assisted hydrodistillation for extraction of essential oil from clove buds–A step towards process improvement and sustainable outcome. Chem. Eng. Process. 2023, 189, 109404. [Google Scholar] [CrossRef]
  27. Ghazanfari, N.; Yazdi, F.T.; Morazavi, S.A.; Mohammadi, M. Using pulsed electric field pre-treatment to optimize coriander seeds essential oil antimicrobial properties, antioxidant activity, and essential oil compositions. LWT 2023, 182, 114852. [Google Scholar] [CrossRef]
  28. Ranjha, M.M.A.N.; Zahra, S.M.; Irfan, S.; Shafique, B.; Noreen, R.; Alahmad, U.F.; Liaqat, S.; Umar, S. Extraction and analysis of essential oils: Extraction methods used at laboratory and industrial level and chemical analysis. In Essential Oils: Extraction, Characterization and Applications; Academic Press: Cambridge, MA, USA, 2023; pp. 37–52. [Google Scholar]
  29. Aytac, E. Comparison of extraction methods of virgin coconut oil: Cold press, soxhlet and supercritical fluid extraction. Sep. Sci. Technol. 2022, 57, 426–432. [Google Scholar] [CrossRef]
  30. Martínez-Abad, A.; Ramos, M.; Hamzaoui, M.; Kohnen, S.; Jiménez, A.; Garrigos, M.C. Optimization of sequential microwave-assisted extraction of essential oil and pigment from lemon peels waste. Foods 2020, 9, 1493. [Google Scholar] [CrossRef]
  31. Mohamad, N.; Ramli, N.; Abd-Aziz, S.; Ibrahim, M.F. Comparison of hydro-distillation, hydro-distillation with enzyme-assisted and supercritical fluid for the extraction of essential oil from pineapple peels. 3 Biotech 2019, 9, 234. [Google Scholar] [CrossRef]
  32. Apetroaei, V.T.; Pricop, E.M.; Istrati, D.I.; Vizireanu, C. Hemp seeds (Cannabis sativa L.) as a valuable source of natural ingredients for functional foods—A review. Molecules 2024, 29, 2097. [Google Scholar] [CrossRef]
  33. Cravotto, C.; Fabiano-Tixier, A.S.; Bartier, M.; Claux, M.; Tabasso, S. Green extraction of hemp seeds cake (Cannabis sativa L.) with 2-methyloxolane: A response surface optimization study. Sustain. Chem. Pharm. 2024, 39, 101509. [Google Scholar] [CrossRef]
  34. Baldino, N.; Carnevale, I.; Mileti, O.; Aiello, D.; Lupi, F.R.; Napoli, A.; Gabriele, D. Hemp seed oil extraction and stable emulsion formulation with hemp protein isolates. Appl. Sci. 2022, 12, 11921. [Google Scholar] [CrossRef]
  35. Soroush, D.R.; Solaimanimehr, S.; Azizkhani, M.; Kenari, R.E.; Dehghan, B.; Mohammadi, G.; Sadeghi, E. Optimization of microwave-assisted solvent extraction of hemp (Cannabis sativa L.) seed oil using RSM: Evaluation of oil quality. J. Food Meas. Charact. 2021, 15, 5191–5202. [Google Scholar] [CrossRef]
  36. Suarez-Jacobo, A.D.; Pacheco, A.D.; Bonales-Alatorre, E.; Castillo-Herrera, G.A.; Garcia-Fajardo, J.A. Cannabis extraction technologies: Impact of research and value addition in Latin America. Molecules 2023, 28, 2895. [Google Scholar] [CrossRef] [PubMed]
  37. Baljatu, C.; Mateescu, M.; Anghelache, D.; Tabarasu, A.M. The importance of moisture in extacting oils from oilseeds—A review. Ann. Fac. Eng. Hunedora—Int. J. Eng. 2022, 20, 167–170. [Google Scholar]
  38. Bogaert, L.; Mathieu, T.; Mhemdi, H.; Vorobiev, E. Characterization of oilseeds mechanical expression in an instrumental pilot screw press. Ind. Crops Prod. 2018, 121, 106–113. [Google Scholar] [CrossRef]
  39. Munson-Mcgee, S.H. D-optimal experimental designs for uniaxial expression. J. Food Process Eng. 2014, 37, 248–256. [Google Scholar] [CrossRef]
  40. Kabutey, A.; Kibret, S.H.; Kiros, A.W.; Afework, M.A.; Onwuka, M.; Raj, A. Comparative Analysis of Pretreatment Methods for Processing Bulk Flax and Hemp Oilseeds Under Uniaxial Compression. Foods 2025, 14, 629. [Google Scholar] [CrossRef]
  41. Demirel, C.; Kabutey, A.; Herák, D.; Sedlaček, A.; Mizera, Č.; Dajbych, O. Using Box–Behnken Design Coupled with Response Surface Methodology for Optimizing Rapeseed Oil Expression Parameters under Heating and Freezing Conditions. Processes 2022, 10, 490. [Google Scholar] [CrossRef]
  42. Kabutey, A.; Mizera, Č.; Dajbych, O.; Hrabě, P.; Herák, D.; Demirel, C. Modelling and Optimization of Processing Factors of Pumpkin Seeds Oil Extraction under Uniaxial Loading. Processes 2021, 9, 540. [Google Scholar] [CrossRef]
  43. Gürdil, G.A.K.; Kabutey, A.; Selvi, K.Ç.; Mizera, Č.; Herák, D.; Fraňková, A. Evaluation of Postharvest Processing of Hazelnut Kernel Oil Extraction Using Uniaxial Pressure and Organic Solvent. Processes 2020, 8, 957. [Google Scholar] [CrossRef]
  44. Divisova, M.; Herak, D.; Kabutey, A.; Sigalingging, R.; Svatonova, T. Deformation curve characteristics of rapeseeds and sunflower seeds under compression loading. Sci. Agric. Bohem. 2014, 45, 180–186. [Google Scholar] [CrossRef]
  45. Herak, D.; Kabutey, A.; Divisova, M.; Simanjuntak, S. Mathematical model of mechanical behaviour of Jatropha curcas L. Seeds under compression loading. Biosyst. Eng. 2013, 114, 279–288. [Google Scholar] [CrossRef]
  46. Saady, N.M.C.; Nazifa, T.H. Kiwi peel waste enhances manure protein degradation: Statistical optimization using Box-Behnken design and response surface methodology. Clean. Waste Syst. 2025, 12, 100382. [Google Scholar] [CrossRef]
  47. Thapa, D.; Kumar, V.; Naik, B.; Gupta, A.K.; Richa, R. Process optimization and characterization of Shorea robusta (Sal) seed oil using response surface methodology: A sustainable approach to oil valorization. Food Chem. X 2025, 32, 103380. [Google Scholar] [CrossRef] [PubMed]
  48. Weremfo, A.; Abassah-Oppong, S.; Adulley, F.; Dabie, K.; Seidu-Larry, S. Response surface methodology as a tool to optimize the extraction of bioactive compounds from plant sources. J. Sci. Food Agric. 2023, 103, 26–36. [Google Scholar] [CrossRef] [PubMed]
  49. Avramovic, J.M.; Radosavljevic, D.B.; Velickovic, A.V.; Stojkovic, I.J.; Stamenkovic, O.S.; Veljkovic, V.B. Statistical modeling and optimization of ultrasound-assisted biodiesel production using various experimental designs. Zast. Mater. 2019, 60, 70–80. [Google Scholar]
  50. Polat, S.; Sayan, P. Application of response surface methodology with a Box-Behnken design for struvite precipitation. Adv. Powder Technol. 2019, 30, 2396–2407. [Google Scholar] [CrossRef]
  51. Veljkovic, V.B.; Velickovic, A.V.; Avramovic, J.M.; Stamenkovic, O.S. Modeling of biodiesel production: Performance comparison of Box-Behnken, face central composite and full factorial design. Chin. J. Chem. Eng. 2019, 27, 1690–1698. [Google Scholar] [CrossRef]
  52. Stamenković, O.S.; Kostić, M.D.; Radosavljević, D.B.; Veljković, V.B. Comparison of box-behnken, face central composite and full factorial designs in optimization of hempseed oil extraction by n-hexane: A case study. Period. Polytech. Chem. Eng. 2018, 62, 359–367. [Google Scholar] [CrossRef]
  53. Das, S.; Mishra, S. Box-Behnken statistical design to optimize preparation of activated carbon from Limonia acidissima shell with desirability approach. J. Environ. Chem. Eng. 2017, 5, 588–600. [Google Scholar] [CrossRef]
  54. Ye, Z.; Wang, W.; Yuan, Q.; Ye, H.; Sun, Y.; Zhang, H.; Zeng, X. Box-Behnken design for extraction optimization, characterization and in vitro antioxidant activity of Cicer arietinum L. hull polysaccharides. Carbohydr. Polym. 2016, 147, 354–364. [Google Scholar] [CrossRef]
  55. Musayev, M.; Kabutey, A.; Soe, S.S.; Kibret, S.H. Optimization of input factor levels for processing bulk hemp seeds under linear pressing. In Proceedings of the TAE 2025—9th International Conference on Trends in Agricultural Engineering, Prague, Czech Republic, 17–19 September 2025. [Google Scholar]
  56. IS:3579; Indian Standard Methods for Analysis of Oilseeds. Indian Standard Institute: New Delhi, India, 1996.
  57. Blahovec, J. Agromaterials Study Guide; Czech University of Life Sciences Prague: Prague, Czech Republic, 2008. [Google Scholar]
  58. Fornasari, C.H.; Secco, D.; Santos, R.F.; da Silva, T.R.B.; Lenz, N.B.G.; Tokura, L.K.; Lenz, M.L.; de Souza, S.N.M.; Junior, L.A.Z.; Gurgacz, F. Efficiency of the use of solvents in vegetable oil extraction at olaginous crops. Renew. Sustain. Energy Rev. 2017, 80, 121–124. [Google Scholar] [CrossRef]
  59. Niu, L.; Li, J.; Chen, M.-S.; Xu, Z.-F. Determination of oil contents in Sacha inchi (Plukenetia volubilis) seeds at different developmental stages by two methods: Soxhlet extraction and time-domain nuclear magnetic resonance. Ind. Crops Prod. 2014, 56, 187–190. [Google Scholar] [CrossRef]
  60. Danlami, J.M.; Arsad, A.; Zaini, M.A.A. Characterization and process optimization of castor oil (Ricinus communis L.) extracted by the Soxhlet method using polar and non-polar solvents. J. Taiwan Inst. Chem. Eng. 2015, 47, 99–104. [Google Scholar] [CrossRef]
  61. Mohammadpour, H.; Sadrameli, S.M.; Eslami, F.; Asoodeh, A. Optimization of ultrasound-assisted extraction of Moringa peregrina oil with response surface methodology and comparison with Soxhlet method. Ind. Crops Prod. 2019, 131, 106–116. [Google Scholar] [CrossRef]
  62. StatSoft Inc. STATISTICA for Windows; StatSoft Inc.: Tulsa, OK, USA, 1995. [Google Scholar]
  63. Chanioti, S.; Tzia, C. Optimization of ultrasound-assisted extraction of oil from olive pomace using response surface technology: Oil recovery, unsaponifiable matter, total phenol content and antioxidant activity. LWT–Food Sci. Technol. 2017, 79, 178–189. [Google Scholar] [CrossRef]
  64. Ocholi, O.; Menkiti, M.; Auta, M.; Ezemagu, I. Optimization of the operating parameters for the extractive synthesis of biolubricant from sesame seed oil via response surface methodology. Egypt. J. Pet. 2018, 27, 265–275. [Google Scholar] [CrossRef]
  65. Deli, S.; Farah Masturah, M.; Tajul Aris, Y.; Wan Nadiah, W.A. The effects of physical parameters of the screw press oil expeller on oil yield from Nigella sativa L. seeds. Int. Food Res. J. 2011, 18, 1367–1373. [Google Scholar]
  66. Hernandez-Santos, B.; Rodriguez-Miranda, J.; Herman-Lara, E.; Torruco-Uco, J.G.; Carmona-Garcia, R.; Juarez-Barrientos, J.M.; Chavez-Zamudio, R.; Martinez-Sanchez, C.E. Effect of oil extraction assisted by ultrasound on the physicochemical properties and fatty acid profile of pumpkin seed oil (Cucurbita pepo). Ultrason. Sonochem. 2016, 31, 429–436. [Google Scholar] [CrossRef]
  67. Herak, D.; Kabutey, A.; Sedlacek, A.; Gurdil, G. Mechanical behaviour of several layers of selected plant seeds under compression loading. Res. Agric. Eng. 2012, 58, 24–29. [Google Scholar] [CrossRef]
  68. Lysiak, G. Fracture toughness of pea: Weibull analysis. J. Food Eng. 2007, 83, 436–443. [Google Scholar] [CrossRef]
  69. Gupta, R.K.; Das, S.K. Fracture resistance of sunflower seed and kernel to compressive loading. J. Food Eng. 2000, 46, 1–8. [Google Scholar] [CrossRef]
  70. Herak, D.; Kabutey, A.; Choteborsky, R.; Petru, M.; Sigalingging, R. Mathematical models describing the relaxation behaviour of Jatropha curcas L. bulk seeds under axial compression. Biosyst. Eng. 2015, 131, 77–83. [Google Scholar] [CrossRef]
  71. Chakespari, A.G.; Rajabipour, A.; Mobli, H. Strength behaviour study of apples (cv. Shafi Abadi & Golab Kohanz) under compression loading. Mod. Appl. Sci. 2010, 4, 173–182. [Google Scholar]
  72. Pritchard, P.J. Mathcad: A Tool for Engineering Problem Solving; McGraw-Hill: New York, NY, USA, 1998. [Google Scholar]
  73. Moslavac, T.; Jokic, S.; Subaric, D.; Ostojcic, M.; Tomas, S.; Kovac, M.; Budzaki, S. Influence of drying, pressing, and antioxidants on yield and oxidative stability of cold pressing oils. Kem. Ind. 2023, 72, 433–442. [Google Scholar] [CrossRef]
  74. Zhang, Y.; Li, X.; Lu, X.; Sun, H.; Wang, F. Effect of oilseed roasting on the quality, flavor, and safety of oil: A comprehensive review. Food Res. Int. 2021, 150, 110791. [Google Scholar] [CrossRef]
  75. Sing, G.; Sing, A.K.; Sing, P. Effect of moisture content on the mechanical oil extraction of canola seeds. Int. J. Curr. Microbiol. App. Sci. 2019, 8, 965–977. [Google Scholar] [CrossRef]
  76. Wroniak, M.; Rekas, A.; Siger, A.; Janowicz, M. Microwave pretreatment effects on the changes in seeds microstructure, chemical composition, and oxidative stability of rapeseed oil. LWT–Food Sci. Technol. 2016, 68, 634–641. [Google Scholar] [CrossRef]
  77. Bambgoye, A.I.; Adejumo, O.I. Effects of processing parameters of Roselle seed on its oil yield. Int. J. Agric. Biol. Eng. 2011, 4, 82–86. [Google Scholar]
  78. Yang, M.; Huang, F.; Liu, C.; Zheng, C.; Zhou, Q.; Wang, H. Influence of microwave treatment of rapeseed on minor components content and oxidative stability of oil. Food Bioprocess Technol. 2013, 6, 3206–3216. [Google Scholar] [CrossRef]
  79. Uquiche, E.; Jerez, M.; Ortiz, J. Effect of pretreatment with microwaves on mechanical extraction yield and quality of vegetable oil from chilean hazelnuts (Gevuina avellana Mol). Innov. Food Sci. Emerg. Technol. 2008, 9, 495–500. [Google Scholar] [CrossRef]
  80. Sheoran, S.S.; Vardhanabhuti, B.; Bilyeu, K.; Flint-Garcia, S.; Wan, C.; Somavat, P. Development of a novel, small-scale cold screw press protocol for rapid soybean processing and coproduct evaluation. Food Bioprod. Process. 2024, 146, 89–102. [Google Scholar] [CrossRef]
  81. Sigalingging, R.; Herak, D.; Kabutey, A.; Dajbych, O.; Hrabe, P.; Mizera, C. Application of a tangent curve mathematical model for analysis of the mechancial behaviour of sunflower bulk seeds. Int. Agrophys. 2015, 29, 517–524. [Google Scholar] [CrossRef]
  82. Baidhe, E.; Clementson, C.L. Modelling rupture and relaxation characteristics of soyabean under compressive loading. Biosyst. Eng. 2025, 254, 104137. [Google Scholar] [CrossRef]
  83. Kabutey, A.; Herak, D.; Mizera, Č. Determination of maximum oil yield, quality indicators, and absorbance spectra of hulled sunflower seeds oil extraction under axial loading. Foods 2022, 11, 2866. [Google Scholar] [CrossRef]
  84. Zhang, P.; Li, S.X.; Zhang, Z.F. General relationship between strength and hardness. Mater. Sci. Eng. 2011, 529, 62–73. [Google Scholar] [CrossRef]
  85. Karaj, S.; Muller, J. Optimizing mechanical oil extraction of Jatropha curcas L. seeds with respect to press capacity, oil recovery, and energy efficiency. Ind. Crops Prod. 2011, 34, 1010–1016. [Google Scholar] [CrossRef]
  86. Willems, P.; Kuipers, N.J.M.; De Haan, A.B. Hydraulic pressing of oilseeds: Experimental determination and modeling of yield and pressing rates. J. Food Eng. 2008, 89, 8–16. [Google Scholar] [CrossRef]
  87. Willems, P.; Kuipers, N.J.M.; De Haan, A.B. A consolidation-based extruder model to explore GAME process configurations. J. Food Eng. 2009, 90, 238–245. [Google Scholar] [CrossRef]
  88. Babiker, E.E.; Uslu, N.; Juhaimi, F.A.; Ahmed, I.A.M.; Ghafoor, K.; Ozcan, M.M.; Almusallam, I.A. Effect of roasting on antioxidative properties, polyphenol profile, and fatty acids composition of hemp (Cannabis sativa L.) seeds. LWT–Food Sci. Technol. 2021, 139, 110537. [Google Scholar] [CrossRef]
  89. Karrar, E.; Ahmed, I.A.M.; Manzoor, M.F.; Al-Farga, A.; Wei, W.; Albakry, Z.; Sarpong, F.; Wang, X. Effect of roasting pretreatment on fatty acids, oxidative stability, tocopherols, and antioxidant activity of gurum seeds oil. Biocatal. Agric. Biotechnol. 2021, 34, 102022. [Google Scholar] [CrossRef]
  90. Ee, K.Y.; Zhao, J.; Rehman, A.; Agboola, S. Effects of roasting on the characteristics of Australian wattle (Acacia victoriae Bentham) seed and extracts. Int. J. Food Prop. 2013, 16, 1135–1147. [Google Scholar] [CrossRef]
  91. Potočnik, T.; Cizej, M.R.; Košir, I.J. Influence of seed roasting on pumpkin seed oil tocopherols, phenolics and antiradical activity. J. Food Compos. Anal. 2018, 69, 7–12. [Google Scholar] [CrossRef]
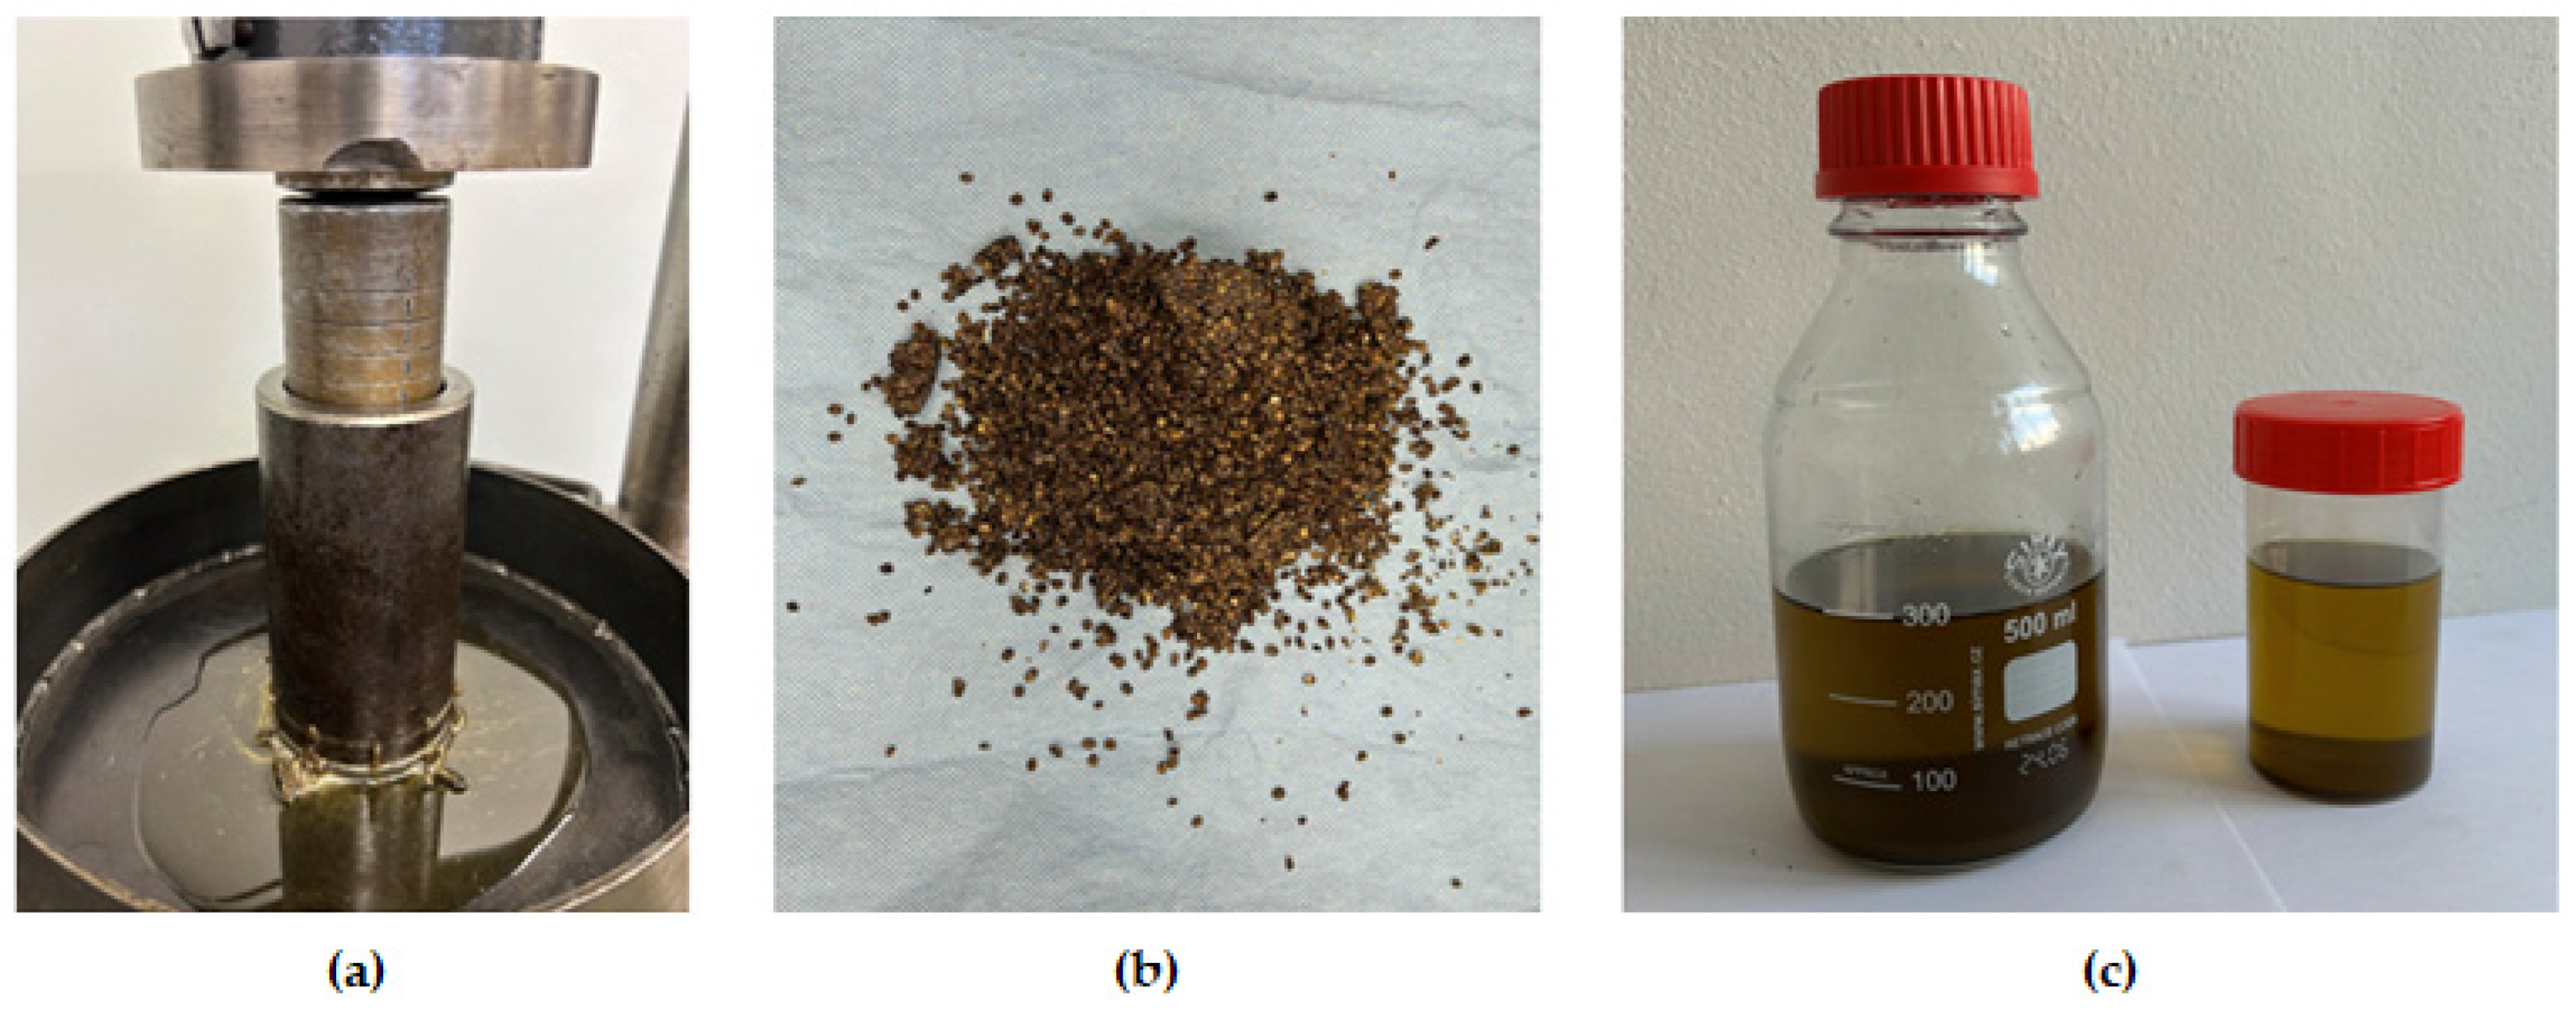
Figure 1. (a) Uniaxial compression test for extracting the oil; (b) seedcake of bulk hemp seeds sample afer compression tests; (c) extracted oils from the 17 experimental tests/runs conducted.
Processes 14 00631 g001
Figure 2. Force–deformation curves of bulk hemp seed samples at various pressing heights, H (a) 80 mm, (b) 60 mm, (c) 100 mm, and (d) 80 mm at centre factor levels. The blue area under the curve represents the experimental deformation energy required to extract the oil.
Processes 14 00631 g002
Figure 3. Profiles of predicted parameter with desirability (blue dashed lines: circled and rectangular) and optimal values (red dashed lines) for the mass of oil M O L parameter; H T P : Heating temperature (+1: optimal level of 60 °C); H T M : Heating time (0: optimal level of 45 min); and P H T : Initial pressing height of sample (+1: optimal level of 100 mm).
Processes 14 00631 g003
Figure 4. Profiles of predicted parameter with desirability (blue dashed lines: circled and rectangular) and optimal values (red dashed lines) for oil yield O Y D parameter; H T P : Heating temperature (+1: optimal level of 60 °C); H T M : Heating time (0.5: optimal level of 52.5 min); and P H T : Initial pressing height of sample (−1: optimal level of 60 mm).
Processes 14 00631 g004
Figure 5. Profiles of predicted parameter with desirability (blue dashed lines: circled and rectangular) and optimal values (red dashed lines) for oil expression efficiency O E E parameter; H T P : Heating temperature (+1: optimal level of 60 °C); H T M : Heating time (0.5: optimal level of 52.5 min); and P H T : Initial pressing height of sample (−1: optimal level of 60 mm).
Processes 14 00631 g005
Figure 6. Profiles of predicted parameter with desirability (blue dashed lines: circled and rectangular) and optimal values (red dashed lines) for experimental deformation energy E N G parameter; H T P : Heating temperature (+1: optimal level of 60 °C); H T M : Heating time (+1: optimal level of 60 min); and P H T : Initial pressing height of sample (+1: optimal level of 100 mm).
Processes 14 00631 g006
Figure 7. Experimental and fitted data of the force–deformation curves of bulk hemp seeds for runs 1–4, representing similar curves obtained for experimental runs 5–17.
Processes 14 00631 g007
Figure 8. Force–deformation curves of bulk hemp seeds at optimal input processing factors for (I): H T P : Heating temperature (+1: 60 °C); H T M : Heating time (0.5: 52.5 min); and P H T : Initial pressing height of sample (−1: 60 mm), (II): H T P : Heating temperature (+1: 60 °C); H T M : Heating time (+1: 60 min); and P H T : Initial pressing height of sample (+1: 100 mm). The area under the curve represents the deformation energy.
Processes 14 00631 g008
Table 1. Box–Behnken experimental design with 12 combinations and 5 replications.
Input Processing FactorsCoded Values Using Equation (2)
Run H T P (°C) H T M (min) P H T (mm) H T P (°C) H T M (min) P H T (mm)
1403080−1−10
26030801−10
3406080−110
4606080110
5404560−10−1
660456010−1
74045100−101
86045100101
95030600−1−1
1050606001−1
1150301000−11
125060100011
13 *504580000
14 *504580000
15 *504580000
16 *504580000
17 *504580000
* Repetitions at the centre points of factor levels; H T P : Heating temperature; H T M : Heating time and P H T : Initial pressing height of the sample.
Table 2. Determined amounts of oil output parameters and deformation energy of bulk hemp seed samples from the Box–Behnken Design (BBD).
RunInput Processing FactorsCalculated Oil Output and Energy Parameters
H T P (°C) H T M (min) P H T (mm) M O L (g) O Y D (%) O E E (%) E N G (J)
140308020.5315.9448.55850.21
260308026.4620.5562.57934.74
340608025.2619.6259.73829.49
460608027.7221.5365.55972.28
540456020.8721.1564.40811.15
660456021.822.0967.27818.03
7404510031.8819.6259.741143.53
8604510034.7521.3965.121179.6
950306020.9621.2464.68778.24
1050606021.3721.6665.94722.55
11503010032.2619.8560.451051.14
12506010031.2519.2358.561092.21
13 *50458025.3319.6759.901009.82
14 *50458025.1519.5359.47876.28
15 *50458026.8920.8863.59909.25
16 *50458024.7319.2058.48886.91
17 *50458028.9222.4668.39886.46
Mean26.2020.3561.97913.74
SD1.721.344.0855.04
%CV6.586.596.586.02
* Repetitions at the centre points of factor levels: H T P : Heating temperature; H T M : Heating time; P H T : Initial pressing height of sample; M O L : Mass of oil extracted; O Y D : Percentage oil yield; O E E : Percentage oil expression efficiency, E N G : Deformation energy and SD: Standard Deviation and CV: Coefficient of Variation.
Table 3. Determined mechanical properties of bulk hemp seeds from the BBD.
RunInput Processing Factors Calculated Mechanical Parameters
H T P
(°C)
H T M
(min)
P H T
(mm)
F R C
(kN)
D F X
(mm)
H D N
(kN/mm)
ϵ S T
(-)
σ S S
(MPa)
S M E L
(MPa)
1403080223.5250.494.430.6379.05125.26
2603080250.1750.574.950.6388.48139.97
3406080222.7250.834.380.6478.77123.98
4606080257.7749.465.210.6291.17147.46
5404560251.1138.366.550.6488.81138.92
6604560273.3438.577.090.6496.68150.39
74045100239.1664.283.720.6484.59131.59
86045100266.9363.664.190.6494.41148.30
9503060262.2238.026.900.6392.74146.35
10506060241.1637.556.420.6385.29136.29
115030100230.8363.33.650.6381.64128.97
125060100241.2362.713.850.6385.32136.05
13 *504580246.6251.814.760.6587.22134.68
14 *504580237.3750.434.710.6383.95133.18
15 *504580249.4949.175.070.6188.24143.57
16 *504580250.1845.435.510.5788.48155.81
17 *504580248.0049.874.970.6287.71140.70
Mean246.3349.345.000.6287.12141.59
SD5.202.390.320.031.849.02
%CV2.114.856.384.822.116.37
* Repetitions at the centre points of factor levels: H T P : Heating temperature; H T M : Heating time; P H T : Initial pressing height of sample; F R C : Compression force; D F X : Deformation; H D N : Hardness; ε S T : Strain; σ S S : Compressive stress; S M E L : Secant modulus of elasticity; SD: Standard Deviation; and CV: Coefficient of Variation.
Table 4. ANOVA results for the M O L g parameter at a 0.05 significance level.
EffectModel a
Coefficients
Standard
Error
t-ValueSum of
Squares

df
Mean SquareF-Valuep-Value
Intercept26.200.7733.89292.5932.5010.870.00 *
H T P (L)1.520.612.4918.57118.576.250.04 *
H T P 2 (Q)−0.170.84−0.210.1310.130.040.84 ns
H T M (L)0.670.611.103.6313.631.220.31 ns
H T M 2 (Q)−1.040.84−1.234.5414.541.530.26 ns
P H T (L)5.640.619.23254.701254.7085.650.00 *
P H T 2 (Q)1.290.841.547.0517.052.370.17 ns
H T P · H T M −0.870.86−1.003.0113.011.010.35 ns
H T P · P H T 0.490.860.560.9410.940.320.59 ns
H T M · P H T −0.360.86−0.410.5010.500.170.69 ns
Residual 20.9272.99
Lack of Fit 9.0333.011.010.47 ns
Pure Error 11.8942.97
Total 313.4216
H T P : Heating temperature; H T M : Heating time; P H T : Initial pressing height of sample; L: Linear term; Q: Quadratic term; a: Coefficient of determination (R2) = 0.93 for mass of oil, M O L g ; *: p-value < 0.05 or higher F-value means significant and ns: p-value > 0.05 or lower F-value means non-significant.
Table 5. ANOVA results for the O Y D % parameter at a 0.05 significance level.
EffectModel a
Coefficients
Standard
Error
t-ValueSum of
Squares

df
Mean SquareF-Valuep-Value
Intercept20.350.5934.4025.692.841.620.00 *
H T P (L)1.150.472.4710.64110.645.930.04 *
H T P 2 (Q)−0.190.64−0.290.1510.150.080.78 ns
H T M (L)0.560.471.192.4712.471.380.27 ns
H T M 2 (Q)−0.750.64−1.172.3912.391.330.28 ns
P H T (L)−0.760.47−1.624.5714.572.550.15 ns
P H T 2 (Q)0.900.641.403.4113.411.900.21 ns
H T P · H T M −0.670.66−1.021.8211.821.010.34 ns
H T P · P H T 0.210.660.310.1710.170.090.76 ns
H T M · P H T −0.260.66−0.390.2710.270.150.71 ns
Residual 12.2471.75
Lack of Fit 5.0731.690.940.49 ns
Pure Error 7.1741.79
Total 37.8216
H T P : Heating temperature; H T M : Heating time; P H T : Initial pressing height of sample; L: Linear term; Q: Quadratic term; a: Coefficient of determination (R2) = 0.68 for oil yield, O Y D % ; *: p-value < 0.05 or higher F-value means significant and ns: p-value > 0.05 or lower F-value means non-significant.
Table 6. ANOVA results for the O E F % parameter at a 0.05 significance level.
EffectModel a
Coefficients
Standard
Error
t-ValueSum of
Squares

df
Mean SquareF-Valuep-Value
Intercept61.961.8034.40237.2926.351.620.00 *
H T P (L)3.511.422.4798.62198.625.930.04 *
H T P 2 (Q)−0.571.96−0.291.3711.370.080.78 ns
H T M (L)1.691.421.1922.91122.911.380.27 ns
H T M 2 (Q)−2.291.96−1.1722.17122.171.330.28 ns
P H T (L)−2.301.42−1.6242.37142.372.550.15 ns
P H T 2 (Q)2.741.961.4031.59131.591.900.21 ns
H T P · H T M −2.052.01−1.0216.83116.831.010.34 ns
H T P · P H T 0.632.010.311.5711.570.090.76 ns
H T M · P H T −0.792.01−0.392.4912.490.150.71 ns
Residual 113.54716.22
Lack of Fit 47.02315.670.940.49 ns
Pure Error 66.51416.63
Total 350.6916
H T P : Heating temperature; H T M : Heating time; P H T : Initial pressing height of sample; L: Linear term; Q: Quadratic term; a: Coefficient of determination (R2) = 0.68 for oil expression efficiency, O E F % ; *: p-value < 0.05 or higher F-value means significant and ns: p-value > 0.05 or lower F-value means non-significant.
Table 7. ANOVA results for E N G J parameter at a 0.05 significance level.
EffectModel a
Coefficients
Standard
Error
t-ValueSum of
Squares

df
Mean SquareF-Valuep-Value
Intercept913.7620.2045.25252,777928,086.3313.770.00 *
H T P (L)24.9415.971.564977149771.640.16 ns
H T P 2 (Q)38.8222.011.766345.416345.42.090.12 ns
H T M (L)−8.5715.97−0.5458715870.190.61 ns
H T M 2 (Q)−38.2222.01−1.746151.216151.22.030.13 ns
P H T (L)167.0615.9710.46223,282.41223,282.473.580.00 *
P H T 2 (Q)35.4922.011.615304.215304.21.750.15 ns
H T P · H T M 32.2522.581.434159.614159.61.370.20 ns
H T P · P H T 7.3022.580.3221312130.070.76 ns
H T M · P H T 24.1922.581.072340.612340.60.770.32 ns
Residual 14,275.3872039.34
Lack of Fit 2137.33712.40.230.87 ns
Pure Error 12,13843034.5
Total 267,052.416
H T P : Heating temperature; H T M : Heating time; P H T : Initial pressing height of sample; L: Linear term; Q: Quadratic term; a: Coefficient of determination (R2) = 0.95 for deformation energy, E N G J ; *: p-value < 0.05 or higher F-value means significant and ns: p-value > 0.05 or lower F-value means non-significant.
Table 8. Prediction comparison between the full quadratic model and the reduced model.
Model ResponsesFull Quadratic Model (Equations (14), (16), (18) and (20))Reduced Model
(Equations (15), (17), (19) and (21))
Absolute DifferenceRelative Difference (%)
M O L g 34.9833.361.624.62
O Y D % 22.6521.501.155.06
O E E % 68.9665.473.495.06
E N G J 1197.001080.82116.189.71
M O L : Mass of oil; O Y D : Oil yield; O E E : Oil expression efficiency; and E N G : Deformation energy.
Table 9. Observed, predicted, residuals, and absolute percentage error values of mass of oil and oil yield.
Runs Mass   of   Oil ,   M O L   g Oil   Yield ,   O Y D   %
ObservedPredictedResiduals% ErrorObservedPredictedResiduals% Error
120.5321.93−1.406.3715.9417.03−1.086.36
226.4626.71−0.250.9420.5520.68−0.130.64
325.2625.010.251.0019.6219.480.130.67
427.7226.321.405.3121.5320.441.085.30
520.8720.640.231.1021.1520.870.281.34
621.8022.72−0.924.0522.0922.76−0.672.96
731.8830.960.922.9819.6218.950.673.55
834.7534.98−0.230.6521.3921.66−0.281.29
920.9619.791.175.9221.2420.440.803.94
1021.3721.85−0.482.1821.6622.07−0.411.86
1132.2631.780.481.5019.8519.440.412.11
1231.2532.42−1.173.6119.2320.04−0.804.01
* 1325.3326.20−0.873.3419.6720.35−0.683.34
* 1425.1526.20−1.054.0219.5320.35−0.824.02
* 1526.8926.200.692.6220.8820.350.532.62
* 1624.7326.20−1.475.6319.2020.35−1.145.63
* 1728.9226.202.7210.3622.4620.352.1110.36
* Repetitions at the centre points of factor levels.
Table 10. Observed, predicted, residuals, and absolute percentage error values of oil expression efficiency and deformation energy.
Runs Oil   Expression   Efficiency ,   O E E   % Experimental   Deformation   Energy ,   E N G   J
ObservedPredictedResiduals% ErrorObservedPredictedResiduals% Error
148.5551.85−3.306.36920.94930.23−9.291.00
262.5762.97−0.400.64934.74915.6219.122.09
359.7359.330.400.67829.49848.61−19.122.25
465.5562.253.305.30972.28962.999.290.97
564.4063.550.851.34811.15803.377.780.97
667.2769.32−2.052.96818.03838.66−20.632.46
759.7457.692.053.551143.531122.9020.631.84
865.1265.97−0.851.291179.601187.38−7.780.66
964.6862.232.453.94778.24776.731.510.19
1065.9467.19−1.251.86722.55711.2211.331.59
1160.4559.211.252.111051.141062.48−11.341.07
1258.5661.01−2.454.011092.211093.72−1.510.14
* 1359.9061.96−2.073.341009.92913.7696.1610.52
* 1459.4761.96−2.494.02876.28913.76−37.484.10
* 1563.5961.961.622.62909.25913.76−4.510.49
* 1658.4861.96−3.495.63886.91913.76−26.852.94
* 1768.3961.966.4210.36886.46913.76−27.302.99
* Repetitions at the centre points of factor levels.
Table 11. Determined coefficients of the tangent curve model and statistical metrics for describing the force–deformation curve of bulk hemp seeds against the input processing factors of the BBD.
Run X (mm) A D (kN) B D (mm −1)n (-)F-ValueF-Criticalp-ValueR2
150.492.7590.02921.3413.8510.2470.993
250.573.0940.02920.8823.8510.3480.995
350.832.6870.02920.9463.8510.3310.995
449.463.4770.02920.6953.8510.4050.996
538.364.2600.03820.1843.8510.6680.989
638.574.0000.03820.3273.8510.3680.996
764.282.8950.02320.6303.8510.4280.991
863.662.9230.02320.9133.8510.3400.995
938.023.8090.03820.4583.8510.4990.995
1037.553.7260.03920.6333.8510.4270.996
1163.302.5040.02321.2023.8510.2730.993
1262.712.8670.02321.1013.8510.2940.995
* 1351.813.4870.02820.5323.8510.4660.993
* 1450.432.9130.02920.9633.8510.3270.995
* 1549.173.1660.03020.8723.8510.3510.996
* 1645.433.7240.03220.4073.8510.5240.996
* 1749.872.8990.02920.8353.8510.3610.995
* Repetitions at the centre points of factor levels: X is the experimental deformation, D F X (mm), A D is the force coefficient of mechanical behaviour (kN), B D is the deformation coefficient of mechanical behaviour (mm−1), n is the model’s fitting exponent (-), F-value < F-critical or p-value > 0.05 means significant, and R2 is the coefficient of determination of the tangent model.
Table 12. Determined amounts of experimental and theoretical energy of bulk hemp seeds against the input processing factors of the BBD.
RunInput Processing FactorsExperimental and Theoretical Deformation Energy
H T P (°C) H T M (min) P H T (mm) E N G (J) T E N G (J)Error (%)
1403080850.18749.9111.79
2603080934.71863.077.66
3406080829.50818.341.35
4606080972.37701.2127.89
5404560811.21823.421.50
6604560818.06843.243.08
740451001141.2811702.52
860451001179.66100115.14
9503060778.22646.2716.69
10506060722.49749.914.51
1150301001051.16784.8725.33
1250601001095.25785.1828.31
* 135045801009.84851.1415.72
* 14504580876.21776.74211.35
* 15504580909.29943.753.79
* 16504580886.90820.627.47
* 17504580886.16653.7826.22
Mean913.68809.2112.91
SD55.10106.308.66
%CV6.0313.1467.11
* Repetitions at the centre points of factor levels: H T P : Heating temperature; H T M : Heating time; P H T : Initial pressing height of sample; E N G : Experimental deformation energy; T E N G : Theoretical deformation energy; SD: Standard Deviation; and CV: Coefficient of Variation.
Table 13. Validated tests of the optimal input processing factors and corresponding calculated output parameters of bulk hemp seeds.
TestsOptimal Input Processing Factors Calculated Oil Output and Energy Parameters
H T P (°C) H T M (min) P H T (mm) M O L (g) O Y D (%) O E E (%) E N G (J)
160536022.5022.8069.43869.75
260536022.4722.7769.34864.03
360536022.0422.3368.01854.85
Mean22.3422.6468.93862.88
SD0.260.260.797.52
% CV1.151.151.150.87
1606010035.0121.5565.611223.26
2606010034.0020.9263.721267.03
3606010033.9620.9063.641250.81
Mean34.3221.1264.321247.03
SD0.600.371.1222.13
% CV1.731.731.731.77
H T P : Heating temperature; H T M : Heating time; P H T : Initial pressing height of sample; M O L : Mass of oil extracted; O Y D : Percentage oil yield; O E E : Percentage oil expression efficiency; E N G : Deformation energy; SD: Standard Deviation; and CV: Coefficient of Variation.
Table 14. Validated tests of the optimal input processing factors and corresponding calculated mechanical properties of bulk hemp seeds.
TestsOptimal Input Processing Factors Calculated Mechanical Parameters
H T P
(°C)
H T M
(min)
P H T
(mm)
F R C
(kN)
D F X
(mm)
H D N
(kN/mm)
ϵ S T
(-)
σ S S
(MPa)
S M E L
(MPa)
1605360279.7837.757.410.6398.95157.28
2605360279.3637.767.400.6398.80157.00
3605360275.1137.957.250.6397.30153.83
Mean278.0837.827.350.6398.35156.04
SD2.580.110.090.000.911.91
% CV0.930.301.220.300.931.22
16060100255.9163.724.020.6490.51142.04
26060100278.8862.704.450.6398.63157.31
36060100273.3562.024.410.6296.68155.88
Mean269.3862.814.290.6395.27151.74
SD11.990.860.240.014.248.43
% CV4.451.365.561.364.455.56
H T P : Heating temperature; H T M : Heating time; P H T : Initial pressing height of sample; F R C : Compression force; D F X : Deformation; H D N : Hardness; ε S T : Strain; σ S S : Compressive stress; S M E L : Secant modulus of elasticity; SD: Standard Deviation; and CV: Coefficient of Variation.
Disclaimer/Publisher’s Note: The statements, opinions and data contained in all publications are solely those of the individual author(s) and contributor(s) and not of MDPI and/or the editor(s). MDPI and/or the editor(s) disclaim responsibility for any injury to people or property resulting from any ideas, methods, instructions or products referred to in the content.