Article

Process Optimization of Thermal Stability for Hemp Seed Milk Produced from Whole Fat and Fat-Reduced Seeds

Food Engineering Department, Engineering Faculty, Ondokuz Mayıs University, Samsun 55139, Türkiye
*
Author to whom correspondence should be addressed.
Processes 2026, 14(5), 783; https://doi.org/10.3390/pr14050783
Submission received: 29 January 2026 / Revised: 20 February 2026 / Accepted: 23 February 2026 / Published: 27 February 2026
(This article belongs to the Special Issue Green Technologies for Food Processing)

Abstract

Hemp seed milk is a promising plant-based alternative to dairy due to its rich nutritional profile and environmental sustainability. However, challenges related to thermal instability and phase separation hinder its commercial viability. This study aimed to improve the formulation and processing of hemp seed milks derived from de-hulled full-fat and fat-reduced seeds, with a focus on thermal stability under pasteurization conditions. To increase stability and decrease phase separation, Response Surface Methodology (RSM) was applied to systematically modify four important processing parameters: seed ratio, ultrasound time, pH value, and mixing time. The physicochemical characteristics of the optimized milks, including their viscosity, creaming index, ζ-potential, and particle size distribution, were described. The emulsion stability and heat-induced aggregation behavior of full-fat and fat-reduced formulations differed significantly. The optimized full-fat hemp seed milk was produced using a seed concentration of 5.23%, a mixing time of 5 min, a sonication duration of 10 min, and an adjusted pH of 8.26, while the optimized hemp seed milk from fat-reduced seeds was prepared using an 11.1% seed-to-water ratio, a mixing time of 10 min, a 10 min ultrasound treatment, and an adjusted pH of 8.5. These parameter sets represent the samples obtained after the RSM optimization process and were used as the optimized formulations for further characterization. The findings showed that the desirability values of normal fat and fat-reduced hemp milk were 76% and 83%, respectively. These findings provide valuable insights into the development of stable, scalable hemp seed milk systems and highlight the critical role of seed composition in determining functional stability.

1. Introduction

Growing concerns about environmental sustainability, ethical issues, and the desire for improved quality of life are driving the global trend toward plant-based diets. With a variety of formulations derived from grains, legumes, nuts, seeds, and pseudo-cereals, plant-based milk alternatives (PBMAs) have become a dynamic category within this trend [1].
Hemp seed milk is an oil-in-water (O/W) emulsion system, similar to other extracts derived from vegetable seeds (almond, soybean, etc.). It behaves unsteadily and has a tendency to cream, agglomerate, and coalesce when heated and stored. The literature indicates that when heat treatment is applied at 80 °C, the proteins in hemp seeds aggregate due to their poor heat stability [2]. The low functional qualities of the hemp seed proteins have been linked to the development of covalent disulfide bonds between proteins and their subsequent aggregation at neutral or acidic pH levels as a result of the large amount of free sulfhydryl from sulfur-containing amino acids. In general, the dominance of molecular aggregation and attractive forces is linked to the poor solubility of plant proteins in acidic media, which restricts their capacity to form emulsions in an acidic medium and their application in food systems [3]. According to research, heating alters the molecular structure of proteins by exposing hydrophobic groups, opening the native tertiary structure, and causing denatured molecules to aggregate. This occurs because high temperatures cause denaturation, which leads to a development of large insoluble protein aggregates [4]. Thermal processing may also weaken the oil-droplet interface, change lipid–protein interactions, and increase droplet flocculation and coalescence, all of which contribute to creaming and phase separation in full-fat emulsions. These processes are in addition to protein denaturation and aggregation, which decrease protein solubility and encourage the formation of insoluble protein networks [2].
As a result, a variety of techniques, including stabilizers and emulsifiers, have been used to improve the stability of hemp seed milk. However, for financial and health reasons, this approach is not advised. For instance, a number of studies have suggested that prolonged use of artificial emulsifiers may lead to chronic inflammatory conditions associated with metabolic syndrome and obesity. Consequently, there is a growing need for affordable alternative technologies and additive-free food products [2]. Wang, Q. et al., in their published study, examined the application of high-pressure homogenization (HPH) and pH-shift techniques to produce hemp seed milk without additives, paying particular attention to the product’s oxidative and physical stability [5]. Jiang et al. investigated a pH-shift approach to improve interfacial properties of plant seed proteins in general, without optimizing a complete milk formulation [6]. In contrast, the present work applies Response Surface Methodology to simultaneously optimize the production of thermally stable hemp seed milk produced from both full-fat and fat-reduced de-hulled seeds.
Additionally, ultrasonication is a promising method for boosting the stability of plant-based milk. Applying high-power ultrasonication to a particular product can result in cavitation, where cavitation is a phenomenon in which tiny gas or vapor bubbles form inside the sample as a result of high-power sound waves propagation. This method produces extremely high pressures and temperatures. These harsh conditions may cause enzymes to become inactive, altering the secondary structure of proteins and thereby changing their functional properties and nutritional value [2,7]. However, there are two types of ultrasound: low-intensity ultrasound, which has a frequency of five to ten MHz and a power intensity of less than one wcm-2, and high-intensity ultrasound, which has a frequency of twenty to one hundred kHz and a power intensity of ten to one hundred wcm-2. The latter type is utilized in technologies related to food processing [8]. Furthermore, hemp seed protein is poorly solubilized at neutral and acidic pH, which prevents its use as a functional food ingredient [9]. The protein solubility of the albumin fraction ranges from 57% at pH 3.0 to 84% at pH 8.0. The low solubility of hemp protein below pH 7.0 has been attributed to the aggregation tendency of edestin, one of the main proteins found in the ingredients. However, at a pH higher than 8.0, protein solubility can increase from 65% to 90%, indicating that hemp protein is a kind of alkali-soluble protein. The mechanism underlying the solubility at alkaline pH may be related to the decomposition of edestin [2]. Therefore, it was demonstrated that adjustments in pH extraction parameters could increase yield and optimize functionality [10].
Different processing techniques, including de-hulling [11], salt extraction [9], and combined ultrasonication and pH change [12], have been investigated to improve hemp seed protein functionality. The application of various methods to increase the heat stability of hemp seed extract (milk), however, has not been the subject of much published scientific research. Accordingly, this study aims to optimize the production of thermally stable hemp seed milk from both de-hulled full-fat and de-hulled fat-reduced hemp seeds. Through systematic formulation and processing assessments, this work seeks to provide insights into the influence of seed composition on milk stability and to support the development of robust, scalable plant-based dairy alternatives.

2. Materials and Methods

2.1. Raw Materials

The hemp seeds used in the present study were de-hulled hemp seeds of Lithuanian origin supplied by Naturiga Gıda San. Tic. Ltd. Şti. (Istanbul, Türkiye). The oil in the seeds was extracted (≈69% of the original oil) by a cold pressing device (Karaerler Makine, Ankara, Türkiye) in the Hemp Research Institute at Ondokuz Mayıs University (Samsun, Türkiye), and the resulting press cake was used as the fat-reduced raw material. For the full-fat hemp seeds, the nutritional composition declared on the package was, per 100 g: protein 33 g, fat 48 g, carbohydrate 4.6 g, and energy 613 kcal. For the fat-reduced seeds: protein 55 g, fat 15 g, per 100 g.

2.2. Methods

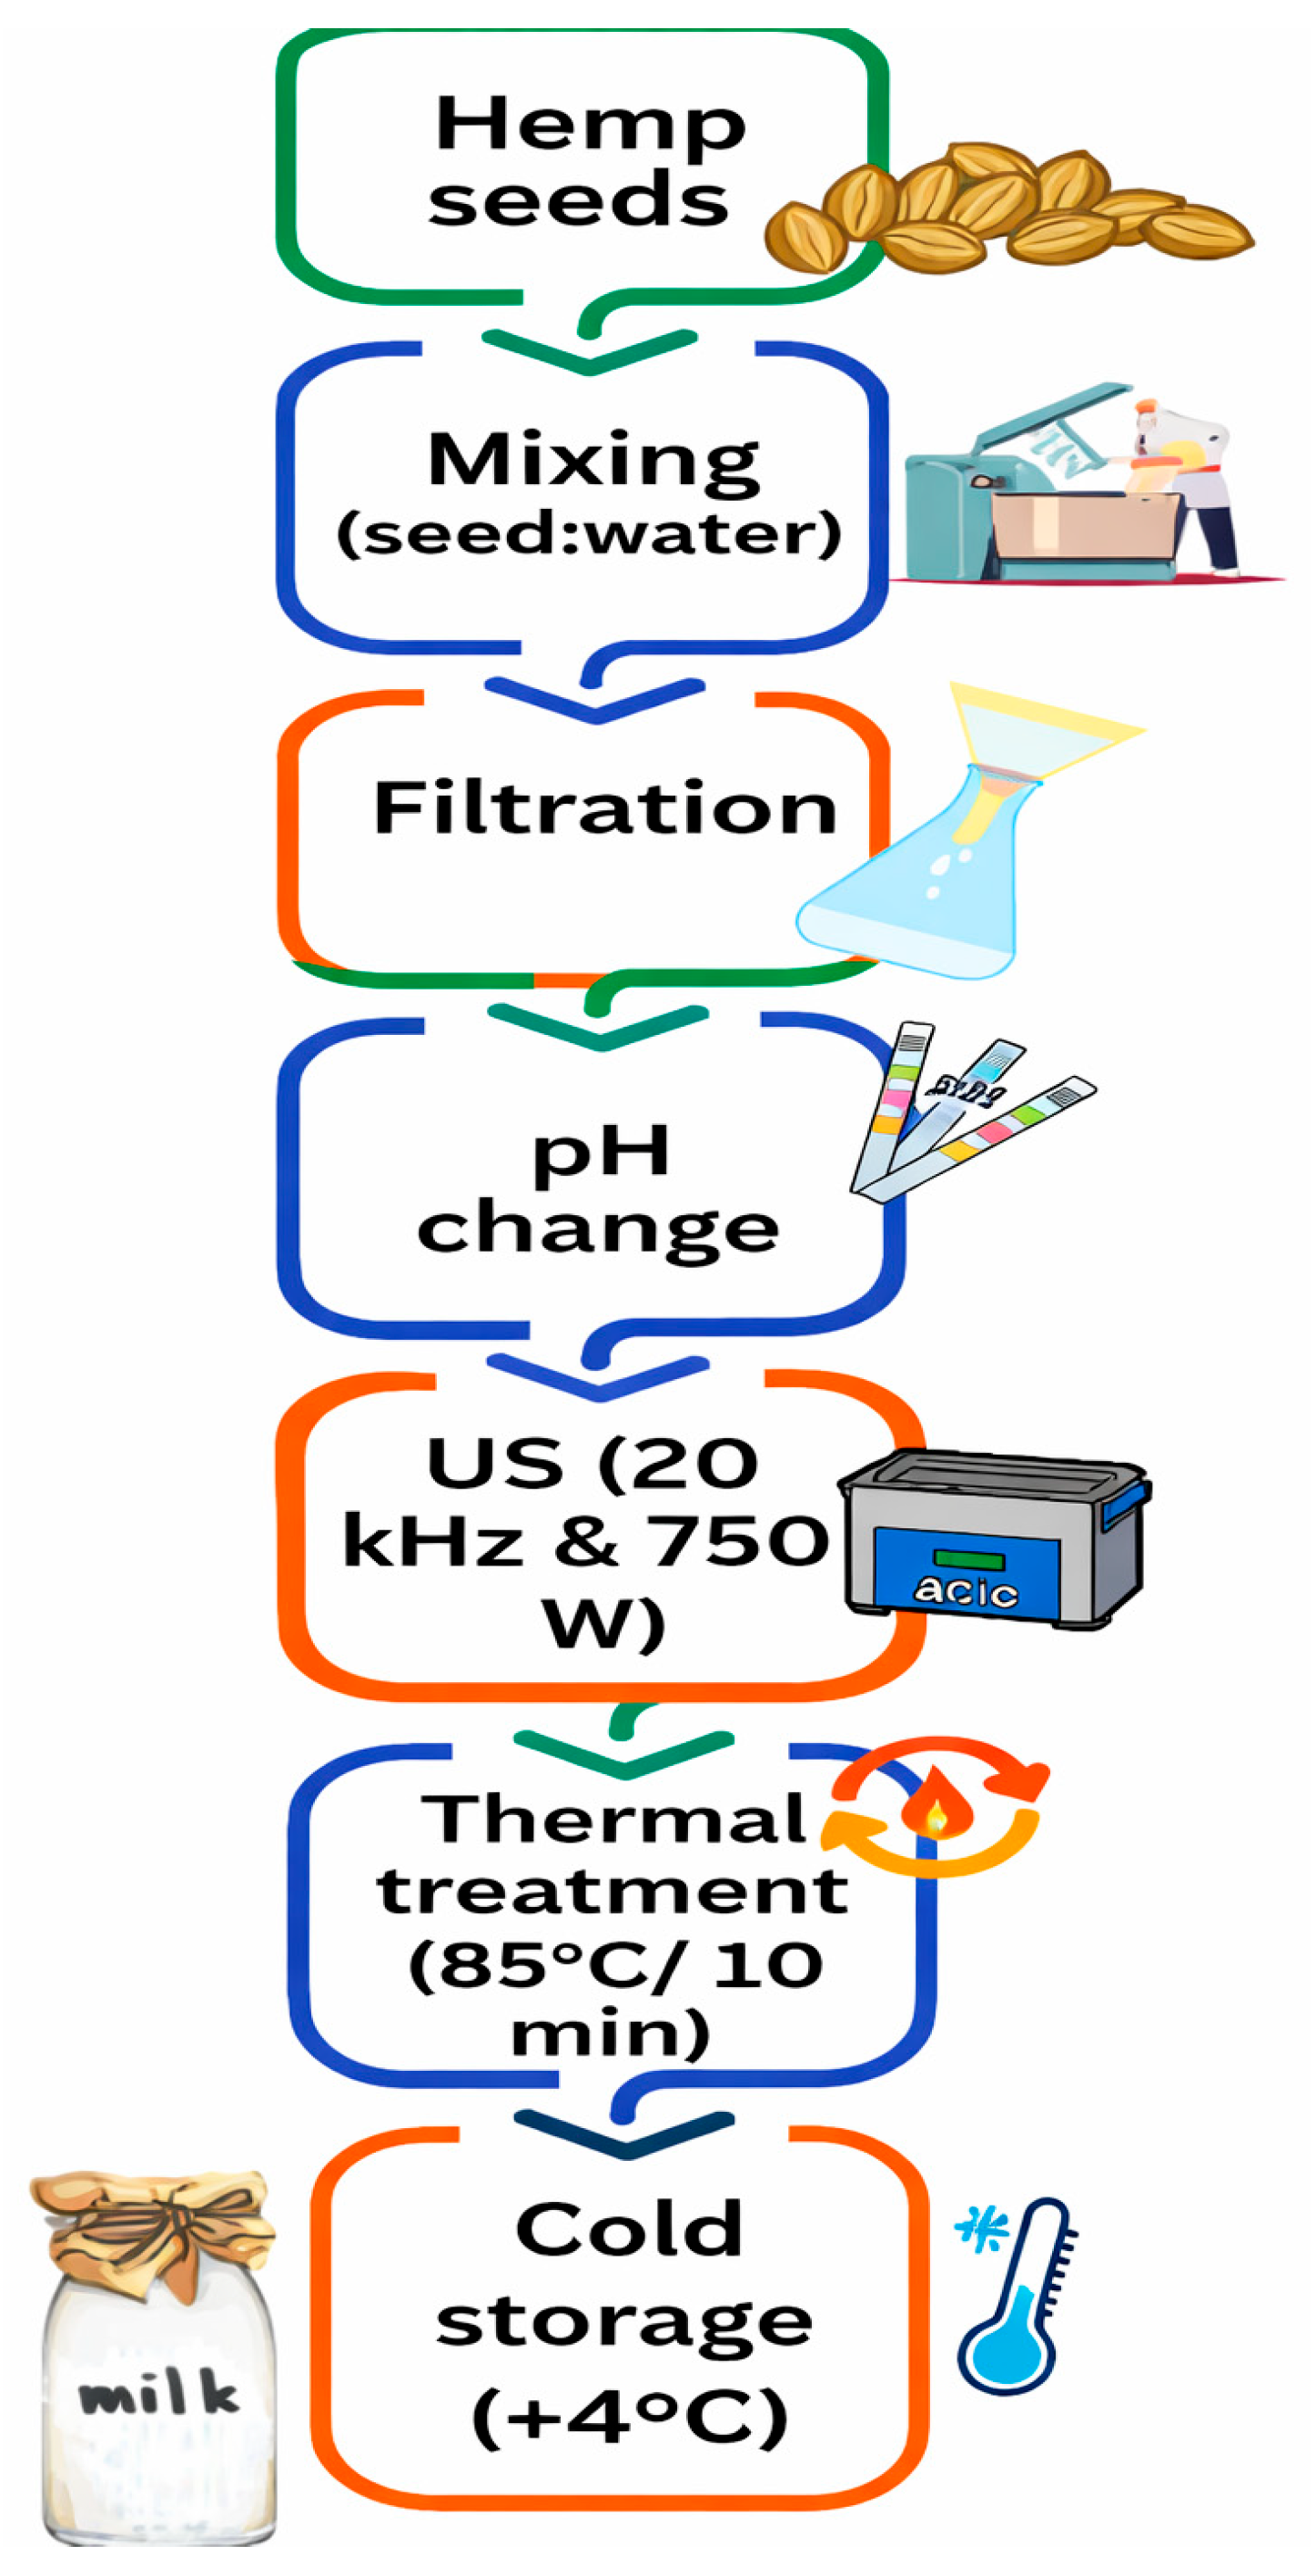
2.2.1. Preparation of Hemp Seed Milk

Within the scope of the analyses, de-hulled hemp seeds and oil-reduced de-hulled hemp seed kernels were prepared according to the seed/water ratio factor determined according to the experimental design. In this context, the mixtures mixed with water at room temperature were homogenized by means of Ultraturrax (IKA-Werke GmbH & Co. KG, Staufen, Germany) at a speed of 10.000 rpm; this was used only as a standard pre-dispersion step. Then, it was filtered using four-layer cheesecloth. The resulting mixture was adjusted to the pH values determined in the model pattern. For the samples to be subjected to ultrasound (US), the process was applied using a VibraCell VC750 ultrasound processor (Sonics & Materials, Inc., Newtown, CT, USA) at 20 kHz and 750 W (ultrasound was the controlled homogenization variable studied in the RSM design). Sonication energy was transferred to hemp seed extract using a 13 mm diameter probe (Sonics & materials Inc., Newtown, CT, USA). The sonication pulse duty cycle was set to 10 s on, 1 s off. An ice bath was used to prevent overheating from ultrasound that could cause protein denaturation [12]. After the prepared mixtures were passed through a three-layer cloth filter, the filtered samples were closed in bottles. The samples were then pasteurized in a water bath at 85 °C for 10 min. The samples were kept in storage at +4 °C for analysis [13]. The general production flow chart for hemp seed extract is shown in Figure 1.

2.2.2. Optimization of Hemp Seed Milk Production with Experimental Design

According to the Response Surface Methodology (RSM), the independent variables seed ratio (%) (A), ultrasonic homogenization time (B), pH value (C) and mixing time (D), were used to investigate the effects on the responses, such as total soluble solids (Brix), sedimentation index, brightness value (L*), dry matter (%) and ash amount (%), protein content (%), viscosity (mPa.s), particle size and ζ-potential measurements, of hemp seed milk. Four independent variables were determined as a seed ratio between 1 and 15%, ultrasound duration between 0 and 10 min, pH value between 7.5 and 9.5, and mixing time between 1 and 10 min, as shown in Table 1. Thus, 29 trials were created, including the minimum and maximum regions in the design, as summarized in Table 2. The model in question was applied to full-fat and fat-reduced de-hulled hemp seeds.

2.2.3. Physicochemical Analyses

Determination of Dry Matter
The samples were weighed to a specific amount in porcelain crucibles and dried in an oven (Nüve EV-018, Ankara, Türkiye) at 103 ± 2 °C until they reached a constant weight [14].
Determination of Ash Content
For ash determination, ICC standard method number 104/1 was used [15]. Crucibles were weighed on a precision balance. The furnace temperature was gradually increased and burned at 500 °C until it turned white [14].
Protein Content
The protein content of the samples was analyzed using the Kjeldahl method. Five grams of sample was weighed into a Kjeldahl digestion tube and 13 mL of sulfuric acid was added to the tube. Two tablets of Kjedahl catalyst were also added to the tubes. The tubes were then placed in the Kjeldahl digestion heater until the solution turned light blue-green or yellowish green and continued to boil for another 30 min. The tubes were cooled and placed in the automatic distillation system. The distillate was taken into a volumetric flask containing 25 mL of boric acid and 1~2 drops of mixed indicator solution (Methyl Red Methylene Blue). The distillate was titrated with 0.1 NHCl. The protein content was calculated as follows:
%   N i t r o g e n = ( ( H C l   s p e n t   i n   s a m p l e     H C l   s p e n t   i n   b l a n k )   ×   0.1   ×   0.014 ) / ( s a m p l e   a m o u n t ( g ) )   ×   100
%   P r o t e i n = %   N i t r o g e n   ×   6.25
Color Analysis
The color of the samples was determined with a digital colorimeter (Model CR-400, Minolta-Konica, Japan) and the results were expressed as L* (brightness−darkness), a* (redness−greenness) and b* (yellowness−blueness).
Determination of Total Soluble Solids (TSS)
Two to three drops of the sample were placed into the prism of the digital Abbe refractometer (Model DTM-1, ATAGO, Tokyo, Japan). A digital reading and the percentage of the Brix value were recorded.
Viscosity Measurement
Rheological characterization of the samples was carried out using a Haake Mars III rheometer (Thermo Scientific, Karlsruh, Germany) with a cone and plate system (35 mm diameter, 0.105 mm gap, 2 angles). The temperature was kept constant at 25 °C with a Peltier plate system. Steady-state shear tests were measured by shearing the samples for 120 s at linearly increasing shear rates between 1 and 100 s−1. The measurements were made in 3 replicates for each sample and the average was taken. The results are given in mPas.
Determination of Particle Size
The Malvern Mastersizer 3000 (Malvern Instruments Ltd., Worcestershire, UK) was used to determine the particle size and size distribution of the samples. Particle size measurement was repeated 3 times for each sample. The measurement results were used as d50, which is the diameter of the particles at 50% of the cumulative volume [16].
Solid Particle Sedimentation (SPS) Determination
Solid particle sedimentation was carried out according to the method described by Gul et al. [17]. Each sample was centrifuged at 2500× g for 20 min using 10 mL of solution. The amount of solid matter accumulated at the bottom of the tube is given as percent (w/w) [17].
Measurement of ζ-Potential
The determined distribution stability and zeta potential measurements of the milk particles were carried out using Nano ZSP (Malvern Panalytical, Malvern, UK). After the particles were dispersed in ultrapure water and placed in capillary cells, an average of 3 measurements were carried out for each sample at 25 °C [18].
Statistical Analysis
The analyses were performed in three replications; the mean values and standard deviations of the obtained data were derived using the Design Expert Program (13.0, Stat-Ease Inc., Minneapolis, MN, USA) and ANOVA evaluation was applied for optimization.

3. Results and Discussion

3.1. Modeling Results

Box–Behnken design is a statistical, theoretical and mathematical technique for creating models to optimize the level of independent variables [19]. The results of 29 randomly applied treatments of the full-fat hemp seed samples are summarized in Table 3, and the pictures of the samples are shown in Figure 2. Likewise, the results of 29 randomly applied treatments of the fat-reduced samples are summarized in Table 4 and their pictures are shown in Figure 3.

3.2. Modeling Results of Hemp Seed Milk

Table 3 and Table 4 present the impacts of independent factors on correlated variables, which include the total soluble solids (Brix), sedimentation index (SPS), brightness value (L*), dry matter (%) and ash content (%), protein content (%), viscosity (mPa.s), particle size (nm) and ζ-potential (mV). The statistical data of the production parameters of both full-fat and fat-reduced hemp seed milk groups are represented in Table 5 and Table 6. However, significant and non-significant results are displayed in Table 7 and Table 8 for both full-fat and fat-reduced samples, respectively.

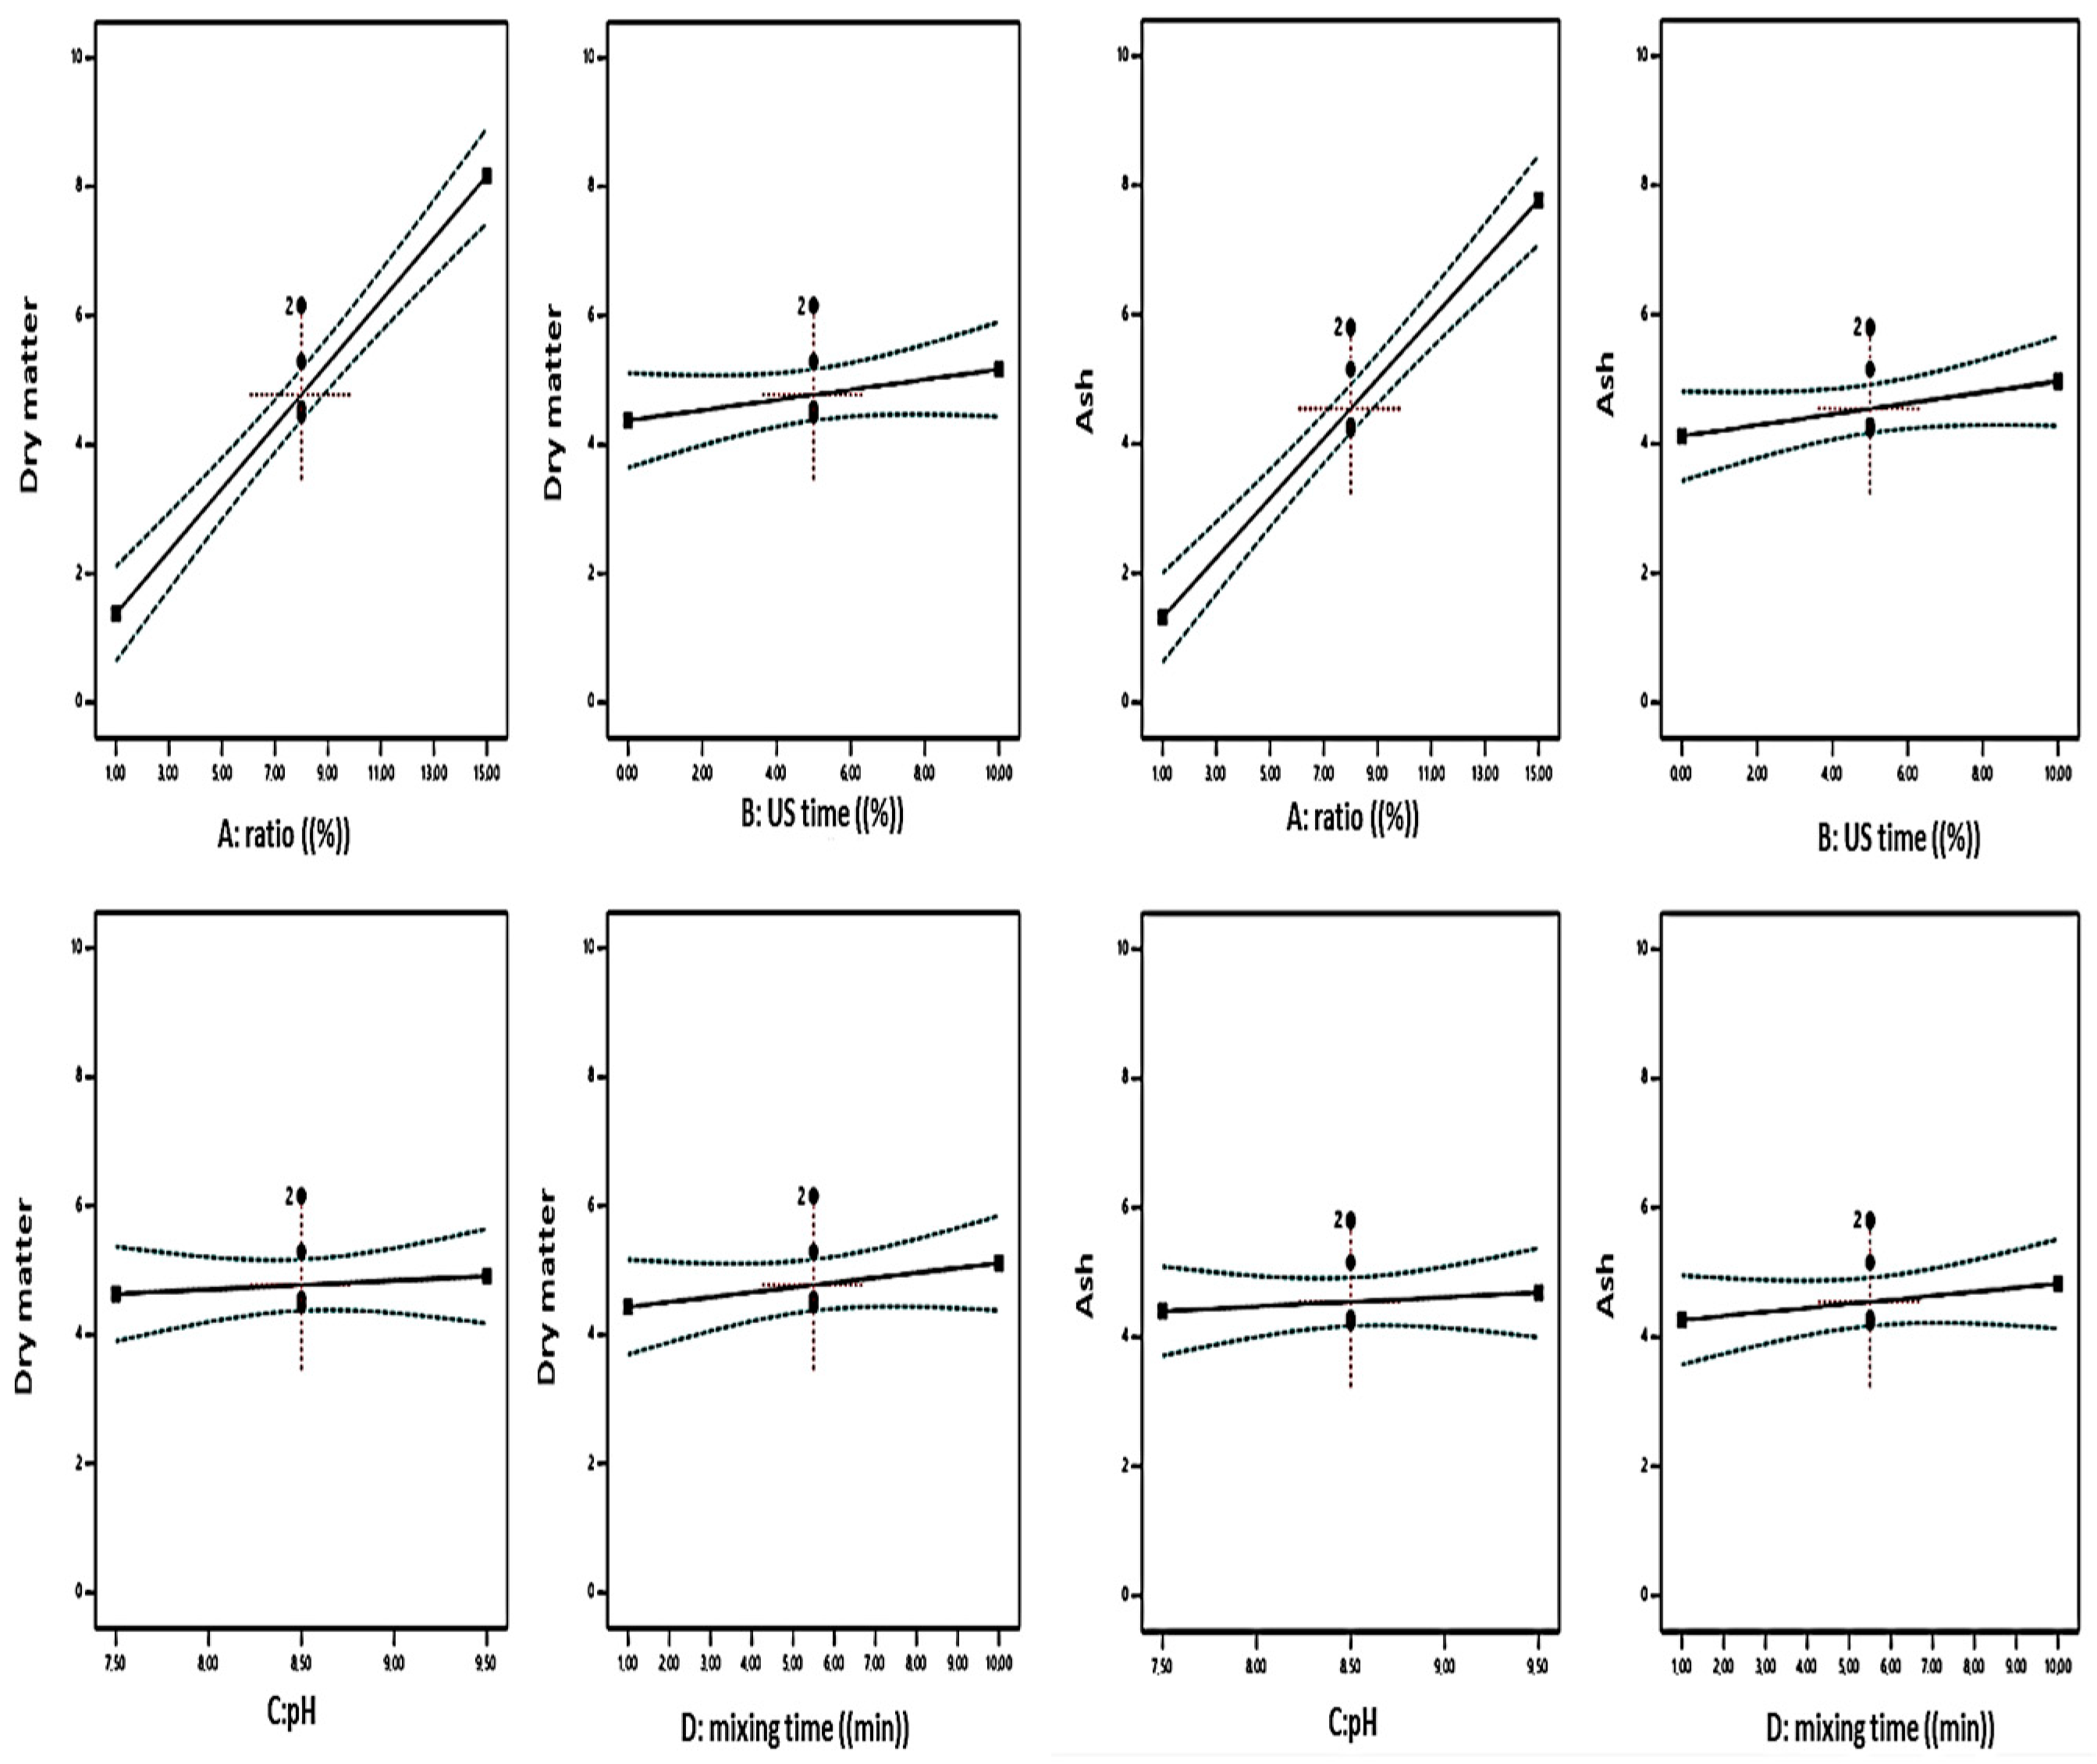
3.3. Dry Matter Content

According to the literature, the dry matter composition of plant-based milk samples ranges from 25.24 g kg−1 (almond milk) to 133.67 g kg−1 (rice milk) [20]. Rice milk has the highest average dry matter values among plant-based beverages, followed by oat, soy, cashew and coconut beverages (Walther et al., 2022 [20]). Dry matter content is an indicator of different parameters, including the quality and shelf life of the final product. It is related to the concentration of nutrients such as sugar, protein and vitamins in food products [20].
During this study, a wide range of dry matter content was found among the samples. As shown in Table 3 and Table 4, the highest dry matter content values were obtained as 9.54% and 13.02% for sample no. 26 in each group, full-fat and fat-reduced, respectively. On the other hand, the lowest values in both groups were recorded as 0.634% and 1.37% for sample no. 11 (ratio: 1%, US: 0, pH value: 8.5 and mixing time: 5.5), respectively.
From the obtained data it is clear that the dry matter value depends on the seed ratio. The higher the seed ratio, the higher the dry matter value. For the dry matter response, mean and standard deviation parameters were 4.77 ± 1.04 and 6.47 ± 1.04, for full-fat and fat-reduced samples respectively. The coefficient of variation (CV) was reported as 21.74 and 15.92 for full-fat and fat-reduced seed milk samples respectively. The sensitivity value of the response was 17.61 and 15.66, respectively. Similarly, R2 values were 0.8460 and 0.9435 respectively, and Adj-R2 values were 0.8204 and 0.8871 respectively. Therefore, all the statistical parameters of the dry matter response were found to be statistically significant for the model of both hemp seed milk groups (p < 0.05), as shown in Table 7 and Table 8.
Figure 4 and Figure 5 show the overall effect of various production parameters on the dry matter content response. According to the de-hulled full-fat seed milk model, the response equation with production parameters such as the seed ratio, US time, pH value and mixing time is given as follows:
D r y   m a t t e r = +   4.77 + 3.40   A + 0.3965   B + 0.1378   C + 0.3404   D
A: seed ratio, B: US time, C: pH value, D: mixing time.
The production parameters and response equation of the de-hulled fat-reduced seed milk sample are given as follows:
D r y   m a t t e r   = +   6.48   +   4.36   A   +   0.6613   B   +   0.4733   C   +   0.1264   D   +   0.1574   A B   +   0.9606   A C   +   0.6488   A D   +   0.3253   B C     0.1328   B D   +   0.5088   C D   +   0.1867   A 2     0.4482   B 2   +   0.4852   C 2     0.2583   D 2
A: seed ratio, B: US time, C: pH value, D: mixing time.
During the optimization process of hemp seed milk production, it was observed that the increase in seed–water ratio led to a significant increase in the dry matter content of the final product (Figure 4 and Figure 5). This increase can be explained by the greater availability of solid components such as proteins, oils and fibers in the seeds. As the seed ratio increases, these solids are extracted more efficiently during processing, resulting in a more concentrated hemp milk with a higher dry matter content. This highlights its importance as an important variable in formulating the desired quality in the final product.
In contrast, the effect of sonication and mixing time on dry matter content was less pronounced, with only a small increase observed. Both sonication and mixing serve to increase the extraction and distribution of particles within the milk, contributing to the disintegration of hemp seed structures and improving their homogeneity [21]. However, the relatively slight change in dry matter content suggests that these mechanical treatments help improve homogeneity and particle size distribution rather than significantly increase solids extraction [21]. Similarly, during the optimization process, changes in pH had no discernible impact on the dry matter content. The stability of the dry matter content in the face of pH variations suggests that, within the pH range under investigation, neither acidity nor alkalinity significantly affects the extraction and suspension of solid components in hemp seed extraction.

3.4. Ash Content

In plant-based beverages the inorganic residue left after organic components are burned is called ash content. Ash from foods can provide important information about the nutritional profile and quality of the beverages. Ash content consists mostly of minerals that are essential for numerous physiological processes in the body. These minerals include calcium, magnesium, potassium and phosphorus [2].
During this study, the ash content showed a wide range of values ranging from 0.057 to 1.282 and 0.053 to 1.63% for full-fat and fat-reduced hemp seed milk samples as shown in Table 3 and Table 4, respectively.
Besir et al. [4] reported the ash content of hemp seed milk as 0.63 g/100 g in their study. From the data we collected, it was clearly found that the seed ratio affects the ash content value. As the seed ratio increases, the ash value also increases. For the ash content response, the mean and standard deviation parameters were 0.499 ± 0.102 and 0.544 ± 0.182 for full-fat and defatted seed milk samples, respectively. Additionally, the coefficient of variation (CV) was found to be 20.6 and 33.46, respectively. The sensitivity value of the response was reported as 21.76 and 9.88 respectively. Similarly, R2 values were reported as 0.898 and 0.851 respectively and Adj-R2 was reported as 0.881 and 0.703 respectively.
The total effect of different production factors on the ash content response is shown in Figure 6. Accordingly, all statistical parameters of the ash content response were found to be statistically significant for both models (p < 0.05). For full-fat hemp seed milk, the response equation with production parameters such as the seed ratio, US time, pH value and mixing time is given as follows:
A s h   % = 0.4993 + 0.4311   A + 0.0337   B 0.0277   C + 0.0030   D
A: seed ratio, B: US time, C: pH value, D: mixing time.
The production parameters and response equation of the fat-reduced hemp seed milk sample are shown as follows:
A s h   % = + 5124 + 0.3755   A + 0.0152   B + 0.0927   C + 0.1049   D 0.0129   A B 0.0145   A C + 0.0879 0.0621   B C 0.0023   B D + 0.310   C D 0.0806   A 2 0.0725   B 2 + 0.1321   C 2 + 0.0976   D 2
A: seed ratio, B: US time, C: pH value, D: mixing time.
In optimizing the production of hemp seed milk, it was found that increasing the seed-to-water ratio resulted in a significant increase in the ash content of the final sample. Kundu et al. [14]. have previously observed similar outcomes when improving the production of soymilk and almond milk. As the hemp seed ratio increased, the ash content of the milk—which indicates its mineral makeup—increased noticeably. This is explained by the increased content of nutrients like potassium and magnesium.
The solid lines represent the predicted values obtained from the regression model, while the dashed lines indicate the 95% confidence intervals. The symbols represent experimental data points. As more seeds are used, a greater amount of these inorganic compounds is released into the extract, resulting in a higher ash content.
In addition to the seed ratio, the effects of sonication and mixing time on the ash content were also investigated. While these mechanical treatments contributed to a slight increase in the ash content, their effects were relatively less compared to the seed ratio. Sonication and mixing are primarily used to enhance the extraction process by disrupting cell walls and promoting the release of bioactive compounds [22]. However, their limited effects on ash content suggest that they mainly improve the dispersion and extraction of smaller particles and organic compounds rather than significantly increasing the mineral content [23], suggesting that mechanical processing plays a supporting role in ash content, while the seed ratio remains the dominant factor. Furthermore the effects of sonication, mixing time, and pH value on ash content were also investigated. These mechanical treatments contributed to a statistically insignificant (p > 0.05) increase in ash content, while their effects were relatively less compared to the seed ratio (Figure 6).

3.5. Protein Content

A major limitation of plant milk types is the low protein content seen in most commercially available products [24]. In general, the nutritional components in different types of plant-based milk vary significantly, including in protein content. In a published study by Zhang et al. [25], they reported differences in the protein content of different types of plant-based milk types. Soy milk had the highest value (3.0 g/100 mL), while other milk types had intermediate values of 0.6 to 1.2 g/100 mL for coconut and oat milk, respectively. The same study found that the only plant-based types that met the specified criteria for protein content were soy milk and mixed milk types. However, consistent with previous studies, in addition to soy milk having protein levels comparable to bovine milk, hemp seed milk has been shown to have a high protein content ranging from 0.83 to 4% (depending on the seed ratio) [4], placing it at an intermediate level with the possibility of mimicking bovine milk (3.3 g/100 mL) [20].
During this study, the protein content of full-fat milk samples ranged from 0.096 to 5.41 g/100 mL for samples 25 and 9, respectively, as shown in Table 3. The protein content of fat-reduced milk samples ranged from 1.37 to 13.02 g/100 mL for samples 11 and 26, respectively, as shown in Table 4. The models for full-fat and fat-reduced samples provided mean and standard deviation of 2.69 ± 0.385 and 4.27 ± 1.66, respectively. The value of the sensitivity response was recorded as 18.11 and 6.28, respectively. The coefficient of variation (CV) was 14.33 and 38.91, respectively. In addition, R2 values for full-fat and fat-reduced milk samples were recorded as 0.9682 and 0.7635, while Adj-R2 values were recorded as 0.9364 and 0.5270, respectively, as shown in Table 5 and Table 6.
As a result, the statistical parameter of protein content response was found to be statistically significant for both models (p < 0.05). The combined effects of production parameters on protein content response are shown in Figure 7 and Figure 8.Thus, the model showed that the response equation with production parameters of full-fat hemp seed milk sample was as follows:
P r o t e i n   c o n t e n t   = + 3.34   +   2.21   A   +   0.1474   B   +   0.0781   C     0.0246   D   +   0.0197   A B   +   0.1529   A C     0.1933   A D   +   0.4891   B C   +   0.0491   B D   +   0.0234   C D     0.3798   A 2     0.3209   B 2     0.5901   C 2     0.2878   D 2  
A: seed ratio, B: US time, C: pH value, D: mixing time.
The parameters of the fat-reduced hemp seed milk sample and the response equation were given as follows:
P r o t e i n   c o n t e n t   = + 5.31   +   2.55   A   +   0.4209   B   +   1.08   C   +   0.2102   D     0.2480   A B   +   1.21   A C   +   0.3952   A D   +   0.4925   B C   +   0.4683   B D     0.3175   C D     1.55   A 2     0.0981   B 2     1.00   C 2   +   0.1318   D 2
A: seed ratio, B: US time, C: pH value, D: mixing time.
In optimizing the production of full-fat and fat-reduced hemp seed milk types, it was observed that the protein content showed a significant correlation with the seed-to-water ratio. As the hemp seed ratio in the extraction mixture increased, there was a significant increase in protein concentration. This relationship can be attributed to the higher availability of proteins in a more concentrated seed matrix. Since protein is the primary macronutrient found in hemp seeds and its concentration directly affects the overall nutritional profile of the milk, the increased protein content with higher seed ratios is consistent with expectations.
Additionally, ultrasound and mixing duration played a secondary but significant role in enhancing protein extraction. Even though the increase in protein content with extended sonication and mixing time was less noticeable than the seed ratio effect, the application of mechanical energy helped disintegrate cellular structures and facilitated the release of protein molecules into the surrounding medium [26]. These findings suggest that optimizing mechanical processing conditions with appropriate seed ratios can increase protein yield in full-fat hemp seed milk.
On the other hand, the effect of pH value on protein content was particularly significant in full-fat hemp seed milk. Protein concentration increased as pH increased and was highest at pH 8.5. This suggests that the solubility of hemp proteins is maximized under slightly alkaline conditions, leading to higher extraction efficiency. However, beyond pH 8.5, protein content began to decrease; this may be due to protein denaturation or the formation of insoluble aggregates at higher pH levels. The literature indicates that following hemp protein extraction, hemp albumins become more soluble at pH values between 3 and 9. Following extraction, hemp globulins were very weakly soluble at pH 5. Globulins became more soluble at the most alkaline pH (pH 5 to 9) environment. In this instance, the increase in the protein extraction yield from pH 8 is in line with the fact that albumins and globulins become more soluble above this pH value [27].
The hemp seed sample that had been fat-reduced, however, responded differently to pH variations. The fat-reduced sample demonstrated a steady increase in protein content with increasing pH values, in contrast to the full-fat sample, whose protein level decreased at a pH above 8.5. The decrease in fat content, which would normally impact the stability and solubility of proteins in the full-fat milk, might be the cause of this behavior. Since proteins are less likely to interact with lipids that may alter their solubility at higher pH values, the lowering of fat content in samples probably enables more consistent protein extraction throughout a wider pH range.

3.6. Color Measurement

The color of food items is one of the most important parameters that affect the consumer’s purchasing decision. Therefore, food companies that produce plant- based milk products today are conducting research to improve the sensory qualities, including color, and acceptability of products in order to imitate bovine milk [28]. During this research, the values of the brightness (L*) factor were examined in the design to investigate the optimum production parameters of hemp seed milk; the redness (a*) and yellowness (b*).
According to the statistical results, the mean and standard deviation values of the L* parameter were 85.40 ± 1.99 and 83.87 ± 3.83 for full-fat and fat-reduced milk types, respectively. The coefficient of variation (CV) was 2.34 and 4.56, respectively. The ‘sensitivity’ value of the response is reported as 13.25 and 9.11, respectively. Also, the R2 and Adj-R2 values were 0.9375, 0.8170 and 0.8750, 0.6340, respectively. However, the p-value and F-value of the full-fat milk sample were found to be 0.0001 (significant) and 0.1348 (not significant), respectively, as shown in Table 7. For the fat-reduced sample, they were found to be 0.0042 (significant) and 0.0007 (significant), as shown in Table 8. Therefore, all statistical parameters of the L* response were found to be statistically significant (p < 0.05) for the model of the full-fat group, whereas, for the fat-reduced group, they were not statistically significant (p > 0.05).
For the full-fat seed milk samples, the combined effects of different production factors on the brightness response are shown in Figure 9. According to the model, the response equation with production parameters such as the seed ratio, US time, pH value and mixing time is given as follows:
L   = + 89.237   +   ( 6.3575   × A )   +   ( 2.20875   × B )   +   ( 1.2525   × C )     ( 0.315417   × D )     ( 1.43   × A B )     ( 1.945   × A C )   +   ( 1.745   × A D )     ( 0.7875   × B C )   +   ( 0.05375   × B D )   +   ( 0.475   × C D )     ( 5.80579   × A 2 )     ( 2.18017   ×   B 2 )     ( 0.330792   ×   C 2 )     ( 0.947667   ×   D 2 )
A: seed ratio, B: US time, C: pH value, D: mixing time.
In optimizing the production of full-fat hemp seed milk, significant differences in the brightness (L* value) of the milk were observed in response to changes in processing parameters. The most important factor affecting the L* value was the seed-to-water ratio. As the seed ratio increased, there was a significant increase in the L* value, indicating a lighter or more transparent milk sample. This trend continued until the seed ratio reached 9%, at which point the L* value began to decrease (Figure 9).
Ultrasound duration also played an important role in affecting the L* value. As the sonication duration increased, the L* value continued to increase. The application of ultrasound energy promotes the disintegration of larger particles, helping to homogenize the milk and distribute suspended solids more evenly [29]. This homogeneity may possibly cause the milk to appear clearer and brighter. Similarly, the pH of the extraction medium also had a positive effect on the L* value. The L* value increased as the pH increased, indicating that a more alkaline environment favored a lighter appearance in the full-fat hemp seed milk. This may be due to better solubilization of proteins and other components at higher pH values [27], which may result in a whiter milk sample. In contrast, the mixing time showed no significant effect on the L* value. Longer mixing times did not show a significant change in the clarity of the milk.

3.7. Rheological Measurement

Understanding the rheological properties of food is essential for developing new products and maintaining the stability and quality of the product during storage. It also investigates the effect of formulation components and relates product structure to its rheological properties and fluid flow and heat transfer [30]. The correlation between shear rate and shear stress determines the rheological flow properties of fluids. Fluids can be categorized as Newtonian or non-Newtonian (pseudo-plastic) according to their rheological flow properties.
For a Newtonian fluid, ƞ (flow behavior index) = 1. In the case of a non-Newtonian fluid, shear thinning occurs when ƞ < 1, while shear thickening occurs when ƞ > 1 [31]. According to the literature, the viscosity of plant-based milk samples (soy, oat and buckwheat) decreased with increasing shear rate. This flow behavior showed that all plant-based milk samples examined exhibited non-Newtonian flow behavior [31]. The flow behavior index (ƞ) of each milk sample examined is less than one, confirming the pseudo-plastic (non-Newtonian) property of the plant-based milk and indicating that all milk sample fluids are shear-thinning fluids [31].
Likewise, the flow behavior index (ƞ) of all hemp seed milk samples examined during this study showed a value less than one, indicating that the hemp seed extract was non-Newtonian. However, the effect of different production parameters on the viscosity properties of hemp seed milk was investigated. According to the statistical results, significant differences were found among all samples in both groups. The highest viscosity value of 19.58 (mPas) for a full-fat milk sample is reported in Table 3, for sample number 26. This sample has the following production parameters: 15%, 5 min, 8.5 and 5.5 min for the seed ratio, US time, pH value and mixing time respectively. The lowest value of 0.349 (mPas) was reported for sample number 16. In contrast, the highest viscosity value of the fat-reduced seed milk samples (17.3 mPas) was reported for sample number 9 (ratio: 15, US: 5 min, pH: 8.5 and mixing time: 1 min). However, the lowest viscosity value (0.27 mPas) was reported for sample number 11 (ratio: 1, US: 0 min, pH: 8.5 and mixing time: 5.5 min).
The mean and standard deviation parameters of the viscosity response were 5.65 ± 5.46 and 6.71 ± 2.93 for full-fat and fat-reduced seed milk samples respectively. The coefficient of variation (CV) was 96.69 and 43.67 respectively. The ‘Adeq Precision’ value of the response was reported as 6.169 and 10.84 respectively. Also, R2 values were reported as 0.4025 and 0.8617, Adj-R2 was reported as 0.3029 and 0.7235 respectively, as shown in Table 5 and Table 6. Then, for the full-fat model, all the statistical parameters of viscosity response were found to be statistically significant for the model (p < 0.05), as shown in Table 7. However, the lack of fit of the viscosity response (0.0001) was significant, causing this parameter to be not significant for the model, as shown in Table 7. On the other hand, the statistical parameters of the viscosity response of the fat-reduced samples were found to be statistically significant for the model (p < 0.05) Table 8.
The equation predicted by the model for the production parameters of the fat-reduced milk sample is:
V i s c o s i t y   = + 4.86   +   6.53   A     0.2795   B     2.08   C   +   0.1394   D     1.10   A B     4.42   A C   +   0.0434   A D     2.61   B C   +   0.7275   B D     0.1576   C D   +   2.69   A 2     0.5015   B 2   +   1.97 C 2   +   0.3213   D 2
A: seed ratio, B: US time, C: pH value, D: mixing time.
According to the results, the seed–water ratio factor had the most significant (p < 0.05) effect on the viscosity values. As the seed ratio increased, there was a significant increase in the viscosity of the samples (Figure 10). This can be attributed to the higher concentration of suspended solids such as proteins and fibers which contribute to a thicker and more viscous milk.
In contrast, sonication time had a slight decreasing effect on the viscosity of fat-reduced hemp seed milk samples. Ultrasonic energy application helps break up larger particles and disrupt aggregates, resulting in a more homogeneous and finer distribution of solids, thus reducing viscosity [32]. Similarly, an increase in pH also caused a decrease in viscosity values. At higher pH levels, the solubility of proteins and other solid components increases, leading to a more dispersed suspension with fewer aggregates. This increased solubility might reduce interactions between particles, lowering resistance to flow and decreasing overall viscosity. On the other hand, mixing time showed no significant effect on the viscosity of the fat-reduced samples. Although mixing ensures homogeneous distribution of particles in the extraction medium, it demonstrated no effect on the size or solubility of the particles important enough that it would affect the viscosity.

3.8. Particle Size

The stability of an emulsion is largely dependent on particle size. In general, plant-based beverages with smaller particle sizes exhibit enhanced stabilizing properties [33]. Therefore, homogenization is an important step in the processing of plant-based milk types, with the aim of reducing particle size and improving product stability, appearance, mouthfeel and shelf life. In a study on peanut milk, it was reported that the particle average size decreased after ultrasound treatment compared to ultrasound-untreated and thermally treated peanut milk [17]. Similarly, Dai et al. [33], in their study on the production of mung bean-based milk, reported that samples with 25 to 35 min of sonication had significantly smaller average particle sizes compared to samples without sonication. This is generally due to the fragmentation of particles caused by the high intensities of ultrasound and the hydrodynamic cavitation effect [33].
During this study, the particle size values of full-fat milk samples showed a wide range as shown in Table 3. The lowest particle size value was 1.775 (µm) while the highest value was 9.122 (µm), for sample numbers 28 and 13, respectively. The mean and standard deviation parameters of particle size response were 5.348.74 ± 2714.8. The coefficient of variation (CV) was reported as 50.76 and the ‘sensitivity’ value of the response was 2.91. In addition, the R2 and Adj-R2 values were 0.29 and 0.41, respectively. Accordingly, all the statistical parameters of particle size response showed no statistical significance for the model (p > 0.05). Similarly, the particle size value of fat-reduced milk samples varied between 1.612 and 9.895 (µm) for sample number 1 and 29 as shown in Table 4. The mean and standard deviation parameters were reported as 5.348.74 ± 2336.6. The coefficient of variation (CV) was reported as 43.6 and the ‘Adeq Precision’ value of the response was reported as 3.55. Thus, the R2 and Adj-R2 values showed the values of 0.47 and 0.04, respectively, as shown in Table 6. Hence, all the statistical parameters of particle size response were not found to be statistically significant for fat-reduced hemp seed milk model (p > 0.05), as shown in Table 8.
The hemp milk system here showed high variability and strong, overlapping effects of composition, pH, and heat treatment, so the RSM models for particle size results did not reach significance. However, significant size reductions have been documented in mung bean milks [17], and the action of ultrasound is frequently isolated while the formulation is kept constant (like, constant ratios and pH). In this study, the seed ratio, pH, mixing duration, and ultrasound were all simultaneously changed using a Box–Behnken design. In addition to potentially masking the net ultrasonic effect in the statistical model, changes in the seed ratio and pH can drastically change viscosity, aggregation, and apparent particle size. Therefore, ultrasound effects on particle size may have existed but were statistically masked under the multifactor conditions used. The second explanation is that hemp seed milk is a complex, highly polydisperse emulsion–suspension; heating and an alkaline pH encourage protein aggregation and re-aggregation can broaden the particle size distribution and prevent fragmentation caused by ultrasound [2].

3.9. Sedimentation Index

The sedimentation index is one of the most important parameters for evaluating the quality and stability of plant-based milk. The higher the sedimentation value, the lower the stability of the milk [17]. Many techniques, including high-pressure homogenization and ultrasound treatments, have been reported to be effective in reducing the sedimentation value in plant-based milk types. The presence of large aggregates in the emulsion is associated with a higher sedimentation index. Therefore, these techniques are likely associated with the disruption of large particle aggregates, reduction in particle size, and increased protein solubility, and consequently increased the stability of the emulsion [34].
During this research, the highest sedimentation ratio (57.10%) of the full-fat hemp seed milk was reported under these production parameters: 15, 5, 8.5, and 10 for the seed ratio, sonication time, pH value, and mixing time, respectively. The lowest sedimentation ratio (38.56%) was reported for sample number 10 after production with a 1% seed ratio, sonication time 5 min, pH (9.5) and mixing time of 5.5 min. On the other hand, the fat-reduced seed milk sample with production parameters of 8, 5, 8.5, and 5.5 for the seed ratio, sonication time, pH value, and mixing time, respectively, showed the highest sedimentation ratio of 55.93%. The lowest sedimentation ratio of 37.56% was reported for sample number 1 after production with a 1% seed ratio, sonication time of 5 min, pH 8.5, and mixing time of 10 min.
According to the statistical analysis results of sedimentation, mean and standard deviation values were found as 46.34 ± 4.76 and 45.97 ± 4.33 for full-fat and fat-reduced milk samples, respectively. The coefficient of variation (CV) value was found as 10.26 and 9.42, respectively. Thus, the ‘Adeq sensitivity’ value for which the response should be greater than four was 6.353 and 8.0, respectively. However, low values of R2 0.6841 and 0.5875 and Adj-R2 0.3683 and 0.1749 were found for full-fat and fat-reduced seed milk samples, respectively, as shown in Table 5 and Table 6, indicating that there is a deviation from the mean value. According to the statistical parameters in question, sedimentation index responses were not found to be statistically significant for both groups (p > 0.05), as shown in Table 7 and Table 8.

3.10. ζ-Potential Measurement Results

When particles move in an applied electric field, the net surface potential affected by the co-moving particles is represented by the ζ-potential. In other words, it is represented as the electrical potential difference between the moving dispersion medium and the stationary layer of the dispersion [34]. Although electrostatic stabilization is frequently linked to large absolute ζ-potential values, moderate values (such as 20–40 mV) can still be compatible with good physical stability if they are paired with enough continuous-phase viscosity, particle/protein network formation, and protein-rich interfacial layers [8]. If the pH changes, the ionization state of charged groups (such as -COOH or -NH2) will also change, causing a change in surface charge density [35].
In a study investigating the effect of sonication on the ζ-potential of peanut milk, the ζ-potential of peanut milk increased from −27.6 mV (untreated) to −30 mV (sonicated) after 300 W ultrasound treatment [17]. Likewise, Lu et al. (2019) [29] found that ultrasound treatment increased the absolute ζ-potential electronegativity number of pure coconut milk from −0.446 mV to −9.396 mV. This is because ultrasound can cause cavitation, which leads to the dissociation of water molecules in bubbles and the production of hydrogen, hydroxyl radicals and other free radicals [8,29].
Hence, the ζ-potential value of full-fat milk samples during this study varied between −9.1 mV and −21.55 mV, with mean values around −17 mV for both formulations, indicating moderate electrostatic repulsion. The coefficient of variation (CV) was 10.42 and the ‘Adeq Precision’ value of the response was reported as 8.21. In addition, R2 and Adj-R2 values were 0.75 and 0.50, respectively. As a result, it is believed that the stability of optimized samples is not due to ζ-potential alone, but rather to the combined effects of this moderate ζ-potential, greater viscosity at larger seed ratios, and enhanced dispersion and protein solubility generated by ultrasound and alkaline pH.
Accordingly, all the statistical parameters of the ζ-potential response were found to be statistically significant for the model (p < 0.05), as shown in Table 5. The equation estimated by the model is:
Z P   =   17.21   +   0.2317   A   +   1.87   B     0.0383   C   +   0.4308   D     3.38   A B   +   0.95   A C   +   0.8750   A D     0.9325   B C     1.21   B D     0.0925   C D   +   0.6725   A 2   +   1.01   B 2     0.4625   C 2     1.44   D 2
A: seed ratio, B: US time, C: pH value, D: mixing time.
However, the ζ-potential value of fat-reduced milk samples varied between −9.1 mV and −19.82 mV for samples no. 9 and 23 as shown in Table 4. Mean and standard deviation parameters were reported as −17.30 ± 2.82. The coefficient of variation (CV) was reported as 16.28 and the ‘Adeq Precision’ value of the response was reported as 3.9. Thus, R2 and Adj-R2 values were 0.39 and 0.2, respectively, as shown in Table 6. Hence, all the statistical parameters of ζ-potential response were not found to be statistically significant for fat-reduced hemp seed milk model (p > 0.05). During the optimization process of full-fat hemp seed milk production, zeta potential exhibited significant changes in response to different processing parameters. It was observed that the seed ratio had a slight but consistent effect on zeta potential, with a slight increase as seed concentration increased (Figure 11). According to this trend, increasing the seed ratio may increase the emulsion particles’ surface charge density. This is probably due to the fact that there are more charged bioactive compounds present, especially proteins and polysaccharides, which adsorb at the interface and support colloidal stability through electrostatic repulsion [36].
Sonication time, on the other hand, showed a more pronounced effect on zeta potential values. A sharper increase in zeta potential was observed as sonication time increased, as shown in Table 3 and Table 4. This is attributed to the disruption of particle aggregates and increased dispersion at the colloidal level, which are typical results of long-term sonication [32]. Nevertheless, at a particular pH and mixing time threshold, an intriguing reversal in the zeta potential behavior was observed. The zeta potential specifically started to drop when the pH approached over 8.5. This pH-dependent behavior is in line with many proteins’ and other colloidal species’ isoelectric points, when charge neutralization takes place and stability is reduced. Similarly, a decrease in zeta potential was observed after 5 min of mixing. Prolonged mixing may have caused the particles to reaggregate or may have counteracted the initial dispersion effects, leading to destabilization of the system.

Optimization Process

In order to investigate the effects of the seed ratio, sonication time, pH value and mixing time on the response variables, response surface graphs were drawn using the “Design Expert” software version 13. These graphs were created by changing two independent variables within the experimental ranges while keeping the third variable at a central point. In Figure 12 and Figure 13, the designs were designed by changing the production factors where the central point is desirability. These graphs show the complex interactions between the independent variables. Then, numerical optimization was performed with the desirability function using the Design Expert Software.
The targets selected for the optimization of hemp seed milk production are to minimize both sedimentation index and particle size values and to maximize brightness values (L*). The desirability was found to be 76.9% for the full-fat hemp seed milk and 83.2% for the fat-reduced hemp seed milk sample. Figure 14 shows the picture of the optimized thermally stable full-fat (A), and fat-reduced (B), hemp seed milk produced.

4. Conclusions

This study successfully optimized the production of thermally stable hemp seed milk derived from de-hulled full-fat and fat-reduced hemp seeds using Response Surface Methodology (RSM). Among the investigated variables, the seed-to-water ratio had the greatest impact on dry matter, protein content, ash content, and viscosity in both formulations. Under the defined optimization criteria (minimizing sedimentation and particle size and maximizing brightness), the fat-reduced hemp seed milk achieved higher overall desirability than the full-fat milk, indicating better thermal and physicochemical stability within the tested processing range.
Furthermore, the integration of ultrasound and pH adjustment significantly improved homogenization, brightness, and zeta potential, contributing to better colloidal stability and shelf-life potential. Optimization models revealed that reducing sedimentation and particle size while maximizing brightness (L*) yielded hemp seed milk with desirable physical and nutritional characteristics. Importantly, this study provides novel insights into the process–structure–function relationships in plant-based emulsions and supports the development of additive-free, high-protein milk alternatives. These findings not only advance scientific understanding of hemp milk processing but also have practical implications for the clean-label food industry seeking to meet consumer demand for sustainable and functional plant-based beverages. Future work should explore different hemp varieties and seed origins to assess the impact of initial composition, the long-term stability over 4–8 weeks, sensory attributes, and in vivo digestibility of optimized formulations.

Author Contributions

N.M.H.A.: Writing—original draft, visualization, validation, methodology, investigation, formal analysis, data curation. M.M.: Review and editing, supervision, methodology, investigation, conceptualization. All authors have read and agreed to the published version of the manuscript.

Funding

This work was supported by Ondokuz Mayıs University with the project number PYO.MUH.1904.23.016.

Data Availability Statement

The raw data supporting the conclusions of this article will be made available by the authors on request.

Acknowledgments

During the preparation of this work, the author used ChatGPT (GPT-5, OpenAI, San Francisco, CA, USA) to check the grammar of the manuscript. After using this tool, the author reviewed and edited the content as needed and takes full responsibility for the content of the published article.

Conflicts of Interest

The authors declare no conflicts of interest.

References

  1. Suryamiharja, A.; Gong, X.; Zhou, H. Towards more sustainable, nutritious, and affordable plant-based milk alternatives: A critical review. Sustain. Food Proteins 2024, 2, 250–267. [Google Scholar] [CrossRef]
  2. Awad, N.; Mortaş, M. Effect of pH-shift Treatment and Ultrasonication on the Physical Stability and Properties of Hemp Seed Milk. Int. J. Innov. Approaches Sci. Res. 2024, 8, 123–137. [Google Scholar] [CrossRef]
  3. Ajibola, C.F. Structural and Functional Properties of Hemp Seed Storage Proteins. Master’s Thesis, University of Manitoba, Winnipeg, MB, Canada, 2020. Available online: https://mspace.lib.umanitoba.ca/server/api/core/bitstreams/77ab0e6b-087c-44b2-953a-41edc32ad99f/content (accessed on 14 December 2025).
  4. Besir, A.; Awad, N.; Mortas, M.; Yazici, F. A Plant-Based Milk Type: Hemp Seed Milk. Akad. Gida 2022, 20, 170–184. [Google Scholar] [CrossRef]
  5. Wang, Q.; Jiang, J.; Xiong, Y.L. High pressure homogenization combined with pH shift treatment: A process to produce physically and oxidatively stable hemp milk. Food Res. Int. 2018, 106, 487–494. [Google Scholar] [CrossRef] [PubMed]
  6. Jiang, J.; Wang, Q.; Xiong, Y.L. A pH shift approach to the improvement of interfacial properties of plant seed proteins. Curr. Opin. Food Sci. 2018, 19, 50–56. [Google Scholar] [CrossRef]
  7. Vanga, S.K.; Wang, J.; Orsat, V.; Raghavan, V. Effect of pulsed ultrasound, a green food processing technique, on the secondary structure and in-vitro digestibility of almond milk protein. Food Res. Int. 2020, 137, 109523. [Google Scholar] [CrossRef] [PubMed]
  8. Sarangapany, A.K.; Murugesan, A.; Annamalai, A.S.; Balasubramanian, A.; Shanmugam, A. An overview on ultrasonically treated plant-based milk and its properties–A Review. Appl. Food Res. 2022, 2, 100130. [Google Scholar] [CrossRef]
  9. Liu, Y.; Tan, Z.; Huang, Y.; Liu, J.; Xu, X.; Zhu, B.; Dong, X. pH-shift strategy improving the thermal stability and oxidation stability of rice starch/casein-based high internal phase emulsions for the application in fish cake. Food Chem. X 2023, 18, 100694. [Google Scholar] [CrossRef]
  10. Julakanti, S.; Charles, A.P.R.; Zhao, J.; Bullock, F.; Syed, R.; Myles, Y.; Wu, Y. Hempseed protein (Cannabis sativa L.): Influence of extraction pH and ball milling on physicochemical and functional properties. Food Hydrocoll. 2023, 143, 108835. [Google Scholar] [CrossRef]
  11. Shen, P.; Gao, Z.; Xu, M.; Ohm, J.B.; Rao, J.; Chen, B. The impact of hempseed dehulling on chemical composition, structure properties and aromatic profile of hemp protein isolate. Food Hydrocoll. 2020, 106, 105889. [Google Scholar] [CrossRef]
  12. Kahraman, O.; Petersen, G.E.; Fields, C. Physicochemical and Functional Modifications of Hemp Protein Concentrate by the Application of Ultrasonication and pH Shifting Treatments. Foods 2022, 11, 587. [Google Scholar] [CrossRef] [PubMed]
  13. Kuru, C.; Tontul, I. Optimisation of Plant-based Milk Formulation using Hazelnut, Sunflower Seed and Pumpkin Seed by Mixture Design Turkish Journal of Agriculture––Food Science and Technology Optimisation of Plant-based Milk Formulation using Hazelnut, Sunflower Seed and P. Turk. J. Agric. 2020, 11, 2441–2448. [Google Scholar] [CrossRef]
  14. Kundu, P.; Dhankhar, J.; Sharma, A. Development of non dairy milk alternative using soymilk and almond milk. Curr. Res. Nutr. Food Sci. 2018, 6, 203–210. [Google Scholar] [CrossRef]
  15. ICC 104/1; Determination of Ash in Cereals and Cereal Products. International Association for Cereal Science and Technology (ICC): Vienna, Austria, 1990.
  16. Salve, A.R.; Pegu, K.; Arya, S.S. Comparative assessment of high-intensity ultrasound and hydrodynamic cavitation processing on physico-chemical properties and microbial inactivation of peanut milk. Ultrason. Sonochem. 2019, 59, 104728. [Google Scholar] [CrossRef]
  17. Gul, O.; Turker, F.; Mortas, M.; Atalar, I.; Yazici, F. Effect of high pressure homogenization (HPH) on microstructure and rheological properties of hazelnut milk. Innov. Food Sci. Emerg. Technol. 2017, 41, 411–420. [Google Scholar] [CrossRef]
  18. Yilmaz, M.T.; Akman, P.K.; Bozkurt, F.; Karasu, S. An effective polydopamine coating to improve stability and bioactivity of carvacrol-loaded zein nanoparticles. Int. J. Food Sci. Technol. 2021, 56, 6011–6024. [Google Scholar] [CrossRef]
  19. Mehmood, T.; Ahmed, A.; Ahmad, A.; Ahmad, M.S.; Sandhu, M.A. Optimization of mixed surfactants- based β-carotene nanoemulsions using response surface methodology: An ultrasonic homogenization approach. Food Chem. 2018, 253, 179–184. [Google Scholar] [CrossRef]
  20. Walther, B.; Guggisberg, D.; Badertscher, R.; Egger, L.; Portmann, R.; Dubois, S.; Haldimann, M.; Kopf-Bolanz, K.; Rhyn, P.; Zoller, O.; et al. Comparison of nutritional composition between plant-based drinks and cow’s milk. Front. Nutr. 2022, 9, 988707. [Google Scholar] [CrossRef]
  21. Rahman, M.M.; Lamsal, B.P. Ultrasound-assisted extraction and modification of plant-based proteins: Impact on physicochemical, functional, and nutritional properties. Compr. Rev. Food Sci. Food Saf. 2021, 20, 1457–1480. [Google Scholar] [CrossRef]
  22. Kumar, R.; Kumar, A.; Jayachandran, L.E.; Rao, P.S. Sequential Microwave–Ultrasound assisted extract ion of soymilk and optimization of extraction process. LWT 2021, 151, 112220. [Google Scholar] [CrossRef]
  23. BermÚdez-Aguirre, D.; Mawson, R.; Versteeg, K.; Barbosa-CÁnovas, G.V. Composition properties, physicochemical characteristics and shelf life of whole milk after thermal and thermo-sonication treatments. J. Food Qual. 2009, 32, 283–302. [Google Scholar] [CrossRef]
  24. Jeske, S.; Zannini, E.; Arendt, E.K. Past, present and future: The strength of plant-based dairy substitutes based on gluten-free raw materials. Food Res. Int. 2018, 110, 42–51. [Google Scholar] [CrossRef]
  25. Zhang, J.; Cai, Q.; Ji, W. Nutritional Composition of Plant Protein Beverages on China’s Online Market: A Cross-Sectional Analysis. Nutrients 2023, 15, 2701. [Google Scholar] [CrossRef]
  26. Manzoor, M.F.; Siddique, R.; Hussain, A.; Ahmad, N.; Rehman, A.; Siddeeg, A.; Alfarga, A.; Alshammari, G.M.; Yahya, M.A. Thermosonication effect on bioactive compounds, enzymes activity, particle size, microbial load, and sensory properties of almond (Prunus dulcis) milk. Ultrason. Sonochem. 2021, 78, 105705. [Google Scholar] [CrossRef] [PubMed]
  27. Potin, F.; Lubbers, S.; Husson, F.; Saurel, R. Hemp (Cannabis sativa L.) Protein Extraction Conditions Affect Extraction Yield and Protein Quality. J. Food Sci. 2019, 84, 3682–3690. [Google Scholar] [CrossRef] [PubMed]
  28. Bustamante Capule, A.; Barcelon, E.G. Influence of Colour on The Sensory Perceptıon of Ready-to-Drınk Soy Mılk. Asian J. Sci. Technol. 2014, 5, 879–882. [Google Scholar]
  29. Lu, X.; Chen, J.; Zheng, M.; Guo, J.; Qi, J.; Chen, Y.; Miao, S.; Zheng, B. Effect of high-intensity ultrasound irradiation on the stability and structural features of coconut-grain milk composite systems utilizing maize kernels and starch with different amylose contents. Ultrason. Sonochem. 2019, 55, 135–148. [Google Scholar] [CrossRef]
  30. Silva, K.; Machado, A.; Cardoso, C.; Silva, F.; Freitas, F. Rheological behavior of plant-based beverages. Food Sci. Technol. 2019, 40, 258–263. [Google Scholar] [CrossRef]
  31. Yao, Y.; He, W.; Cai, X.; Bekhit, A.E.D.A.; Xu, B. Sensory, physicochemical and rheological properties of plant-based milk alternatives made from soybean, peanut, adlay, adzuki bean, oat and buckwheat. Int. J. Food Sci. Technol. 2022, 57, 4868–4878. [Google Scholar] [CrossRef]
  32. Maghsoudlou, Y.; Alami, M.; Mashkour, M.; Shahraki, M.H. Optimization of Ultrasound-Assisted Stabiliz ation and Formulation of Almond Milk. J. Food Process. Preserv. 2016, 40, 828–839. [Google Scholar] [CrossRef]
  33. Dai, Y.; Xing, L.; Liu, S.; Liu, J.; Zhu, T.; Jiang, T.; Zheng, X.; Zhou, S.; Lu, J. Enhancing stability and flavor of mung bean-based milk through ultrasound treatment: Impacts on physical-chemical properties and protein structure. Int. J. Biol. Macromol. 2025, 286, 138465. [Google Scholar] [CrossRef] [PubMed]
  34. Snir, B.; Fishman, A.; Glusac, J. Chickpea-Based Milk Analogue Stabilized by Transglutaminase. Foods 2025, 14, 514. [Google Scholar] [CrossRef] [PubMed]
  35. Grossmann, L.; Weiss, J. Alternative Protein Sources as Technofunctional Food Ingredients. Annu. Rev. Food Sci. Technol. 2021, 12, 93–117. [Google Scholar] [CrossRef] [PubMed]
  36. Zhao, H.; Wang, S.; Zhao, G.; Li, Y.; Liu, X.; Yang, L.; Zhu, L.; Liu, H. Fabrication and emulsifying prope rties of non-covalent complexes between soy protein isolate fibrils and soy soluble polysaccharides. Food Funct. 2022, 13, 386–397. [Google Scholar] [CrossRef]
Figure 1. Production flow chart of hemp seed milk.
Processes 14 00783 g001
Figure 2. Images of full-fat dehulled hemp seed milk samples produced under the optimized production conditions predicted by the model.
Processes 14 00783 g002
Figure 3. Pictures of fat-reduced de-hulled hemp seed milk samples produced according to the production parameters in the model pattern.
Processes 14 00783 g003
Figure 4. Effects of different production variables (A: seed ratio, B: ultrasound time, C: pH, and D: mixing time) of full-fat hemp seed milk on the optimization of dry matter. The solid lines represent the predicted values obtained from the regression model, while the dashed lines indicate the 95% confidence intervals. The symbols represent experimental data points.
Processes 14 00783 g004
Figure 5. Contour plots showing the effects of production variables (seed ratio, ultrasound time, pH, and mixing time) on the dry matter content of fat-reduced dehulled hemp seed milk. The color gradient represents the predicted dry matter values, while the contour lines indicate levels of equal response.
Processes 14 00783 g005
Figure 6. Effects of production variables (A: seed ratio, B: ultrasound time, C: pH, and D: mixing time) on the ash content of fat-reduced dehulled hemp seed milk.
Processes 14 00783 g006
Figure 7. Three-dimensional response surface plots showing the effects of processing variables (A: seed ratio, B: ultrasound time, C: pH, and D: mixing time) on the protein content of full-fat hemp seed milk. The colored surfaces represent the predicted values obtained from the regression model, while the contour projections at the base indicate levels of equal response. The dots represent the experimental design points.
Processes 14 00783 g007
Figure 8. Three-dimensional response surface plots showing the effects of processing variables (A: seed ratio, B: ultrasound time, C: pH, and D: mixing time) on the protein content of fat-reduced hemp seed milk. The colored surfaces represent the predicted values obtained from the regression model, while the contour projections at the base indicate levels of equal response. The dots represent the experimental design points.
Processes 14 00783 g008
Figure 9. Three-dimensional response surface plots showing the effects of processing variables (A: seed ratio, B: ultrasound time, C: pH, and D: mixing time) on the brightness (L*) of fat-reduced hemp seed milk. The colored surfaces represent the predicted values obtained from the regression model, while the contour projections at the base indicate levels of equal response. The dots represent the experimental design points.
Processes 14 00783 g009
Figure 10. Three-dimensional response surface plots showing the effects of processing variables (A: seed ratio, B: ultrasound time, C: pH, and D: mixing time) on the viscosity of fat-reduced hemp seed milk. The colored surfaces represent the predicted values obtained from the regression model, while the contour projections at the base indicate levels of equal response. The dots represent the experimental design point.
Processes 14 00783 g010
Figure 11. Three-dimensional response surface plots showing the effects of processing variables (A: seed ratio, B: ultrasound time, C: pH, and D: mixing time) on the ζ-potential response of full-fat hemp seed milk. The colored surfaces represent the predicted values obtained from the regression model, while the contour projections at the base indicate levels of equal response. The dots represent the experimental design points.
Processes 14 00783 g011
Figure 12. Effects of different production variables on the desirability percentage of the full-fat seed milk sample. The solid black lines represent the predicted desirability values obtained from the model, while the black square markers indicate the evaluated factor levels. The red dotted vertical bars represent the confidence intervals of the predicted responses.
Processes 14 00783 g012
Figure 13. Effects of different production variables on the desirability percentage of the fat-reduced seed milk sample. The solid black lines represent the predicted desirability values obtained from the model, while the black square markers indicate the evaluated factor levels. The red dotted vertical bars represent the confidence intervals of the predicted responses.
Processes 14 00783 g013
Figure 14. Optimized thermally stable full-fat (A), and fat-reduced (B), hemp seed milk produced.
Processes 14 00783 g014
Table 1. Experimental plan for four-factor Box–Behnken rotatable design.
FactorUnitMin.Max.Coded LowCoded HighAverageStandard Deviation
A—Seed ratio%1.015.0−1 ↔ 1.0+1 ↔ 15.08.04.58
B—USMin0.010.0−1 ↔ 0.0+1 ↔ 10.05.03.27
C—pH-7.59.5−1 ↔ 7.5+1 ↔ 9.08.50.65
D—Mixing timeMin1.010.0−1 ↔ 1.0+1 ↔ 10.05.52.95
Table 2. Experimental design.
RunA: Seed RatioB: USC: pHD: Mixing Time
(%)(Min)-(Min)
11.005.008.5010.00
28.005.008.505.50
315.0010.008.505.50
415.000.008.505.50
58.000.007.505.50
68.000.008.501.00
78.005.007.5010.00
88.0010.008.501.00
915.005.008.501.00
101.005.009.505.50
111.000.008.505.50
128.005.008.505.50
138.005.009.501.00
148.000.008.5010.00
158.0010.007.505.50
161.0010.008.505.50
178.005.009.5010.00
188.0010.009.505.50
198.005.007.501.00
208.000.009.505.50
218.005.008.505.50
228.005.008.505.50
2315.005.007.505.50
2415.005.008.5010.00
251.005.008.501.00
2615.005.009.505.50
278.005.008.505.50
281.005.007.505.50
298.0010.008.5010.00
Table 3. Experimental results of full-fat hemp seed milk obtained according to the experimental plan.
FactorsResponses
Run NumberSeed Ratio %US (min)pHMixing Time (min)BrixSPSL*Dry Matter %Ash %Protein %Viscosity (mPas)ζ-Potential
(mV)
Particle Size (µm)
1158.5100.8543.0573.830.910.080.230.71−18.852.676
2858.55.51.0550.5787.34.560.433.313.70−18.934.573
315108.55.56.948.0489.87.300.704.915.45−15.473.121
41508.55.51.952.8586.537.860.744.886.80−14.44.243
5807.55.51.0540.6685.563.440.322.853.41−18.455.185
6808.511.1544.4683.414.320.402.383.19−21.46.444
7857.5101.1549.0284.425.860.552.742.86−18.45.384
88108.513.943.5288.884.020.423.284.12−17.73.209
91558.511.7554.4788.404.980.475.417.51−18.15.523
10159.55.52.1538.5681.861.680.050.321.33−18.555.788
11108.55.51.0539.2268.160.630.160.591.12−21.558.796
12858.55.55.0541.0288.634.450.422.833.04−19.827.001
13859.515.2541.3688.884.940.462.323.60−18.839.122
14808.5102.0541.2684.122.800.261.983.26−16.717.956
158107.55.51.6551.4488.665.500.511.773.13−12.326.543
161108.55.51.0539.9877.171.440.130.540.34−9.13.584
17859.5101.0556.8289.615.220.492.784.52−18.156.961
188109.55.51.1552.4687.075.150.472.9016.53−165.231
19857.511.2546.8085.595.210.492.387.34−19.458.934
20809.55.52.940.2387.125.160.502.026.35−18.42.242
21858.55.51.1549.6189.976.150.583.663.24−16.28.283
22858.55.51.0551.4189.776.150.573.593.35−16.751.909
231557.55.51.7556.9089.129.271.284.0031.1−18.96.264
241558.5101.957.1089.408.670.904.789.53−16.93.932
25158.511.9539.9479.811.450.140.090.72−16.553.094
261559.55.59.6544.6188.529.540.914.6419.5−15.858.498
27858.55.53.2548.3490.445.280.513.304.37−14.356.43
28157.55.50.9538.9474.680.750.060.290.33−17.81.775
298108.5105.743.7889.815.560.533.063.05−17.852.411
Table 4. Experimental results of the fat-reduced hemp seed milk obtained according to the experimental plan.
FactorsResponses
Run NumberSeed Ratio %US (min)pHMixing Time (min)BrixSPSL*Dry Matter %Ash %Protein %Viscosity (mPas)ζ-Potential
(mV)
Particle Size (µm)
1158.5100.9537.5657.621.700.0531.701.48−17.81.612
2858.55.52.2546.5686.294.040.3954.043.43−16.751.909
315108.55.56.7546.4387.7410.750.77010.759.43−18.42.242
41508.55.51.850.5285.328.790.8908.7912−17.852.411
5807.55.51.143.983.055.8410.3685.845.09−18.852.676
6808.512.0543.6986.725.150.4135.154.72−16.553.094
7857.5101.0549.7885.55.440.5135.449.05−15.473.121
88108.514.9540.8883.576.070.4686.072.14−17.73.209
91558.511.2554.5489.910.540.71210.5417.3−9.13.584
10159.55.50.9540.9480.092.410.1282.411.06−16.93.932
11108.55.50.938.9176.881.370.1231.370.27−14.44.243
12858.55.55.141.387.336.620.5236.623.26−18.934.573
13859.515.3543.9187.616.330.5516.333.38−18.455.185
14808.5102.444.5783.85.620.5255.624.78−165.231
158107.55.50.9549.8386.086.850.6276.8510.19−18.45.384
161108.55.50.7542.877.842.700.0542.702.05−18.15.523
17859.5104.943.9984.386.991.6566.994.56−18.555.788
188109.55.55.540.6585.488.570.5348.575.47−18.96.264
19857.511.1540.4986.286.810.6486.817.24−14.356.43
20809.55.53.145.4181.246.260.5246.2610.83−21.46.444
21858.55.55.7551.6987.786.250.5756.254.144−12.326.543
22858.55.54.945.0887.457.770.5487.775.46−18.156.961
231557.55.52.1546.4686.919.860.9439.8625.83−19.827.001
241558.5106.7549.8389.0512.750.92412.7515.21−16.717.956
25158.511.149.9382.372.090.1932.093.74−16.28.283
261559.55.57.0553.9388.0713.020.91613.028.16−15.858.498
27858.55.54.9555.9386.727.700.5197.707.99−21.558.796
28157.55.51.247.6273.483.090.0973.091.05−19.458.934
298108.5106.2545.8787.586.010.5726.015.11−18.839.895
Table 5. Statistical data for responses to full-fat hemp seed milk production.
Responses
Statistical DataBrixoSPS (%)L*Dry Matter (%)Ash (%)Protein (%)Viscosity (mPas)ζ-Potential (mV)Particle Size (µm)
Mean2.4746.4385.404.770.4992.695.35−17.305.348
Std. Dev.1.984.761.991.040.1020.38545.461.802714.88
CV (%)80.2710.262.3421.7420.6014.3396.6910.4250.76
R20.56730.68410.93750.84600.8980.96820.40250.7500.2939
Adj-R20.13450.36830.8950.82040.8810.93640.30290.50050.4123
Pre-R20.32510.52890.6690.77120.8460.84440.07330.00352.363
Adeq Precision4.91096.353413.258317.610521.766118.11186.16968.2112.9147
Table 6. Statistical data for responses to fat-reduced hemp seed milk production.
Responses
Statistical DataBriksoSPS (%)L*Dry Matter (%)Ash (%)Protein (%)Viscosity (mPas)ζ-Potential (mV)Particle Size (µm)
Mean3.2245.9783.876.470.5444.276.71−17.305.348
Std. Dev.1.154.333.831.040.81480.1822.932.822336.64
CV (%)35.769.424.5615.9230.9533.4643.6716.2843.69
R20.86680.58750.81700.94350.77690.8510.86170.39010.4769
Adj-R20.73360.17490.63400.88710.55370.7030.7235−0.21990.0462
Pre-R20.45330.50500.04880.82130.40180.1710.2773−1.44671.2227
Adeq Precision8.00224.62649.110415.66646.70209.88210.84213.91263.5553
Table 7. ANOVA results for each response of full-fat hemp seed milk.
Responses Sun of SquaresdfMean SquareF-Valuep-Value
BrixModel72.17145.161.310.3097Not significant
Residual55.06143.93
Lack of Fit42.15104.211.310.4290Not significant
Pure Error12.9143.23
Cor Total127.2328
SPS (%)Model687.751449.132.170.0802Not significant
Residual317.521422.68
Lack of Fit247.971024.801.430.3914Not significant
Pure Error69.55417.39
Cor Total1005.2728
L*Model835.331459.6715.00<0.0001Significant
Residual55.68143.98
Lack of Fit49.54104.953.230.1348Not significant
Pure Error6.1341.53
Cor Total891.0128
Dry matter (%) Model141.91435.4832.97<0.0001Significant
Residual25.83141.08
Lack of Fit23.11101.161.700.3251Not significant
Pure Error2.7240.6796
Cor Total167.7428
ASh (%)Model2.2540.563253.23<0.0001Significant
Residual0.2539240.0106
Lack of Fit0.2300200.01151.920.3059Not significant
Pure Error0.023940.0060
Cor Total2.5128
Protein (%)Model63.33144.5230.45<0.0001Significant
Residual2.08140.1485
Lack of Fit1.65100.16501.540.3602Not significant
Pure Error0.429140.1073
Cor Total65.4128
Viscosity (mPas)Model481.784120.454040.0121Significant
Residual715.182429.80
Lack of Fit714.082035.70130.840.0001Significant
Pure Error1.0940.2729
Cor Total1196.9628
Particle Size (µm)Model4.294 × 107143.067 × 1060.41620.9437Not significant
Residual1.032 × 108147.371 × 106
Lack of Fit7.867 × 107107.867 × 1061.280.4365Not significant
Pure Error2.452 × 10746.130 × 106
Cor Total1.461 × 10828
ζ-potential (mV)Model136.59149.763.000.0242Significant
Residual45.47143.25
Lack of Fit26.29102.630.540.7991Not significant
Pure Error19.1844.80
Cor Total182.0628
Table 8. ANOVA results for each response of fat-reduced hemp seed milk.
Responses Sun of SquaresdfMean SquareF-Valuep-Value
BrixModel120.59148.616.510.0006Significant
Residual18.53141.32
Lack of Fit11.22101.120.61430.7579Not significant
Pure Error7.3141.83
Cor Total139.1228
SPS (%)Model373.411426.671.420.2585Not significant
Residual262.231418.73
Lack of Fit130.31013.030.3950.8935Not significant
Pure Error131.93432.98
Cor Total635.6428
L*Model914.811465.344.460.0042Significant
Residual204.931414.64
Lack of Fit203.491020.3556.630.0007Significant
Pure Error1.4440.3593
Cor Total1119.7428
Dry matter (%) Model247.97417.7116.71<0.0001Significant
Residual14.84141.06
Lack of Fit5.66100.84840.24700.9401Not significant
Pure Error9.1742.29
Cor Total262.8128
Ash (%)Model2.67140.1905.750.0012Significant
Residual0.464140.0331
Lack of Fit0.4451100.04459.40.0224Not significant
Pure Error0.018940.0047
Cor Total3.1328
Protein (%)Model124.89148.923.230.0180Significant
Residual38.68142.87
Lack of Fit34.41103.233.220.1356Not significant
Pure Error4.2841.07
Cor Total163.5728
Viscosity (mPas)Model749.16453.516.230.0008Significant
Residual120.20248.59
Lack of Fit104.942010.492.750.1708Significant
Pure Error15.2643.81
Cor Total869.3628
Particle Size (µm)Model6.969 × 107144.978 × 1060.91170.5674Not significant
Residual7.644 × 107145.460 × 106
Lack of Fit4.893 × 107104.893 × 1060.71130.6992Not significant
Pure Error2.751 × 10746.878 × 106
Cor Total1.461 × 10828
ζ-potential (mV)Model71.02145.070.63950.7934Not significant
Residual111.05147.93
Lack of Fit64.79106.480.56030.7916Not significant
Pure Error46.26411.56
Cor Total182.0628
Disclaimer/Publisher’s Note: The statements, opinions and data contained in all publications are solely those of the individual author(s) and contributor(s) and not of MDPI and/or the editor(s). MDPI and/or the editor(s) disclaim responsibility for any injury to people or property resulting from any ideas, methods, instructions or products referred to in the content.

