Article

Market Clearing Optimization of Auxiliary Peak Shaving Services with Participation of Flexible Resources

1
State Grid Sichuan Economic Research Institute, Chengdu 610041, China
2
Department of Economic Management, North China Electric Power University, Baoding 071003, China
*
Author to whom correspondence should be addressed.
Processes 2026, 14(4), 599; https://doi.org/10.3390/pr14040599
Submission received: 13 January 2026 / Revised: 2 February 2026 / Accepted: 5 February 2026 / Published: 9 February 2026

Abstract

Amid China’s pursuit of the “dual carbon” goals, the development and large-scale integration of renewable energy have become a core pillar of the power system transition. However, the intermittency and uncontrollability of wind and photovoltaic (PV) power have intensified peak-regulation conflicts after large-scale grid integration. Traditional coal-fired units lack sufficient flexibility to accommodate renewable energy fluctuations, while their willingness to participate in deep peak shaving remains low due to high associated costs. Addressing these challenges requires both enhanced system-level peak-regulation flexibility and effective market incentives for thermal units. Motivated by the limitations of existing studies that often consider individual flexibility resources or deterministic market mechanisms in isolation, this study investigates a coordinated multi-resource peak-regulation framework combined with an optimized market-clearing mechanism for deep peak-shaving ancillary services. First, flexibility resources are classified, and the peak-regulation mechanisms of source–load–storage coordination and auxiliary service markets are analyzed. Second, a wind–PV–thermal–storage operation cost model is established, followed by a two-layer peak-regulation market-clearing model that explicitly accounts for wind–PV uncertainty. The upper-level model minimizes total system operating costs through the coordinated dispatch of demand response and energy storage, while the lower-level model minimizes power purchase costs under a unified marginal clearing price. In addition, an uncertainty modeling framework based on Information Gap Decision Theory (IGDT) is introduced to manage renewable generation uncertainty and support decision-making under different risk preferences. Case studies are conducted to verify the effectiveness of the proposed framework. The results show that: (1) synergistic peak shaving through energy storage and demand response reduces the system peak–valley difference from 460 MW to 387.87 MW and decreases wind–PV curtailment costs from 355,000 yuan to 15,700 yuan, thereby alleviating thermal unit pressure and improving renewable energy accommodation; (2) the unified marginal clearing price mechanism reduces total system operating costs by 41.07% and significantly lowers the frequency of deep peak shaving for thermal units, enhancing their participation willingness; and (3) the IGDT-based model effectively addresses wind–PV uncertainty by providing optimistic and pessimistic scheduling strategies under different deviation coefficients. These results confirm that the proposed framework offers an effective and flexible solution for coordinated peak shaving in power systems with high renewable energy penetration.

1. Introduction

At this pivotal stage of advancing China’s dual carbon strategy—achieving peak carbon emissions by 2030 and carbon neutrality by 2060—the large-scale development and grid integration of renewable energy sources such as wind and solar power have become the core pillar and inevitable pathway for energy structure transformation [1]. However, the inherent intermittency, volatility, and unpredictability of such energy sources have led to increasingly prominent challenges in peak-load regulation and supply–demand imbalances within the power system. Conventional coal-fired power units, constrained by technical output limitations, face significant cost pressures during deep peak shaving, including increased fuel consumption and accelerated equipment wear. Consequently, their capacity for peak shaving and willingness to participate are markedly insufficient, rendering them inadequate to meet integration demands following the high-proportion grid connection of new energy sources. Against this backdrop, the National Energy Administration jointly issued policy documents, including the Guiding Opinions on Strengthening Grid Peak-Shaving Energy Storage and Intelligent Dispatch Capability Development [2]. These explicitly call for advancing flexibility upgrades of coal-fired units, elevating demand-side response levels to over 5% of peak load, and establishing a market-oriented development framework for new energy storage. This provides clear policy direction for optimizing peak-shaving ancillary service market mechanisms and upgrading resource allocation.
Existing research on flexibility resources participating in peak shaving exhibits significant limitations: firstly, most studies focus on the dispatch optimization of single-type flexibility resources, lacking mechanism design and coupling analysis for the coordinated participation of multi-side resources in peak shaving [3]; secondly, traditional uncertainty handling methods rely on explicit probability distribution or membership function assumptions, making them ill-suited to effectively accommodate the complex characteristics of fluctuating wind and solar power generation [4]; and thirdly, the clearing mechanisms of peak-shaving ancillary service markets are inadequately aligned with the cost characteristics of flexible resources, failing to establish a unified coordination framework that balances economic efficiency and fairness [5]. How to design market mechanisms to incentivize the collaborative peak shaving of multiple flexible resources, and how the unified marginal clearing price affects system operating costs and thermal power peak shaving frequency, without relying on probability distribution, quantifying the impact of renewable energy uncertainty on peak shaving costs has become a key issue to be solved.
Addressing the identified research gaps, this paper investigates a peak-shaving ancillary service market-clearing mechanism that incorporates the coordinated participation of multi-sided flexible resources. This study focuses on improving the flexibility of power system peak shaving and incentivizing the participation of thermal power units. It constructs a dual-layer market-clearing optimization model that considers the collaborative participation of multiple flexible resources and proposes a market mechanism based on a unified marginal clearing price to enhance resource-allocation efficiency and willingness to participate in thermal power generation. The use of information gap decision-making theory to deal with the uncertainty of wind and solar power output provides scheduling strategies for decision-makers with different risk preferences, which has important theoretical value and practical significance. The research results not only fill the research gap in the coupling of multi-flexible resource coordination peak-shaving and market-clearing mechanisms, but also provide a theoretical basis and methodological reference for the optimization and scheduling of new power systems, and significantly improve the integration capacity of renewable energy and the efficiency of peak shaving auxiliary service markets. This provides a practical and feasible approach for the transformation of China’s energy structure and the safe and economic operation of the power system.
The main contributions of this paper are summarized as follows:
(1)
This paper proposes a coordinated peak-regulation framework that links the marginal contribution of generation-, load-, and storage-side flexible resources to peak-regulation capacity demand and subsequent market-clearing outcomes, rather than treating them solely as parallel dispatch variables.
(2)
This paper incorporates Information Gap Decision Theory (IGDT) into the determination of peak-regulation capacity demand, so that wind and photovoltaic uncertainty directly influences the required depth of peak shaving, rather than being handled solely through dispatch-stage uncertainty modeling.
(3)
This paper develops a unified marginal clearing price mechanism under IGDT-derived uncertainty sets, through which renewable uncertainty is explicitly transmitted to both clearing quantities and marginal prices in the peak-regulation market.
The rest of this paper is organized as follows: Section 2 reviews the current state of relevant research. Section 4 constructs a multi-source coordinated peak-shaving cost model accounting for unit flexibility upgrades. Section 5 develops a peak-shaving ancillary service clearing model considering wind and solar uncertainty. Section 6 presents case study analyses. Section 7 provides a comprehensive discussion of the results and implications.

2. Literature Review

2.1. Flexible Resources Participating in Peak-Shaving Auxiliary Services Markets

Existing research on flexible resources participating in peak-shaving ancillary service markets, both domestically and internationally, has primarily focused on four categories: demand-side resources, generation-side resources, energy storage resources, and grid-side resources. Demand-side flexible resources have been extensively studied through demand response (DR) mechanisms, which aim to achieve peak shaving and valley filling by leveraging load price elasticity and user participation. Yang et al. [6] developed an uncertainty-aware dispatch model incorporating both generation units and demand-side response resources while considering carbon emission minimization. Zhao et al. [7] proposed a load-side deep peak-shaving cost-sharing mechanism based on the Shapley value method to allocate responsibilities among participants. Meng et al. [8] established a rural residential energy consumption simulation model to analyze winter demand response peak-shaving strategies in Shaanxi Province. Typical demand-side flexible resources considered in existing studies include electric vehicles (EVs) [9,10,11,12], temperature-controlled loads [13], and high-energy-consumption loads [14].
Generation-side flexible resources have also received considerable attention, including hydropower [15,16], thermal power units [17,18,19], wind power [19], photovoltaic (PV) generation [20,21,22], and nuclear power [23,24]. Wang et al. [19] examined the economic feasibility of deep peak-shaving retrofits for thermal power units using an enhanced Invasive Weed Optimization (IWO) algorithm and showed that participation risk increases with deeper peak-shaving levels. Fang et al. [20] proposed a multi-time-scale rolling peak-shaving optimization model that coordinates generation resources with different response speeds and demand response resources, utilizing the fast response of concentrated solar power (CSP) to support system peak shaving.
Energy storage resources constitute another key category of flexible resources in peak-shaving ancillary services, with existing studies mainly focusing on pumped storage [25,26], electrochemical energy storage [27], and battery energy storage systems [28,29]. Zhang et al. [26] proposed a market compensation mechanism for pumped storage participating in peak-shaving ancillary services to reduce peak-shaving costs and alleviate the burden on thermal power units. Zeenat Hameed et al. [29] investigated the commercial participation of battery energy storage systems in Nordic ancillary service markets and discussed their market value and participation strategies.
Grid-side flexible resources have primarily been studied in cross-regional interconnected power grids [30], microgrids [31,32,33], and flexible transmission technologies [34]. Zhai et al. [34] incorporated the operational flexibility of back-to-back HVDC into a unit commitment framework to enhance renewable energy integration and peak-shaving capability. Wang et al. [32] addressed peak-shaving challenges in renewable-dominated microgrids by establishing a mathematical model to identify and prioritize generating units based on their regulation capacity.
Overall, existing studies provide a comprehensive understanding of individual flexible resources participating in peak-shaving ancillary service markets. However, most research focuses on single-type resources or operational optimization, while coordinated participation mechanisms that integrate multiple flexible resources and reflect their combined effects in market-clearing remain limited.

2.2. Uncertainty Modeling

With the increasing penetration of renewable energy, uncertainty modeling has become a central issue in coordinated dispatch and peak-shaving analysis. Wind and solar power exhibit strong randomness and intermittency, leading to frequent deviations between scheduled plans and actual operating conditions [35]. To address these challenges, existing studies mainly employ fuzzy optimization, stochastic optimization, and robust optimization methods.
Fuzzy optimization has been applied to describe uncertainty through membership functions and risk-based reserve requirements [36] and has been extended to integrated energy system dispatch [37] and electricity–gas coupled systems [38]. While these approaches are flexible in representing multiple uncertainty sources, their effectiveness strongly depends on the selection of membership functions, which may inadequately capture the inherent randomness of wind and solar power [37,39].
Stochastic optimization explicitly models uncertainty through probabilistic scenarios and has been widely used in multi-stage dispatch problems involving hydropower, wind, and photovoltaic generation [40,41]. Despite its strong theoretical foundation, stochastic optimization requires a large number of scenarios generated by methods such as Monte Carlo simulation [42] or Latin hypercube sampling [43], resulting in a high computational burden and strong dependence on data availability [44,45].
Robust optimization avoids probabilistic assumptions by constructing uncertainty sets and seeking solutions that remain feasible under worst-case conditions [46]. Applications include virtual power plant operation [47] and distributionally robust models for photovoltaic uncertainty [48]. However, the emphasis on worst-case scenarios often leads to overly conservative solutions and may underestimate system flexibility under typical operating conditions [49].
In the context of peak-shaving ancillary service markets, uncertainty modeling is commonly applied at the dispatch or operational planning level and often considers flexible resources in isolation. Moreover, traditional uncertainty modeling approaches rely on probabilistic distributions, membership functions, or deterministic uncertainty bounds, which are difficult to specify under Knightian uncertainty. Information Gap Decision Theory (IGDT), proposed by Yakov Ben-Haim et al., offers an alternative by characterizing uncertainty through deviation ranges without requiring probabilistic assumptions, and has shown potential for addressing complex uncertainties in power system operation and electricity markets [50].
Based on the above literature, uncertainty plays a critical role in peak-shaving capacity decisions under high renewable penetration. Conventional methods often depend on predefined probabilistic or fuzzy assumptions that are difficult to specify in practice, whereas Information Gap Decision Theory (IGDT) characterizes uncertainty through deviation ranges, making it suitable for peak-shaving decision-making under severe uncertainty. Accordingly, IGDT is adopted in this study.

3. Model Construction Methodology

3.1. Model Construction Objectives

This model aims to systematically address the core issues of insufficient peak-shaving capacity and misaligned market incentives within power systems operating under high renewable energy integration. Its objective is to develop an integrated analytical framework capable of synergistically optimizing physical operations and market-clearing, thereby quantitatively evaluating the economic viability and systemic value of diverse flexibility resources participating in peak-shaving ancillary service markets.
Specifically, the model endeavors to: (1) simulate and optimize the coordinated dispatch and economic clearing process of generation-load-storage resources within the day-ahead market environment; (2) provide quantifiable risk and decision-selectable dispatch and clearing solutions under the constraints of renewable energy output uncertainty; (3) Exploring market signals that effectively incentivize participation from diverse resources—particularly novel flexibility resources—through a unified marginal clearing price mechanism. Ultimately, the model aims to furnish market designers, system operators, and investors with a decision-support tool that combines theoretical rigor with practical guidance.

3.2. Model Research Methodology

To achieve the aforementioned objectives, four key research methodologies were comprehensively applied:
(1)
Economic Modeling Approach: Mathematical models reflecting the physical operational constraints and commercial cost structures of thermal power, wind power, photovoltaic power, and energy storage were constructed separately. Notably, a segmented linearization cost function for peak-shaving was established for thermal power units to precisely characterize their economic properties across different operational intervals.
(2)
Two-layer optimization and market simulation methodology: A two-layer optimization framework based on principal–agent game theory is established, in which the upper-level model determines optimal peak-shaving demand by minimizing total system operating costs, while the lower-level model minimizes electricity procurement costs to simulate a competitive market-clearing process under a unified marginal price, thereby capturing the feedback effects of market mechanisms on physical operations.
(3)
Information Gap Decision Theory–based uncertainty modeling: A non-probabilistic uncertainty modeling approach based on IGDT is adopted to characterize wind and photovoltaic uncertainty, avoiding reliance on probability distributions or fuzzy membership functions. By defining IGDT uncertainty sets, the model generates dispatch schemes under both risk-averse and opportunity-seeking strategies, providing multi-perspective decision support.
(4)
Mathematical programming formulation and solution method: The proposed framework is ultimately formulated as a mixed-integer linear programming (MILP) problem, enabling efficient and reliable numerical solution using standard optimization solvers.

3.3. Model Applicability and Limitations

The construction and application of this model are subject to explicit boundary conditions, with its validity predicated upon specific assumptions regarding the operational realities of power systems and market environments. The model is primarily applicable within settings where a deep peak-shaving ancillary service market has been established and operates in synergy with a spot market, and where market participants exhibit rational behavior. It is particularly adept at handling scenarios involving significant Knightian uncertainty in renewable energy generation. Within this framework, the model delivers a day-ahead market-clearing optimization solution based on a unified marginal price for multi-resource systems incorporating flexibility-upgraded thermal power, energy storage, and price-responsive demand response.
However, the model’s explanatory power and applicability face inherent limitations: firstly, its uncertainty analysis focuses solely on the generation side, failing to integrate load-side uncertainty for a more comprehensive ‘source-load’ risk coupling assessment; Secondly, the model’s temporal scope is concentrated on the day-ahead phase, neglecting the dynamic integration with intraday and real-time markets across multiple time scales. Furthermore, the characterization of demand-side resources primarily relies on price-based response, failing to encompass incentive-based responses and the complex interaction patterns of emerging flexible resources such as electric vehicles. Finally, the model’s conclusions exhibit significant sensitivity to input parameters, necessitating broader validation and sensitivity analysis under diverse resource endowments and market designs to establish its universality. These limitations objectively define the current model’s capability boundaries while simultaneously pointing towards directions for future research deepening and expansion.

4. Multi-Source Coordinated Peak-Shaving Cost Model Incorporating Flexible Unit Retrofits

Existing research has primarily focused on analyzing peak shaving costs for single resource types, lacking systematic modeling of flexibility upgrades for thermal power units and multi-energy coordinated peak shaving. To address these issues, this section constructs a multi-flexible resource peak shaving cost model encompassing thermal power units, wind power, photovoltaics, and battery energy storage systems (BESS): Firstly, it analyses the coupled relationships between investment costs, fuel costs, lifetime depreciation costs, oil injection costs, and environmental costs following flexibility upgrades to thermal power units; Secondly, operational maintenance cost models for wind and solar power, alongside curtailment penalty cost models, are developed, complemented by operational maintenance and cyclical lifespan depreciation cost models for BESS. Finally, a multi-resource coordinated peak shaving cost calculation framework is established, providing theoretical underpinnings for subsequent optimal resource allocation within power systems.

4.1. Thermal Power Units

4.1.1. Flexibility Retrofitting for Thermal Power Units

The investment cost for flexibility retrofitting of a thermal power unit is calculated as the product of the unit investment cost and the difference in the minimum technical output before and after retrofitting. The calculation formula is as follows:
C 1 = k ( P m i n P m i n )
where k represents the cost for flexibility retrofitting for thermal power units; P m i n represents the minimum technical output of the unit after retrofitting.

4.1.2. Fuel

The fuel cost of a thermal power unit during the deep peak shaving phase is the same as that during the conventional peak shaving phase, as shown in the following formula:
C 2 = t = 1 T i = 1 N a P i , t 2 + b P i , t + c
where a , b , c are the fuel cost coefficients of the thermal power unit.

4.1.3. Life Degradation

After flexibility retrofitting, during the deep peak-shaving phase of the thermal power unit, deep output reduction leads to excessive thermal stress on the unit’s rotor shafting. This increases the risk of unit damage, such as deformation and fracture, resulting in degradation costs. The degradation cost is calculated using the method for calculating deep peak shaving degradation cost of thermal power units proposed in existing literature, as shown in the following formulas:
C 3 = t = 1 T i = 1 N ρ S i 2 N e ( P i , t )
N e ( P i , t ) = t = 1 T i = 1 N 0.0005778 P i , t 3 2.682 P i , t 2 + 484 P i , t 8411
where ρ represents the loss coefficient of the thermal power unit; S i represents the purchase cost of Unit; N e ( P i , t ) represents the rotor cracking cycle times.

4.1.4. Oil Injection

When a thermal power unit enters the oil injection deep peak shaving phase, oil injection is required to maintain stable combustion of the unit. The oil injection cost of the thermal power unit is calculated as follows:
C 4 = t = 1 T i = 1 N Q i , t V o i l
where Q i , t represents the oil consumption rate; V o i l represents the oil price.

4.1.5. Environmental

After the thermal power unit operates with oil injection, the emissions of pollutants increase accordingly, leading to corresponding environmental costs. The calculation formula is as follows:
C 5 = t = 1 T i = 1 N Q o i l δ + C f
C f = x S O 2 Δ S O 2 P S O 2 + x N O 2 Δ N O x P N O x
where C 5 represents the unit pollutant discharge fee for oil combustion; C f represents the additional penalty function when pollutant emissions exceed the specified limit; x S O 2 and x N O 2 , respectively, represent the emission standards of S O 2 and N O x for the thermal power unit during the deep peak shaving phase; Δ S O 2 and Δ N O x , respectively, represent the excess coefficients; P S O 2 and P N O x , respectively, represent the excess penalty amounts.
In summary, the peak shaving cost of a thermal power unit varies with different peak shaving phases. The peak shaving cost is expressed in a piecewise manner, and its formula is as follows:
C = C 1 + C 2 0.5 P max P i , t < P max C 2 + C 3 0.4 P max P i , t < 0.5 P max C 2 + C 3 + C 4 + C 5 0.25 P max P i , t < 0.4 P max

4.2. Wind Turbine (WT) Operation

4.2.1. WT Operation and Maintenance (O&M)

W 1 = t = 1 T ρ W P W , t
where ρ W represents the O&M cost coefficient for WT; P W , t is the actual output of WT at time t.

4.2.2. Wind Curtailment Penalty

W 2 = t = 1 T δ W ( P W , t P W , t )
where δ W represents the wind curtailment penalty coefficient; P W , t represents the predicted output of WT.
In summary, then WT operation cost model is expressed as:
W = W 1 + W 2

4.3. Photovoltaic (PV) Operation

4.3.1. PV O&M

V 1 = t = 1 T ρ V P V , t
where ρ V represents the O&M cost coefficient for PV systems; P V , t is the actual output of PV system.

4.3.2. Solar Curtailment Penalty

V 2 = t = 1 T δ V ( P V , t P V , t )
where δ V represents the solar curtailment penalty coefficient; P V , t represents the predicted output of PV.
In summary, the PV operation cost model is expressed as:
V = V 1 + V 2

4.4. Battery Energy Storage Station (BESS) Operation

4.4.1. BESS O&M

E 1 = t = 1 T E s P c h , t + P d i s , t
where E s represents the unit power charging/discharging cost of BESS; P c h , t and P d i s , t represents the BESS charging/discharging power.

4.4.2. Life Degradation

E 2 = Y t N t t = 1 T M c h , t + M d i s , t 2
where Y t represents the total investment cost of BESS; N t represents the cycle life of BESS; M c h , t and M d i s , t are binary variables representing the BESS charging/discharging state.
In summary, the BESS peak shaving operation cost model is expressed as:
E = E 1 + E 2

5. Peak-Shaving Ancillary Service Clearing Model

This section aims to establish a bilevel clearing optimization model for the peak-regulation ancillary service market that accounts for wind and photovoltaic power uncertainty. The upper-level model minimizes the system operating cost by optimizing deep peak-regulation capacity. The lower-level model is formulated from the grid perspective and minimizes electricity purchasing costs by optimizing the clearing schedules of individual units. To address deviations in peak-regulation costs caused by wind and photovoltaic uncertainty, IGDT is employed to model the uncertainty of wind and photovoltaic power in the upper-level model, thereby constructing a clearing optimization model in which flexible resources participate in the deep peak-regulation ancillary service market under IGDT.

5.1. Upper-Level Model

5.1.1. Objective Function

This section establishes the model by comprehensively considering the minimum cost of various flexible resources, and the objective function is as follows:
min   F =   C   +   W   +   V   +   E
where C represents the operating cost of thermal power units; W represents the operating cost of wind power units; V represents the operating cost of photovoltaic units; E represents the operating cost of energy storage power stations.

5.1.2. Operational Constraints

(1)
Power balance constraint
The sum of output powers of various flexible resources at any given time must satisfy the requirement of power load balance, as shown in the following equation:
i = 1 N P i , t + P W , t + P V , t + P d i s , t P c h , t = L
(2)
Output constraint of thermal power units
  • Constraint of conventional peak-regulating units:
    P i , m i n P i , t P i , m a x
  • Constraint of deep peak-regulating units:
    1 ω μ i , t P i , m i n + ω μ i , t P i , m i n P i , t μ i , t P t , m a x
    where P i , m i n represents the minimum output limit of a thermal power unit under conventional operation; P i , m i n represents the minimum output limit after flexibility retrofitting; P i , m a x represents the maximum output limit of the thermal power unit; μ i , t represents denotes the load ratio of the retrofitted thermal power unit; ω is a binary variable. When ω = 1 , the thermal power unit is retrofitted for flexibility, whereas when ω = 0 , the unit is not retrofitted.
(3)
Thermal power unit ramp constraint
U i P i , t P i , t 1 U i
where U i represents the ramping rate of thermal power unit i .
(4)
WT unit output constraint
0 P W , t P W , t m a x
where P W , t m a x represents the maximum output of WT at time t .
(5)
PV output constraint:
0 P V , t P V , t m a x
where P V , t m a x represents the maximum output of PV at time t .
(6)
Charging and discharging logic constraint of BESS
X c h , t + X d i s , t 1
where binary variables X c h , t and X d i s , t are used to specify the operating state of BESS. When X c h , t = 1 , BESS is in the charging state in time t ; when X d i s , t = 1 , it is in the discharging state.
(7)
Charging and discharging power constraint of BESS
    0 < P c h , t P c h , t max X c h , t 0 < P d i s , t P d i s max X d i s , t
where P c h max represents the maximum charging power of BESS at time t ; P d i s max represents the maximum discharging power of BESS at time t .
(8)
SOC constraint
S O C t = 1 μ S O C t 1 + φ c h P c h , t + P d i s , t φ d i s Δ T S O C m i n < S O C t S O C m a x
where S O C max and S O C min represent the upper and lower bounds of the state of charge (SOC), respectively; S O C t is the state of charge of BESS at time t ; Δ T represents the scheduling step; φ c h and φ d i s represent the charging and discharging efficiencies, respectively.

5.2. Lower-Level Model

5.2.1. Objective Function

min Y = t = 1 T v t B E S S P t B E S S + i = 1 n v i , t f i r e P i , t f i r e
where v i , t f i r e represents the clearing price of deep peak-regulating thermal power unit i at time t; v t B E S S represents the clearing price of BESS at time t; P i , t f i r e represents the optimized clearing plan of deep peak-regulating thermal power unit i at time t; P t B E S S represents the optimized clearing plan of BESS at time t.

5.2.2. Operational Constraints

(1)
Capacity constraint
P i , t fire + P t BESS = P T , t
where P T , t represents the optimized deep peak-regulating capacity obtained from the upper-level model.
(2)
Bid price constraint
v min v i fire v max v min v i BESS v max
v i , t fire P i , t fire C i , t fire v t BESS P t BESS E t BESS
where v m i n and v m a x represent the lower and upper limits of the declared unified marginal clearing prices, respectively; C i , t f i r e represents the cost of thermal power unit i at time t; E t B E S S represents the cost of BESS at time t.
(3)
Charging and discharging logic constraint of BESS
X c h , t + X d i s , t 1
(4)
Charging and discharging power constraint of BESS
0 < P c h , t P c h , t max X c h , t 0 < P d i s , t P d i s max X d i s , t
(5)
SOC constraint
S O C t = 1 μ S O C t 1 + φ c h P c h , t + P d i s , t φ d i s Δ T S O C m i n < S O C t S O C m a x
(6)
Thermal power unit ramp constraint
U i P i , t fire P i , t 1 fire U i

5.3. I GDT-Based Minimum System Operating Cost Model

5.3.1. Uncertainty Modeling of WT and PV Outputs

This section employs an envelope-constrained model to construct an uncertainty set model, the mathematical expression of which is as follows:
U ( α * , H ¯ ) = { | H ( t ) H ¯ ( t ) | τ h ( t ) }
where H ¯ t denotes the forecast value of the uncertain variable, which in this study refers to WT and PV outputs; H t represents the actual value of the uncertain variable; h t is a deterministic function; U α * , H ¯ represents the fluctuation range and τ denotes the degree of variation in the uncertain variable.
Let h t = H ¯ t , the uncertainty of WT and PV outputs can therefore be described as follows:
U ( α * , P W , t ) = { | P W , t P W , t | α * | P W , t | }
U ( β * , P V , t ) = { | P V , t P V , t | β * | P V , t | }
where α * represents the fluctuation magnitude of WT output; β * represents the fluctuation magnitude of PV output.
From the above equation, the following conclusion can be deduced:
( 1 α ) P W , t P W , t ( 1 + α ) P W , t
( 1 β ) P V , t P V , t ( 1 + α ) P V , t
( 1 α * ) P W , t P W , t ( 1 + α * ) P W , t
( 1 β * ) P V , t P V , t ( 1 + β * ) P V , t
In the absence of uncertainty, when α * = β * = 0 , The power system dispatch model under discussion is a deterministic model, which has the capability of calculating the dispatch cost at a given time, otherwise referred to as the base cost, record as F 0 .

5.3.2. IGDT-Based Peak-Regulating Model

This section develops a differentiated optimization framework based on IGDT. For decision-makers with a risk-averse preference, a robustness optimization model (RM) is established to formulate a risk-avoidance dispatch strategy. For decision-makers with a risk-seeking preference, an opportunity model (OM) is constructed to obtain an opportunity-capturing dispatch scheme. This section simultaneously accounts for the uncertainty in WT and PV outputs by integrating them through a weighted sum. Assuming both have equal weighting coefficients of 1, the combined uncertainty of wind and solar power is expressed as follows:
γ * = k 1 α * + k 2 β *
where γ * represents the combined uncertainty of WT and PV outputs; k 1 and k 2 are WT and PV power fluctuation weighting coefficient.
The impact of renewable energy output uncertainty on thermal power peak shaving is closely related to generation volume, meaning that higher generation volumes carry greater weigh. Therefore, the weighting method employed in this section is of a linear nature, with the purpose of calculating the weights for WT and PV.
k 1 = t = 1 T P W , t t = 1 T ( P W , t + P V , t )
k 2 = t = 1 T P V , t t = 1 T ( P W , t + P V , t )
(1)
Risk Avoidance Strategy
The purpose of this strategy is to obtain the corresponding uncertainty under the condition that the decision-making cost does not exceed the expected value. The larger its value, the stronger the risk avoidance capability; however, the corresponding dispatch cost will increase accordingly. Dispatch decision-makers gain risk avoidance capability at the cost of higher dispatch costs, which reflects the robustness of IGDT. This paper sets the dispatch cost deviation parameter as Δ1 and uses (1 + Δ1)F0 to represent the decision-makers’ expected cost. The IGDT-based peak-regulating model under the risk avoidance strategy is established as follows:
M a x   γ α * = k 1 α * + k 2 β *
s t . max F ( 1 + Δ 1 ) F 0 P w , t U ( α * , P w , t ) P v , t U ( β * , P v , t ) α * 0 β * 0
The above formula belongs to a bi-level programming model. The lower level specifies that when the actual WT output P W , t and actual PV output P V , t fluctuate within the uncertainty set, the resulting dispatch cost shall not exceed the expected cost. The upper level represents the maximum uncertainty under the condition that the lower-level constraints are satisfied. Since the generation cost of WT and PV units is much lower than that of deep peak-regulating units, when the output of WT and PV units reaches their maximum values while the output of thermal power units drops to the minimum, thermal power units will enter deep peak-regulating the most frequently. Specifically, the deep peak-regulating cost is maximized when P W , t = 1 + α * P W , t and P V , t = 1 + β * P V , t . Based on this, the bi-level programming model can be converted into a single-level optimization model:
M a x   γ α * = k 1 α * + k 2 β *
s t . F ( 1 + Δ 1 ) F 0 i = 1 N P h , i , t + P w , t + P v , t + P E , t = P L P w , t = ( 1 + α * ) P w , t P v , t = ( 1 + β * ) P v , t α * 0 β * 0
The decision solution obtained from the above model exhibits robustness with respect to WT and PV outputs. Specifically, when the WT and PV outputs fluctuate arbitrarily within the ranges P W , t , 1 + α * P W , t and P V , t , 1 + β * P V , t respectively, the decision solution can ensure that the peak shaving cost remains below 1 + Δ 1 F 0 .
(2)
Opportunity-Seeking Strategy
OM targets the minimum uncertainty that enables a reduction in dispatch cost: the larger its value, the greater the risk faced, and the lower the corresponding cost. Dispatch decision-makers seek opportunities to reduce costs amid greater risks, which reflects the opportunistic nature of IGDT. Similarly, by setting the dispatch cost deviation parameter as Δ 2 , the IGDT dispatch model under the opportunity-seeking strategy is derived as follows:
M i n   γ β * = k 1 α * + k 2 β *
s t . min F ( 1 Δ 2 ) F 0 P w , t U ( α * , P w , t ) P v , t U ( β * , P v , t ) α * 0 β * 0
Likewise, the bi-level programming model of the opportunity-seeking strategy can be converted into a single-level optimization model:
M a x   γ β * = k 1 α * + k 2 β *
s t . F ( 1 Δ 2 ) F 0 i = 1 N P h , i , t + P w , t + P v , t + P E , t = P L P w , t = ( 1 α * ) P w , t P v , t = ( 1 β * ) P v , t α * 0 β * 0
The model indicates that when the WT and PV outputs fluctuate arbitrarily within the ranges 1 α * P W , t , P W , t and 1 β * P V , t , P V , t respectively, the decision solution can ensure that the peak shaving cost remains below 1 Δ 2 F 0 .

5.3.3. Economic Interpretation and Practical Selection of IGDT Deviation Parameters

(1)
Economic Interpretation of the IGDT Deviation Parameter Δ
In the IGDT-based formulation, the deviation parameter Δ represents the maximum allowable relative deviation of system operating cost from the deterministic benchmark F 0 . Δ as the cost tolerance margin accepted under renewable generation uncertainty.
In practice, Δ can be quantitatively determined based on explicit budget constraints or dispatch security requirements. From a budgetary perspective, Δ reflects the proportion of additional operating cost that the market organizer is willing to reserve as a hedge against unfavorable renewable output deviations. If the maximum acceptable operating cost is specified as F m a x , Δ can be directly expressed as:
Δ = F m a x F 0 F 0 .
From the security-oriented perspective, Δ characterizes the maximum cost increase required to maintain system feasibility under worst-case renewable fluctuations. Consequently, Δ establishes a transparent linkage between uncertainty tolerance and economic feasibility: a larger Δ corresponds to a more conservative (risk-averse) strategy with higher cost reserves, whereas a smaller Δ reflects an opportunity-seeking strategy prioritizing economic efficiency over robustness.
(2)
Practical Interpretation of Deviation Coefficients Δ1 and Δ2
In the proposed IGDT-based market-clearing framework, the deviation coefficients Δ1 and Δ2 are introduced to characterize asymmetric uncertainty tolerances under different market objectives. Although both parameters follow the same conceptual foundation as Δ, they represent distinct dimensions of market risk tolerance from an operator’s perspective.
Specifically, Δ1 is associated with the robustness-oriented objective, and reflects the maximum relative deviation of operating cost that the system operator is willing to accept in order to guarantee system feasibility under worst-case renewable generation realizations. In practice, Δ1 is selected based on conservative risk management principles, such as strict reliability standards, low tolerance for emergency interventions, or regulatory requirements on secure dispatch. A larger Δ1 corresponds to a more risk-averse strategy, where additional operating costs are intentionally reserved to hedge against severe uncertainty.
In contrast, Δ2 is associated with the opportunity-oriented objective, and represents the maximum relative cost reduction that the operator is willing to pursue by exploiting favorable renewable generation realizations, while still maintaining acceptable operational risk. From a practical standpoint, Δ2 is determined by the operator’s willingness to tolerate higher variability in dispatch outcomes in exchange for potential economic gains. A larger Δ2 therefore reflects a more aggressive, opportunity-seeking strategy that prioritizes economic efficiency over conservative robustness.
Together, Δ1 and Δ2 form a two-sided risk preference representation in the market-clearing process, enabling system operators to explicitly balance reliability and economic efficiency. By adjusting Δ1 and Δ2 according to market conditions, regulatory environments, or operational preferences, the proposed framework provides a transparent and flexible mechanism to align mathematical uncertainty modeling with actual market risk tolerance.

5.4. Model Solution

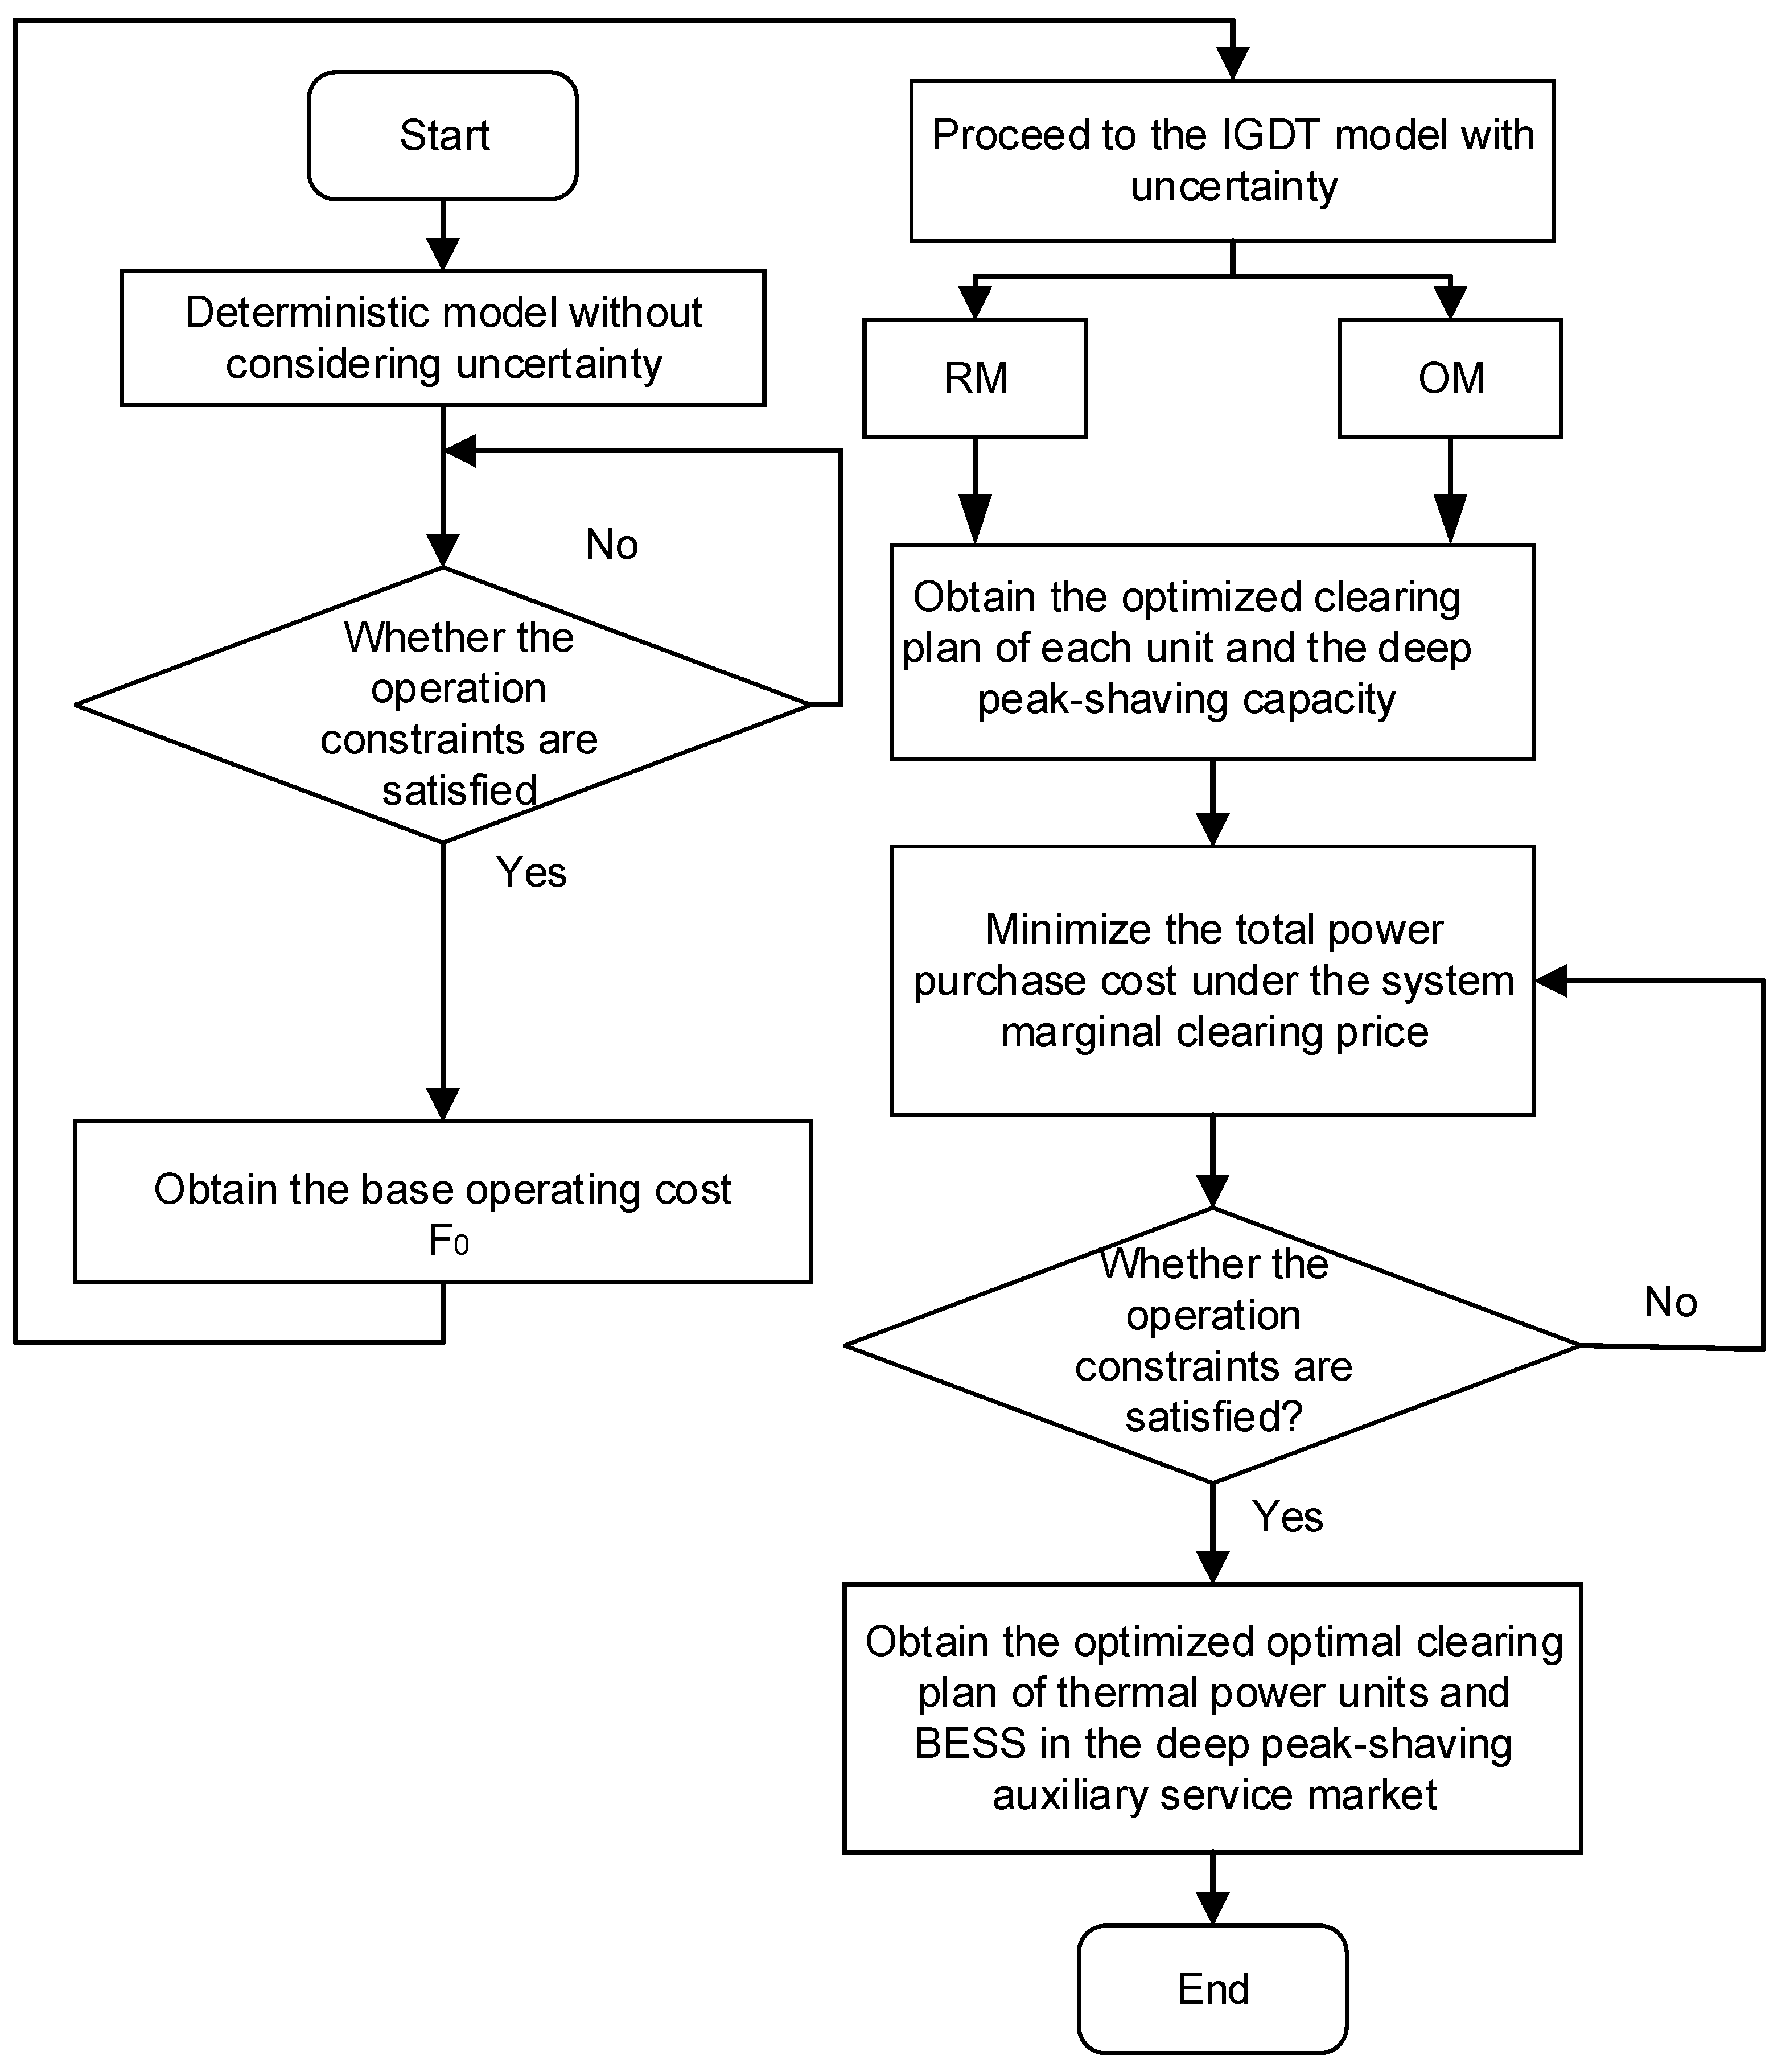
In this study, the optimization problem is solved using the commercial solver CPLEX (12.10.0.0), developed by IBM, which is accessed via the Yalmip toolbox (2023) in MATLAB (R2023a). The detailed solution procedure is illustrated in Figure 1. It should be noted that the proposed market-clearing framework is structurally independent of region-specific characteristics. The model formulation, including the dual-layer clearing mechanism, the coordination of multiple flexibility resources, and the IGDT-based uncertainty treatment, does not rely on assumptions unique to a particular power system. Regional differences—such as renewable penetration levels, demand profiles, auxiliary service prices, and storage costs—are reflected only through input parameters and constraint settings. Therefore, the proposed framework can be adapted to other regions by reconfiguring these parameters without altering the underlying optimization structure.

6. Case Study

To verify the practical applicability of the proposed model, this section conducts an empirical analysis using measured data from scenarios with high wind and photovoltaic penetration. Different scenarios are compared to evaluate peak-regulation costs and assess the model’s effectiveness in reducing grid-side deep peak-regulation electricity purchasing costs. The coordinated dispatch characteristics of wind, photovoltaic, thermal, and storage resources are further analyzed to demonstrate improvements in renewable energy accommodation and thermal unit participation. Although the case study is based on a specific regional dataset, the modeling framework can be extended to systems with different renewable penetration levels, demand patterns, and market structures. For regions with higher renewable penetration, the corresponding wind and PV capacity parameters and forecast uncertainty bounds can be adjusted accordingly. Similarly, different demand profiles can be incorporated by replacing the load time series, while alternative market designs can be accommodated by modifying the clearing constraints. These features ensure that the proposed model is applicable to a wide range of power systems beyond the case study considered.

6.1. Case Study Data

This case study adopts power system data from a specific region for verification, including 4 thermal power units, 1 wind farm, 1 photovoltaic farm, and 1 energy storage station. The relevant parameters of the thermal power units are as follows: Only Units 1 and 2 in the case study undergo flexibility retrofitting. Specifically, the minimum technical output of these units is 0.5 P m a x before retrofitting; after retrofitting, their minimum technical output for deep peak shaving without oil injection is 0.4 P m a x , and 0.25 P m a x for deep peak shaving with oil injection. Units 3 and 4 do not undergo flexibility retrofitting and only participate in conventional peak shaving (with a minimum technical output of 0.5 P m a x ). The technical parameter table of thermal power units and the parameters related to their participation in the deep peak-shaving ancillary service market are presented in Table 1 and Table 2, respectively.
The energy storage station selected in this section is a Battery Energy Storage Power Station (BESS), and its relevant parameters are shown in Table 3.
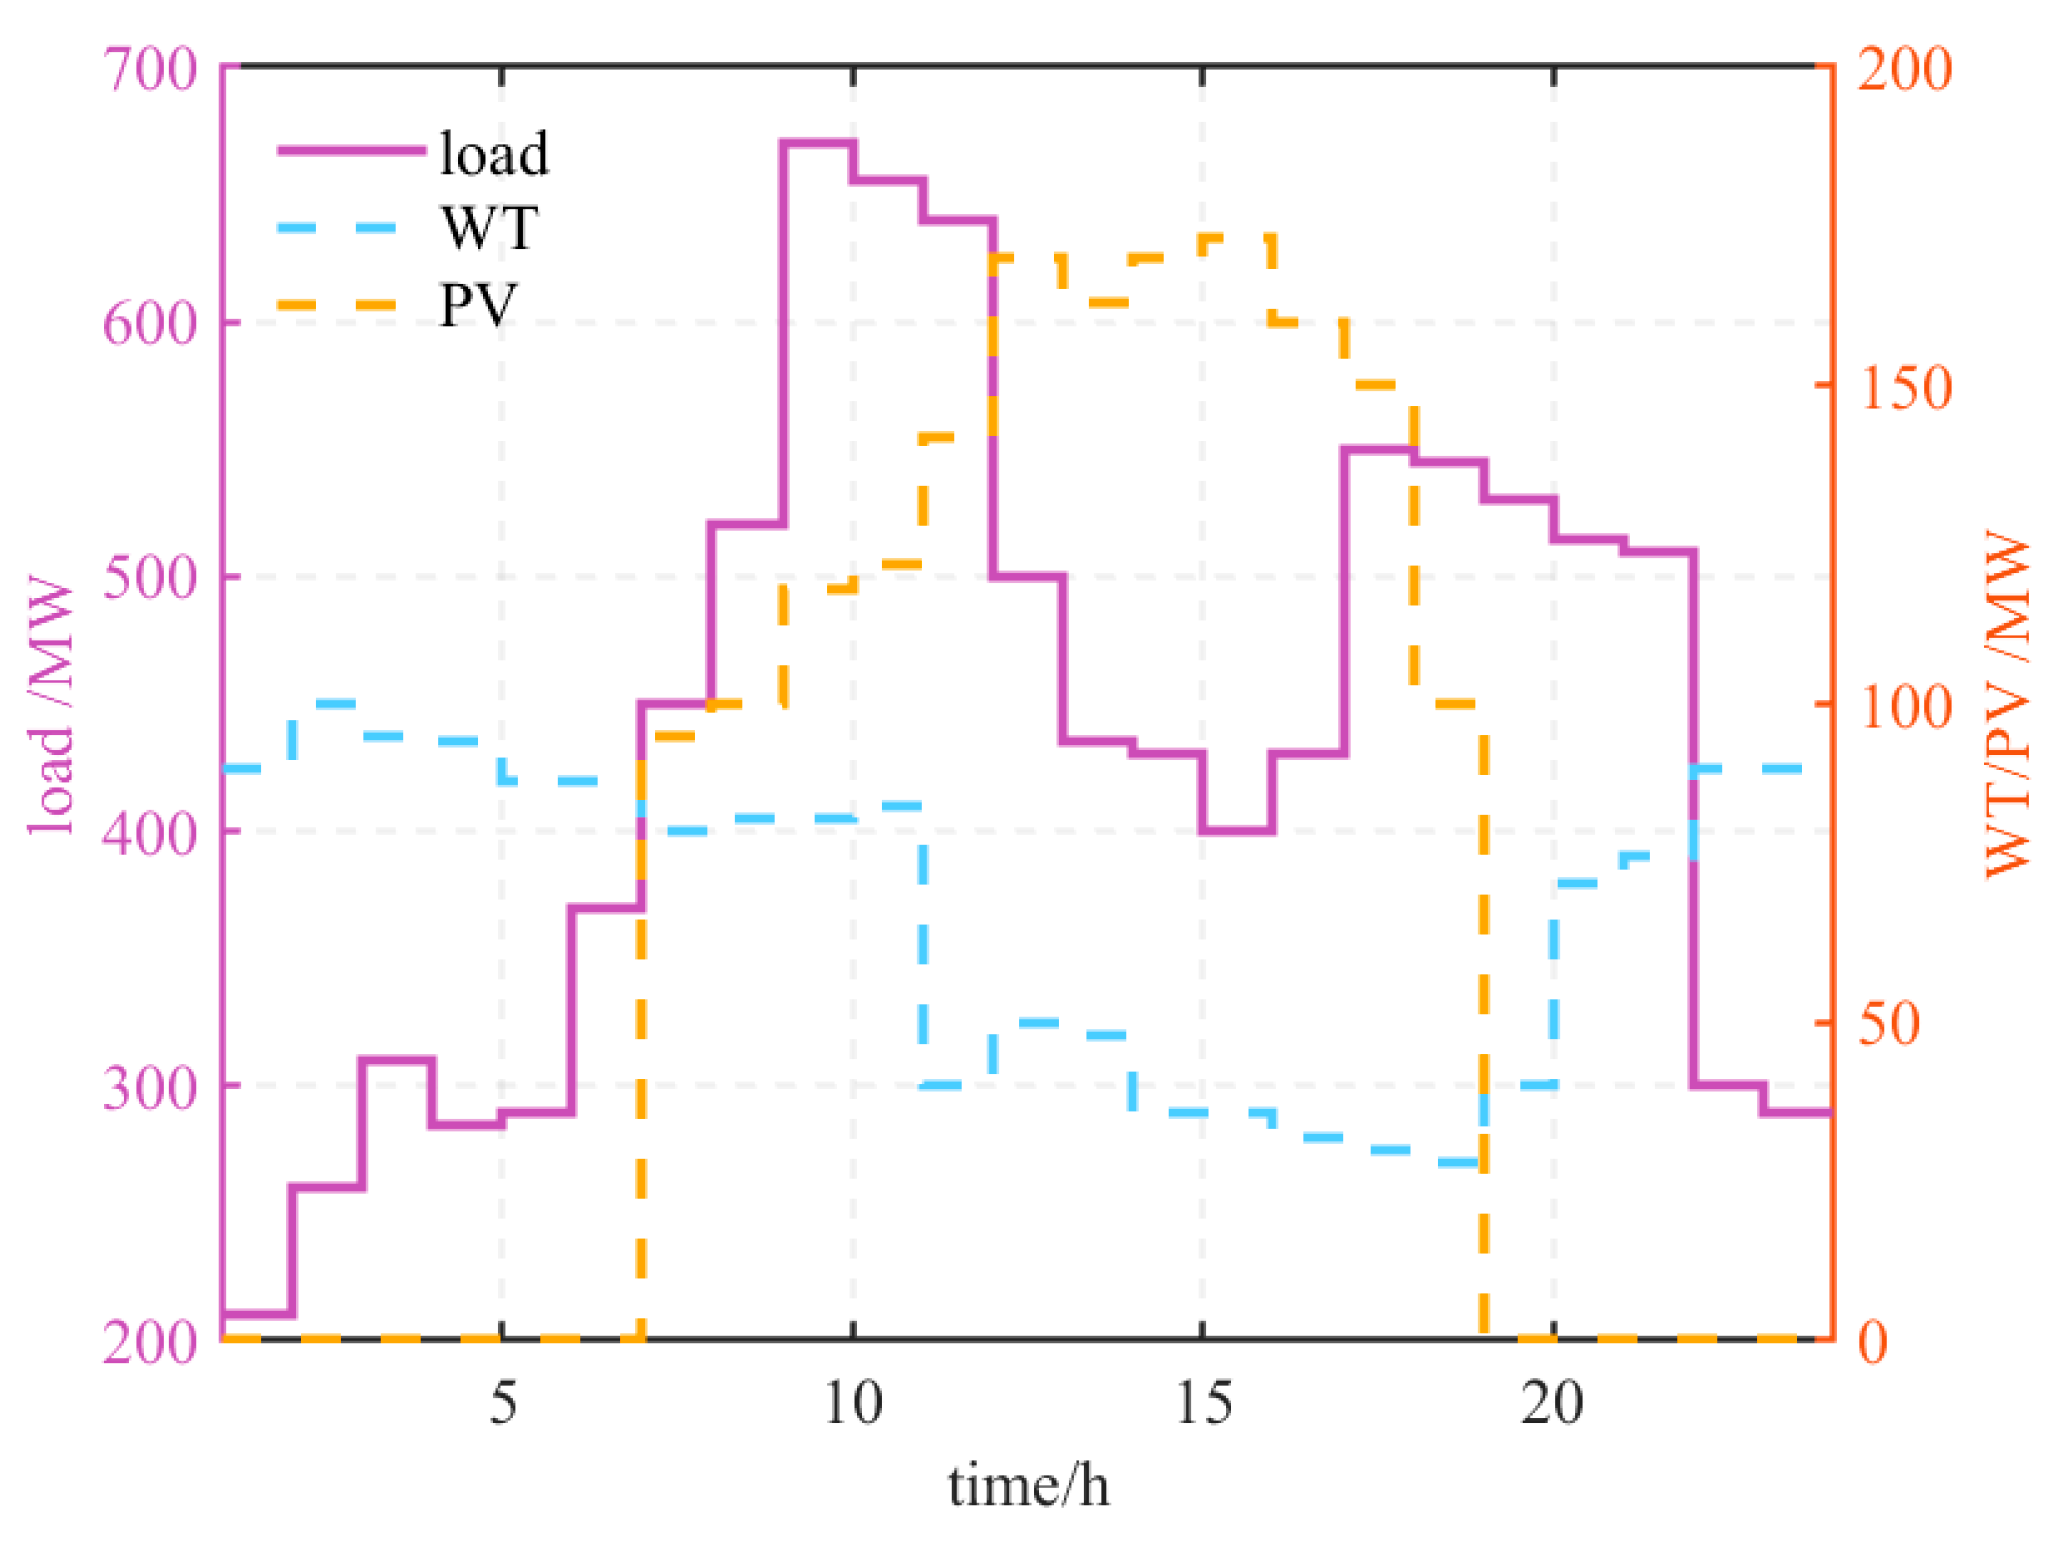
The installed capacity of wind power is 200 MW, and the installed capacity of PV power is 100 MW. The data of wind power, PV power, and load are shown in Figure 2:

6.2. Calculation Results and Analysis

To verify the effectiveness of the model proposed in Section 4, the following comparative scenarios are designed for analysis:
  • Scenario 1: Basic operation strategy, excluding energy storage, demand response, IGDT, and unified marginal clearing price mechanism;
  • Scenario 2: On the basis of Scenario 1, adding demand response and energy storage;
  • Scenario 3: On the basis of Scenario 2, adding the unified marginal clearing price mechanism;
  • Scenario 4: On the basis of Scenario 2, considering the risk avoidance strategy (RM) model;
  • Scenario 5: On the basis of Scenario 4, adding the unified marginal clearing price mechanism;
  • Scenario 6: On the basis of Scenario 2, considering the opportunity-seeking strategy (OM) model;
  • Scenario 7: On the basis of Scenario 6, adding the unified marginal clearing price mechanism.

6.2.1. Deterministic Model Analysis

(1)
Optimization Result Analysis of Demand Response and Energy Storage
The load curve is divided into peak, flat, and valley periods using time-of-use pricing. The electricity price is optimized through price response, and the optimization results are shown in Table 4. After implementing time-of-use pricing, the optimized electricity prices for the system load are 0.92 CNY/(kW·h) during peak periods, 0.54 CNY/(kW·h) during flat periods, and 0.23 CNY/(kW·h) during valley periods.
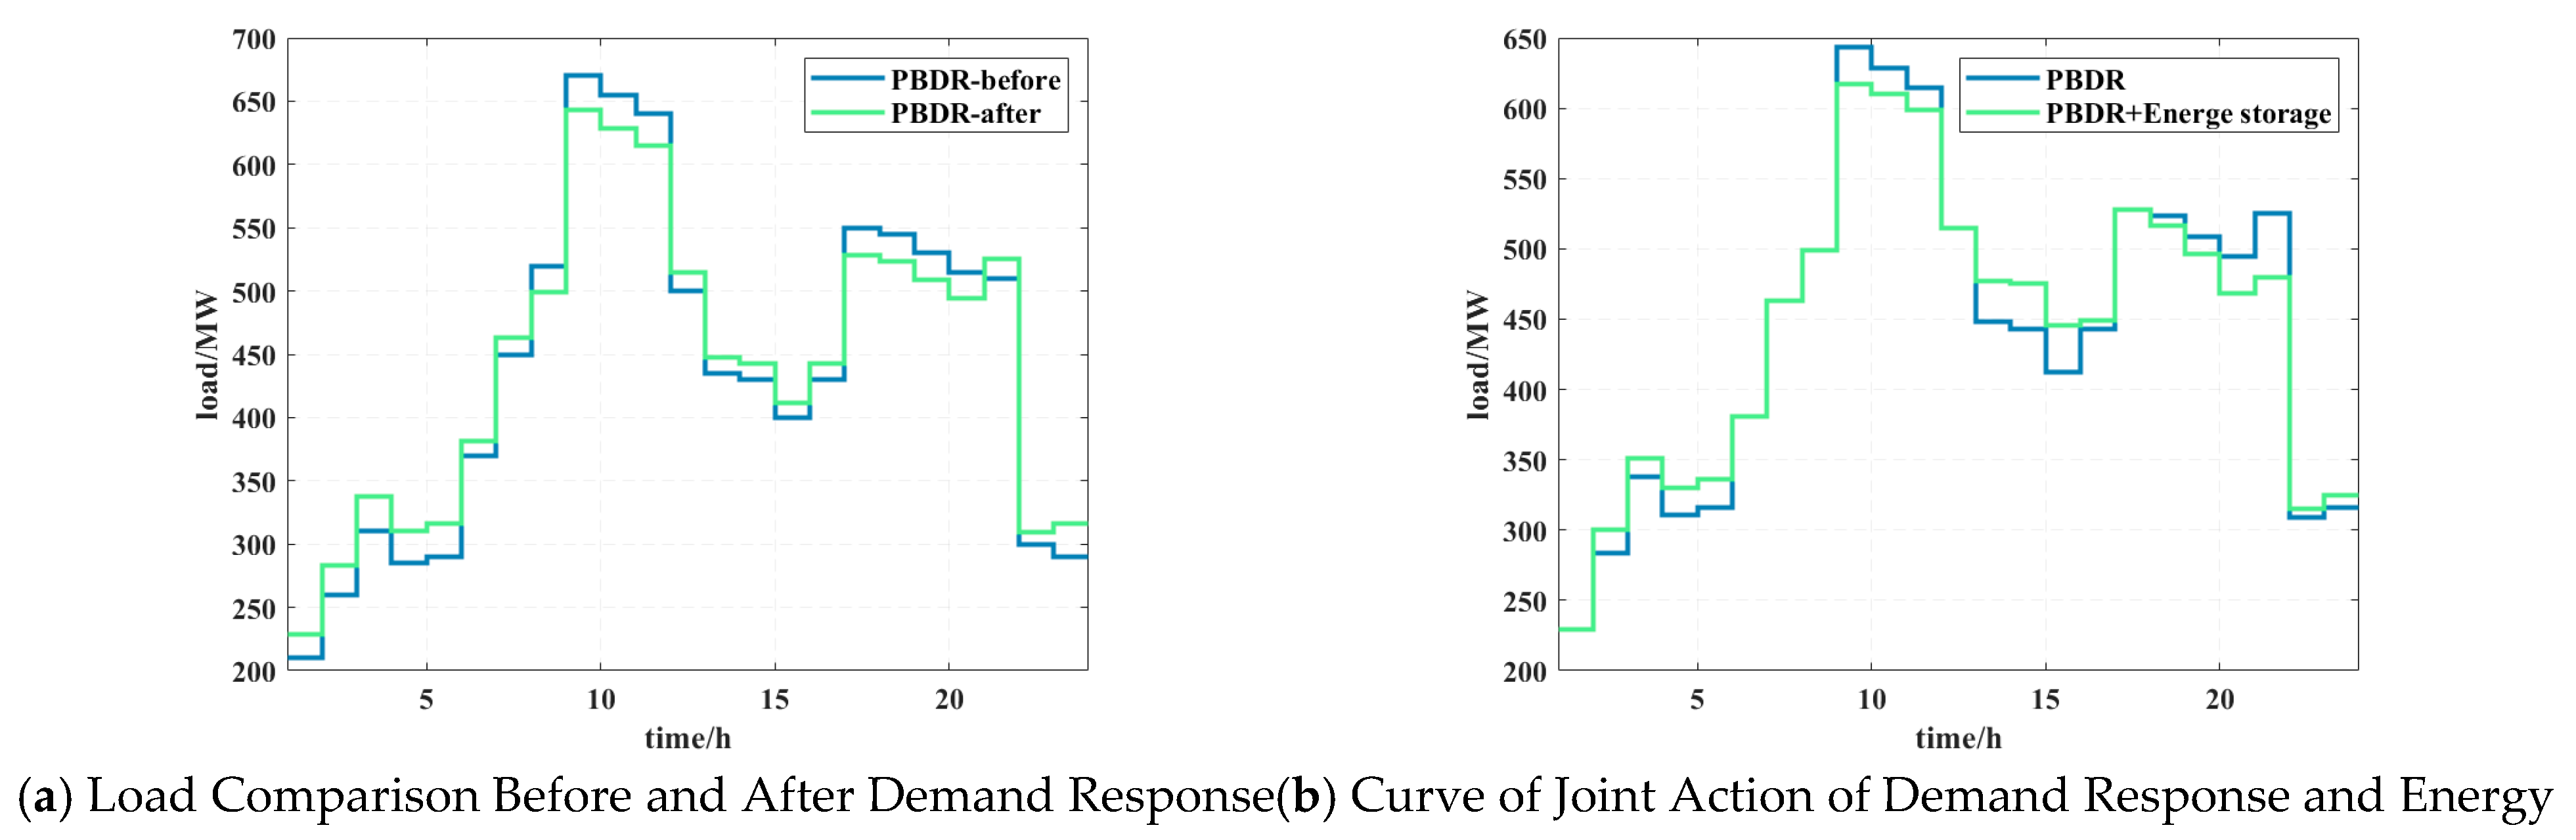
According to the curve comparison in Figure 3a, the load curve before implementing demand response fluctuates significantly, with a peak-to-valley difference of 460 MW. After adding demand response, the load fluctuation amplitude is significantly reduced through price response, and the peak-to-valley difference drops to 414.3 MW (a decrease of 9.93%), with an overall trend tending to be flat. This indicates that the peak-shaving and valley-filling objectives are successfully achieved through the price response mechanism, making the load curve more balanced.
According to the analysis in Figure 3b, after adding energy storage, the peak-to-valley difference in the load curve is further reduced by 6.38%. The continuous reduction in the peak-to-valley difference indicates that under the combined action of energy storage and demand response, the possibility of thermal power units entering deep peak shaving is reduced, which is conducive to the stable operation and resource optimization allocation of the power system, and alleviates the peak shaving pressure of thermal power units.
(2)
Cost Optimization Result Analysis
Scenarios 1 to 3 operate under the deterministic operation strategy, without considering the impact of wind and PV uncertainty fluctuations on the system. After scenario optimization, the relevant costs of thermal power units are shown in Table 5. Compared with Scenario 1, Scenario 2 considers demand response and energy storage, and although 0.64 ten thousand CNY of energy storage cost is incurred, the total system operation cost decreases significantly from 94.58 ten thousand CNY to 48.50 ten thousand CNY. The fuel cost is reduced by 5.91%, and the oil injection and environmental costs are reduced by 32.64%. This indicates that the peak-shaving and valley-filling effects of demand response and energy storage are effectively exerted, which reduces the degree of thermal power units entering deep peak shaving and improves the enthusiasm of thermal power units for peak shaving. In Scenario 1, when the depth of the unit’s deep peak shaving increases, the unit needs to inject fuel to maintain operation, resulting in additional oil injection cost and environmental supplementary cost. At this time, the deep peak shaving cost accounts for the main part of the system operation cost. In Scenario 2, after adding energy storage, its charging/discharging cost and life degradation cost are significantly lower than the thermal power deep peak shaving cost. By using energy storage to charge during load valleys and discharge during load peaks, replacing thermal power unit output with energy storage output can not only achieve deep peak shaving but also effectively reduce the overall system operation cost.
On the basis of Scenario 2, Scenario 3 adds the unified marginal clearing price mechanism. Although the energy storage cost increases due to the increase in energy storage output, the operation cost is further reduced to 28.58 ten thousand CNY (a decrease of 41.08%), and the coal consumption and degradation costs are both reduced. This indicates that the adoption of a unified marginal clearing price can further optimize energy resource allocation, improve system operation efficiency, and alleviate the deep peak shaving cost of thermal power units.
(3)
Optimization Analysis of Wind and Solar Accommodation in Different Scenarios
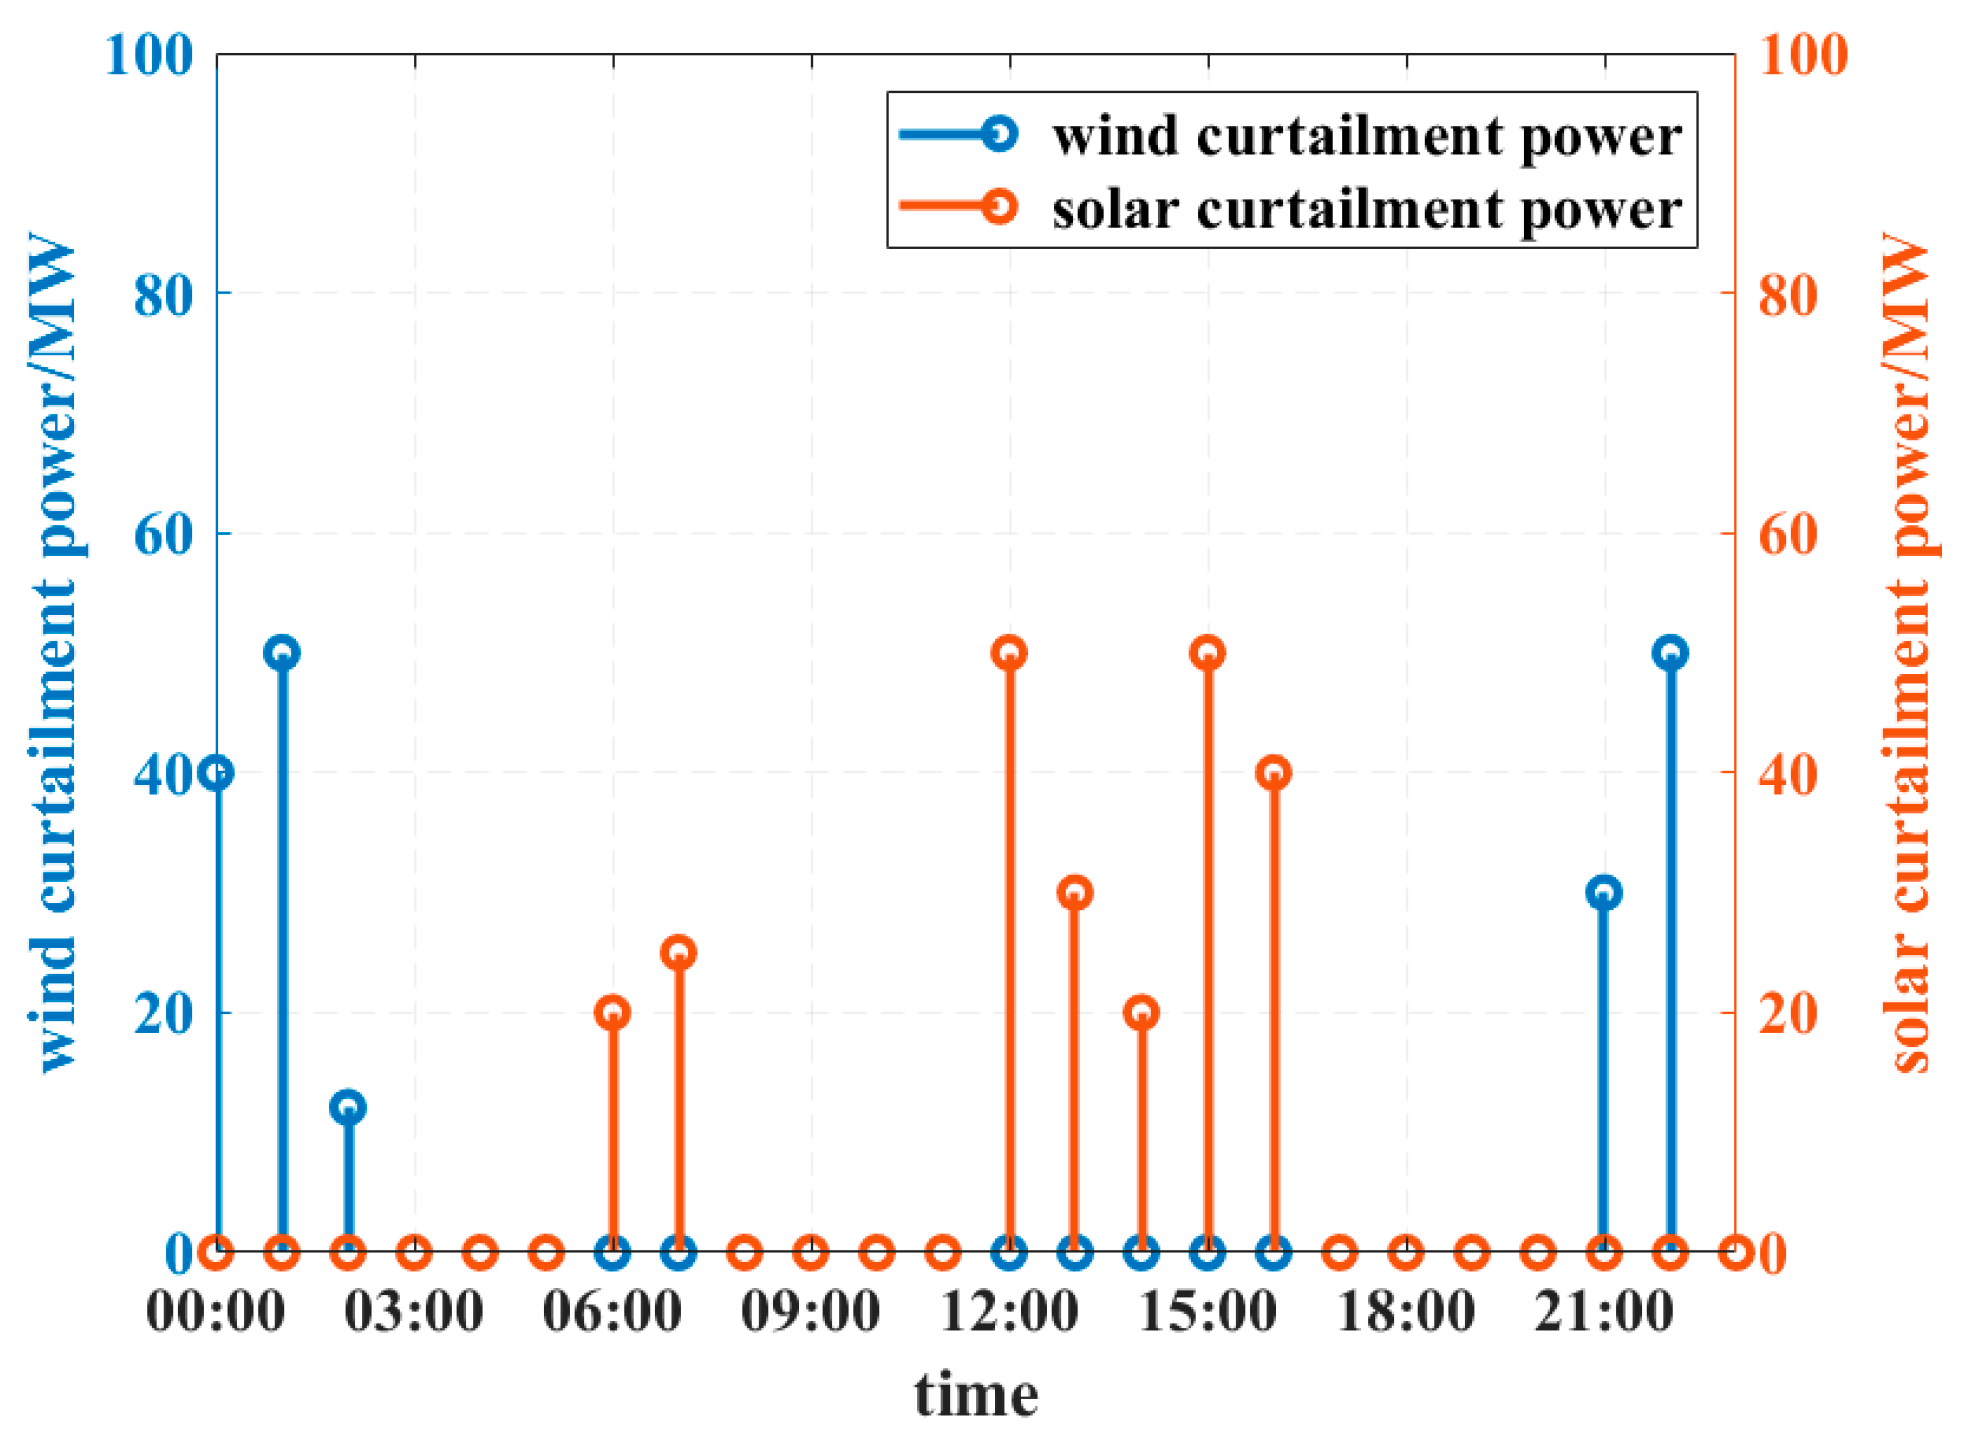
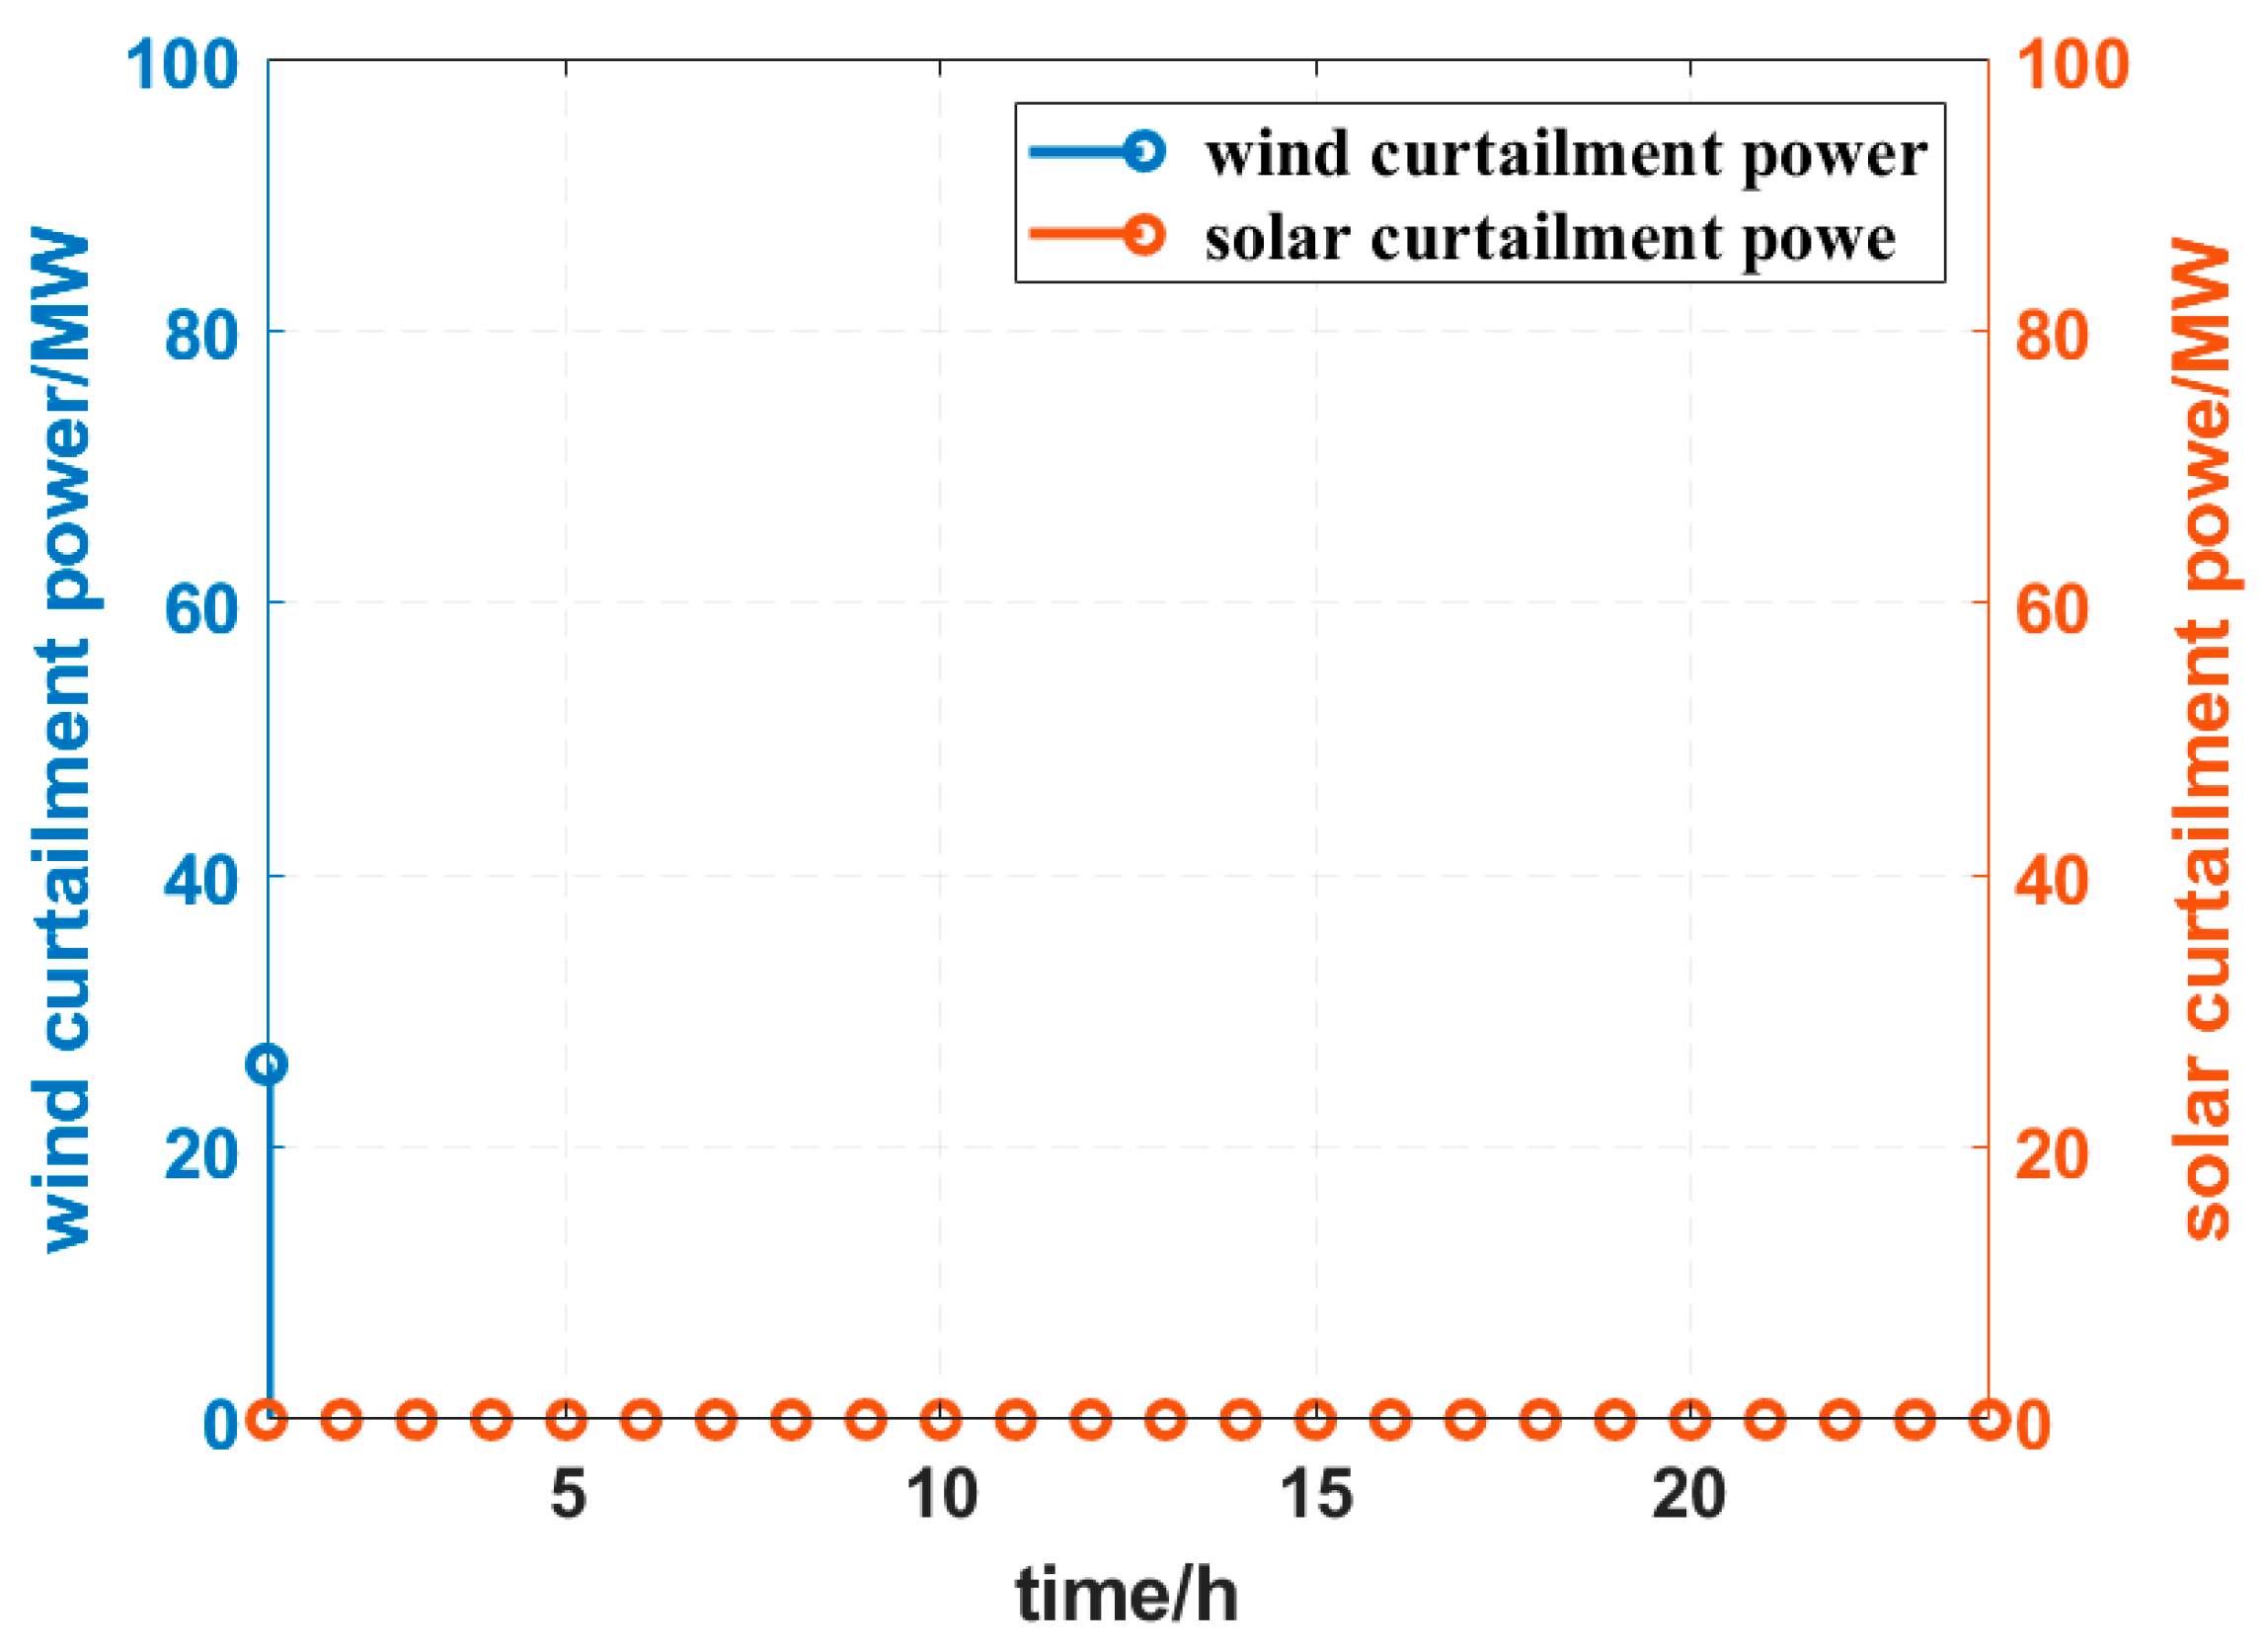
To further verify the optimization effect of the proposed model on the system’s wind and solar curtailment power, a comparative analysis of wind and solar curtailment power in different scenarios is conducted. Since Scenarios 2 and 3 have the same constraints and processing methods for wind and solar accommodation, they are analyzed together. The specific results are shown in Figure 4 and Figure 5.
It can be seen from Figure 4 that under the basic operation strategy, the wind and solar curtailment power shows a bimodal characteristic. The wind curtailment power mainly occurs during the periods of 00:00–04:00 and 22:00–23:00, and the solar curtailment power occurs during the periods of 06:00–07:00 and 12:00–16:00, which is closely related to the diurnal peak–valley fluctuation characteristics of PV power generation and the insufficient peak shaving capacity of the power grid.
Further comparison of Figure 5 shows that the wind and solar curtailment power is significantly improved in different scenarios. The wind and solar curtailment rate in Scenario 1 is 18.11%, while the wind curtailment power in Scenarios 2 and 3 only occurs at 0:00, and the wind curtailment power at other times is 0. At the same time, the PV power in both scenarios achieves full accommodation. Compared with the solar curtailment rate in Scenario 1, the solar curtailment rate in Scenarios 2 and 3 is reduced by 100%. Combined with the analysis in Table 5, the wind and solar curtailment cost in Scenario 2 is reduced by 95.59% compared with Scenario 1. This indicates that after introducing the two flexible resources of demand response and energy storage, the peak–valley difference in the load can be effectively adjusted through demand response to achieve peak-shaving and valley-filling, and the power fluctuation can be smoothed by energy storage, which effectively reduces the phenomenon of wind and solar curtailment. It further verifies the effectiveness of the proposed model in improving the wind and PV accommodation level.

6.2.2. Uncertainty Model Analysis

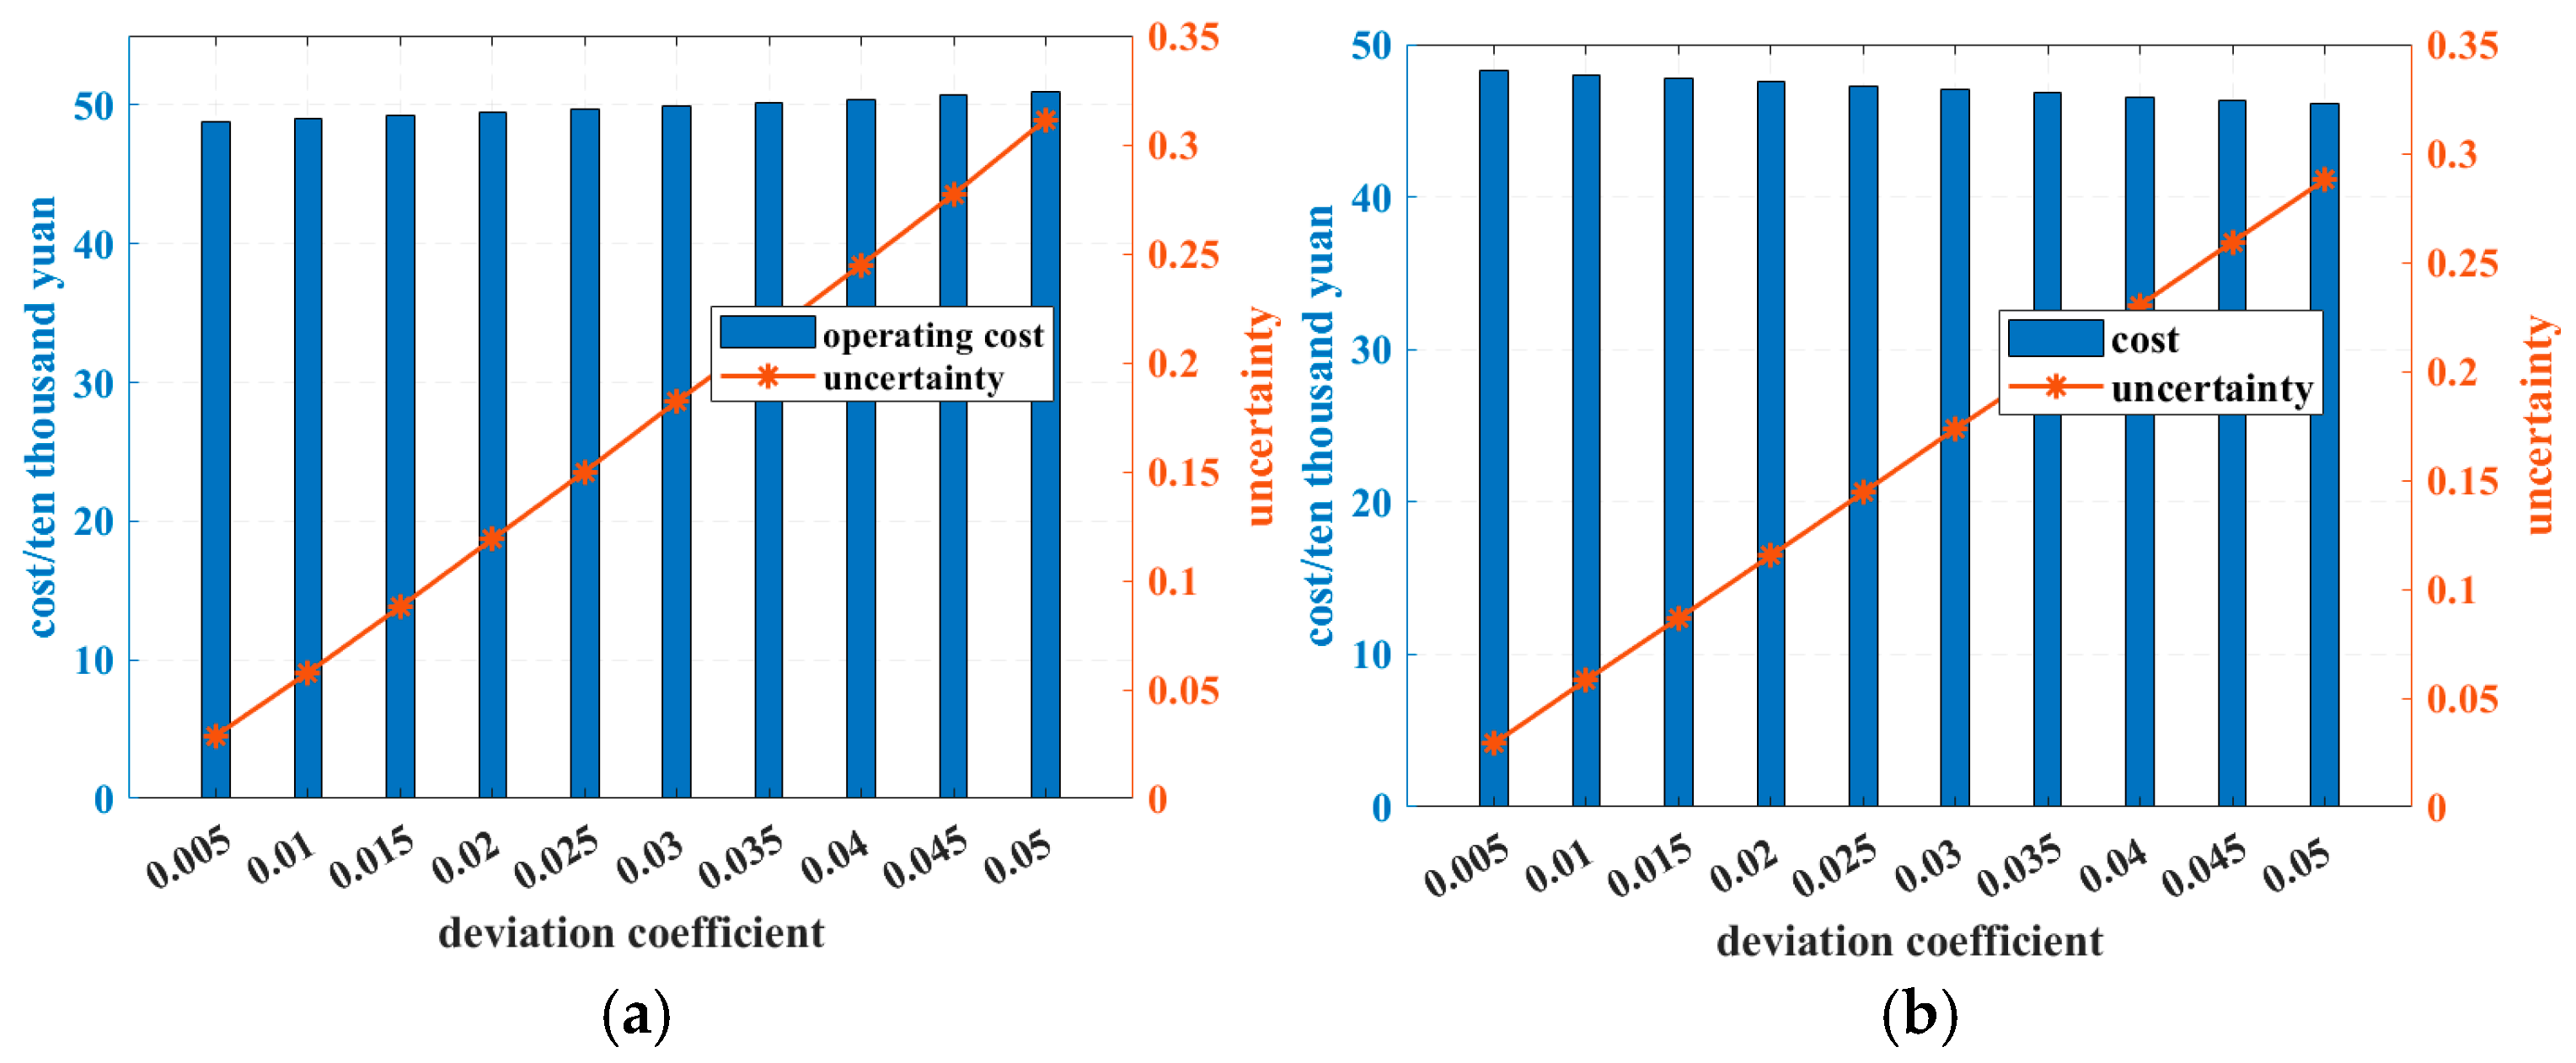
The situation of the deterministic model has been discussed earlier. Based on Scenario 2, the basic cost of system operation is calculated as 48.5 ten thousand CNY. Considering the uncertainty of wind and PV, the comprehensive uncertainty is obtained. According to the weighted average method, the weights of wind power and PV are calculated as 0.49 and 0.51, respectively. On this basis, the deviation coefficient range is set to 0.005~0.05, and the corresponding wind and PV uncertainty, system operation cost, cost threshold, peak shaving operation cost, and deviation coefficient under the opportunity-seeking strategy and risk avoidance strategy are calculated, respectively. The calculation results are shown in Table 6.
To ensure reproducibility and economic interpretability, the deviation parameter Δ in the case study is calibrated. Scenario 2 is first adopted as the deterministic benchmark to obtain the base operating cost F 0 . Based on historical peak-regulating auxiliary service expenditures and acceptable reserve margins and specifies a reasonable cost deviation interval. Accordingly, Δ is varied within the range of 0.005–0.05, corresponding to an allowable operating cost deviation of 0.5–5% relative to F 0 . This range is consistent with typical budget flexibility observed in peak-regulating ancillary service markets, where limited additional costs are tolerated to enhance dispatch robustness under renewable uncertainty. For each candidate Δ, the IGDT robustness and opportunity models are solved to obtain the corresponding uncertainty horizon and system operating cost. This parametric analysis explicitly reveals the trade-off between economic performance and uncertainty tolerance, thereby supporting informed strategy selection while ensuring that all dispatch solutions remain economically meaningful and operationally feasible.
Combined with Table 6 and Figure 6a, as the deviation coefficient Δ 1 under the risk avoidance strategy increases, the uncertainty, total system operation cost, and peak shaving cost all gradually increase. This is because the decision-maker considers the worst-case scenario and assumes that the predicted output of wind and PV is lower than the actual value. With the increase in uncertainty, the actual output of wind and PV becomes larger and larger, and thermal power units can only reduce their output to meet the load requirements, leading to frequent entry of thermal power units into deep peak shaving, further increasing the peak shaving cost and equipment loss, and thus increasing the total system operation cost. Therefore, as Δ1 increases, the adverse risks caused by uncertain factors become greater, and the total operation cost becomes higher. However, when each uncertain variable changes within the allowable range of its own fluctuation amplitude, the total cost can be guaranteed to be lower than the maximum cost acceptable to the decision-maker 1 + Δ 1 F 0 .
Combined with Table 6 and Figure 6b, as the deviation coefficient Δ 2 under the opportunity-seeking strategy increases, the uncertainty increases, but the total system operation cost and peak shaving cost both decrease. This is because the decision-maker considers the optimistic scenario and assumes that the predicted output of wind and PV is higher than the actual value. With the increase in uncertainty, the actual output of wind and PV becomes smaller and smaller, and thermal power units and energy storage need to maintain a high output state. The number of deep peak shaving units entering the deep peak shaving state is reduced. However, since the unit fuel cost of thermal power units is less than the deep peak shaving cost of thermal power units, the total cost will decrease. Therefore, as Δ 2 increases, the benefits brought by uncertain factors become greater, and the total system operation cost and peak shaving cost become lower. Moreover, when each uncertain variable changes within the allowable range of its respective fluctuation amplitude, it is always possible for the total cost to be lower than the decision-maker’s expected value 1 Δ 2 F 0 .
Optimization Result Analysis of Different Strategies
Scenarios 4 to 7 are set, and one case of the risk avoidance model and the opportunity-seeking model is selected as the comparative scheme, respectively. Through analyzing the system operation cost, unit output and other data under wind and PV fluctuations, the optimization effects of energy storage, demand response, and the introduction of unified marginal clearing are compared, highlighting the advantages of the method in this study.
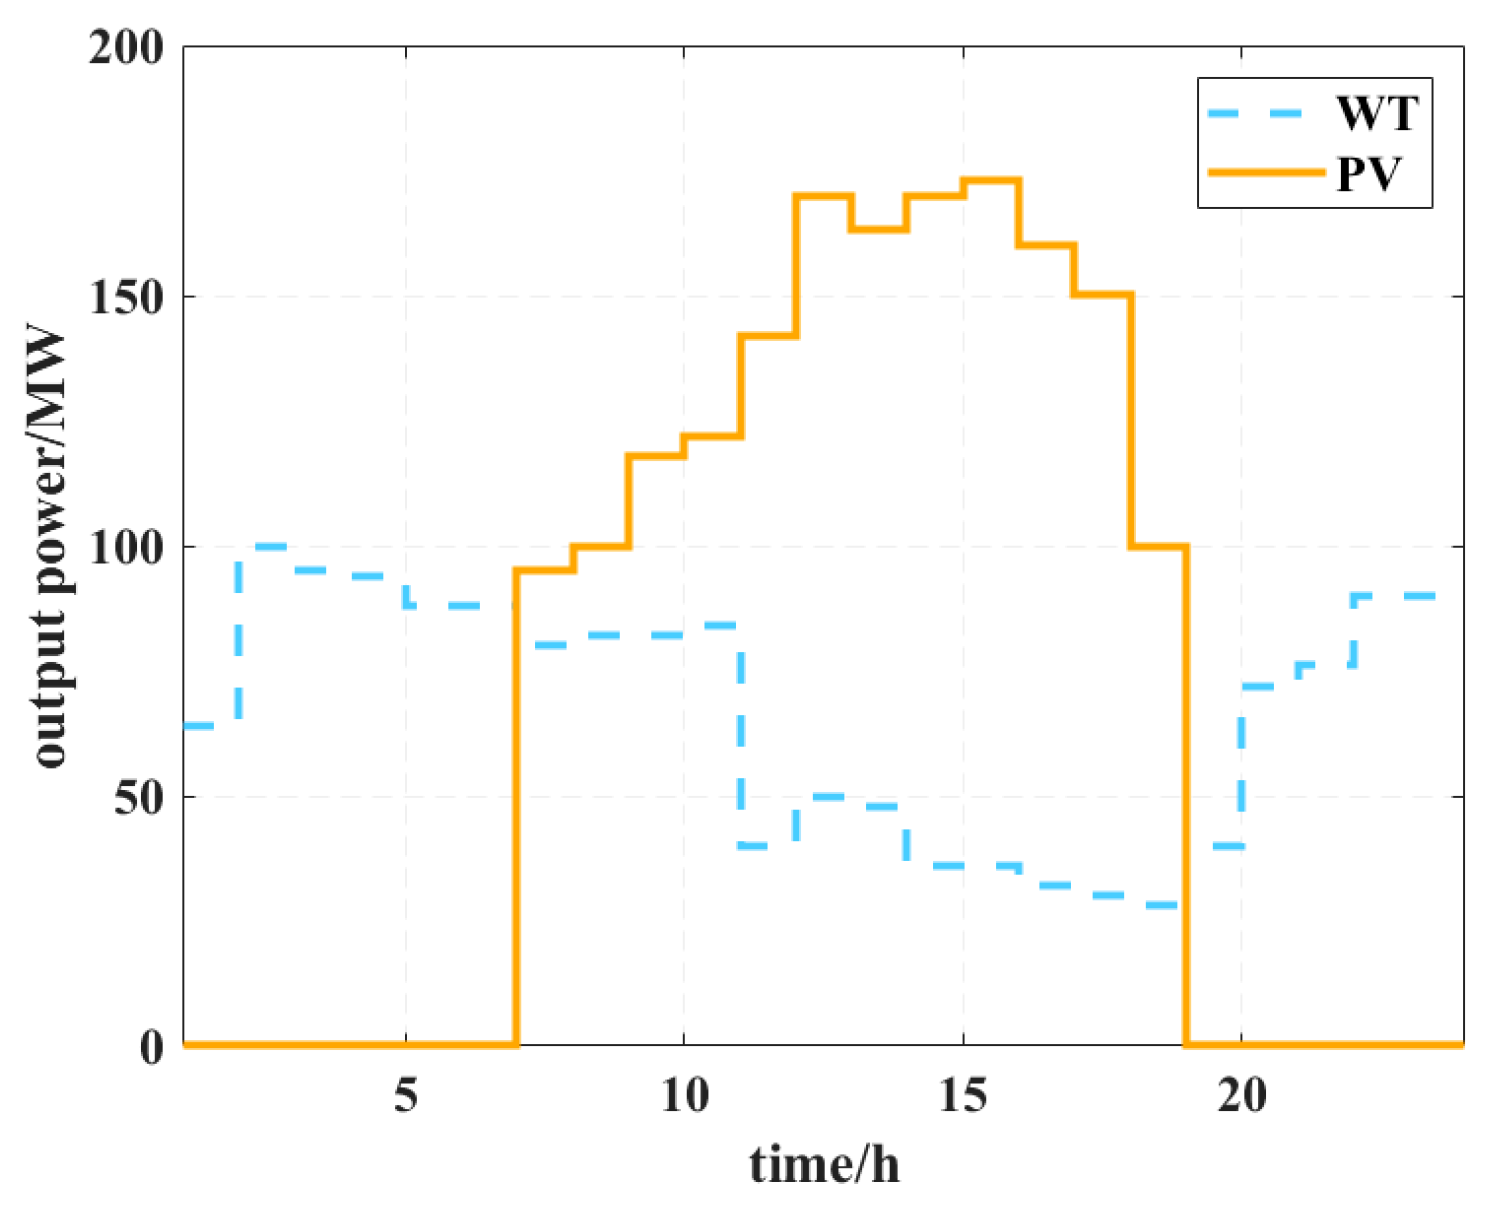
According to the analysis of the deterministic model in the previous section, the wind and PV output diagram under Scenario 2 is shown in Figure 7.
(1)
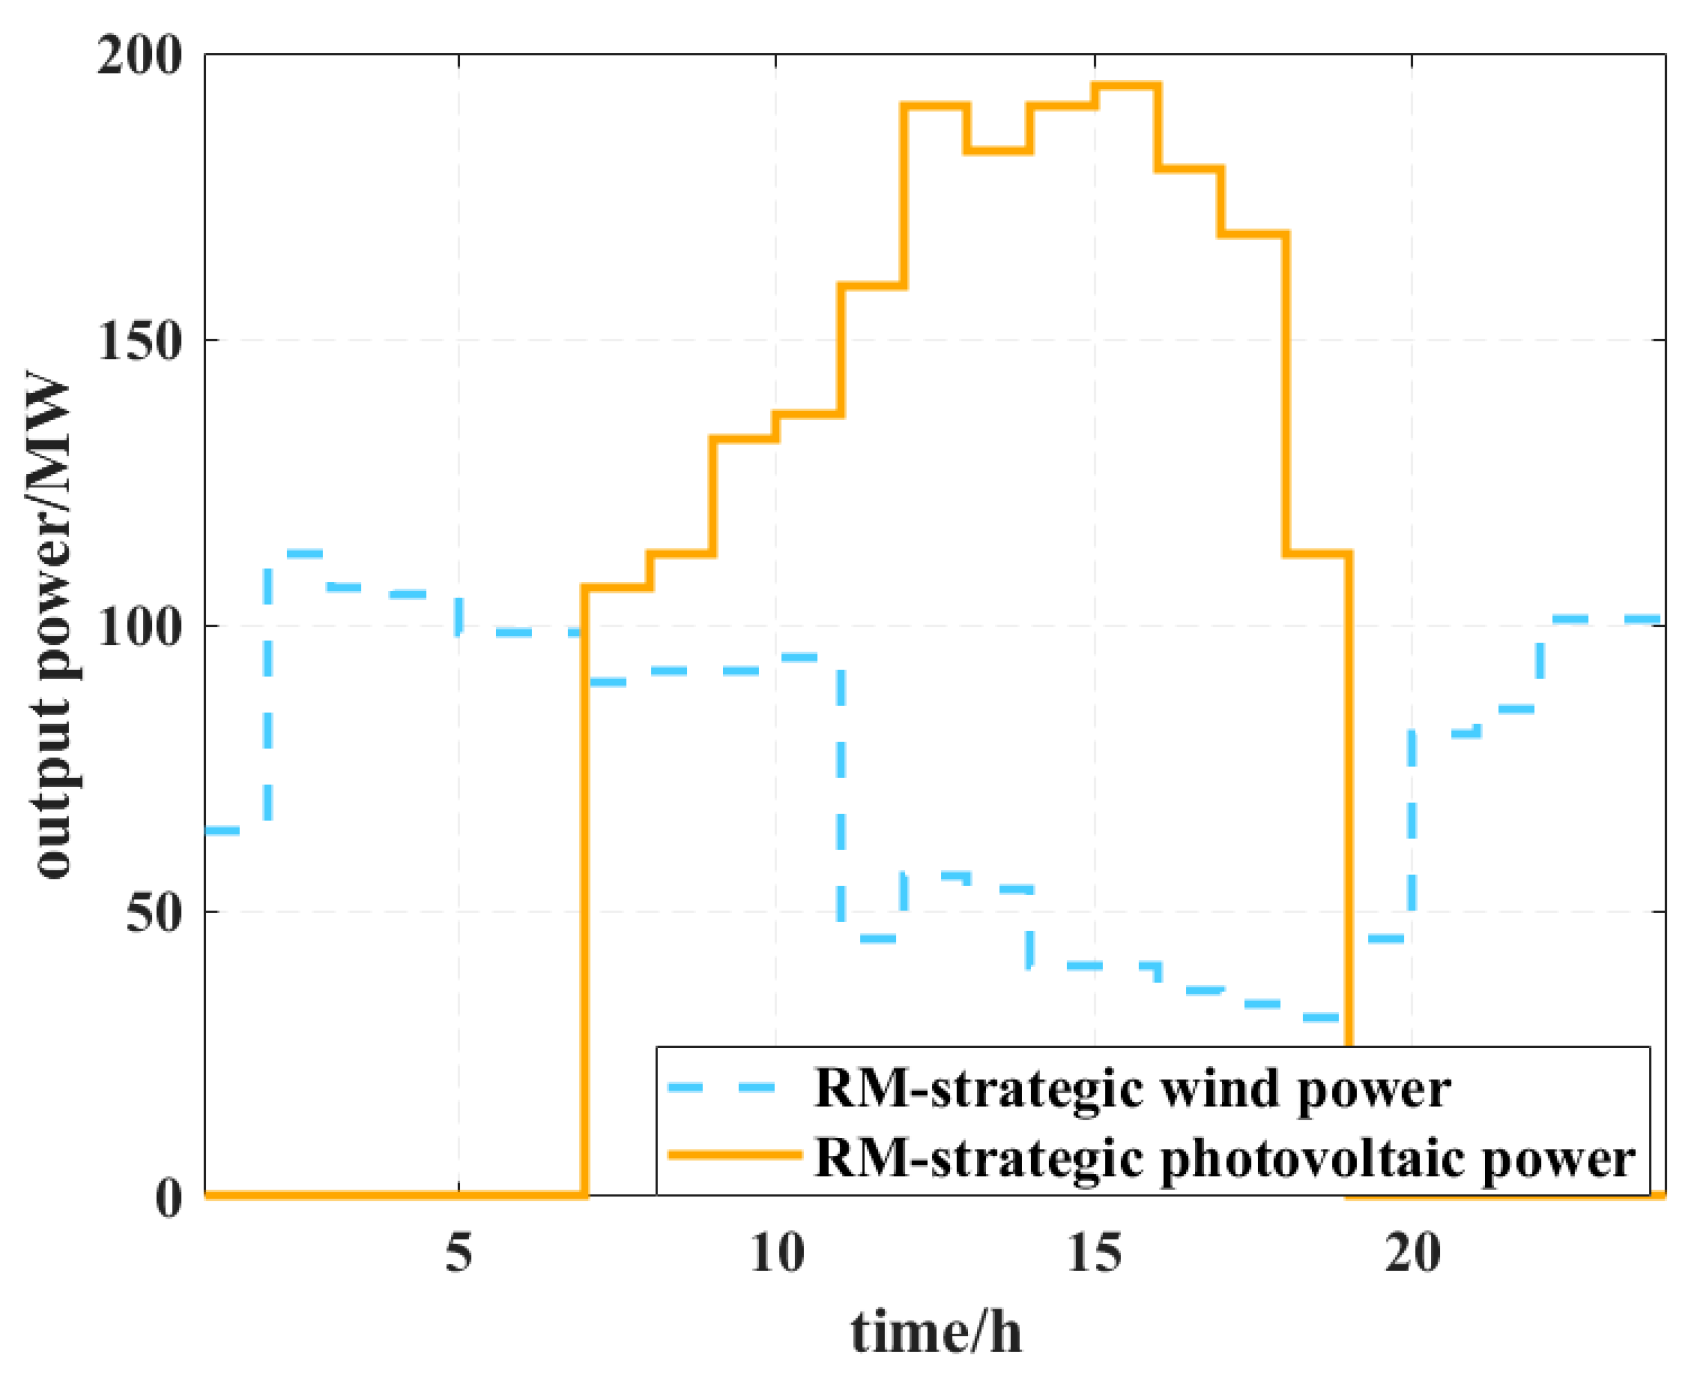
Risk Avoidance Strategy, under the risk avoidance strategy, a deviation coefficient of 0.04 and an uncertainty of 0.2449 are selected for analysis. The wind and PV output under this scheme is shown in Figure 8.
After using the IGDT risk avoidance strategy, the wind and PV uncertainty is 0.2449. Compared with the wind and PV output under the deterministic model, the PV peak value increases by 13%, and the wind power peak value increases by 12.25%. The wind and PV output in each period has increased to varying degrees. At this time, the costs of each scenario and the number of unit peak shaving entries under the risk avoidance strategy are shown in Table 7 and Table 8.
Scenario 4 considers the risk avoidance strategy on the basis of Scenario 2, and Scenario 5 introduces the unified marginal clearing price mechanism on the basis of Scenario 4. Comparative analysis of Table 7 and Table 8 shows that the operation cost of Scenario 4 is 3.76% higher than that of Scenario 2, and the life degradation cost, oil injection and environmental cost, and energy storage cost increase by 34.91%, 3.92%, and 10.19% respectively. This is because under the risk avoidance strategy, the actual value of wind and PV is higher than the predicted value, leading to an increase in the number of times units enter deep peak shaving, thereby increasing the life degradation cost, oil injection and environmental cost.
Under the risk avoidance strategy, the decision-maker considers system operation from a pessimistic perspective, and the decision-maker is willing to exchange high costs for low risks. At this time, wind and PV fluctuations tend to the maximum uncertainty. When the wind power output and PV output fluctuate arbitrarily within the ranges P W , t , 1.12 P W , t and P V , t , 1.13 P V , t respectively, the decision solution can ensure that the peak shaving cost is lower than 50.44 ten thousand CNY. At this time, the decision-maker can use a cost reserve of 1.94 ten thousand CNY to achieve effective control of system operation when the wind and PV output uncertainty does not exceed 0.2449.
After introducing the unified marginal clearing price mechanism, although the energy storage cost increases by 47.89%, the system cost, fuel cost, life degradation cost, and oil injection and environmental cost all show varying degrees of decrease. It can be seen from Table 8 that after considering the unified marginal clearing price, the number of deep peak shaving times of Unit 1 decreases from 13 to 7, and the number of deep peak shaving times of Unit 2 decreases from 6 to 4, with a significant decrease. This indicates that considering the unified marginal clearing price can reduce the system cost, reduce the number of times thermal power units enter deep peak shaving, and improve the enthusiasm of thermal power units to participate in the deep peak shaving auxiliary service market.
(2)
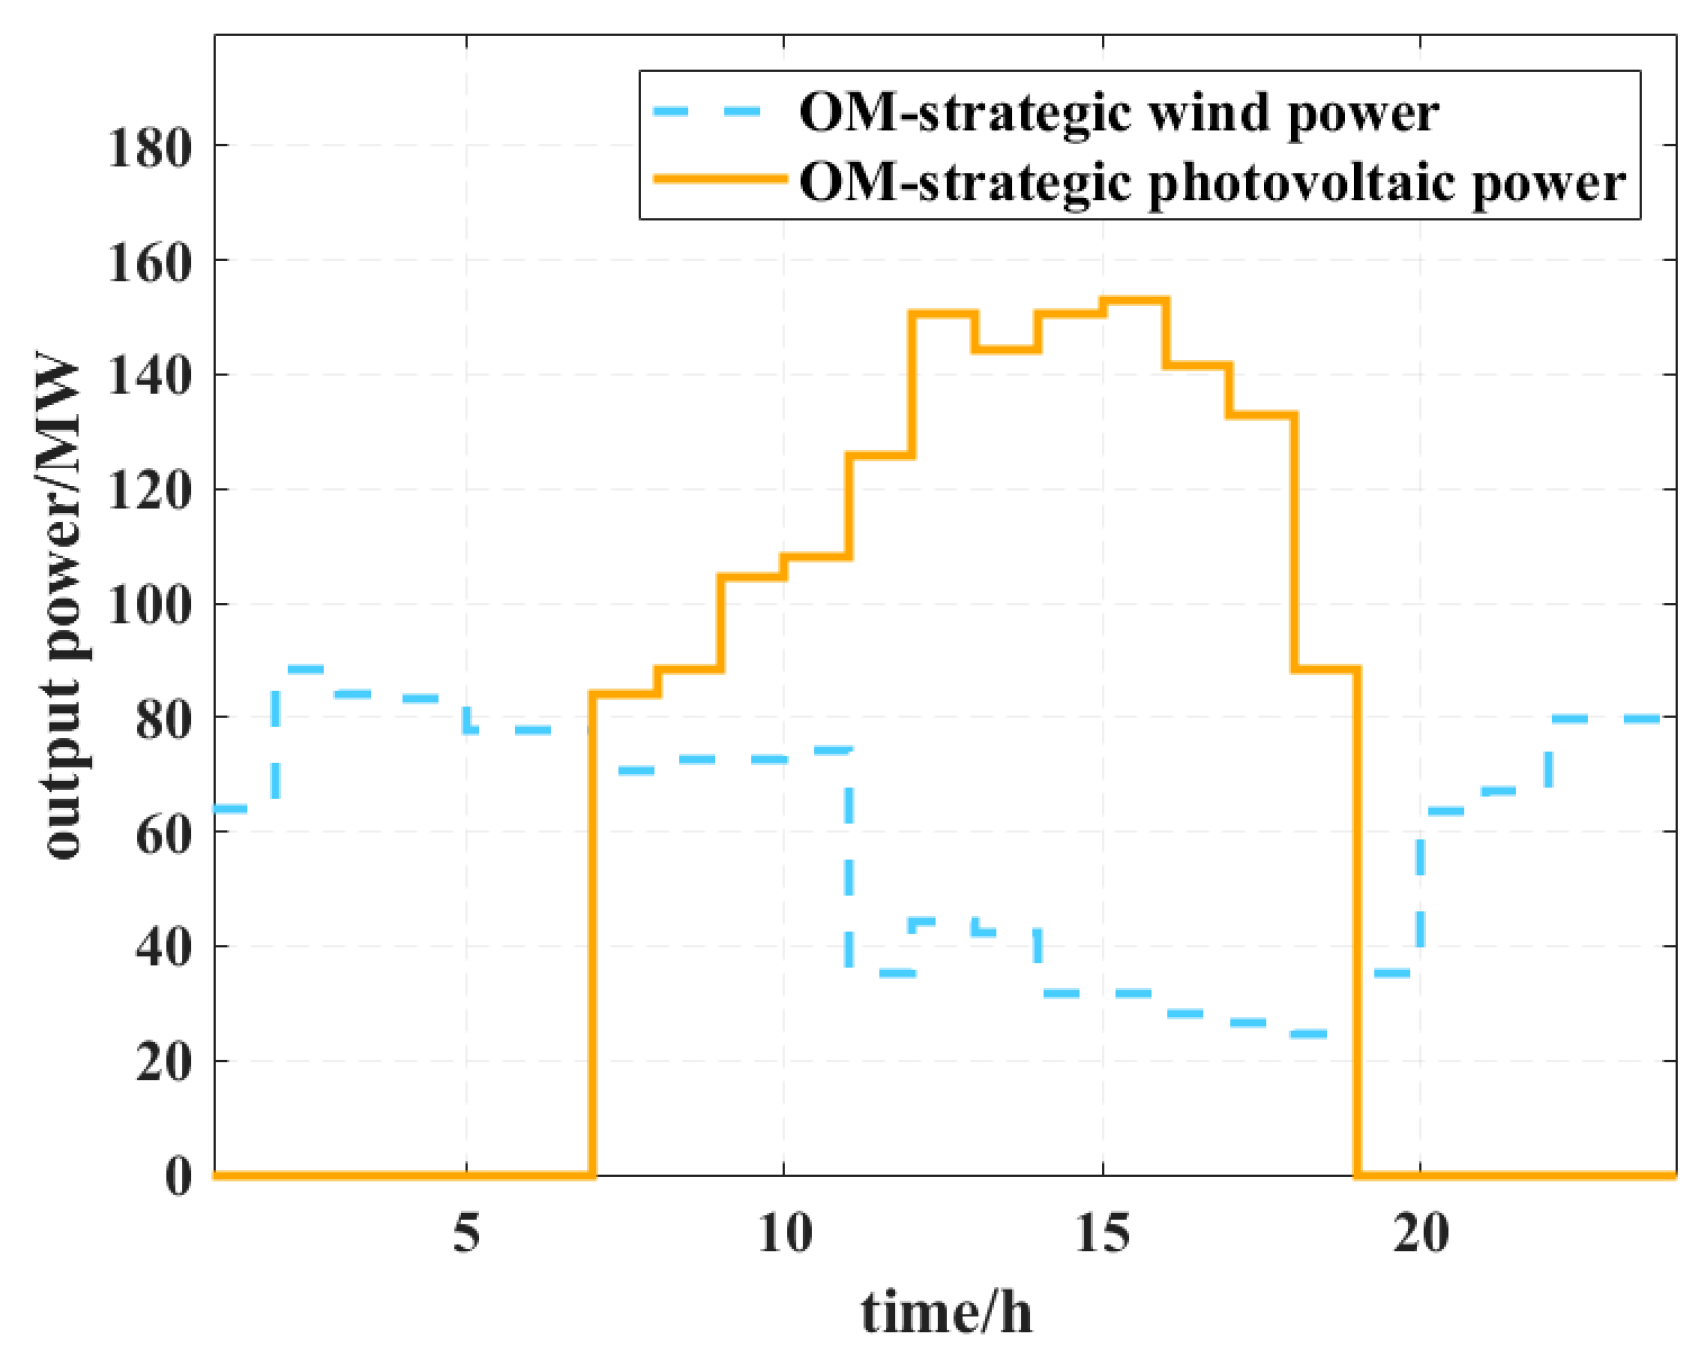
Opportunity-seeking strategy under the opportunity-seeking strategy, a deviation coefficient of 0.04 and an uncertainty of 0.2304 are selected for analysis. The wind and PV output under this scheme are shown in Figure 9.
After using the IGDT opportunity-seeking strategy, the wind and PV uncertainty is 0.2304. Compared with the wind and PV output under the deterministic model, the PV peak value decreases by 12%, and the wind power peak value decreases by 11.52%. The wind and PV output in each period has decreased to varying degrees. At this time, the costs of each scenario and the number of unit peak shaving entries under the opportunity-seeking strategy are shown in Table 9 and Table 10.
Scenario 6 considers the risk avoidance strategy on the basis of Scenario 2, and Scenario 7 introduces the unified marginal clearing price mechanism on the basis of Scenario 6. Comparative analysis of Table 9 and Table 10 shows that the operation cost of Scenario 6 is 4.25% lower than that of Scenario 2, and the life degradation cost, oil injection and environmental cost, and wind and solar curtailment cost decrease by 35.90%, 10.92%, and 20.57% respectively, while the fuel cost and energy storage cost increase by 3.88% and 24.31% respectively. This is because under the opportunity-seeking strategy, the actual value of wind and PV is lower than the predicted value. To meet the load demand, the system needs to increase the output of thermal power units or keep energy storage in the charging/discharging state, thereby increasing the fuel cost and energy storage cost. The decision-maker selects conventional units and energy storage stations with lower unit costs to output from the perspective of cost control, reducing the deep peak shaving output of units, so the cost shows a downward trend.
Under the opportunity-seeking strategy, the decision-maker considers system operation from an optimistic perspective and is willing to choose high risk and low cost. At this time, the minimum uncertainty of wind and PV tends to develop in a direction favorable to the system. When the wind power output and PV output fluctuate arbitrarily within the ranges 0.89 P W , t , P W , t and 0.88 P V , t , P V , t respectively, the decision solution can ensure that the peak shaving cost is lower than the cost threshold of 46.56 ten thousand CNY, and the total system cost under this uncertainty is 46.44 ten thousand CNY. Optimistic decision-makers can release at least 2.06 ten thousand CNY of cost occupation space when the wind and PV output uncertainty is greater than 0.2304.

7. Results and Discussion

7.1. Research Results

This study develops a bilevel clearing optimization model for peak-shaving ancillary service markets that incorporates multiple flexible resources and addresses wind and solar power uncertainty. The key empirical findings from the case study are summarized as follows:
(1)
The synergistic operation of demand response and energy storage effectively flattened the net load curve, reducing the peak-to-valley difference by 16.31% and drastically cutting wind/PV curtailment costs by 95.59%, thereby alleviating the deep peak-shaving pressure on thermal power units.
(2)
The settlement mechanism based on a uniform marginal clearing price incentivized a more efficient allocation of peak-shaving tasks, favoring energy storage participation. This led to a 41.08% reduction in total system operating costs and significantly decreased the frequency, especially of oil injection deep peak shaving, for thermal units, enhancing their participation willingness.
(3)
The IGDT framework successfully quantified wind/PV output uncertainty, providing distinct dispatch strategies for risk-averse and opportunity-seeking decision-makers. When combined with the uniform marginal clearing price, this approach further optimized costs under uncertainty, offering a practical tool for market participants.

7.2. Research Discussion

This study addresses key gaps identified in the current research landscape, namely the predominant focus on single-type flexibility resources, the reliance of traditional uncertainty methods on explicit probability distributions, and the insufficient alignment between market-clearing mechanisms and the cost structures of diverse resources.
In response, the proposed framework makes a distinct contribution by demonstrating how an integrated market-based approach can effectively synchronize multi-sided resources. The introduction of a uniform marginal clearing price mechanism is shown to optimize capacity allocation between thermal units and storage, overcoming coordination barriers present in fragmented models. Furthermore, by employing Information Gap Decision Theory (IGDT), the model provides a practical, non-probabilistic decision tool that translates uncertainty quantification directly into viable market-clearing strategies, offering a complementary perspective to conventional stochastic and robust optimization. Collectively, this work advances a more holistic and implementable paradigm for enhancing system flexibility and market efficiency under renewable integration.
To further enhance the robustness and practical relevance of the findings, future work should include sensitivity analyses on critical parameters, such as the ranges of renewable forecast errors and the cost of energy storage, which would strengthen the credibility of the proposed strategies under varied conditions and provide more actionable insights for real-world implementation.

Author Contributions

Conceptualization, T.M. and X.Z.; methodology, C.W. and Y.D.; software, T.M. and H.L.; validation, T.M., G.W. and H.L.; formal analysis, T.M.; investigation, X.Z.; resources, C.W. and Y.D.; data curation, G.W.; writing—original draft preparation, T.M.; writing—review and editing, X.Z.; visualization, H.L.; supervision, G.W.; project administration, X.Z.; funding acquisition, X.Z. All authors have read and agreed to the published version of the manuscript.

Funding

This research was funded by Science and Technology Project of State Grid Sichuan Electric Power Company, grant number 521996240009.

Data Availability Statement

The original contributions presented in this study are included in the article. Further inquiries can be directed to the corresponding author.

Conflicts of Interest

The authors declare that the research was conducted in the absence of any commercial or financial relationships.

References

  1. Lu, D.; Bian, X.; Zhou, B.; Xu, B.; Xu, Z.; Li, D. Hierarchical Distributed Coordinated Optimal Dispatch of Active Distribution Networks Considering Frequency Regulation Reserve Benefits. Electr. Power Autom. Equip. 2023, 43, 55–63. [Google Scholar]
  2. National Energy Administration Operation of Renewable Energy Grid Connection in 2024 [EB/OL]. Available online: https://www.nea.gov.cn/20250221/e10f363cabe3458aaf78ba4558970054/c.html (accessed on 27 January 2025).
  3. Zhang, Y. Research on Multi Energy Complementary Low Carbon Operation of Power Grid Considering Multidimensional Uncertainty of “Source Load”. Ph.D. Thesis, Xi’an University of Technology, Xi’an, China, 2024. [Google Scholar]
  4. Zhang, H.; Jin, P.; Pang, W. Research on deep peaking cost allocation mechanism considering peaking demand subject and thermal power unit. Energy Rep. 2024, 12, 158–172. [Google Scholar] [CrossRef]
  5. Yang, B.; Cao, X.; Cai, Z.; Yang, T.; Chen, D.; Gao, X.; Zhang, J. Unit Commitment Comprehensive Optimal Model Considering the Cost of Wind Power Curtailment and Deep Peak shaving of Thermal Unit. IEEE Access 2020, 8, 71318–71325. [Google Scholar] [CrossRef]
  6. Yang, Y.; Wang, Y.; Gao, Y. Peak Shaving Analysis of Power Demand Response with Dual Uncertainty of Unit and Demand-Side Resources under Carbon Neutral Target. Energies 2022, 15, 4588. [Google Scholar] [CrossRef]
  7. Zhao, Y.; Wang, Y.; Liu, C.; Cai, G.; Ge, W.; Xu, Y.; Xiang, Z. Research on the deep peak-shaving cost allocation mechanism considering the responsibility of the load side. Front. Energy Res. 2023, 11, 1182620. [Google Scholar] [CrossRef]
  8. Meng, Q.; Wei, Y.; Fan, J. Peak shaving strategies for ground source heat pump demand response of based on load forecasting: A case study of rural building in China. Renew. Energy 2024, 224, 120059. [Google Scholar] [CrossRef]
  9. Tong, Z.; Mansouri, S.A.; Huang, S.; Jordehi, A.R.; Tostado-Véliz, M. The role of smart communities integrated with renewable energy resources, smart homes and electric vehicles in providing ancillary services: A tri-stage optimization mechanism. Appl. Energy 2023, 351, 121897. [Google Scholar] [CrossRef]
  10. Wang, Y.; Shi, P.; Chen, G.; Wang, X.; Sun, X.; Ding, L.; Li, Y. A multi-time scale schedulable capacity evaluation method for stations considering user wishes. Energy Rep. 2023, 9, 321–325. [Google Scholar] [CrossRef]
  11. Nie, X.; Mansouri, S.A.; Jordehi, A.R.; Tostado-Véliz, M. A two-stage optimal mechanism for managing energy and ancillary services markets in renewable-based transmission and distribution networks by participating electric vehicle and demand response aggregators. Int. J. Electr. Power Energy Syst. 2024, 158, 109917. [Google Scholar] [CrossRef]
  12. Owens, J.; Schittekatte, T.; Gençer, E. Commercial electric vehicle fleets in U.S. ancillary services markets: A stochastic analysis to inform utility rate design. Util. Policy 2024, 90, 101790. [Google Scholar] [CrossRef]
  13. Guan, D.; Shen, Y.; Ye, P.; Li, Z.; Tang, M.; Wang, H. Temperature control load-regulation strategy based on multi-dimensional state queue method. Energy Rep. 2022, 8, 159–171. [Google Scholar] [CrossRef]
  14. Lin, S.; He, T.; Shen, Y.; Qian, L.; Li, D.; Li, F. Bilevel optimal dispatch model for a peak shaving ancillary service in an industrial park of energy-intensive loads. Electr. Power Syst. Res. 2024, 230, 110272. [Google Scholar]
  15. Liu, B.; Liu, T.; Liao, S.; Wang, H.; Jin, X. Short-term operation of cascade hydropower system sharing flexibility via high voltage direct current lines for multiple grids peak shaving. Renew. Energy 2023, 213, 11–29. [Google Scholar] [CrossRef]
  16. Geng, X.; Zhou, Y.; Zhao, W.; Shi, L.; Chen, D.; Bi, X.; Xu, B. Pricing ancillary service of a Francis hydroelectric generating system to promote renewable energy integration in a clean energy base: Tariff compensation of deep peak shaving. Renew. Energy 2024, 226, 120292. [Google Scholar]
  17. Yue, X.; Liao, S.; Xu, J.; Ke, D.; Wang, H.; Yang, J.; He, X. Collaborative optimization of renewable energy power systems integrating electrolytic aluminum load regulation and thermal power deep peak shaving. Appl. Energy 2024, 373, 123869. [Google Scholar] [CrossRef]
  18. Wang, J.; Zhang, S.; Huo, J.; Zhou, Y.; Li, L.; Han, T. Dispatch optimization of thermal power unit flexibility transformation under the deep peak shaving demand based on invasive weed optimization. J. Clean. Prod. 2021, 315, 128047. [Google Scholar] [CrossRef]
  19. Naemi, M.; Davis, D.; Brear, M.J. Optimisation and analysis of battery storage integrated into a wind power plant participating in a wholesale electricity market with energy and ancillary services. J. Clean. Prod. 2022, 373, 133909. [Google Scholar] [CrossRef]
  20. Fang, L.; Dong, H.; Zhen, X.; Li, S. Peak Shaving Strategy of Concentrating Solar Power Generation Based on Multi-Time-Scale and Considering Demand Response. Energy Eng. 2024, 121, 661–679. [Google Scholar]
  21. Wang, P.; Hu, B.; Tai, N.; Zhao, L.; Vafai, K. Peak shaving auxiliary service analysis for the photovoltaic and concentratin solar power hybrid system underthe planning-dispatch optimization framework. Energy Convers. Manag. 2023, 295, 117609. [Google Scholar]
  22. Guan, H.; Feng, Y.; Yang, X.; Du, Y.; Feng, D.; Zhou, Y. Optimization strategy of combined thermal-storage-photovoltaic economic operation considering deep peak load regulation demand. Energy Rep. 2022, 8, 112–120. [Google Scholar]
  23. Guo, Q.; Wu, X.; Cai, H.; Cheng, L.; Huang, J.; Liu, Y.; Chen, K. Multi-power sources joint optimal scheduling model considering nuclear power peak shaving. Energy 2024, 293, 130678. [Google Scholar]
  24. Wang, H.; Mu, S.; Li, G.; Yang, Z.; Yang, J.; Marquez, F.P.G.; Zhou, X.; Ma, Y.; Chen, Z. Modeling and operation strategy of nuclear power plant with electric heat storage in the ancillary service market. Nucl. Eng. Des. 2023, 415, 112686. [Google Scholar] [CrossRef]
  25. Zhang, Z.; Cong, W.; Liu, S.; Li, C.; Qi, S. Auxiliary Service Market Model Considering the Participation of Pumped-Storage Power Stations in Peak Shaving. Front. Energy Res. 2022, 10, 915125. [Google Scholar] [CrossRef]
  26. Ge, X.; Ma, Y.; Li, Y.; Jiao, Y.; Wang, Z.; Wu, F.; Zhao, B.; Xue, X. Daily peak shaving operation of mixed pumped-storage hydro plants considering cascade hydraulic coupling. Energy Rep. 2023, 9, 971–978. [Google Scholar] [CrossRef]
  27. Chen, G. Optimization Control Strategy for Electrochemical Energy Storage Cluster Participating in System Peak Shaving. Master’s Thesis, Northeast Electric Power University, Jilin, China, 2023. [Google Scholar]
  28. Li, S.; Xu, Q.; Huang, J. Research on the integrated application of battery energy storage systems in grid peak and frequency regulation. J. Energy Storage 2023, 59, 106459. [Google Scholar] [CrossRef]
  29. Hameed, Z.; Træholt, C.; Hashemi, S. Investigating the participation of battery energy storage systems in the Nordic ancillary services markets from a business perspective. J. Energy Storage 2023, 58, 106464. [Google Scholar] [CrossRef]
  30. Lin, S.; Zhang, Q.; Shen, Y.; Zhou, B.; Bian, X.; Li, D. Optimization and scheduling strategy for cross regional power grid flexibility resources considering mutual benefit of flexibility. Electr. Power Constr. 2023, 44, 71–81. [Google Scholar] [CrossRef]
  31. Wang, J.; Wang, Y.; Zhang, W. Research on peak shaving of high proportion new energy microgrids based on priority sorting. Electr. Technol. 2024, 43–45. [Google Scholar] [CrossRef]
  32. Zhai, H.; Li, B.; Ma, Q. Optimization method for unit combination modeling considering the flexibility of back-to-back flexible and straight operation. Grid Technol. 2024, 48, 2660–2669. [Google Scholar] [CrossRef]
  33. Xu, W. Research on Wind Solar Thermal Storage Optimization Scheduling Considering Deep Peak Shaving and Wind Solar Uncertainty. Master’s Thesis, Lanzhou University of Technology, Lanzhou, China, 2023. [Google Scholar] [CrossRef]
  34. Li, J.; Zhang, J.; Li, C. Configuration scheme and economic analysis of energy storage system participating in peak shaving. J. Electr. Technol. 2021, 36, 4148–4160. [Google Scholar]
  35. Song, X.; Wang, P.; Zhang, B. A low-carbon peak-load regulation trading strategy for large-scale wind power integration using information gap decision theory. Energy Rep. 2022, 8, 9642–9661. [Google Scholar]
  36. Yang, X.; Wang, X.; Deng, Y.; Mei, L.; Deng, F.; Zhang, Z. Integrated energy system scheduling model based on non-complete interval multi-objective fuzzy optimization. Renew. Energy 2023, 218, 119289. [Google Scholar]
  37. Qiu, G.; He, C.; Luo, Z. Fuzzy optimization scheduling of integrated energy system for electric gas interconnection in industrial parks considering source and load uncertainties. Electr. Power Autom. Equip. 2022, 42, 8–14. [Google Scholar]
  38. Pan, Z.; Liu, S.; Wang, Z. Dispatch of Wind Power Systems Based on Information Gap Decision Theory. Electr. Power Constr. 2018, 39, 87–94. [Google Scholar]
  39. Li, P.; Wang, X.; Han, P. Research on Risk Analysis of Microgrid Optimization Operation and Scheduling under Dual Uncertainty Environment. Chin. J. Electr. Eng. 2017, 37, 4296–4303+4569. [Google Scholar] [CrossRef]
  40. Zhong, Z.; Fan, N.; Wu, L. Multistage Stochastic optimization for mid-term integrated generation and maintenance scheduling of cascaded hydroelectric system with renewable energy uncertainty. Eur. J. Oper. Res. 2024, 318, 179–199. [Google Scholar] [CrossRef]
  41. Li, B. Research on Stochastic Optimization Scheduling Considering Wind Power and Demand Response Uncertainty. Master’s Thesis, North China Electric Power University, Beijing, China, 2024. [Google Scholar]
  42. Yang, Y.; Chen, M.; Qin, F. Static voltage stability probability evaluation method based on Latin hypercube key sampling. Guangxi Electr. Power 2022, 45, 44–52. [Google Scholar] [CrossRef]
  43. Han, F.; Zhao, Y.; Zeng, J.; Zhang, S.; Wu, T. Uncertain parameters adjustable two-stage robust optimization of a rural housing integrated energy system considering biomass on-site utilization. Energy 2024, 296, 131106. [Google Scholar] [CrossRef]
  44. Liu, C.; Zheng, X.; Yang, H.; Tang, W.; Sang, G.; Cui, H. Techno-economic evaluation of energy storage systems for concentrated solar power plants using the Monte Carlo method. Appl. Energy 2023, 352, 121983. [Google Scholar] [CrossRef]
  45. Chen, L.; Yang, D.; Cai, J.; Yan, Y. Robust optimization based coordinated network and source planning of integrated energy systems. Int. J. Electr. Power Energy Syst. 2024, 157, 109864. [Google Scholar] [CrossRef]
  46. Wang, Y.; Chen, H.; Huang, Y. Robust optimization scheduling strategy for virtual power plants participating in the electricity and demand response market under multiple uncertainties. Power Gener. Technol. 2024, 45, 1173–1185. [Google Scholar]
  47. Sun, S.; Yang, S. Distributed robust optimization scheduling method considering the uncertainty of photovoltaic output. Adv. Laser Optoelectron. 2025, 62, 0925001. [Google Scholar] [CrossRef]
  48. Yan, R.; Wang, J.; Wang, J.; Tian, L.; Tang, S.; Wang, Y.; Zhang, J.; Cheng, Y.; Li, Y. A two-stage stochastic-robust optimization for a hybrid renewable energy CCHP system considering multiple scenario-interval uncertainties. Energy 2022, 247, 123498. [Google Scholar]
  49. Ben-Haim, Y. Info-Gap Decision Theory: Decisions Under Severe Uncertainty; Elsevier: Amsterdam, The Netherlands, 2006. [Google Scholar]
  50. Li, D.; You, Y.; Zhou, B. Optimization decision-making of power sales companies participating in multiple markets based on information gap decision-making theory. Grid Technol. 2022, 46, 4778–4790. [Google Scholar] [CrossRef]
Figure 1. CPLEX-based model solution flow chart.
Processes 14 00599 g001
Figure 2. Wind Power, PV Power, and Original Load Data.
Processes 14 00599 g002
Figure 3. Load Curves Before and After Response.
Processes 14 00599 g003
Figure 4. Wind and Solar Curtailment Power in Scenario 1.
Processes 14 00599 g004
Figure 5. Wind and solar curtailment power in Scenarios 2 and 3.
Processes 14 00599 g005
Figure 6. Operation cost and uncertainty under different strategies. (a) Operation cost and uncertainty under risk avoidance strategy. (b) Operation cost and uncertainty under opportunity-seeking strategy.
Processes 14 00599 g006
Figure 7. Wind and PV output under a deterministic model.
Processes 14 00599 g007
Figure 8. Wind and PV output under risk avoidance strategy.
Processes 14 00599 g008
Figure 9. Wind and PV output under opportunity-seeking strategy.
Processes 14 00599 g009
Table 1. Technical parameters of thermal power units.
No.Unit Capacity (MW)QuantityMaximum Output (MW)Minimum Output (MW)Ramp Rate (MW/h)Fuel Cost Coefficient a (CNY/MW2)Fuel Cost Coefficient b (CNY/MW)Fuel Cost Coefficient c (CNY)
12001200501000.037520372.5
2100110025500.07719360.5
3100110050500.07719360.5
48018040400.17517.5352.3
Table 2. Parameters of thermal power units participating in the deep peak shaving auxiliary service market.
ParameterUnitConventional Peak ShavingDeep Peak Shaving Without Oil InjectionDeep Peak Shaving with Oil Injection
Minimum Load Rate%504025
Operation Impact Coefficient ( β )1.21.5
Unit Purchase Cost ( S 2 )CNY/kW3464
Oil Consumption During Oil Injection Phaset/h4.2
Oil PriceCNY/t
Unit Pollutant Discharge Fee (δ)CNY/t25.22
SO2 Emission Standard ( x S O 2 )mg/m350
SO2 Emission Excess ( Δ S O 2 )%10
SO2 Excess Penalty ( P S O 2 )CNY/(mg/m3)842
NOx Emission Standard ( x N O x )mg/m3100
NOx Emission Excess ( Δ N O x )%12
NOx Excess Penalty ( P N O x )CNY/(mg/m3)667
Table 3. Relevant parameters of battery energy storage station.
ParameterValue
Energy Storage Capacity (MWh)300
Charging/Discharging Cost (CNY/MWh)10
Self-Discharge Rate (%)0.5
Initial State of Charge (SOC)0.5
Charging/Discharging Efficiency (%)90/90
Maximum SOC0.9
Minimum SOC0.1
Table 4. Optimized electricity prices for each period.
Load PeriodTime IntervalElectricity Price (CNY/(kW·h))
Peak8:00–12:00, 17:00–21:000.92
Flat6:00–8:00, 12:00–17:00, 21:00–22:000.54
Valley0:00–6:00, 22:00–24:000.23
Table 5. Peak shaving operation cost optimization results of each scenario.
ScenarioOperation Cost (10,000 CNY)Wind and Solar Curtailment Cost (10,000 CNY)Fuel Cost (10,000 CNY)Life Degradation Cost (10,000 CNY)Oil Injection and Environ-Mental Cost (10,000 CNY)Energy Storage Cost (10,000 CNY)
194.5835.5024.191.2033.700.00
248.501.5722.760.8322.700.64
328.581.5722.560.263.370.82
Table 6. Cost, Uncertainty, and Deviation Coefficient Under Wind and PV Uncertainty.
Risk Avoidance Strategy Opportunity-Seeking Strategy
System Operation Cost Threshold (10,000 CNY)System Operation Cost (10,000 CNY)UncertaintyDeviation CoefficientUncertaintySystem Operation Cost (10,000 CNY)System Operation Cost Threshold (10,000 CNY)
48.500048.500000048.500048.5000
48.742548.62890.02890.0050.029248.133948.2575
48.985048.87090.05780.0100.058347.892148.0150
49.227549.11280.08800.0150.086647.650247.7725
49.470049.35470.11910.0200.115447.408347.5300
49.712549.59670.15000.0250.144347.166447.2875
49.955049.83860.18220.0300.173646.924547.0450
50.197550.08050.21320.0350.201946.682746.8025
50.440050.32250.24490.0400.230446.440846.5600
50.682550.56440.27720.0450.259346.198946.3175
50.925050.80630.31150.0500.287845.957046.0750
Table 7. Cost optimization results under risk avoidance strategy.
ScenarioOperation Cost (10,000 CNY)Wind and Solar Curtailment Cost (10,000 CNY)Fuel Cost (10,000 CNY)Life Degradation Cost (10,000 CNY)Oil Injection and Environmental Cost (10,000 CNY)Energy Storage Cost (10,000 CNY)
248.501.5722.760.8322.700.64
328.581.5722.560.263.370.82
450.322.2922.611.1223.590.71
529.692.2922.630.363.371.05
Table 8. Number of peak shaving entries under risk avoidance strategy.
ScenarioUnitConventional Peak Shaving (Times)Deep Peak Shaving Without Oil Injection (Times)Deep Peak Shaving with Oil Injection (Times)
211284
22031
311761
22310
411185
21842
511561
22031
Table 9. Cost optimization results under opportunity-seeking strategy.
ScenarioOperation Cost (10,000 CNY)Wind and Solar Curtailment Cost (10,000 CNY)Fuel Cost (10,000 CNY)Life Degradation Cost (10,000 CNY)Oil Injection and Environmental Cost (10,000 CNY)Energy Storage Cost (10,000 CNY)
248.501.5722.760.8322.700.64
328.581.5722.560.263.370.82
646.441.2423.640.5320.220.80
727.331.2424.740.230.001.12
Table 10. Number of peak shaving entries under opportunity-seeking strategy.
ScenarioUnitConventional Peak Shaving (Times)Deep Peak Shaving Without Oil Injection (Times)Deep Peak Shaving with Oil Injection (Times)
211284
22031
311761
22310
611671
22130
711770
22310
Disclaimer/Publisher’s Note: The statements, opinions and data contained in all publications are solely those of the individual author(s) and contributor(s) and not of MDPI and/or the editor(s). MDPI and/or the editor(s) disclaim responsibility for any injury to people or property resulting from any ideas, methods, instructions or products referred to in the content.