Article

Research and Application of Intelligent Control System for Uniform Pellet Distribution

1
ZhongYe ChangTian International Engineering Co., Ltd., Changsha 410006, China
2
National Research Center for Equipment System Engineering Technology of Sintering Pellet, Changsha 410006, China
3
School of Computer and Communication Engineering, Changsha University of Science and Technology, Yuntang Campus, Changsha 410114, China
4
ZhongYe ChangTian (Changsha) Intelligent Technology Co., Ltd., Changsha 410114, China
*
Author to whom correspondence should be addressed.
Processes 2026, 14(3), 490; https://doi.org/10.3390/pr14030490
Submission received: 25 December 2025 / Revised: 19 January 2026 / Accepted: 29 January 2026 / Published: 30 January 2026

Abstract

In pellet production, the uniformity of material distribution directly affects the subsequent roasting effect and the quality of finished products. Aiming at the problems of uneven distribution in traditional shuttle distribution systems, such as material stacking at both ends of the wide belt, insufficient parameter matching leading to uneven distribution, and reliance on manual adjustment which makes it difficult to adapt to dynamic working conditions, this paper proposes an intelligent control method based on Integral Simulation and Gradient Descent optimization (IS-GD). Firstly, this method combines the structure and operating parameters of the distribution equipment and accurately simulates the material distribution law on the wide belt during the reciprocating movement of the shuttle through integral technology. Based on the simulation results, longitudinal and lateral uniformity discriminant functions are constructed, and a phased gradient descent optimization strategy is adopted to dynamically adjust the shuttle belt speed, walking speed, and operating parameters of each stage with the goal of minimizing the uniformity index. Experimental results show that this method achieves a significant improvement in lateral distribution uniformity without affecting the stability of longitudinal distribution. This research provides reliable technical support for intelligent distribution control in pellet production and helps to improve the roasting quality and production efficiency of pellets.

1. Introduction

Against the backdrop of the green and low-carbon transformation in the iron and steel industry, pellet ore, as a high-quality burden for blast furnace ironmaking, has been continuously increasing its proportion in the blast furnace burden structure due to its advantages such as low process energy consumption and excellent metallurgical properties. It has thus become one of the important approaches to achieving low-carbon smelting [1,2]. In mainstream pellet production processes including the belt roaster and grate-kiln system, the uniformity of green pellet distribution directly determines the bed permeability, the uniformity of roasting heating, as well as the strength and output of finished pellets [3,4].
At present, the mainstream distribution methods in pellet production include oscillating belts, shuttle car, and so on. Among them, shuttle car systems are widely used in new construction and renovation projects due to their advantages such as compact structure and adaptability to large-scale production. However, traditional shuttle car systems have significant drawbacks: on the one hand, during the reciprocating movement of the shuttle car, the long commutation braking time and multiple falling times of green pellets easily lead to material accumulation at both ends of the wide belt, forming a “basin”-shaped material profile with poor distribution uniformity [3]; on the other hand, the insufficient matching between its speed parameters (such as the traveling speed of the shuttle car and the belt speed) and the operating speed of the wide belt is prone to causing material strip overlap or gaps, increasing the system operating load [4]. To improve distribution uniformity, compared with the traditional method of manual adjustment based on production output, some control models have been developed in recent years relying on technologies such as neural networks and big data analysis. Zhou Jianping [5] proposed using multi-point thickness measurement data of the cross-section to judge the uniformity of distribution and finding the speed combination of distribution equipment with the most uniform distribution through big data analysis. Li Dan et al. [6] proposed establishing the relationship between the deviation value of material thickness and parameters such as the stopping margin of the wide belt and the reciprocating car by detecting the material layer distribution on the wide belt with sensors, thereby realizing distribution control. He Shuangping et al. [7]. proposed dividing the pendulum distributor into equal spacing arc lengths and controlling the oscillating belt to run for the same time within the same arc length distance, so as to achieve uniform distribution.
Based on the existing literature, there are few studies on the relationship between material quantity distribution and operating parameters during the shuttle car distribution process. Some researchers have attempted to investigate the feeding distribution under different equipment parameters via discrete element simulation, with the main adjusted parameters being those of the wide belt and roller screen [8,9,10]. The lateral feeding uniformity on the wide belt is mainly affected by the uniformity of the reciprocating lateral feeding of the shuttle feeder. Therefore, this paper studies the causes of uneven feeding based on the equipment structure of a selected plant, establishes the relationship between equipment operating parameters and the material receiving quantity at each position under this equipment structure, and optimizes the operating parameters of shuttle car feeding using the gradient descent optimization algorithm. The aim is to provide technical support for uniform feeding in pellet production.

2. Problem Analysis and Technology Introduction

2.1. Problem Analysis of Uneven Distribution by Shuttle Car

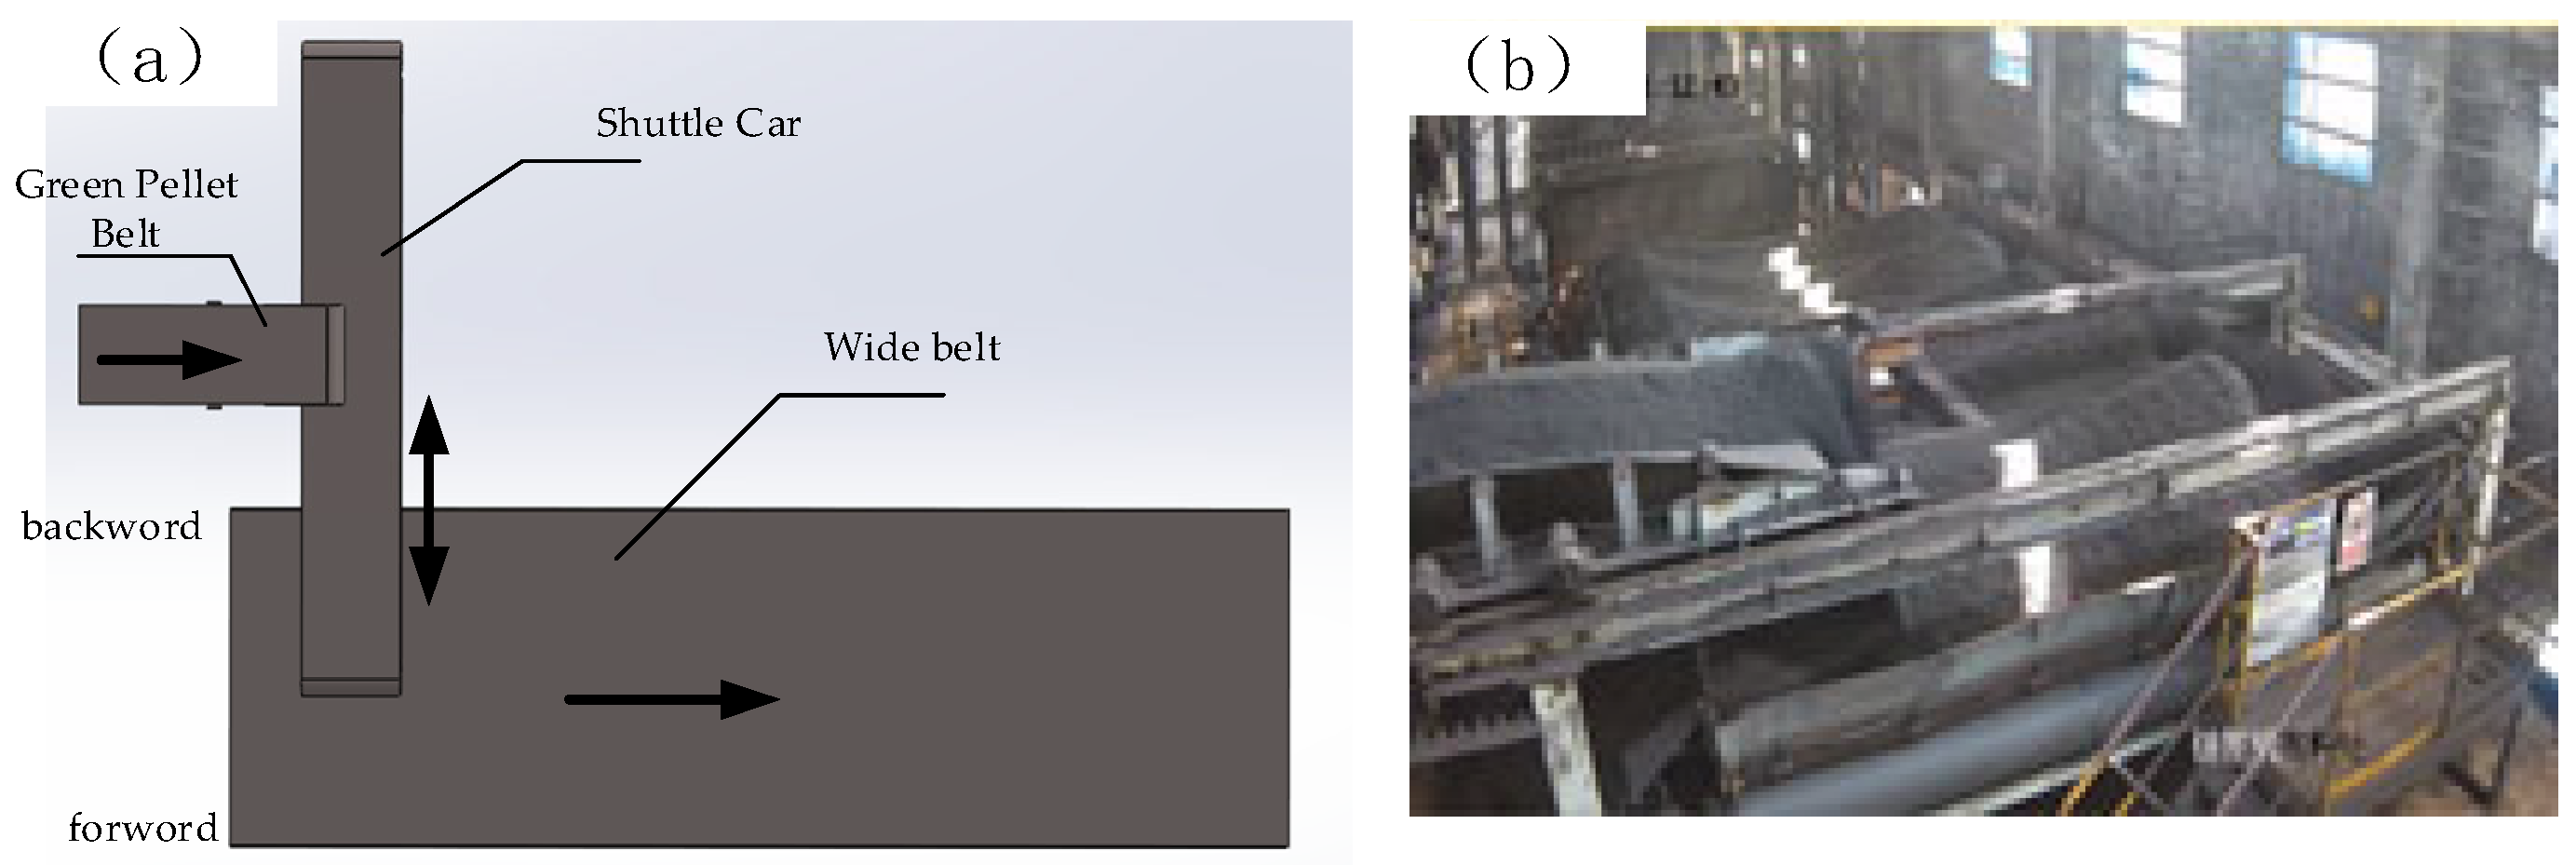
Shuttle feeding has two structural types: full-car reciprocating and head reciprocating. To facilitate the verification of the system’s application, this technology selects a domestic steel plant for research and application. The structure in this project is shown in Figure 1: green pellets produced by the pelletizing disc are collected onto the green pellet belt, which transports them to the shuttle car. Through forward and backward reciprocating movement, the shuttle car distributes the green pellets onto the wide belt.
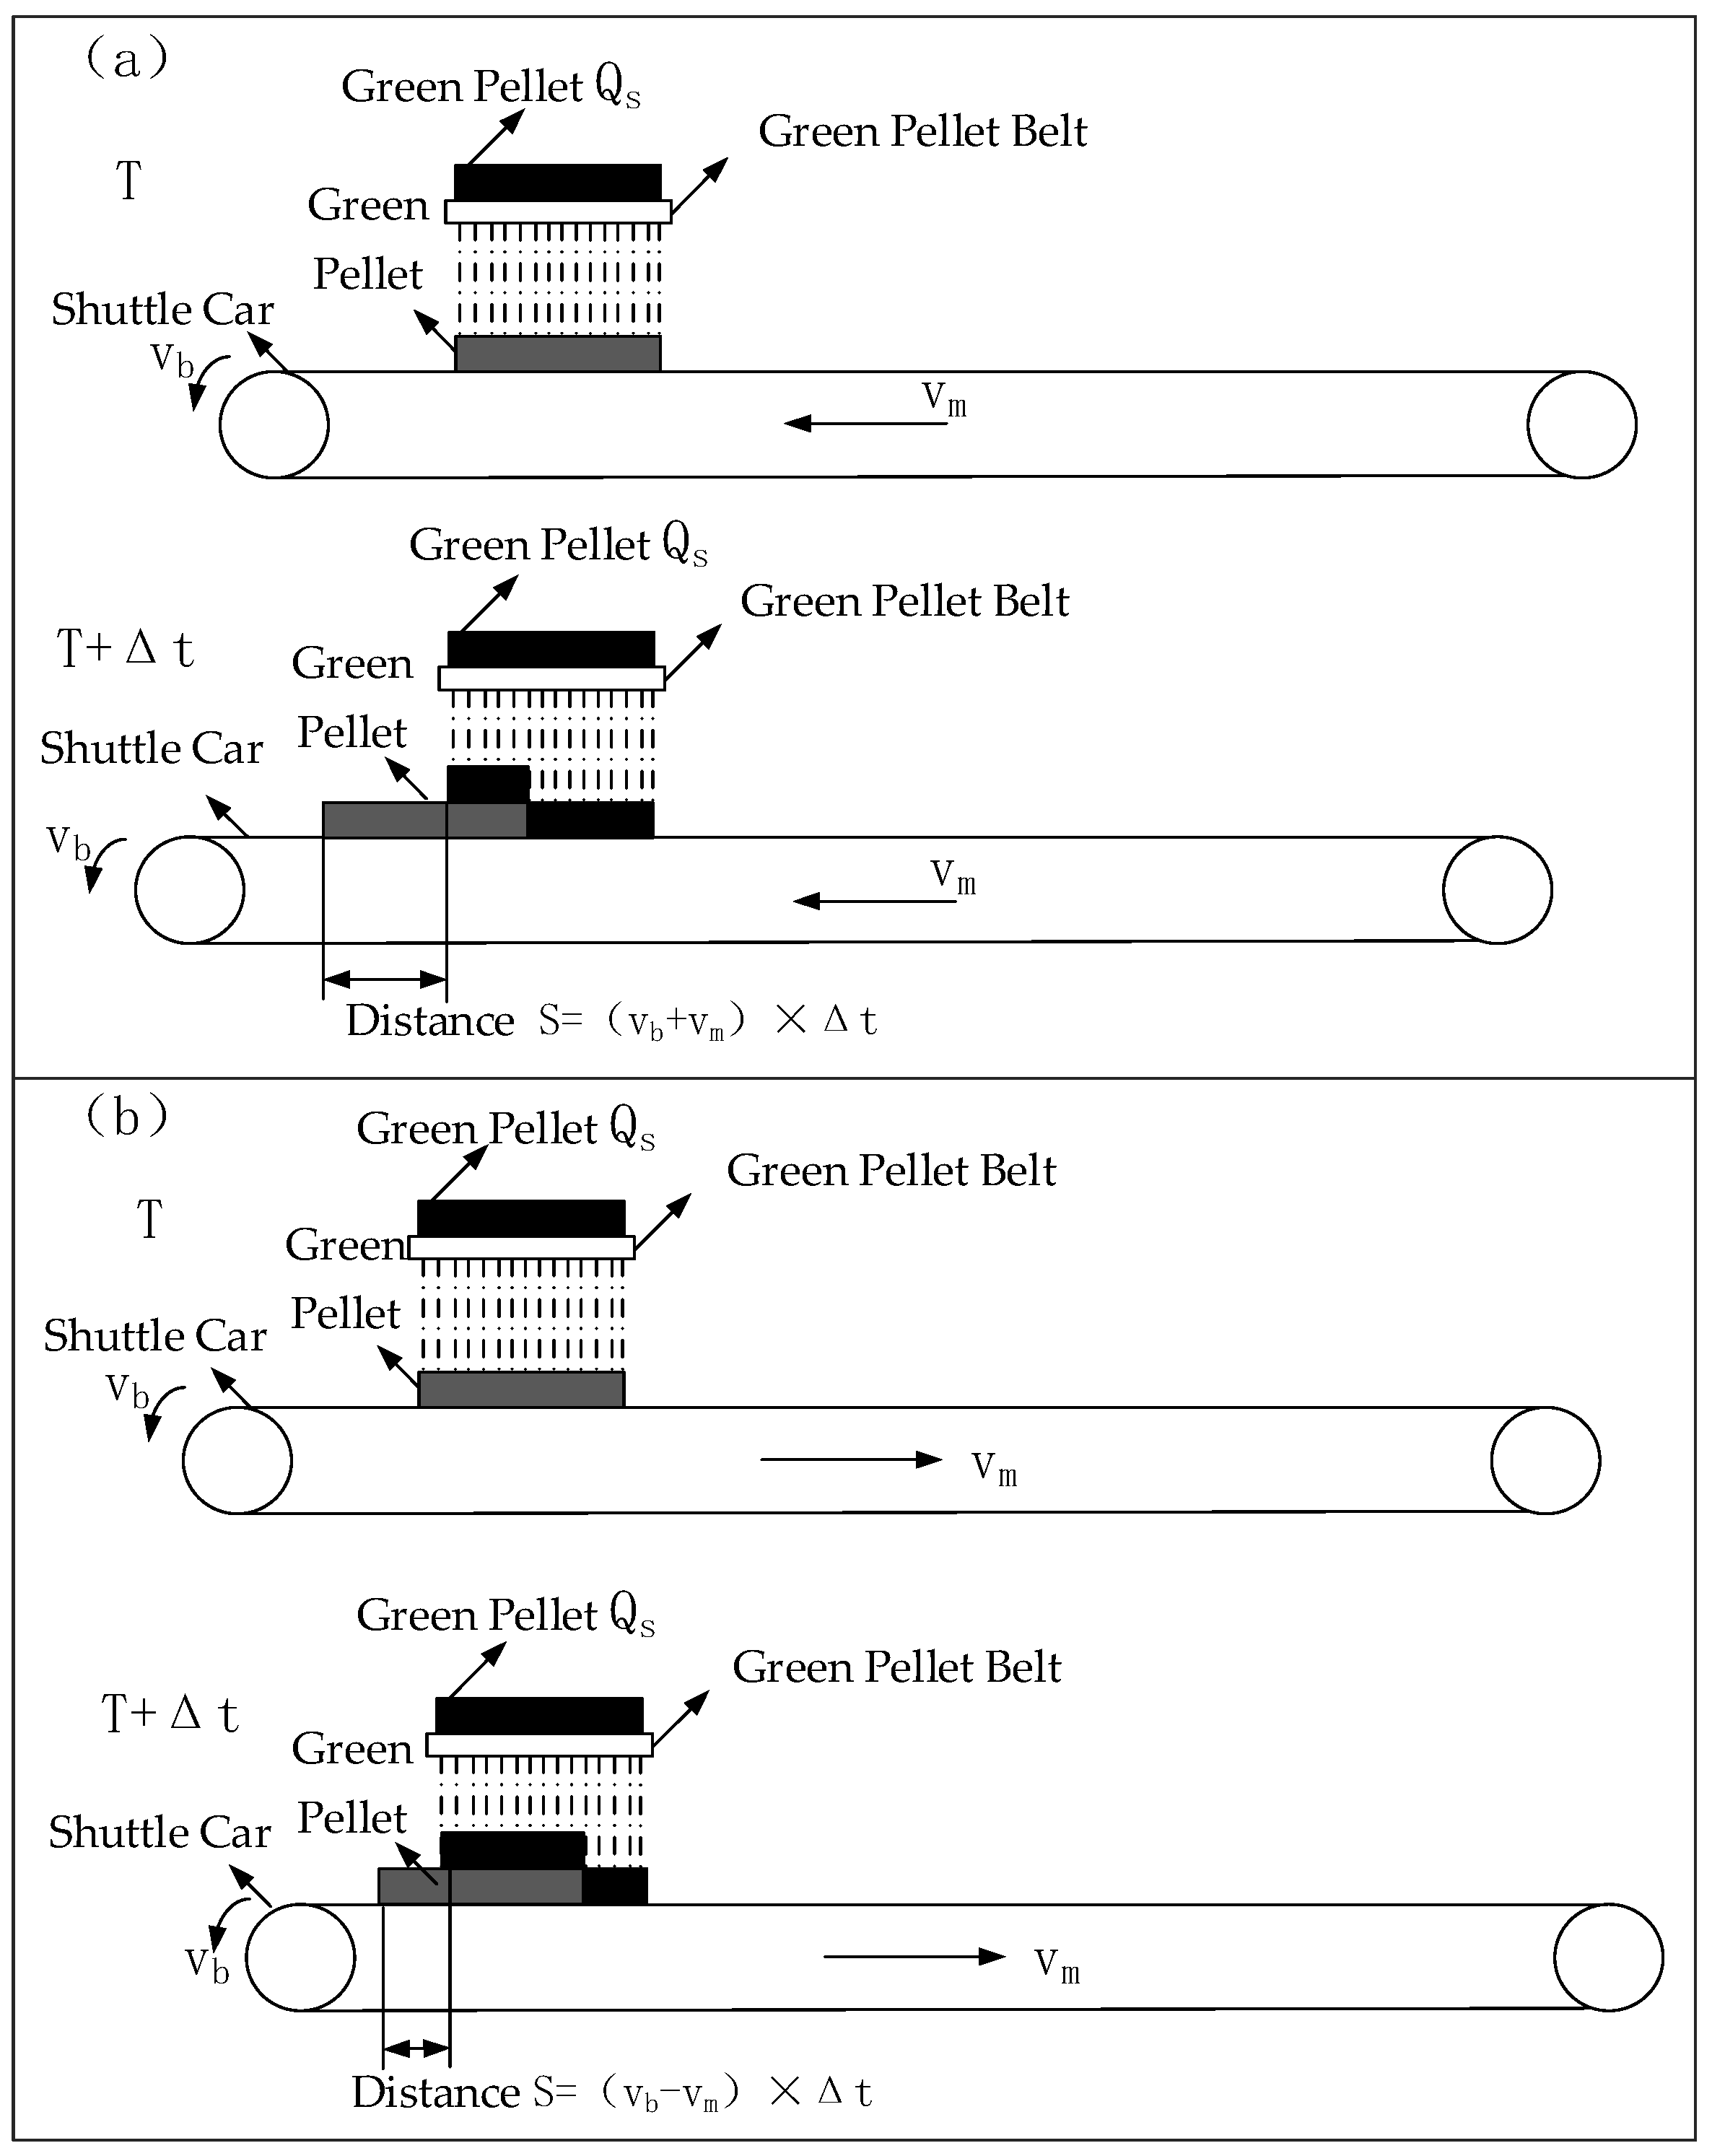
The shuttle car consists of a movable belt that operates unidirectionally. It continuously conveys the pellet ore transported by the green pellet belt. The entire shuttle car reciprocates perpendicular to the running direction of the wide belt to control the position where green pellets fall onto the wide belt. When the shuttle car moves forward, its relative speed with respect to the green pellet belt is the sum of the shuttle car’s moving speed and the shuttle belt’s speed: v b + v m ; when moving backward, the relative speed is the difference between the shuttle belt’s speed and the shuttle car’s moving speed: v b v m . Therefore, even if the feeding quantity of the green pellet belt is stable, the material receiving quantity on the shuttle belt fluctuates during the shuttle car’s reciprocating movement, leading to unstable material discharge onto the wide belt. As shown in Figure 2, within the same time interval, the moving distance of the material receiving position during the forward process is greater than that during the backward process, resulting in more material accumulation in the backward process. Thus, the material loaded per unit length on the shuttle car during the backward process is greater than that during the forward process. Even if the discharge speed is the same during both forward and backward movements of the shuttle car, the discharge quantity differs due to changes in the material loaded on the belt. Direction switching of the shuttle car requires start-up and braking time, and continuous material discharge during the commutation process causes material accumulation at both ends of the wide belt.
Due to the equipment structure inherently leading to uneven distribution in shuttle feeding, this paper first uses integral technology to simulate the distribution process. Based on the simulation results, it analyzes the uniformity and inversely optimizes the distribution parameters, realizing the rapid search for appropriate distribution parameters under a given production volume to ensure stable production.

2.2. Integral-Based Wide Belt Distribution Simulation Model

Due to the variation in material quantity during shuttle feeding, uneven distribution on the trolley will ultimately occur. To understand the distribution status, multiple radar level gauges are currently mostly installed uniformly along the cross-sectional direction of the trolley at the position where green pellets enter the roasting port to monitor the uniformity of trolley distribution [5]. The number of radar level gauges determines the monitoring accuracy of the material layer thickness on the cross-section, but generally only four to six measuring points are adopted in practice due to cost constraints. Since the distribution uniformity on the trolley is closely related to that on the wide belt, this paper proposes an integral-based distribution simulation approach.

2.2.1. Calculation of Shuttle Car Traveling Frequency

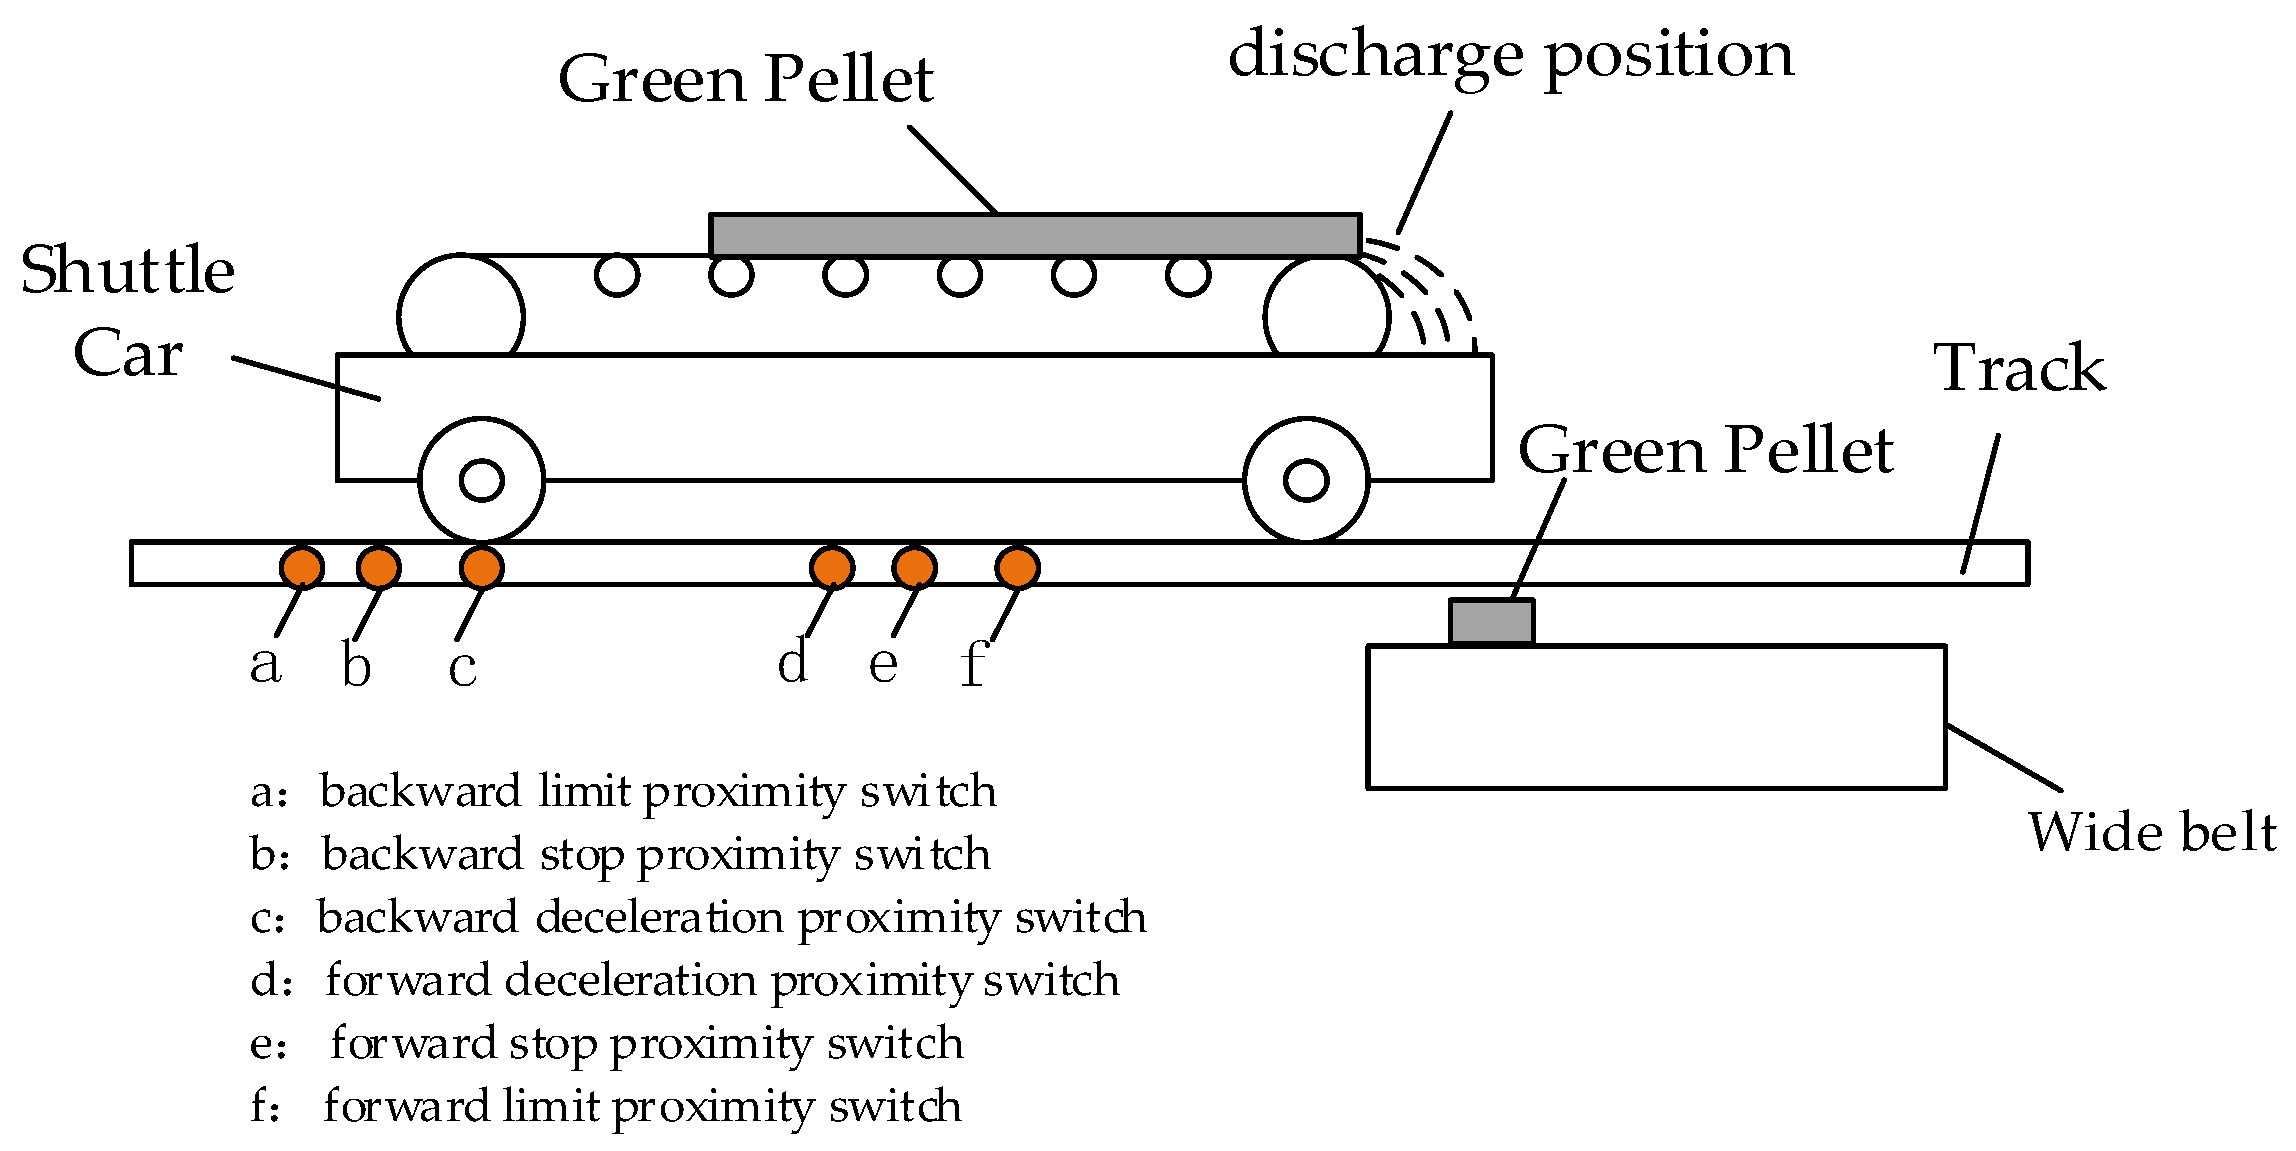
According to the shuttle car’s operation in the applied project, its operation is controlled by multiple proximity switches. As shown in Figure 3, six proximity switches are installed on the shuttle car’s running track. Deceleration proximity switches are used to set the advance deceleration frequency for the shuttle car during forward and backward movements, preventing it from failing to stop safely and overshooting the stop position when reaching the stop proximity switches. The limit proximity switches mark the maximum allowable distance the shuttle car can reach at both ends. Exceeding this position may cause the shuttle car to derail, leading to emergency shutdown due to accidents.
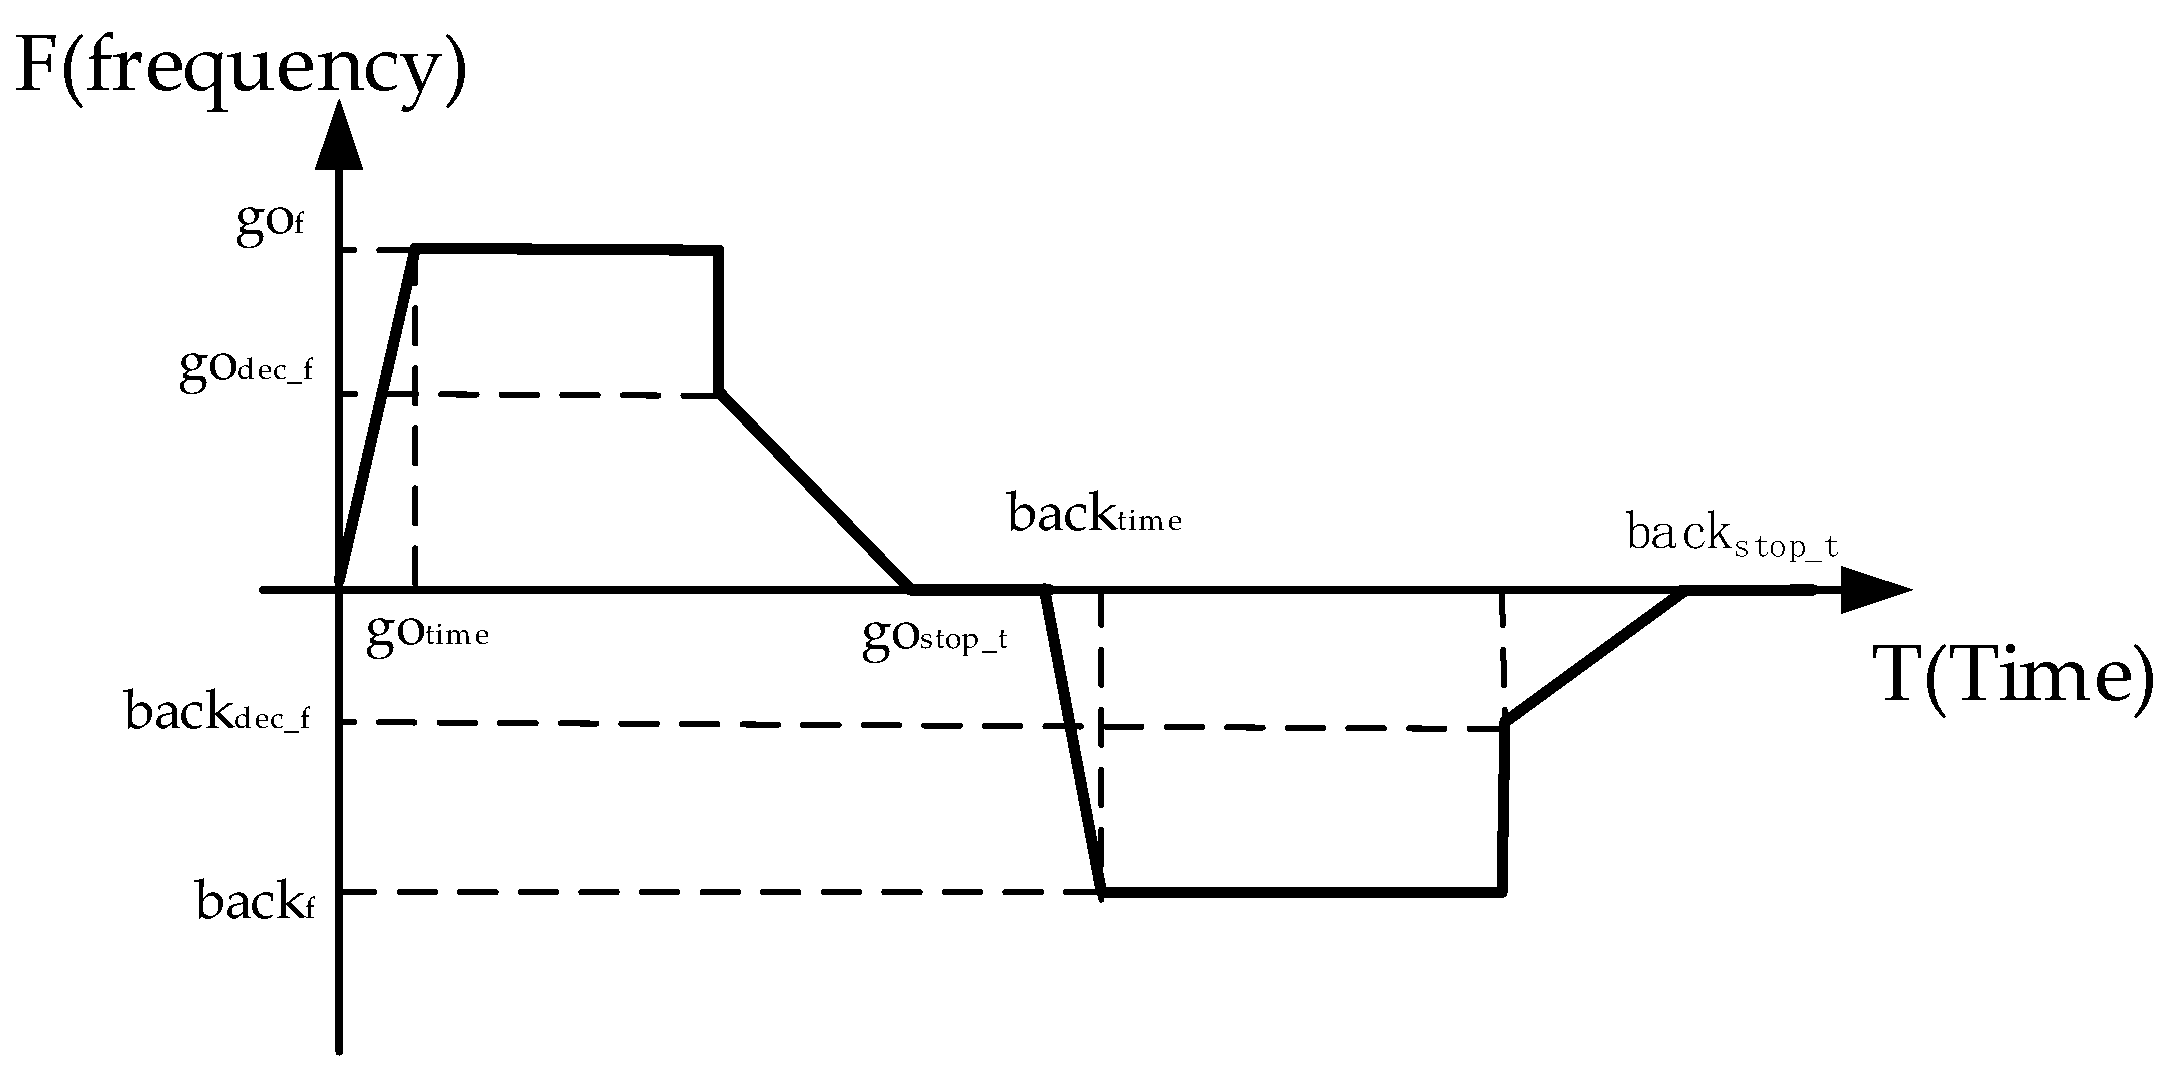
Based on the layout of the proximity switches, the operation of the shuttle car can be divided into eight states: shuttle car forward acceleration, shuttle car forward constant speed, shuttle car forward deceleration, shuttle car forward stop, shuttle car backward acceleration, shuttle car backward constant speed, shuttle car backward deceleration, and shuttle car backward stop. Thus, the setting parameters related to the shuttle car’s operation are as follows: shuttle car forward start-up time g o t i m e , shuttle car forward constant speed frequency g o f , shuttle car forward deceleration frequency g o d e c _ f , shuttle car forward stop time g o s t o p _ t , shuttle car backward start-up time b a c k t i m e , shuttle car backward constant speed frequency b a c k f , shuttle car backward deceleration frequency b a c k d e c _ f , and shuttle car backward stop time b a c k s t o p _ t , as shown in Figure 4.
Let the shuttle car’s travel sampling frequency be Δ t . Based on the above operating parameters, the shuttle car’s frequency values at each time point can be calculated as follows:
(1) Frequency of the shuttle car’s forward start-up phase
The acceleration and deceleration slope of the shuttle car’s motor speed changes linearly; thus, the frequency value vector F g o 1 of the shuttle car’s forward start-up phase is obtained:
F g o 1 = g o f g o t i m e / Δ t , g o f × 2 g o t i m e / Δ t , g o f × 3 g o t i m e / Δ t , , g o f
(2) Frequency of the shuttle car’s forward constant speed phase
First, calculate the operating distance of the start-up phase s g o 1 :
s g o 1 = v g o 2 × g o t i m e
Among them, v g o represents the speed of the shuttle car’s forward constant speed phase, which is calculated based on the conversion formula v = ( f × π × D ) / ( i × p ) between motor frequency and speed. In the formula, f is the motor frequency (hz); p denotes the number of motor pole pairs; v represents the shuttle car’s travel speed (m/s); D is the diameter of the motor’s drive drum (m); i denotes the proportional relationship between the motor’s input speed and output speed.
The moving distance of the constant speed phase is s g o 2 = s c d + ( s b c s g o 1 ) . Among them, s b c is the distance between the backward stop proximity switch and the backward deceleration proximity switch, and s c d is the distance between the backward deceleration proximity switch and the forward deceleration proximity switch. The frequency value vector is F g o 2 :
F g o 2 = [ g o f , g o f , , g o f ]
The length of the vector F g o 2 is s g o 2 v g o × Δ t .
(3) Frequency of the shuttle car’s forward deceleration phase
The shuttle car triggers the deceleration operation when it reaches the forward deceleration proximity switch, decelerates linearly according to the set deceleration frequency, and its speed becomes 0 when it reaches the position of the forward stop proximity switch. The speed at the deceleration point is v g o _ d e c = g o d e c _ f × π × D / ( i × p ) , the operating time of the forward deceleration phase is g o d e c _ t i m e = s d e × 2 v g o _ d e c , and the forward deceleration frequency vector is F g o 3 :
F g o 3 = g o dec _ f , ( g o dec _ f g o dec _ f g o d e c _ t i m e / Δ t ) , ( g o dec _ f g o f × 2 g o t i m e / Δ t ) , , 0
(4) Frequency of the shuttle car’s forward stop phase
To control the thickness of the material layer at both ends, a stop time is set for the shuttle car at both ends. The frequency vector F g o 4 = 0 , 0 , , 0 has a length of g o s t o p _ t Δ t .
Then, the frequency distribution of the shuttle car at every Δ t time during the forward movement is F g o = F g o 1 , F g o 2 , F g o 3 , F g o 4 . Following the same logic above, the frequency distribution vector of the shuttle car during the backward movement is calculated as F back .

2.2.2. Simulation Calculation of Material Receiving Capacity for Shuttle Cars and Wide Belts

Based on the dimensions of the equipment, corresponding arrays are established to store the material quantity of green pellets distributed per unit length on each equipment. The array of green pellet belt width is W sq , the array of shuttle car length is L sc , and the array of wide belt width is W k . The lengths of the arrays are N 1 , N 2 , and N 3 , respectively, with all initial values set to 0. The starting coordinate of material receiving for the shuttle car belt is S S s t a r t , and the starting coordinate of material receiving for the wide belt is S K s t a r t . The arrays obtain the comprehensive production throughput from the system and calculate the feeding quantity q s q of the green pellet belt within time Δ t . The green pellet quantity per unit length on the green pellet belt is q s q :
q s q = q s q / W s q
The material initially received by the shuttle car in its initial state:
L s c s t a r t [ S S i _ s t a r t , S S i _ s t a r t + W s q ] = q s q
At the j-th moment during the forward movement, the running speed v s c _ b of the shuttle car belt is obtained based on its current frequency. The forward moving speed v s c _ m of the shuttle car is calculated using F g o [ j ] , thereby deriving the moving distance d s c _ m of the shuttle car and the moving distance d s c _ b of the shuttle car belt compared to the previous moment. All values in the shuttle car array L sc j 1 at the (j − 1)-th moment are shifted forward by a length of d s c _ b as a whole. The material corresponding to the shifted distance falls onto the wide belt (denoted as q s c = s u m ( L sc j 1 [ 0 , d s c _ b 1 ] ) ), and the tail of the shuttle car array is assigned a value of L sc j 1 [ N 2 d s c _ b 1 , N 2 1 ] = 0 to simulate the change in material distribution caused by the movement of the shuttle car belt. At the j-th moment, the starting coordinate of material receiving for the shuttle car belt is S S j = S S j 1 + d s c _ m . The material quantity in the shuttle car array at the j-th moment is L sc j [ S S j , S S j + W s q ] = L sc j 1 [ S S j , S S j + W s q ] + q s q . This is used to simulate the change in the shuttle car’s material receiving position caused by its movement and the distribution change brought by the newly added material. The material receiving quantity at each position of the wide belt is W k [ S K j 1 , S K j 1 + d s c _ m ] = q s c / d s c _ m .
At the j-th moment during the shuttle car’s backward movement, the running speed v s c _ b of the shuttle car belt is obtained based on its current frequency. The backward moving speed v s c _ m of the shuttle car is calculated using F back [ j ] , thereby deriving the moving distance d s c _ m and d s c _ b . Similarly, all values in the shuttle car array L sc j 1 at the (j − 1)-th moment are shifted forward by a length of d s c _ b as a whole. The material corresponding to the shifted distance falls onto the wide belt (denoted as q s c = s u m ( L sc j 1 [ 0 , d s c _ b 1 ] ) ), and the tail of the shuttle car array is assigned a value of L sc j 1 [ N 2 d s c _ b 1 , N 2 1 ] = 0 to simulate the change in material distribution caused by the movement of the shuttle car belt. At the j-th moment, the starting coordinate of material receiving for the shuttle car belt is S S j = S S j 1 d s c _ m . The material quantity in the shuttle car array at the j-th moment is L sc j [ S S j , S S j + W s q ] = L sc j 1 [ S S j , S S j + W s q ] + q s q . The material receiving quantity at each position of the wide belt is W k [ S K j 1 , S K j 1 d s c _ m ] = q s c / d s c _ m .
Subsequently, the shuttle car operates in a forward–backward cycle. Through the above steps, the material distribution on the shuttle car and the wide belt of the distributing system under the current parameters can be simulated.

2.3. Gradient Descent-Based Distribution Optimization Control Model

In actual working conditions, the shuttle car distribution process has problems such as longitudinal stacking deviation and uneven transverse distribution. Traditional control methods rely on the setting of empirical parameters and have difficulty meeting the dynamic adjustment needs under complex working conditions. As an efficient continuous optimization method, the gradient descent algorithm has shown excellent parameter optimization capabilities in the field of industrial control [11,12]. In addition to equipment operating parameters, the feeding condition is also affected by factors such as the vibration energy of equipment [13,14]. For example, the roller screen exerts a certain dispersing effect during operation. To reduce the complexity of the model, vibration energy is not incorporated into the model in this paper. Meanwhile, during the production process of large-scale equipment, frequent adjustments to equipment operating parameters are prohibited to reduce production fluctuations and extend equipment service life when the production volume is preset. Therefore, after obtaining the preset production volume, this paper proposes a gradient descent optimization model based on operation phase division, which is tailored to the feeding characteristics of the dual processes of the shuttle car’s forward and backward movements. By establishing the mapping relationship among production volume, operating parameters of the acceleration, constant-speed and deceleration phases, and feeding uniformity indicators, a multi-objective optimization function is constructed. The gradient descent algorithm is then employed to achieve the collaborative optimization of control parameters in each phase, ultimately realizing the simultaneous improvement of both longitudinal and transverse uniformity.

2.3.1. The Principle of the Gradient Descent Algorithm

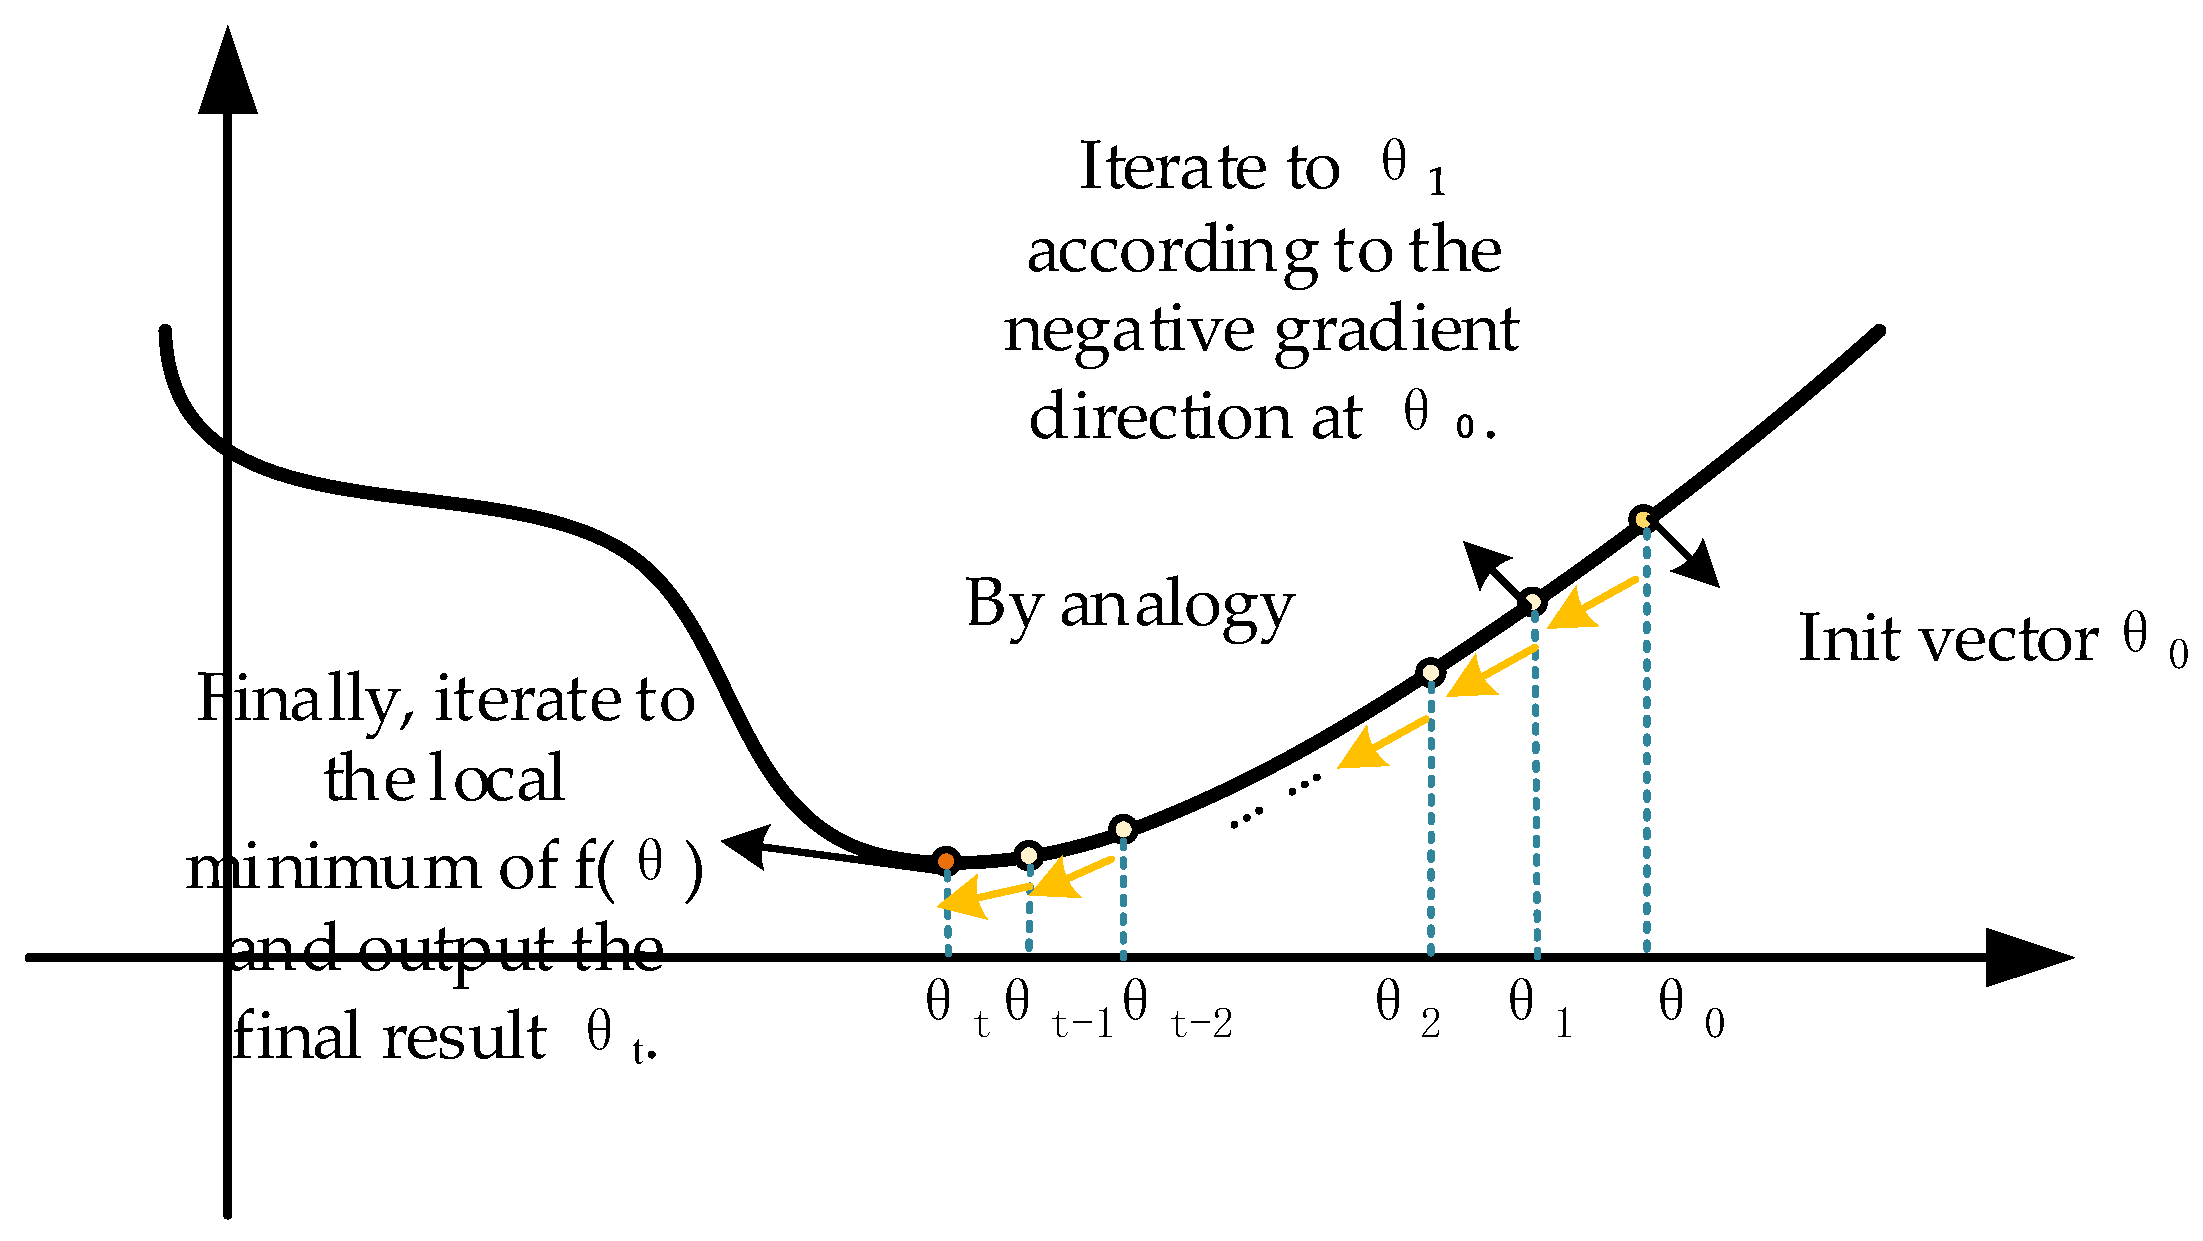
Gradient descent is an iterative method based on first-order optimization. Its core idea is to continuously update parameters along the negative direction of the gradient of the objective function, thereby gradually approaching the minimum value of the function. As shown in Figure 5, for a continuously differentiable objective function f θ , gradient descent is updated through the following iterative formula:
θ t + 1 = θ t α f θ t
Among them, θ is the parameter vector, the gradient f θ represents the direction of the maximum rate of change of the function at that point, α is the step size (learning rate) during each iterative update, and t denotes the number of iterations.
Common gradient descent methods include Batch Gradient Descent (BGD), Stochastic Gradient Descent (SGD), and Mini-Batch Gradient Descent (MBGD). In Batch Gradient Descent, the gradient is calculated using the entire dataset in each iteration, ensuring stable convergence but incurring high computational costs. Stochastic Gradient Descent randomly selects one sample per iteration to compute the gradient, offering fast calculation speed yet exhibiting significant fluctuations during the convergence process. Mini-Batch Gradient Descent combines the advantages of both approaches; by calculating the gradient using a subset of samples, it balances stability and convergence speed. As indicated in Equation (7), the learning rate plays a crucial role in gradient descent. A too-small step size leads to slow convergence; excessively refined searching may not only result in low efficiency but also fail to find a favorable local optimal solution. A too-large step size, while shortening the convergence time, may cause drastic parameter fluctuations and even deviate from the optimal range.

2.3.2. Gradient Descent Optimization Model for Fabric Based on Operation Phase Division

Since the operating parameters for regulating the shuttle car’s fabric distribution vary across different phases, for instance, when the material discharge amount is insufficient at both ends of the shuttle car, priority can be given to adjusting the front or rear stopping time of the shuttle car. In contrast, the main adjustable parameter for the material discharge amount during the uniform speed phase of the shuttle car is its traveling speed. Combining the characteristics of gradient descent and the requirements of fabric distribution optimization, this paper proposes a gradient descent optimization model for fabric distribution based on operation phase division. First, through simulation calculations, the fabric distribution vector on the wide belt during the shuttle car’s forward movement W k g o and backward movement W k b a c k , under the current parameters can be obtained, respectively. According to the operating distances of the shuttle car in acceleration, uniform speed, and deceleration phases, W k g o and W k b a c k are each divided into three segments: W k g o _ 1 , W k g o _ 2 , W k g o _ 3 , W k b a c k _ 1 , W k b a c k _ 2 , W k b a c k _ 3 .
Optimization objectives are established by region based on the operation phases. Among them, the evaluation index for longitudinal uniformity is the mean difference of fabric distribution between the forward and backward movements, expressed as follows:
d i f f 1 = avg ( W k g o ) a v g ( W k b a c k )
A smaller value of d i f f 1 indicates a more uniform longitudinal distribution. The evaluation index for lateral uniformity is the difference between the mean value of each segmented small region and the total mean value of the corresponding operation direction:
d i f f 2 = avg ( W k g o ) a v g ( W k g o _ 1 ) d i f f 3 = avg ( W k g o ) a v g ( W k g o _ 2 ) d i f f 4 = avg ( W k g o ) a v g ( W k g o _ 3 ) d i f f 5 = avg ( W k b a c k ) a v g ( W k b a c k _ 1 ) d i f f 6 = avg ( W k b a c k ) a v g ( W k b a c k _ 2 ) d i f f 7 = avg ( W k b a c k ) a v g ( W k b a c k _ 3 )
Similarly, a smaller difference indicates a more uniform distribution.
The operating parameters of each phase include the shuttle car’s forward start time g o t i m e , forward uniform speed frequency g o t i m e , and forward deceleration frequency g o d e c _ f , etc. Based on these, we construct the optimization variable X = [ g o t i m e , g o f , g o d e c _ f , ] .
Considering the uniformity requirements of each phase comprehensively, a segmented weighted objective function is constructed.
min F ( X ) = ϖ 1 ( d i f f 1 ) + ϖ 2 ( d i f f 2 + d i f f 3 + d i f f 4 ) + ϖ 3 ( d i f f 5 + d i f f 6 + d i f f 7 )
Among them, ϖ 1 , ϖ 2 , and ϖ 3 are weight coefficients, which are dynamically adjusted based on process priorities and on-site operational experience. Since the transverse feeding uniformity is adopted as the core evaluation index in this system, the coefficients are set ϖ 1 = ϖ 2 = 0.4 , ϖ 3 = 0.2 . The weight ratios can be flexibly adapted according to the evaluation requirements of different plants. Since all parameters need to cooperate in fabric control, this technology is optimized and improved based on the BGD method. We calculate the partial derivatives of each extreme objective function with respect to each variable to form the gradient vector Δ F ( X ) , and adopt a gradient descent strategy with an adaptive learning rate to iteratively update the parameters. Given that the operating frequency of on-site equipment must be an integer, η K is set to a fixed value of 1 in this study.
Constraint conditions are set for the operating parameters of each phase, and their value ranges are related to the actual equipment parameters. For example, all variable values are not less than 0, and the maximum motor frequency is 50 Hz. In addition, the following requirements are also specified: g o f > g o d e c _ f , b a c k f > b a c k d e c _ f .
To address the coupling between phases such as forward movement, backward movement, acceleration, uniform speed, and deceleration, a phased alternating optimization strategy is adopted: (1) fix the parameters of the acceleration and deceleration phases and optimize the parameters of the uniform speed phase; (2) based on the previous optimization results, optimize the parameters of the acceleration and deceleration phases; (3) perform global collaborative iteration until the objective function converges.

3. Result and Discussion

When the production conditions are determined, the fixed parameters of the model are obtained as follows: the bulk density is 2.2 t/m3, the distance between proximity switches are s a b = 290 ( mm ) , s b c = 320 ( mm ) , s c d = 3000 ( mm ) , s d e = 400 ( mm ) , s e f = 420 ( mm ) , the speed ratio of the shuttle car’s traveling motor is 121.46, the diameter of the traveling motor is 400 mm, the number of pole pairs of the traveling motor is 2, the speed ratio of the shuttle car’s belt motor is 62.31, the diameter of the belt motor is 630 mm, and the number of pole pairs of the belt motor is 2.
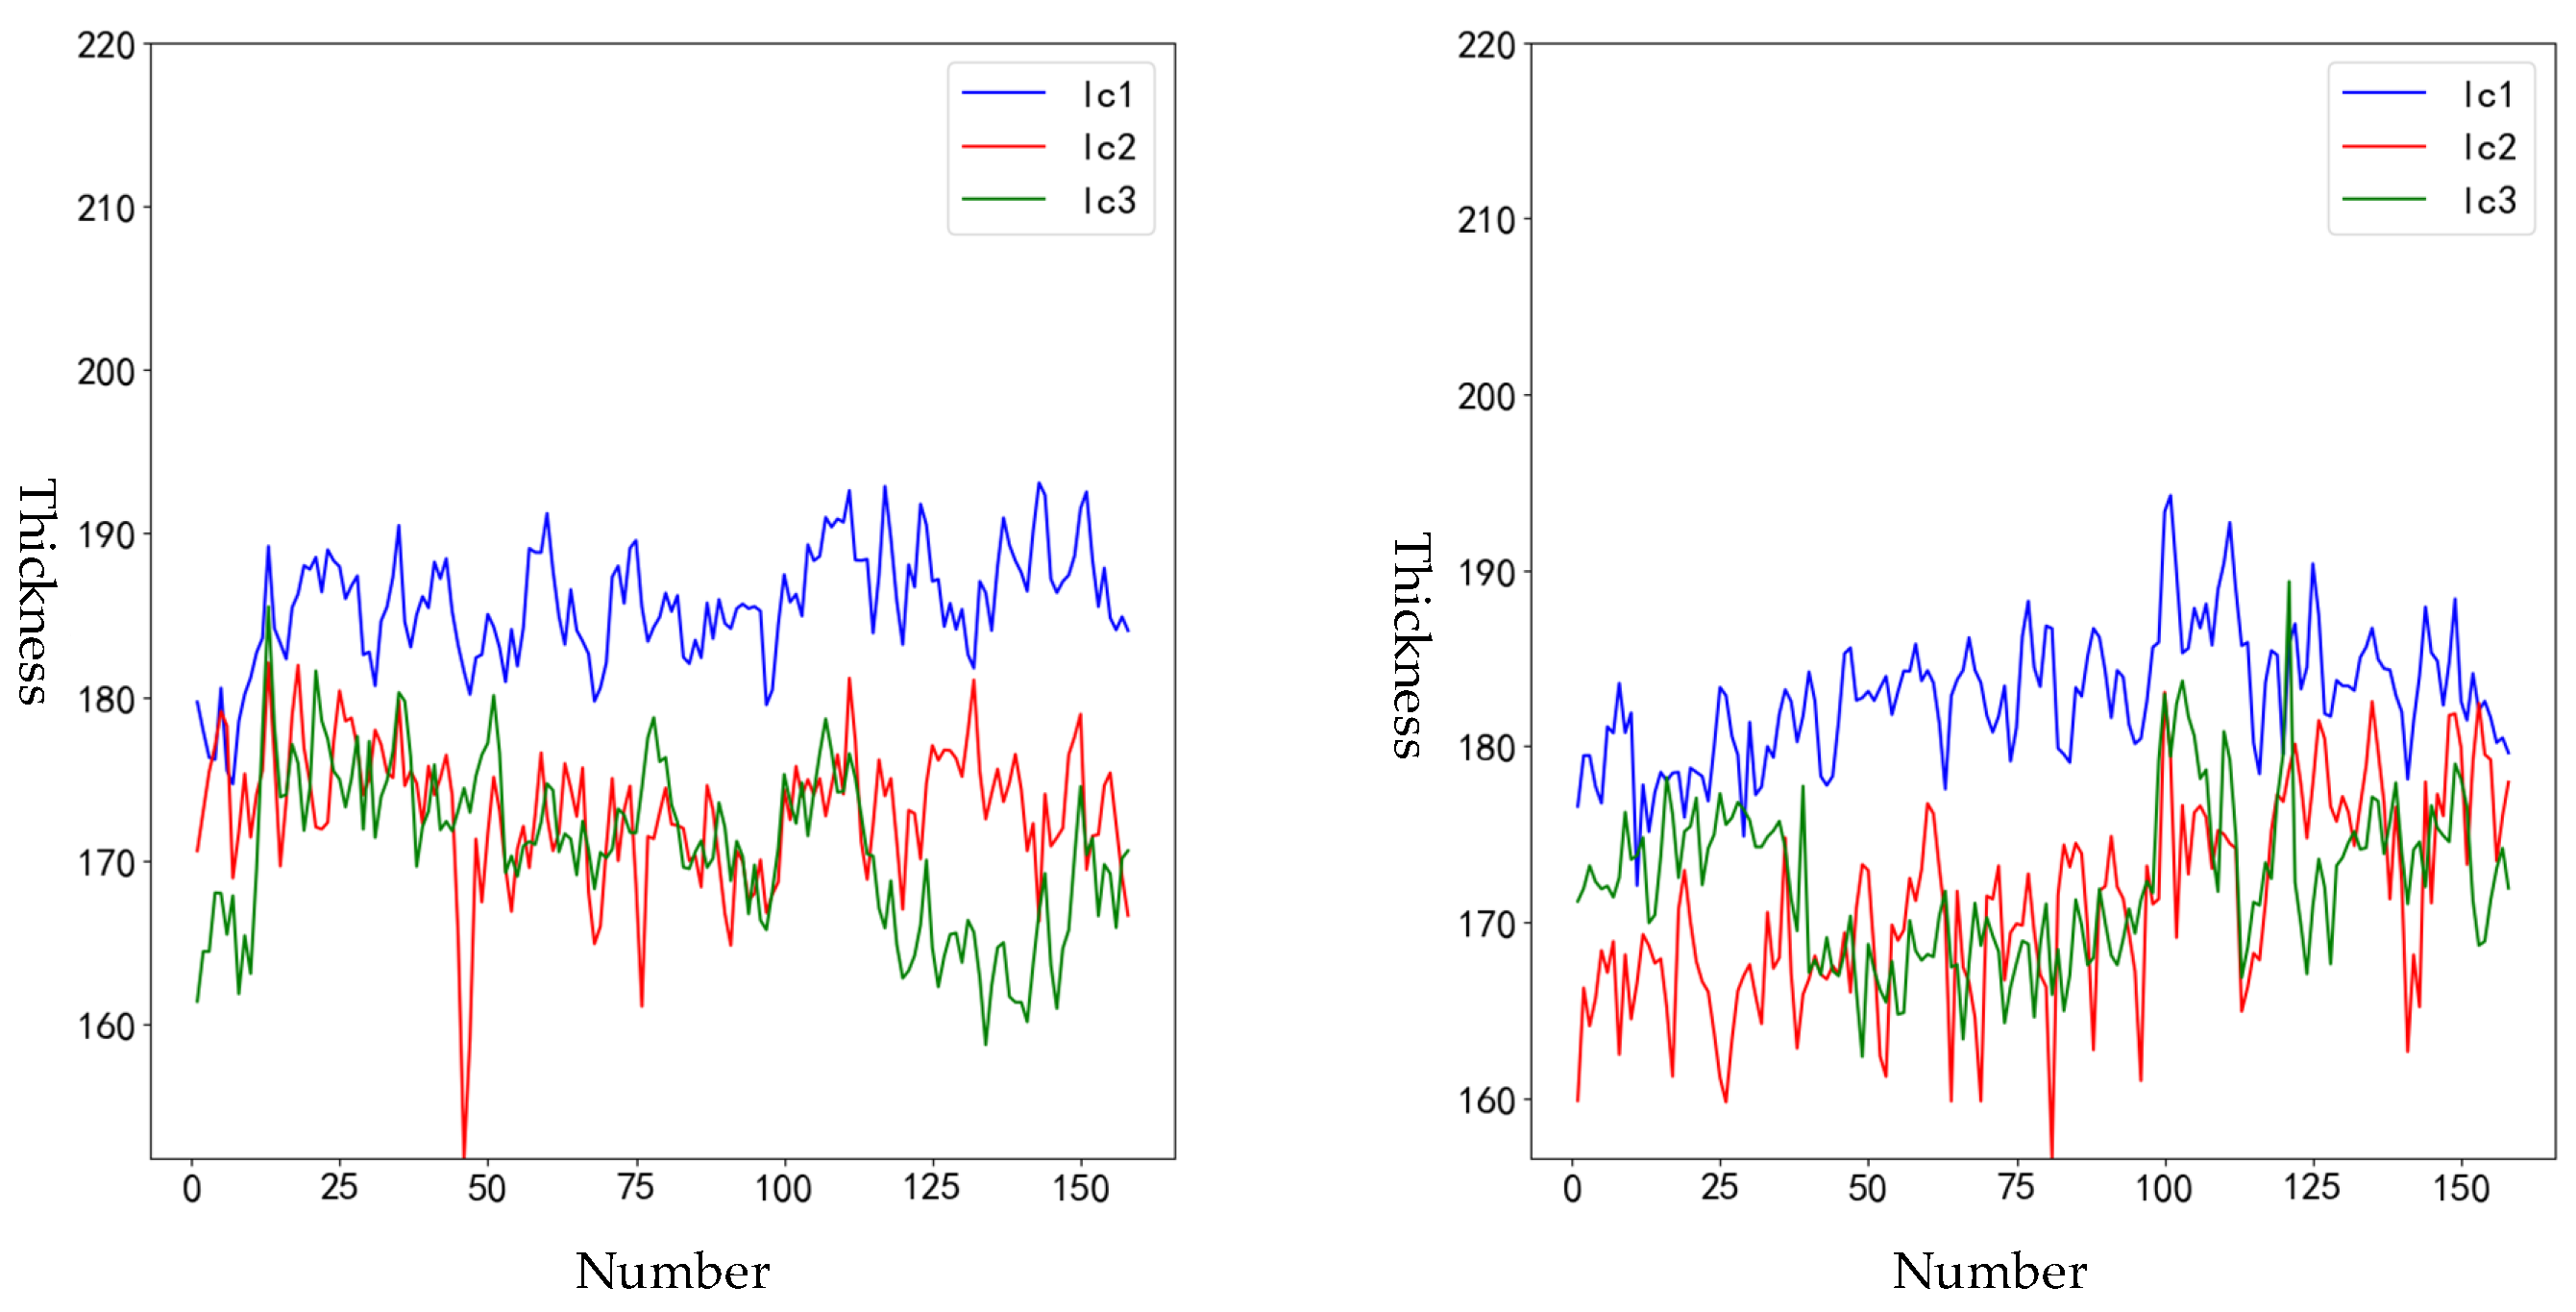
We analyze the bed thickness values several hours before and after the optimization model is put into operation, and the values are shown in Figure 6. In the figure, the X-axis represents the time sequence cycle, Y-axis represents the thickness. Lc1 denotes the thickness at the No. 1 level gauge, lc2 denotes the thickness at the No. 2 level gauge, and lc3 denotes the bed thickness at the No. 3 level gauge.
The more stable the thickness at each level gauge over the time sequence cycle, the more uniform the longitudinal fabric distribution; the closer the thickness values at the three positions, the better the lateral fabric uniformity. To quantify the fabric uniformity, the cosine distance, Euclidean distance, and central distance of the three curves are calculated to measure the degree of aggregation between vectors—smaller values indicate higher aggregation and better fabric uniformity. The comparison of uniformity before and after optimization is shown in Table 1.
The cosine distance values before and after deployment are 0.999496 and 0.999496, respectively. From the cosine distance, it can be seen that the longitudinal uniformity has not improved significantly after the model is put into operation, which is also evidenced by the significant fluctuations in thickness over the time cycle as shown in Figure 6. Based on on-site investigation and analysis, the core reason for the limited improvement in longitudinal uniformity lies in dual constraints: First, there are the inherent characteristics of the equipment structure—even when the incoming material flow is stable, the material receiving volume during the shuttle car’s forward and backward movements is inherently inconsistent due to relative speed differences, and this structural limitation exerts a significant impact on longitudinal uniformity. Second, there are the constraints of process and parameter adjustment—the preset production output remains relatively fixed for an extended period during on-site production, and it is neither permitted nor feasible to adjust the output according to the shuttle car’s moving direction. Consequently, it is difficult to offset the longitudinal fluctuations caused by inherent structural defects merely by adjusting the shuttle car’s belt speed and movement speed.
After deployment, the average Euclidean distance between each pair of curves decreased from 150.33713 to 131.82897. From the perspective of Euclidean distance, the lateral fabric uniformity has improved by 12.31% after the optimization model was put into operation. After deployment, the average central distance between the three curves and their corresponding mean value decreased from 158.63992 to 109.42816. From the perspective of central distance, the lateral fabric uniformity has improved by 31.02% after the optimization model was put into operation. Based on the above data analysis, it can be concluded that after the deployment of this model, the lateral distribution uniformity has been significantly improved without affecting the longitudinal distribution uniformity.

4. Conclusions

To address the uneven distribution issues of the shuttle distributing system in pellet production (such as material piling at both ends of the wide belt, insufficient parameter matching, and reliance on manual adjustment), this paper proposes an intelligent control method based on Integral Simulation and Gradient Descent optimization (IS-GD). By constructing a simulation model of the shuttle car’s operating state, the material distribution laws during the acceleration, uniform speed, deceleration, and other phases of the shuttle car’s forward and backward movement are accurately depicted. Combined with a phased gradient descent strategy, the shuttle car’s operation control parameters are optimized with the goal of minimizing the uniformity index, achieving the coordinated improvement of both longitudinal and lateral distribution uniformity. Experimental results show that this method significantly improves the lateral distribution uniformity, with the lateral uniformity increased by 12.31% and 31.02%, respectively, in terms of indicators, providing reliable technical support for the intelligent distribution in pellet production. Future research can be deepened in three aspects: first, introduce reinforcement learning algorithms to enhance the model’s adaptive optimization capability for dynamic operating conditions (such as fluctuations in material properties and changes in equipment status); second, expand the multi-equipment collaborative optimization framework, integrate the shuttle car, wide belt, roasting equipment, etc., into the overall optimization system to improve system-level distribution uniformity; third, develop a real-time optimization system based on edge computing to shorten the parameter adjustment response time, meet the high real-time control requirements of industrial sites, and further promote the green, efficient, and intelligent upgrading of pellet production.

Author Contributions

Conceptualization, T.L., X.L. and X.Z.; methodology, T.L., J.Z. and C.L.; software, T.L. and W.W.; validation, T.L.; formal analysis, T.L. and C.L.; investigation, T.L. and X.L.; resources, C.L.; data curation, T.L. and X.L.; writing—original draft preparation, T.L.; writing—review and editing, T.L.; visualization, T.L.; supervision, X.Z.; project administration, X.Z. and Z.L.; funding acquisition, X.Z. and Z.L. All authors have read and agreed to the published version of the manuscript.

Funding

This research was funded by The Science-Technology Foundation for Young Scientist of China Minmetals Corporation (2024QNJJA04).

Data Availability Statement

The data presented in this study are available from the corresponding author upon reasonable request.

Conflicts of Interest

Authors Tingting Liao, Xiaoxin Zeng, Xudong Li, Zongping Li and Chen Liu were employed by the company ZhongYe ChangTian International Engineering Co., Ltd. Author Weisong Wu was employed by the company ZhongYe ChangTian (Changsha) Intelligent Technology Co., Ltd. The remaining authors declare that the research was conducted in the absence of any commercial or financial relationships that could be construed as a potential conflict of interest.

Abbreviations

The following abbreviations are used in this manuscript:
IS-GDIntegral Simulation and Gradient Descent optimization
BGDBatch Gradient Descent
SGDStochastic Gradient Descent
MBGDMini-Batch Gradient Descent

References

  1. Zhang, F.M.; Zhang, W.H.; Qing, G.L.; Wang, Q.S.; Han, Z.G. Design and Application of Pelletizing Technical Equipment for Large-scale Belt Roaster. Sinter. Pellet 2021, 46, 66–75. [Google Scholar]
  2. Fan, X.H. Principles of Sintering and Pelletizing Plant Design; Central South University Press: Changsha, China, 2016; pp. 10–20. [Google Scholar]
  3. Zhang, R.X.; Huang, S.L.; Gao, X.S.; Duan, Z.J. Discussion on Automatic Control of Rotary Kiln Roasting. Metall. Power 2020, 239, 60–63. [Google Scholar]
  4. Yu, H.Z.; Liao, J.Y.; Fan, X.H. Application and Research Progress of Pelletizing Technology for Belt Roasters. Sinter. Pellet 2020, 45, 47–54. [Google Scholar]
  5. Zhi, Q.; Zhang, F.M.; Han, Z.G.; Zhang, Q.Z. Research and Application of Uniform Distribution for Belt Roasters. Sinter. Pellet 2024, 49, 57–60. [Google Scholar]
  6. Xu, Y.X. Cause Analysis and Improvement of Uneven Distribution in Grate Machines. Mach. Autom. 2013, 9, 98–107. [Google Scholar]
  7. Zhou, J.P. Control of Cloth Uniformity for Belt Roaster Pallets. Metall. Equip. 2023, 6, 84–88. [Google Scholar]
  8. Li, D.; Han, J.X.; Ren, W.; Qi, Z.F.; Zhou, J.P. Adaptive Control Method for Feeding Equipment of Belt Roaster Based on Uniform Distribution. Patent 202410511101, 14 June 2024. [Google Scholar]
  9. Huang, S.P.; Zhang, Z.X.; Qiu, X.L. Design of Pellet Uniform Distribution Model. Control Eng. 2009, 16, 1–3. [Google Scholar]
  10. Chen, Z.L.; Han, J.X.; Ren, W. Discrete Element Simulation Study on Distribution and Screening System of Belt Roaster. Sinter. Pellet 2019, 44, 45–49. [Google Scholar]
  11. Ge, Q.B.; Zhang, J.Z.; Yang, Q.M.; Li, H. Adaptive Gradient Descent Optimization Algorithm with Derivative Term Improvement. Control Theory Appl. 2022, 39, 623–632. [Google Scholar]
  12. Wu, J. Research on Stochastic Parallel Gradient Descent Algorithm Based on Segmented Random Disturbance Amplitude; China University of Mining and Technology: Xuzhou, China, 2015. [Google Scholar]
  13. Liu, C.R.; Wang, Y.W.; Zhang, W.; Yang, K.P.; Ma, J.J.; Sun, H. Nonlinear dynamics of a magnetic vibration isolator with higher-order stable quasi-zero-stiffness. Mech. Syst. Signal Process. 2024, 218, 111584. [Google Scholar] [CrossRef] [Scilit]
  14. Liu, C.R.; Zhang, R.; Yang, K.P.; Li, H.P.; Li, B.P. A quasi-zero-stiffness device capable of vibration isolation and energy harvesting using piezoelectric buckled beams. Energy 2021, 233, 121146. [Google Scholar] [CrossRef] [Scilit]
Figure 1. Structure of green ball belt and shuttle car distributing device. (a) schematic diagram; (b) physical diagram.
Processes 14 00490 g001
Figure 2. Schematic of material receiving during the forward and backward operation of the shuttle distributor. (a) shuttle car forward movement; (b) shuttle car backward movement.
Processes 14 00490 g002
Figure 3. Schematic of the shuttle car structure in the applied engineering project.
Processes 14 00490 g003
Figure 4. Schematic of the shuttle car’s operating frequency variation.
Processes 14 00490 g004
Figure 5. Schematic of gradient descent.
Processes 14 00490 g005
Figure 6. Level gauge material layer thickness values before and after model implementation.
Processes 14 00490 g006
Table 1. Comparison of uniformity indicators before and after model implementation.
Cosine DistanceEuclidean DistanceCentral Distance
before optimization0.999496150.33713158.63992
after optimization0.999448131.82897109.42816
lift ratio0.0048%12.31%31.02%
Disclaimer/Publisher’s Note: The statements, opinions and data contained in all publications are solely those of the individual author(s) and contributor(s) and not of MDPI and/or the editor(s). MDPI and/or the editor(s) disclaim responsibility for any injury to people or property resulting from any ideas, methods, instructions or products referred to in the content.