Article

Numerical Simulation of Mechanical Parameters of Oil Shale Rock in Minfeng Subsag

1
School of Energy Resources, China University of Geosciences Beijing, Beijing 100083, China
2
Beijing Key Laboratory of Unconventional Natural Gas Geological Evaluation and Development Engineering, China University of Geosciences Beijing, Beijing 100083, China
*
Authors to whom correspondence should be addressed.
Processes 2026, 14(3), 476; https://doi.org/10.3390/pr14030476
Submission received: 9 January 2026 / Revised: 24 January 2026 / Accepted: 27 January 2026 / Published: 29 January 2026
(This article belongs to the Special Issue Advances in Reservoir Simulation and Multiphase Flow in Porous Media)

Abstract

Rock mechanical parameters can provide fundamental data for the numerical simulation of hydraulic fracturing, aiding in the construction of hydraulic fracturing models. Due to the laminated nature of shale, constructing a hydraulic fracturing model requires obtaining the rock mechanical parameters of each lamina and the bedding planes. However, acquiring the mechanical parameters of individual shale laminas through physical experiments demands that, after rock mechanics testing, cracks propagate along the centre of the laminae without connecting additional bedding planes, which imposes extremely high requirements on shale samples. Current research on the rock mechanics of the Minfeng subsag shale is relatively limited. Therefore, to obtain the rock mechanical parameters of each lamina and the bedding planes in the Minfeng subsag shale, a numerical simulation approach can be employed. The model, built using PFC2D, is based on prior X-ray diffraction (XRD) analysis, conventional thin-section observation, scanning electron microscopy (SEM), Brazilian splitting tests, and triaxial compression tests. It replicates the processes of the Brazilian splitting and triaxial compression experiments, assigning initial parameters to different bedding planes based on lithology. A trial-and-error method is then used to adjust the parameters until the simulated curves match the physical experimental curves, with errors within 10%. The model parameters for each lamina at this stage are then applied to single-lithology Brazilian splitting, biaxial compression, and three-point bending models for simulation, ultimately obtaining the tensile strength, uniaxial compressive strength, Poisson’s ratio, Young’s modulus, brittleness index, and Mode I fracture toughness for each lamina. Simulation results show that the Minfeng subsag shale exhibits strong heterogeneity, with all obtained rock mechanical parameters spanning a wide range. Calculated brittleness indices for each lamina mostly fall within the “good” and “medium” ranges, with carbonate laminae generally demonstrating better brittleness than felsic laminae. Fracture toughness also clearly divides into two ranges: mixed carbonate shale laminae have overall higher fracture toughness than mixed felsic laminae.

1. Introduction

Oil shale is an important non-conventional energy resource valued worldwide [1,2,3]. China possesses relatively rich reserves of shale oil. Since 2010, the scale of shale oil exploration and development in China has gradually increased, with production rising year by year. Shale oil has become one of the strategic alternative resources to ensure stable and even increased production in China [4,5,6]. An in-depth study of the mechanical properties of shale not only serves as a critical basis for determining wellbore parameters and optimizing perforation and fracturing designs but also provides fundamental parameters for subsequent numerical simulations of core behaviour. For shale with a layered structure, mechanical parameters for each lithological lamina must be used when establishing models. Conventional triaxial compression tests and Brazilian splitting tests can only obtain the mechanical parameters of the overall core or be used for qualitative studies on the influence of specific components on rock mechanics [7,8]. To obtain mechanical parameters for individual laminae, it is essential to ensure that fractures generated during experiments propagate centrally within the laminae without intersecting bedding planes, which imposes extremely high requirements on shale samples.
Currently, obtaining mechanical parameters for individual shale samples primarily relies on nanoindentation tests conducted on corresponding laminas. For instance, Cheng S et al. studied the mechanical parameters of shale laminas and the influence of laminae on fracture propagation using nanoindentation tests and macroscopic uniaxial compression experiments [9]. Shi X et al. performed nanoindentation tests on numerous Longmaxi Formation shale samples to determine their mechanical parameters and established a micromechanical model based on nanoindentation data for specific minerals [10]. However, this method requires specialized experimental equipment. Alternatively, predictive models can be constructed using existing data for calculations. For example, Shi Y et al. analyzed the failure characteristics of complex lithology shale oil in the Lucaogou Formation through rock mechanics experiments, established a predictive model for rock mechanical parameters, and conducted application analyses [11]. However, the conclusions drawn from this method lack generalizability and cannot be directly applied to the Minfeng subsag. Moreover, current research on the Minfeng subsag region tends to focus more on stratigraphic sedimentation and diagenesis [12,13], with limited studies on the mechanical properties of shale in the area, and even fewer on the mechanical properties of individual shale laminae. Therefore, establishing a predictive model is challenging.
Thus, to obtain the compressive strength, tensile strength, Young’s modulus, Poisson’s ratio, brittleness index, and Mode I fracture toughness of individual shale laminae in the Minfeng subsag, a PFC2D model can be established for Brazilian splitting and biaxial compression tests based on data from ordinary thin sections, scanning electron microscopy, mineral composition testing, and rock mechanics testing of the Minfeng subsag shale. A trial-and-error method can then be employed to adjust the parameters until the simulated curve closely matches the physical experimental curve, with the error between simulated and experimental results within 10%. The obtained PFC parameters can then be applied to single-lithology Brazilian splitting, uniaxial compression, and three-point bending models to acquire relatively difficult-to-obtain mechanical parameters for individual laminas through simulated physical experiments.

2. Physical Property Testing of Oil Shale

2.1. Mineral Composition Testing of Oil Shale

To clarify the lithology of each lamination, different coloured laminations in the rock samples were made into powder for XR ray diffraction testing to determine their mineral composition content. The experimental results show that the component types of the two laminations do not differ significantly, both being mainly composed of quartz, carbonate minerals (dolomite, calcite), and clay minerals (mainly illite), containing small amounts of plagioclase, pyrite, and siderite. Among them, the lighter-coloured lamination contains more felsic content, while the darker-coloured lamination contains more carbonate content. According to the classification method used by Fang Z [14], the laminations are divided into carbonate-bearing mixed shale and felsic-bearing mixed shale according to lithofacies, with their mineral compositions shown in Table 1.
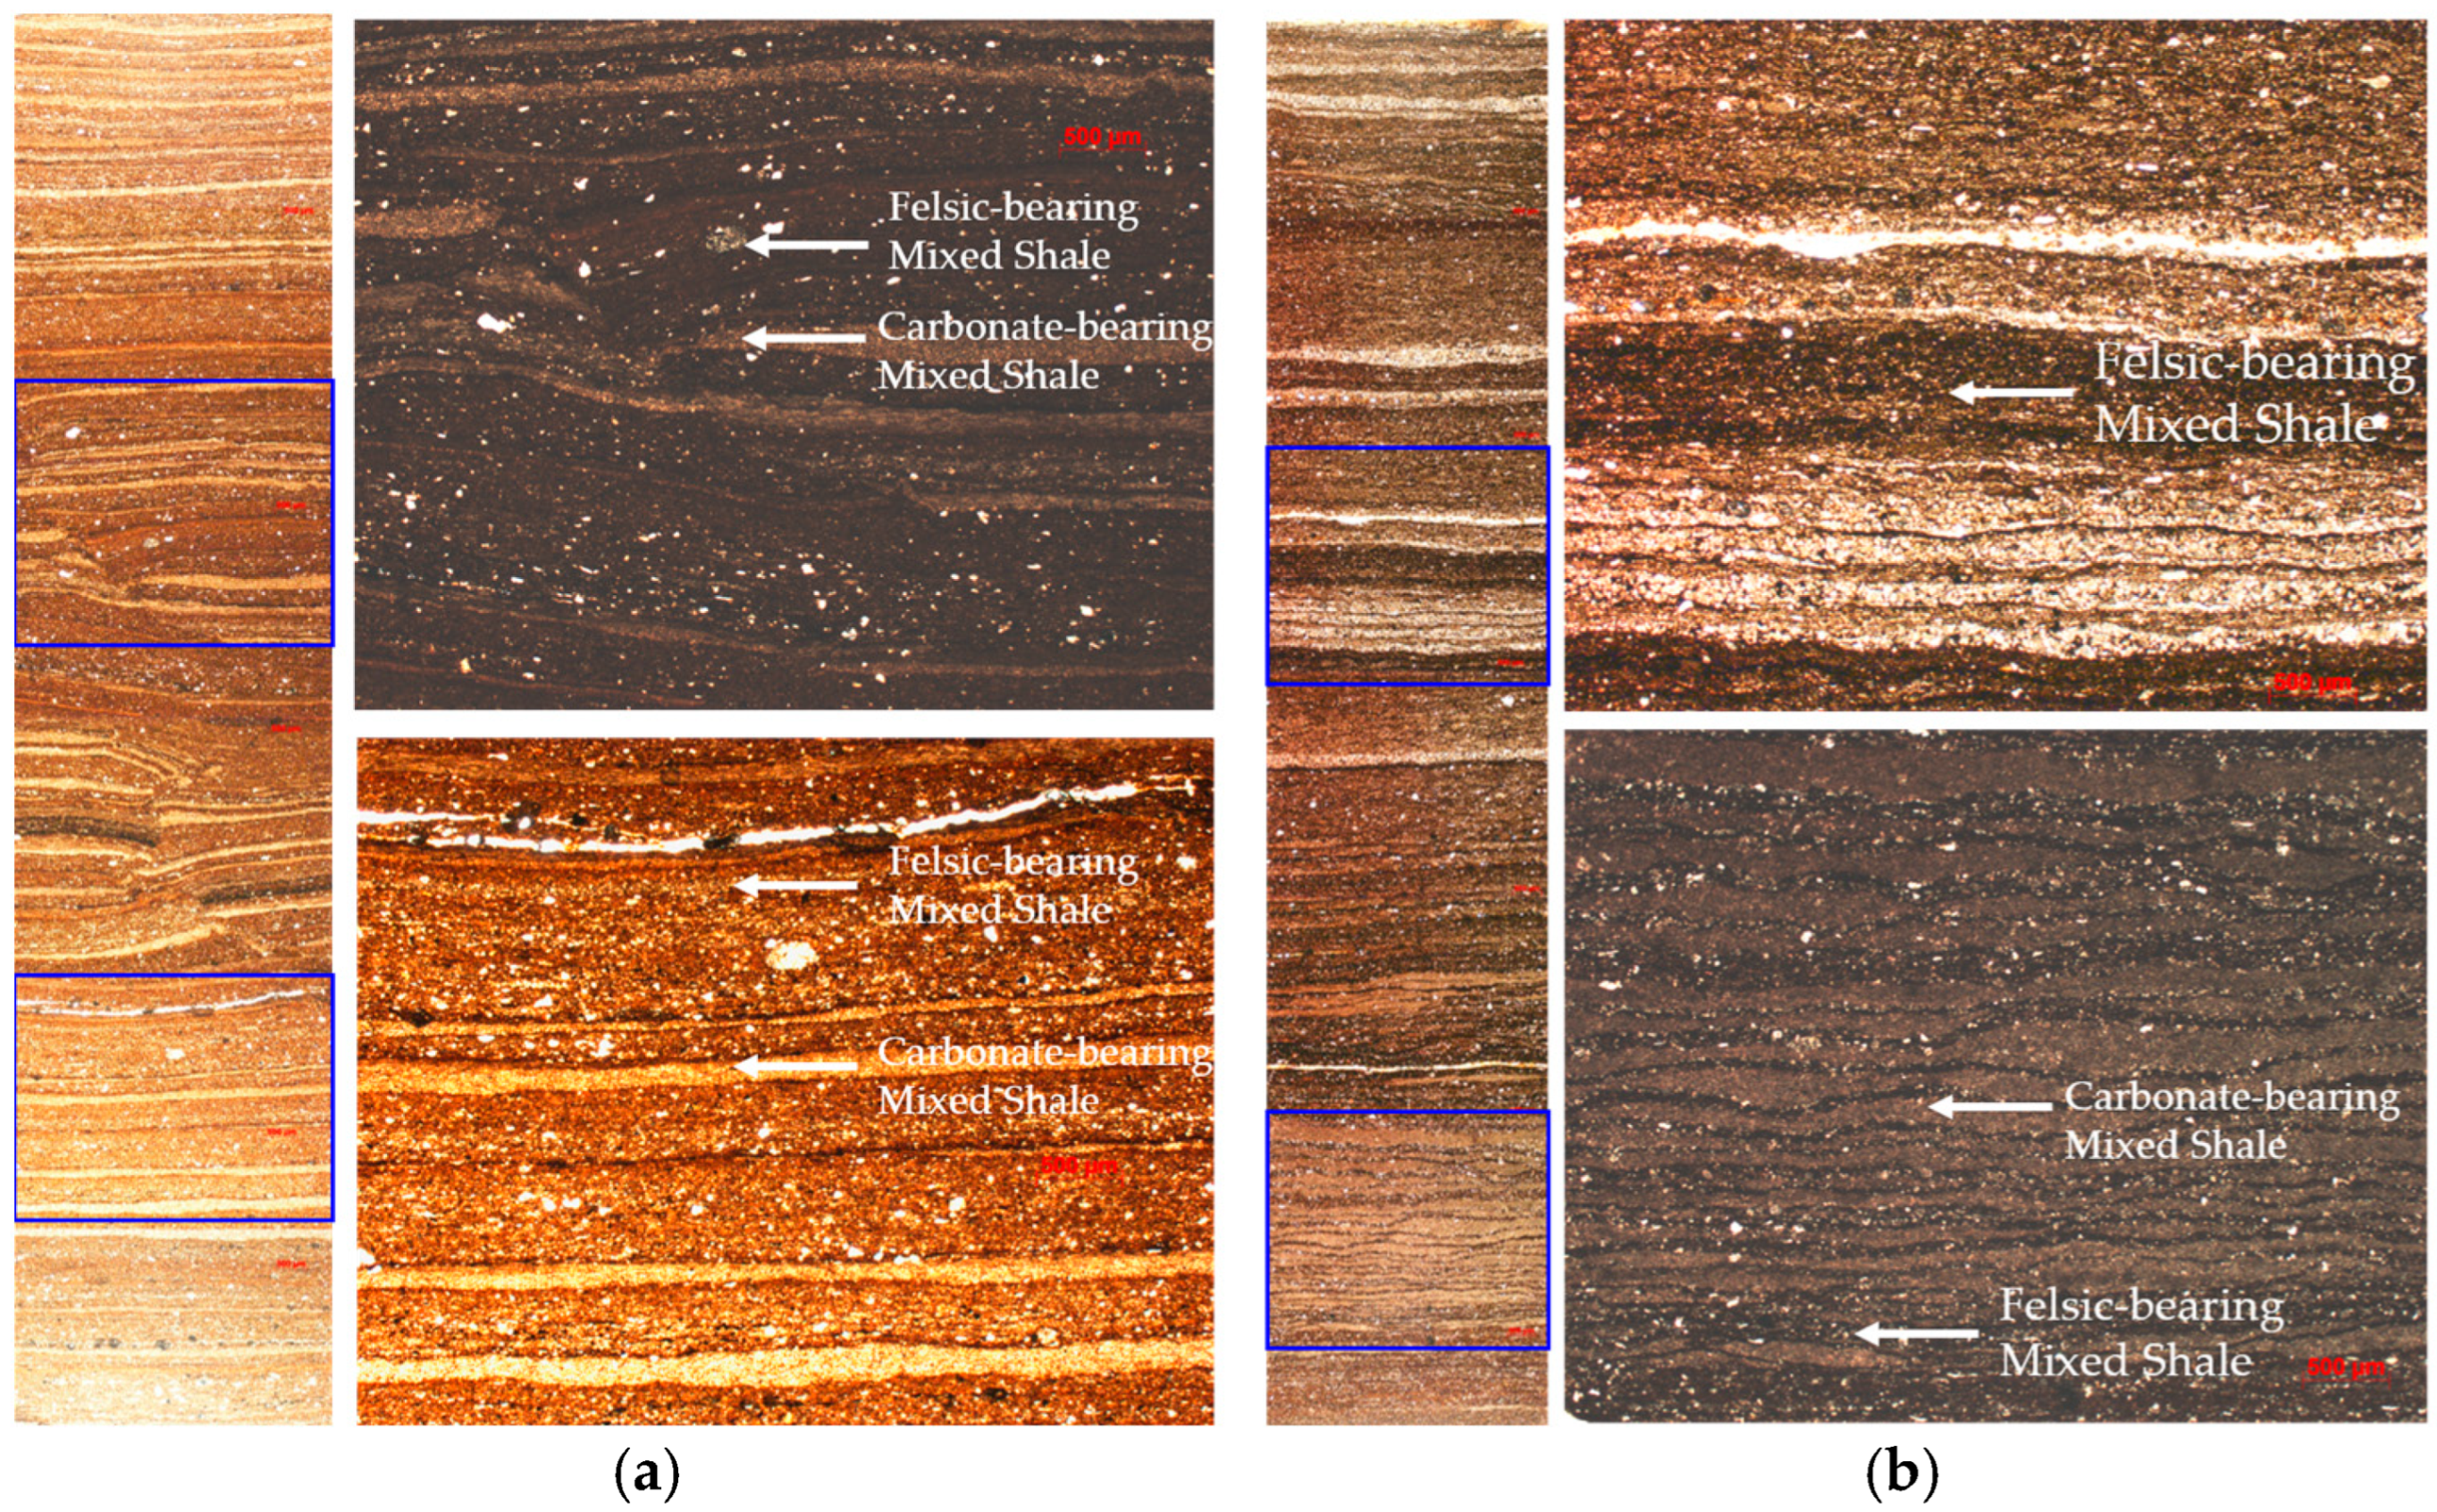
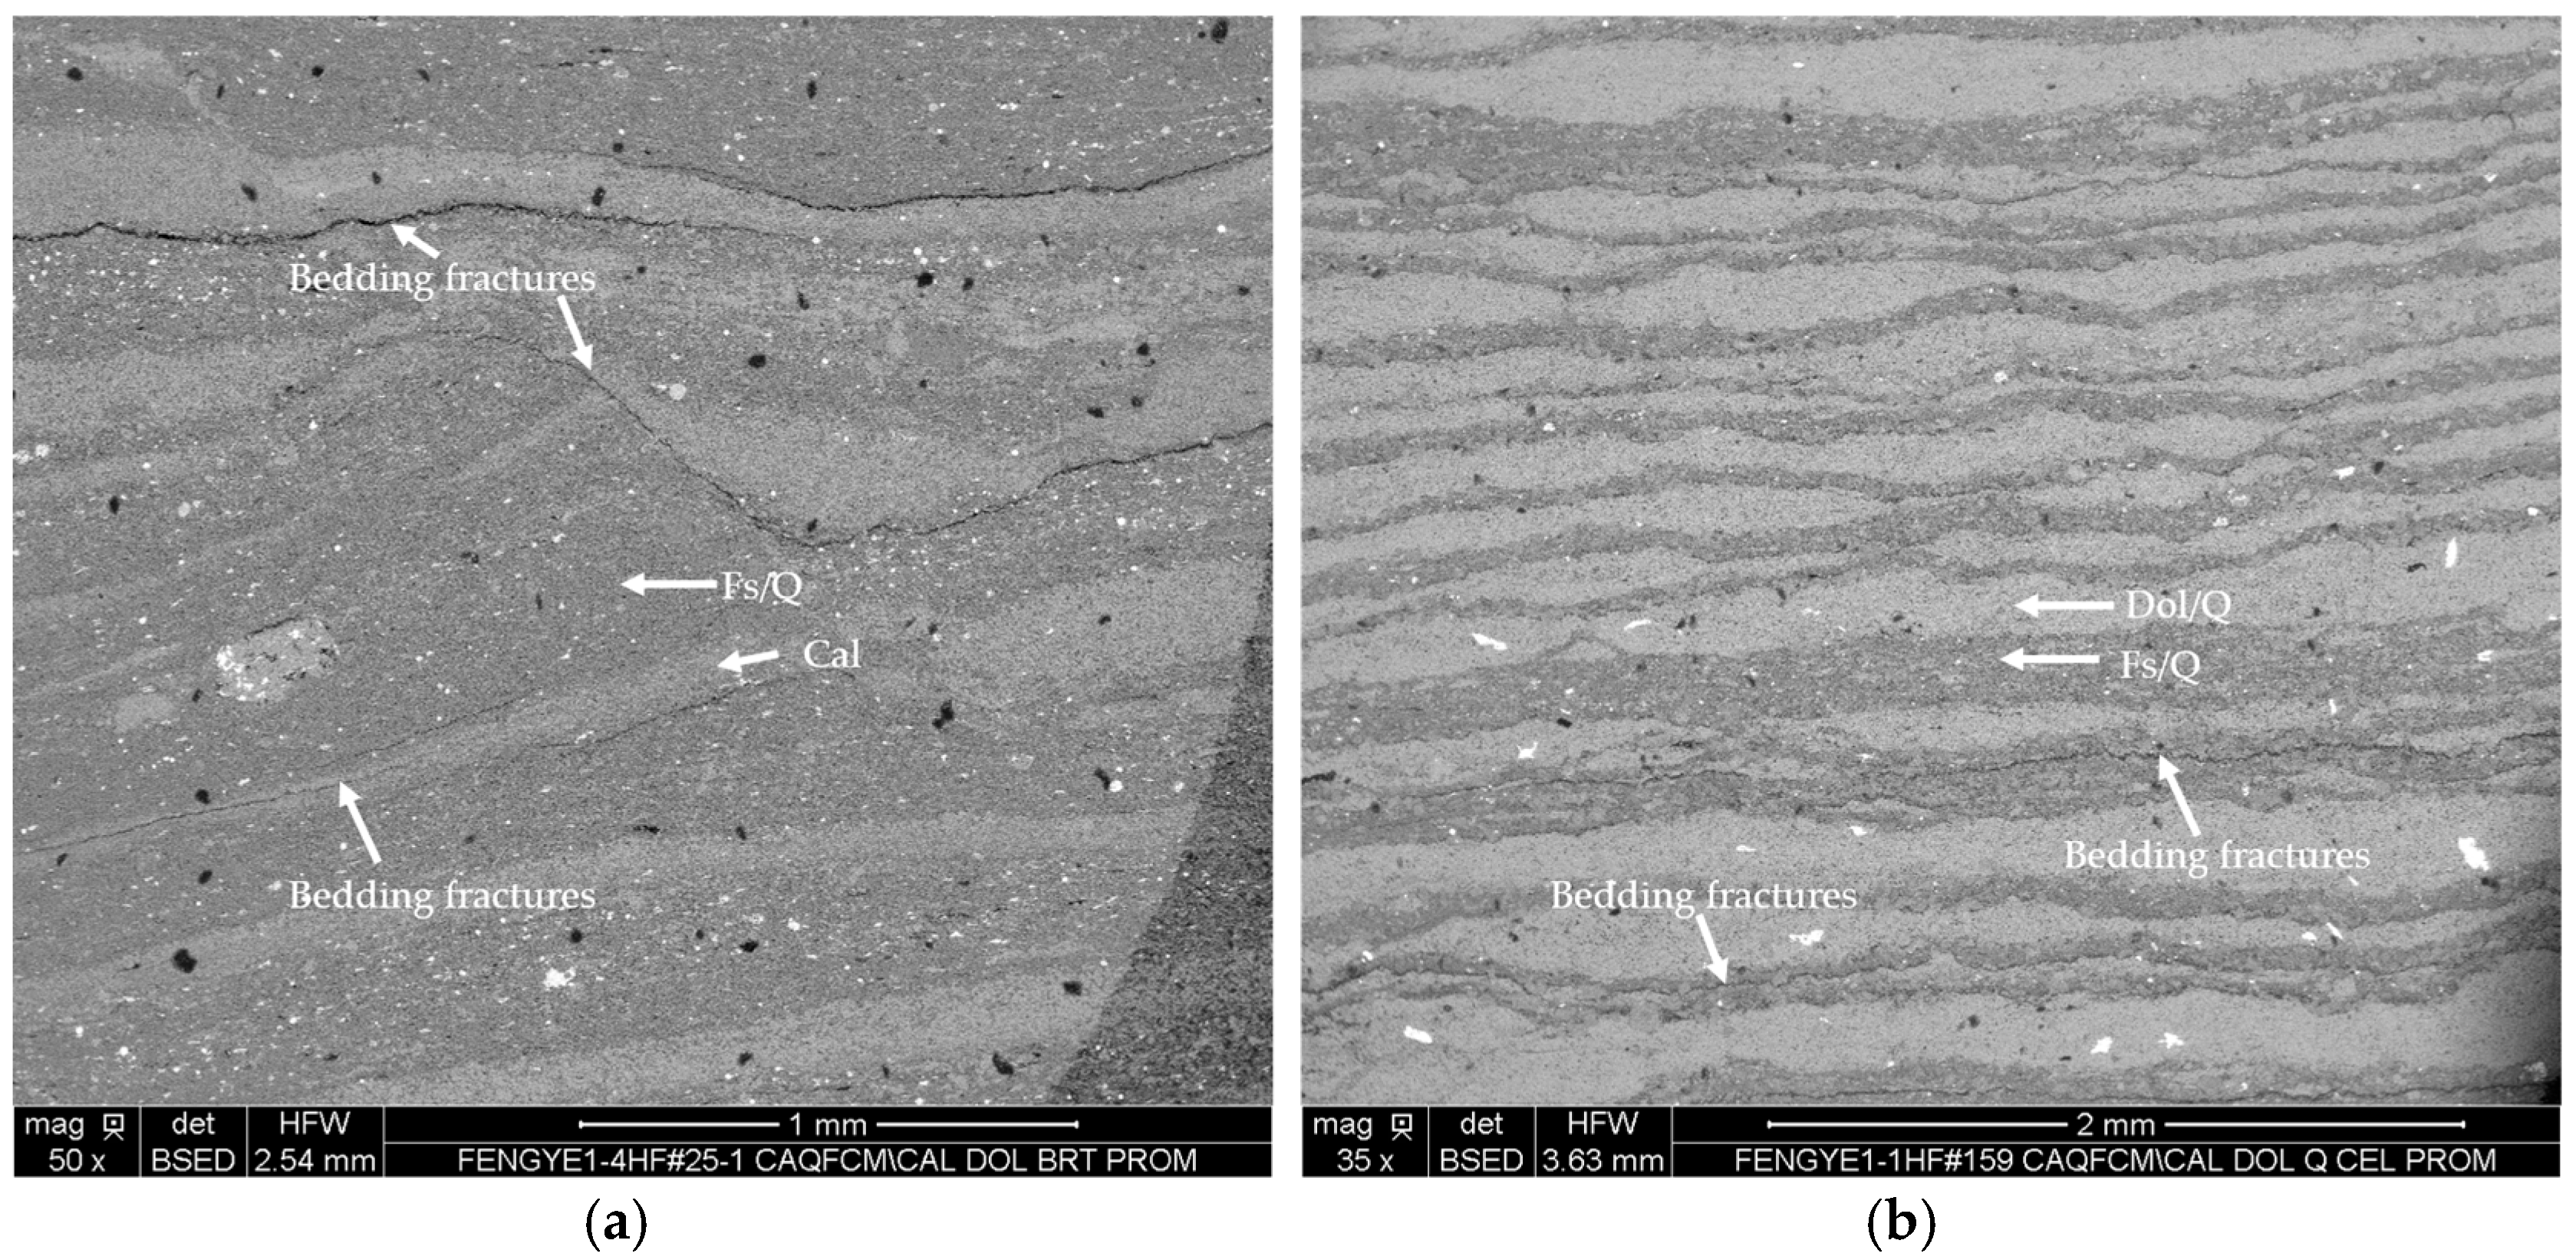
After clarifying the lamination properties, ordinary thin sections were prepared from some core samples in the target block (Figure 1). Observation of ordinary thin sections shows that the bedding of shale in the Minfeng subsag is mainly wavy bedding or horizontal bedding, occasionally massive bedding. The bedding density is large, reaching over 10 layers/mm. Most bedding develops horizontally, with inclined bedding developing in some areas. Combined with scanning electron microscope results (Figure 2), it can be seen that bedding fractures develop extensively in the shale of the Minfeng subsag, mostly expanding along lamination boundaries. This type of bedding fracture has relatively large width and relatively long length, with most bedding fractures being horizontal. If the lamination boundary is inclined, the bedding fracture will preferentially expand along the lamination boundary. A small portion expands within the rock lamination, with this type of lamination having relatively smaller length. The majority of bedding fractures contain organic matter filling, with a small portion also showing pyrite filling.

2.2. Rock Mechanics Experimental Testing of Oil Shale

2.2.1. Brazilian Test

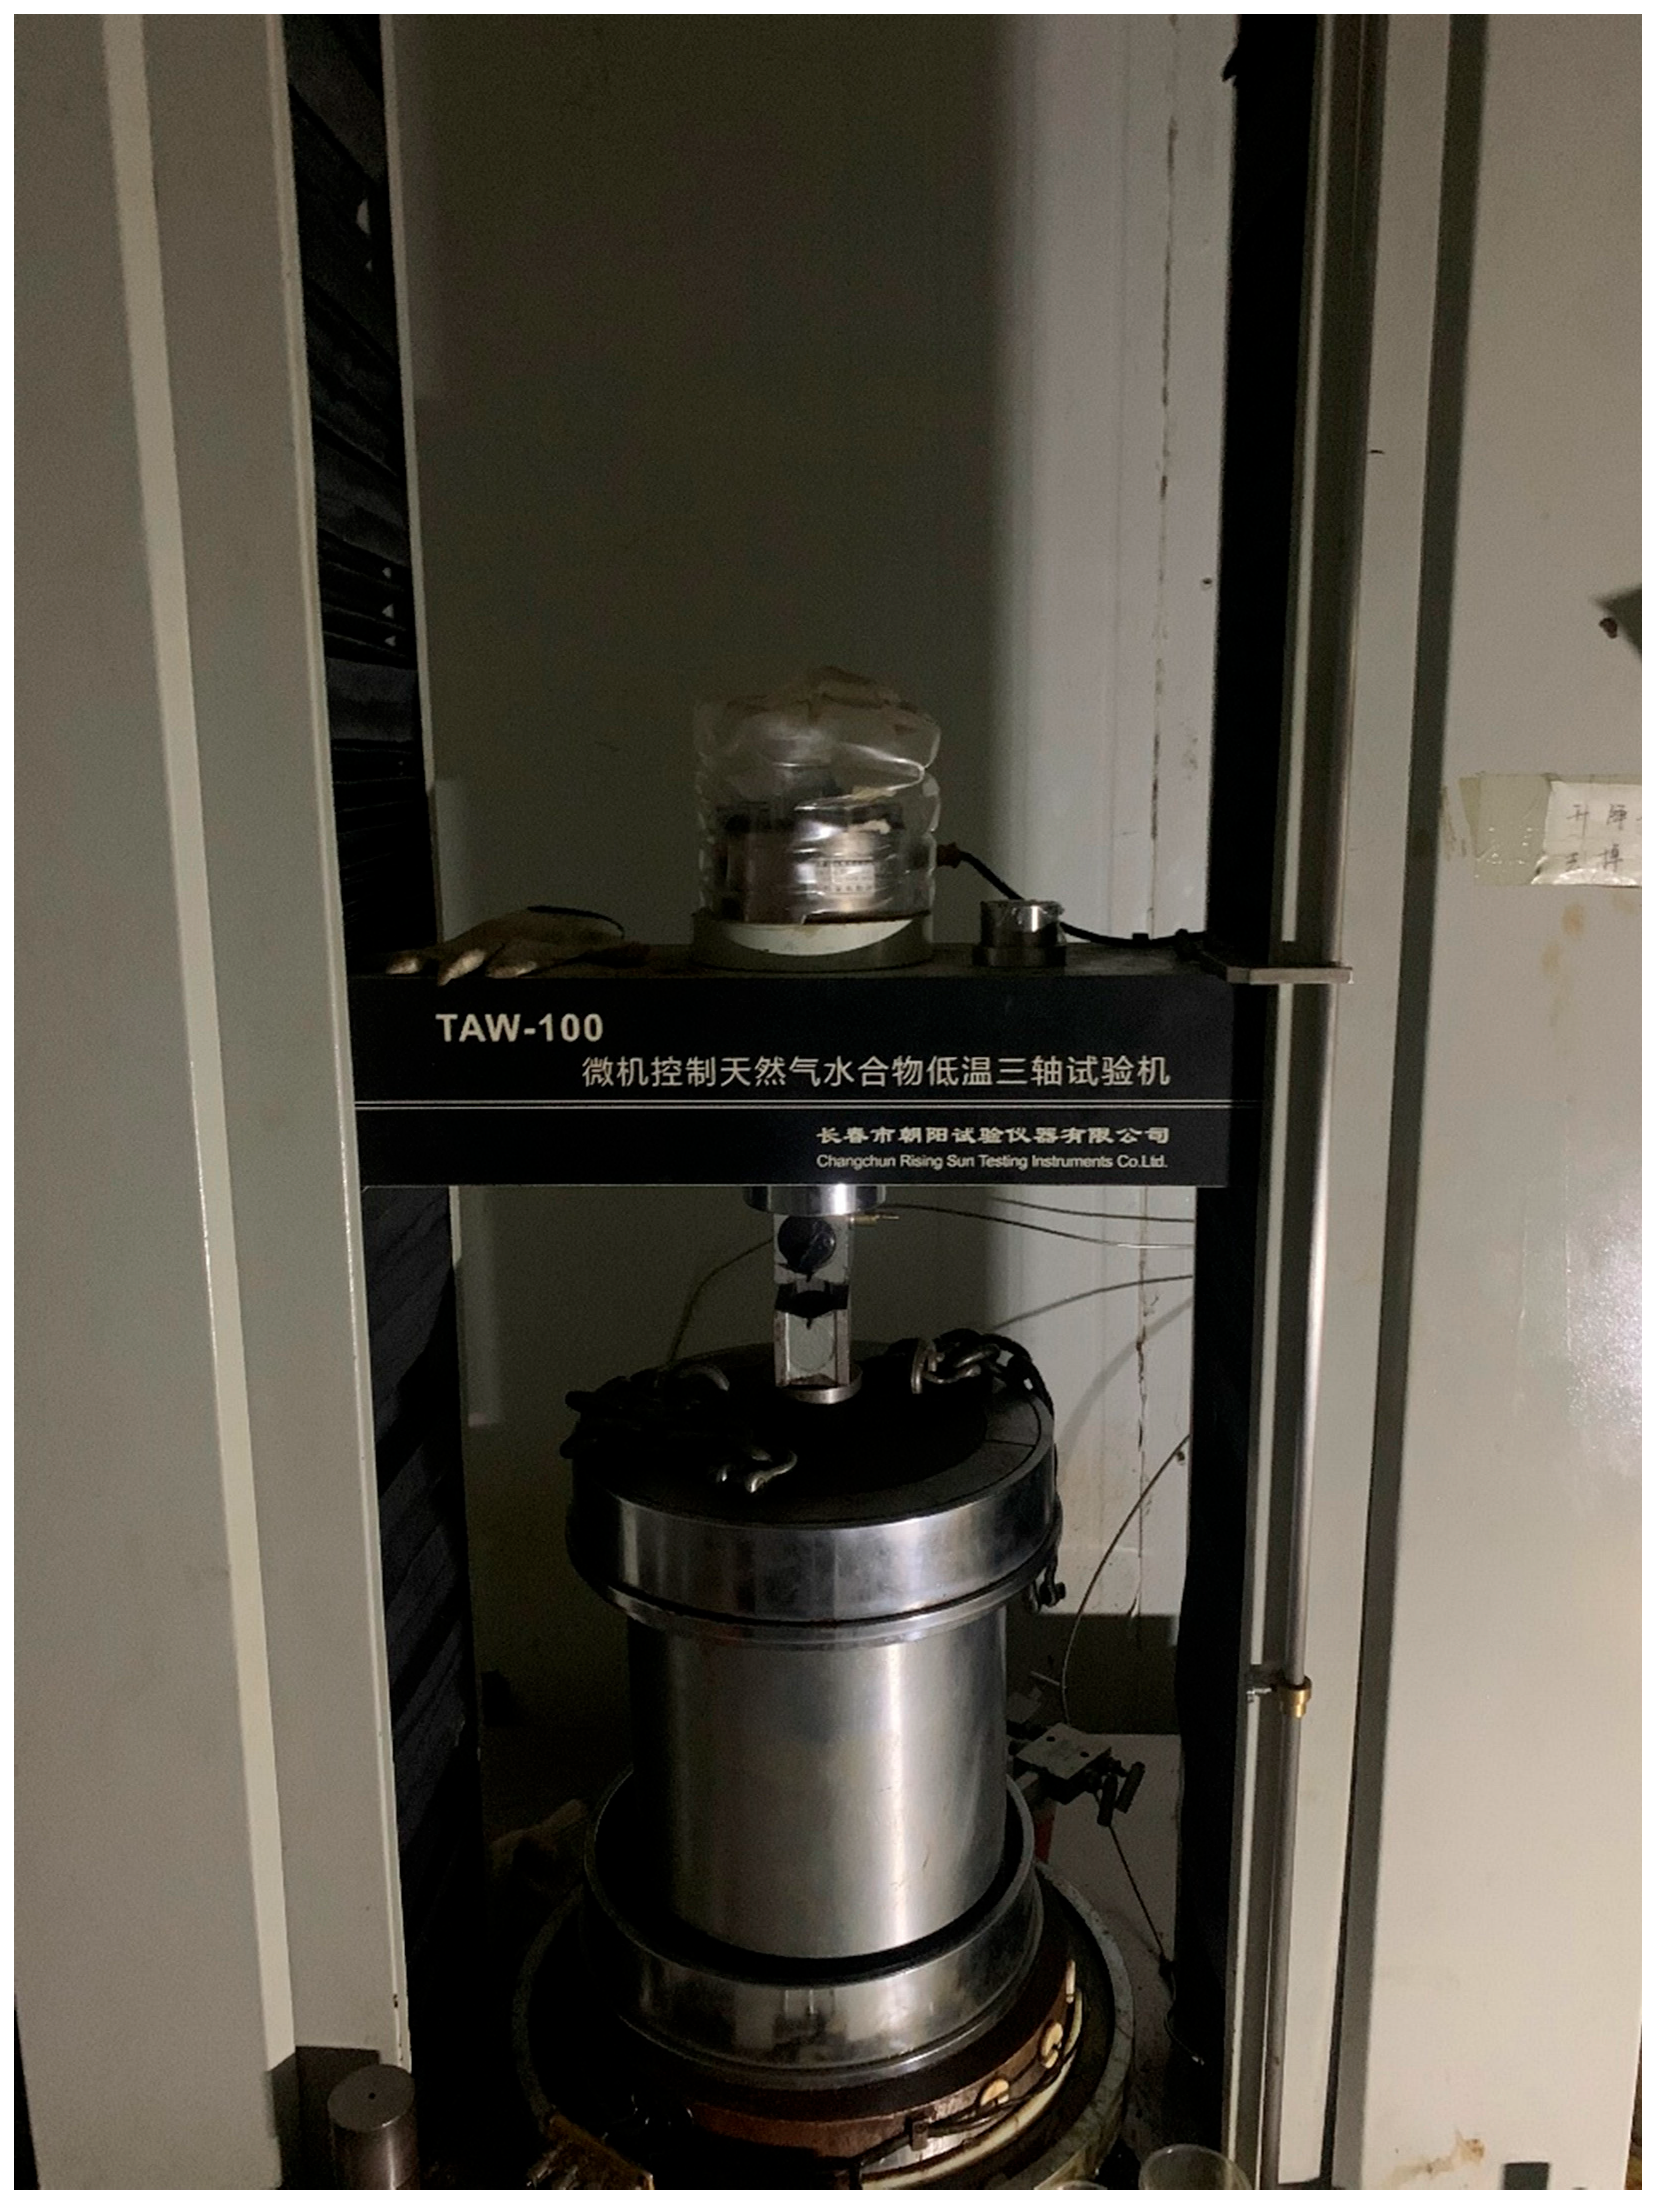
The Brazilian splitting test was conducted using the TAW-100 microcomputer-controlled natural gas hydrate low-temperature triaxial testing machine(manufactured by Changchun City Chaoyang Test Instrument Company in Changchun, China.) (Figure 3). The testing procedure followed the “Suggested Methods for Determining Tensile Strength of Rock Materials” in the ISRM Blue Book [15].
Core samples with wide bedding at the centre were selected so that cracks would expand as much as possible along the wide bedding or structural weak planes, reducing the impact of complex cracks passing through multiple structural weak planes on subsequent numerical simulation analysis.
After obtaining the maximum load of each rock, the tensile strength of the rock was calculated using the following formula:
σ t = 2 P π D L
where σ t is the tensile strength of the rock, in MPa; P is the rock load, in N; D is the rock diameter, in mm; and L is the rock length, in mm.
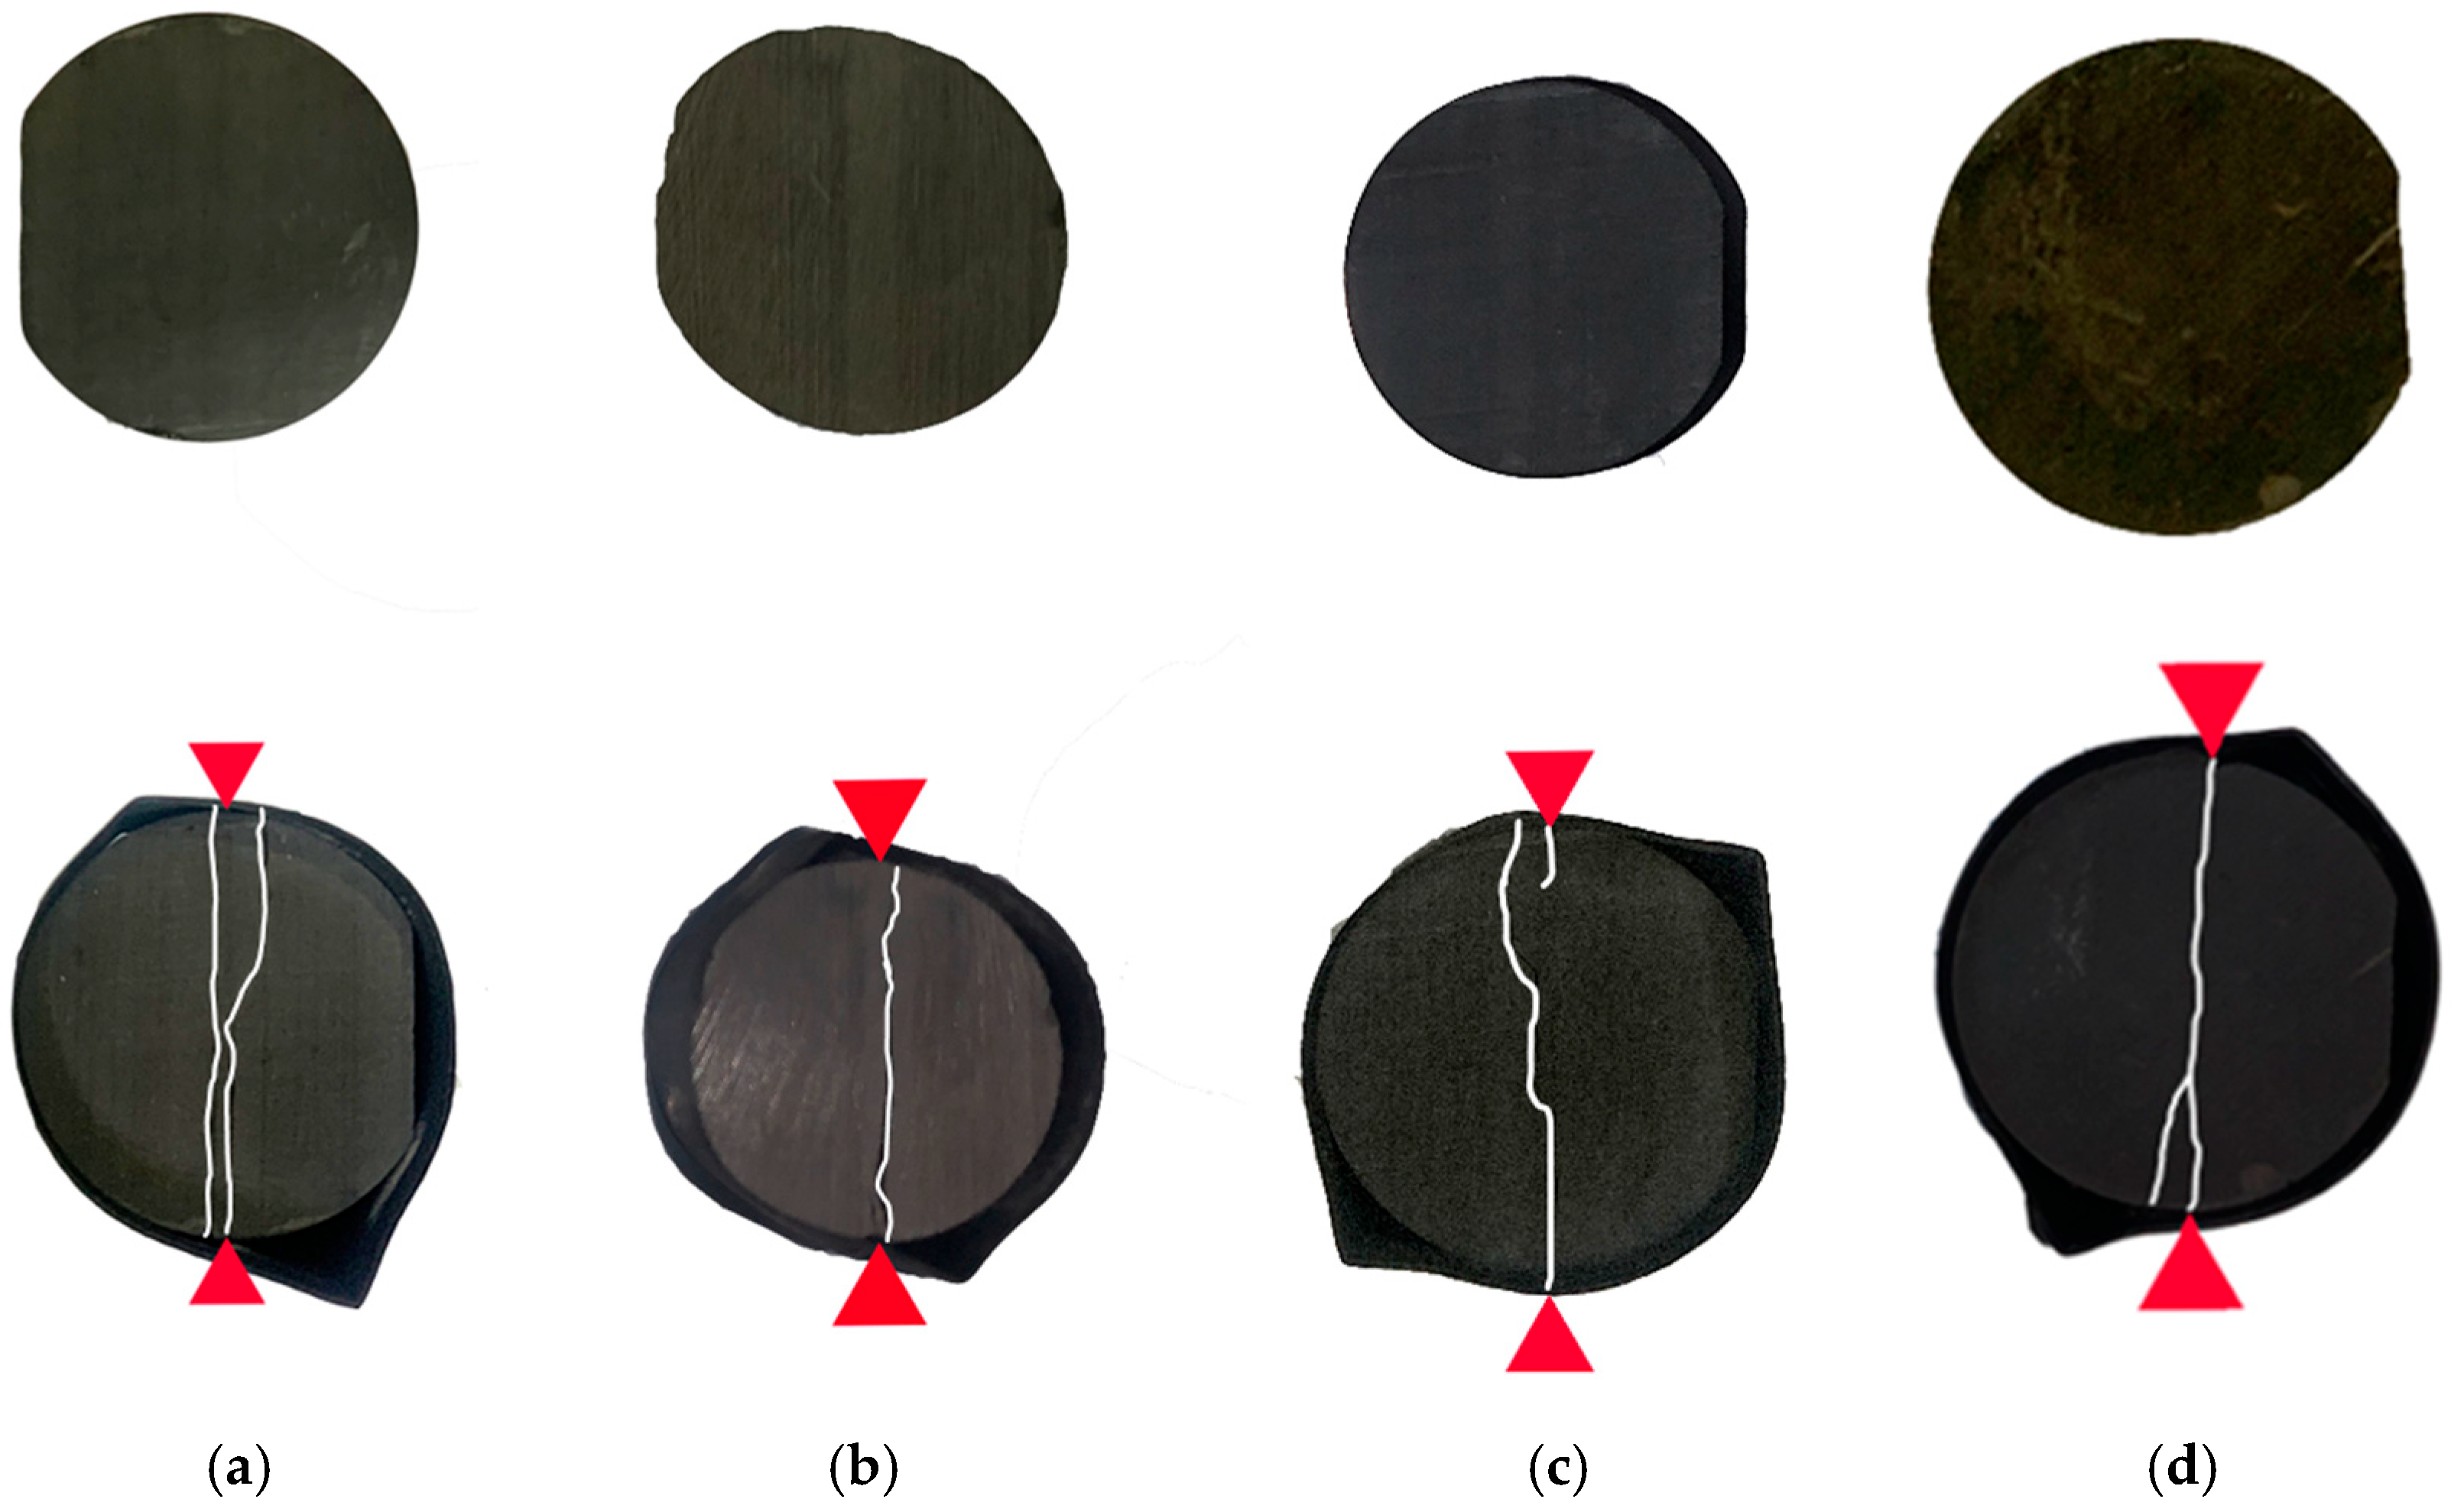
The test results are shown in Figure 4 and Table 2.
From the test results, it can be seen that the tensile strength of oil shale in the Minfeng from 1.49 MPa to 4.03 MPa. Combined with the fracture morphology of experimental core samples, Brazilian splitting cracks mostly expand along the structural weak planes between laminations, with only one group expanding in the middle of the lamination. Therefore, one group of experimental records shows tensile strength significantly higher than the other three groups.

2.2.2. Triaxial Test

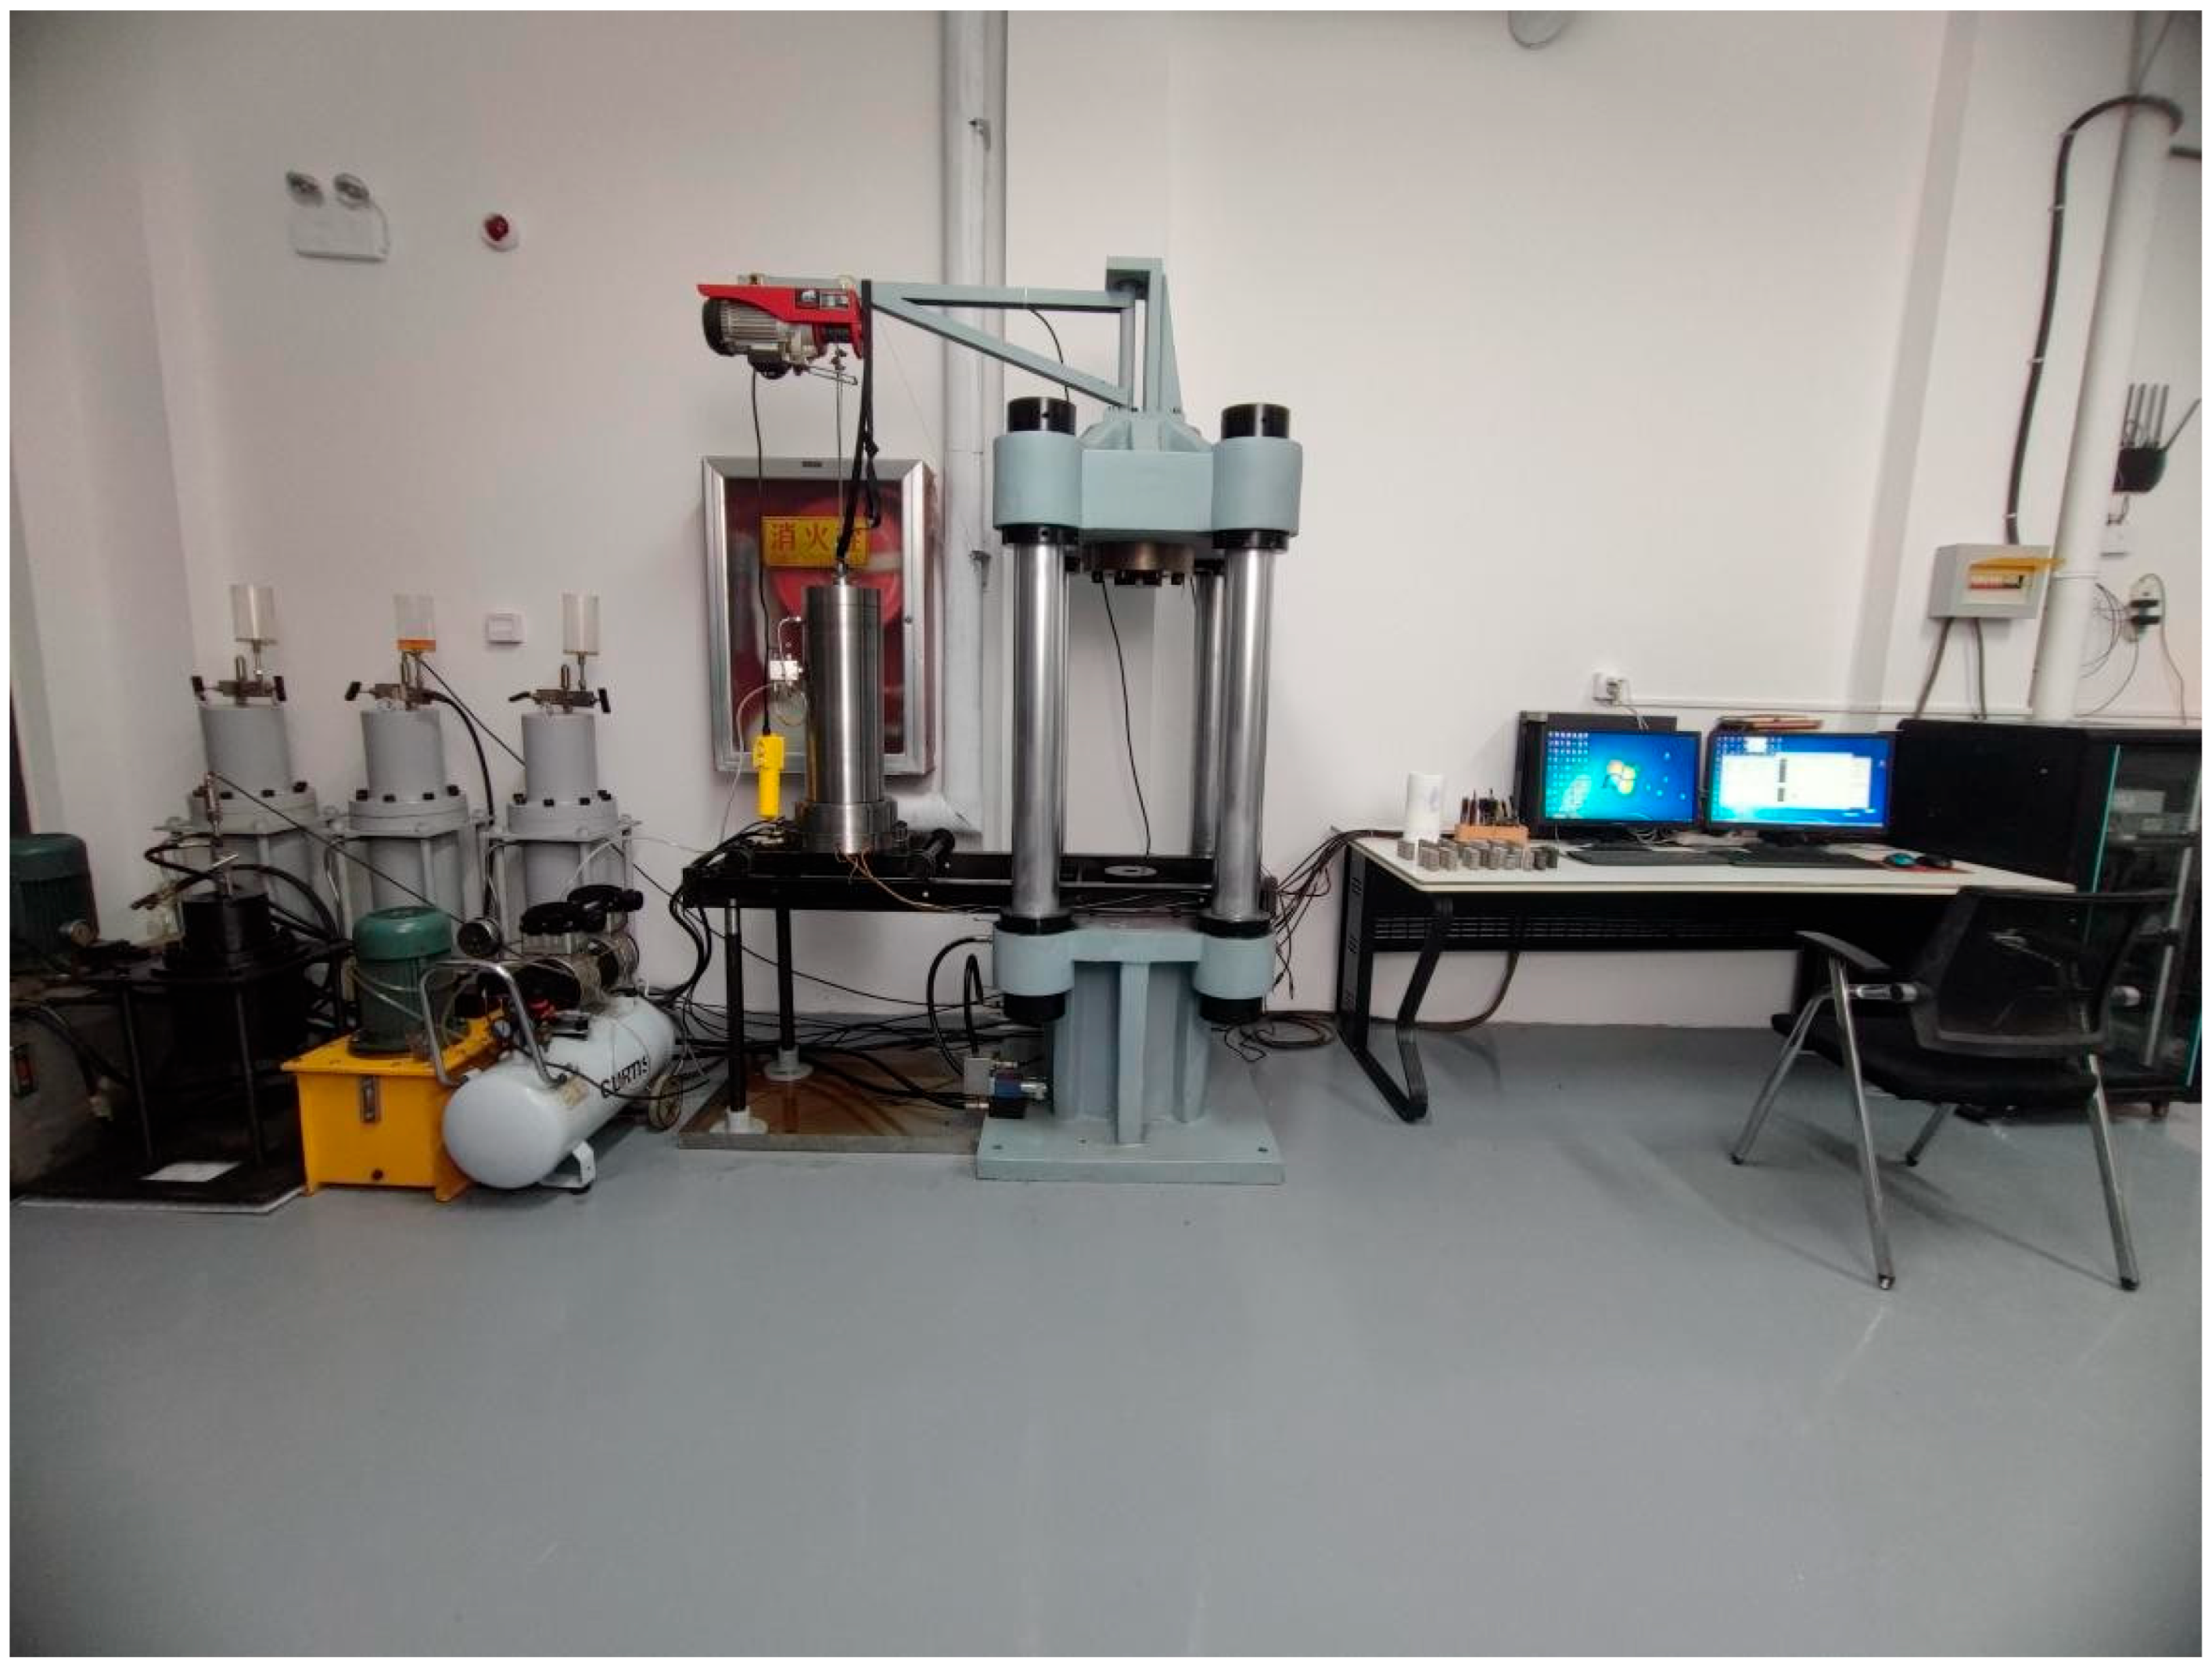
The triaxial compression test was conducted using the TAW-1000 hydraulic servo testing system (manufactured by Changchun City Chaoyang Test Instrument Company in Changchun, China) (Figure 5). The experiment followed the “Rock Testing Code for Water Resources and Hydropower Projects (SL264-2001)” of the People’s Republic of China industry standards, as well as the “Suggested Methods for Rock Mechanics Tests” provided by ISRM.
Before conducting the triaxial test, the actual size and density of the rock were first measured. Core samples with laminations at a certain angle were selected. The actual height and bottom diameter of the rock were measured using a vernier calliper and recorded. Subsequently, the weight of the rock was measured using an electronic balance, and the core density was calculated by Equation (2).
ρ = 4 m π d 2 L
In the formula, ρ is the rock sample density, in g/cm3; m is the mass of the rock sample, in g; d is the rock sample diameter, in cm; L is the height of the rock sample, in cm. The final experimental core sample size data are shown in the following table (Table 3):
After fixing the rock on the testing instrument, lateral stress (confining pressure) and axial stress were first applied to the shale. During the experiment, the confining pressure was kept constant while the axial stress was gradually increased until the rock sample fractured, thereby obtaining the axial strain, radial strain, and destruction curve varying with the stress of the rock sample.
Based on the obtained axial/radial strain curves, the uniaxial compressive strength, Young’s modulus, and Poisson’s ratio of the core can be calculated through formulas.
The compressive strength of the core is calculated according to the following formula:
σ 1 = p A
where σ 1 is the compressive strength of the core under specific confining pressure, in MPa; p is the maximum load, in N; and A is the cross-sectional area of the core, in mm2.
The Young’s modulus is calculated according to the following formula:
E = ( σ 1 σ 3 ) 50 ε h ( 50 )
where E is the Young’s modulus, in GPa; σ 1 σ 3 50 is 50% of the maximum principal stress difference, in MPa; and ε h 50 is the axial strain value corresponding to σ 1 σ 3 50 .
Poisson’s ratio is calculated according to the following formula:
μ = ε d 50 ε h 50
where μ is Poisson’s ratio; and ε d 50 is the radial strain value corresponding to σ 1 σ 3 50 .
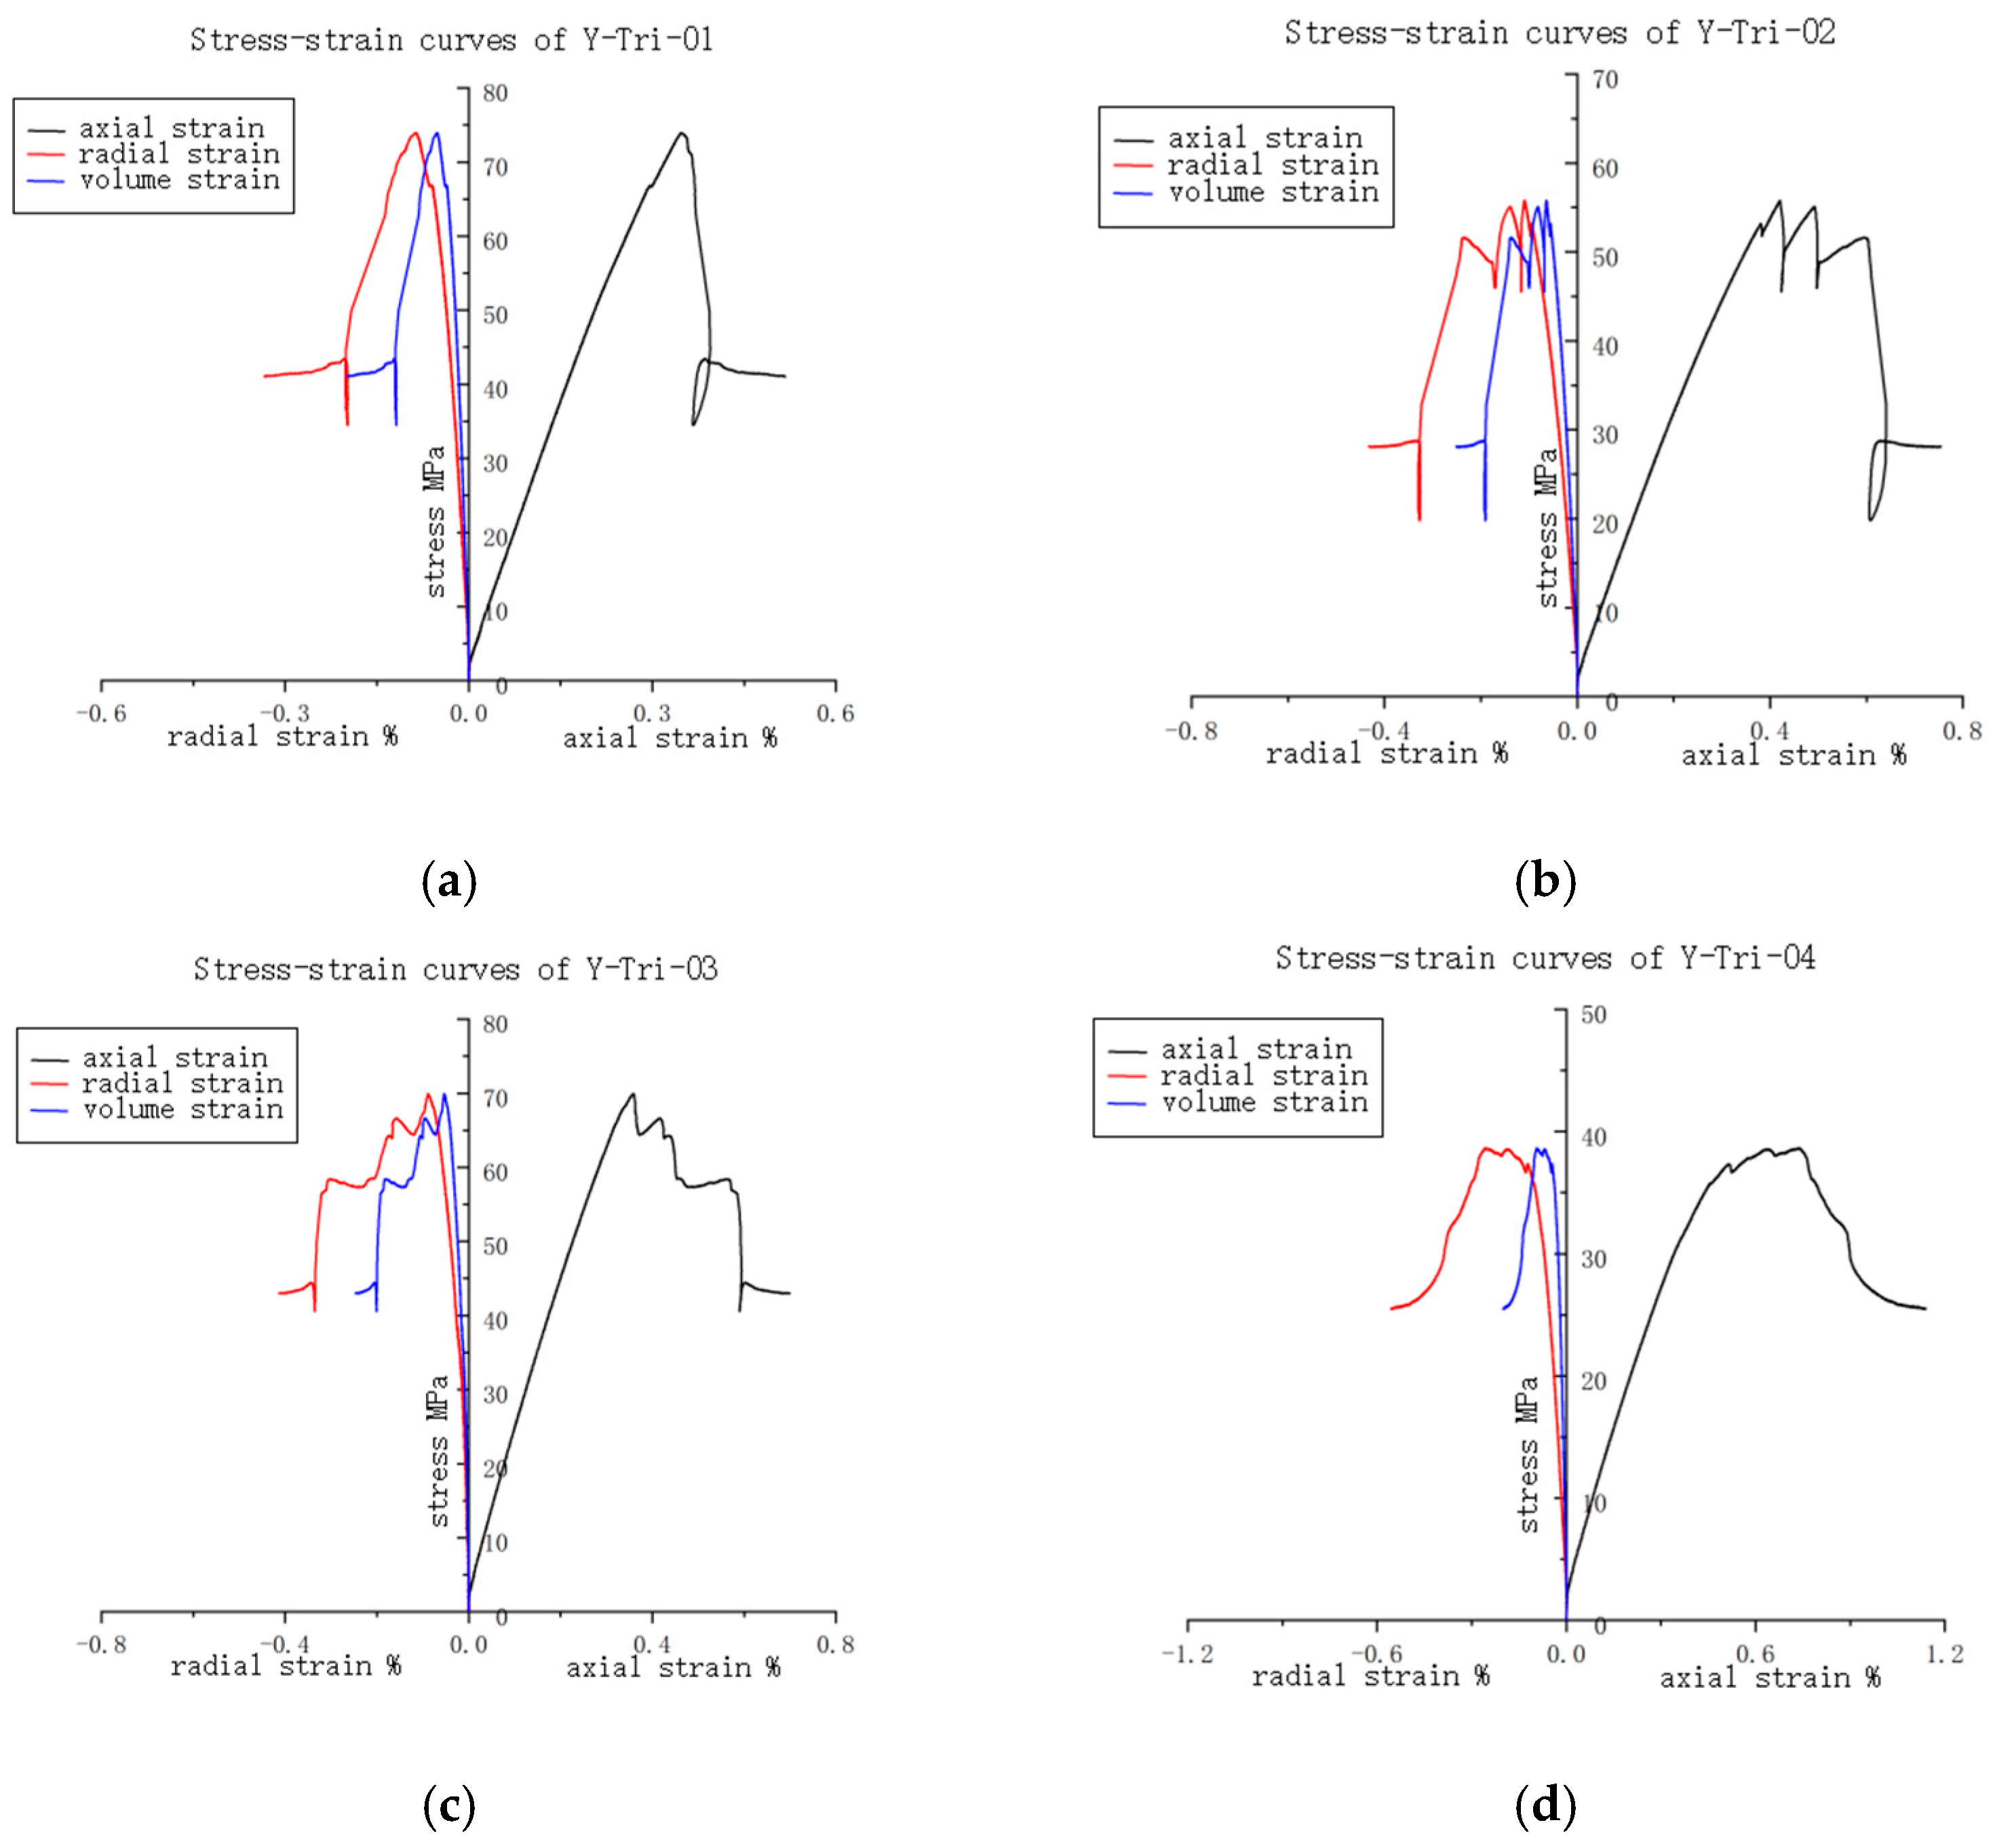
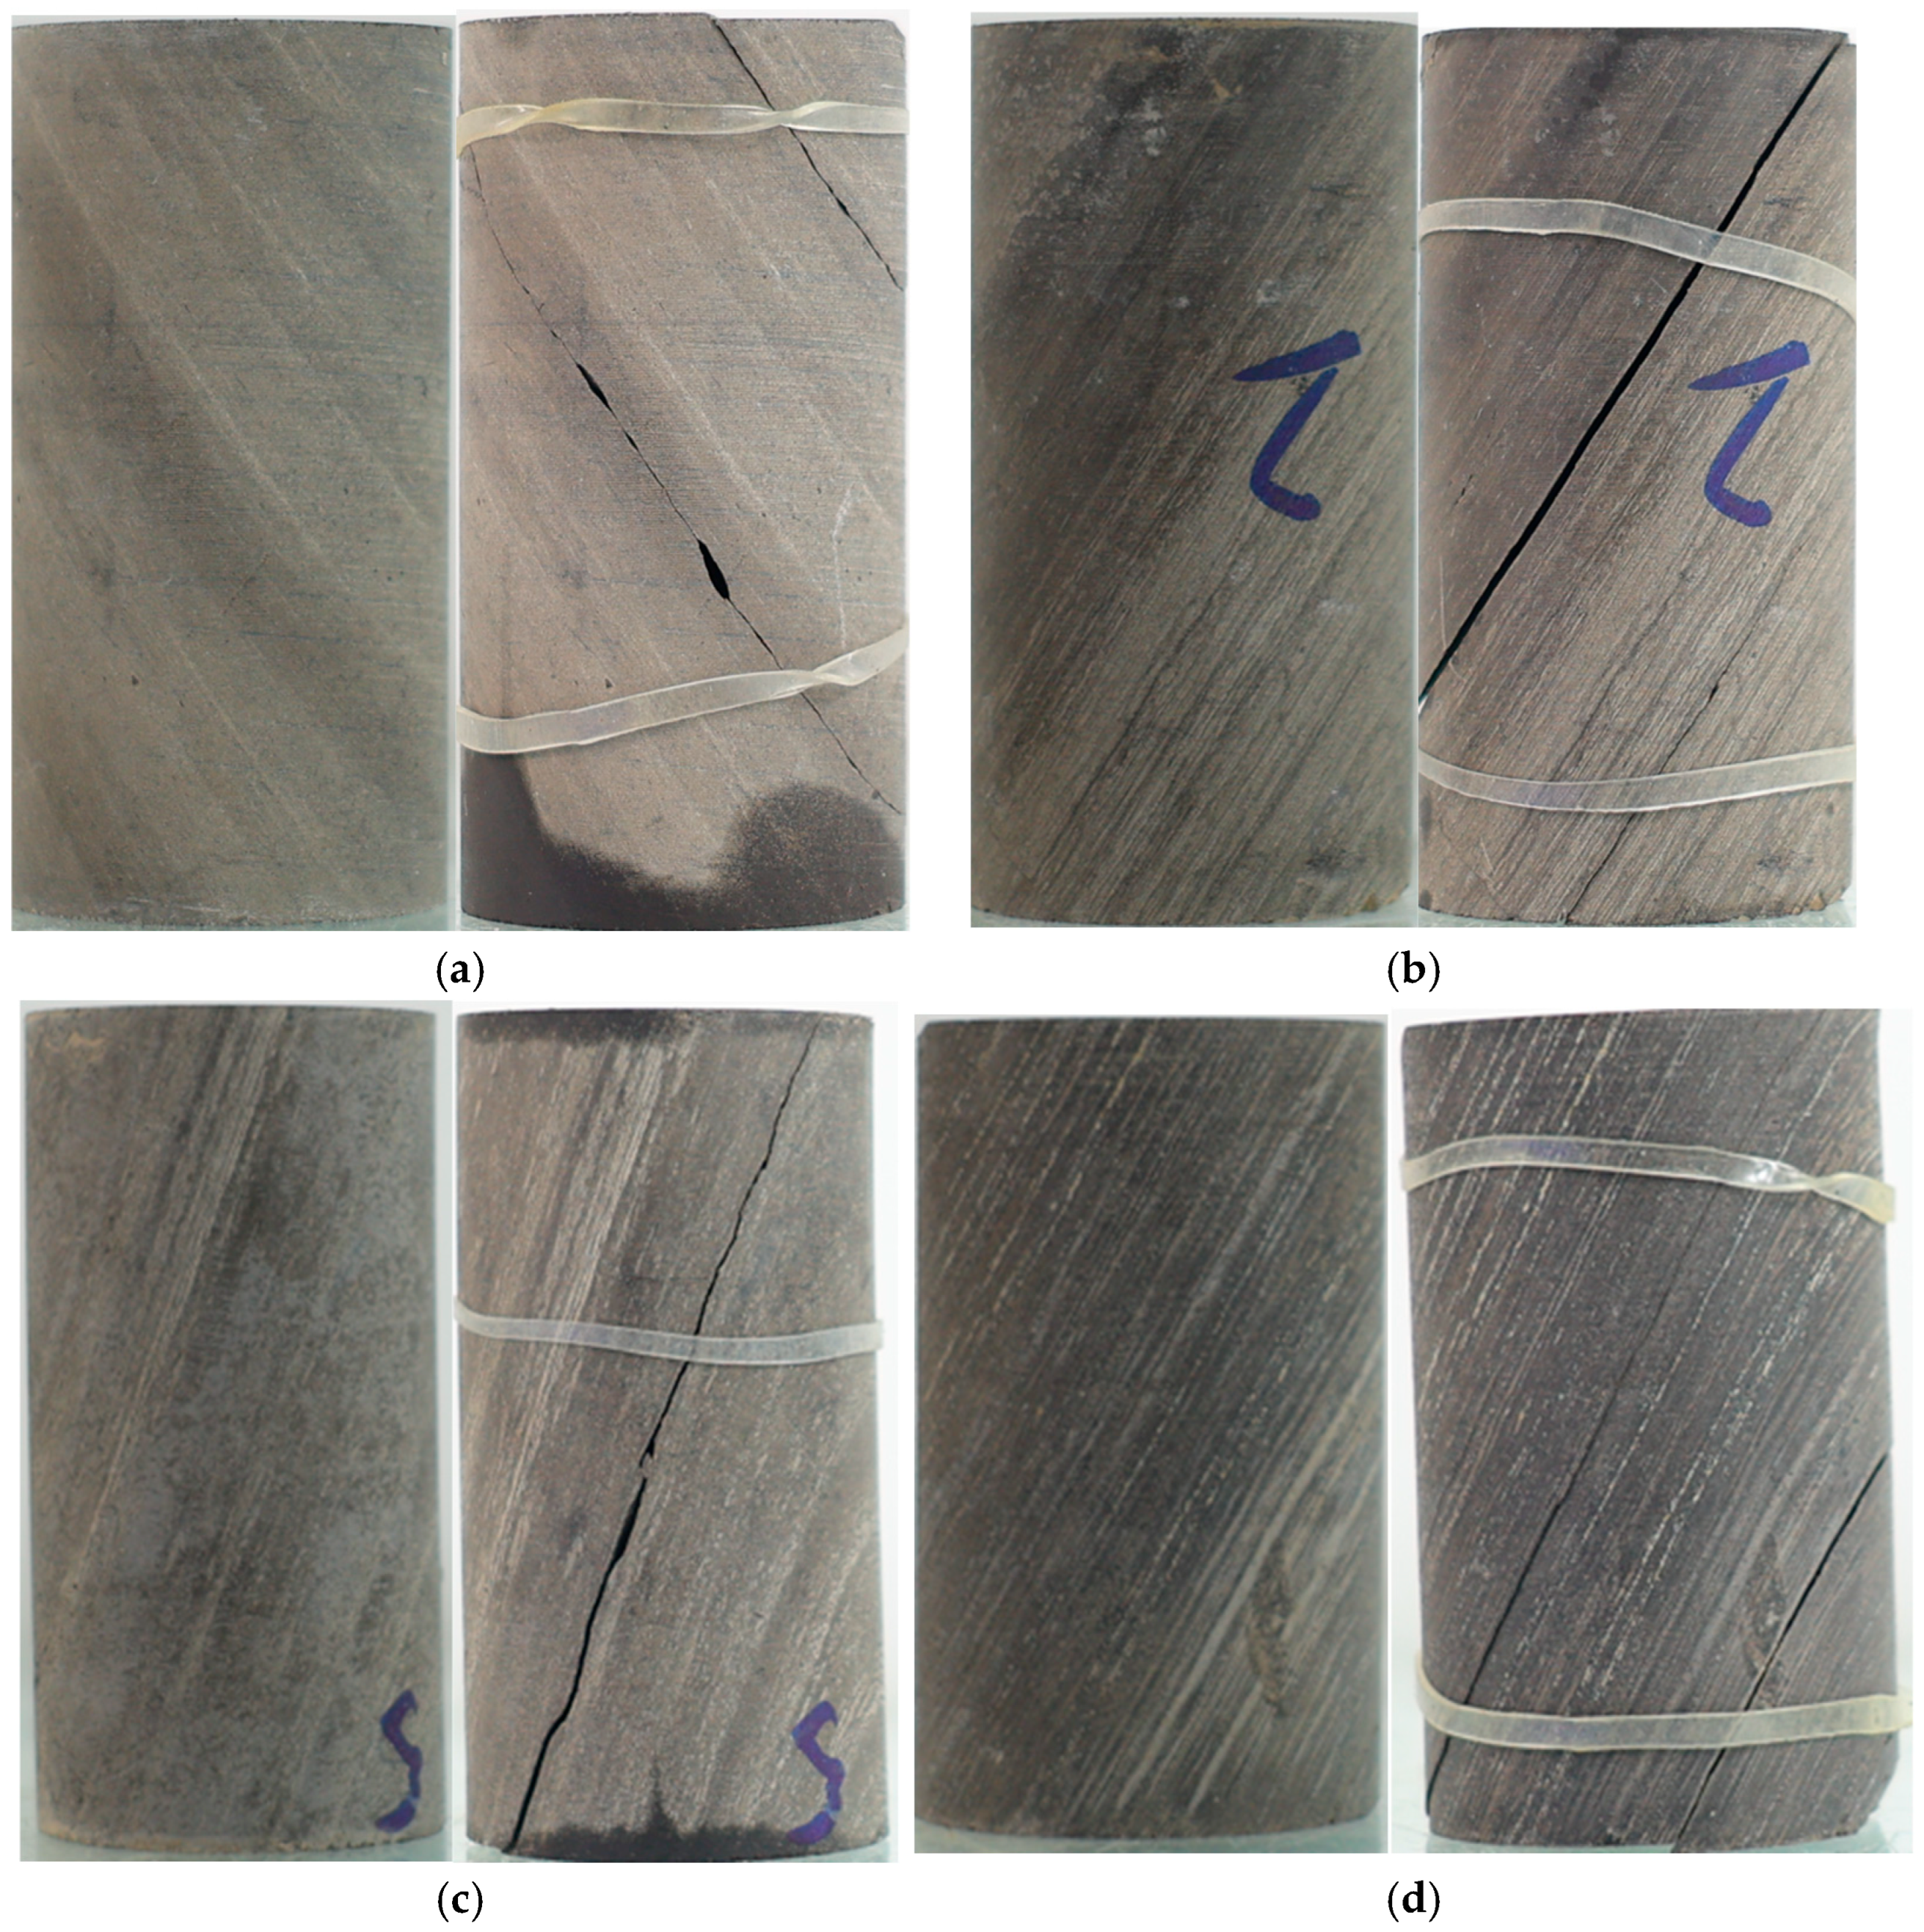
The final fracture morphology is shown in Figure 6, and the experimental results are shown in Table 4 and Figure 7.
From the experimental results, it can be seen that the core samples are generally brittle, with uneven distribution of compressive strength ranging from 38.65 to 73.92 MPa. The Young’s modulus ranges from 8.36 GPa to 23.40 GPa, and Poisson’s ratio ranges from 0.173 to 0.216. The cracks generated by the triaxial test mostly expand along the bedding boundaries, so their mechanical properties show significant differences.
After obtaining the Brazilian splitting and Young‘s modulus, the brittleness index of shale can be calculated according to Formula (6) in the method of determination and evaluation of shale brittleness index (NB/T 10248-2019) [16].
B Y B = E s E m i n E m a x E m i n + ν m a x ν s ν m a x ν m i n 2 × 100
Among them, B Y B is the brittleness index, dimensionless, E s is the static Young‘s modulus of the sample, the unit is MPa, E m a x is the maximum Young‘s modulus, and the maximum Young‘s modulus in this experiment is taken (2.340 × 10⁴ MPa), E m i n is the minimum Young‘s modulus, and the minimum Young‘s modulus in this experiment is taken (0.836 × 10⁴ MPa), ν s is the static Poisson‘s ratio of the sample, dimensionless. ν m a x is the maximum Poisson’s ratio, and the maximum Poisson’s ratio (0.216) in this experiment is taken. ν m i n is the minimum Poisson’s ratio, and the minimum Poisson‘s ratio (0.159) in this experiment is taken.
From the Young‘s modulus and Poisson’s ratio obtained from the experiment, the brittleness indexes of these four cores are calculated as shown in Table 5:
The evaluation criteria for shale brittleness in “Determination and evaluation method of shale brittleness index” (NB/T 10248-2019) are as follows (Table 6):
As far as the experimental results are concerned, the brittleness distribution of oil shale in Minfeng sag is uneven, ranging from 21.053 to 92.254. Two of the four cores have excellent brittleness index and two have poor brittleness index. It shows that the brittleness distribution of shale in Minfeng subsag is extremely uneven, and some have strong brittleness, while some brittleness is relatively weak.

3. Numerical Simulation of Oil Shale Mechanical Properties

3.1. Principle of Particle Discrete Element Method

The particle discrete element method was proposed by P. A. Cundall et al. [17] as a numerical simulation method. Specifically, it abstracts rock as an assembly of particles. Different cementation methods result in different contact force calculation methods between particles during simulation calculations. Therefore, different cementation models can be used between particles to simulate different mechanical properties in rocks [18,19]. When the cementation model is applied between particles, it determines their normal adhesion strength and shear normal strength according to preset values. If the maximum tensile stress at the connection exceeds its normal adhesion strength during simulation, tensile failure will occur, generating tensile cracks. If the maximum shear stress exceeds the shear normal strength, shear failure will occur, generating shear cracks.
Considering that using physical experiments to separately test the mechanical parameters of each lamination and structural weak plane of shale requires finding core samples with suitable lamination positions and lithology, and given the limited number and types of core samples, it is extremely difficult to find suitable shale. Therefore, based on existing rock mechanics experimental data, numerical models need to be established using the particle discrete element method. Subsequently, the microscopic parameters of each lamina are substituted into the Brazilian splitting model, the uniaxial compression model, and the three-point compression model of the Brazilian disc with a central straight notch to convert the microscopic parameters of the model into macroscopic rock mechanics parameters such as Young’s modulus, Poisson’s ratio, and compressive strength.
In model establishment, the lamination part uses linearbond model cementation, which is the most commonly used model for rock simulation [20,21]. There are laminae using the flatjoint model, but relatively few [22,23]. For the structural weak plane part, currently, the mainly used cementation models include the weakened linearbond model, the smoothjoint model, and the flatjoint model [24,25]. The weakened linearbond model uses a linearbond model with lower strength than the lamination at the structural weak plane, but once it breaks, all cementation of that structural weak plane breaks simultaneously, which does not conform to reality. The flatjoint model can formulate parameters more precisely, but practical applications have found it difficult to break. After testing, the smoothjoint model showed the best simulation effect, so the structural weak plane adopts the smoothjoint model in model construction.

3.2. Numerical Simulation of Brazilian Splitting

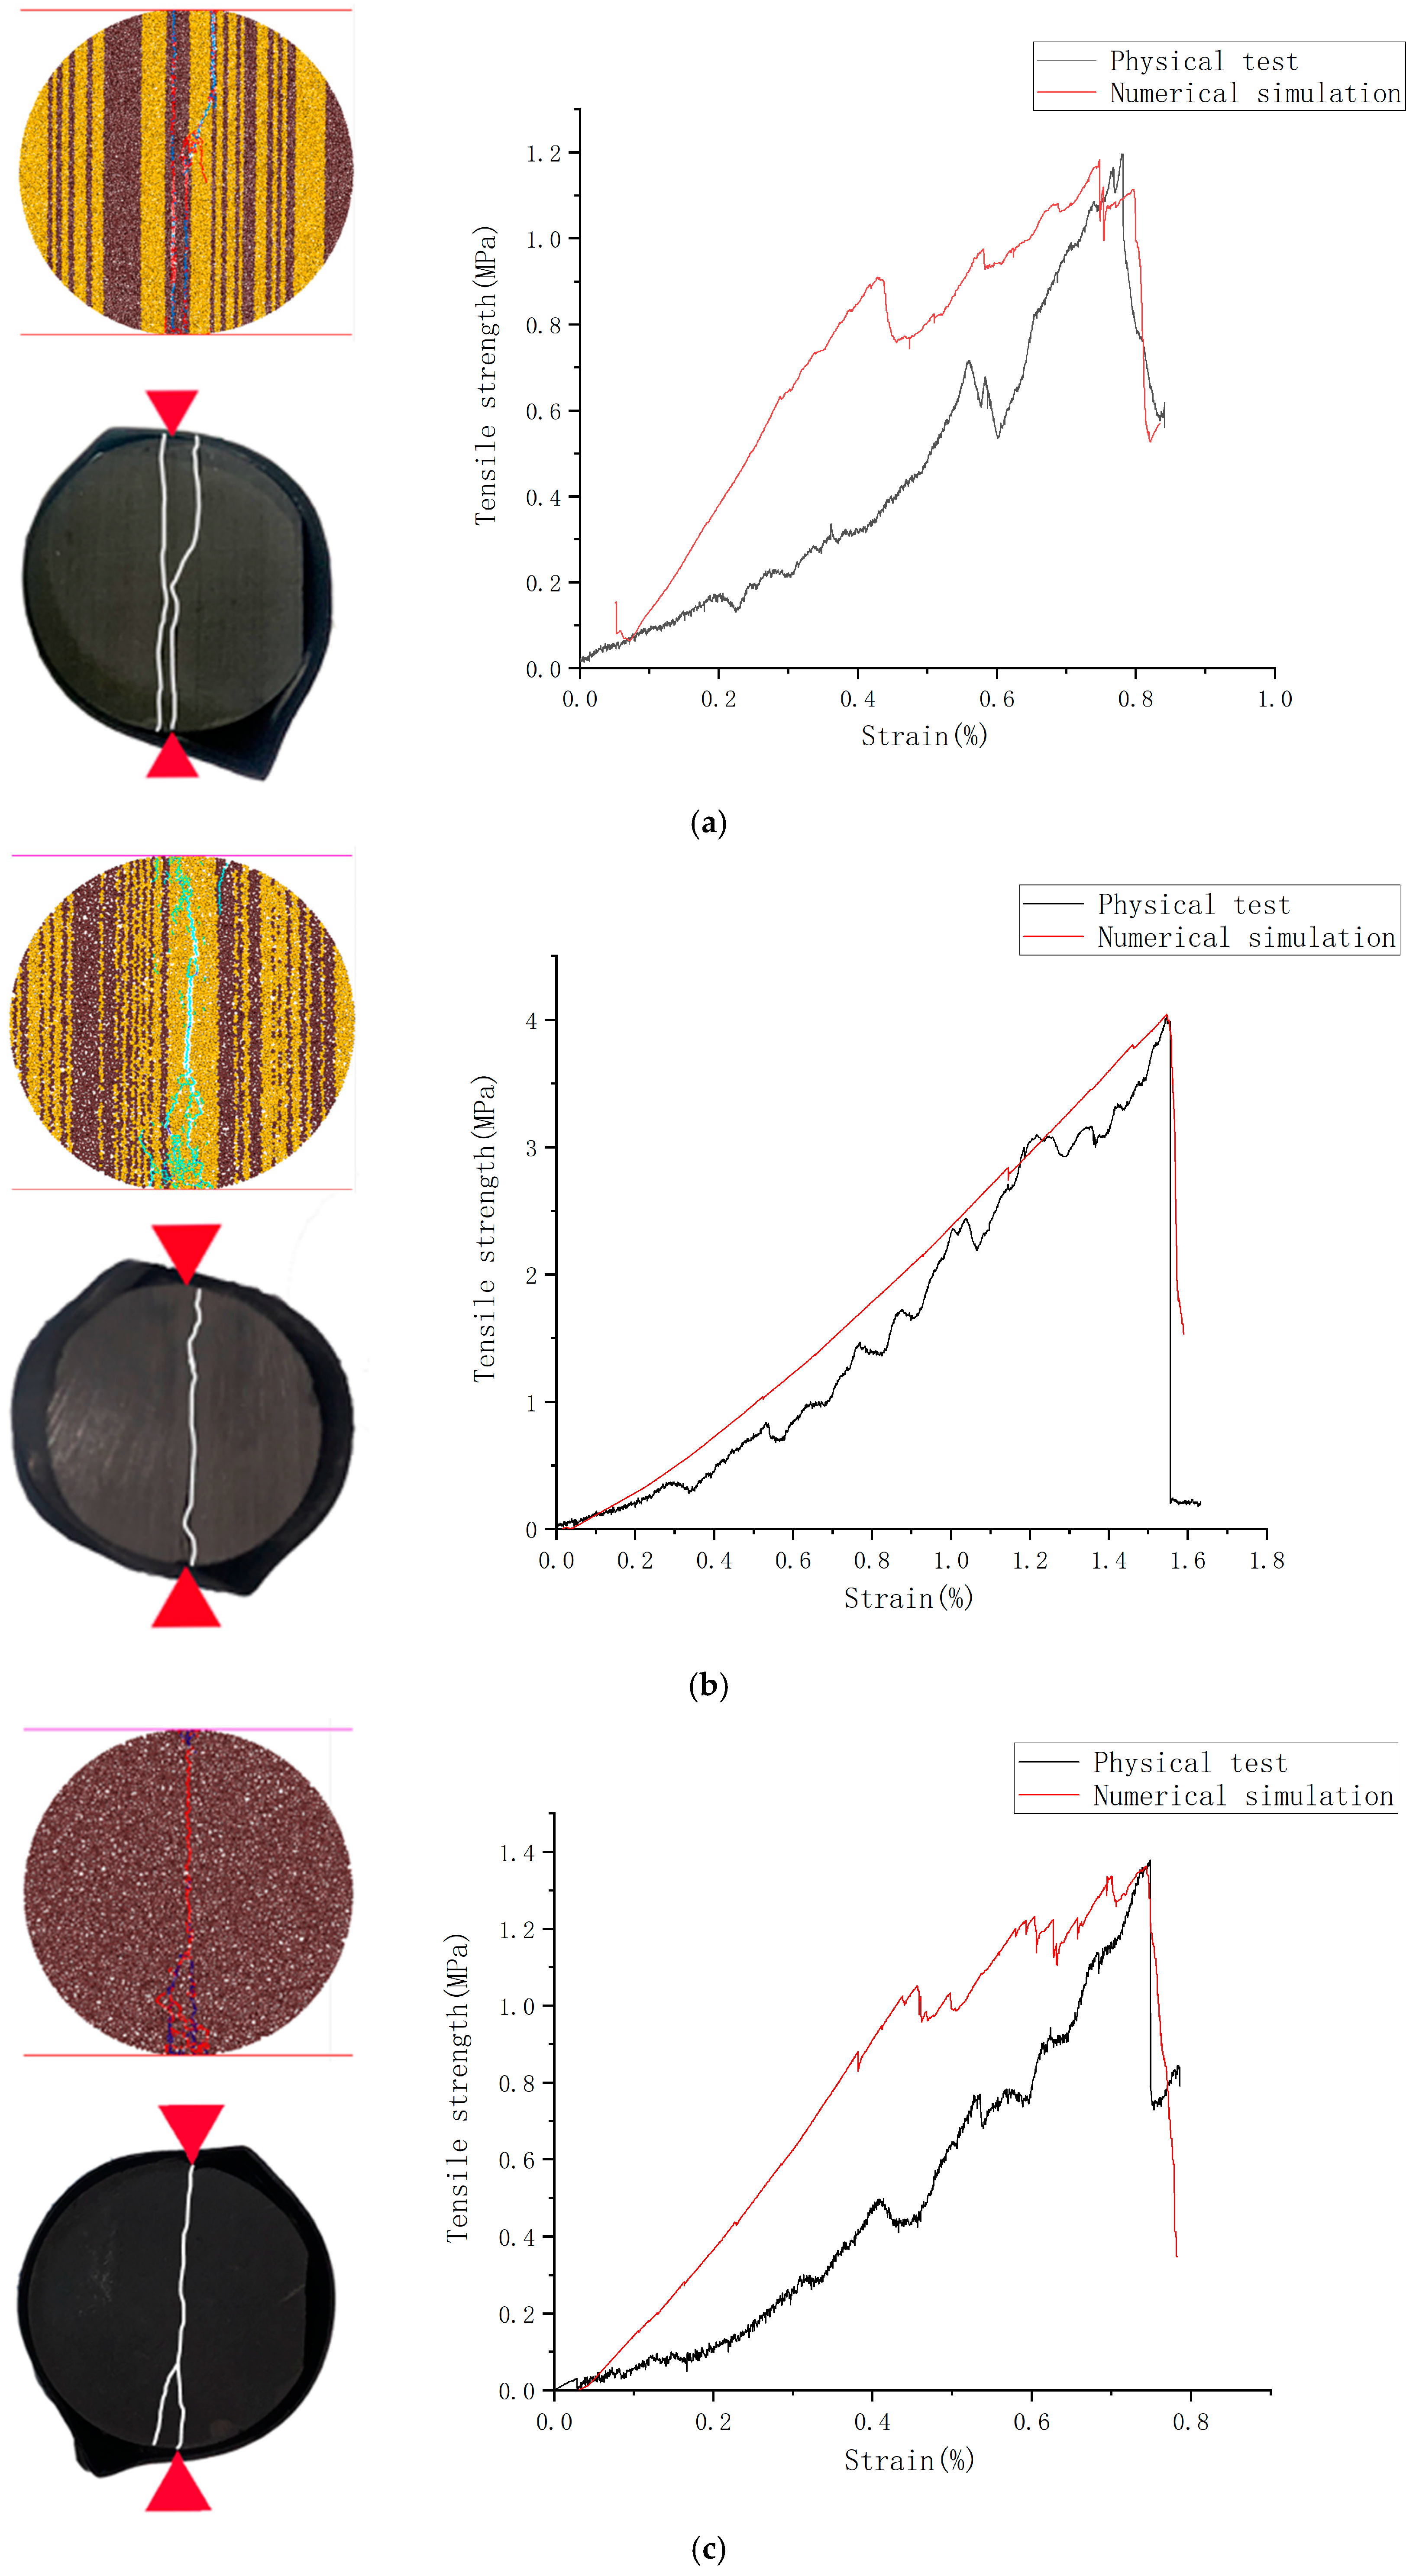
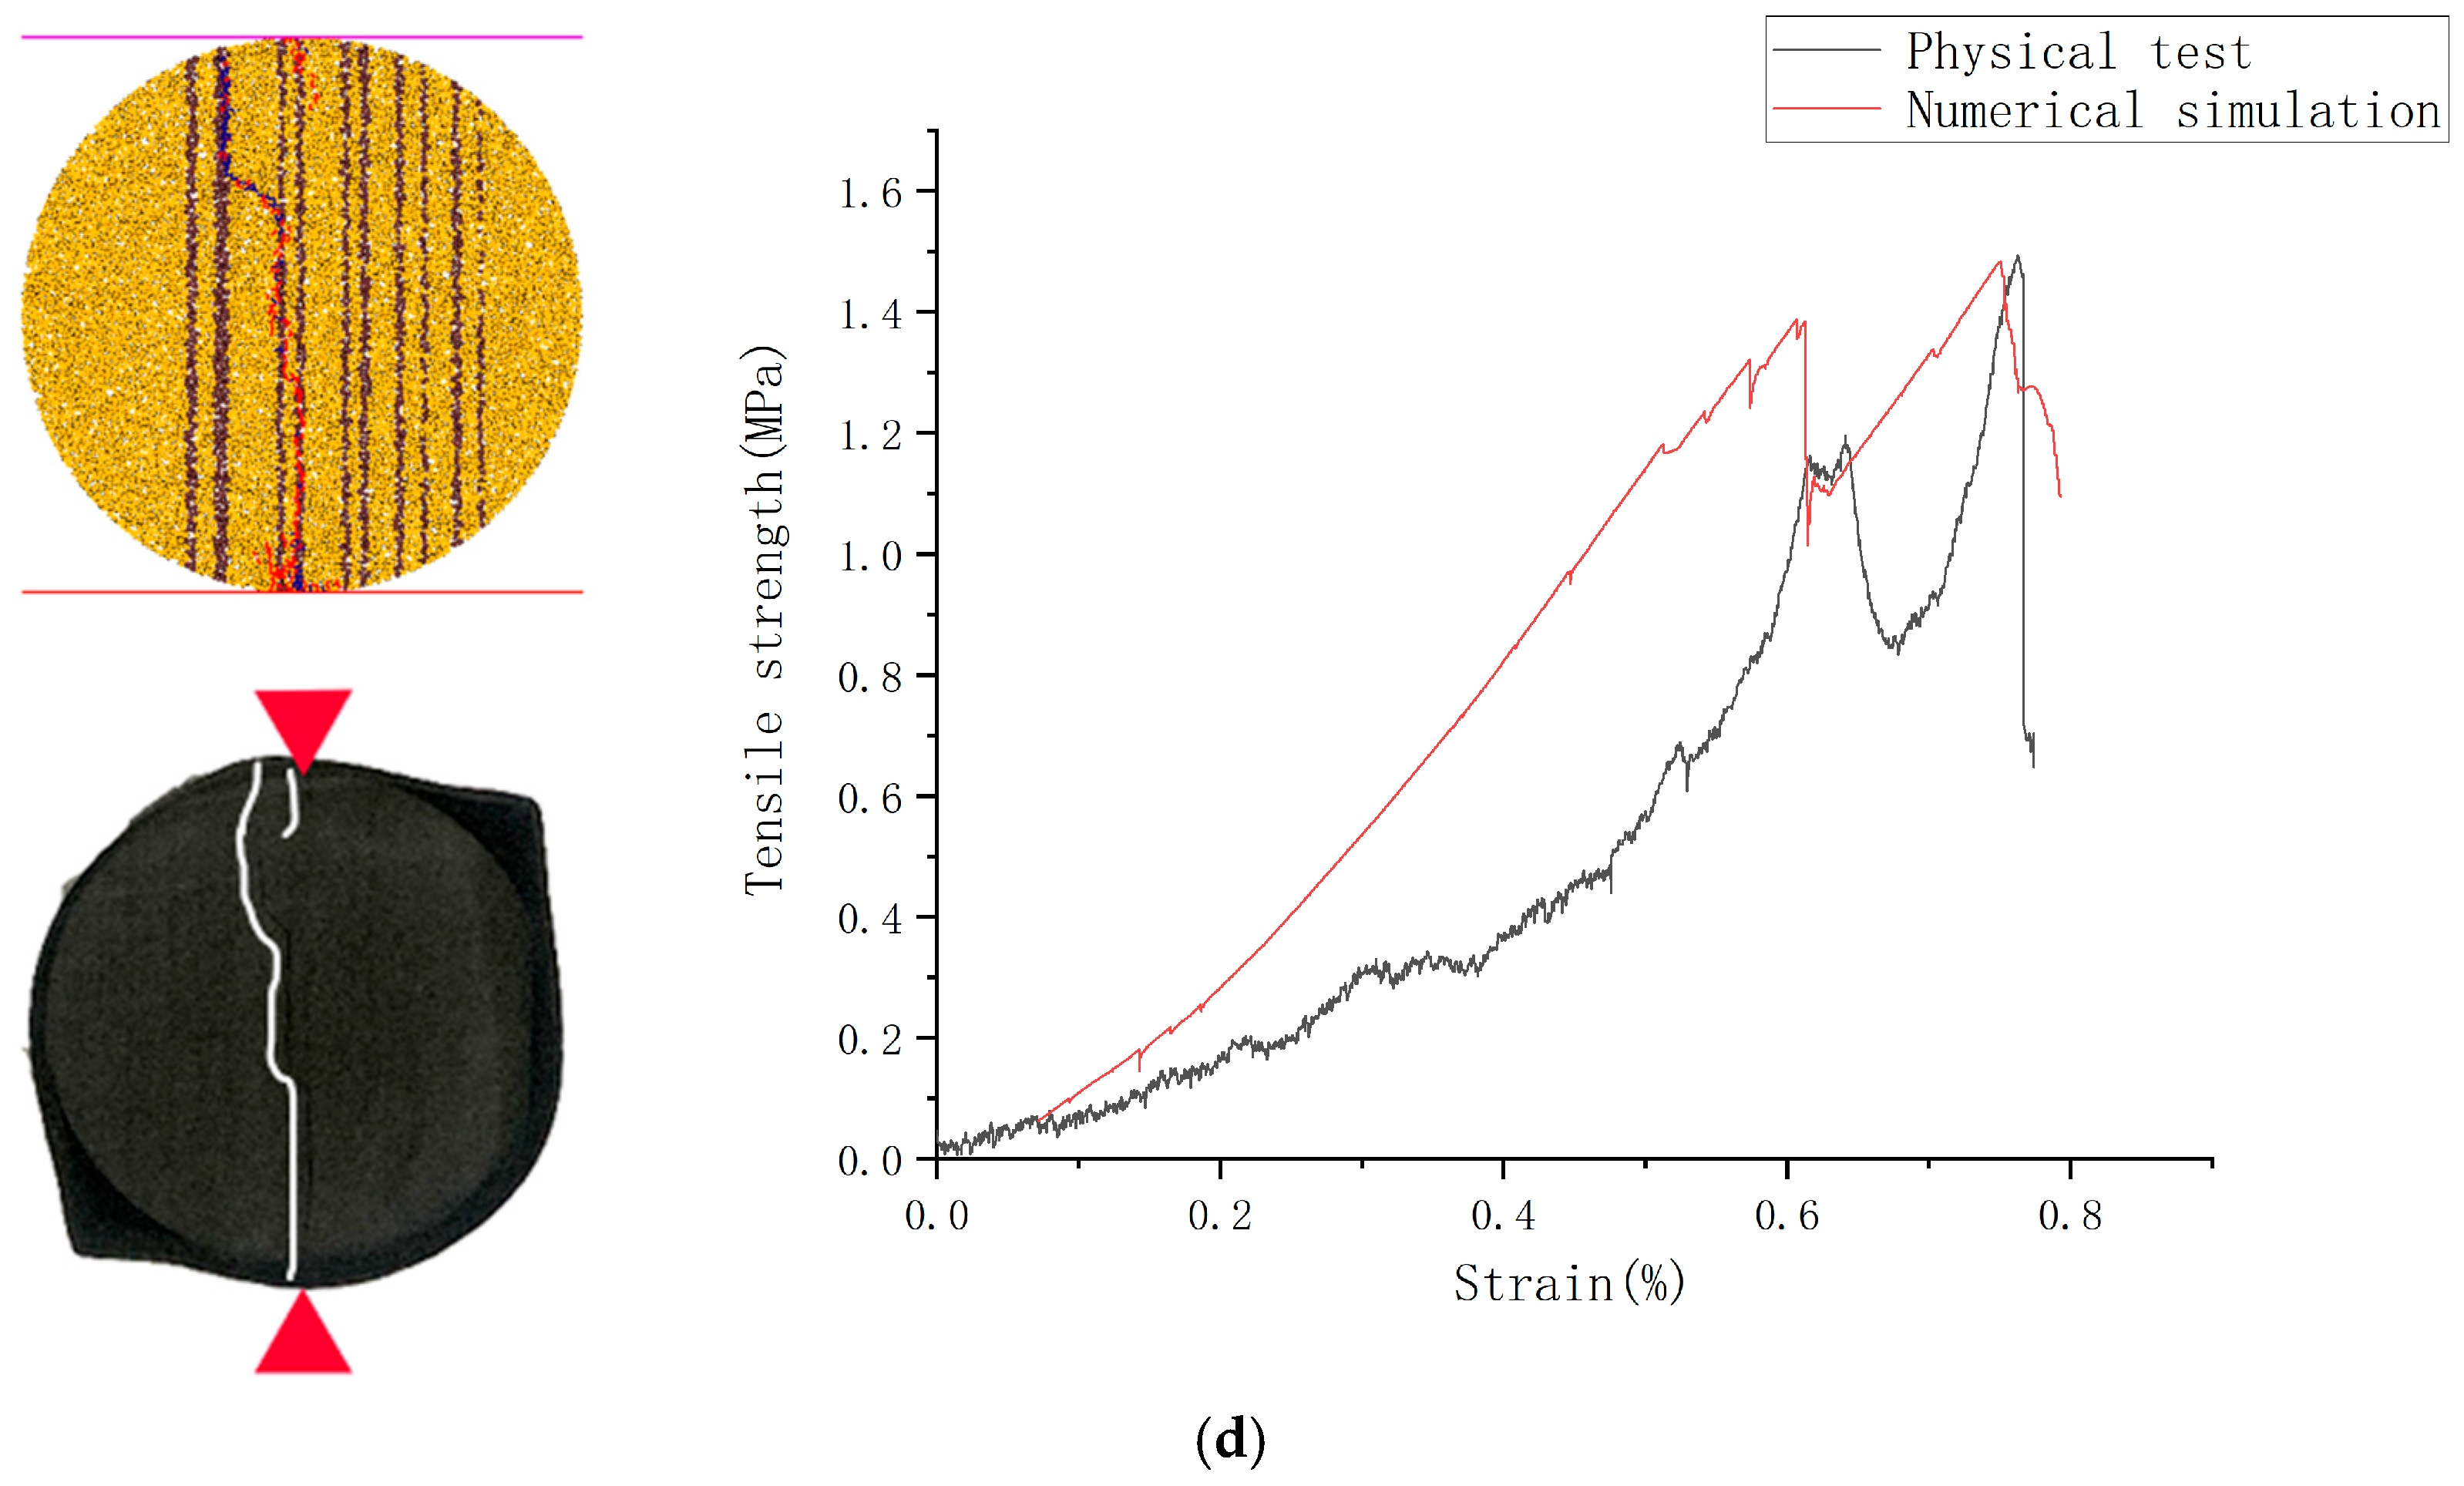
Based on the bedding position and lithology of the core samples in the Brazilian splitting experiment, combined with XR ray diffraction results, four core numerical models were constructed using PFC2D; the loading speed was 0.02 m/s. The model bedding position was constructed according to the actual core sample size, with approximately 7600 particles, a particle density of 2800, and a particle friction coefficient of 0.577.In the model, the gold particles refer to “Felsic-bearing mixed lamina”, coffee particles refer to “Carbonate-bearing mixed lamina”. The initial rock mechanics parameters were assigned to each lamina, and the numerical core Brazilian experiment simulation was carried out under the same loading conditions as the real Brazilian experiment. Based on the stress–strain curve and fracture surface morphology of the actual core, the rock mechanics parameters of the laminations were adjusted until the fracture surface morphology of the numerical core matched that of the actual core, and the overall stress–strain curve of the numerical core was close to the experimentally measured results (error less than 10%). Subsequently, the obtained parameters were substituted into the single-lithology Brazilian splitting model to obtain the macroscopic tensile strength.
The final rock mechanics simulation results and particle parameters are shown in Table 7, Table 8 and Table 9 and Figure 8:
For the structural weak planes in the shale model, during trial-and-error processes, it is found that, if the structural weak planes parameter is set to a single value, problems with different fracture sequences would occur, which would directly cause incorrect fluctuations in the simulation curve morphology. It is necessary to adjust the parameters of different structural weak planes according to the actual curve to ensure that the curve obtained from numerical simulation fits the actual situation. Therefore, some structural weak plane parameters are range values.
The Y-Ten-02 core sample could not infer its lamination parameters because its crack was located in the centre of the lamination and did not connect with any bedding.
From the experimental results, it can be seen that the tensile strength of bedding and structural weak plane of the four groups of core samples varies greatly. The tensile strength of carbonate-bearing mixed shale laminations ranges from 2.381 to 4.999 MPa, with an average value of 3.609 MPa. The tensile strength of felsic-bearing mixed shale laminations ranges from 2.043 to 4.907 MPa, with an average value of 3.675 MPa. The tensile strength range of structural weak planes is 0.139–0.141 MPa, with an average tensile strength of 0.319 MPa.
Combined with the results of scanning electron microscopy, it can be seen that the internal bedding fractures of felsic-bearing mixed shale laminations are more developed than carbonate-bearing mixed shale laminations, so its tensile strength is smaller.

3.3. Numerical Simulation of Biaxial Compression

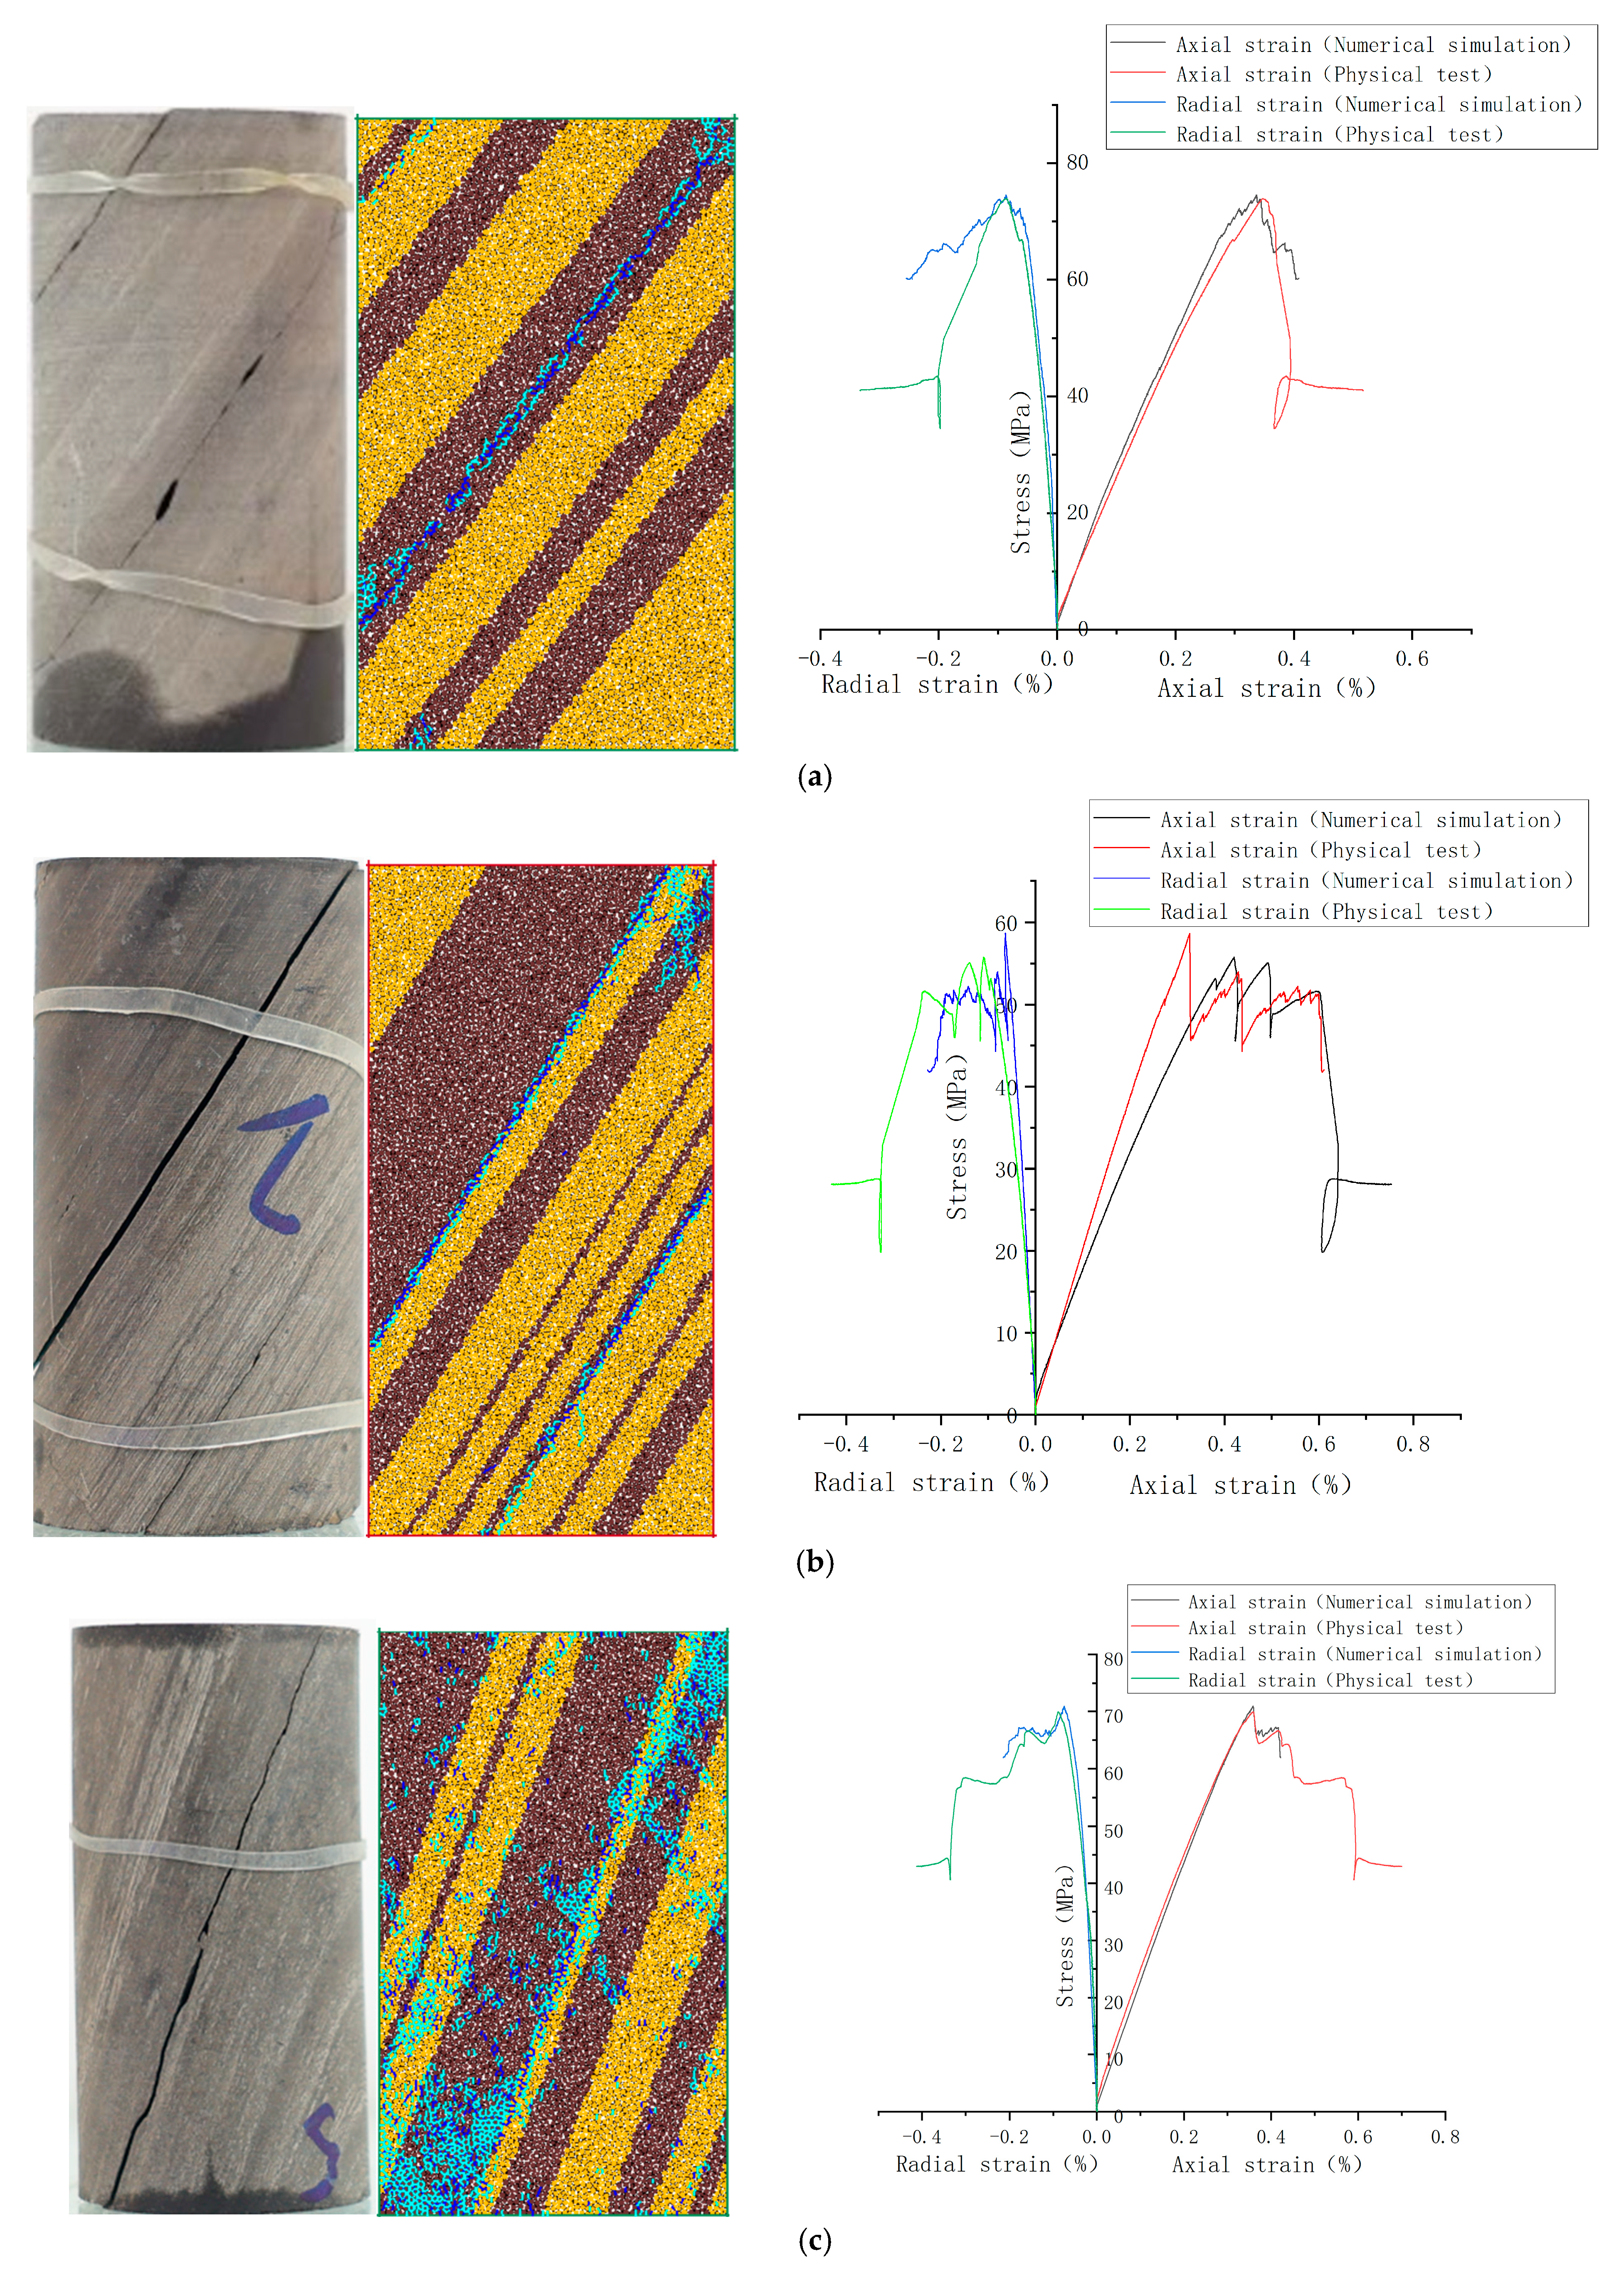
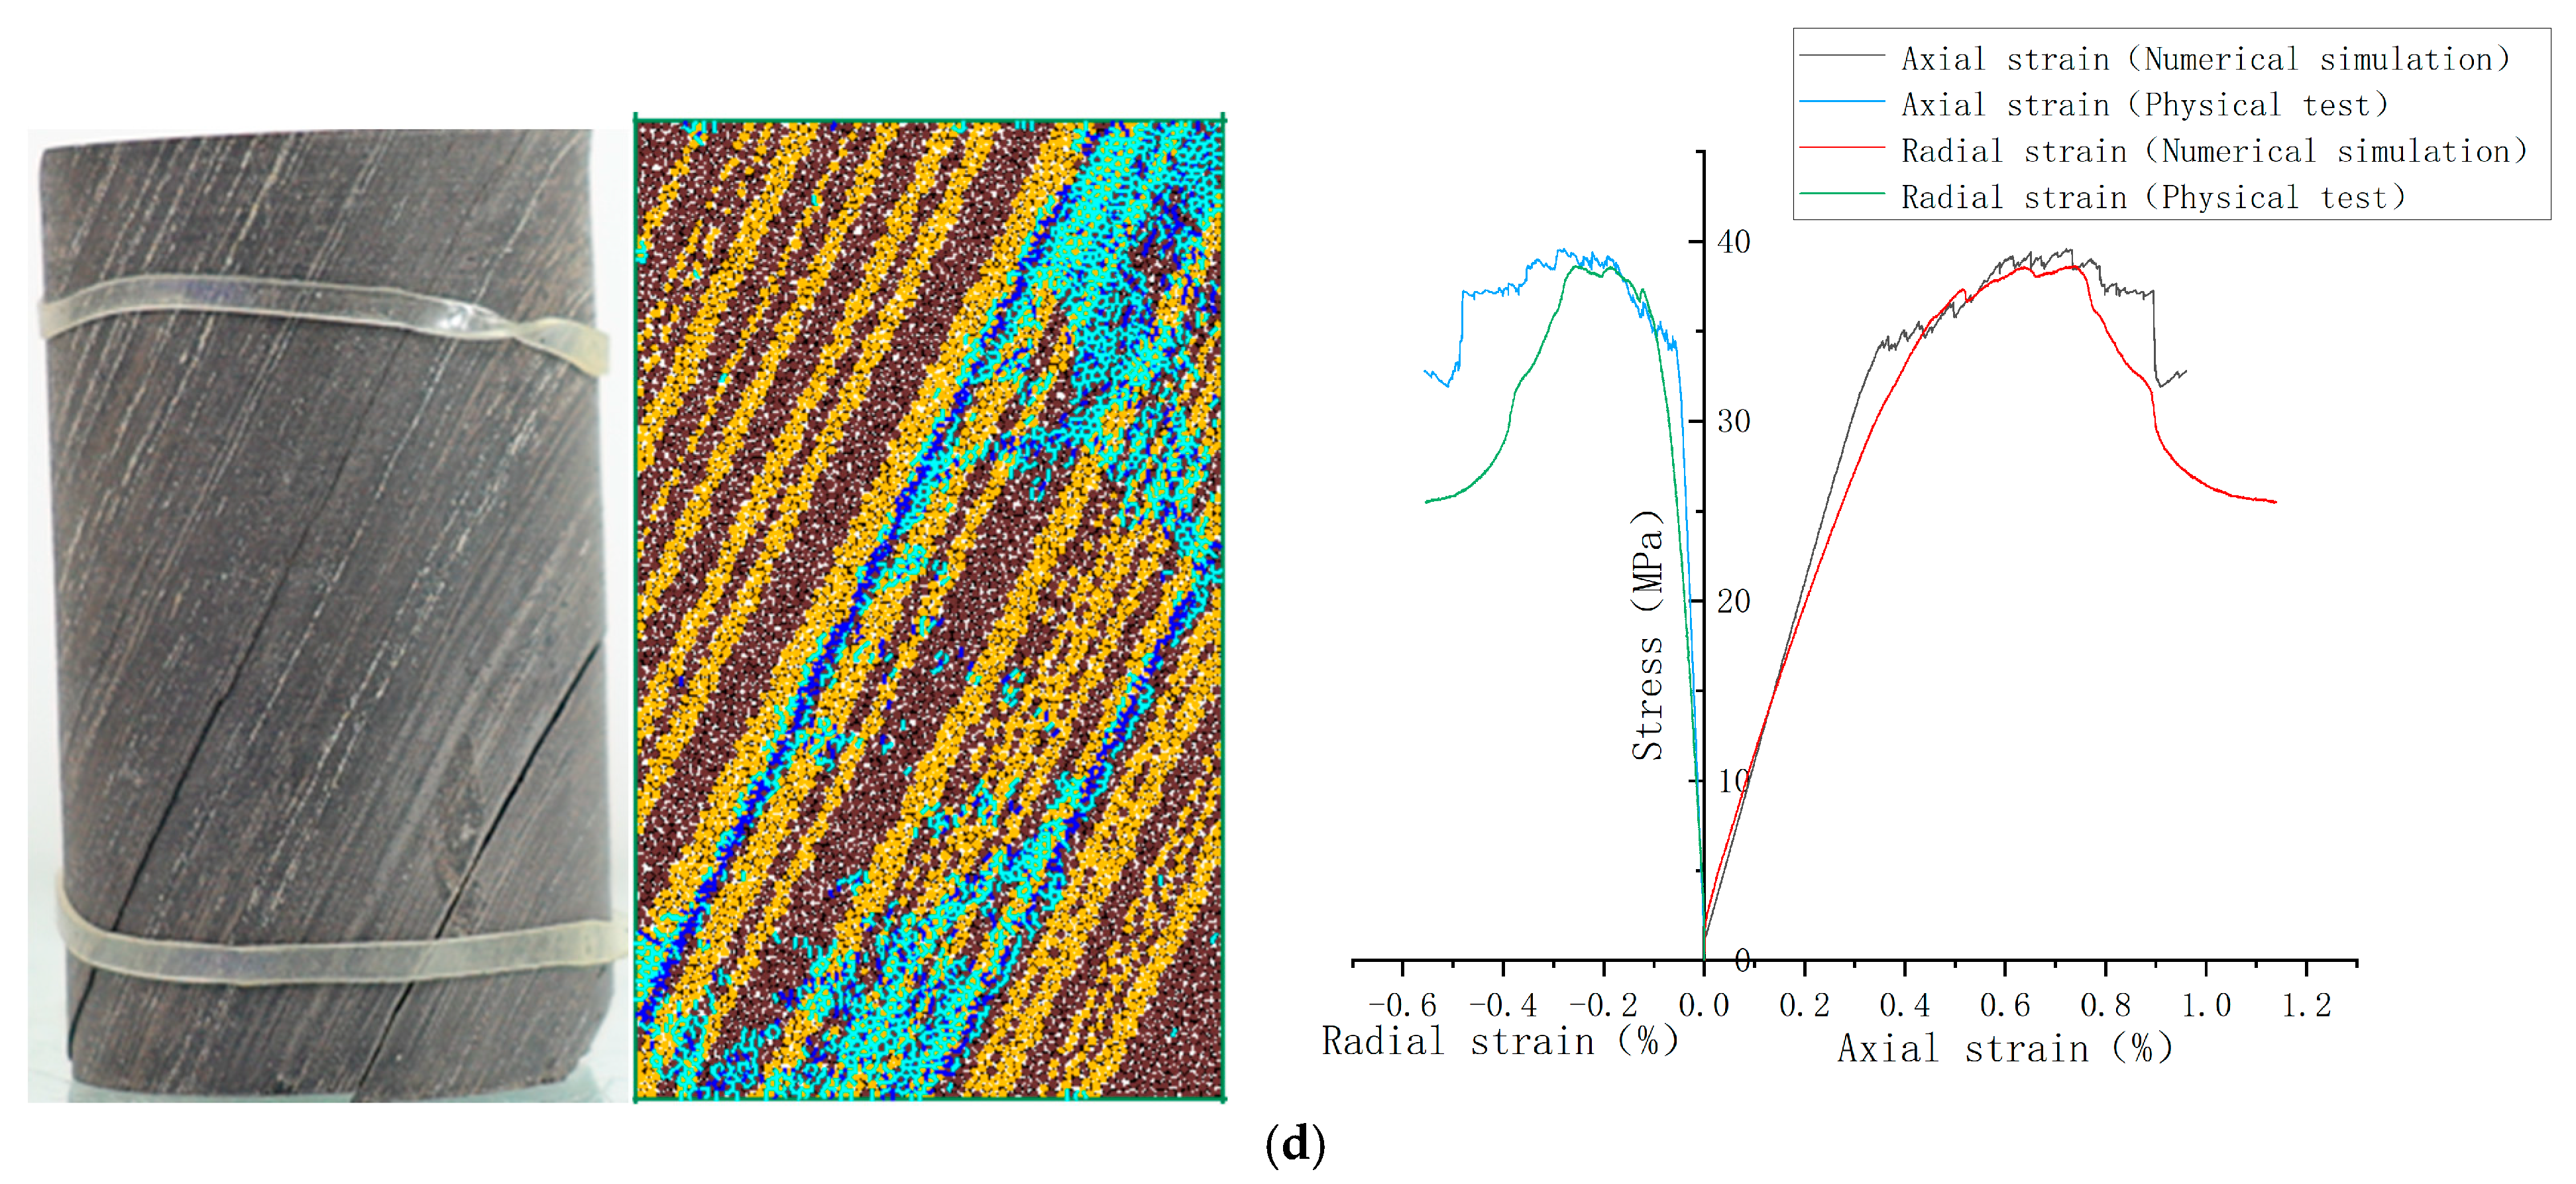
Based on the core morphology, size, lamination position, lamination thickness, and lamination lithology of the triaxial compression test, a PFC2D biaxial compression model was constructed, with the core confining pressure set to the same as the physical experiment (13.2 MPa), the loading speed was 0.02 m/s. Subsequently, the cementation parameters of each lamina were adjusted through the trial-and-error method until the fracture surface approached that of the actual core, and the experimental results had an error of less than 10% compared to the triaxial compression experiment results. Then, the obtained parameters were substituted into the single-lithology uniaxial compression model to obtain the compressive strength, Poisson’s ratio, and Young’s modulus. The model had a particle density of 2500 and a friction coefficient of 0.577 for the biaxial compression model, obtaining the microscopic cementation parameters of each lamina, as shown in Figure 9(In model, blue lines mean shear fracture, light blue line means tension fracture.) and Table 10 and Table 11. The simulation results of biaxial compression are shown in Table 12.
From the simulation results, it can be seen that the strength distribution of each lamina of the core samples varies greatly. The compressive strength of felsic-bearing mixed shale laminations ranges from 14.64 MPa to 65.71 MPa, with an average value of 35.28 MPa; the Young’s modulus distributes between 9.81 GPa and 35.57 GPa, with an average of 20.83 GPa; and Poisson’s ratio distributes between 0.244 and 0.273, with an average value of 0.263. The compressive strength of carbonate-bearing mixed shale laminations ranges from 13.62 MPa to 55.89 MPa, with an average value of 31.41 MPa; Young’s modulus distributes between 5.92 and 34.70 GPa, with an average of 19.66 GPa; and Poisson’s ratio distributes between 0.198 and 0.271, with an average value of 0.240. According to the nanoindentation experiments carried out by Du Y et al. [26], the elastic modulus of quartz is significantly higher than that of carbonate rock, which is in line with the actual situation.
After obtaining the Young’s modulus and Poisson’s ratio of each lamina, the brittleness index of each lamina can be calculated according to Equation (6). Because the simulated data are layered to obtain the rock mechanical strength, which is different from the actual core, E m a x , E m i n , ν m a x , and ν m i n are different from the actual core. E m a x is the maximum Young’s modulus (3.557 × 10⁴ MPa) in the same batch simulation, and E m i n is the minimum Young’s modulus (0.892 × 10⁴ MPa) in the same batch simulation. The ν m a x is the maximum Poisson’s ratio (0.273) in the same batch simulation. The minimum Poisson’s ratio (0.198) in the same batch simulation was taken as ν m i n .
Finally, the brittleness index was obtained, as shown in Table 13.
From the simulation results, it can be seen that the brittleness index of each lamina of shale in Minfeng subsag also has a large span. According to the evaluation method of Table 6, there is one group of rock samples with excellent brittleness, one group of rock samples with good brittleness, two groups with medium brittleness, and four groups with poor brittleness. The brittleness of carbonate laminae is better than that of felsic laminae. From the results of scanning electron microscopy, it can be seen that there are many bedding fractures in shale in Minfeng subsag, which are developed by Liu H. et al. [27]. The study shows that the more bedding fractures are developed, the greater the fracture toughness of shale is. Therefore, it is speculated that the overall fracture toughness of shale is mostly provided by bedding fractures.

3.4. Fracture Toughness Simulation

Fracture toughness characterizes the ability of rock to resist crack propagation and is an inherent property of rock. The smaller its value, the easier it is for cracks to propagate. Obtaining the fracture toughness value of rock can provide basic parameters for rock hydraulic fracturing research and has guiding significance for rock hydraulic fracturing.
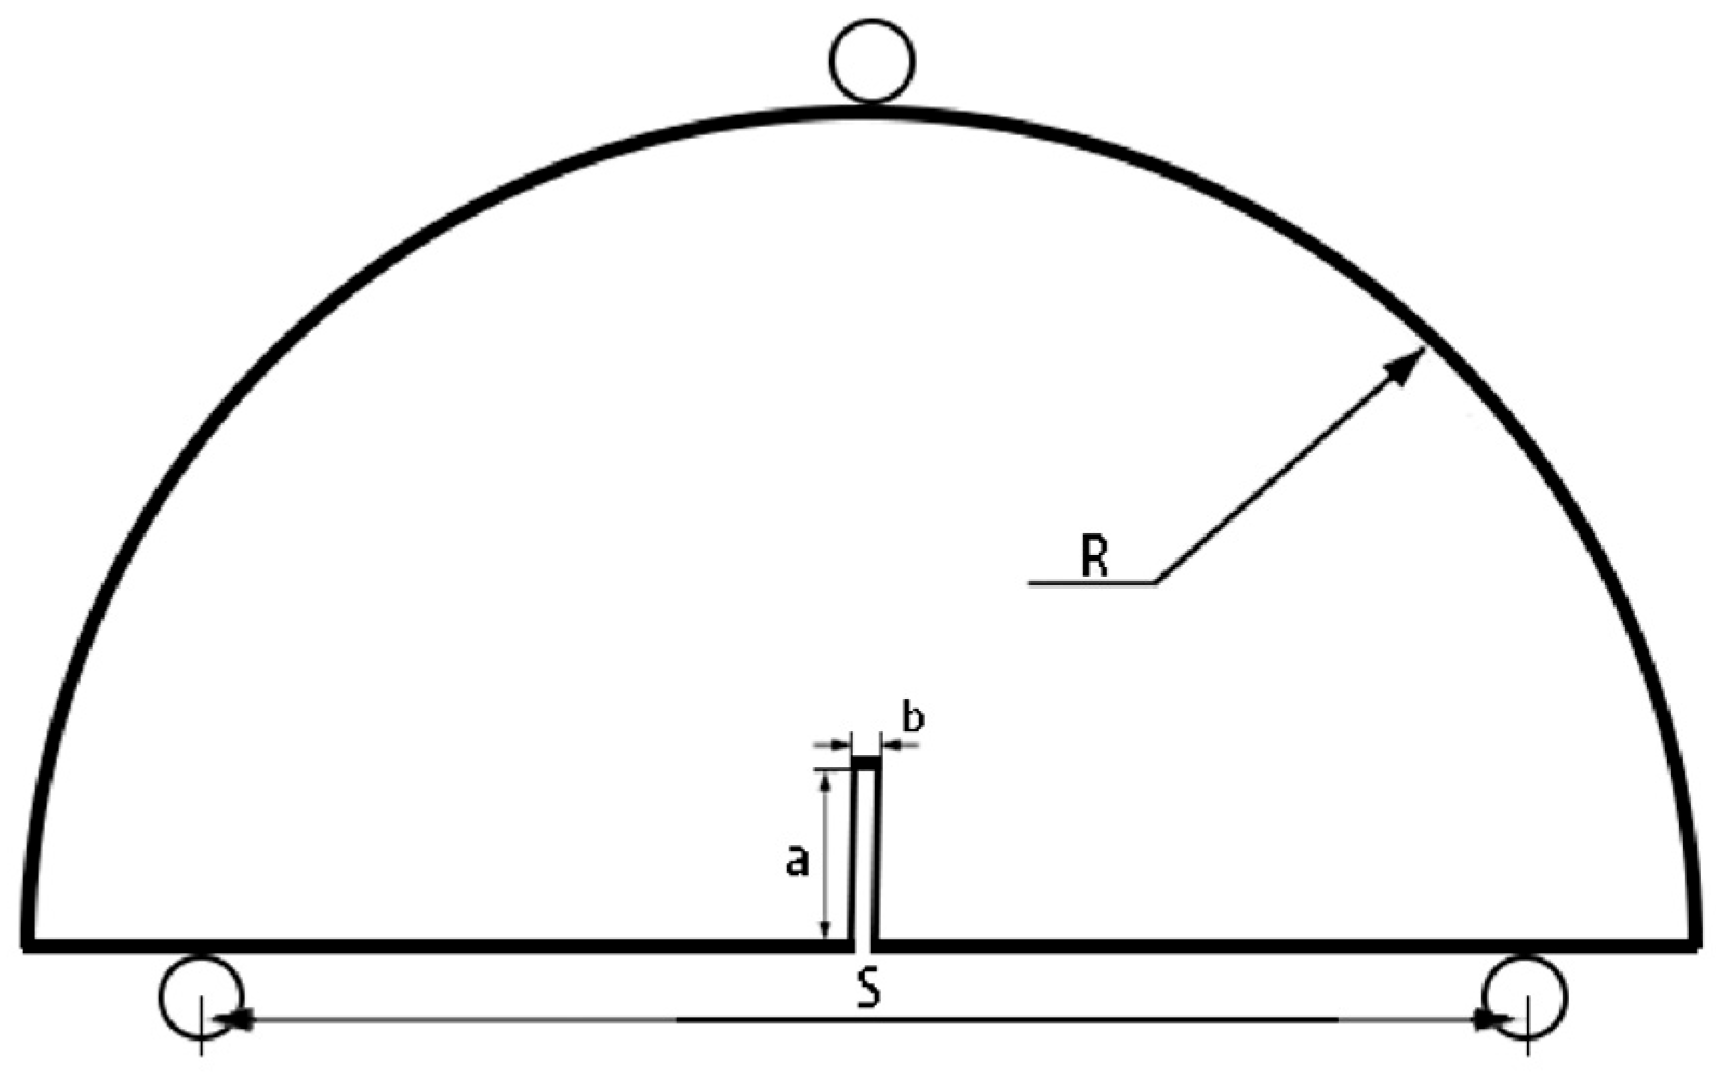
Using physical experiments to obtain the macroscopic fracture toughness of laminations places high demands on core samples. Using conventional measurement methods is limited by materials and is difficult to complete. Therefore, fracture toughness parameters can be obtained by establishing a three-point bending test model based on the simulated lamination parameters already obtained. ISRM recommends methods for measuring fracture toughness including three-point bending tests using circular beam specimens, short rod specimens, and notched Brazilian disc specimens. This paper uses PFC2D to construct notched Brazilian disc specimens.
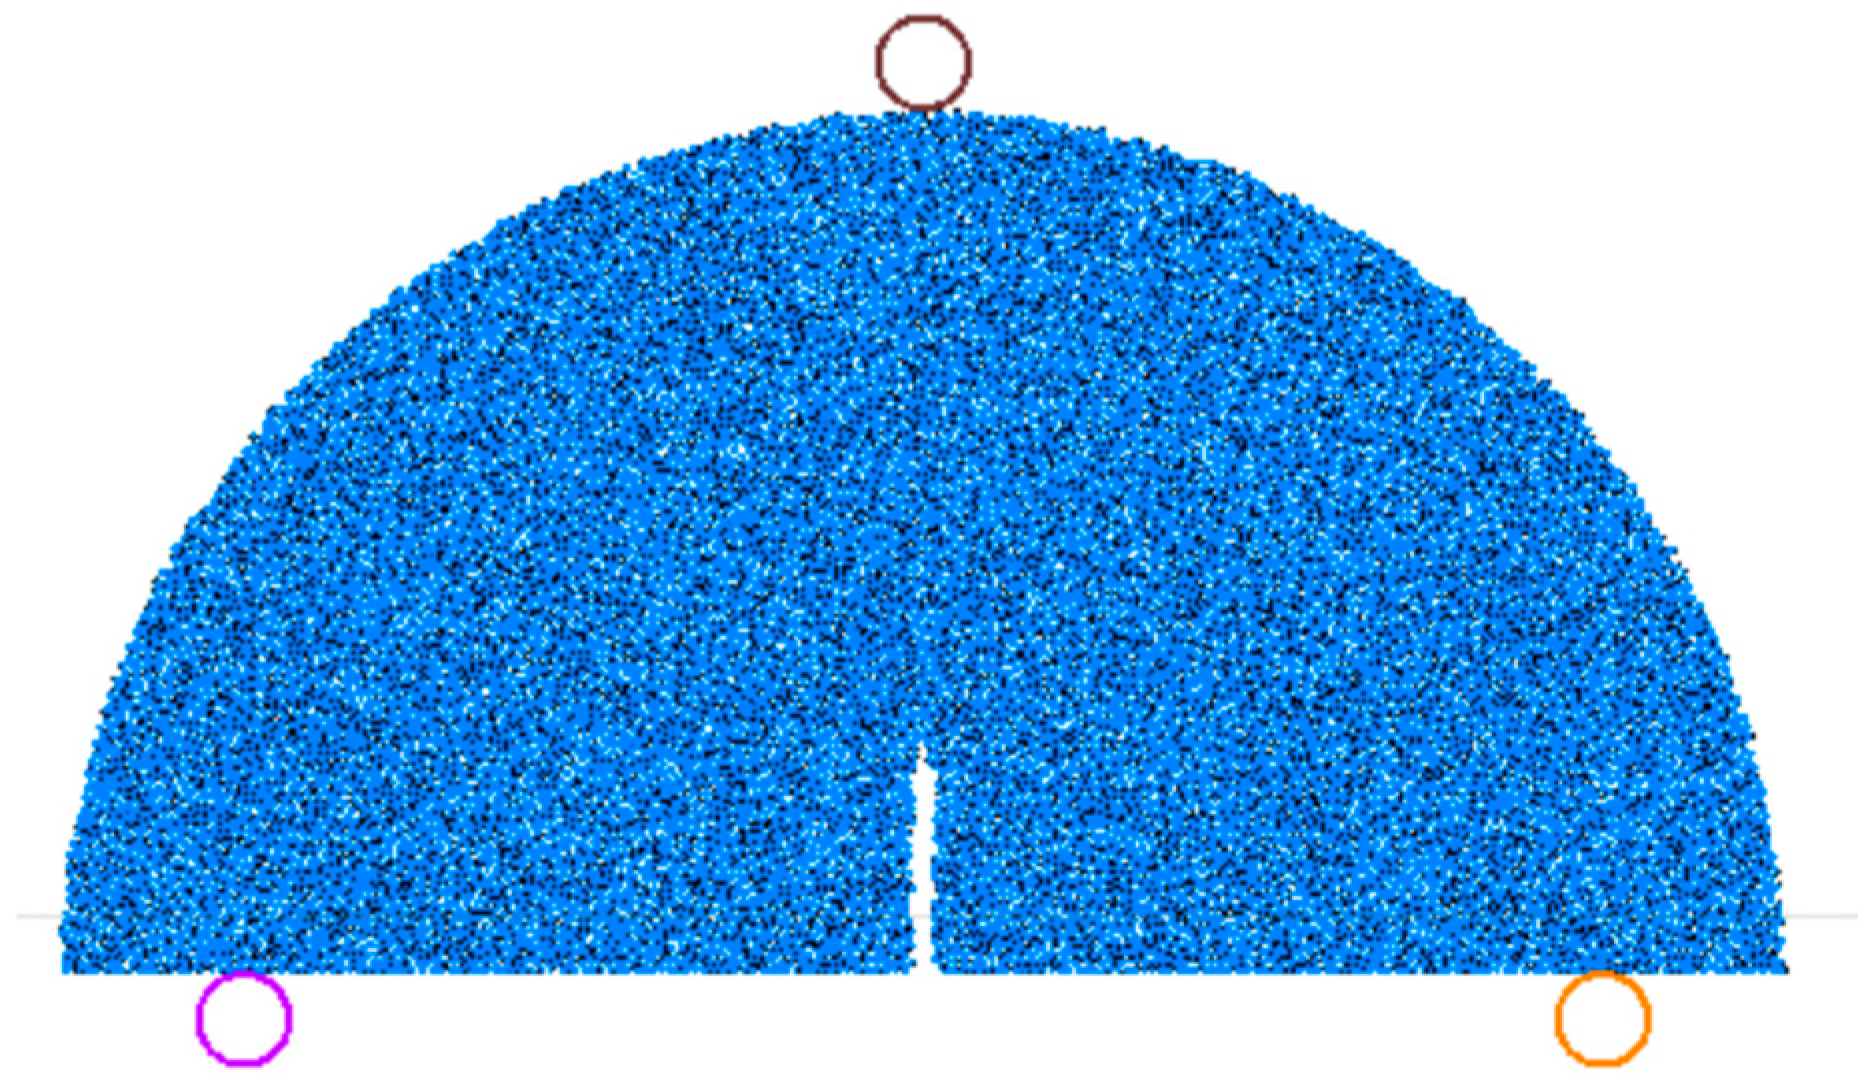
When using Brazilian disc specimens, the Notch Semi-Circular Bend (NSCB) is the standard method for measuring Mode I fracture toughness [28,29]. Its preparation is relatively simple, and, compared to Cracked Chevron Notched Brazilian Disc (CCNBD) with special requirements for the shape of the central slot, it can be simplified into a two-dimensional plane model [30]. Therefore, when constructing the model, it was built according to the standard of Brazilian disc straight-through slot specimens. After constructing the rock sample, three circular wall components were constructed at specified positions above and below the specimen as crossbeams to simulate the actual three-point compression experiment.
The dimensions of the central straight-through slot semi-disc specimen model were established referring to the dimension range recommended by ISRM. The specific parameters are shown in Table 14 and Figure 10. Referring to ISRM recommendations, the tip of the central crack was set as triangular, and the final model established is shown in Figure 11.
In the previous experimental study, the model parameters of the cores of each lithology in a number of target blocks were obtained, as shown in Table 15.
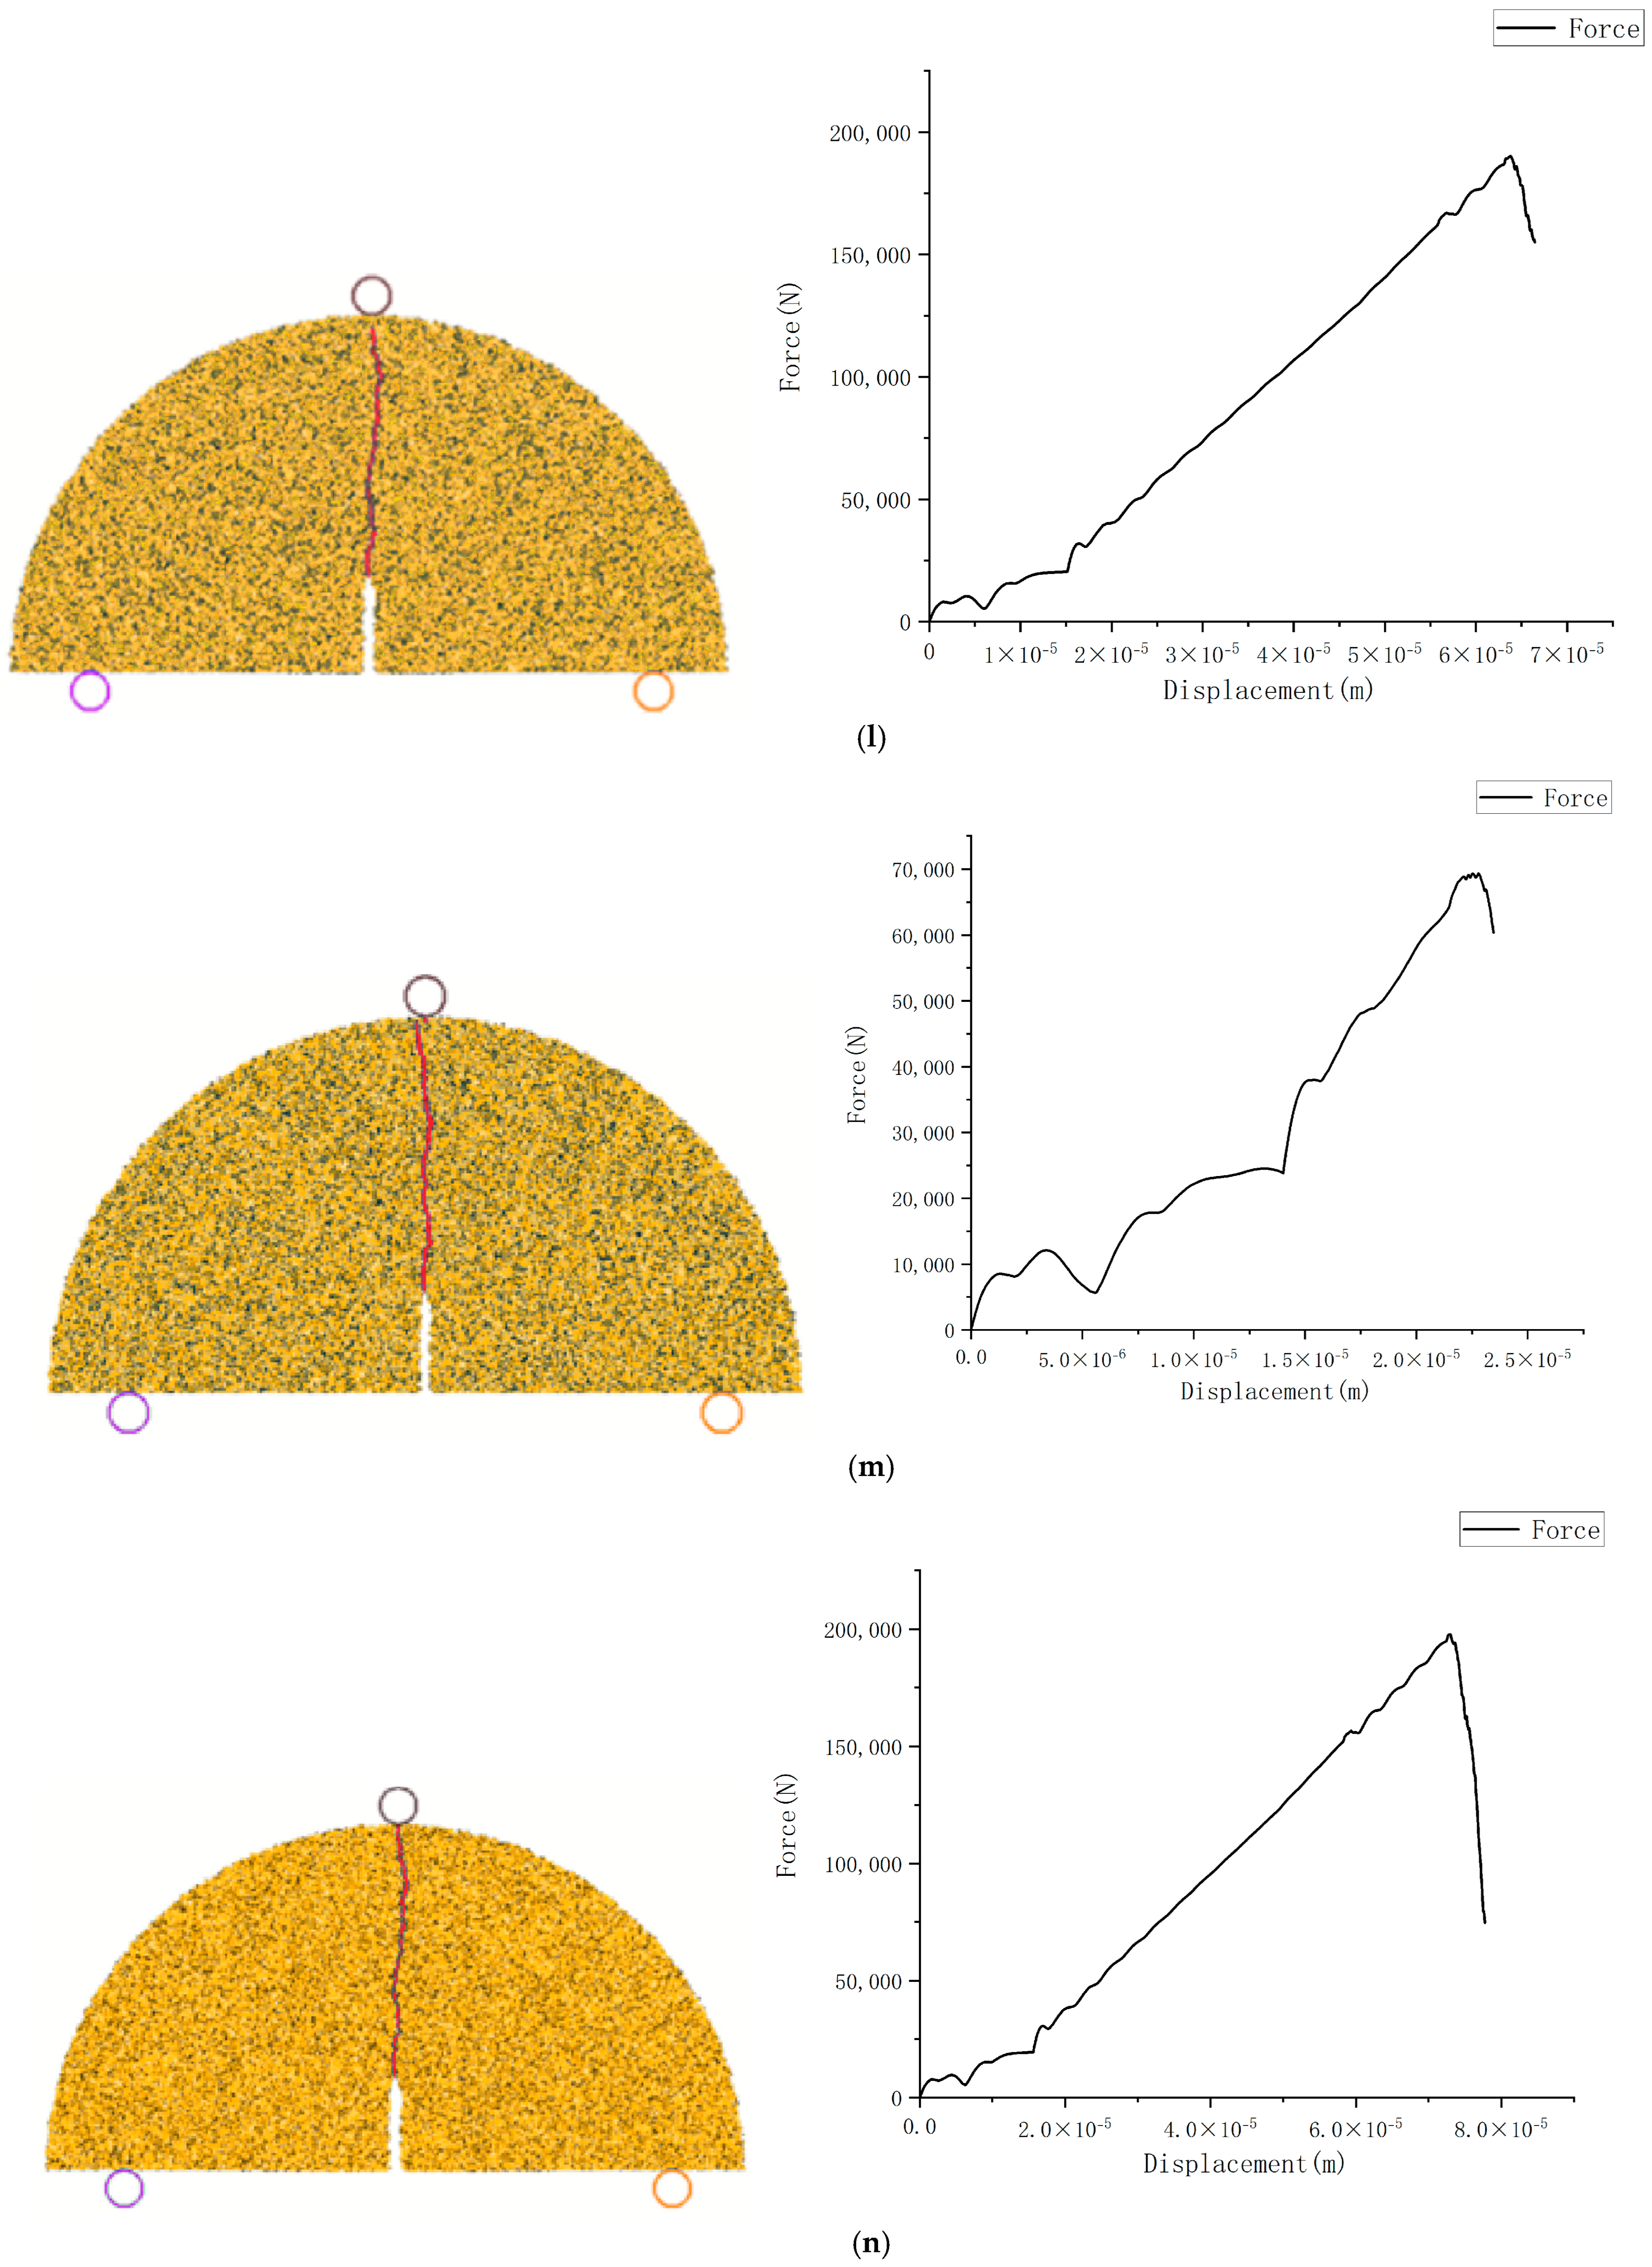
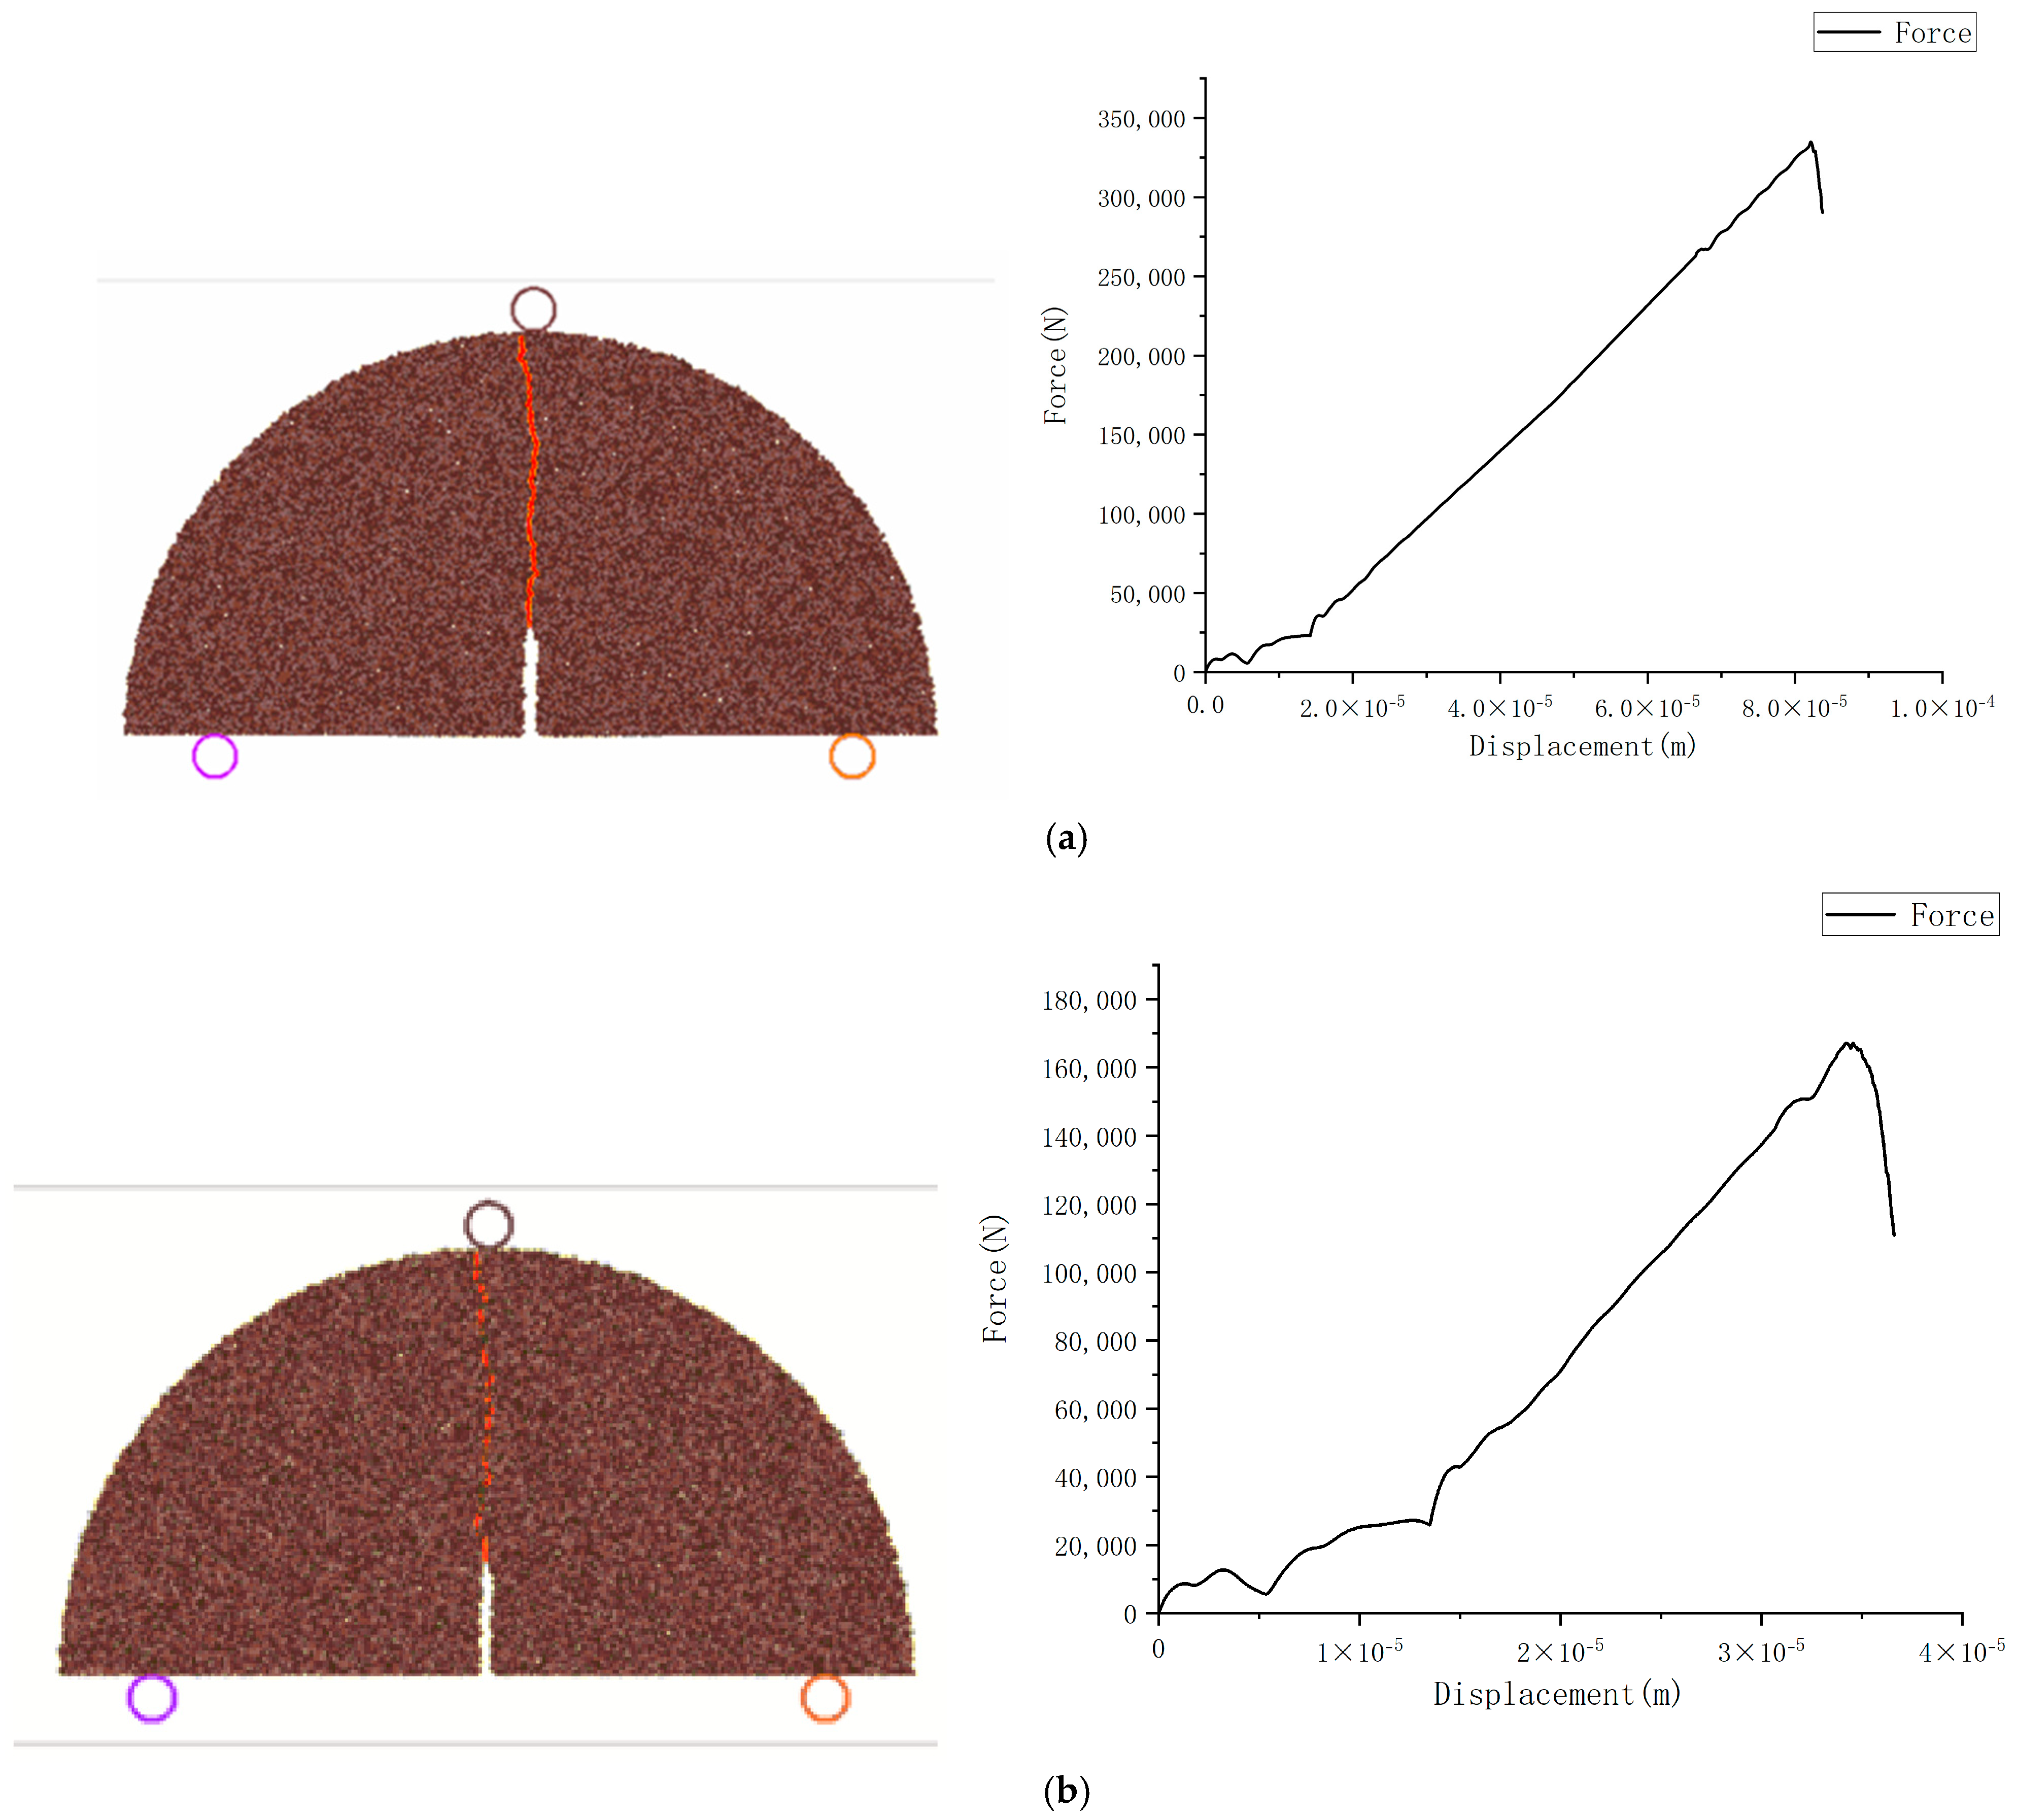
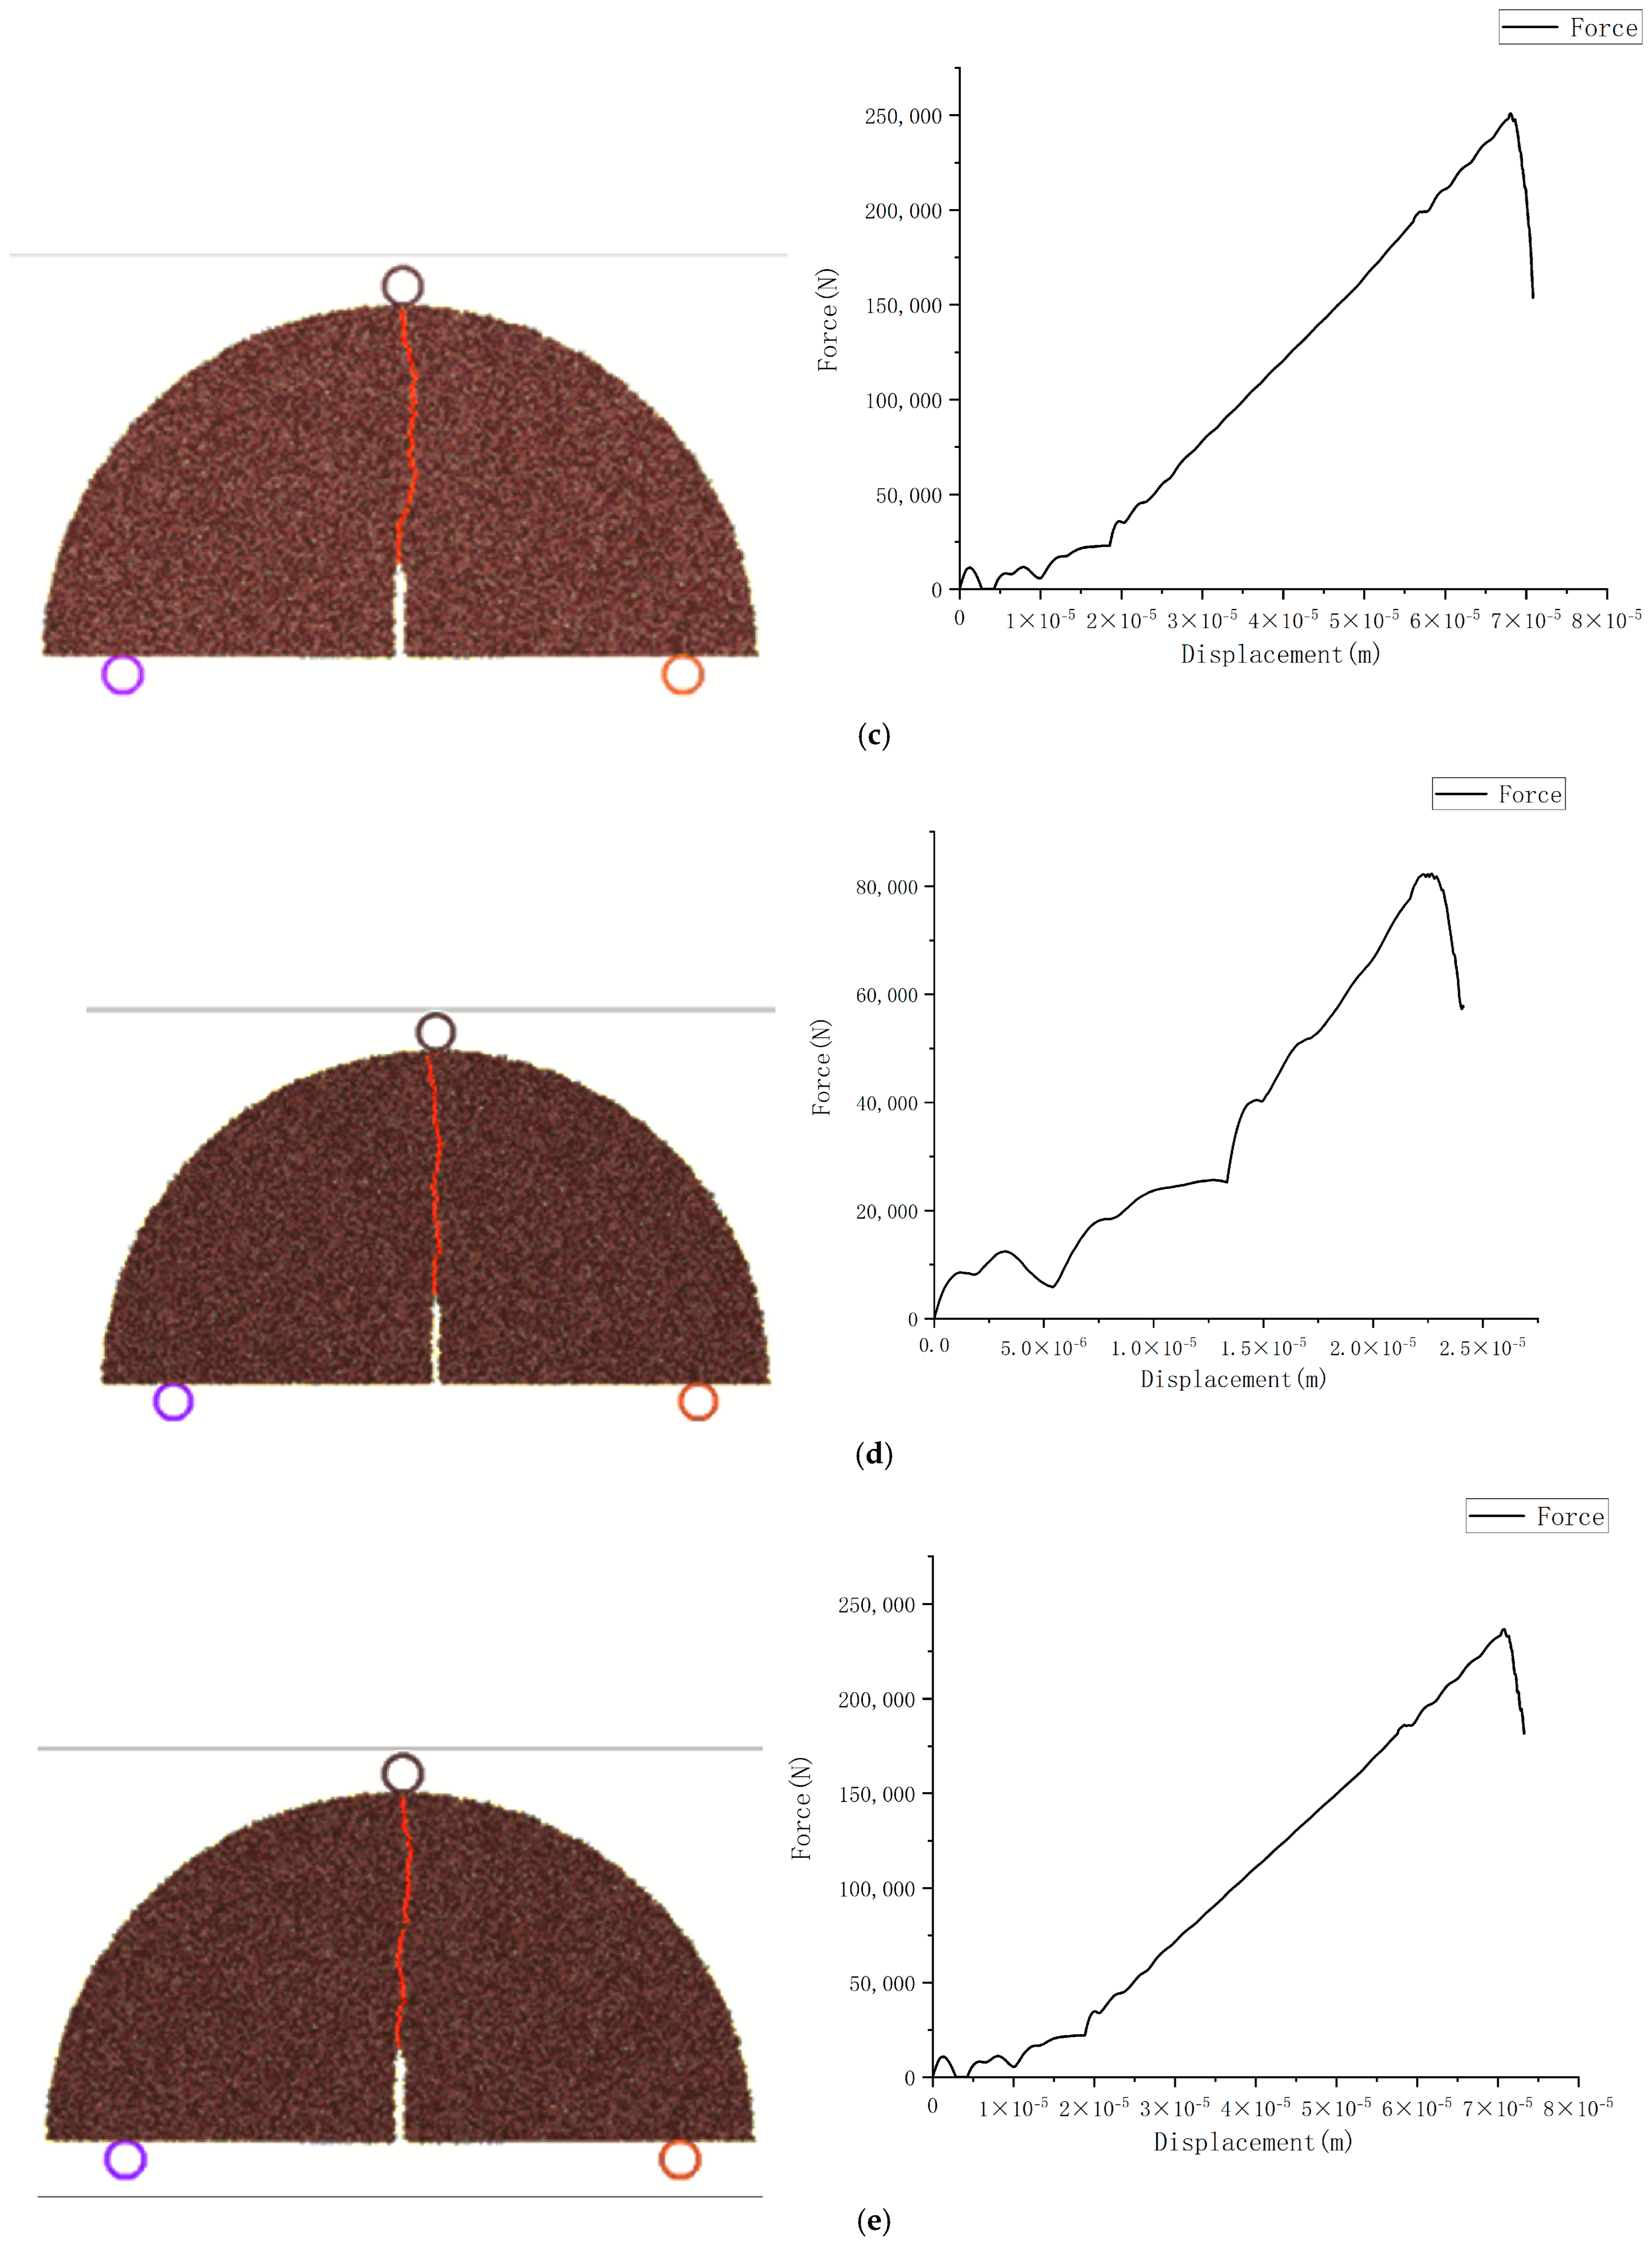
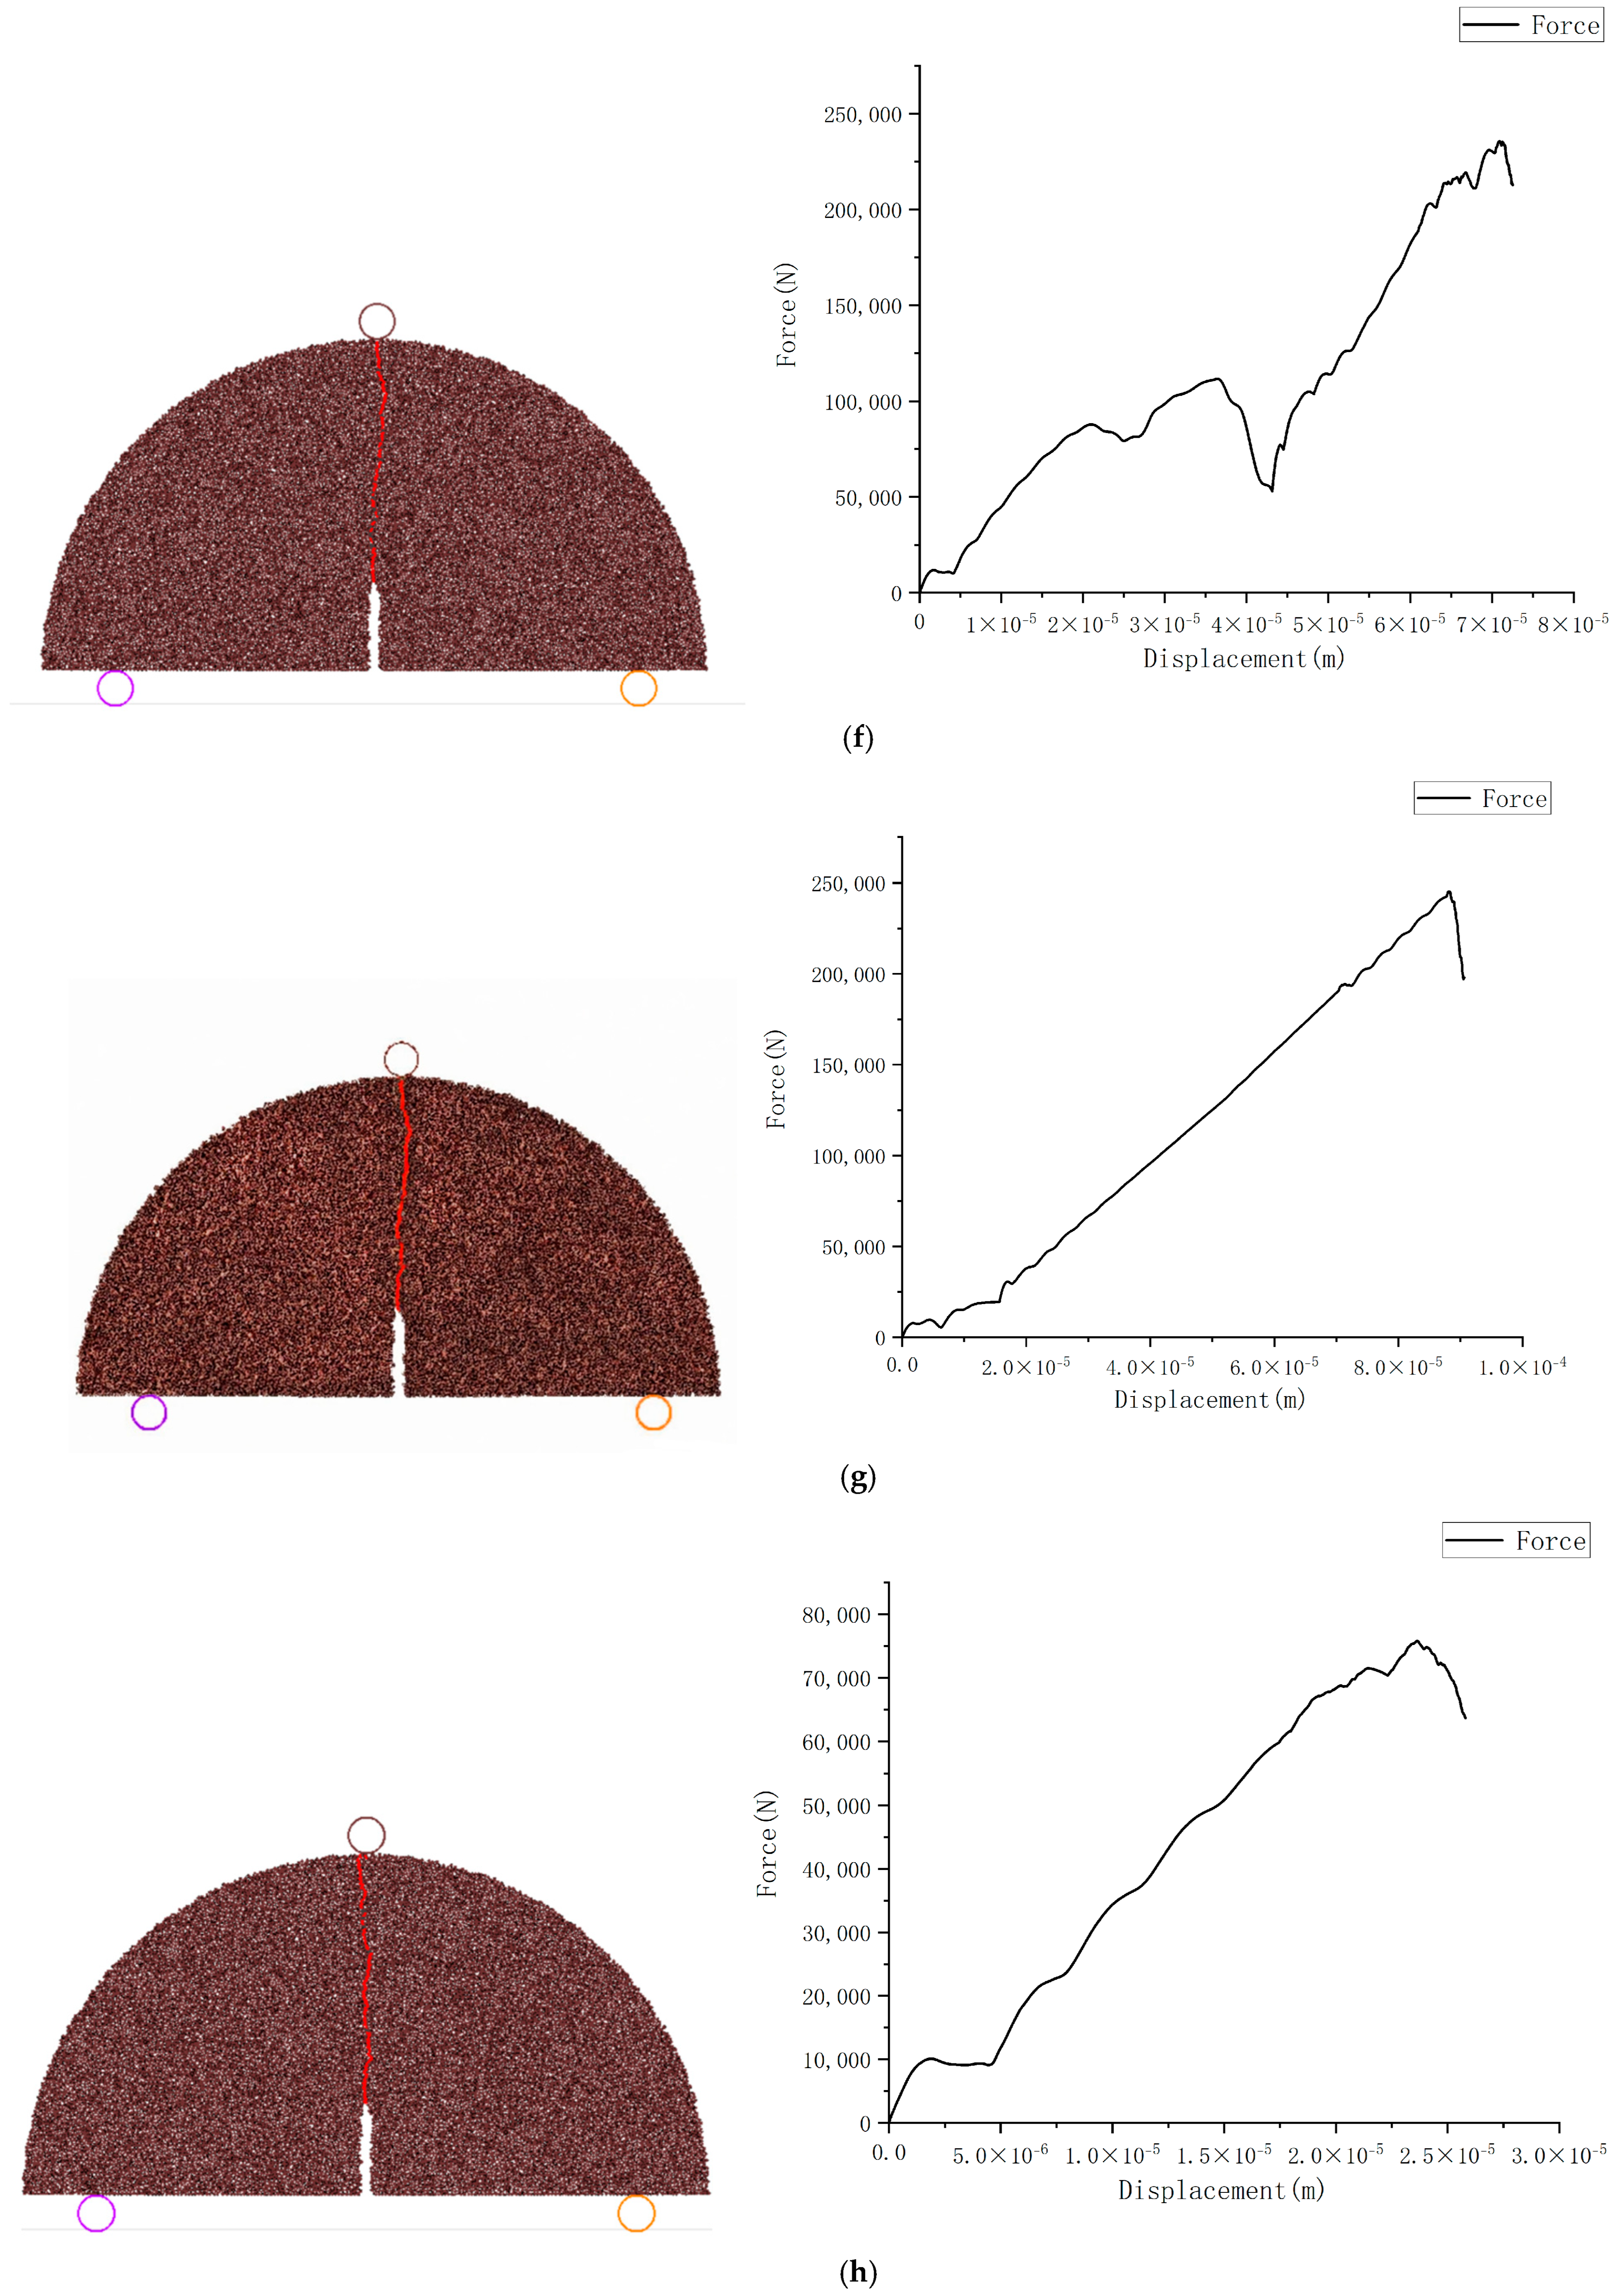
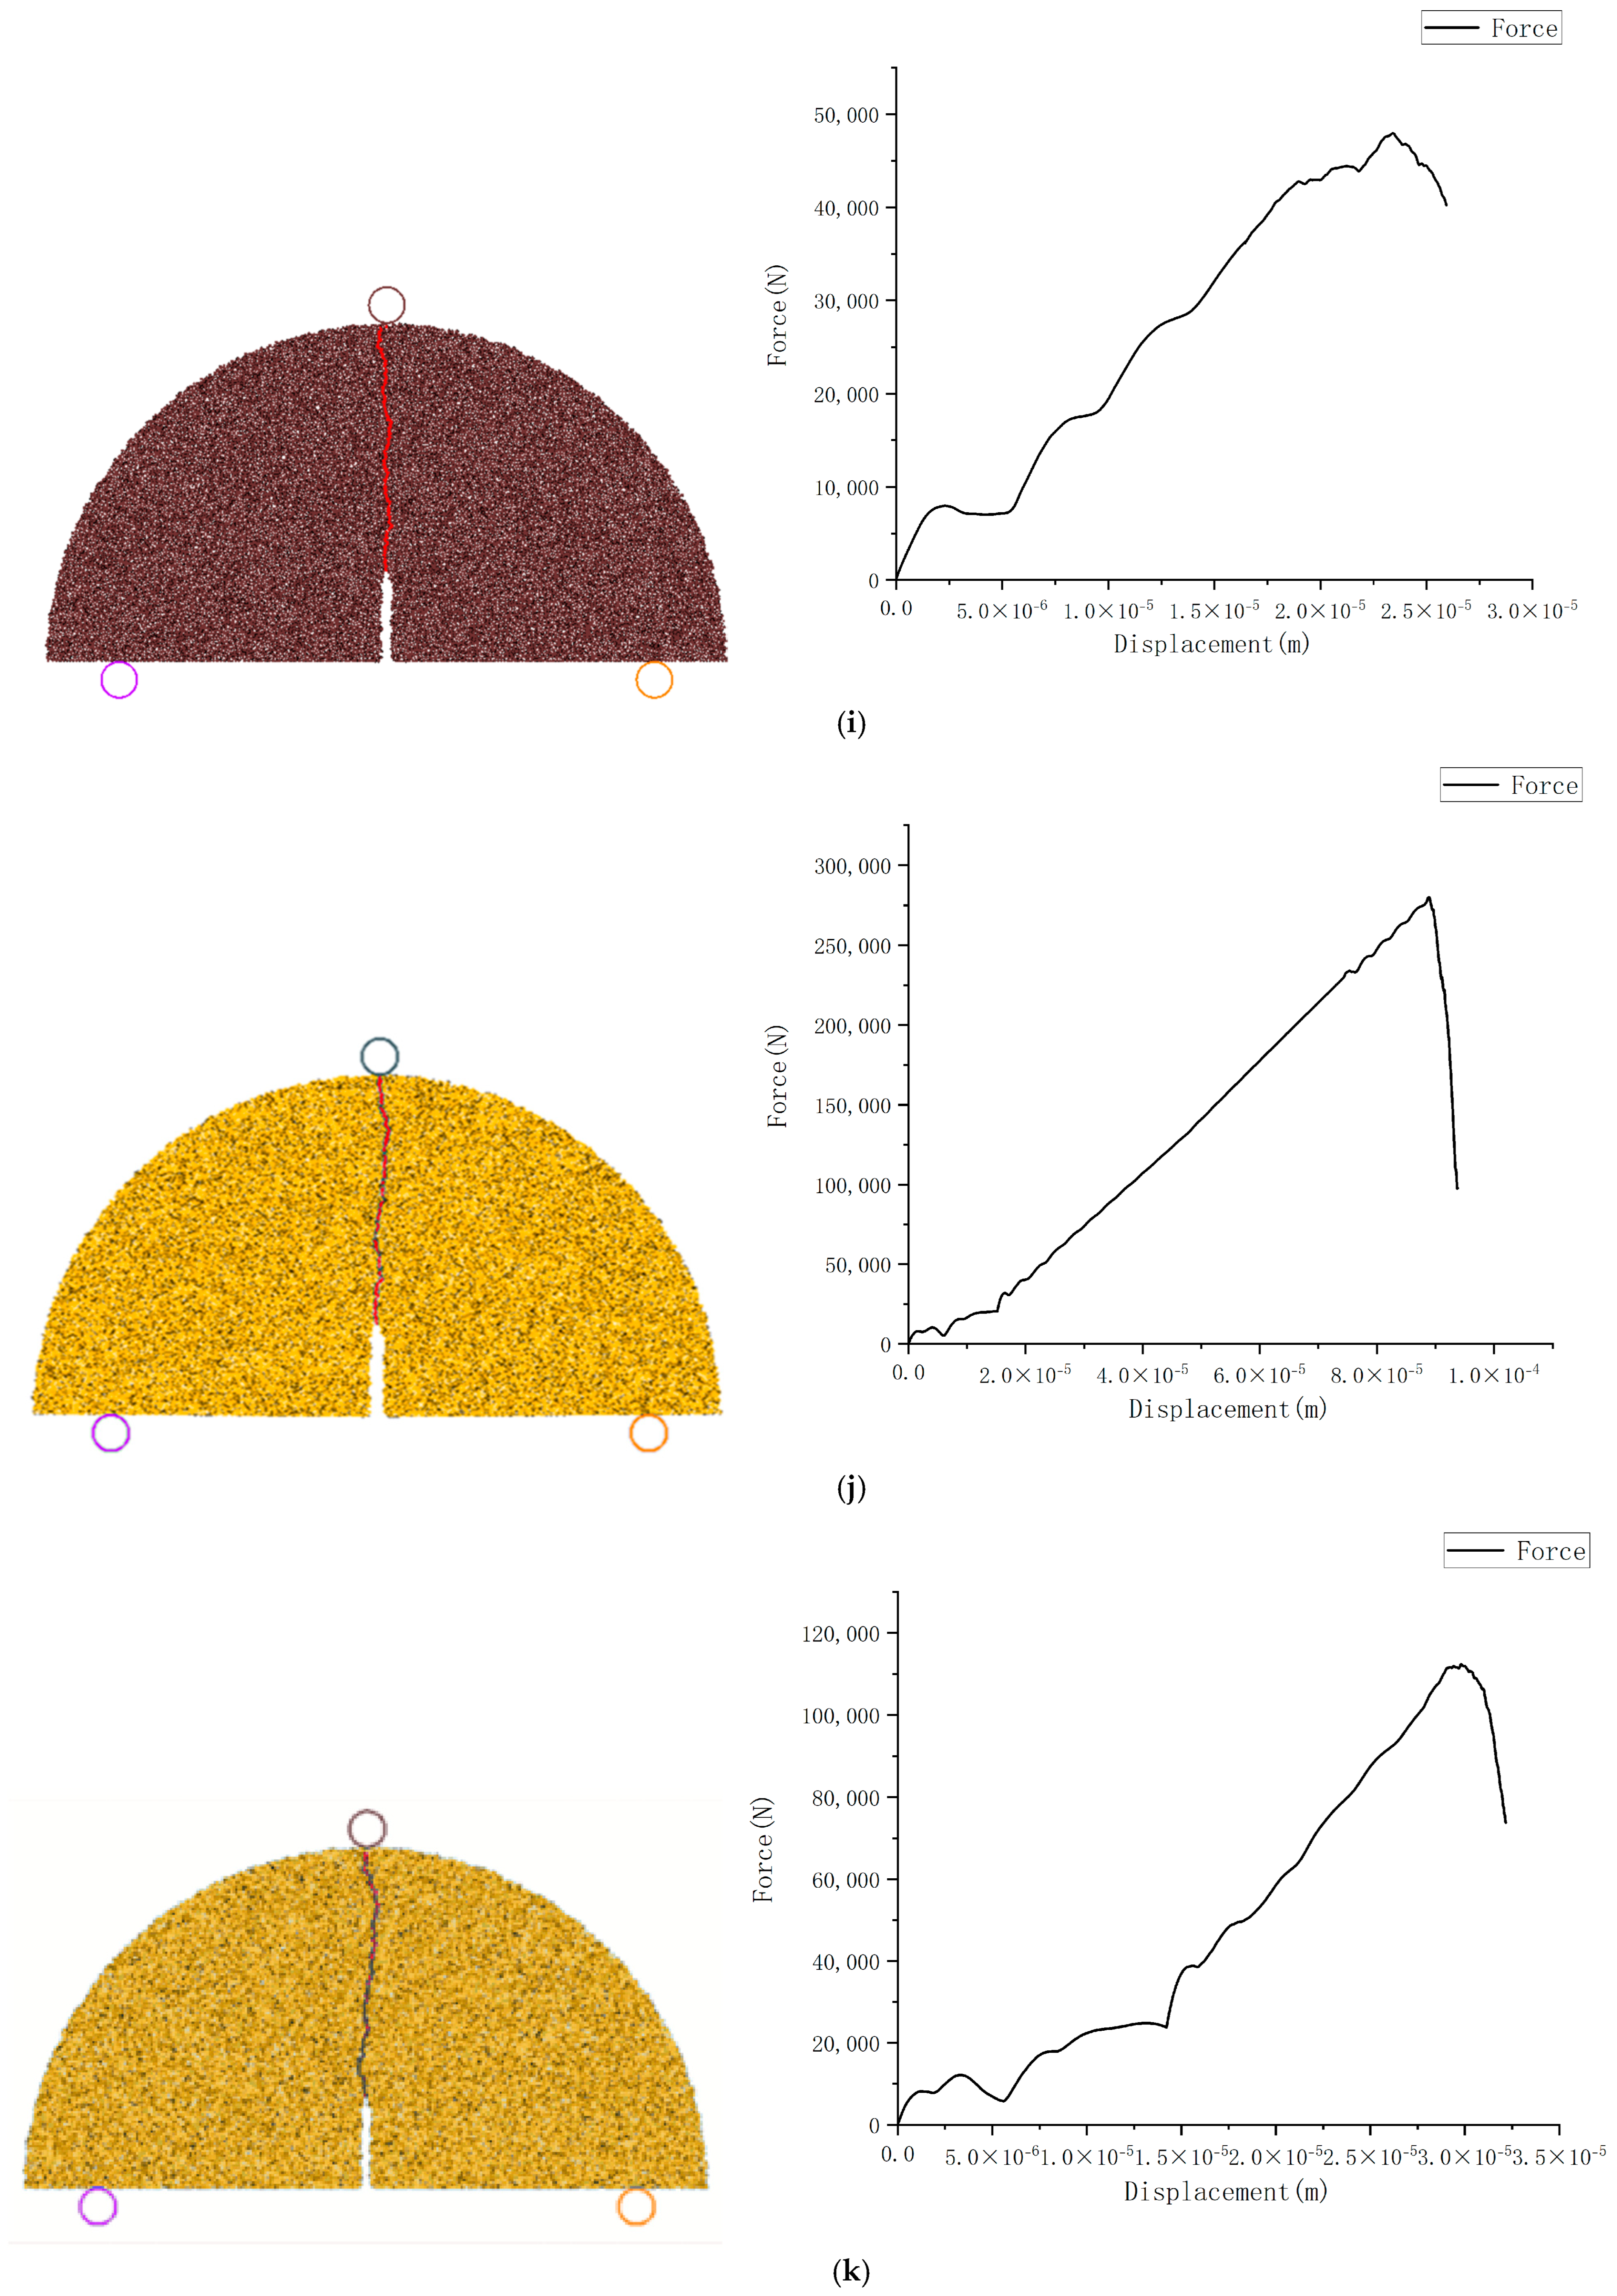
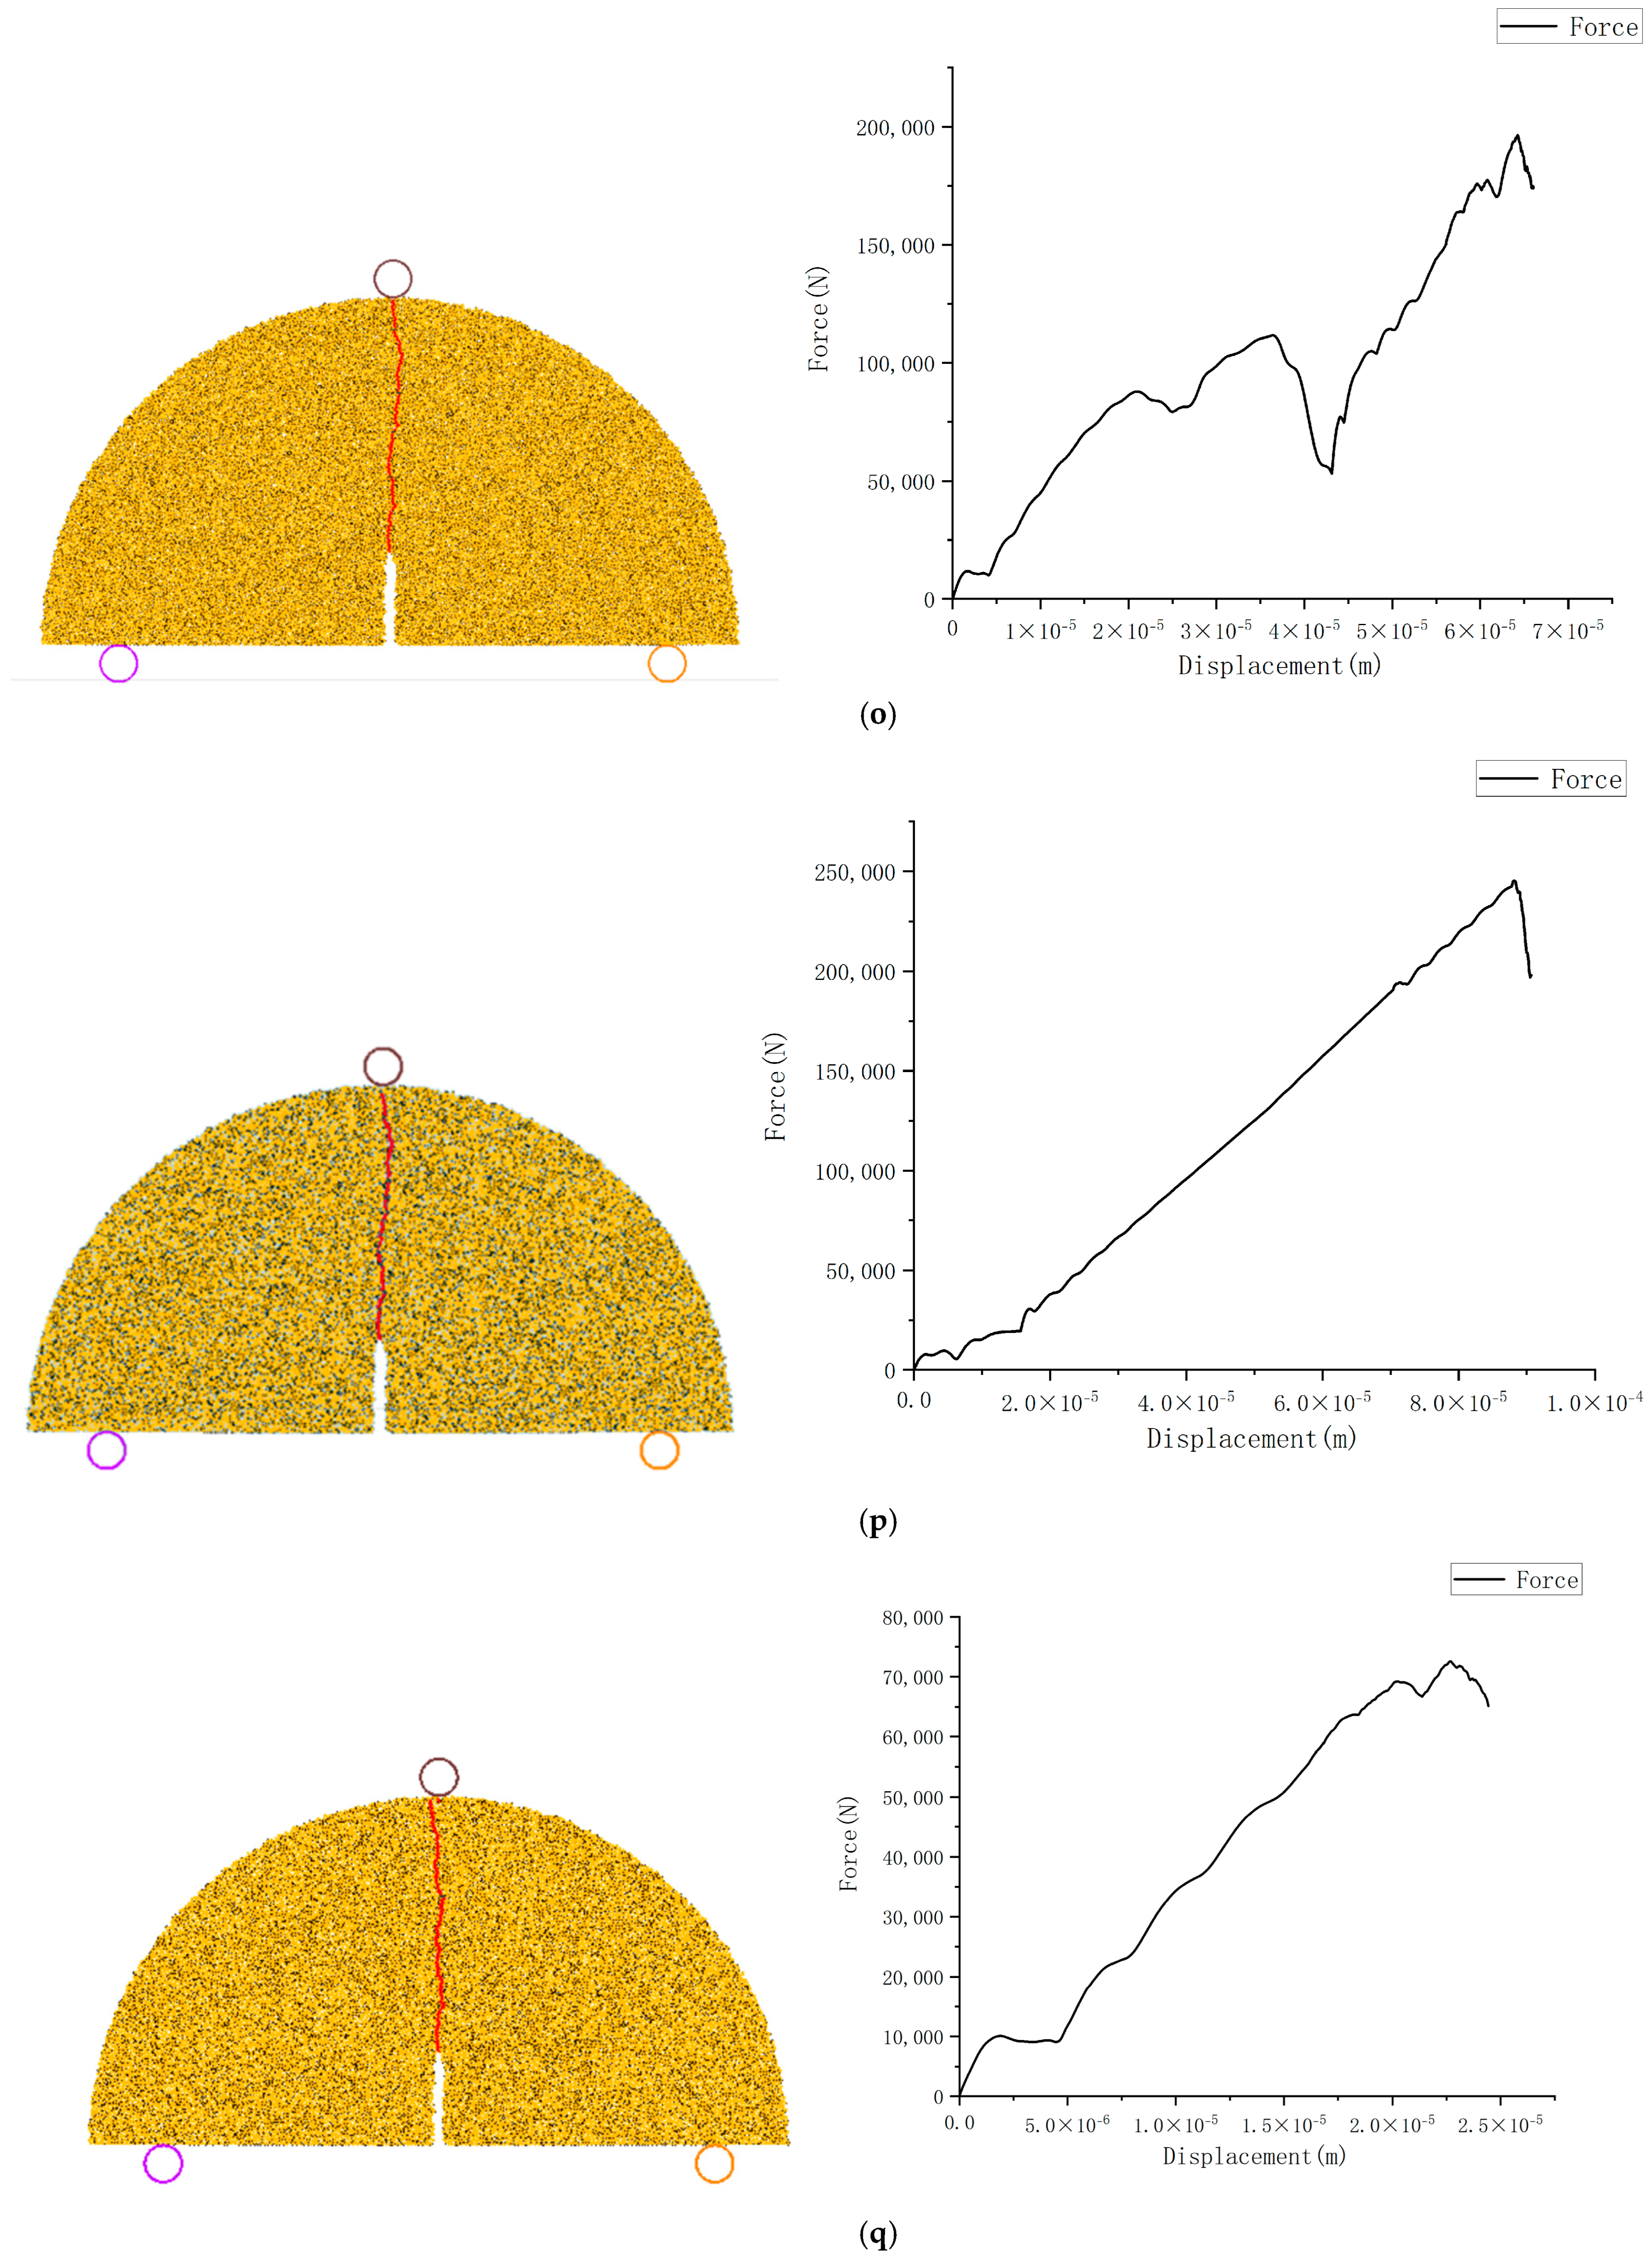
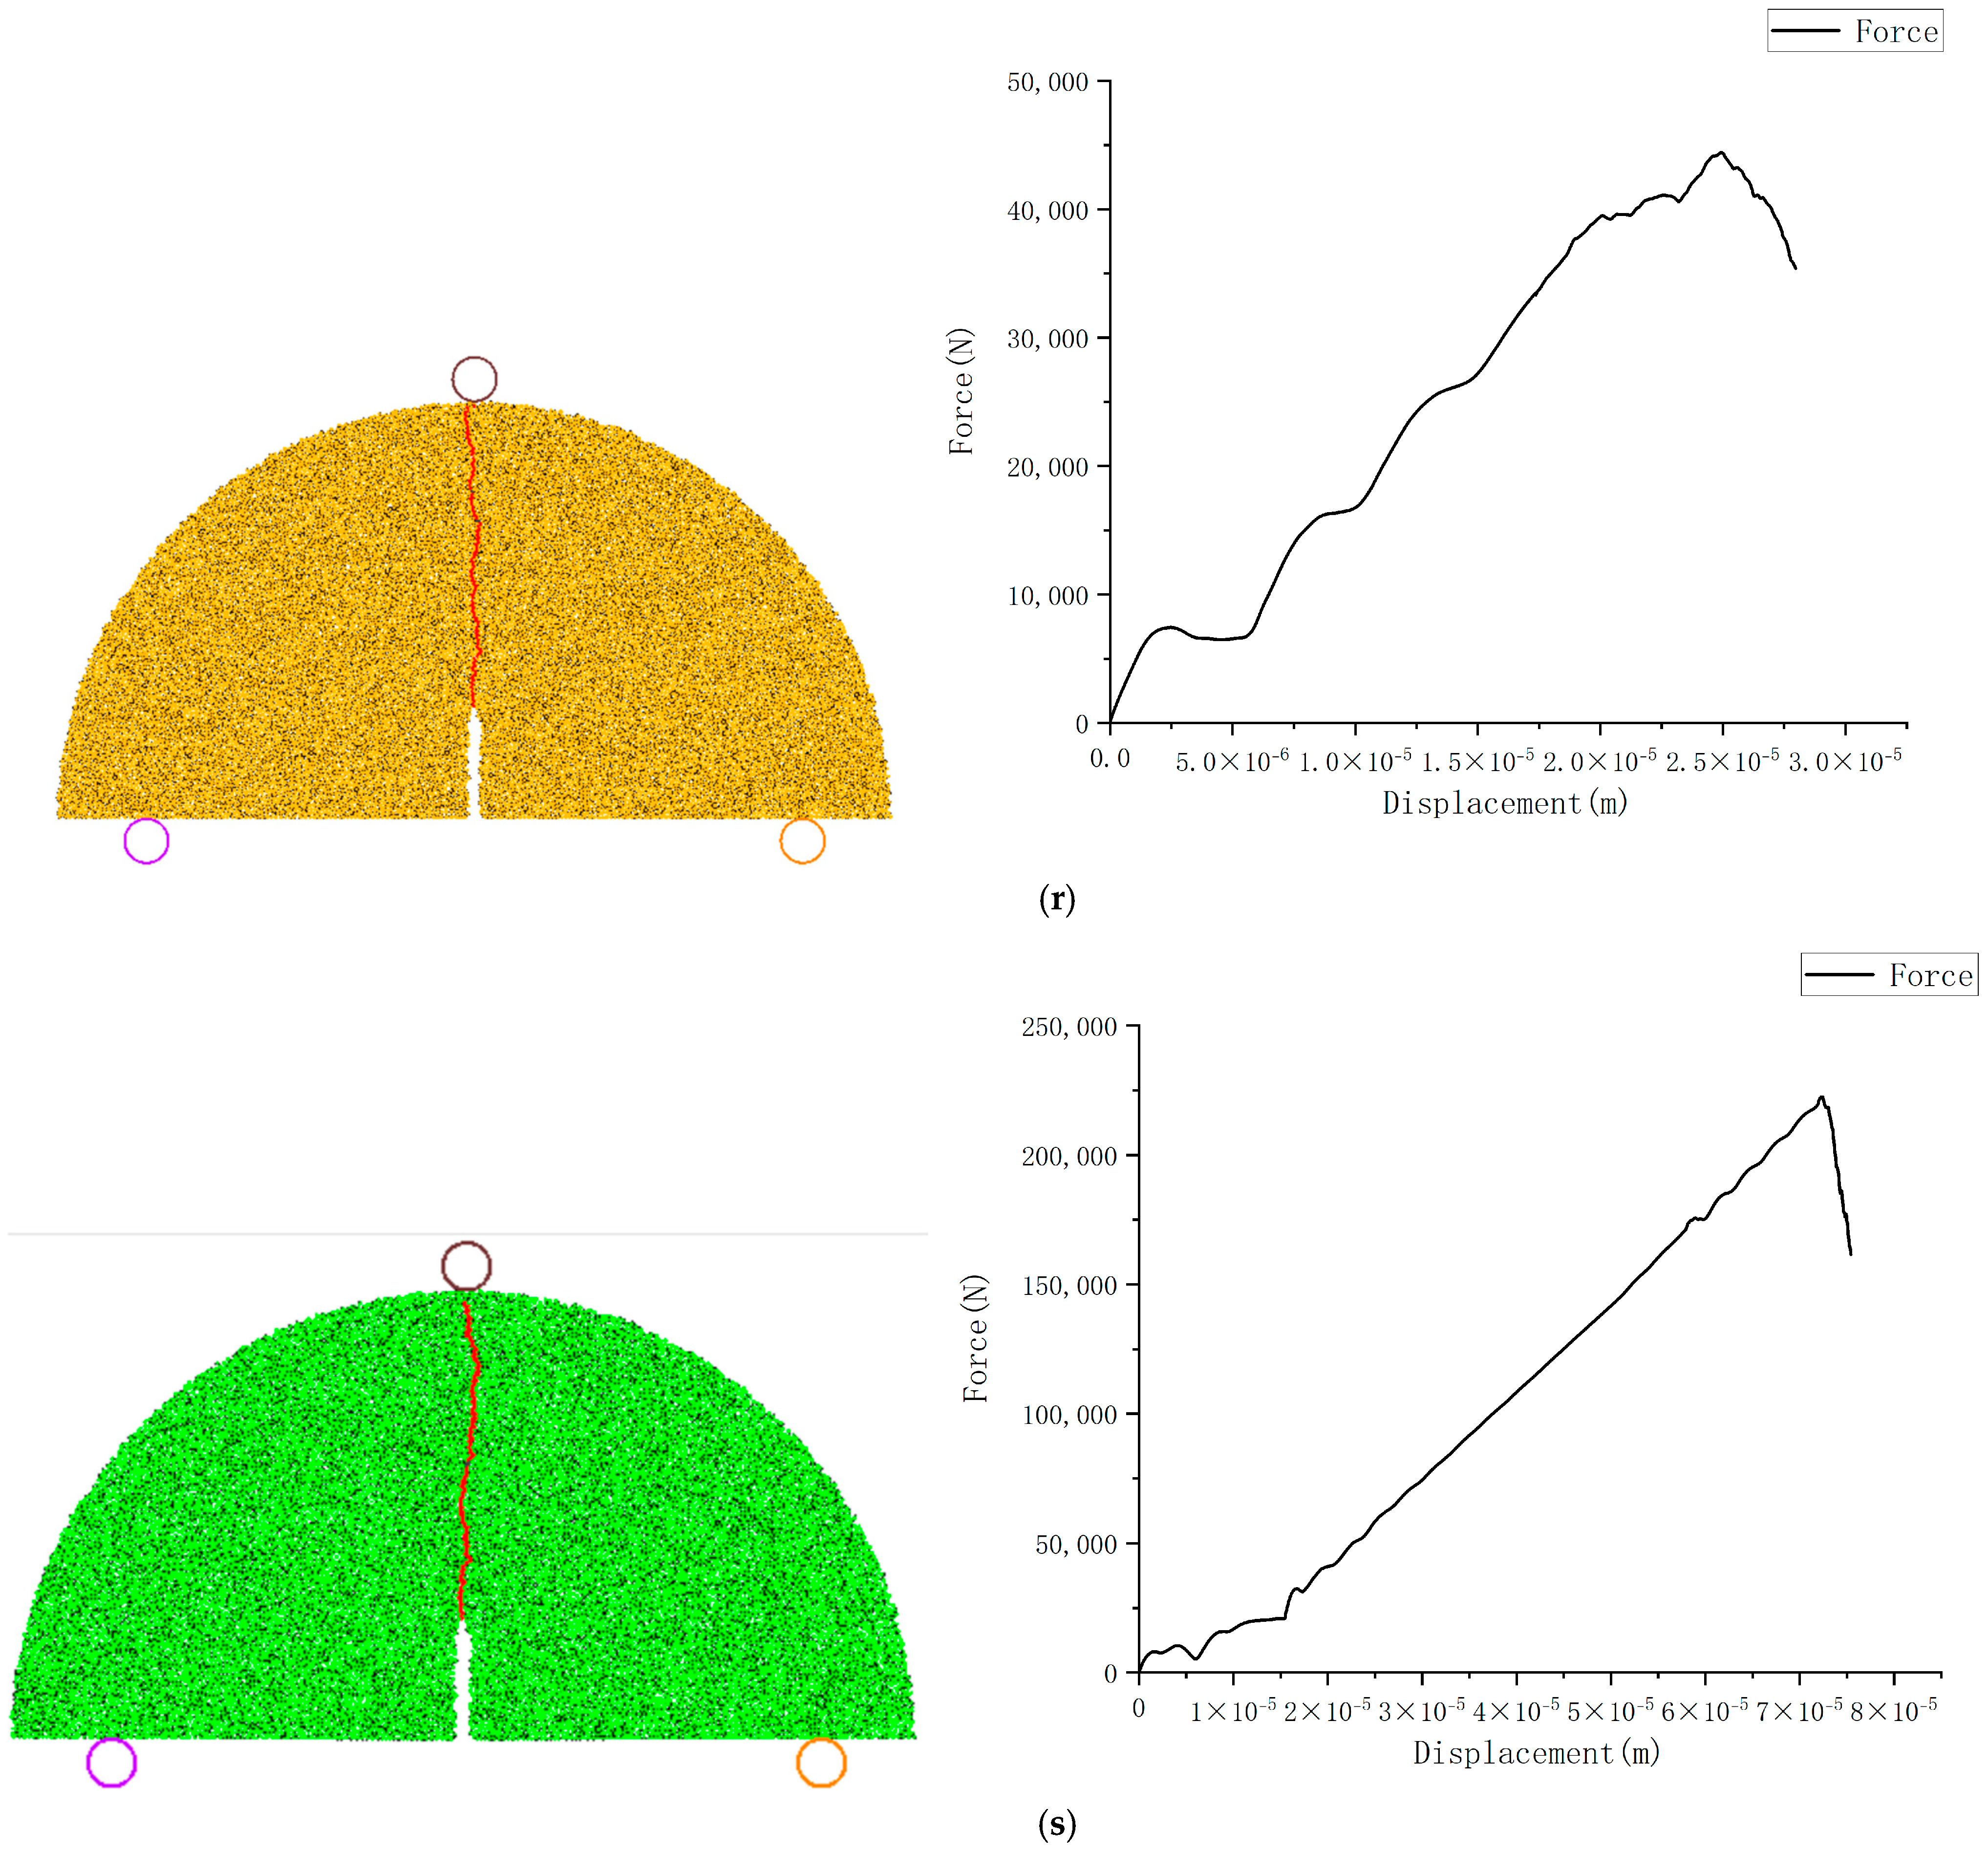
In the model, the gold particles refer to “Felsic-bearing mixed lamina”, coffee particles refer to “Carbonate-bearing mixed lamina”,and green particles refer to “Clay-bearing mixed lamina”.After setting the rock microscopic parameters of the model to the microscopic parameters of each lamina obtained from biaxial compression simulation, a constant downward speed (0.02 m/s) was applied to the uppermost circle, causing it to compress downward until the specimen fractured. After fracture, the peak load was recorded. The simulation results are shown in Figure 12.
Since the width of models established by PFC2D simulation defaults to 1 m, the loads obtained from simulation are generally high.
The ISRM-recommended Mode I fracture toughness calculation formula is as follows:
K I C = P m a x π a 2 R B Y
where P m a x is the peak load, and B is the specimen width, taken as 1 m under 2D conditions; the Y value is determined by Formulas (7) and (8).
Y = 1.297 + 9.516 s 2 R 0.47 + 16.457 s 2 R β + 1.071 + 34.401 s 2 R β 2
β = a R
Substituting the loads obtained from simulation into the formula, the final Mode I fracture toughness is obtained as follows (Table 16):
The simulation results show that the fracture toughness of carbonate-bearing mixed shale laminations ranges from 0.479 to 3.614, with an average of 1.973. The fracture toughness of felsic-bearing mixed shale laminations ranges from 0.517 to 3.023, with an average of 1.791. Clay-bearing mixed shale laminations have only one set of data, with a fracture toughness of 2.4016. The fracture toughness distribution is relatively uneven with large variance, but can generally be divided into two intervals: 0.4–1.0 and above 2.0, with only one set of data falling outside these two ranges. On the same rock sample, the fracture toughness of carbonate-bearing mixed shale laminations is greater than that of felsic-bearing mixed laminations.

4. Conclusions

(1)
After XR-ray diffraction, ordinary thin-section observation, and scanning electron microscope observation of some shale samples in Minfeng subsag, the lithology of different laminae can be divided into carbonate-bearing mixed shale and felsic-bearing mixed shale. The observed bedding mainly includes horizontal bedding or wavy bedding. The bedding density is large, most of them are horizontally developed, and some regional beddings have inclined angles. There are many bedding fissures, most of which are horizontally developed along the bedding boundary. If the laminae are inclined, the bedding fissures developed at the boundary will also be inclined. A small number of bedding joints develop inside the lamina, and the length and width of this kind of bedding joint are generally small. Most bedding fractures have organic matter filling, and some bedding fractures have quartz and pyrite filling.
(2)
There are large fluctuations in the data of the four groups of rock samples participating in the rock mechanics experiment. The tensile strength, compressive strength, Young’s modulus, and Poisson’s ratio span are large. Most of the cracks generated by the Brazilian splitting experiment expand along the weak surface of the interlaminar structure, and only one group expands in the lamina, resulting in its tensile strength being much larger than the other three sets of data. Through the triaxial compression experiment to obtain the parameters to calculate the brittleness index, it is found that there are two groups of rock samples with good brittleness, and there are two groups of rock samples with poor brittleness, indicating that the brittleness of shale in Minfeng subsag is obviously different in different locations, and the overall heterogeneity is strong.
(3)
The simulation results show that the average tensile strength of the carbonate-bearing mixed shale lamina is 3.609 MPa; the average compressive strength is 31.41 MPa; and the average Young’s modulus is 19.66 GPa. The average Poisson’s ratio is 0.240. The average tensile strength of felsic-bearing mixed shale laminae is 3.675 MPa, the average compressive strength is 35.28 MPa, the average compressive strength is 35.28 MPa, and the average Young’s modulus is 20.83 GPa; the average Poisson’s ratio is 0.263. The average tensile strength is 0.319 MPa. The rock heterogeneity is strong, the data fluctuates greatly, and the strength of felsic shale is greater than that of carbonate shale. According to the Young’s modulus and Poisson’s ratio data of each lamina, the brittleness index is calculated. It is found that the brittleness index of each lamina of rock samples decreases obviously. It is speculated that the development of bedding joints leads to the increase in brittleness of the whole rock.
(4)
The simulation results show that the fracture toughness of each lamina is uneven and the variance is large. The average fracture toughness of carbonate-bearing mixed shale laminae is 1.973. The average fracture toughness of the felsic-bearing mixed shale lamina is 1.791, the clay mixed shale lamina has only one set of data, and the fracture toughness is 2.4016. However, the fracture toughness of each lamina can be roughly divided into two ranges of 0.4–1.0 and above 2.0, and only one set of data is outside these two ranges. The fracture toughness of carbonate-bearing mixed shale laminae is greater than that of felsic-bearing mixed laminae. Because the slip fracture is not considered in the simulation, the simulation and acquisition of mode II fracture toughness is not carried out. In the subsequent simulation process, it is necessary to carry out simulation experiments on the slip fracture of rock, and construct a central straight crack Brazilian disc with a certain offset angle to simulate the mode II fracture toughness [31].

Author Contributions

Methodology, X.L. and Y.H.; investigation, Y.H.; formal analysis, Y.H.; software, Y.H.; writing—original draft, Y.H.; writing—review and editing, X.L. and Q.Y.; funding acquisition, X.L. All authors have read and agreed to the published version of the manuscript.

Funding

This research was funded by the National Natural Science Foundation of China (52204024), and the Fundamental Research Funds for the Central Universities (No. 2-9-2023-049). And the APC was paid by corresponding authors.

Data Availability Statement

The original contributions presented in this study are included in the article. Further inquiries can be directed to the corresponding authors.

Conflicts of Interest

The authors declare no conflict of interest.

References

  1. Félix, G.; Djimasbe, R.; Varfolomeev, M.A.; Al-Muntaser, A.; Tirado, A.; Suwaid, M.; Prochukhan, K.Y.; Bochkov, A.S.; Frolov, K.N.; Zhdaneev, O.V.; et al. Kinetic modeling of oil shale upgrading at sub- and supercritical water conditions using Ni- and Fe-based oil-soluble catalysts. J. Supercrit. Fluids 2024, 207, 106193. [Google Scholar] [CrossRef] [Scilit]
  2. Zhou, Q.; Jin, Z.; Yang, G.; Dong, N.; Shang, Z. Inspiration from the post-shale revolution era in North America. China Pet. Explor. 2022, 27, 26–39. [Google Scholar]
  3. Zhang, F.; Li, G.; Zheng, X.; Wu, Q.; Li, Z.; Zhang, Q.; Wang, J.; Zhang, L. Ten major driving forces for the vigorous development of unconventional oil and gas in North America and its impact on regional oil and gas supply and demand. Pet. J. 2014, 35, 890–900. [Google Scholar]
  4. Zhao, W.; Hu, S.; Hou, L.; Yang, T.; Li, X.; Guo, B.; Yang, Z. Types and resource potential of continental shale oil in China and its boundary with tight oil. Pet. Explor. Dev. 2020, 47, 2–12. [Google Scholar] [CrossRef] [Scilit]
  5. Jin, Z.; Wang, G.; Liu, G.; Gao, B.; Liu, Q.; Wang, H.; Liang, X.; Wang, R. Research progress and key scientific issues of continental shale oil in China. Pet. J. 2021, 42, 821–835. [Google Scholar]
  6. Sun, L.; Liu, H.; Zhu, R.; Cui, B.; Lei, Z.; Meng, S.; Tang, J. ten issues worthy of attention in China ‘s shale oil revolution. Pet. J. 2023, 44, 2007–2019. [Google Scholar]
  7. Cała, M.; Cyran, K.; Stopkowicz, A.; Kolano, M.; Szczygielski, M. Preliminary Application of X-ray Computed Tomography on Characterization of Polish Gas Shale Mechanical Properties. Rock Mech. Rock Eng. 2016, 49, 4935–4943. [Google Scholar] [CrossRef] [Scilit]
  8. Zhang, H. Rock Mechanics Characteristics and Brittleness Evaluation Technology of Marine High Mature Shale Reservoir. Ph.D. Thesis, Chengdu University of Technology, Chengdu, China, 2019. [Google Scholar]
  9. Cheng, S.; Sheng, M.; Deng, C. Identification of different lithofacies laminations in oil shale and their mechanical properties. Front. Energy Res. 2024, 11, 1321853. [Google Scholar] [CrossRef] [Scilit]
  10. Shi, X.; Jiang, S.; Lu, S.; He, Z.; Li, D.; Wang, Z.; Xiao, D. Investigation of mechanical properties of bedded shale by nanoindentation tests: A case study on Lower Silurian Longmaxi Formation of Youyang area in southeast Chongqing, China. Pet. Explor. Dev. 2019, 46, 155–164. [Google Scholar] [CrossRef] [Scilit]
  11. Shi, Y.; Gou, Y.; Liu, X.; Geng, Z.; Xiong, J.; Zhang, J.; Luo, J. Logging prediction method of rock mechanical parameters for complex lithology shale reservoirs in continental shale oil—A case study of the Lucaogou Formation in Jimsar Sag, Junggar Basin. Nat. Gas Geosci. 2025, 36, 2179–2192. [Google Scholar]
  12. Wang, Y.; Cao, Y.; Ma, B.; Liu, H.; Gao, Y.; Chen, L. Mechanism of diagenetic trap formation in nearshore subaqueous fans on steep rift lacustrine basin slopes—A case study from the Shahejie Formation on the north slope of the Minfeng Subsag, Bohai Basin, China. Pet. Sci. 2014, 11, 481–494. [Google Scholar] [CrossRef] [Scilit]
  13. Yang, C. Study on Sedimentary Characteristics and Genesis of Multi-Grade Reservoirs in the Upper Submember of the Fourth Member of Shahejie Formation, Paleogene, Minfeng Sag. Master’s Thesis, China University of Geosciences (Beijing), Beijing, China, 2023. [Google Scholar] [CrossRef]
  14. Fang, Z.; Liu, H.; Tian, W.; Zhang, P.; Zhang, L.; Guo, W.; Hao, P. Lithofacies Characteristics and Distribution Patterns of Shale in Steep Slope Deep Depression Areas of Continental Rift Basins. J. China Univ. Pet. (Ed. Nat. Sci.) 2025, 49, 57–70. [Google Scholar]
  15. Bieniawski, Z.T.; Hawkes, I. Suggested Methods for Determining Tensile Strength of Rock Materials. Int. J. Rock Mech. Min. Sci. 1978, 15, 99–103. [Google Scholar] [CrossRef] [Scilit]
  16. NB/T 10248-2019; Determination and Evaluation Method of Shale Brittleness Index. National Energy Administration: Beijing, China, 2019.
  17. Cundall, P.A.; Strack, O.D.L. A discrete numerical model for granular assemblies. Géotechnique 1979, 29, 47–65. [Google Scholar] [CrossRef] [Scilit]
  18. Tang, H.; Song, G.; Zhou, F.; Yang, J. Experimental study on macro and meso parameters of limestone materials based on particle flow model-taking Zengziyan unstable rock in Nanchuan District of Chongqing as an example. J. Chongqing Norm. Univ. (Nat. Sci. Ed.) 2024, 41, 50–60. [Google Scholar]
  19. Jiang, Y.; Zou, W. Study on the correlation between macro and micro parameters of hollow cylindrical gray sandstone based on PFC3D. Coal Sci. Technol. 2024, 52, 78–89. [Google Scholar]
  20. Wang, X. PFC Simulation of Jointed Rock Indoor Test and Failure Law Analysis. Master’s Thesis, Kunming University of Science and Technology, Kunming, China, 2023. [Google Scholar]
  21. Liu, X.; Zeng, N.; Zhang, L.; Hou, Z.; Pan, Y.; Hao, Z.; Li, T. Improved PFC fluid-solid coupling model and its simulation of reservoir shale seepage failure. Appl. J. Fundam. Eng. Sci. 2023, 31, 467–482. [Google Scholar]
  22. He, B.; Liu, J.; Zhao, P.; Wang, J. PFC2D-based investigation on the mechanical behavior of anisotropic shale under Brazilian splitting containing two parallel cracks. Front. Earth Sci. 2021, 15, 803–816. [Google Scholar] [CrossRef] [Scilit]
  23. Tang, W.; Zhai, C.; Yu, X.; Xu, J.; Sun, Y.; Cong, Y.; Zheng, Y.; Wang, Y. Dynamic Brazilian splitting experiment of bedding shale based on continuum-discrete coupled method. Int. J. Impact Eng. 2022, 168, 104289. [Google Scholar] [CrossRef] [Scilit]
  24. Lan, S. Study on the Physical and Mechanical Properties of Xinjiang Balikun Oil Shale and the Mechanism of Crack Evolution Under Confining Pressure. Master’s Thesis, Jilin University, Changchun, China, 2024. [Google Scholar] [CrossRef]
  25. Duan, K. Micromechanical Modeling of Inherently Anisotropic Rock and Its Application in Borehole Breakout Analyses. Ph.D. Thesis, The University of Hong Kong, Hong Kong, China, 2016. [Google Scholar]
  26. Du, Y.; Li, R.; Xing, Z.; Yang, H.; Xiong, L.; Deng, H.; Ma, S.; He, J.; Li, K.; Su, H. Brittleness evaluation based on micro-macro rock mechanics and fractal dimension and its application in hydraulic fracturing-taking the shale reservoir of Qiongzhusi formation in southern Sichuan as an example. Geol. China 2026, 1–20. [Google Scholar]
  27. Liu, H.; Li, J.; Liu, X.; Yu, F.; Yan, J.; Wang, Y.; Ren, J.; Feng, H.; Wei, X.; Yang, C. The development characteristics and genetic mechanism of shale fractures in the upper Es4-lower Es3 of Dongying Sag, Bohai Bay Basin. Oil Nat. Gas Geol. 2025, 46, 1960–1979. [Google Scholar]
  28. Zhao, Z.; Liu, D.; Cui, Z.; Tang, T.; Han, W. Experimental study on the determination of fracture toughness (KIC) of shale by semi-disk three-point bending method. Geomechanics 2018, 39, 258–266. [Google Scholar]
  29. Wei, M.; Dai, F.; Xu, N.; Zhao, T.; Liu, Y. Experimental and numerical study on the cracked chevron notched semi-circular bend method for characterizing the mode I fracture toughness of rocks. Rock Mech. Rock Eng. 2016, 49, 1595–1609. [Google Scholar] [CrossRef] [Scilit]
  30. Dai, F.; Wei, M.-D.; Xu, N.-W.; Xu, Y.; Zhao, T. Rock fracture toughness CCNSCB method for progressive failure mechanism and dimensionless stress intensity factor calibration in a wide range. Geotech. Mech. 2016, 37, 3215–3223. [Google Scholar]
  31. Zhang, C.; Li, D.; Yang, B. Progress in Mode II Fracture Theory and Test Technology of Rock Materials. Eng. Mech. 2025, 42, 19–36. [Google Scholar] [CrossRef] [Scilit]
Figure 1. Ordinary thin sections of shale in Minfeng subsag. (a) Y-Fla-01; (b) Y-Fla-02.
Processes 14 00476 g001
Figure 2. SEM images of shale in Minfeng subsag. (a) Y-SEM-01; (b) Y-SEM-02.
Processes 14 00476 g002
Figure 3. TAW-100 microcomputer-controlled natural gas hydrate low-temperature triaxial testing machine.
Processes 14 00476 g003
Figure 4. Fracture morphology of core samples in Brazilian splitting test. (a) Y-Ten-01 01; (b) Y-Ten-02; (c) Y-Ten-03; (d) Y-Ten-04.
Processes 14 00476 g004
Figure 5. TAW-1000 hydraulic servo testing system.
Processes 14 00476 g005
Figure 6. Fracture morphology of triaxial compression test. (a) Y-Tri-01; (b) Y-Tri-02; (c) Y-Tri-03; (d) Y-Tri-04.
Processes 14 00476 g006
Figure 7. Stress–strain curves. (a) Y-Tri-01; (b) Y-Tri-02; (c) Y-Tri-03; (d) Y-Tri-04.
Processes 14 00476 g007
Figure 8. Brazilian splitting simulation curves and fracture morphology. (a) Y-Ten-01; (b) Y-Ten-02; (c) Y-Ten-03; (d) Y-Ten-04.
Processes 14 00476 g008aProcesses 14 00476 g008b
Figure 9. Biaxial compression stress–strain curves and fracture morphology. (a) Y-Tri-01; (b) Y-Tri-02; (c) Y-Tri-03; (d) Y-Tri-04.
Processes 14 00476 g009aProcesses 14 00476 g009b
Figure 10. Schematic diagram of central straight-through slot semi-disc.
Processes 14 00476 g010
Figure 11. Central straight-through slot semi-disc model.
Processes 14 00476 g011
Figure 12. Fracture toughness models and curves of various laminations. (a) Y-KI-01 carbonate-bearing mixed shale; (b) Y-KI-02 carbonate-bearing mixed shale; (c) Y-KI-03 carbonate-bearing mixed shale; (d) Y-KI-04 carbonate-bearing mixed shale; (e) Y-KI-05 carbonate-bearing mixed shale; (f) Y-tri-01 carbonate-bearing mixed shale; (g) Y-tri-02 carbonate-bearing mixed shale; (h) Y-tri-03 carbonate-bearing mixed shale; (i) Y-tri-04 carbonate-bearing mixed shale; (j) Y-KI-01 felsic-bearing mixed shale; (k) Y-KI-02 felsic-bearing mixed shale; (l) Y-KI-03 felsic-bearing mixed shale; (m) Y-KI-04 felsic-bearing mixed shale; (n) Y-KI-05 felsic-bearing mixed shale; (o) Y-Tri-01 felsic-bearing mixed shale; (p) Y-Tri-02 felsic-bearing mixed shale; (q) Y-Tri-03 felsic-bearing mixed shale; (r) Y-Tri-04 felsic-bearing mixed shale; (s) Y-KI-05 clay-bearing mixed shale.
Processes 14 00476 g012aProcesses 14 00476 g012bProcesses 14 00476 g012cProcesses 14 00476 g012dProcesses 14 00476 g012eProcesses 14 00476 g012fProcesses 14 00476 g012g
Table 1. Mineral composition content of shale laminations in Minfeng subsag.
LithologyQuartz ContentDolomite ContentCalcite ContentIllite ContentPyrite ContentPlagioclase ContentSiderite Content
Carbonate-bearing Mixed Shale Lamina27%21%19%22%2%8%1%
Felsic-bearing Mixed Shale Lamina29%21%11%29%1%8%1%
Table 2. Results of Brazilian splitting test.
Core NumberDiameter D/mmLength L/mmFailure Load P/NTensile Strength σt/MPa
Y-Ten-012512.513692.79
Y-Ten-022512.519844.03
Y-Ten-032512.56681.33
Y-Ten-042512.57331.49
Table 3. Size and density of core samples for triaxial test.
Core NumberDiameter/mmHeight/mmMass/gDensity g/cm3
Y-Tri-0124.8249.0260.872.57
Y-Tri-0224.8148.5956.392.40
Y-Tri-0324.9142.1349.132.39
Y-Tri-0424.8449.1559.382.49
Table 4. Results of triaxial compression test.
Core NumberConfining Pressure
/MPa
Compressive Strength
/MPa
Young’s Modulus/GPaPoisson’s RatioAngle/°
Y-Tri-0113.273.9223.400.17333.29
Y-Tri-0213.255.7814.860.21632.03
Y-Tri-0313.269.9121.070.15920.04
Y-Tri-0413.238.658.360.19228.19
Table 5. Rock brittleness index(physical test).
Core NumberBrittleness Index
Y-Tri-0187.719
Y-Tri-0221.609
Y-Tri-0392.254
Y-Tri-0421.053
Table 6. Classification table of brittleness index of shale rock mechanics.
Brittleness Index of Shale Rock MechanicsEvaluation Level
B Y B 65 Excellent
55 B Y B < 65 Good
30 B Y B < 55 medium
B Y B < 30 Poor
Table 7. Brazilian splitting lamination model parameters.
Core NumberLithologyemod = pb_emod/GPakrat = pb_kratpb_ten/MPapb_coh/MPapb_fa/°
Y-Ten-01Carbonate-bearing Mixed Shale2.0319.40719.5333.58
Y-Ten-01Felsic-bearing Mixed Shale2.42.820.06620.87633.58
Y-Ten-02Carbonate-bearing Mixed Shale1.02.519.0819.2543.81
Y-Ten-02Felsic-bearing Mixed Shale1.02.513.8314.8833.58
Y-Ten-03Carbonate-bearing Mixed Shale1.82.815.2911.2713.58
Y-Ten-04Carbonate-bearing Mixed Shale1.2310.34210.01133.58
Y-Ten-04Felsic-bearing Mixed Shale1.82.510.85210.37333.58
Table 8. Brazilian splitting structural weak plane model parameters.
Core Numbersj_kn/GPasj_ks/GPafricsj_ten
/MPa
sj_coh
/MPa
sj_fa
dip/°
Y-Ten-01783.55600.51.111–1.8151.128–1.8104.971.52/90
Y-Ten-02///////
Y-Ten-031563.515600.53.330–4.1303.332–4.1304.990
Y-Ten-04156015600.5772.792–3.7923.064–4.0644.990
Table 9. Brazilian splitting simulation results.
Core NumberTensile Strength/MPaError
Carbonate FelsicStructural Weak PlanesSimulated CoreActual Core
Y-Ten-014.9994.9070.139–0.2991.1821.1971.25%
Y-Ten-024.5414.075/4.0424.0300.30%
Y-Ten-032.514/0.4221.3631.3791.16%
Y-Ten-042.3812.0430.4141.4831.4930.67%
Table 10. Biaxial compression lamination model parameters.
Core NumberLithologyemod = pb_emod/GPakrat = pb_kratpb_ten/MPapb_coh/MPapb_fa/°
Y-Tri-01Carbonate-bearing Mixed Shale21.22.83025.7243.81
Y- Tri-01Felsic-bearing Mixed Shale21.22.03829.7233.53
Y- Tri-02Carbonate-bearing Mixed Shale10.22.04035.7243.81
Y- Tri-02Felsic-bearing Mixed Shale15.22.04839.7233.53
Y- Tri-03Carbonate-bearing Mixed Shale12.22.010.509.7243.81
Y- Tri-03Felsic-bearing Mixed Shale12.22.011.0010.2233.53
Y- Tri-04Carbonate-bearing Mixed Shale5.22.06.006.2233.58
Y- Tri-04Felsic-bearing Mixed Shale16.22.06.506.7233.58
Table 11. Biaxial compression structural weak plane model parameters.
Core Numbersj_kn/GPasj_ks/GPafricsj_ten/MPasj_coh/MPasj_fa/°dip/°
Y-Tri-01110020000.57723.3–33.118.9–28.14.9135
Y- Tri -02100010000.57730–3525–304.938.2
Y- Tri -03130020000.57711.811.64.9-45
Y- Tri -04100020000.57711.811.94.9110
Table 12. Biaxial compression simulation results.
Core NumberLithologyPoisson RatioYoung’s Modulus/GPaCompressive Strength/MPa
Y-Tri-01Felsic-bearing Mixed Shale0.27335.5765.71
Y-Tri-02Felsic-bearing Mixed Shale0.24418.1438.14
Y-Tri-03Felsic-bearing Mixed Shale0.26719.8122.62
Y-Tri-04Felsic-bearing Mixed Shale0.2679.8114.64
Y-Tri-01Carbonate-bearing Mixed Shale0.22434.7055.89
Y-Tri-02Carbonate-bearing Mixed Shale0.19815.3733.76
Y-Tri-03Carbonate-bearing Mixed Shale0.26819.6322.35
Y-Tri-04Carbonate-bearing Mixed Shale0.2718.9213.62
Table 13. Rock brittleness index(numerical simulation).
Core NumberLithologyBrittleness Index
Y-Tri-01Felsic-bearing Mixed Shale50.000
Y-Tri-02Felsic-bearing Mixed Shale36.632
Y-Tri-03Felsic-bearing Mixed Shale24.432
Y-Tri-04Felsic-bearing Mixed Shale5.670
Y-Tri-01Carbonate-bearing Mixed Shale81.034
Y-Tri-02Carbonate-bearing Mixed Shale62.099
Y-Tri-03Carbonate-bearing Mixed Shale23.427
Y-Tri-04Carbonate-bearing Mixed Shale1.333
Table 14. Dimensions of central straight-through slot semi-disc.
Model ParameterDesign Value/mmRecommended ISRM Values
Diameter (D = 2R)76Take a large value (10 times the particle diameter or 76 mm)
Centre Crack Length (a)100.20 ≤ a/R
Centre Crack width (b)1000\
Span (S)600.5 ≤ S/2R ≤ 0.8
Table 15. Microscopic parameters of core sample models in target block.
Core NumberLithologyemod = pb_emod/GPakrat = pb_kratpb_ten/MPapb_coh/MPapb_fa/°
Y-KI-01Carbonate-bearing Mixed Shale15.01.045.0043.233.53
Y-KI-01Felsic-bearing Mixed Shale10.211.051.0048.243.81
Y-KI-02Carbonate-bearing Mixed Shale31.21.028.0019.7233.53
Y-KI-02Felsic-bearing Mixed Shale21.21.020.0015.7243.81
Y-KI-03Carbonate-bearing Mixed Shale15.22.038.0034.7233.53
Y-KI-03Felsic-bearing Mixed Shale10.22.032.0028.7243.81
Y-KI-04Carbonate-bearing Mixed Shale25.21.013.0013.7233.58
Y-KI-04Felsic-bearing Mixed Shale20.21.011.0011.7243.81
Y-KI-05Carbonate-bearing Mixed Shale15.22.038.0034.7233.58
Y-KI-05Felsic-bearing Mixed Shale10.22.032.0028.7243.81
Y-KI-05Clay- bearing Mixed Shale12.22.036.0032.7233.58
Table 16. Mode I fracture toughness results of various laminations.
Core NumberLithologyPeak Load
/kN
Fracture Toughness/
(MPa·m0.5)
Y-KI-01Carbonate-bearing Mixed Shale334.84253.6140
Y-KI-02Carbonate-bearing Mixed Shale167.10031.8035
Y-KI-03Carbonate-bearing Mixed Shale250.86682.7076
Y-KI-04Carbonate-bearing Mixed Shale82.32650.8886
Y-KI-05Carbonate-bearing Mixed Shale197.71462.1339
Y-Tri-01Carbonate-bearing Mixed Shale196.40082.1185
Y-Tri-02Carbonate-bearing Mixed Shale298.92613.2263
Y-Tri-03Carbonate-bearing Mixed Shale72.54750.7824
Y-Tri-04Carbonate-bearing Mixed Shale44.41400.4790
Y-KI-01Felsic-bearing Mixed Shale280.07403.0228
Y-KI-02Felsic-bearing Mixed Shale112.37471.2129
Y-KI-03Felsic-bearing Mixed Shale190.19762.0528
Y-KI-04Felsic-bearing Mixed Shale69.35050.7485
Y-KI-05Felsic-bearing Mixed Shale236.56372.5532
Y-Tri-01Felsic-bearing Mixed Shale235.69032.5422
Y-Tri-02Felsic-bearing Mixed Shale245.33302.6479
Y-Tri-03Felsic-bearing Mixed Shale75.77500.8175
Y-Tri-04Felsic-bearing Mixed Shale47.94010.5172
Y-KI-05Clay-bearing Mixed Shale222.51642.4016
Disclaimer/Publisher’s Note: The statements, opinions and data contained in all publications are solely those of the individual author(s) and contributor(s) and not of MDPI and/or the editor(s). MDPI and/or the editor(s) disclaim responsibility for any injury to people or property resulting from any ideas, methods, instructions or products referred to in the content.