1. Introduction
The emergence of Industries 4.0 and 5.0 has revolutionized manufacturing by embedding digital technologies, intelligent automation, and data-driven control into production systems [
1]. Central to this transformation are predictive modeling, machine learning, and soft sensors, which enable real-time monitoring, early fault detection, and proactive quality management [
2]. Soft sensors, also known as virtual (software) sensors, infer hard-to-measure process variables from available data using statistical or machine learning models. They are particularly valuable when physical sensors are impractical, expensive, or too slow to respond. Hybrid soft sensors extend this concept by combining real-time data streams with intermittent manual measurements—such as laboratory analyses or operator logs—allowing periodic recalibration and supervised updates. This approach provides scalable and interpretable solutions in environments where traditional monitoring methods are either too slow, too costly, or insufficiently responsive to process variability [
3].
Ceramic roof tile production, although based on long-established techniques, remains sensitive to fluctuations in raw material properties and process conditions [
4]. The extrusion of moist clay blanks via vacuum-assisted press represents a critical step that directly influences dimensional stability, mechanical integrity, and water-related performance [
5]. Variations in moisture content, particle size distribution, and extrusion dynamics can lead to defects such as excessive shrinkage, poor saturation resistance, or inconsistent absorption—issues often detected only after firing, when corrective measures are no longer feasible [
6]. Because drying and firing are energy-intensive stages [
7], defective output not only reduces product quality but also increases energy consumption and CO
2 emissions, posing both environmental and economic challenges. Smarter process control and early-stage quality prediction are therefore essential for sustainable manufacturing [
7,
8,
9].
Despite the importance of these challenges, the application of soft sensors in ceramics remains limited. Previous studies have primarily focused on laboratory-based analyses of fired products [
10], while industrial datasets and interpretative models for early prediction are scarce. To the best of our knowledge, this study is the first to address soft sensor development for traditional ceramics under real industrial conditions. By integrating physically interpretable inputs with transparent, reproducible modeling, this study proposes a hybrid soft sensor framework tailored to extrusion-based shaping of roof tiles. The framework combines real-time process parameters with clay-specific descriptors to predict critical performance attributes such as shrinkage, water absorption, and saturation. Unlike complex machine learning pipelines, the proposed approach emphasizes lightweight deployment and local adaptability, making it suitable for industrial environments where cloud-based infrastructure or complex IoT frameworks are impractical.
Although the present study focuses on ceramic shaping, the underlying logic—combining physically interpretable inputs with transparent, reproducible modeling—can be extended to other production systems. The simplicity and computational efficiency of the approach make it suitable for integration into soft sensors and local control routines, especially in settings where cloud-based infrastructure or complex IoT frameworks are impractical or unsafe [
11]. This positions the methodology as a practical tool for fast, on-site diagnostics across diverse industrial contexts.
2. Materials and Methods
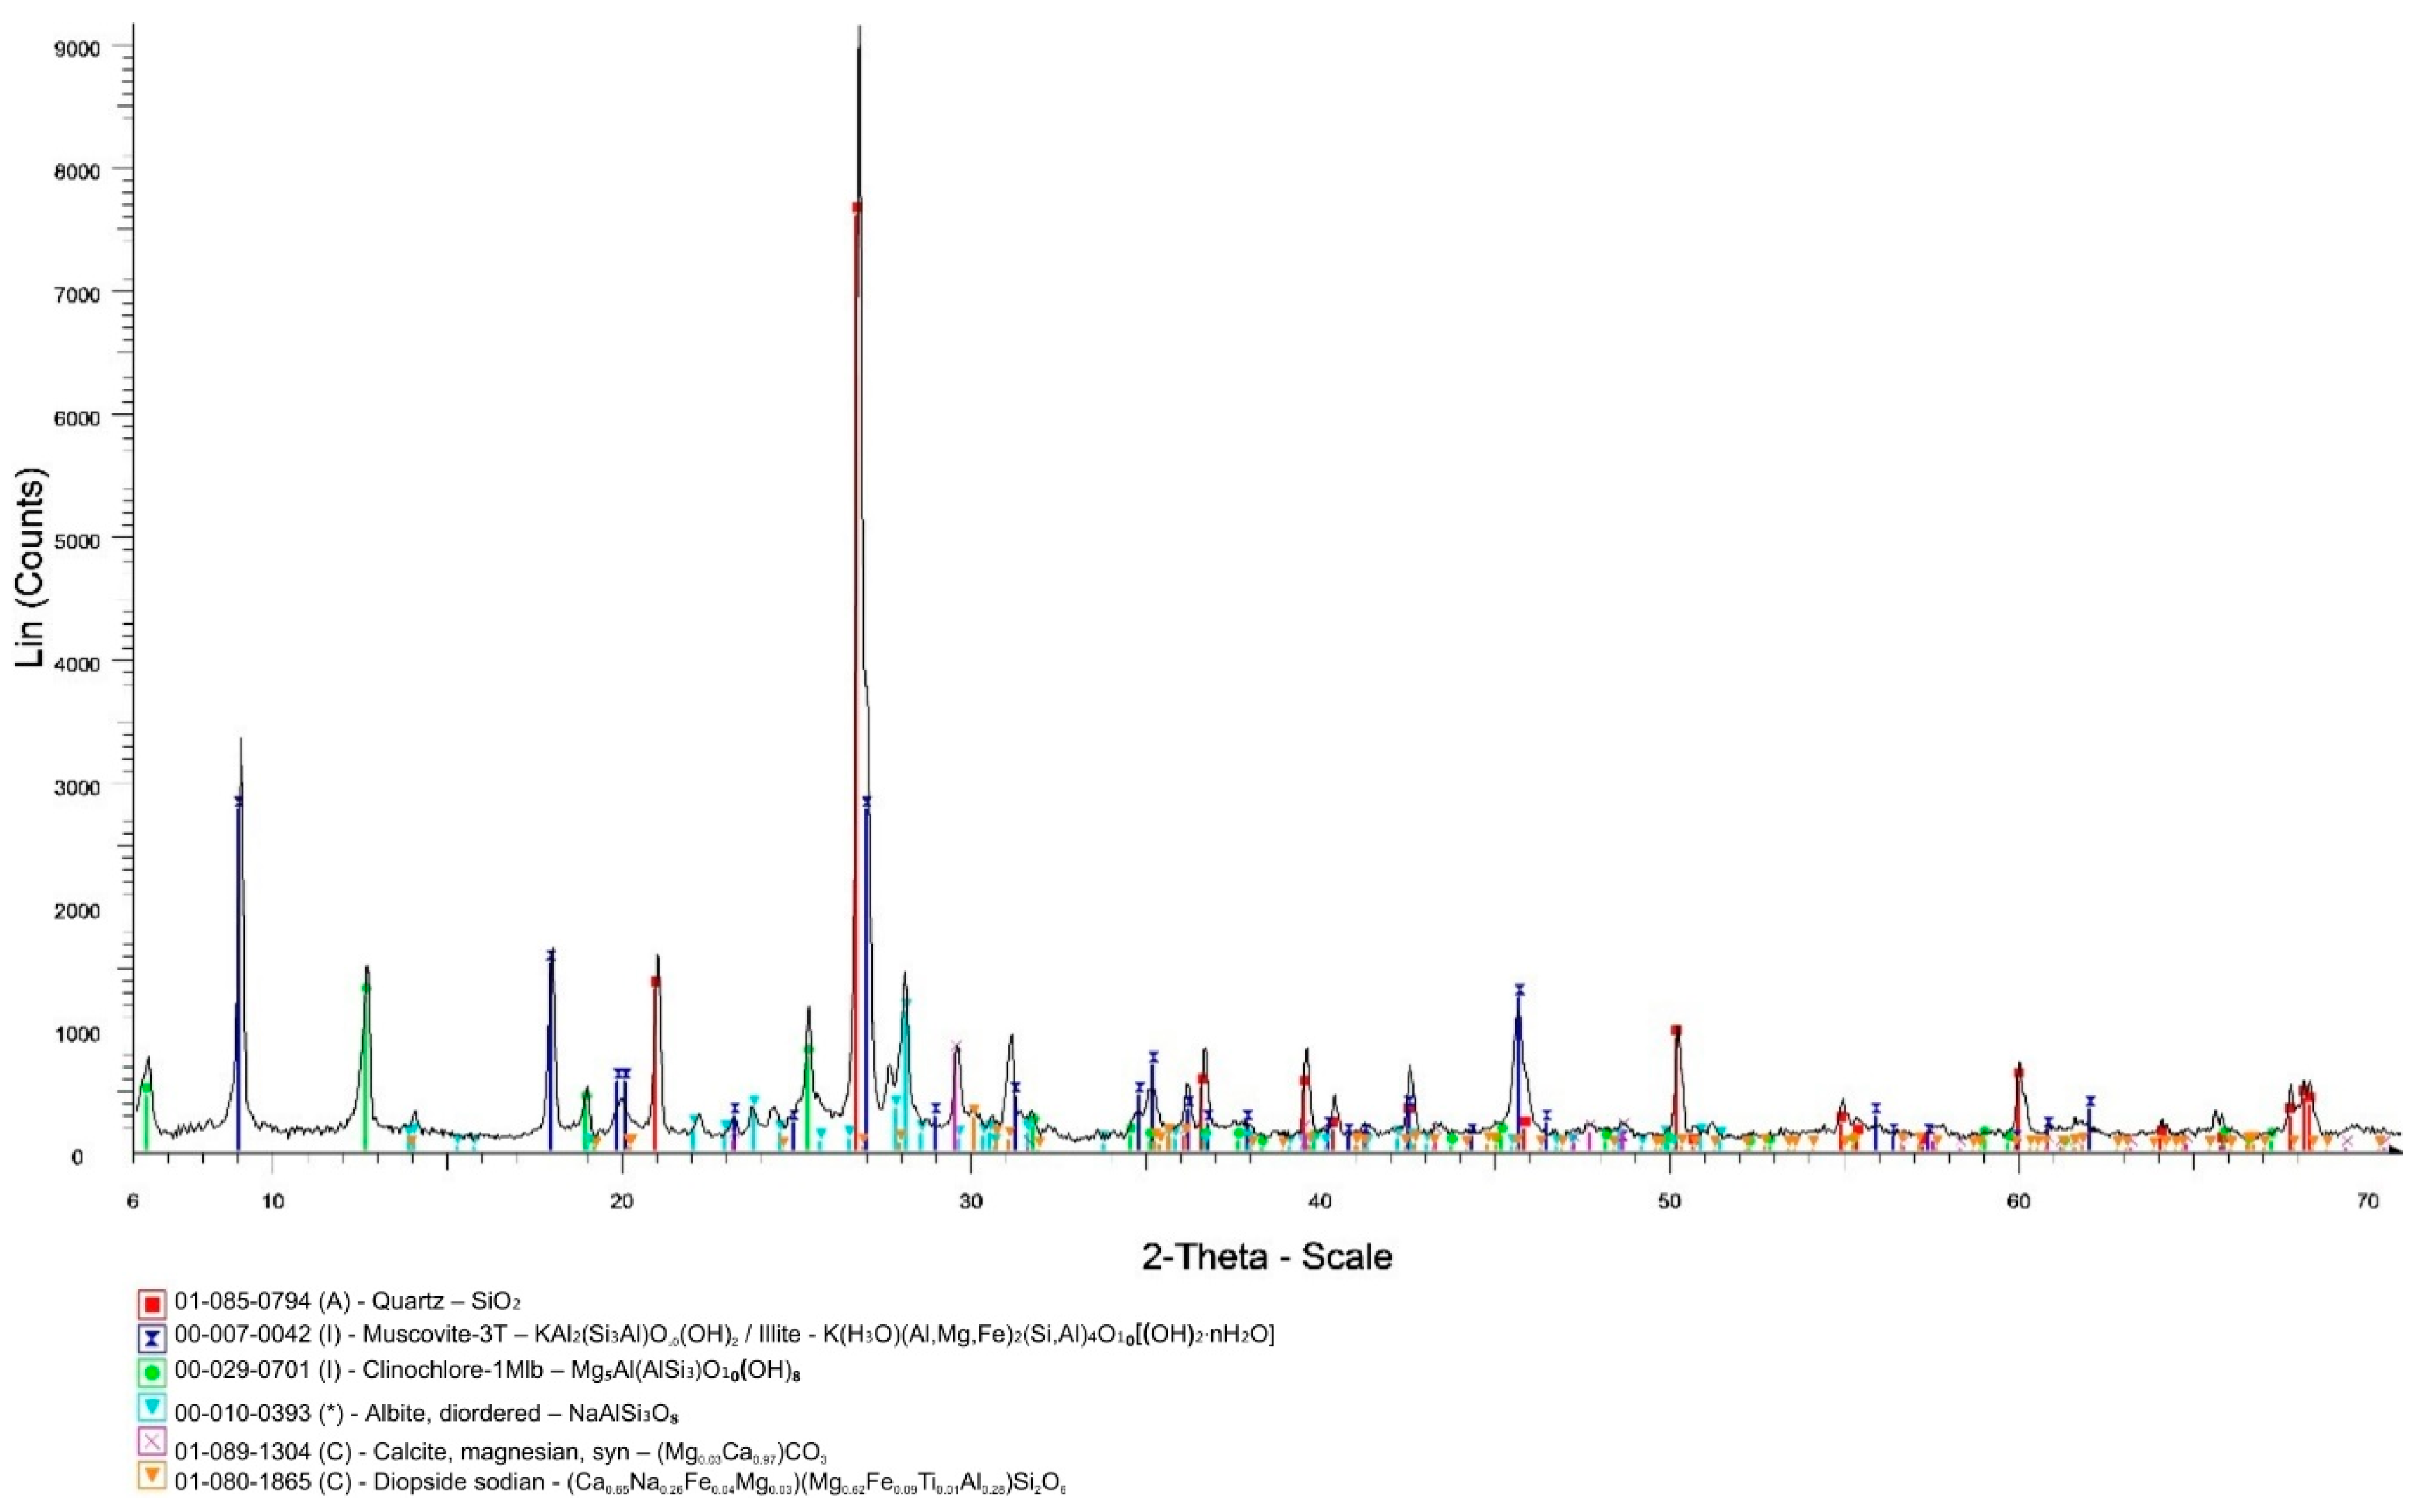
The clay used in this study was a pre-formulated industrial mixture sourced from a roof tile manufacturer in Serbia. The chemical composition of the raw material was analyzed using dry pellets with wax mixed in, applying energy-dispersive X-ray fluorescence (ED-XRF) via the Spectro Xepos system (Kleve, Germany). The obtained data were benchmarked against certified soil reference standards. Mineralogical characterization was carried out through X-ray diffraction (XRD) using a Philips 1050 diffractometer (Amsterdam, The Netherlands). Phase identification was based on the PDF-2 database. The presence of water-soluble salts was determined employing aqueous extraction followed by chemical analysis of the filtrate [
12]. Dry-ground clay samples were leached with distilled water, followed by filtration of the resulting suspension to obtain a clear aqueous extract. Soluble ions, including Ca
2+, Mg
2+, Na
+, K
+, Cl
−, SO
42−, and NO
3−, were then quantified using Inductively Coupled Plasma Optical Emission Spectroscopy (ICP-OES) by Spectro Genesis (Kleve, Germany), potentiometric titration, gravimetric analysis, and ion spectrophotometry, depending on the specific ion.
Granulometric analysis was performed via wet sieving 100 g of raw clay using a sequence of standardized mesh sieves: 1.00 mm (
RS1), 0.71 mm (
RS0.71), and 0.063 mm (
RS0.063). To enhance model interpretability and reduce dimensional complexity, a granulometric index (
GInd, Equation (1)) was derived from raw particle size data. This composite variable integrates the influence of the three sieve fractions weighted according to the inverse of their mesh openings:
The weighting factors (1, 1.4, 15.9) in the granulometric index were selected to emphasize the dominant influence of fine particles (<0.063 mm), Equation (2). This choice is supported by prior ceramic studies highlighting the effects of fines on plasticity, drying sensitivity, and firing behavior, and so the final quality of the product [
4,
13]. This choice aligns with Winkler-based body formulation for roofing tiles, where particle size balance—particularly the fine fraction—governs workability and downstream performance [
14]. A preliminary sensitivity analysis of the data further confirmed that moderate changes in weights did not alter the predictive ranking of
GInd.
This transformation consolidates multiple granulometric inputs into a single, scalable descriptor, while retaining the dominant influence of fine particles—those smaller than 0.063 mm—on ceramic performance. The GInd facilitates robust statistical analysis and soft sensor modelling by streamlining input variables without compromising informational depth.
The total carbonate content (
CCC) is quantified by reacting a dry clay sample with 6% HCl and recording the volume of CO
2 evolved, which reflects the extent of carbonate decomposition. This gas volumetric method (Scheibler calcimeter) relies on the chemical reaction CaCO
3 + 2HCl → CaCl
2 + H
2O + CO
2 to quantify carbonates in a sample [
15].
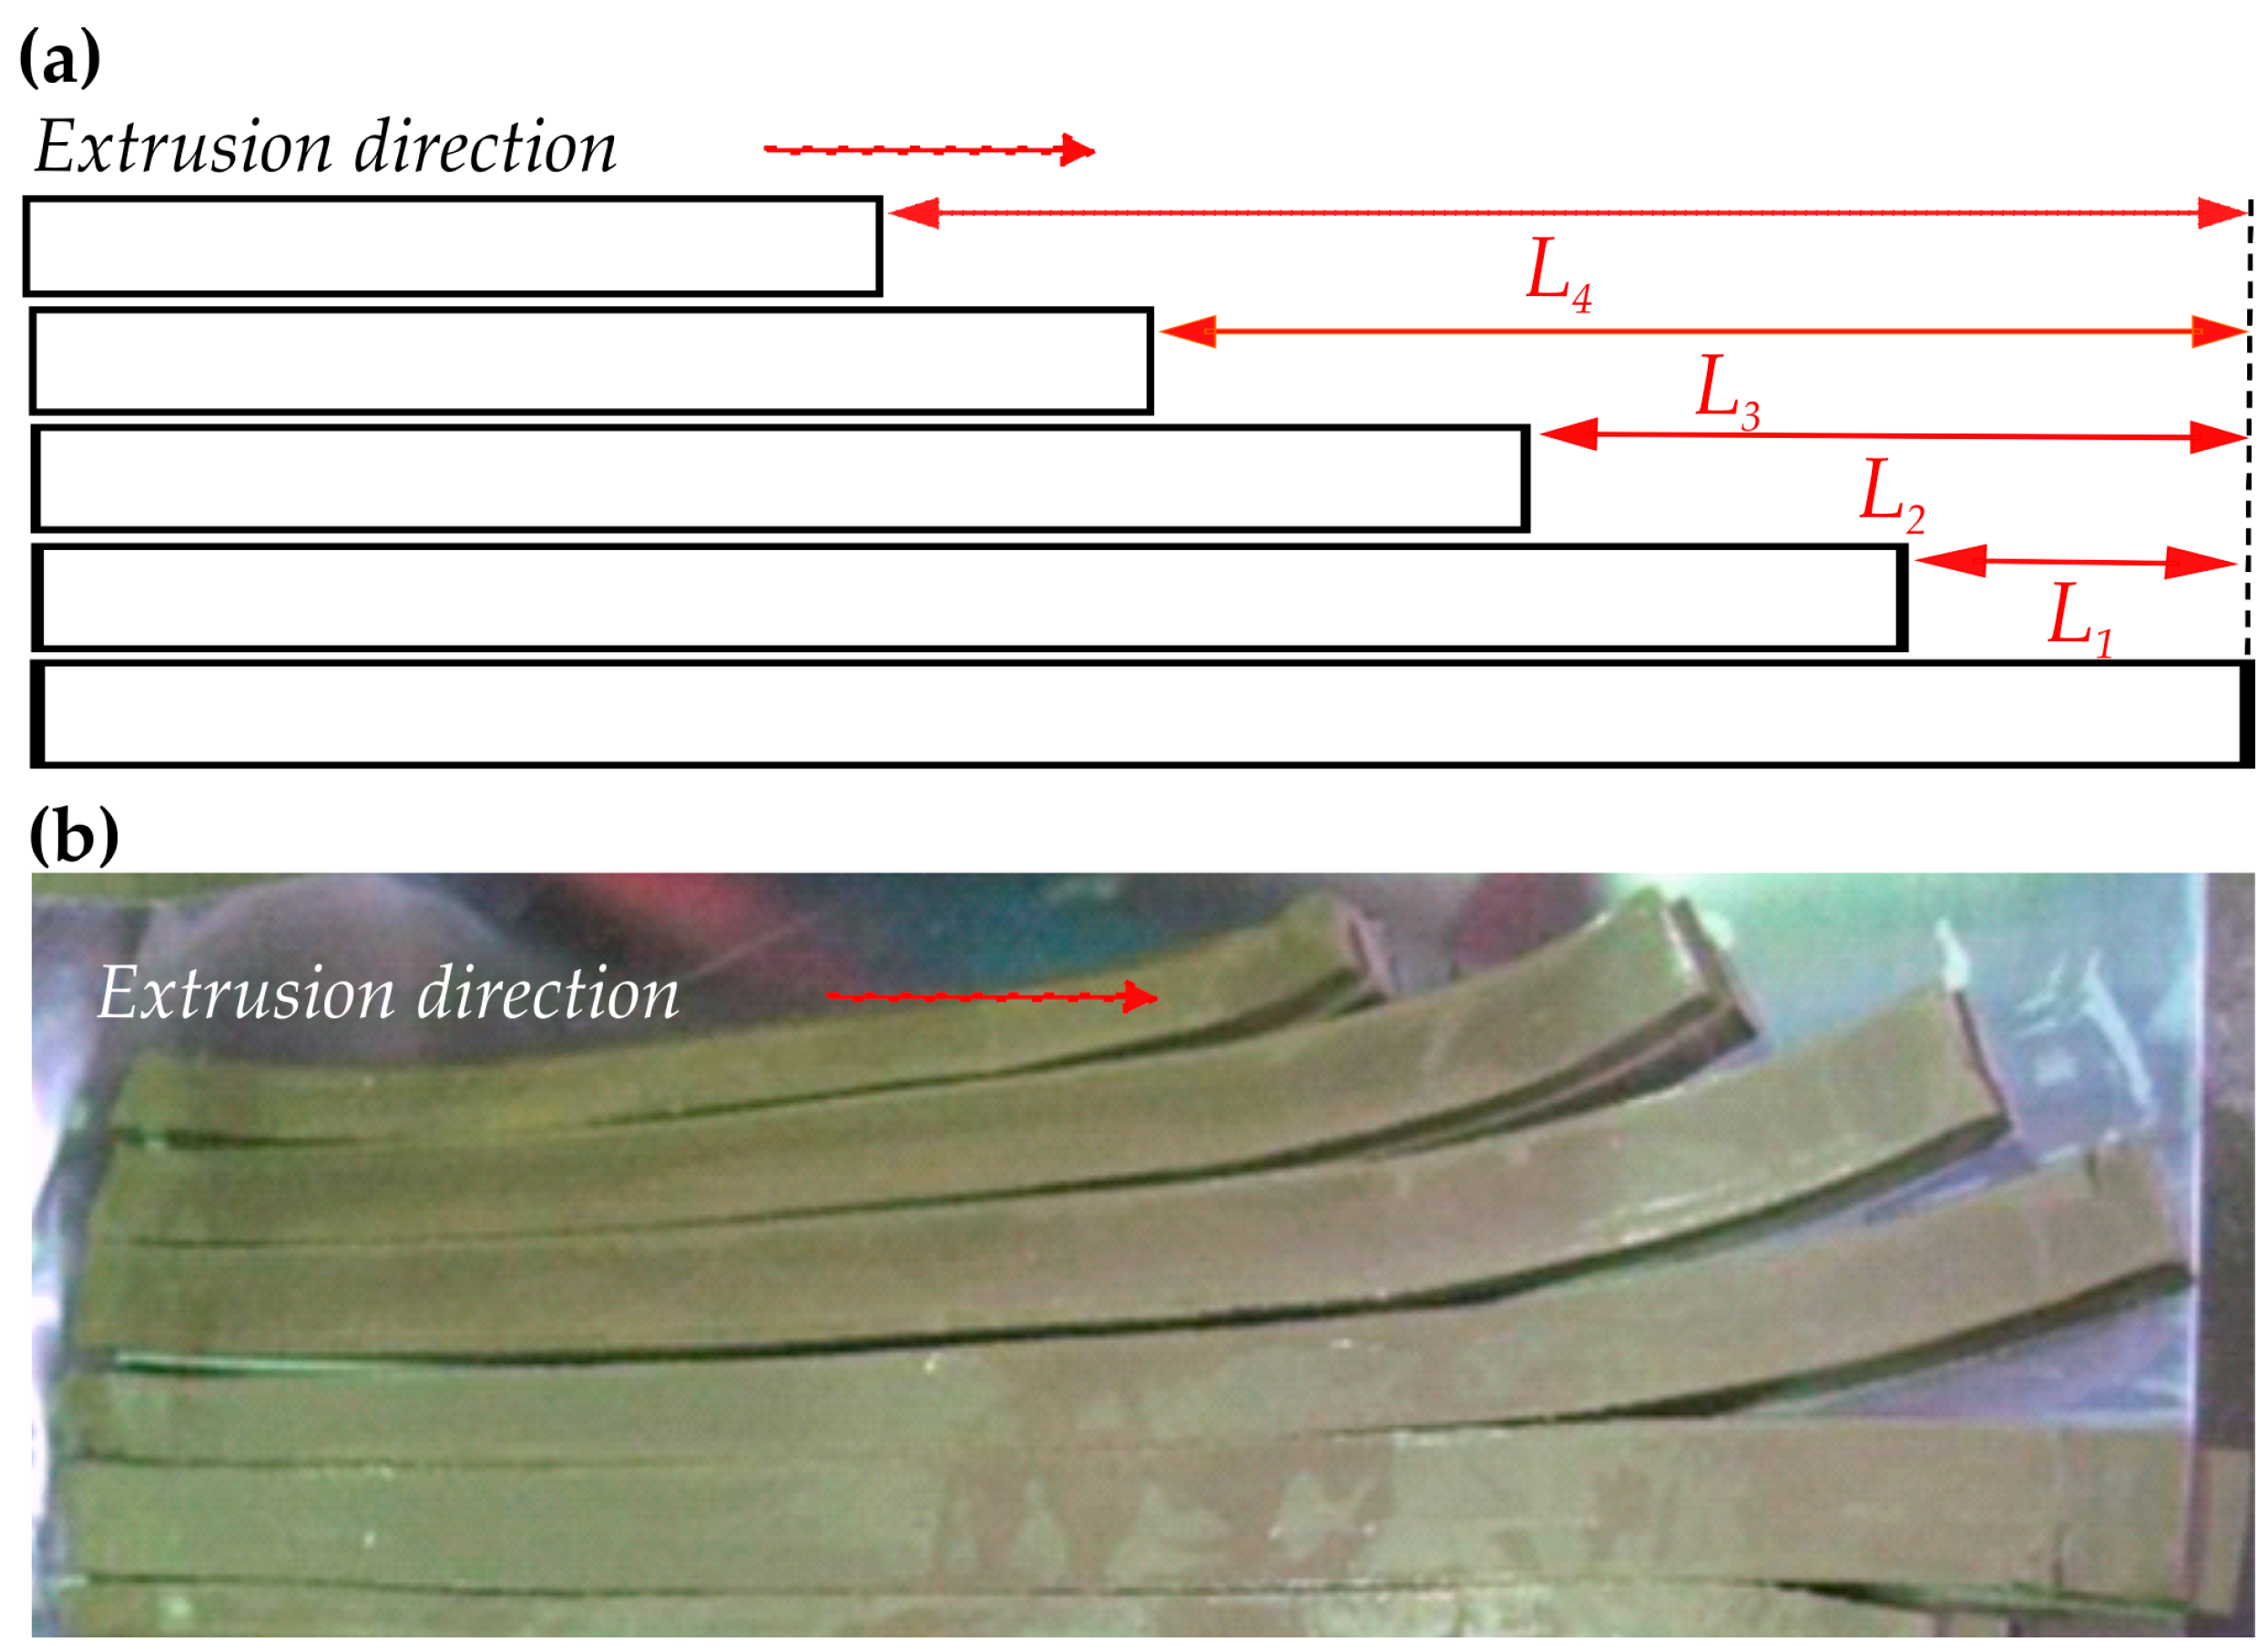
During the extrusion process, parameters that were kept constant were the pressure in the extruder head (10.1 bar) and the vacuum (1 bar). These settings indicate a fairly high pressure—typical for vacuum-assisted clay extrusion, where dense, moist material is being compacted and shaped. This level of extrusion pressure and vacuum ensures dimensional stability, reduced porosity, and improved mechanical strength. The extrusion vacuum press produces a continuous slab of moist clay, which is cut into individual tile blanks before being shaped into the final roof tile form by the pressing head. To monitor dimensional changes during processing, clay blanks of 1500 mm in length were followed for 7 consecutive weeks. Before the testing, the extruder screw was replaced with a new one. Blanks, locally referred to as
plasticas, were cut off lengthwise into five stripes after leaving the press head using a template with wires, while marking the measurement positions (
Figure 1). Length reduction (
Li) was tracked at four predefined points along each blank using a calibrated measuring bench equipped with linear scales. The shrinkage of the plastic was consistently greater on the left side relative to the extrusion direction, most likely due to issues with the flow retarders.
Based on the obtained dimensions, several indices were calculated. The length reduction and shortening ratio per 1500 mm (
SRi) of each of the four segments (Equation (3)) was used to determine asymmetry index (
AInd), central shortage index (
CSI), and total shortage ratio (
TSR), as per Equations (3)–(6).
The AInd parameter quantifies lateral asymmetry in shrinkage, reflecting uneven flow distribution or die misalignment. High AInd values indicate mechanical disturbances that can compromise dimensional stability. CSI serves as an indicator of central deformation, which captures midline contraction, serving as a robust measure of bulk deformation unaffected by localized irregularities. It is particularly relevant for predicting central cracking or warping. TSR reflects the overall extent of longitudinal shortening, integrating global shrinkage behavior across the blank. This parameter is closely tied to energy demand in the drying process, because excessive shortening raises the likelihood of defects.
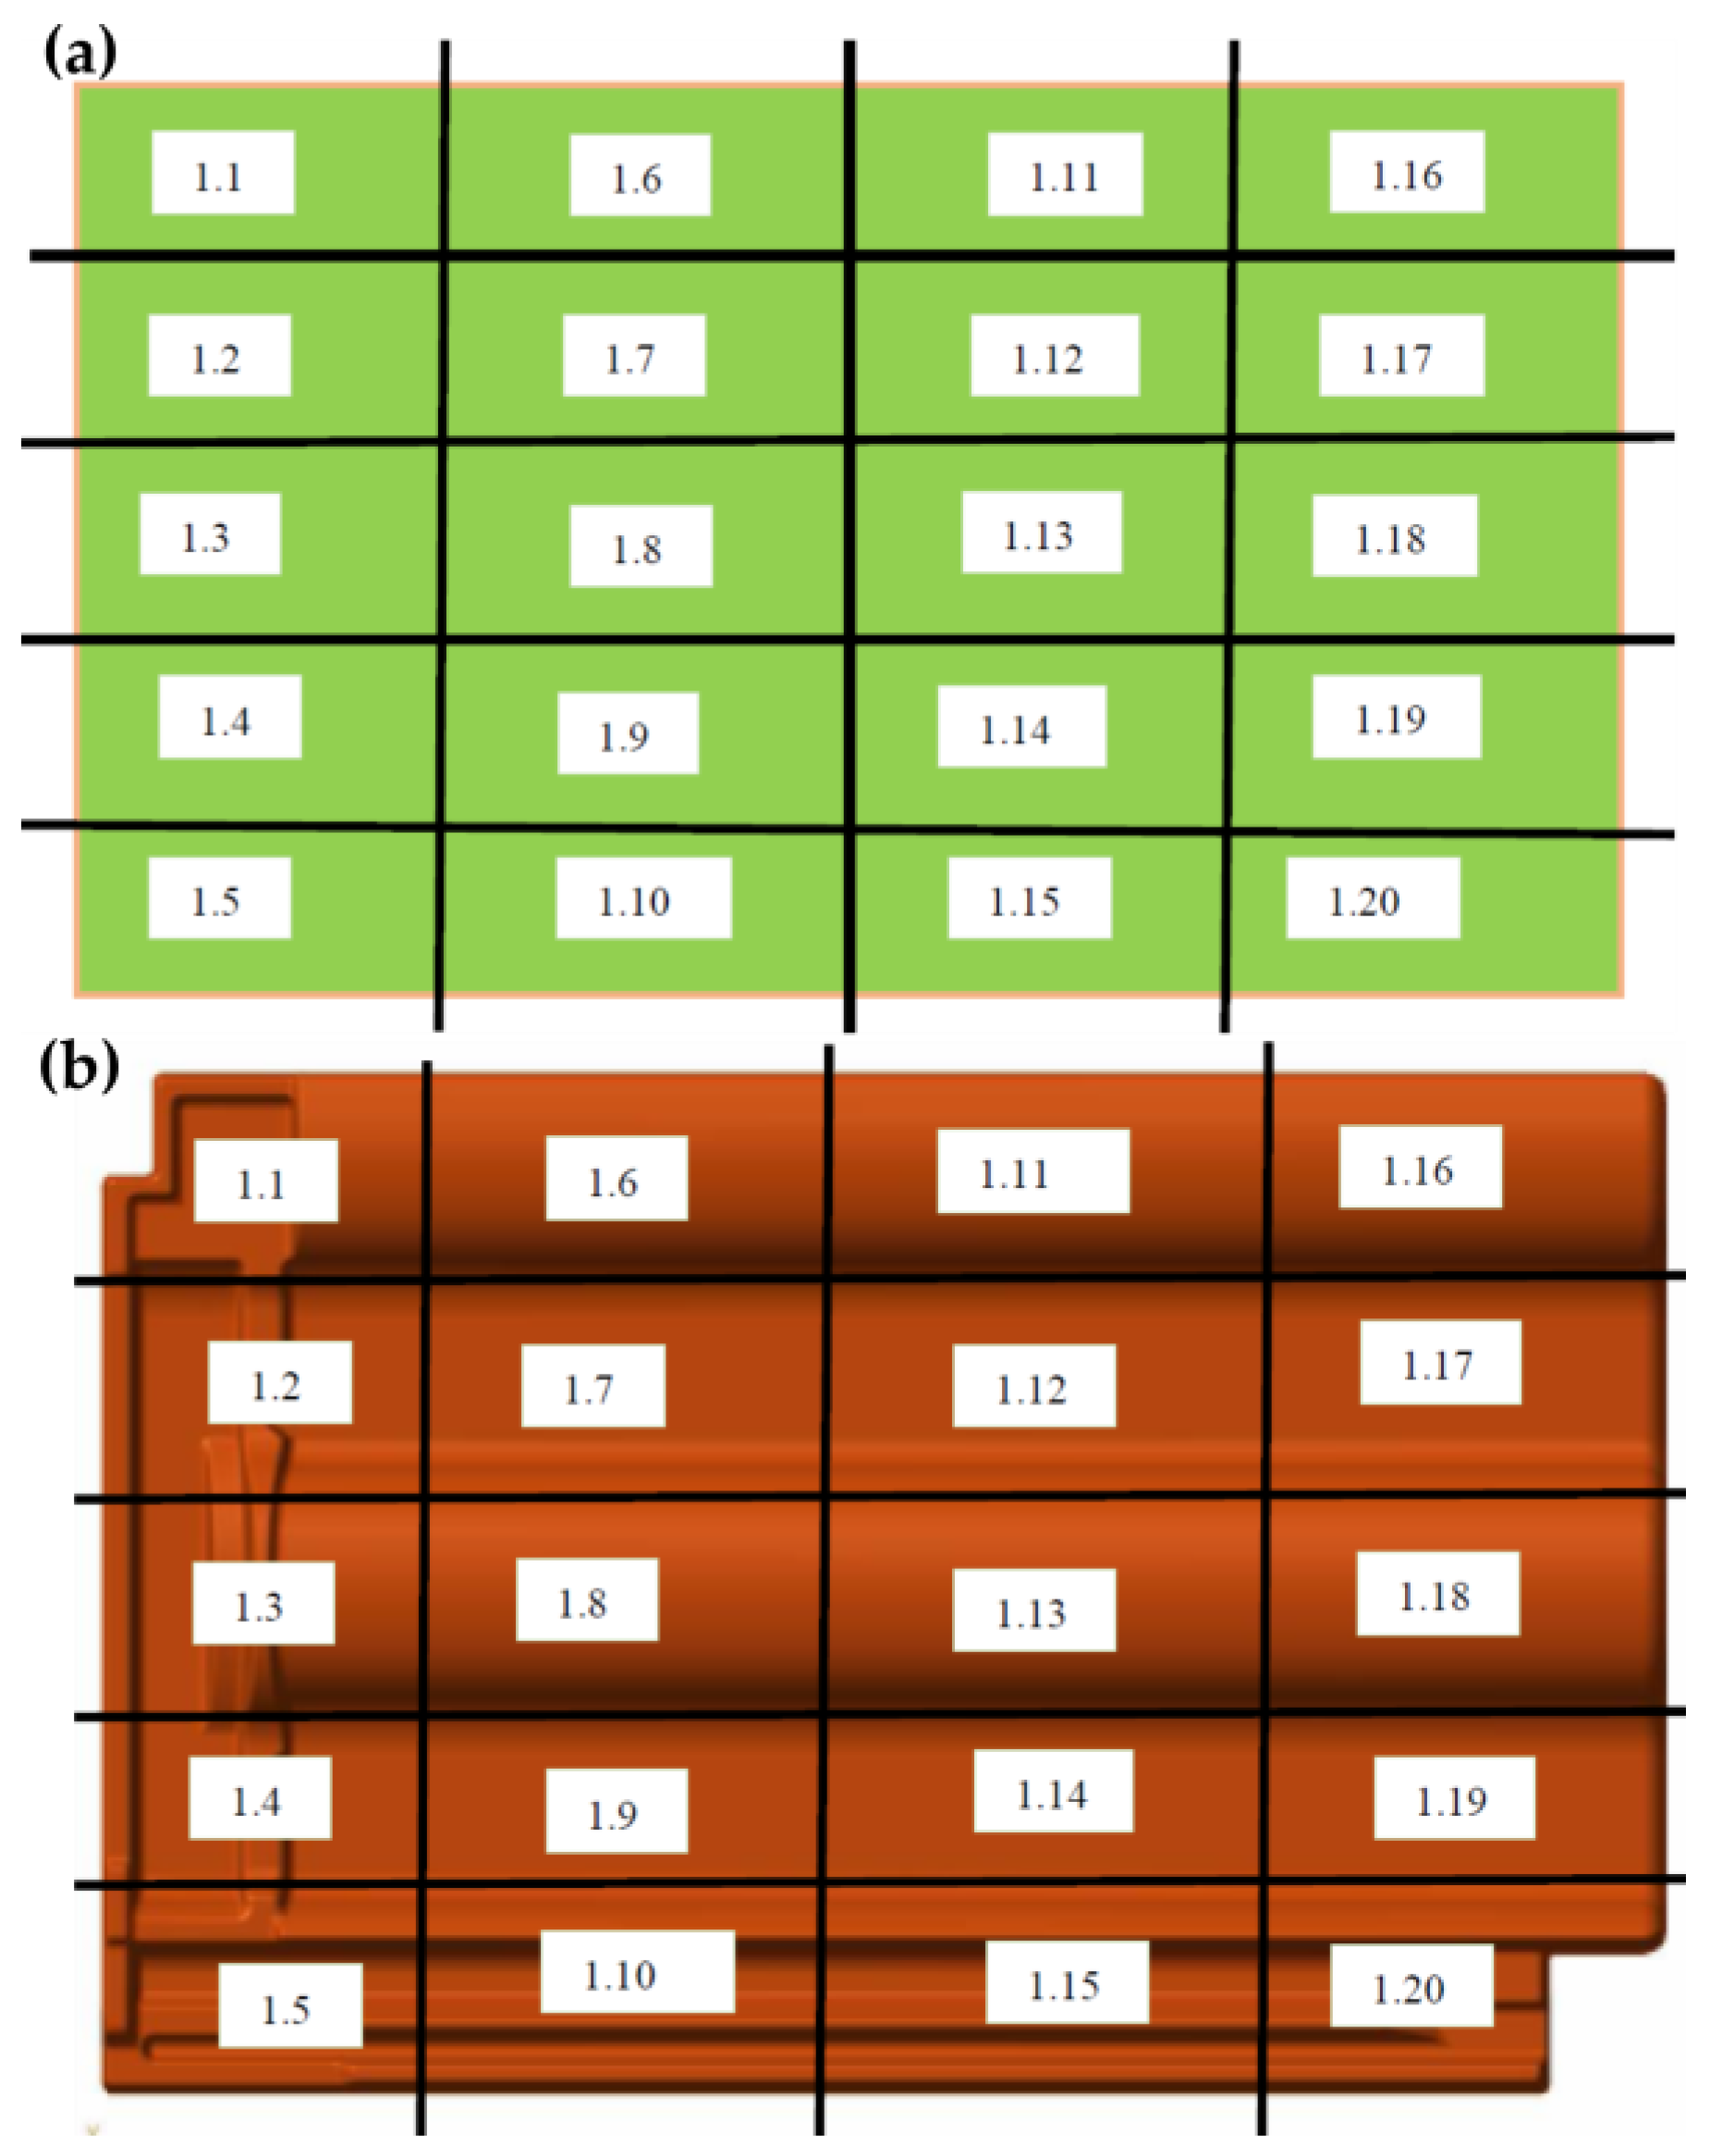
Following initial extrusion and dimensional assessment, a representative offcut from the press field, containing the targeted clay blank (
plastica), was selected for testing. The specimen (dimensions 400 mm × 300 mm × 22 mm, weighing approximately 8.00 kg) was subdivided into 20 equal segments, each of which was individually monitored during the drying and firing stages. While input variables were identical within a series, segments were treated as independent observations to capture localized deformation patterns along the extrusion track. This assumption was necessary to detect spatial heterogeneity that would otherwise be masked by averaging. To address the concern of inflated effective sample size, a sensitivity analysis was performed: models were recalculated using aggregated segment data (series-level averages) and compared with the segment-level approach. The aggregated models showed similar predictor rankings and comparable trends, although with lower statistical power. In practice, this means that the reduced number of effective observations (7 series instead of 140 segments) limited the ability of the models to detect weaker effects and increased the uncertainty of regression coefficients due to overfitting. Consequently, confidence intervals widened, and R
2 values decreased. This demonstrates that segment-level modeling enhances resolution and statistical sensitivity, while aggregated modeling provides a conservative check on robustness. This confirms that the independence assumption did not fundamentally alter the main conclusions, but rather enhanced spatial resolution. However, the intra-series dependence may still bias performance metrics, and future work will incorporate explicit spatial correlation structures to refine reliability. Following the analogy of
plastica segmentation, each roof tile (dimensions 440 mm × 275 mm × 12 mm, of about 4.00 kg in green state and ≈3.5 kg after firing) was longitudinally divided into five strips, with each strip subdivided into four segments, yielding a total of 20 zones for monitoring localized shrinkage and related performance indicators. Reference marks were inscribed on the surface using a digital caliper, enabling tracking of dimensional changes during drying and firing (
Figure 2).
All sample series (including clay blanks and roof tiles) were fired under industrial conditions using a tunnel kiln. To ensure reproducibility, specimens were constantly placed in the same position on the furnace wagon for each batch, with the peak firing temperature (FT) systematically recorded.
The following tests were conducted in accordance with relevant European standards for clay roofing tiles:
- -
Drying and firing shrinkage [
16]
- -
Water absorption and capillarity [
17]
- -
Degree of saturation: calculated from water absorption and porosity data, following EN 539-2 guidelines [
18].
Only the parameters that were considered key influential were measured to obtain an effective model. This selective approach improves a model’s performance, shortens development time, and helps mitigate the problems of dimensionality, where the data demand increases exponentially with the number of input features [
19].
All experimental results were analyzed using statistical and mathematical modeling techniques. Pearson’s correlation was used to identify linear relationships between input and output variables in raw data (without normalization). Following data standardization, Principal Component Analysis (PCA) enabled dimensionality reduction and revealed dominant patterns of variance for visualization. A parallelized variant of step-wise modeling, commonly referred to as multi-target or multi-output regression, was employed to identify the most effective predictive configuration across multiple dependent variables [
20]. Partial Least Squares Discriminant Analysis (PLS-DA) is a supervised classification method derived from Partial Least Squares Regression. It projects predictor variables into a lower-dimensional space while maximizing the separation between predefined classes. PLS-DA is particularly useful when dealing with high-dimensional, collinear, or noisy data. PLS-DA is well-suited for situations where interpretability and variable selection are important, and where traditional classification methods may struggle due to multicollinearity or limited sample size. Classification according to
CSI classes was implemented using a PLS regression model with n components selected a priori (here,
n = 2) and a post hoc discretization step (rounding and clipping to valid class labels). Inputs were standardized before modeling. The target (
CSI class) was label-encoded to ensure consistent mapping between numeric predictions and class indices. The data were split into training and test subsets using a stratified 80/20 partition to preserve class balance in both sets. To mitigate overfitting risks given the limited dataset, the stratified 5-fold cross-validation is applied. Performance was reported both on the held-out test set and via cross-validated predictions. Cross-validation results were used to assess the stability of classification accuracy and to verify that latent-space separation was not an artifact of a single split. Variable importance in projection (VIP) was computed from the fitted PLS model using standardized inputs. VIP scores were reported relative to the conventional threshold of 1.0, indicating variables contributing above the average to the latent structure. Because PLS-DA here uses a regression-plus-rounding approach, class boundary sharpness depends on latent projections and the numeric decision rule. Therefore, the accuracy is interpreted alongside latent-space separation and VIP, so as to avoid over-interpreting perfect or near-perfect scores when the sample size is small.
In time-critical, resource-limited settings, edge computing can outperform cloud-based approaches due to lower communication delays. Edge computing means the data is processed directly on local devices (such as computers connected to the production line) instead of being sent to distant servers, which reduces waiting time and avoids dependence on internet connectivity. Consequently, “lightweight” models—that is, simpler mathematical or statistical models that require less computing power— have become a preferred solution for deploying machine learning efficiently under such constraints [
20,
21,
22]. These models can run on ordinary industrial PCs or controllers without specialized infrastructure, making them practical for factory environments. Recalibration is triggered when deviations in extrusion indices exceed predefined thresholds, ensuring that the model adapts to gradual changes in raw material properties or process conditions. Model maintenance involves periodic updates, where new datasets from laboratory tests are incorporated to refresh regression coefficients and maintain predictive accuracy. Accordingly, this study aimed to develop and evaluate simpler models, which are generally regarded as less accurate based on R
2 and RMSE metrics [
2], but which offer the advantage of faster response, easier maintenance, and feasible integration into everyday production workflows.
Partial Least Squares (PLS) regression was applied to capture multivariate relationships between process parameters and the resulting performance characteristics of clay roof tiles. PLS is specifically built to handle situations where predictors are highly correlated, while projecting the predictors into a lower-dimensional space (latent variables) that capture the most relevant variance for predicting the output. This method is the most intensively employed one in soft-sensing [
23].
Support Vector Regression (SVR) demonstrated strong predictive capabilities, effectively explaining complex relationships that were not adequately modelled by linear approaches such as PLS [
24]. SVR does not rely on estimating individual coefficients like linear regression, so it is less sensitive to correlation among inputs. SVR finds a function that approximates the data within a certain margin of tolerance, using kernel functions to capture nonlinear relationships [
25]. Regularization (via C and epsilon parameters) helps control overfitting.
A second-order polynomial model (SOP) application is also explored. SOP is a mathematical expression that captures both linear and nonlinear relationships between input variables and an output. It typically includes terms for each input, their squares, and their pairwise interactions, allowing it to represent curvature and synergistic effects in complex systems. This makes it particularly valuable for soft sensor applications, where direct measurement of a process variable is difficult or costly [
26,
27]. By fitting the model to experimental or process data, it is possible to estimate the influence of each input on the output and use the resulting equation for real-time prediction or control. Furthermore, when data availability is limited, complex models should be avoided in favor of simpler, more robust alternatives [
2]. Their simplicity enables fast computation and easy integration into supervisory control and data acquisition (SCADA), programmable logic controller (PLC) environments, or an open-source simulation framework, Dyssol [
28], while still offering interpretability and robustness for process monitoring and optimization [
29,
30]. When inputs are highly correlated, the model may struggle to estimate coefficients reliably. This can lead to inflated standard errors, unstable predictions, and difficulty interpreting the influence of individual variables. Furthermore, adding squared and interaction terms (as in second-order models) can amplify multicollinearity, since these terms are often derived from already correlated inputs. Suppose prediction is the goal, and not interpretation. In that case, second-order models can still perform well, especially with regularization techniques like Ridge regression, which penalizes large coefficients, and the Lasso regression, which performs variable selection and can eliminate redundant terms. In this study, Ridge regression was chosen for its ability to retain all input features while shrinking their coefficients to mitigate overfitting. The resulting coefficients provide a direct interpretation of each input‘s influence on the model [
31]. For modeling purposes, the dataset was randomly partitioned into 80% for training and 20% for testing. These models were selected as they support a real-time prediction of multiple quality indicators from the same input stream. The programs used for descriptive statistics and mathematical modeling were Statistica 10.0 (Statsoft; Oklahoma, US) and Python 3.13.7 (Python Software Foundation; Amsterdam, The Nederlands).
Raw data were both normalized and standardized as a key step in preparing the data for modeling, especially since variables are on different scales (e.g.,
FT in °C,
CCC in mass %). Normalization transforms data by rescaling values to a fixed range, typically between 0 and 1, ensuring that all parameters contribute equally regardless of their original units. In contrast, standardization centers the data around the mean and scales it according to the standard deviation, producing values with a mean of 0 and a standard deviation of 1. This approach is particularly beneficial in machine learning applications, where algorithms often assume that input features are normally distributed. It is especially suitable for regression, PCA, and PLS, where variables differ in units or exhibit varying degrees of variance [
32,
33]. The standardization needs to be performed before the PCA and regression modeling. Standardization prevents variables with high values from overpowering those of low results, makes coefficients in regression models more interpretable, and improves the stability and accuracy of PCA and PLS components.
3. Results and Discussion
3.1. Composition of Raw Clay
The raw clay exhibits a predominantly aluminosilicate composition, typical for illitic clays (
Table 1). The Fe
2O
3 content of 4.94% suggests moderate iron enrichment, which positively influences coloration and firing behavior. Calcium oxide (4.21%) and magnesium oxide (1.54%) point to the presence of carbonate phases or clinochlore (
Figure 3). The presence of alkali oxides—Na
2O (0.35%) and K
2O (2.36%)—indicates feldspar minerals such as albite, which promote fluxing during sintering, as well as illite, whose potassium content further supports vitrification. A loss on ignition of 6.68% at 1000 °C corresponds to the release of structural water and the thermal decomposition of carbonates and organic matter. In contrast, the 2.39% moisture loss at 105 °C suggests moderate hygroscopicity. Trace components such as TiO
2 (0.23%), P
2O
5 (0.07%), and SO
3 (0.02%) are also present. Water-soluble salts are minimal, with CaO and MgO at 0.34% and 0.12%, respectively, and other ions, such as Cl
−, NO
3−, Na
2O, and K
2O, collectively below 0.07%, suggesting a low efflorescence potential and good compatibility for ceramic processing [
34].
3.2. Longitudinal Shortening of Clay Blanks
Before the onset of this study, pronounced fluctuations in the length of clay blanks were observed during industrial production. Seven sample series (S1–S7) were analyzed to evaluate shrinkage variability along the 1500 mm extrusion length. Longitudinal shortening of clay blanks during extrusion emerged as a critical indicator of material behavior across the drying and firing stages, directly affecting dimensional stability and conformity of the final product. The dataset comprised seven consecutive production series in a concrete industrial facility using locally available raw material. While this dataset provides valuable real-world insight, the limited sample size constrains statistical generalizability. Accordingly, the reliability of the model should be interpreted with caution, and future studies must validate its performance across diverse production lines, raw material sources, and operating conditions. Although the models developed here apply specifically to extrusion-based roof tile production, their broader applicability can be ensured through systematic calibration and adaptive strategies. Key procedures include periodic adjustment of moisture thresholds, recalibration of granulometric indices to reflect local raw material distributions, and redefinition of carbonate content ranges according to regional clay sources. Adaptive strategies involve incremental model updates using local datasets, transfer learning from previously validated models, and supervised recalibration based on laboratory benchmarks. Beyond extrusion, the same methodological logic can be extended to other traditional ceramic processes, such as pressing or slip casting, where deformation indices can be reformulated to capture compaction asymmetry, shrinkage gradients, or other quality issues. By decomposing complex phenomena into measurable indices and tracking them through mathematical modeling, diverse problems—such as warping during pressing, cracking during drying, or heterogeneity in slip casting—can be systematically monitored and resolved. This demonstrates that the framework is not limited to extrusion but represents a generalizable approach for diagnosing and controlling process variability across traditional ceramic manufacturing and related industries.
The observed variations in shortage were unexpected, especially considering the uniformity of raw material composition and rigorously controlled production parameters. Although the shaping moisture ranged narrowly from 18.08 to 19.43%, this interval alone appeared insufficient to explain the pronounced differences in longitudinal contraction. These subtle irregularities could escape detection through standard monitoring of pressure and vacuum, yet still induced differential elongation and localized deformation.
Figure 4 illustrates the longitudinal deformation behavior of clay blanks across seven consecutively extruded series (S1–S7), highlighting three key aspects: shortening at four predefined positions from left to right side (
Li), and shortening ratio normalized to 1500 mm (
SRi). The consecutive production of seven series makes the observed variability particularly noteworthy, as it suggests that the deformation patterns are not random but potentially linked to transient process instabilities. Furthermore, the obtained results do not show a strong correlation with the wear of the newly installed extruder screw before the extraction of the first batch, following seven weeks of continuous use in the factory and the completion of S7 production. However, these differences stem from the frictional interaction between the inner wall of the extruder barrel and the screw itself—over time, the gap between the barrel wall and the screw diameter increases, primarily due to a gradual reduction in the screw diameter.
Spatially resolved measurements enabled the detection of shrinkage gradients and localized deformation zones, offering insight into both global and segmental behavior of the clay blanks. Although the test series was conducted weekly, following the replacement of the extruder press screw before the first series, clay blank shortening did not exhibit a consistent trend associated with tool wear. Indicators such as AInd, CSI, and TSR showed no systematic increase or decrease over time. Notably, series S6 and S7 displayed the most pronounced differences between L1–L4, along with the highest values of AInd and TSR, and the lowest CSI values. These differences are unlikely to result from raw material inconsistencies, given the temporal proximity of production. Instead, they point to intermittent mechanical disturbances within the press head—such as pressure fluctuations, die misalignment, or uneven lubrication.
To better understand the mechanisms driving clay blank shortening during extrusion, a PLS classification was performed using the central shortage index (CSI) as the target variable. CSI provided a stable and physically interpretable measure of midline deformation, unaffected by localized irregularities, and thus served as a robust basis for classification. Two classes were defined based on CSI ranges: Class 4 (acceptable, CSI between 3.9 and 4.3) and Class 5 (unacceptable, CSI between 4.7 and 4.9).
The latent space plot (
Figure 5a) revealed clear separation between acceptable and excessive central shortening, indicating that
SM,
GInd,
CCC, and
AInd encode meaningful signals for class discrimination. Among these,
SM emerged as the dominant factor, with higher values consistently associated with increased central contraction, even within the narrow range of measured moisture.
GInd and
CCC followed closely: finer particles appeared to amplify deformation through capillary effects, while
CCC exerted a moderating influence.
AInd contributed marginally, suggesting limited relevance for
CSI-based classification. This interpretation was reinforced by the VIP analysis (
Figure 5d), where
SM exceeded the importance threshold (VIP > 1) by a clear margin, and
GInd and
CCC also surpassed it.
AInd remained below the threshold, confirming its secondary role in class separation.
The PLS-based classifier achieved strong separation of
CSI classes in latent space and high accuracy on the held-out test set. Stratified 5-fold cross-validation confirmed stable performance across folds, supporting the robustness of the latent projections. On the held-out test set, the model exhibited robust statistical performance, achieving an accuracy of 1.00 and an R
2 value of 0.883. However, stratified 5-fold cross-validation yielded slightly lower but consistent accuracy values, confirming that the apparent perfect classification on the test set was not due to overfitting. The confusion matrix (
Figure 5b) showed correct separation of classes, while the histogram of predicted scores (
Figure 5c) demonstrated tight clustering around the decision threshold.
The combination of latent-space separation, confusion matrix structure, and VIP ranking provides convergent evidence that shaping moisture (SM), granulometry (GInd), and carbonate content (CCC) encode meaningful signals for CSI discrimination. Given the dataset size, these findings should be viewed as indicative rather than definitive, pending external validation.
3.3. Descriptive Statistics of Model Inputs
To ensure both interpretability and practical relevance in the predictive model, input parameters were carefully selected based on their direct connection to the extrusion process, accessibility within routine production workflows, and their demonstrated impact on the final properties of roof tiles. These inputs include raw material characteristics (e.g., carbonate content, granulometry), process parameters (moisture content, derived indices from extrusion shrinkage (
AInd,
CSI, and
TSR, and firing temperature).
Table 2 summarizes the minimum, maximum, average values, and standard deviations for each input variable across all seven tested series (S1–S7). The moisture content (
SM) ranged from 18.08% to 19.43%, with a relatively low standard deviation (0.44), indicating consistent preparation across batches. The carbonate content (
CCC), ranging from 8.46% to 10.94%, exhibited moderate variability. This fluctuation was primarily attributed to material inhomogeneities and the uneven distribution of slightly coarser carbonate grains—less than 1 mm in diameter, as dictated by the milling specification [
35]—within the clay matrix. Granulometric parameters were used to compute the
GInd, which ranged from 50.9 to 81.8 across the series, with a standard deviation of 12.2, indicating moderate dispersion in particle size distribution. Extrusion shrinkage was assessed at four reference points along each blank, with
SR1 (the right side) exhibiting the highest variability.
SR3 and
SR4 also showed considerable spread, suggesting that certain series underwent uneven shrinkage along their length, likely reflecting localized disturbances during extrusion (
Figure 4). To capture broader deformation and stability patterns, three composite indicators—
AInd,
CSI, and
TSR—were introduced. The indices revealed considerable variability and increased standard deviations, with
TSR (StDev = 7.44) standing out as a marker of localized susceptibility to extrusion-related instability. This statistical overview provides a foundation for subsequent correlation and regression analyses, allowing the model to identify dominant predictors and reduce dimensional complexity without compromising physical relevance.
Given the presence of strong intercorrelations among several composite indicators (
Table 3), with correlation coefficients exceeding 0.80 and highly significant
p-values, the dataset exhibits pronounced multicollinearity. The correlation matrix reveals a complex web of interdependencies among input variables, reflecting both intrinsic material characteristics and process sensitivities. Shaping moisture (
SM) shows strong correlations with all the inputs, particularly
CSI and
GInd, underscoring its central role in governing extrusion behavior and deformation metrics, as illustrated in
Figure 5. This pattern is consistent with the known influence of
SM on plasticity, compressibility, and flow uniformity during extrusion [
36].
CCC strongly correlates with
CSI,
GInd,
SM,
FT, and
AInd, suggesting that variations in carbonate levels—likely due to material inhomogeneities and sub-millimeter grain dispersion—affect both mechanical stability and the thermal response under selected firing conditions [
37]. The granulometric index (
GInd) is highly correlated with all inputs except
AInd and
TSR, raising doubts that it does not affect packing density and extrusion consistency [
38]. Conversely,
CSI is strongly correlated with all variables except
TSR, reflecting its function as a composite deformation indicator that integrates multiple aspects of process sensitivity.
CSI stands out as the most interconnected variable, showing strong correlations across the entire input set. This suggests that it effectively captures cumulative instability arising from multiple sources—moisture variation, carbonate decomposition, particle size effects, and shaping dynamics. The presence of such and other multicollinearities among inputs justifies the use of modeling approaches like PLS and SVR, which are robust to correlated predictors and capable of extracting latent structure without compromising interpretability [
39,
40]. These methods allow the retention of physically meaningful but statistically overlapping variables, ensuring that the model reflects the true complexity of the extrusion process rather than oversimplifying it through premature variable exclusion. Support Vector Regression (SVR) was also utilized, as it is inherently robust to correlated inputs and capable of capturing nonlinear relationships without relying on direct coefficient estimation [
39].
Figure 6 illustrates the projection of active and supplementary variables onto the first two principal components derived from standardized data. Factor 1 (57.52%) predominantly captures granulometric characteristics, while Factor 2 (28.90%) reflects compositional variation, particularly driven by moisture and carbonate content. Together, these components explain 86.42% of the total variance, confirming that the dimensionality reduction preserves the essential multivariate structure of the dataset. Standardization of the variables ensures that all variables contribute equally to the PCA regardless of their original scale, allowing the analysis to reveal underlying correlation patterns that may not be apparent in raw data. This approach is particularly valuable for diagnosing the causes of longitudinal shortening in clay blanks, where deformation behavior may arise from subtle interactions between material composition, granulometry, and process-induced asymmetries. The supplementary variable
FT, projected post hoc, aligns moderately with
GInd and
AInd, suggesting that it influences granulometric structure and deformation asymmetry during firing.
CCC and CSI form a tight cluster with long, co-oriented vectors, indicating a strong positive correlation between carbonate levels and central shortage. This supports the hypothesis that slightly elevated carbonate content contributes to non-uniform shortening during extrusion, possibly by altering plasticity or compressibility. Meanwhile, AInd and TSR are positioned nearly orthogonal to CCC, CSI, and SM, implying minimal correlation with raw material composition. Their orientation suggests that total and asymmetrical shrinkage are governed more by process dynamics than by intrinsic material properties. The vector for CSI, pointing negatively along both axes, further reinforces this decoupling, indicating that central shortage may be inversely related to both other structural and compositional factors.
The PCA structure, with long and well-defined vectors across all variables [
41], confirms their strong contributions and representational quality. This makes them highly suitable for inclusion in simplified, interpretable models. When embedded within a soft sensor framework, longitudinal shortening metrics act as reliable predictors of final tile performance. They also assist in identifying formulations susceptible to excessive deformation during processing. This multivariate approach enables the development of robust, industry-adaptable models that enhance process predictability, reduce waste, and support energy-efficient manufacturing by minimizing the need for corrective reprocessing.
3.4. Analysis of Model Outputs
The output variables evaluated in this study serve as key performance indicators for clay roof tiles, capturing both structural integrity and water absorption-related behavior. These include dimensional shrinkage of blanks and roof tiles, respectively (
DSp,
DSr;
FSp,
FSr), their water absorption (
WAp,
WAr), and saturation (
Sp,
Sr), all of which are critical for ensuring product durability and compliance with industry standards.
DS,
FS,
WA, and
S values reveal notable differences between the clay blank (
plastica, index
p) and the pressed roof tile (index r), reflecting the influence of forming method on material behavior (
Table 4). The
plastica exhibits higher
WA and lower
FS values, indicating a more porous structure and reduced densification during firing. In contrast, the roof tile showed enhanced compaction and worsened pore connectivity achieved through pressing, which are desirable properties [
42]. Saturation levels further support this distinction, with the roof tile demonstrating greater water retention capacity, likely due to finer pore distribution. These variations underscored the mechanical and microstructural advantages of pressing over extrusion alone, particularly in applications that demand higher strength and dimensional stability.
Drying shrinkage (
DSp) in
plastica samples showed moderate variability, reflecting differences in initial moisture content and extrusion consistency. These variations are typical for clay bodies formed under less compacting pressure, where particle orientation and water distribution can fluctuate across batches or sections of the extruded body. While higher moisture content improves material fluidity, it can simultaneously weaken interparticle cohesion, promoting the development of larger pores, greater dimensional shrinkage, and increased susceptibility to drying-induced cracking. Lower, yet optimal, moisture levels promote improved packing density and structural integrity, while reducing plasticity and elevating the likelihood of mechanical cracking [
43].
Firing shrinkage was generally higher in roof tiles compared to
plastica, which is expected due to the increased compaction from pressing. However, the difference in average values is modest—around 0.5%—suggesting that most tiles behaved consistently. Water absorption (
WA) was more pronounced in
plastica, indicating a more open pore structure and lower bulk density. This is expected given the forming method and the other related results. Pressed roof tiles exhibited lower
WA values, suggesting tighter microstructural consolidation and reduced capillary pathways. However, overall absorption remained lower than typically observed in roof tiles [
44]. Saturation (
S) followed a trend similar to
WA, with roof tiles demonstrating higher saturation capacity, likely attributable to finer and more uniformly distributed pores.
Capillarity was assessed on five segments per series; yet, the results provide valuable insights into pore structure and water transport behavior. This parameter reflects the tile’s ability to absorb and transport water through capillary action, which is critical for assessing freeze–thaw resistance and long-term durability [
45]. In the clay blank, capillarity rise over 90 min ranged from 13.81 to 39.97 mm′, with an average of 22.92 mm and a standard deviation of 5.30 mm. In contrast, the roof tile segments showed a narrower range—from 17.42 to 34.37 mm/90′—with a slightly higher average of 23.15 mm and a lower standard deviation of 4.02 mm.
Elevated shrinkage and variations in water absorption across segments point to localized inconsistencies in forming, reflecting material inhomogeneities and uneven pressure distribution during shaping [
46]. These effects are further supported by capillarity measurements, which revealed heterogeneity in pore connectivity and size. Extruded segments tended to show more variable pore networks due to limited control over local compaction and particle arrangement, while pressing generally produced more consistent pore morphology. Nonetheless, occasional anomalies—such as reduced capillary rise and higher shrinkage—indicate that mechanical factors during forming can restrict water movement and alter microstructural uniformity. Taken together, the results highlight the strong influence of forming technique on pore structure [
47], water transport, and dimensional stability, and emphasize the need for regular inspection and maintenance of tooling to ensure consistent compaction and reliable performance of ceramic bodies.
These findings validate the relevance of the selected outputs for modeling and confirm their sensitivity to early-stage process parameters, as also seen in the correlation analysis of inputs vs. outputs (
Appendix A,
Table A1). When integrated into the soft sensor framework, these metrics enable accurate prediction of tile performance, support real-time quality control, and contribute to energy-efficient production by reducing the need for post-firing rejection or reprocessing.
This level of multicollinearity suggests that the measured parameters—both for
plastica (p) and roof tile (r)—are strongly interdependent, reflecting shared underlying physical mechanisms and process conditions (
Table 5). The roof tile parameters (
DSr,
FSr,
WAr,
Sr) show the same pattern, reinforcing the idea that pressing introduces consistent structural changes across multiple properties. Many of the output variables exhibit highly significant correlations (
p < 0.01), revealing tightly coupled mechanisms that govern ceramic behavior. Strong negative correlations between
FSp and
WAp (r = −0.72) and
Sp (r = −0.70) suggest that increased firing contraction leads to denser packing and reduced porosity. A strong positive correlation between
WAp and
Sp (r = 0.86) indicates that these parameters co-vary significantly.
Sp also correlates strongly with
WAr (r = 0.81) and
Sr (r = 0.72), reinforcing its role as a central predictor of water-related behavior in roof tile. Additional correlations—
WAp–
WAr (r = 0.75),
WAp–
Sr (r = 0.62), and
WAr–
Sr (r = 0.85)—confirm that these outputs reflect a shared pore system response. Inverse relationships such as
FSp–
WAr (r = −0.71) and
FSp–
Sr (r = −0.50) further highlight the densification effects of firing on pore volume and fluid uptake. In contrast,
DS parameters exhibit no correlations with other outputs, suggesting that they may be controlled by independent mechanisms or influenced by measurement noise.
The strong correlations between plastica and roof tile variables suggest that, despite differences in forming method, the underlying material behavior remains coherent across formats.
When output variables are highly correlated, it may seem logical to model only one and infer the others. However, strong correlation does not imply identical dependence on input features. Each output may respond differently to specific predictors, revealing distinct physical mechanisms or sensitivities [
48]. For example,
DSp and
DSr may be correlated due to shared dependence on shaping moisture, yet differ in their response to firing temperature or mold geometry. Constructing individual models facilitates independent validation, tighter control over predictive error, and clearer attribution of process-specific effects. Without empirical confirmation of functional links between outputs, correlation alone may lead to reductive interpretations that mask underlying physical distinctions. Therefore, even in cases of high output correlation, separate modeling remains a robust and informative approach [
48].
Analysis of values across segments and series (
Figure 2 and
Figure 7) reveals that average water absorption was relatively stable, yet slightly elevated on the left side, indicating more open porosity near the left extrusion inlet. In contrast, the lowest water absorption values were observed on the right segments, suggesting progressive densification, potentially followed by edge cooling or localized moisture retention. Firing shrinkage exhibited an inverse pattern, with the lowest values on the left side of the clay blank, further supporting the presence of early-stage porosity and reduced thermal contraction in that region. A slight, gradual increase toward the right side is found consistent with thermal accumulation or compaction downstream. The central zones (left-centre, middle central, and right-centre) act as transitional buffers and the most stable zones, confirming a gradient in both
WAp and
FSp across the extrusion width. The outer lines show edge-related anomalies.
This apparent contradiction—where the left side of the
plastica, which experienced the highest mechanical consolidation during extrusion, also shows slightly elevated water absorption—suggests that consolidation alone does not guarantee reduced porosity [
49]. While mechanical pressure near the extrusion inlet likely compacted the clay mass, it may have simultaneously disrupted the pore structure or induced microcracking, especially if the shaping moisture (
SM) was unevenly distributed. Such localized stress could lead to the formation of open pores that remain accessible during water absorption testing, despite the overall densification. Moreover, the extrusion inlet zone is typically subject to complex flow dynamics, including shear gradients and potential backpressure effects, which may cause anisotropic compaction. If the consolidation was uneven—i.e., more lateral than vertical—it could result in a denser macrostructure but retain micro voids aligned with the extrusion direction [
50]. This would explain the slightly higher water absorption on the left side, despite its role as the most compressed region. In contrast, the right side of the
plastica, which shows lower water absorption and higher firing shrinkage, likely underwent gradual densification and thermal accumulation downstream. The sequence favors enhanced packing density and pore closure, especially under conditions where edge cooling limits moisture retention and promotes uniform sintering. The inverse correlation between water absorption and firing shrinkage along the
plastica length highlights the pivotal role of thermal and moisture gradients during extrusion and drying in determining final porosity—surpassing the predictive capacity of mechanical consolidation alone. The variations, mostly detected in
FSp, suggest non-uniform densification during firing, potentially caused by uneven extrusion pressure or moisture gradients and localized anisotropy in particle packing in
plasticas. Peaks in
FSp may indicate zones of higher compaction, while troughs may reflect regions with residual porosity. Conversely,
WAp displays greater consistency across segments, with markedly lower variability compared to
FSp. Notably, segments exhibiting higher
FSp do not consistently correspond to lower
WAp, suggesting that densification alone does not fully account for water behavior. Instead, pore morphology and spatial distribution, shaped by extrusion-induced shear zones, play a key role. These findings reinforce the need for multi-variable modeling, where segmental data can be used to train soft sensors that capture both global and local performance trends.
3.5. Soft Sensors
In this study, three regression approaches were evaluated for predicting the mechanical properties of
plastica and roof tile based on seven input variables: Partial Least Squares (PLS), Support Vector Regression (SVR), and second-order polynomial regression (SOP) with and without Ridge regularization. Model performance varied substantially across outputs and modeling paradigms (
Figure 8). Overfitting was systematically monitored using train-test RMSE comparisons. None of the selected models exhibited significant overfitting, as RMSE differences remained within acceptable bounds and R
2 values were consistent across phases. Drying shrinkage in
plastica (
DSp) and roof tile (
DSr), as well as firing shrinkage in roof tile (
FSr), appeared difficult to model, with all approaches yielding R
2 < 0.30, suggesting weak correlations or noisy measurements. Although measurement positions were marked using a digital caliper to minimize edge irregularities, variability in shrinkage values may still arise (
Table 4). Descriptive statistics revealed that
DSr values exhibit a broader spread (4.15–7.40%, SD ≈ 0.57) compared to
DSp (5.40–6.85%, SD ≈ 0.32), indicating higher measurement variability. The cutting of moist clay blanks may introduce irregular edges, complicating precise measurement despite the use of caliper-marked reference points.
A similar pattern is observed for firing shrinkage. While FSp values remain relatively stable (0.50–1.45%, SD ≈ 0.22), FSr shows extreme variability (0.19–9.92%, SD ≈ 1.42). The narrow range of FSp reflects the more homogeneous behavior of plastica segments under firing, whereas the wide spread of FSr suggests that roof tiles are more sensitive to local heterogeneities. Such variability complicates predictive modeling, as FSr values are influenced not only by intrinsic material properties but also by subtle process irregularities that were not explicitly monitored.
Correlation analysis further confirmed weaker intrinsic relationships between DSr/FSr and the recorded input variables, suggesting that additional descriptors—such as spatially resolved drying data, pressing uniformity indices, or firing atmosphere monitoring —are needed to capture the underlying mechaniSMs. On the other hand, the rest of the outputs related to plastica and roof tile reached R2 above 0.80 for many of the chosen models, confirming that the framework is robust for most performance indicators, while DSr and FSr remain challenging targets requiring extended datasets and refined descriptors.
For the sake of ease of interpretation and further usage, the accent was to test PLS, SOP, and SOP + Ridge models. Although SOP models—with or without Ridge regularization—yielded comparable R2 and RMSE values, they consistently failed to produce physically meaningful outputs when applied to real, unstandardized input data. Removing quadratic terms and transferring the highly influential terms to logarithmic functions again did not give sufficiently good results.
In contrast, the PLS models not only maintained predictive consistency but also translated reliably into real-world units, yielding outputs that align with expected physical behavior. This reliability in practical recalculation is critical for diagnostic modeling, and it reinforces the decision to prioritize PLS over more complex polynomial formulations. Rather than pursuing endless structural variations within SOP, which often introduce interpretational noise, the PLS approach offers a stable, interpretable, and physically grounded framework that supports both scientific clarity and operational applicability. Beyond R
2 and RMSE, PLS was favored for its stability under multicollinearity, robustness to scaling, and interpretability of latent variables. SVR and SOP models showed higher sensitivity to noise and scaling, making PLS more suitable for industrial deployment. Thus, the adequate PLS models for
plastica are presented in the following equations (Equations (7)–(9)):
In the case of roof tile, the most optimal calculations may also be obtained by the PLS model for (Equations (10) and (11)):
To assess the influence of input variables on output behavior, a Variable Importance in Projection (VIP) analysis was conducted on the best-performing PLS models (
Figure 9). The results identified
CCC—the total carbonate content—as the most influential factor affecting the behavior of
plastica and roof tiles during firing. This marks a shift from earlier analyses, such as PLS-DA and pairwise correlations, where shaping moisture (
SM) was consistently ranked as the dominant contributor. The difference arises from the modeling approach: while PLS-DA and correlation analysis capture direct associations or group separations, PLS regression integrates multivariate structure and latent interactions [
51], allowing
CCC’s systemic influence to emerge more clearly.
SM remains the second most influential variable, but its relative importance is now contextualized within a broader predictive framework that accounts for collinearity and cross-variable effects.
CCC can exert a stronger physical influence on ceramic behavior than
SM, particularly during firing. While
SM primarily affects plasticity and compaction during extrusion,
CCC governs irreversible chemical and structural transformations. During firing, carbonates decompose and release CO
2, altering the microstructure by creating transient porosity, modifying densification rates, and influencing sintering dynamics. Importantly,
CCC is not perfectly uniformly distributed—variations in grain size and spatial concentration lead to localized effects such as uneven expansion, pore formation, or bloating. These heterogeneities introduce nonlinear behavior that
SM cannot replicate. In PLS models, which capture latent interactions and multivariate structure,
CCC’s systemic impact becomes more visible, influencing multiple outputs simultaneously.
SM remains influential, especially in shaping-related shrinkage and initial pore formation, but its effects are more reversible and context-dependent.
CCC, by contrast, acts as a deeper structural driver, linking chemical composition to final performance through mechanisms that persist beyond the shaping stage. This explains why
CCC emerges as the dominant predictor in physically meaningful models, even when earlier analyses—based on direct correlations or PLS-DA—highlighted
SM due to its immediate mechanical relevance.
Residuals were computed in the physical space, representing the difference between measured output values and model predictions expressed in real units (
Figure 10 and
Figure 11). To identify extreme deviations, a dynamic threshold was applied: any residual exceeding two times the standard deviation of the residual distribution (residual > 2σ) was classified as extreme. This approach allows the definition of extremity to adjust to the variability specific to each output variable.
In this context, residuals carry direct physical meaning, as they quantify the prediction error in the same units as the target property. Rather than abstract statistical artifacts, they reflect the model’s ability to reproduce real-world measurements. Their magnitude and distribution provide insight into diagnostic reliability, sensitivity to input variation, and potential limitations in capturing underlying physical mechanisms.
Residual plots for
FSp,
WAp,
Sp,
WAr, and
Sr obtained through 5-fold cross-validation reveal distinct patterns of prediction error for each output (
Figure 10 and
Figure 11). Extreme residuals (≥2σ) were present across outputs, but affected samples differed, with only occasional recurrence of the same specimen in multiple variables. This suggests that errors are not tied to a single input configuration but rather reflect localized variability, measurement noise, or specimen-specific physical factors.
Although each series shares identical input values, the specimens were cut into longitudinal tracks along the extrusion direction, with segments 1, 6, 11, and 16 forming the leftmost track, and segments 5, 10, 15, and 20 forming the rightmost (
Figure 2). This spatial segmentation allows for the investigation of whether residual extremes cluster along specific tracks—potentially revealing physical gradients, edge effects, or structural asymmetries in the extrusion process.
When residual extremes are mapped to their segment positions, certain patterns emerge (
Figure 12):
Segment 2 (first track adjacent to the leftmost) appears as extreme in sample 2 (S1) for WAp and WAr, and in sample 82 (S5) for Sr.
Segment 3 (central track) is extreme in sample 123 (S7) for WAp.
Segment 13 (central track) is extreme in sample 133 (S7) for WAp.
Segment 4 (right-central track) is extreme in sample 84 (S5) for Sr.
Segment 14 (right-central track) is extreme in sample 34 (S2) for Sp, sample 54 (S3) for FSp, and sample 114 (S6) for WAp.
Segment 19 (right-central track) is extreme in sample 139 (S7) for WAp and Sp, and in sample 59 (S3) for FSp.
Segment 5 (rightmost track) is extreme in sample 25 (S2) for FSp.
Segment 15 (rightmost track) is extreme in sample 115 (S6) for WAp.
Segment 20 (rightmost track) is extreme in sample 80 (S4) for Sr.
Figure 12.
Segment positions and residual extremes in the direction of extrusion (FSp—firing shrinkage of plastica, WAp and WAr—water absorption of plastica and roof tile, and Sp and Sr—saturation of plastica and roof tile).
Figure 12.
Segment positions and residual extremes in the direction of extrusion (FSp—firing shrinkage of plastica, WAp and WAr—water absorption of plastica and roof tile, and Sp and Sr—saturation of plastica and roof tile).
Mapping residual extremes to segment positions along the extrusion width (
Figure 12) revealed systematic spatial clustering. Extremes appeared more frequently in right-central and rightmost tracks (segments 14, 15, 19, 20, and 5), while leftmost and central tracks showed fewer anomalies. This spatial pattern indicates that prediction errors are not solely random but linked to physical asymmetries in the extrusion process. Localized flow resistance, edge effects, uneven compaction, or gradual die wear may contribute to these deviations, introducing heterogeneity in pore structure and water transport despite identical input values across series.
Residual extremes indicated a non-random spatial distribution. In extrusion systems, localized flow resistance and die misalignment are known to generate asymmetric pressure fields, which can lead to uneven compaction and deformation gradients across the extruded body. Literature on extruder rheology confirms that shear stresses are not uniformly distributed across the die width, with peripheral zones often experiencing higher resistance due to wall friction and imperfect lubrication. Progressive die wear can introduce subtle geometric deviations that exacerbate flow asymmetry, particularly toward the right side of the press head. These mechanistic factors provide a plausible explanation for the observed clustering of residual extremes and justify the inclusion of positional variables and tooling condition indicators in future models.
This interpretation is consistent with firing shrinkage observations, where certain roof tile segments exhibited elevated shrinkage under uneven pressure distribution [
52]. Capillarity data likewise reinforce the influence of forming method on microstructural uniformity: extrusion tends to yield more variable pore networks, while pressing improves consistency but may introduce anomalies if mechanical components degrade. These findings underscore the importance of routine inspection and maintenance of press tooling to ensure stable compaction and reliable water transport dynamics throughout the ceramic body [
53].
Overall, the residual analysis demonstrates that prediction errors are output-specific yet also exhibit systematic spatial clustering. Segment position within the extruded body plays a decisive role in residual variance, highlighting the need to incorporate positional descriptors and tooling condition indicators in future models. Such refinements could reduce unexplained error and enhance predictive reliability by capturing the physical asymmetries inherent in extrusion mechanics.
4. Conclusions
This study investigated the causes and patterns of longitudinal deformation in ceramic clay blanks during the extrusion of roof tiles, focusing on physically interpretable predictors and reproducible modeling strategies. Over the course of seven weeks, seven production series were monitored using a newly installed extruder screw. Each series included clay blanks and roof tiles, segmented into 20 sub-specimens per series along the extrusion direction. Significant shortening of clay blanks was observed during shaping, prompting a detailed diagnostic analysis.
Measured input variables included shaping moisture (SM), total carbonate content (CCC), granulometric index (GInd), and additional physical parameters such as asymmetry index (AInd), central shortage index (CSI), total shrinkage ratio (TSR), and firing temperature (FT). Output variables focused on deformation indices: longitudinal shrinkage before and after firing, water absorption (WA), and saturation (S). A range of statistical tools was applied—including correlation analysis, principal component analysis (PCA), and partial least squares discriminant analysis (PLS-DA)—to identify dominant predictors and interpret shrinkage behavior. Simple regression models were developed using physically grounded inputs and implemented in a computationally lightweight format suitable for on-site use, relying on internal memory without cloud infrastructure.
PLS-DA ranked shaping moisture (SM), granulometric index (GInd), and carbonate content (CCC) as the most dominant predictors for CSI class separation.
Segmental analysis showed that even within a single tile or blank, performance metrics can vary significantly. Mapping residuals across longitudinal tracks revealed that extreme deviations tend to cluster in right-central and rightmost segments, suggesting physical asymmetry in the extrusion process. These variations were not explained by input values, which remained constant across series, but rather pointed to intra-series variability, local structural effects, or measurement uncertainty. This highlights the importance of spatial diagnostics in addition to global modeling.
The results also pointed to specific challenges related to both the extruder and the press, including asymmetries in pressure distribution and inconsistencies in head geometry. Observed shrinkage patterns and capillarity effects suggest that the press head may require redesign or recalibration to ensure uniform shaping conditions. These findings reinforce the need for integrated diagnostics that combine material properties, process parameters, and spatial analysis to achieve dimensional stability and reproducible performance.
The developed models are valid only under the specific conditions of the studied factory, including its raw materials, equipment, and process settings. They are presented as diagnostic templates, not universal solutions. Due to differences in clay composition, forming methods, and firing regimes, each facility must develop and validate its own models tailored to its operational context. However, the underlying methodology—based on physically interpretable inputs, diagnostic logic, and transparent modeling—is transferable. It can be adapted to other industrial sectors where local decision-making, reproducibility, and low computational overhead are essential.
Importantly, the study highlights that different analytical methods yield complementary insights. Correlation analysis revealed SM as the most interconnected input, strongly associated with other variables. PCA emphasized latent contrasts, with CCC and CSI loading negatively and GInd positively on the main variance axis. PLS-DA, in turn, ranked SM, GInd, and CCC as the most influential predictors for CSI classification. These differences underscore that no single method provides a complete picture: correlation captures direct relationships, PCA reveals structural variance, and PLS-DA indicates latent-variable contributions to class separation.
Although full-scale industrial deployment has not yet been implemented, preliminary manual trials during extrusion runs confirmed the feasibility of recording and processing the required indices. These exploratory tests demonstrated that the soft sensor can operate alongside existing monitoring routines without disrupting production. Formal pilot deployments, including integration into SCADA or PLC environments, are planned for future work. In parallel, simulation-based validation using open-source frameworks such as Dyssol is foreseen to test adaptability under varying process conditions.
In conclusion, the study demonstrates that physically grounded, segment-aware modeling can reveal hidden sources of variability and guide targeted interventions. Future research should focus on integrating spatial diagnostics with real-time sensor data, expanding the input space to include structural and thermal parameters, and validating the methodology across different ceramic systems. The framework developed here offers a pragmatic path toward context-aware modeling in industrial environments where precision, transparency, and adaptability are critical.