Article

Study on the Fracturing and Hit Behavior of Shale Reservoir Parent–Child Wells

1
State Key Laboratory of Shale Oil and Gas Enrichment Mechanisms and Effective Development, Beijing 100083, China
2
School of Petroleum Engineering, China University of Petroleum (East China), Qingdao 266580, China
3
Exploration and Development Research Institute, Shengli Oilfield Company, SINOPEC, Dongying 257015, China
4
College of Petroleum Engineering, Yangtze University, Wuhan 430100, China
*
Author to whom correspondence should be addressed.
These authors contributed equally to this work.
Processes 2026, 14(2), 196; https://doi.org/10.3390/pr14020196
Submission received: 8 December 2025 / Revised: 31 December 2025 / Accepted: 4 January 2026 / Published: 6 January 2026
(This article belongs to the Section Energy Systems)

Abstract

To enhance production efficiency, shale gas development often employs tighter well spacing and aggressive fracturing strategies. However, these approaches can result in well interference, where overlapping fracture networks between adjacent wells adversely affect gas production. This study introduces a comprehensive evaluation method for assessing fracture interference, with a specific focus on the role of Repeatedly Stimulated Volume (RSV). By integrating fracture network analysis with fracturing fluid migration modeling, we propose a combined static and dynamic risk assessment framework. The results demonstrate that RSV is a critical indicator of fracture interference—larger RSV values signify greater fracture overlap and intensified fluid migration between wells. Key engineering parameters influencing RSV are identified, including well spacing, fluid volume, and fracture design. Supported by real-time monitoring techniques such as microseismic events and pressure data, our dynamic assessment approach enables proactive management of interference risks. This work offers practical insights for optimizing shale gas development, allowing for improved production efficiency while mitigating interference-related drawbacks.

1. Introduction

As shale gas exploration and development in China continue to advance, the well-factory development model—combined with multi-stage, multi-cluster horizontal well stimulation—has become a key approach for exploiting deep shale gas reservoirs [1,2,3]. To enhance the economic returns of shale gas development, the industry commonly adopts aggressive strategies such as reducing well spacing and increasing fracturing intensity. However, these practices often lead to frequent fracturing interference between parent and child wells [4,5]. Such interfaces can significantly impair the stable production of adjacent wells. The geological complexity of shale formations—characterized by natural fractures, small faults, and other structural weaknesses—provides favorable pathways for fracturing fluid migration and pressure communication. Field observations indicate that interface events are primarily categorized into fracturing–fracturing and fracturing–production types, with the former being dominant [6]. Statistical data further reveal that the production performance of most wells affected by interfaces fails to meet the expected stimulation outcomes, posing serious challenges to the economic viability of shale gas development [7].
Domestic and international scholars have extensively investigated the mechanisms, identification technology, and prevention measures of inter-well interference in shale gas development. Regarding the mechanism, the synchronous production of wells within the same development unit can effectively mitigate interference caused by pressure drawdown from early production in adjacent wells [5,8]. However, due to practical constraints in shale oil fracturing development, achieving synchronous development of adjacent wells is often impractical. Formation energy depletion and stress disturbance are recognized as the two primary causes of inter-well interference. Production from the parent well leads to a non-uniform reduction in reservoir pore pressure around its induced hydraulic fractures. This pressure change influences the daughter well, attracting fracture expansion from high-stress areas towards the parent well’s low-stress regime [9,10]. Recent studies have further elucidated the dynamic mechanisms of these interactions. For instance, Carpenter (2023) highlighted that parent-well fracture hits are often driven by complex poroelastic stress changes that alter the propagation path of infill well fractures [11]. Furthermore, Liu et al. (2025) utilized a damage-based fully coupled DFN model to demonstrate that zipper fracturing sequences significantly influence the intensity of fracture-driven interactions [12]. Experimental work by Li et al. (2025) has also quantified the pressure response characteristics during these hits, revealing that the depletion zone around parent wells acts as a ‘stress sink,’ aggressively attracting hydraulic fractures from daughter wells and intensifying cross-flow risks [13].
Current research on cross-flow—a key manifestation of inter-well interference—primarily employs a combination of numerical simulation and monitoring techniques. Wang Qiang et al. developed a complex fracture propagation-seepage integrated model using the Finite Discrete Element Method and the Embedded Discrete Fracture Model to study how fracture cross-flow affects the productivity of horizontal shale gas wells [14]. An innovative alternative, the Connection Element Method, utilizes flexible, meshless node representation to replace traditional grid topology. Based on node influence domains, it constructs one-dimensional connection units [15], which provides a rich connectivity map that can clearly identify the occurrence, location (in both parent and daughter wells), and degree of cross-flow.
A variety of technical methods have been developed for cross-flow identification, including surface/downhole pressure gauge monitoring, electromagnetic/radioactive proppant tracing, flowback data analysis, chemical tracers, and microseismic monitoring [16,17,18,19,20,21]. While these technologies offer effective means for detecting inter-well interference, each possesses inherent limitations. In contrast to traditional indicators such as RFO, frac-hit intensity, or pressure interference coefficients, which often provide qualitative, post-facto, or localized assessments [22,23]. The RSV metric proposed in this study offers a fundamental improvement in three key aspects. First, it provides a proactive, spatially quantitative measure of the fracture network overlap volume, enabling a direct pre-assessment of channeling risk based on geomechanical and engineering parameters, rather than relying solely on diagnostic data after interference has occurred. Second, by integrating the spatial extent of overlap (RSV) with the dynamic fluid migration behavior, it establishes a more robust and physically meaningful linkage to production outcomes, such as channeling flow rate and long-term recovery efficiency. Third, the methodology for calculating RSV, based on Discrete Fracture Network (DFN) modeling and real-time data integration, offers operational simplicity for field-scale risk mapping and real-time mitigation, moving beyond the descriptive nature of many existing indicators. Therefore, the novelty lies not in the concept of measuring overlap, but in the introduction of a unified, volumetric, and predictive metric that seamlessly connects static fracture geometry with dynamic interference consequences.

2. Governing Equations for Numerical Simulation of Hydraulic Fracturing

2.1. Numerical Model

Accurate modeling of fracture network expansion and fracturing fluid flow behavior is paramount for predicting the risk of inter-well cross-flow (channeling) during the hydraulic fracturing of shale gas reservoirs. Based on prior work [24], this study establishes a comprehensive numerical model for porous hydraulic fracturing (PHF), specifically adapted to the unique characteristics of shale reservoirs. The model aims to simulate the fracture initiation, expansion, and communication mechanisms under multi-well conditions by coupling fundamental physical processes: rock mechanics, fluid flow, and damage evolution.
The numerical simulations in this study were developed and executed based on the open-source MATLAB 2024b Reservoir Simulation Toolbox (MRST). The model employs a fully coupled finite-volume method to solve the governing equations for fluid flow and geomechanics. The outer boundaries of the reservoir model are set as closed (no-flow) conditions, ensuring no external fluid influx or efflux, thereby isolating the inter-well interference effects within the defined simulation domain. The initial conditions are defined by the reservoir’s original pore pressure and in situ stress state. A sequentially coupled solution strategy is employed: first, the fluid flow and rock deformation are solved implicitly to obtain pressure and width distributions; subsequently, these results are used to calculate the stress intensity factors and the fracture propagation direction explicitly for the current time step. This iterative implicit-explicit scheme ensures a stable solution for the strongly coupled hydro-mechanical process while maintaining computational efficiency.
Hydraulic fracturing involves the complex interplay of multi-physics coupling, encompassing rock deformation, fluid transport, and dynamic fracture propagation. This section outlines the key governing equations based on porous media theory. Shale reservoirs are treated as saturated porous media, where the effective stress state is defined by the Biot theory [25]. It reflects the influence of fluid pressure changes on reservoir stress:
σ = σ α P w I
where σ is the effective stress, σ is the nominal stress, Pw is the pore pressure, α is the Biot constant, and I is the identity matrix. The rock matrix equilibrium equation is expressed as:
V ( σ α P w I ) : δ ε d V = S t · δ v d S + V f · δ v d V
where δε is the virtual strain rate, δv is the virtual velocity field, t is the surface force, and f is the volume force.
The flow of fracturing fluid within the induced hydraulic fracture is characterized by two components: tangential flow along the fracture path and normal filtration (leak-off) into the surrounding matrix [26]. Assuming the fracturing fluid behaves as an incompressible Newtonian fluid, the principle of mass conservation dictates the following equation:
( ρ w ω ) t + · ( ρ w q ) = Q ( t ) ( q t + q b )
It describes the mass balance within the fracture, where the rate of fluid accumulation and flow along the fracture equals the injection rate minus the leak-off losses to the formation.
Where ω is the fracture width, ρw is the fluid density, Q(t) is the injection rate, and qt and qb are the filtration velocities of the upper and lower surfaces, described using the Carter filtration model:
q = 2 C L t t 0
where q represents the filtration velocity. CL is the leak-off coefficient. t is the current time. t0 is the time when the fracture face is exposed to the fluid.
It demonstrates the fluid leak-off velocity, which decreases with the square root of exposure time, a characteristic of filtrate invasion into a low-permeability matrix. To establish a clear connection between the fluid flow and fracture propagation, we introduce the governing equations for fracture extension based on fracture mechanics principles. The circumferential stress at the fracture tip, which controls the direction of fracture propagation, is defined as [27]:
σ θ = 1 2 π r cos θ 2 K 1 cos 2 θ 2 3 2 K 2 sin θ
The equation governs the fracture propagation direction by calculating the stress field near the tip; the fracture extends in the direction where the circumferential stress σθ is maximum.
Where σθ is the circumferential stress (MPa), r is the distance from the fracture tip (m), θ is the angle relative to the fracture plane, and K1 and K2 are the stress intensity factors for Mode I and Mode II fractures (MPa·m0.5), respectively. These factors integrate the effects of fluid pressure and in situ stresses, and are calculated as:
K 1 = 1 2 ( 1 cos 2 α ) p net π a K 2 = 1 2 sin 2 α ( σ x x σ y y ) π a
where pnet is the net pressure in the fracture (MPa), a is the fracture half-length (m), α is the angle between the fracture plane and the coordinate axis, and σxx and σyy are the principal stresses (MPa).
It quantifies the driving forces for fracture opening (K1, related to net pressure) and in-plane sliding (K2, related to shear stress), linking the fluid-mechanical loads to the fracture tip stress state.

2.2. Model Validation

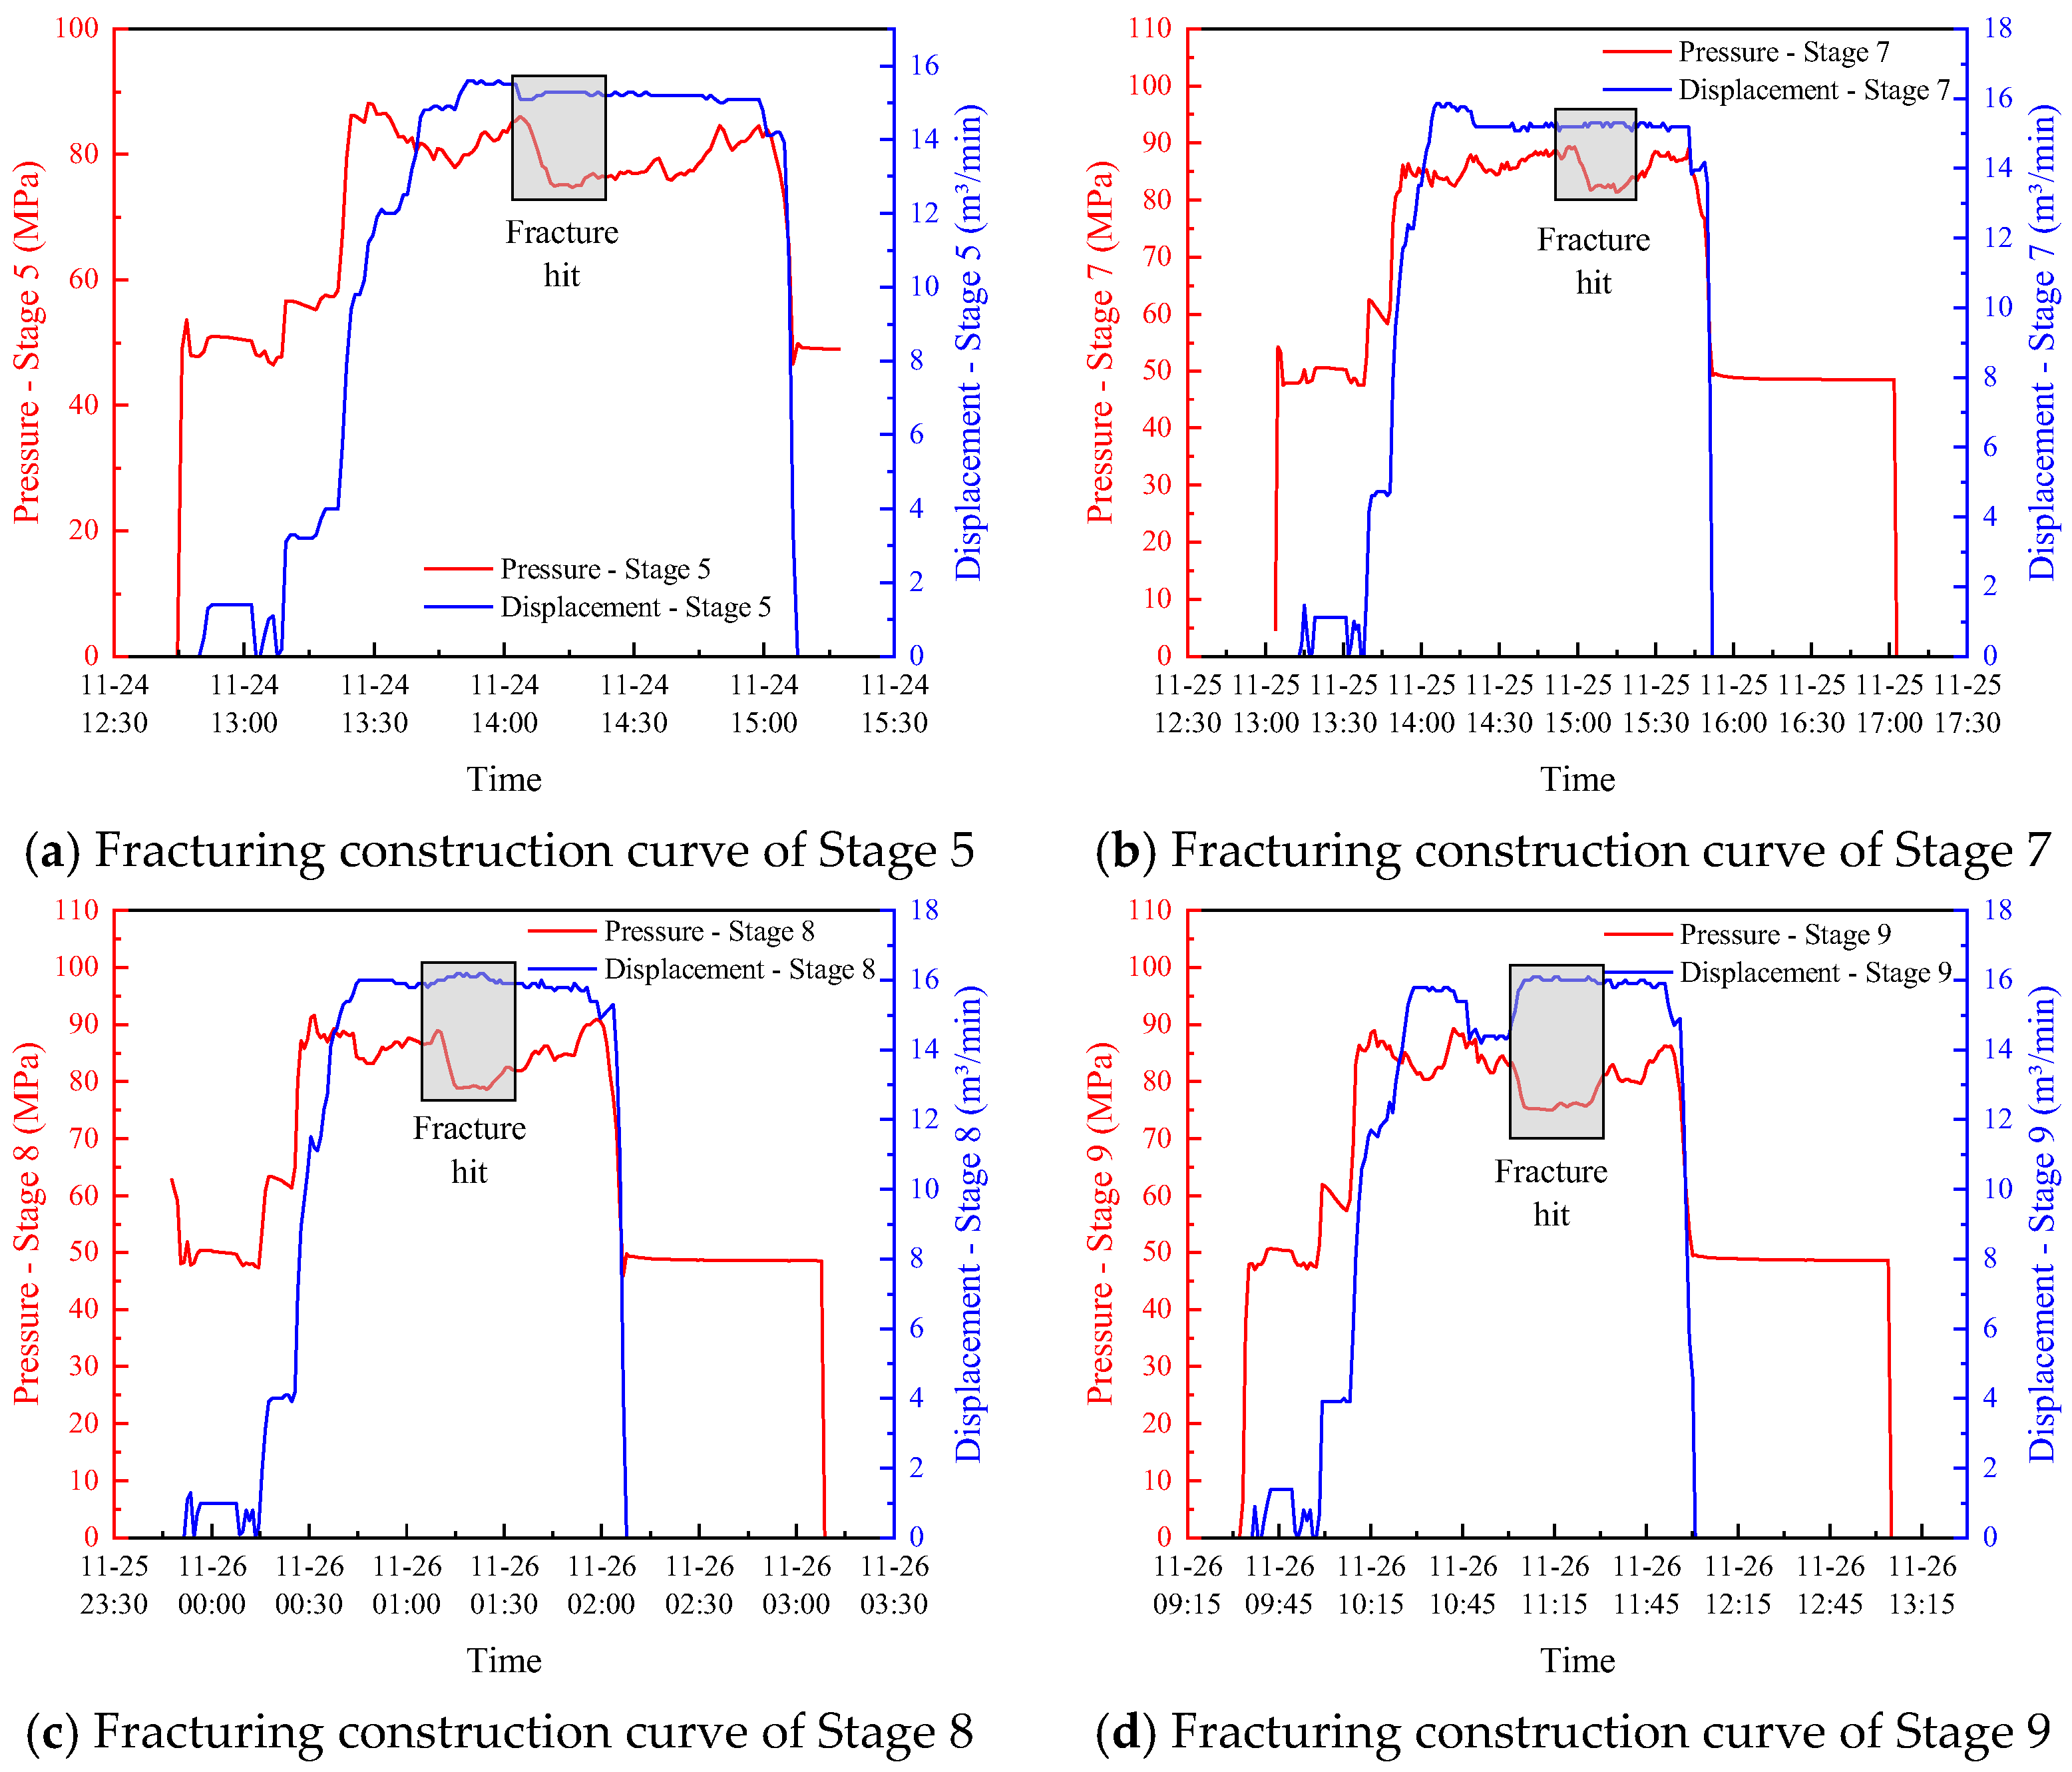
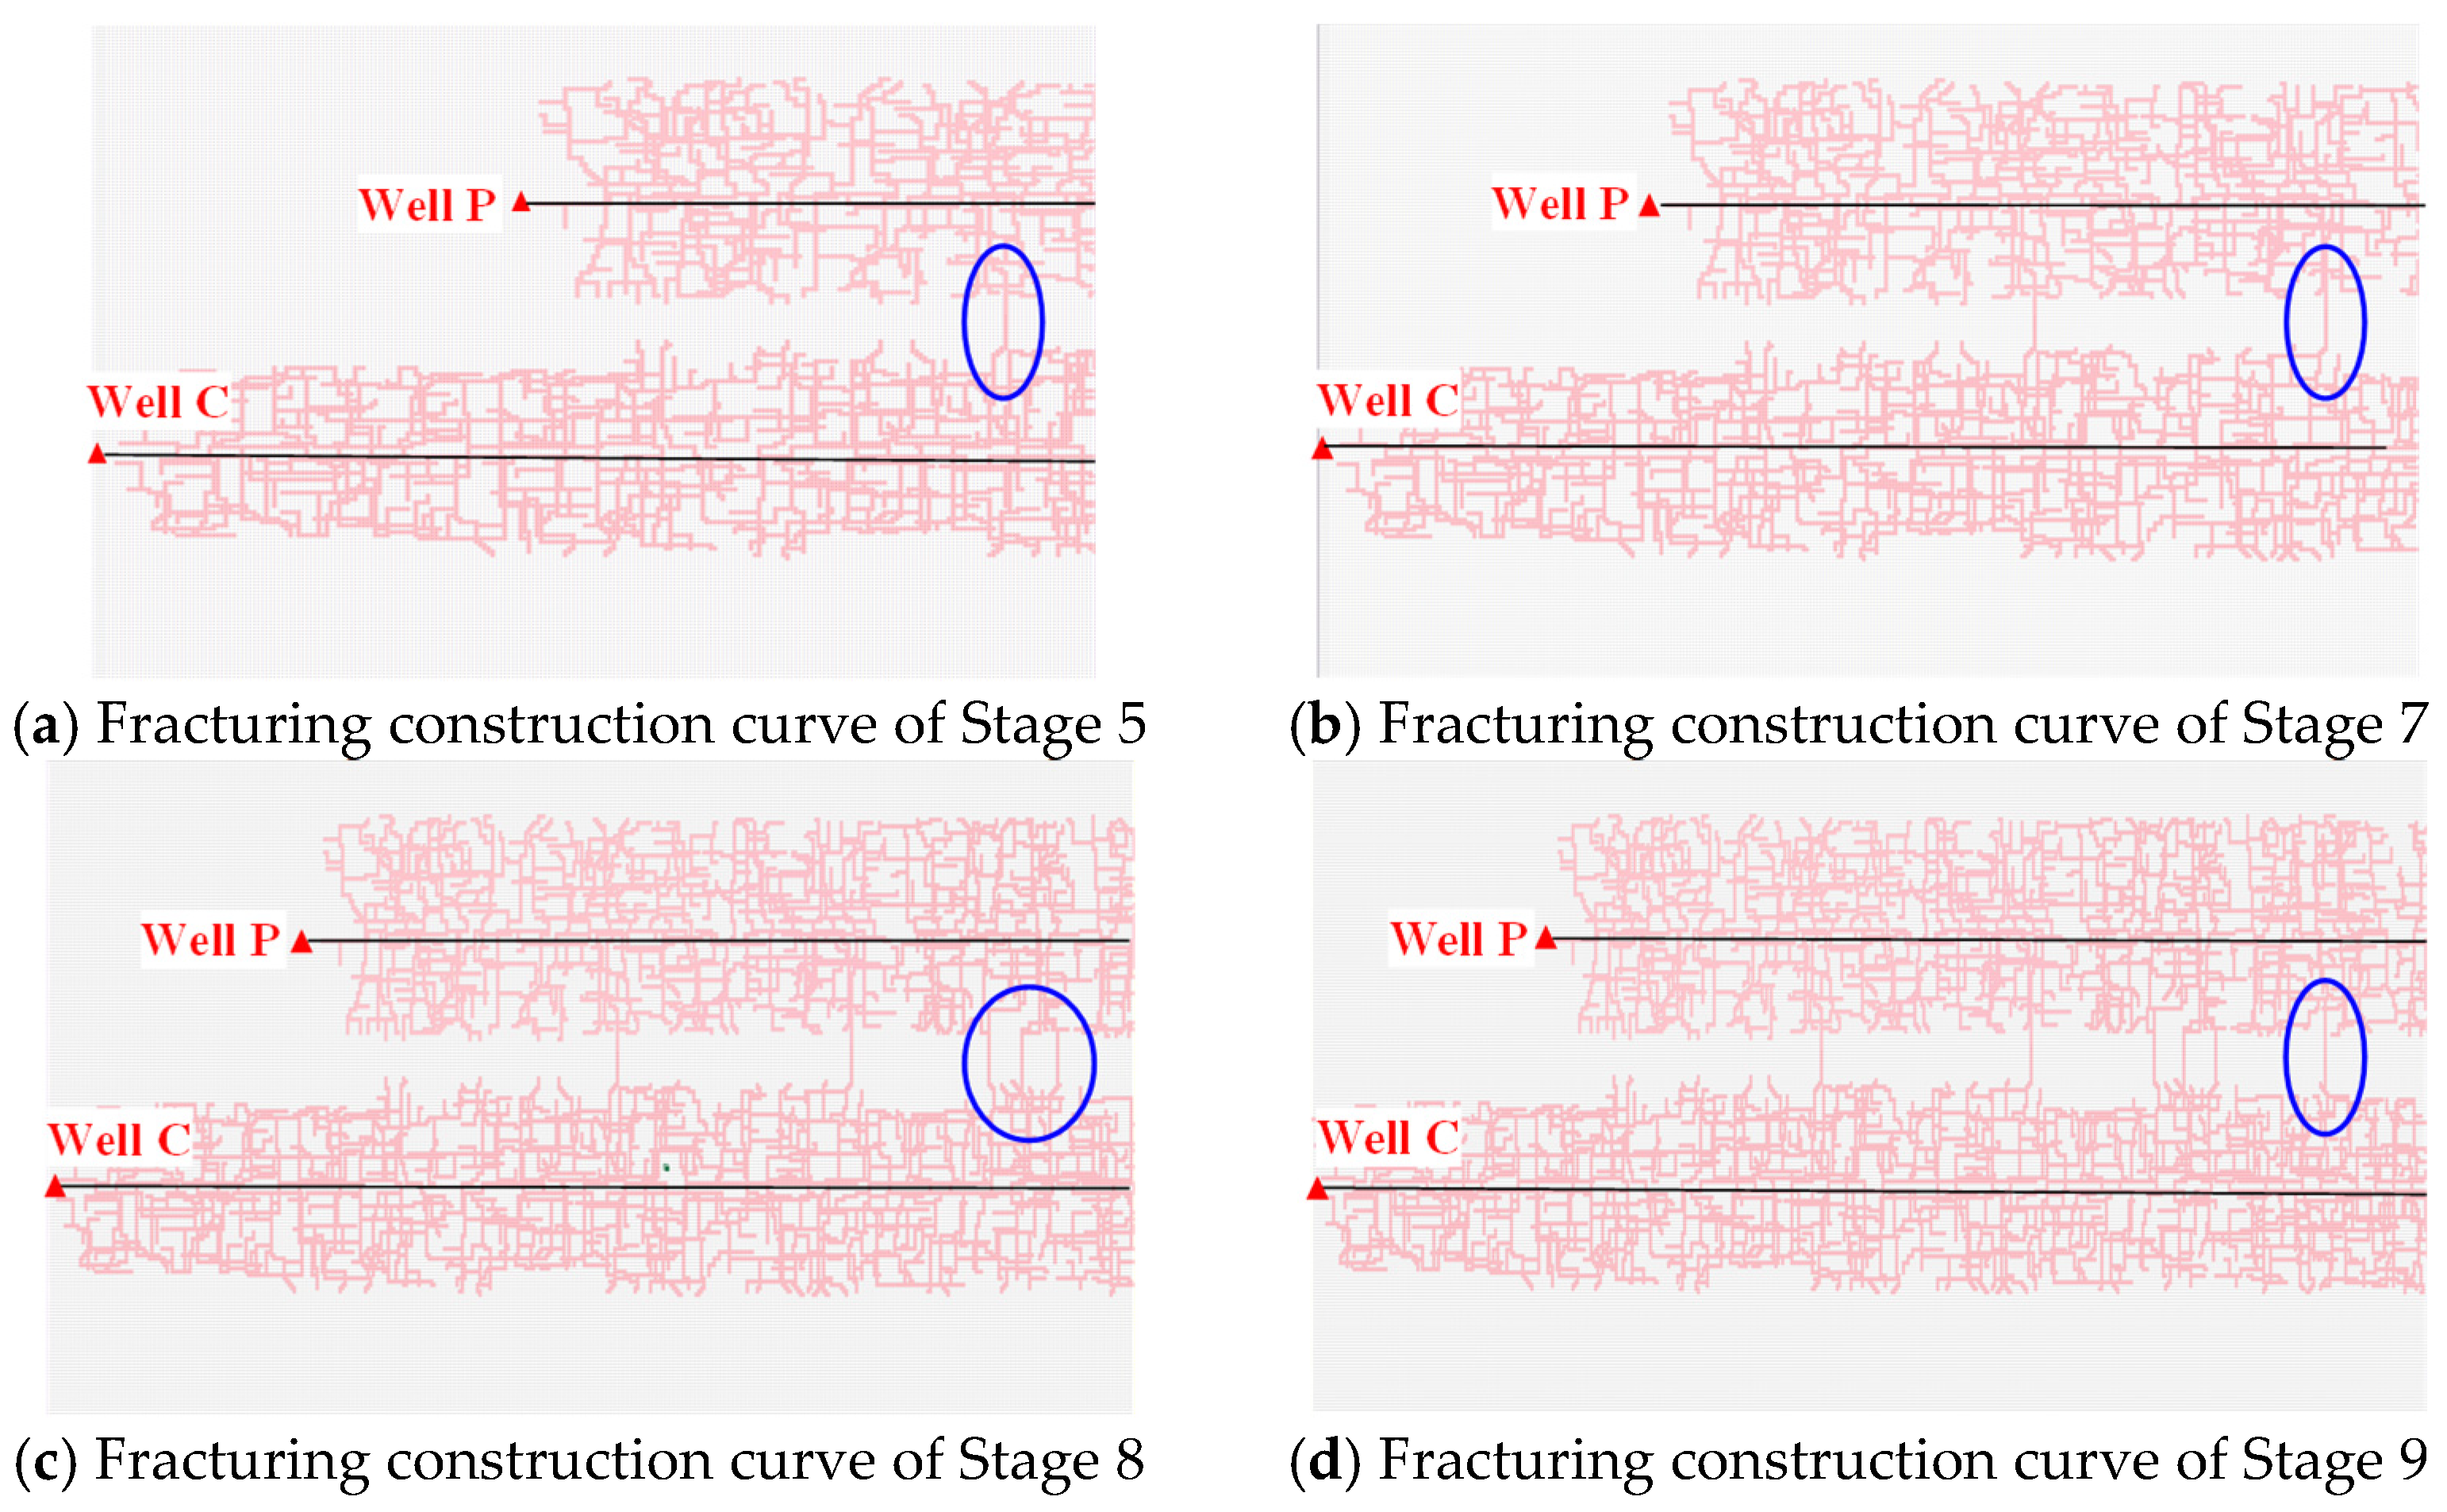
The predictive capability of the developed model was validated against field data from a shale gas development pad. As shown in Figure 1 and Figure 2, the simulated fracture geometry and propagation behavior for the child well (Well C) were compared with the actual fracturing treatment curves and diagnostic results from the parent well (Well P). The key validation metric was the spatial alignment of the simulated fracture network with the pressure response and inferred fracture geometry from the field data. The model successfully reproduced the asymmetric fracture growth towards the pre-depleted zone around the parent well (highlighted by the blue ellipse in Figure 2), a phenomenon directly indicated by the field pressure data. This close match between the simulated fracture propagation pattern and the field-observed interference effect confirms the model’s reliability in capturing the critical stress shadow and pressure depletion interactions essential for this study.
The predictive capability of the proposed RSV-based evaluation methodology was validated against field data. As referenced in the case study, the simulated fracture network geometry for the child well was compared with fracturing data from an actual shale gas pad. The model successfully reproduced the asymmetric fracture growth towards the pre-depleted zone of the parent well, a phenomenon clearly indicated by the field pressure response and fracture construction curve event distribution. This close match between the simulated fracture propagation pattern and field-observed interference effects confirms the model’s reliability in capturing the critical stress shadow and pressure depletion interactions essential for this study.
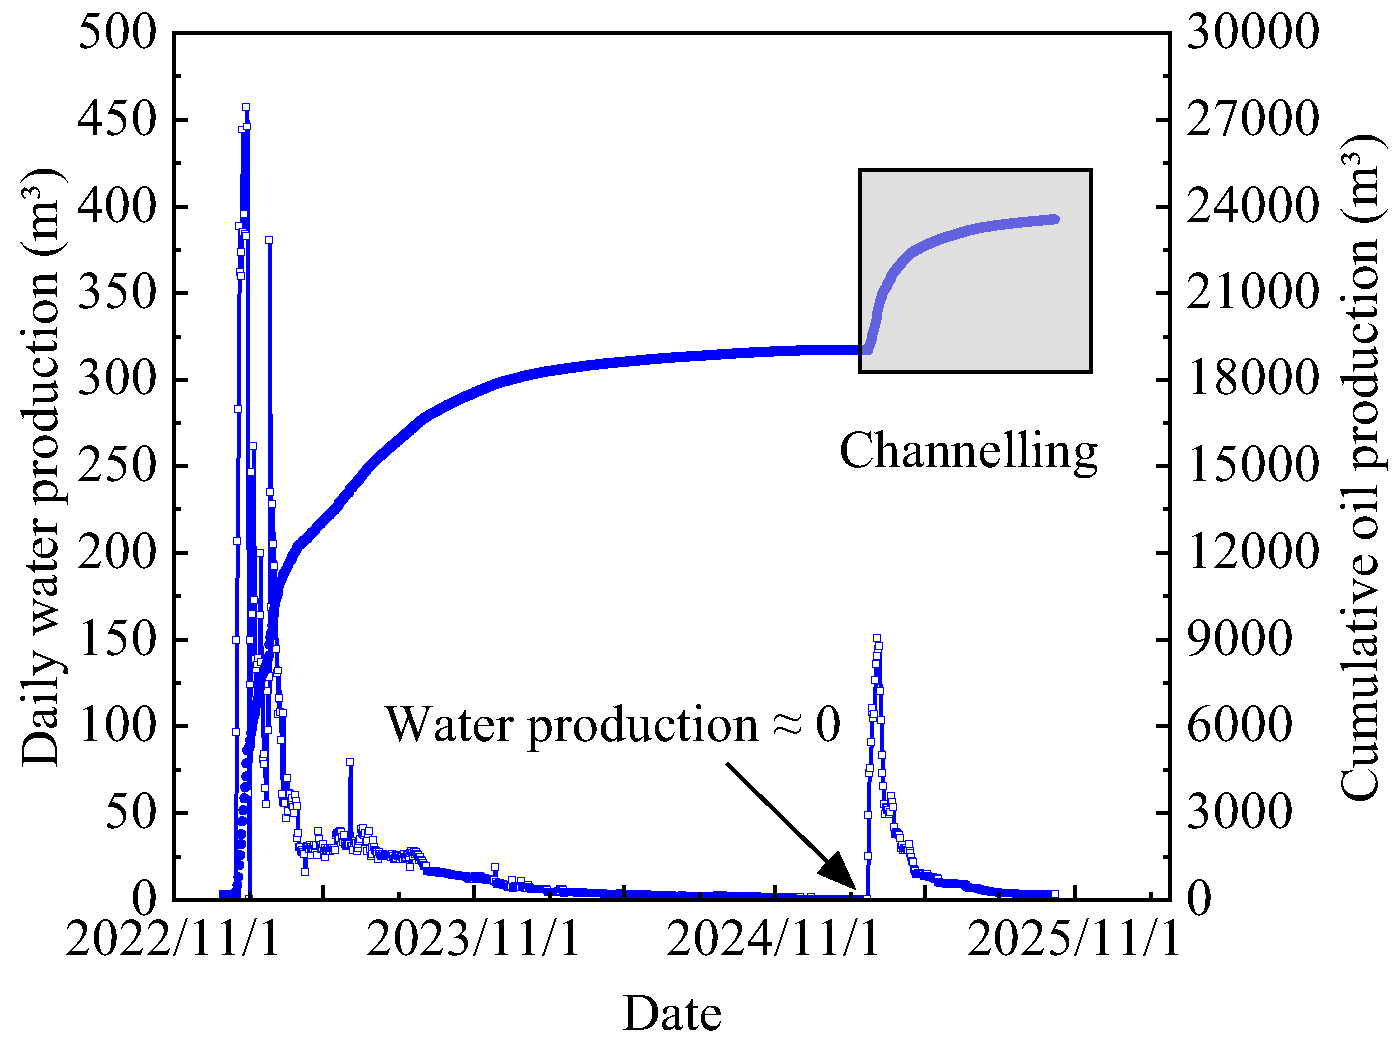
Field Corroboration of Channeling Rates: Direct high-resolution DAS or chemical tracer data were not available for the studied well pair. However, the model’s prediction of significant channeling at high RSV was validated against conventional production data. As shown in Figure 3, the simulated water channeling from the child well to the parent well resulted in a calculated channeled water volume of about 4731 m3. This prediction is corroborated by the field observations from parent well, which showed a marked increase in water production following the child well’s stimulation, with the field-estimated water influx volume being consistent with the simulation. The simulated post-fracturing water saturation increase around the parent well visually aligns with the mechanism inferred from the production response. This agreement between simulated inter-well flow and measured production data provides strong support for the model’s ability to quantify channeling rates.

3. Analysis of Channeling Effect Based on Repeatedly Stimulated Volume

The Repeatedly Stimulated Volume (RSV), which refers to the volume of the overlapping area of the fracture networks created during multi-well fracturing, directly reflects the severity of inter-well fracture channeling. The magnitude of the RSV exhibits a significant positive correlation with the risk of fracturing channeling. Specifically, when the proportion of the Repeatedly Stimulated Volume exceeds 15% of the total stimulated reservoir volume, the risk of severe inter-well fracturing channeling increases significantly [27,28]. This study systematically analyzes the variation in RSV under different engineering parameters and thoroughly investigates its influence mechanism on the fracturing channeling effect.
The formation of the Repeatedly Stimulated Volume (RSV) is principally governed by the synergy between geological and engineering factors [29]. Geological determinants, such as the inherent distribution of the geo-stress field and the degree of natural fracture development, dictate the potential pathways for fracture growth. These factors interact critically with engineering operational decisions, including the chosen well spacing and specific hydraulic fracturing parameters (e.g., injection rate and fluid volume), ultimately controlling the extent of fracture network overlap and, thus, the magnitude of the RSV.
When the fracture extension areas of adjacent wells overlap, a dominant flow channel is established. This preferential pathway causes the fracturing fluid and proppant to flow bypass the target rock volume, leading to a reduced reservoir stimulation effect and potentially serious inter-well interference [30]. Areas characterized by a large RSV frequently correspond to high fluid flow velocity because the overlapping zone acts as a low-resistance, dominant flow channel [31].

3.1. Evaluation Methodology for Channeling Effect Based on Repeatedly Stimulated Volume

This study proposes a comprehensive methodology for evaluating the channeling effect (cross-flow) based on the Repeatedly Stimulated Volume (RSV).
The first step involves establishing a quantitative computational model for the RSV. This model accurately determines the overlapping volume of the fracture networks by integrating data from micro-seismic monitoring, logging interpretations, and core analysis. A Discrete Fracture Network (DFN) modeling technique is utilized to precisely calculate the fracture network overlap volume using the following integral expression:
RSV = Ω overlap ϕ f ( x ) d V
where RSV is the repeatedly stimulated volume, ϕf(x) is the fracture density function at a given spatial location x, which accounts for the local intensity of stimulation; Ωoverlap is the volume of the fracture overlap region between adjacent wells.
The fracture density function, ϕf(x), is defined as the total fracture area per unit volume within a representative elementary volume (REV) centered at location x. The function is formulated as a kernel density estimate:
ϕ f ( x ) = 1 N h 3 i = 1 N K x x i h
where N is the total number of microseismic events, x is the location of the i-th event, K is a Gaussian kernel function, and h is a bandwidth parameter representing the spatial resolution and uncertainty of the microseismic data. This formulation allows us to translate discrete microseismic event locations into a continuous spatial distribution of fracture intensity, which is then integrated over the overlap volume Ωoverlap to compute the RSV.
The sufficiency of microseismic data resolution for an accurate RSV calculation was assessed via a sensitivity analysis. Microseismic event locations have an inherent uncertainty, typically ±10–20 m, due to limitations in velocity modeling and signal processing. Given that the effective stimulation range of hydraulic fractures in shale is substantial (often exceeding 100–150 m in the lateral direction), the RSV calculation is robust to the typical resolution of field microseismic data. This low sensitivity confirms that standard microseismic monitoring provides data sufficient for engineering-grade assessment of inter-well interference risk.
Based on the Ratio of Fracture Overlap (RFO), which is the proportion of the Repeatedly Stimulated Volume to the Total Stimulated Volume (TSV), the channeling risk is quantitatively classified into three distinct levels:
Finally, a dynamic evaluation system is established to allow for real-time risk management. By continuously monitoring micro-seismic events and pressure responses during the fracturing process, the RSV calculation model (Equation (7)) is dynamically adjusted. This enables the real-time alerting and proactive control of fracturing channeling risk.
The RFO thresholds provided in Table 1 are intended primarily to demonstrate the proposed risk assessment framework. As correctly noted, deriving universally applicable thresholds requires statistical analysis of extensive field frac-hit datasets or Monte Carlo simulations that incorporate geological and engineering uncertainties. The values here are based on the deterministic simulations within the scope of this work. Future research will focus on applying this framework to a larger set of field cases to perform the suggested statistical analysis and uncertainty quantification, which will lead to more robust, probabilistically defined thresholds.

3.2. Influence of Key Parameters on Repeatedly Stimulated Volume

3.2.1. Effect of Injection Rate

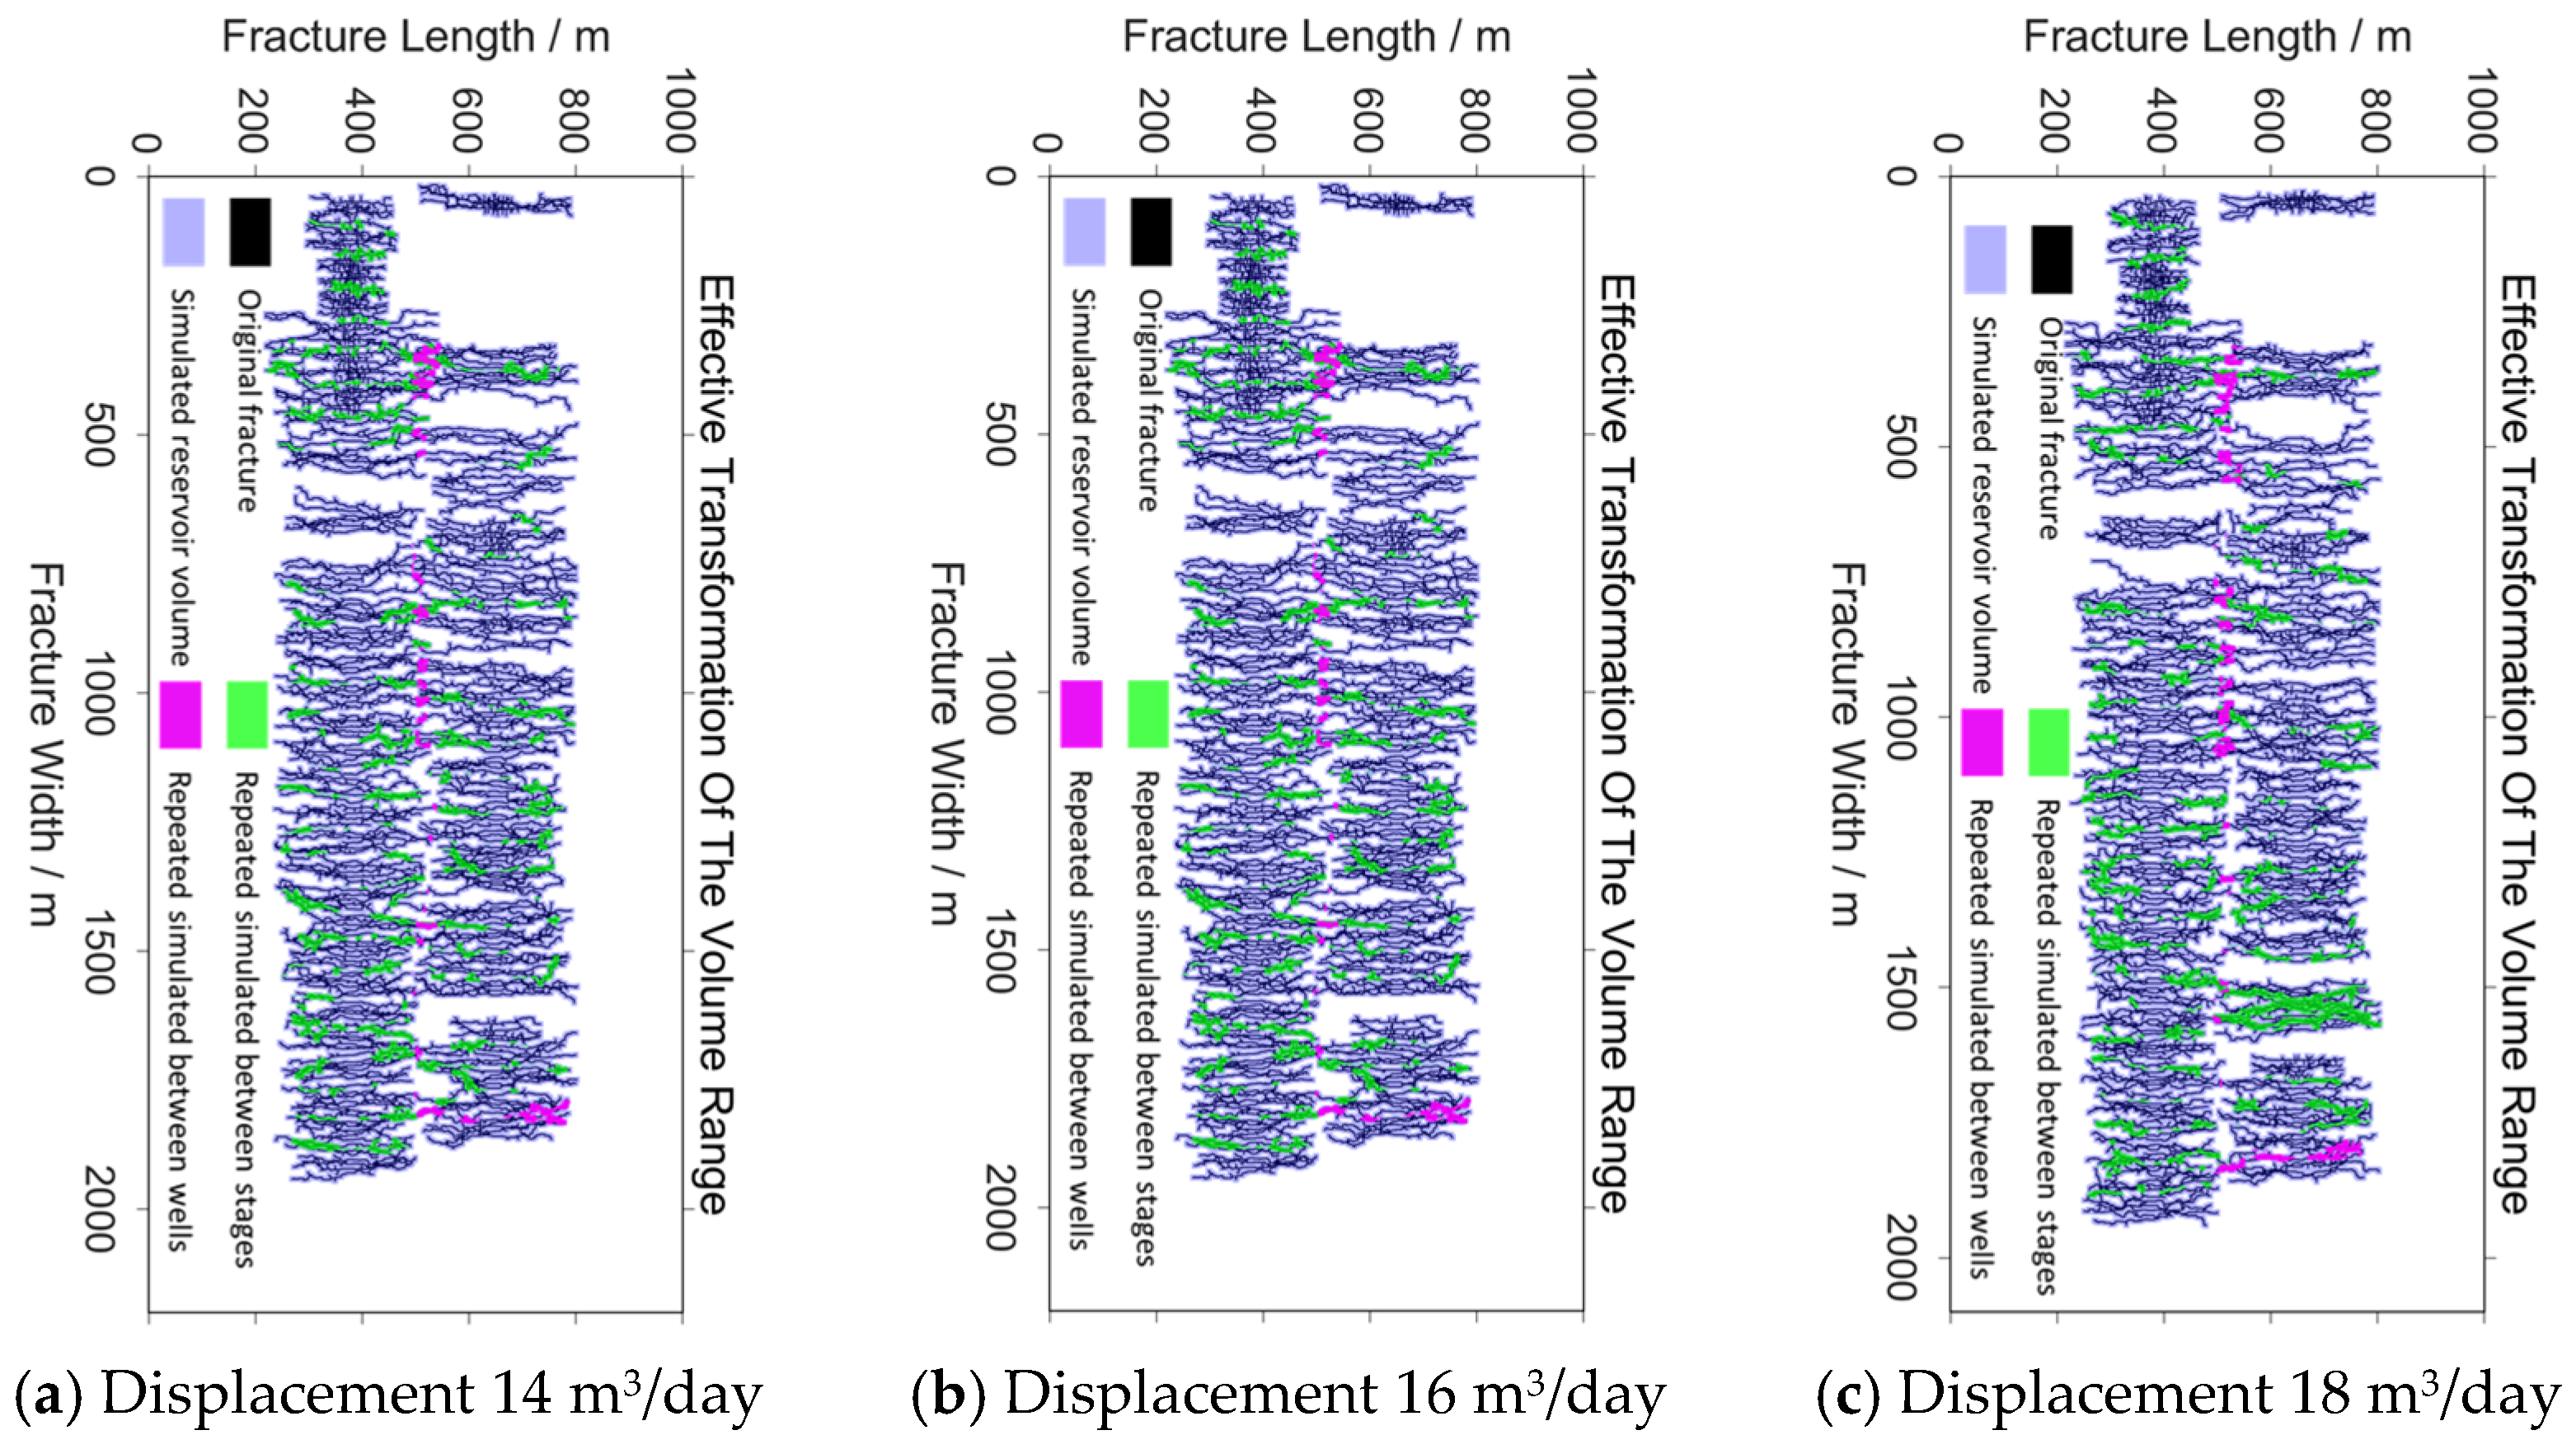
This study investigates the impact of injection rate on fracture network overlap. Simulations were conducted for injection rates of 14, 16, and 18 m3/min. As shown in Figure 4, the absolute Repeatedly Stimulated Volume (RSV) increased from 9.55 × 10⁴ m3 at 14 m3/min to 9.65 × 10⁴ m3 at 18 m3/min. This trend indicates that higher injection rates promote greater fracture extension and network complexity, leading to a larger absolute overlap volume. Conversely, the Ratio of Fracture Overlap (RFO), defined as RSV/SRV, decreased from 15.05% to 14.69% over the same range, as the Total Stimulated Volume (SRV) expanded more rapidly than RSV. This highlights the importance of distinguishing between absolute and relative metrics when assessing interference risks.
The observed trends are specific to the model parameters used in this study, including well spacing of 300 m, homogeneous stress conditions, and fixed fluid volumes. Under these conditions, while higher injection rates increase absolute RSV, the relative risk (RFO) may be mitigated by the proportional growth in SRV. However, this conclusion is context-dependent; variations in geological settings, such as stress anisotropy or natural fracture density, could alter the relationship. Therefore, for practical applications, site-specific simulations are recommended to optimize injection parameters and balance fracture coverage with interference control.

3.2.2. Effect of Fracturing Fluid Volume

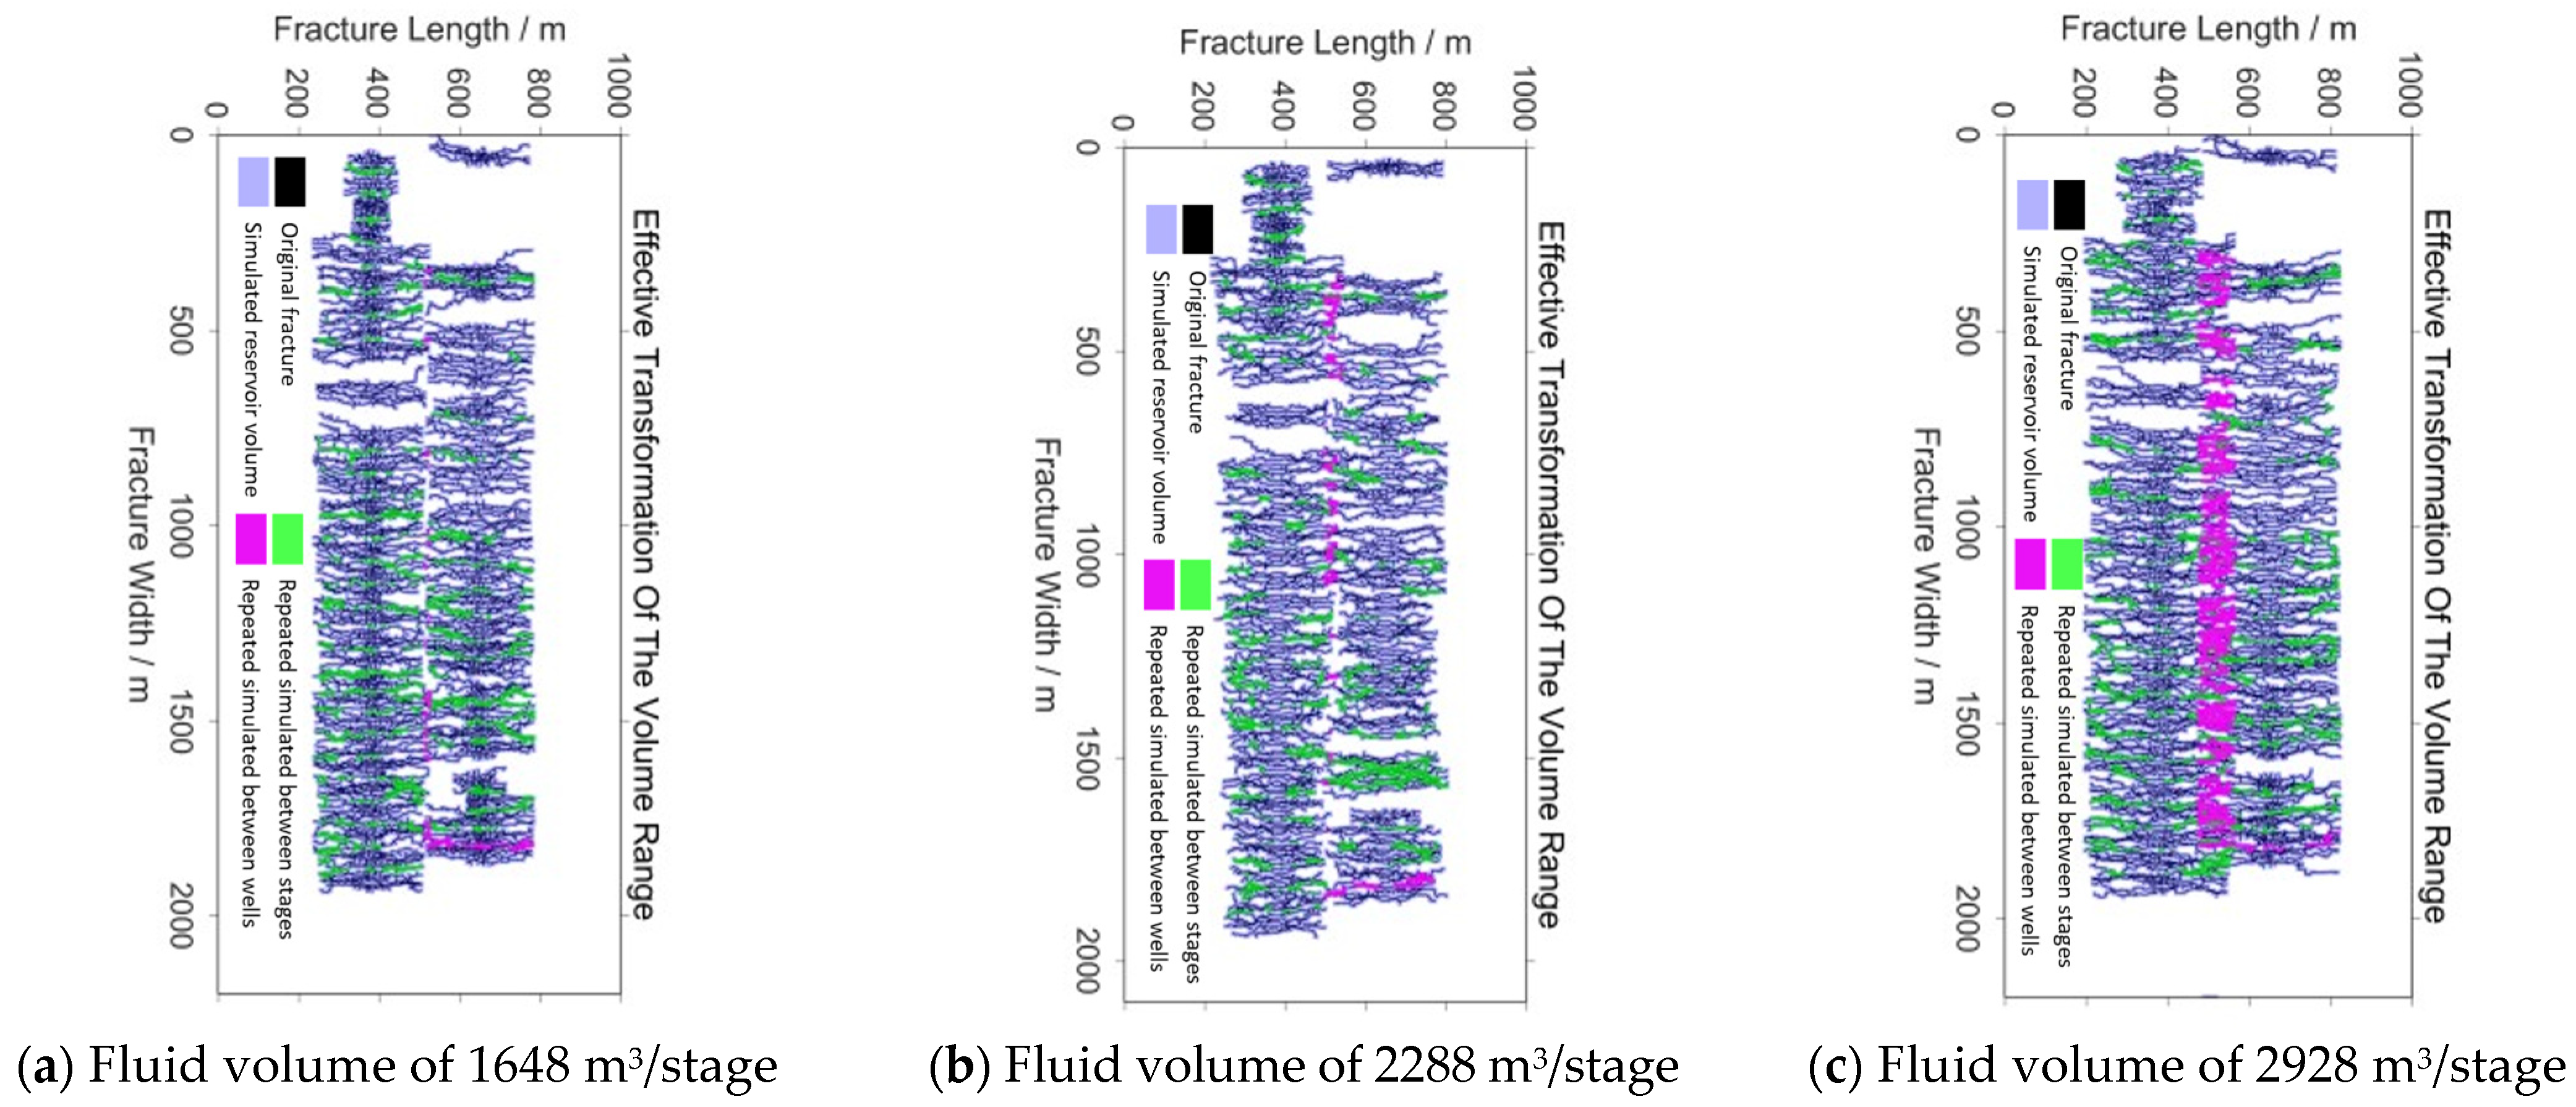
The influence of the total Fracturing Fluid Volume on the RSV exhibits a pronounced nonlinear characteristic, as demonstrated in Figure 5. Initially, increasing the fluid volume from 1648 m3 per stage to 2288 m3 per stage led to a decrease in the RFO from 16.49% to 14.79%. However, when the fluid volume was further increased to 2928 m3 per stage, the RFO experienced a sharp, dramatic increase to 33.31%.
The identified critical fluid volume threshold (approximately 2288 m3/stage) for minimizing RFO aligns with field-optimized design ranges reported for major shale plays. In the Sichuan Basin, China, studies on deep shale gas wells have reported optimal single-stage fluid volumes typically ranging from 2000 to 2500 m3/stage to achieve effective stimulation while managing interference, which closely matches our findings [2,13,15]. This consistency suggests that the non-monotonic RFO response and the associated critical threshold observed in our model are not an artifact but reflect a fundamental geomechanical trade-off encountered in field development.
This non-monotonic behavior indicates the existence of a critical fluid volume threshold, governed by the interplay between near-wellbore fracture complexity and far-field stress reorientation. Below this threshold, fluid energy is primarily consumed in creating a complex, dendritic fracture network near the wellbore, which tends to confine the stimulation within a localized region and results in a moderate RSV. Exceeding this critical volume, however, provides sufficient energy to overcome the confinement effect of the near-wellbore stress cage. The dominant fractures then undergo accelerated, linearized propagation deep into the far-field reservoir. This extensive, directional growth significantly increases the probability of intersecting the pre-existing depletion zone and fracture network of the parent well, leading to the observed sharp rise in RSV.
It should be noted that while the specific value of 2288 m3 is dependent on the geological parameters and grid resolution applied in this study, the underlying nonlinear trend remains robust.

3.2.3. Effect of Well Spacing

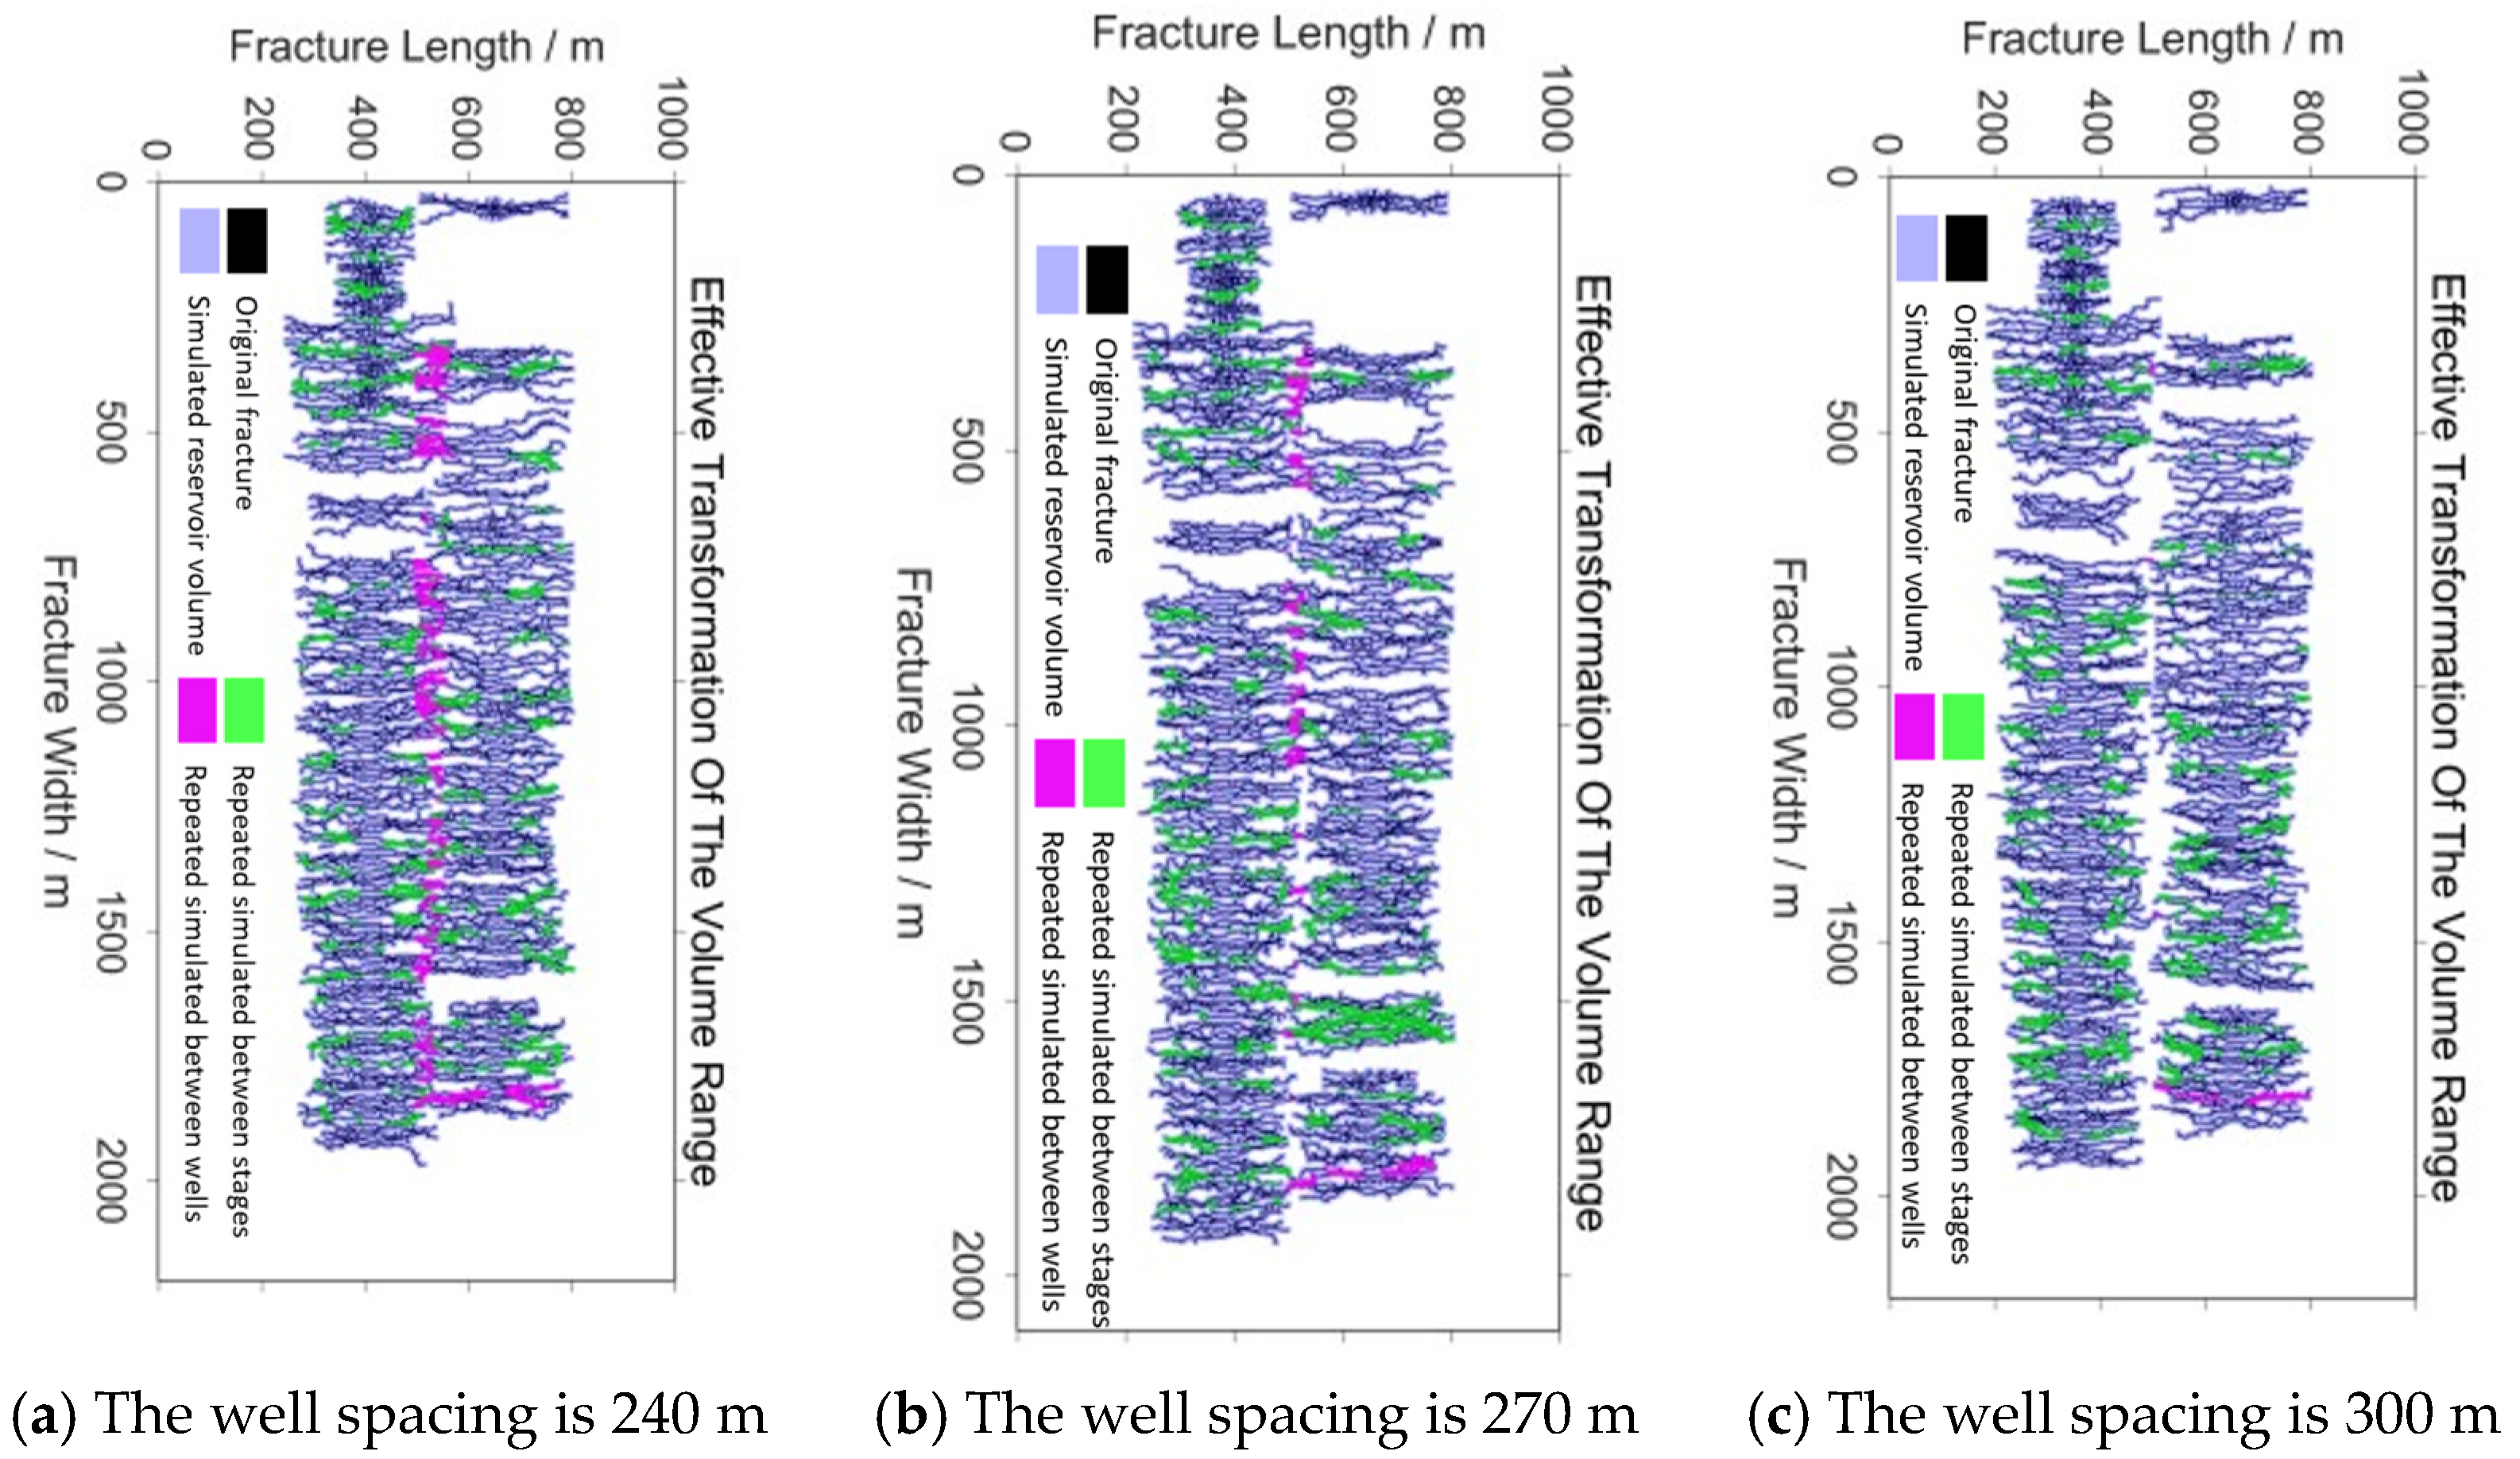
Well spacing is identified as the most influential factor governing the RSV. Simulation results (Figure 6) reveal a pronounced reduction in the RFO from 20.48% at 240 m spacing to 13.03% at 300 m spacing. This trend conclusively indicates that increasing well spacing is the most effective operational parameter for mitigating hydraulic fracturing channeling risk. The underlying mechanism is that a greater inter-well distance provides a larger buffer zone, substantially decreasing the probability of fracture network overlap between adjacent wells. Subsequent economic evaluation further indicates that a well spacing of 300 m achieves an optimal balance between channeling risk mitigation and effective reservoir development under the given conditions.
However, it is important to acknowledge the trade-off between minimizing interference and maximizing resource recovery efficiency. While increasing well spacing reduces fracture overlap and channeling risk, it may also lead to lower total reserve recovery from the lease area due to decreased well density. Economic evaluations must integrate local factors such as reservoir heterogeneity, commodity prices, and development costs to determine an optimal well spacing that balances long-term recovery and interference control. In this study, the 300 m spacing was identified as optimal for the specific conditions, but field applications should adjust based on comprehensive economic assessments.

3.2.4. Effect of Fracture Corridor Arrangement

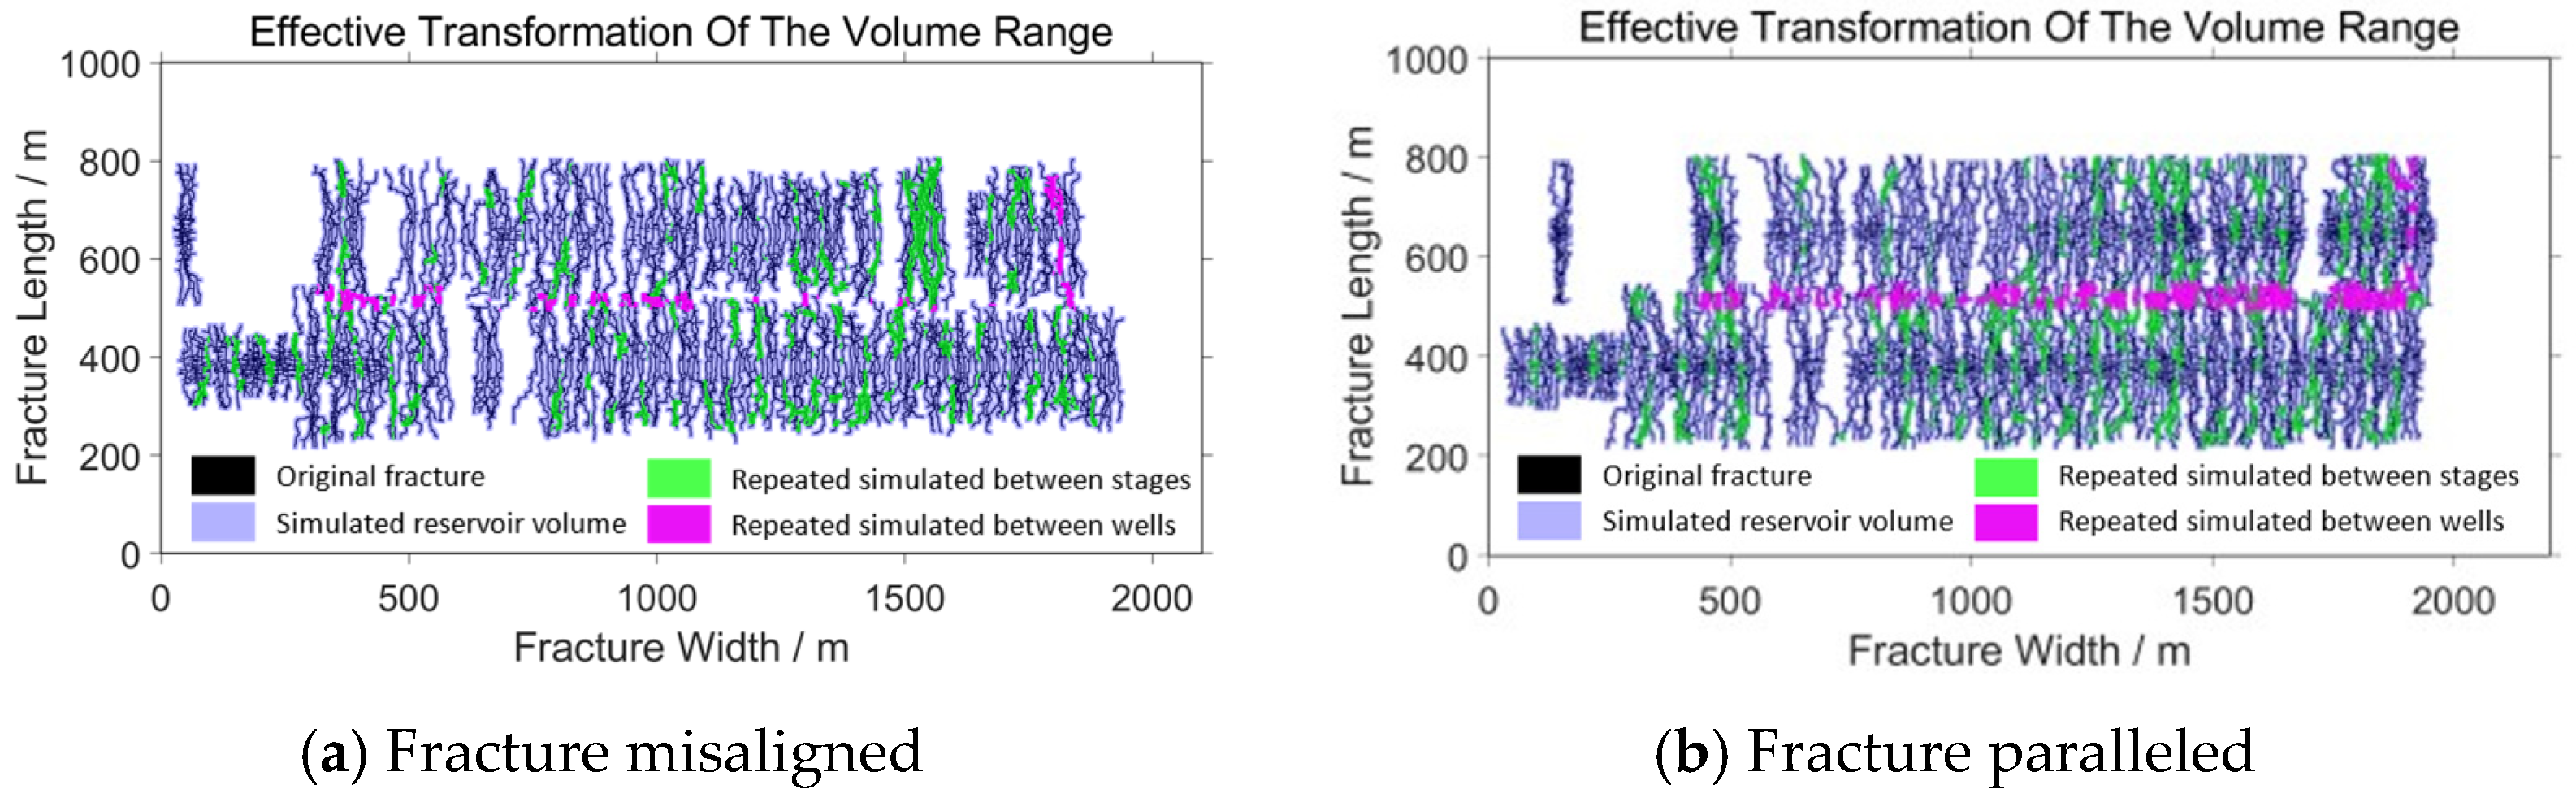
The arrangement of fracture corridors between adjacent wells is another critical factor influencing the RSV. As illustrated in Figure 7, a comparative analysis of parallel versus staggered arrangements shows a clear distinction. The parallel arrangement resulted in a RFO of 14.79%, which is significantly lower than the 18.01% RFO observed for the staggered arrangement. This indicates that, under the simulated conditions, a parallel layout of fracture corridors is more effective in minimizing the spatial overlap of fracture networks.
The comparative analysis held all other parameters constant, including inter-cluster spacing. The key variable was the lateral alignment (phasing) of perforation clusters between wells. The quantitative impact on the Repeatedly Stimulated Volume is summarized in Table 2. The parallel arrangement yielded a total RSV of 9.60 × 10⁴ m3 (RFO = 14.79%), whereas the staggered arrangement produced a larger RSV of 12.24 × 10⁴ m3 (RFO = 18.01%). This demonstrates that, despite having identical cluster spacing, the geometric phasing of initiation points significantly alters the resulting overlap. Parallel phasing promotes fracture growth within a more confined, aligned corridor, leading to a lower probability of widespread, interwoven network overlap compared to the staggered layout.
The lower RFO observed in the parallel arrangement, compared to the staggered design, can be attributed to more predictable fracture propagation paths governed by the in situ stress field. In a parallel layout, simultaneously propagating fractures from adjacent wells create synergistic stress shadows that confine the fracture growth within a more centralized and aligned zone, reducing random outward branching and minimizing direct intersection chances. Conversely, a staggered arrangement, while intended to distribute fractures, often leads to asymmetric stress interference. Fractures from the daughter well are attracted towards the depleted, lower-stress zones surrounding the fractures of the parent well. This attraction increases the likelihood of fractures curving and extending diagonally across the well spacing, thereby increasing the fracture network overlap volume in the inter-well region
This disparity is primarily attributed to the fact that the parallel arrangement promotes greater consistency in the fracture extension direction, thereby minimizing the potential for intersecting and overlapping fracture paths. Field applications have corroborated these findings, demonstrating that adopting a parallel staging design can reduce the incidence of channeling accidents by over 25%.

3.3. Summary of Channeling Risk Analysis Based on RSV

This analysis conclusively validates the Repeatedly Stimulated Volume (RSV) as a robust quantitative metric for assessing inter-well fracture network overlap, confirming its direct positive correlation with channeling risk. The simulation results provide key operational guidelines for minimizing this risk. First, a rate of 16–18 m3/min promotes uniform fracture growth, while the fluid volume per stage must be kept below the critical threshold of 2288 m3 to prevent excessive fracture propagation. Second, a spacing of 300 m provides a sufficient buffer zone, and a parallel arrangement of fracture corridors is recommended to reduce direct overlap. These measures are highly effective for mitigating interference.
It is crucial to emphasize that this threshold is empirically derived from the specific geological and completion conditions of the analyzed field cases. It serves as a useful screening tool within a similar context, but should not be considered a universal constant. The exact threshold will vary for different reservoirs based on permeability, stress state, and completion design. Therefore, the practical application of this framework requires calibration with local field diagnostics to establish asset-specific risk criteria.

3.4. Discussion on Parameter Sensitivity

The sensitivity of the RSV to other key reservoir properties is conceptually summarized below and should guide field application. The influence of key operational and design parameters on the RFO was quantified through the parametric study. To provide a clear, synthesized overview, the parameters are ranked by their mean impact in Table 3. The ΔRFO represents the change in RFO from the baseline simulation scenario to the tested scenario for each parameter. The ranking demonstrates that well spacing is the most influential parameter for controlling overlap, followed by fracture corridor arrangement. The impact of injection rate and fluid volume, while significant, is comparatively smaller under the tested ranges.
A higher horizontal stress contrast typically promotes more planar, confined fracture growth, potentially reducing RSV for a given well spacing. Conversely, in an isotropic stress field, fractures may branch more randomly, increase in the overlap risk and possibly necessitate larger well spacing than the 300 m identified here.
A dense network of natural fractures, especially if favorably oriented, can act as conduits, significantly amplifying RSV and channeling risk. The “optimal” fracture arrangement concluded in Section 3.2.4 may reverse in a naturally fractured reservoir where pre-existing fractures dominate the propagation path. Rocks with a higher Young’s modulus tend to develop narrower, longer fractures, which could lead to a higher RSV at larger distances. Lower Poisson’s ratio may alter the stress anisotropy, indirectly affecting fracture geometry and overlap.
A higher initial pressure or permeability increases fluid leak-off, which can suppress net pressure and fracture length, potentially reducing RSV. The identified fluid volume threshold is directly linked to the efficiency of creating a dominant fracture; this efficiency is a function of these reservoir properties. For fields with differing geology, a similar modeling workflow is recommended to calibrate these thresholds locally.

4. Evaluation of Fracturing Fluid Channeling Effect Based on Fracturing Fluid Channeling Flow Rate

4.1. The Channeling Effect Analysis

This study systematically analyzed the channeling effect under varying conditions. The numerical simulations were conducted using a geological model with dimensions of 2200 m × 1000 m × 10 m, representing a typical shale reservoir block containing a parent and a child well. To accurately characterize the reservoir and fracture properties, the key parameters listed in Table 4 were applied. The model incorporates a dual-permeability system to represent the matrix and fracture networks separately.
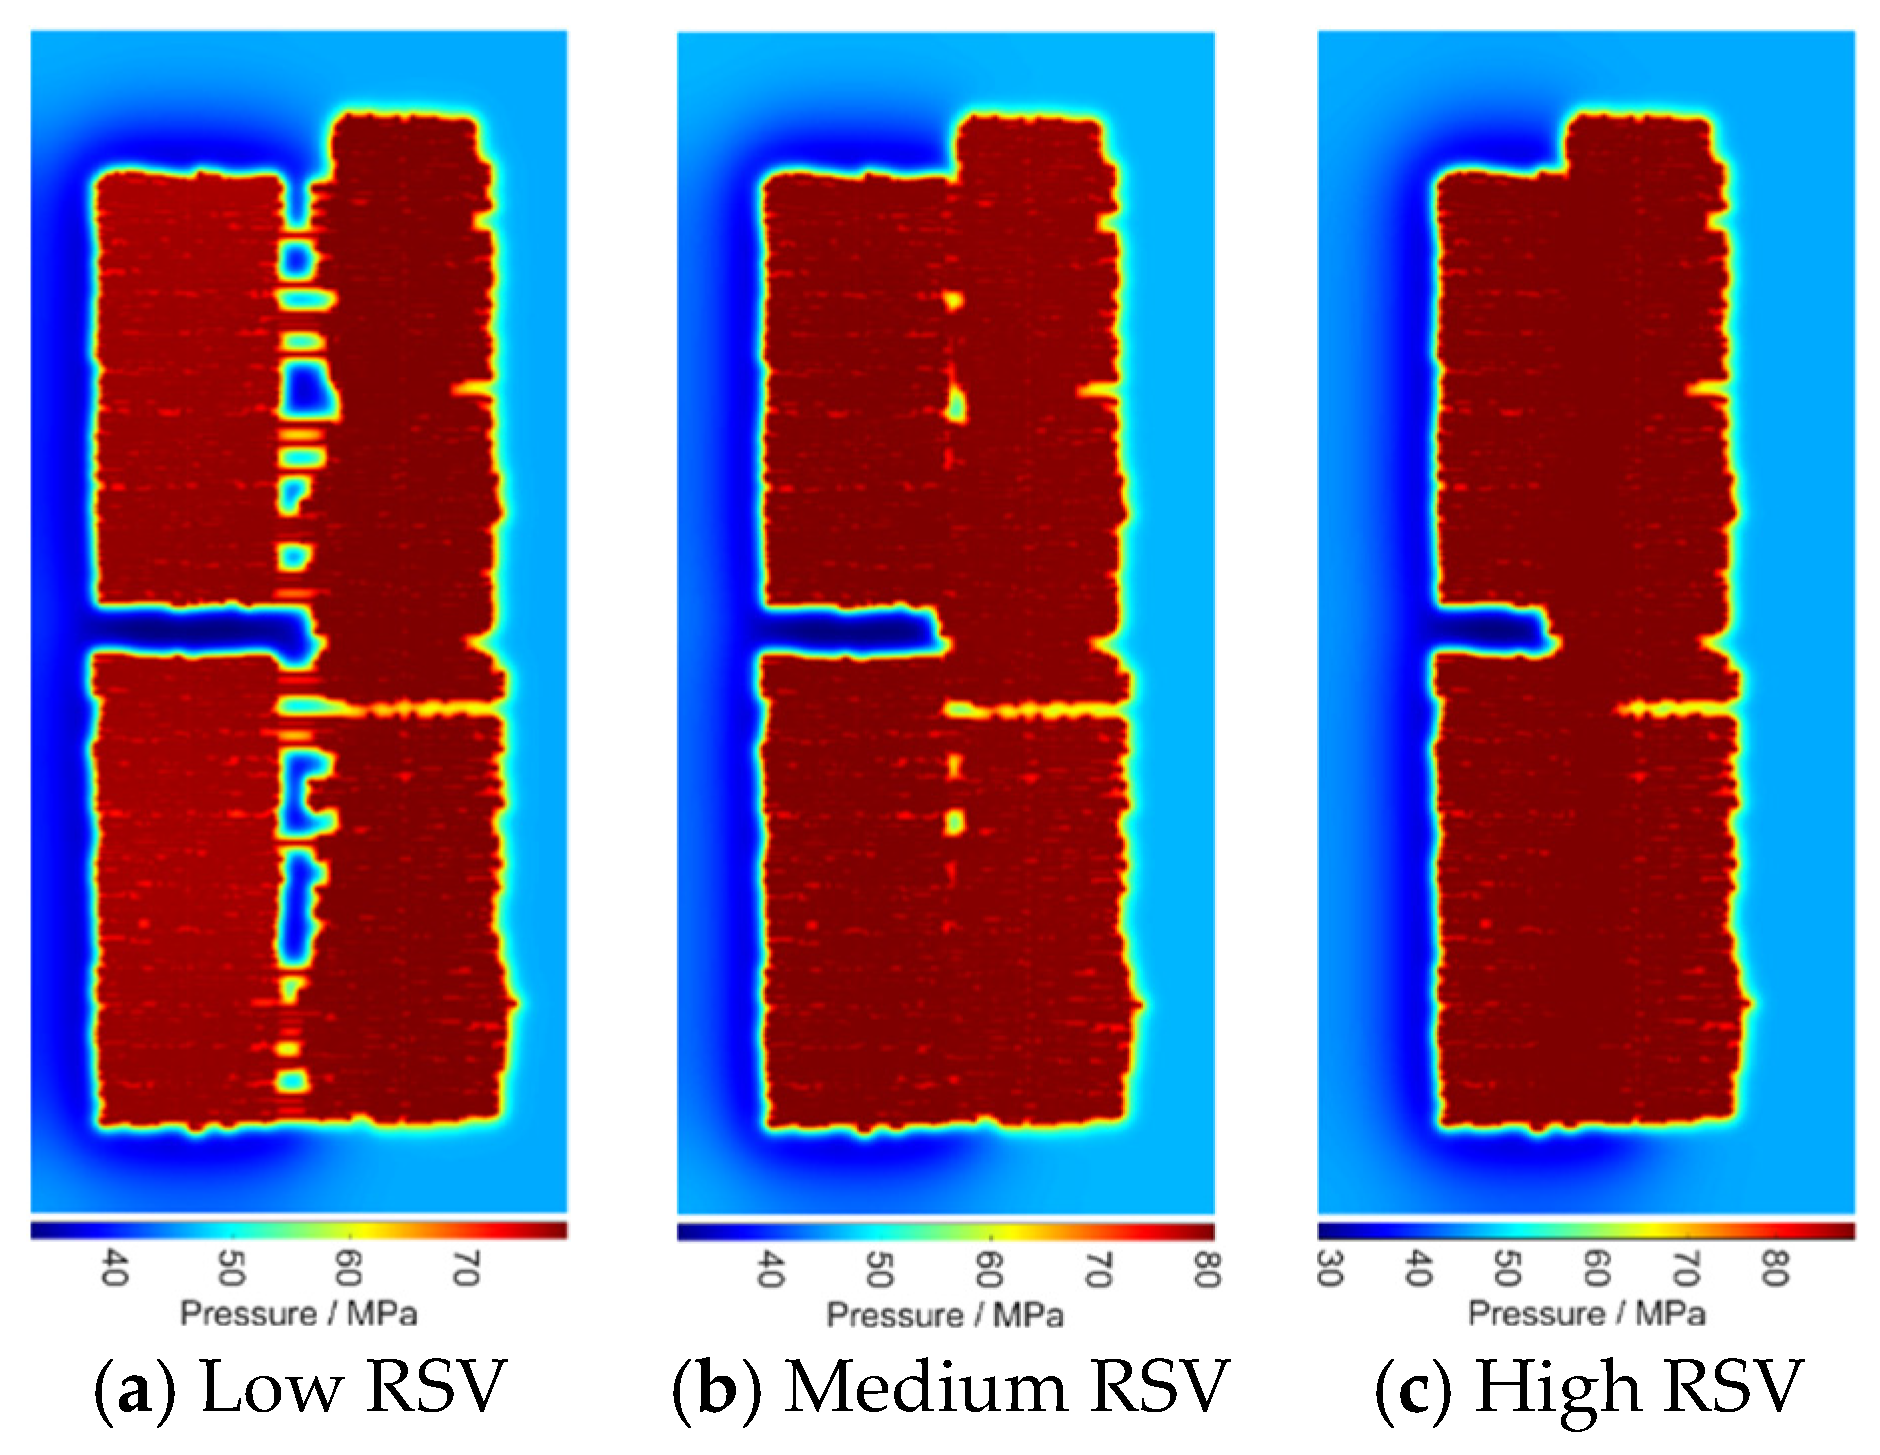
Reservoir pressure responses varied significantly under different RSV conditions—Low, Medium, and High. As shown in Figure 8, the maximum reservoir pressure rose from 77 MPa at Low RSV to 80 MPa at Medium RSV, and further increased to 86 MPa at High RSV. These results confirm that a larger RSV enhances reservoir energy replenishment. However, it also intensifies inter-well interference and promotes the development of more extensive channeling networks.
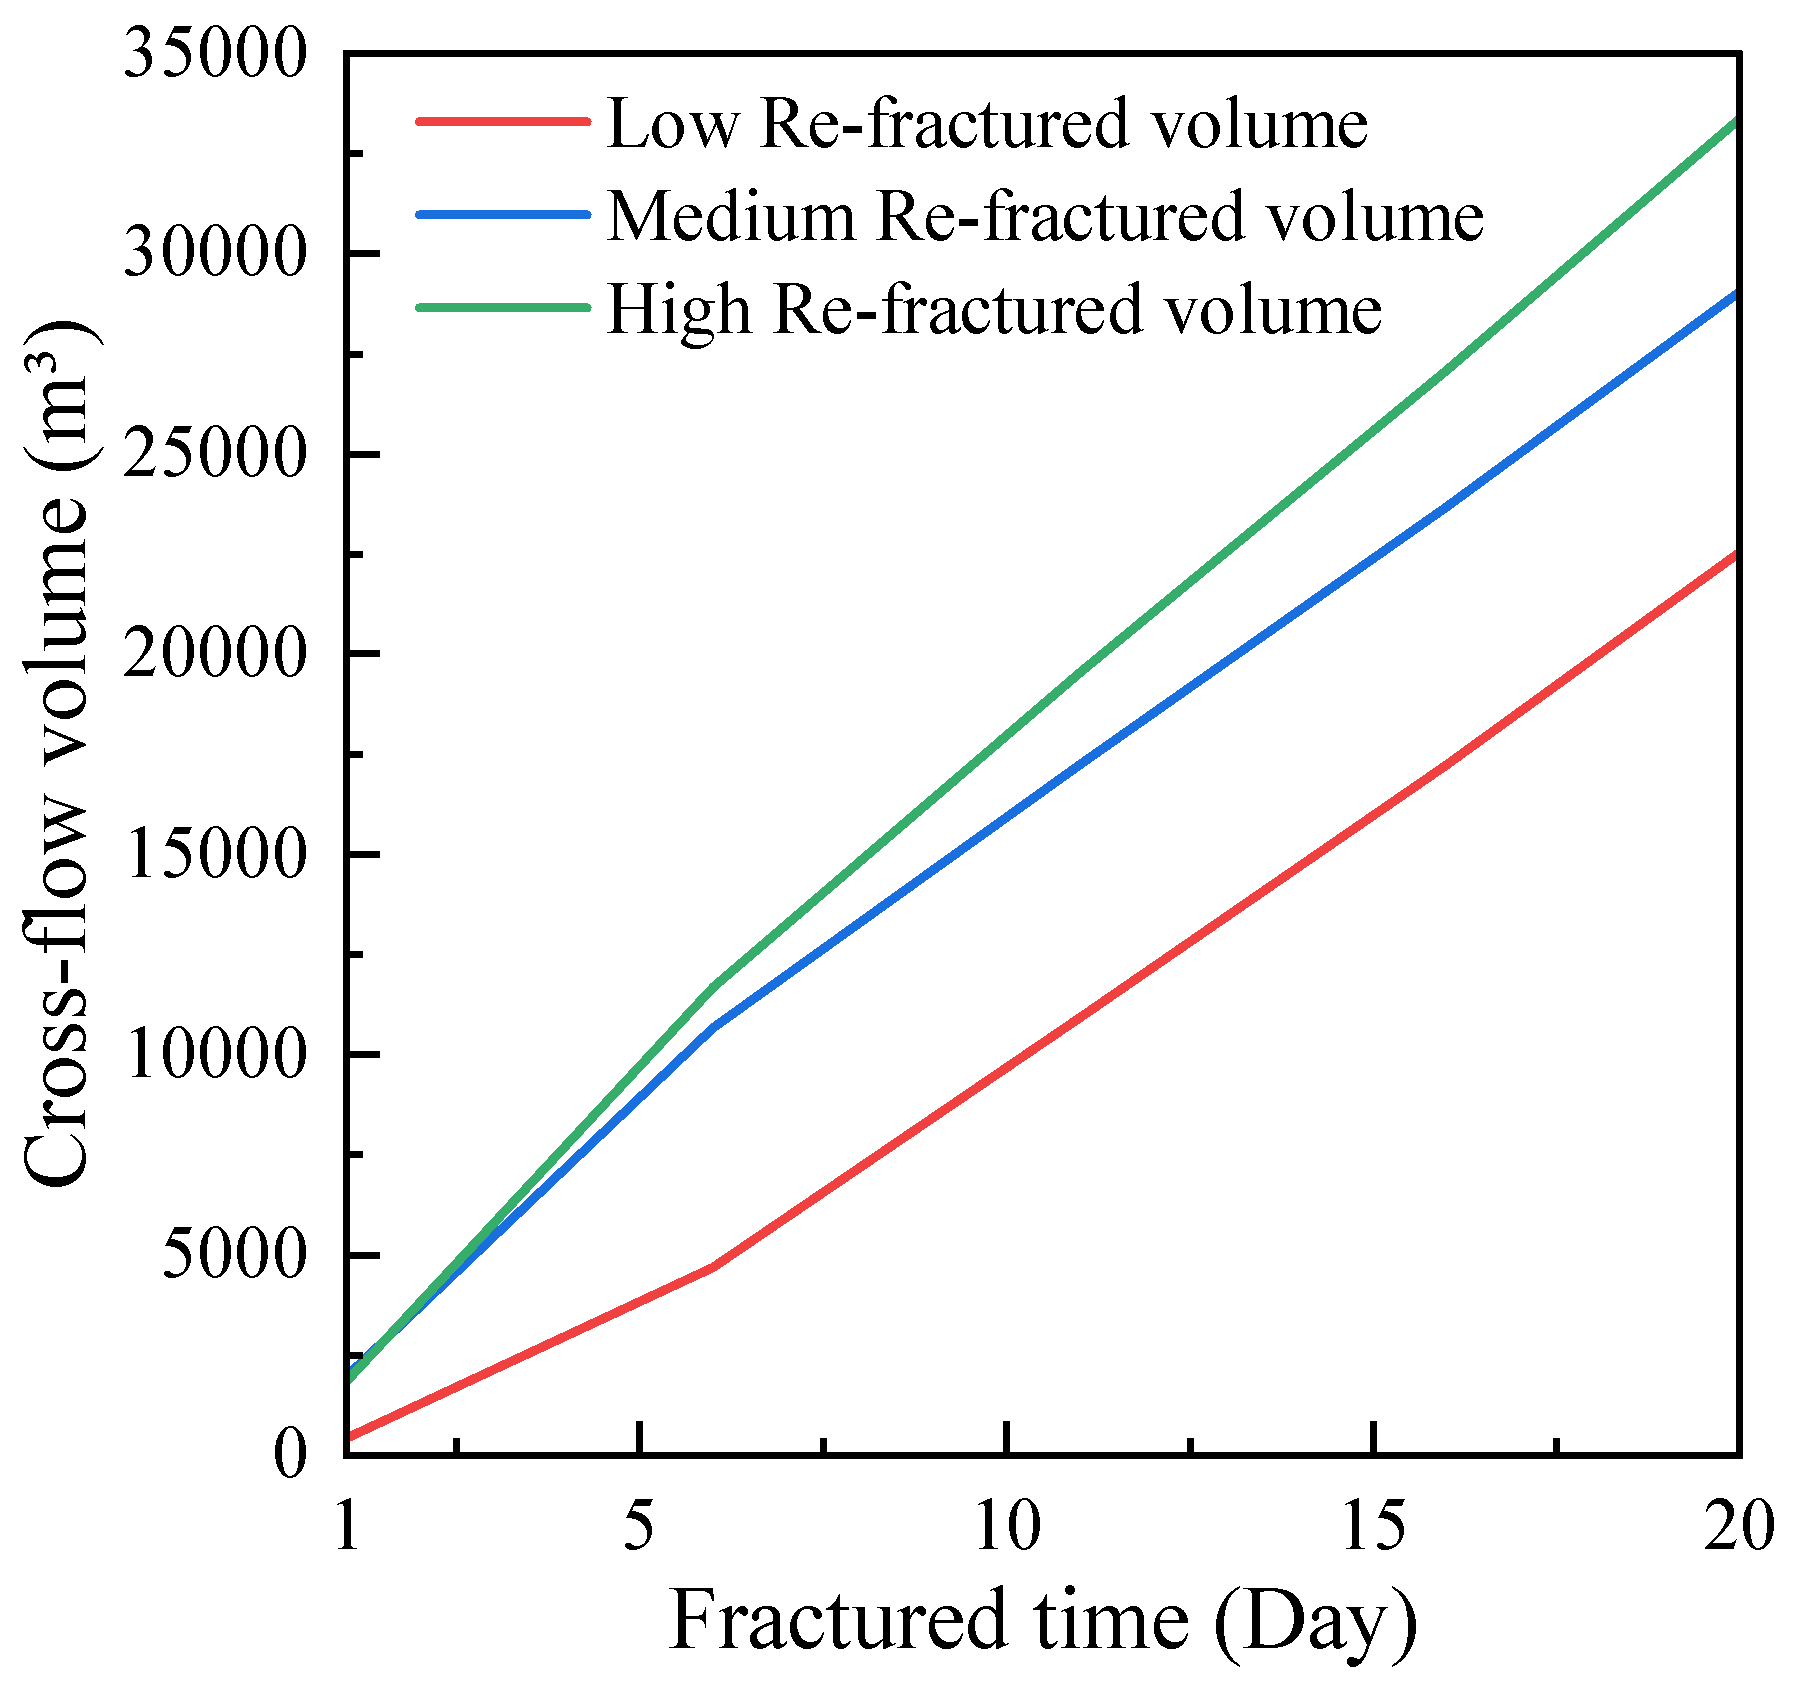
Figure 9 details the spatiotemporal evolution of the fracturing fluid channeling flow rate. During the initial fracturing period, the flow rate increased rapidly under all Repeatedly Stimulated Volume (RSV) conditions. This increase was most pronounced under the High RSV scenario, where the peak rate reached 1.5 times that of the Low RSV condition. In the mid-term production phase (50–200 days), the flow rate gradually stabilized. Notably, the stabilized value remained significantly higher under the High RSV condition. This persistently high flow rate confirms that an excessive RSV leads to sustained, long-term channeling risk.
Quantifying the severity, the channeling coefficient—defined as the proportion of injected fracturing fluid that channels to the parent well—exhibited a clear positive correlation with SRV. Specifically, the coefficient rose from 40% at Low SRV to 52.2% at Medium SRV, and further escalated to 60.1% at High SRV, unequivocally demonstrating a strong positive correlation between the SRV and the intensity of inter-well channeling.
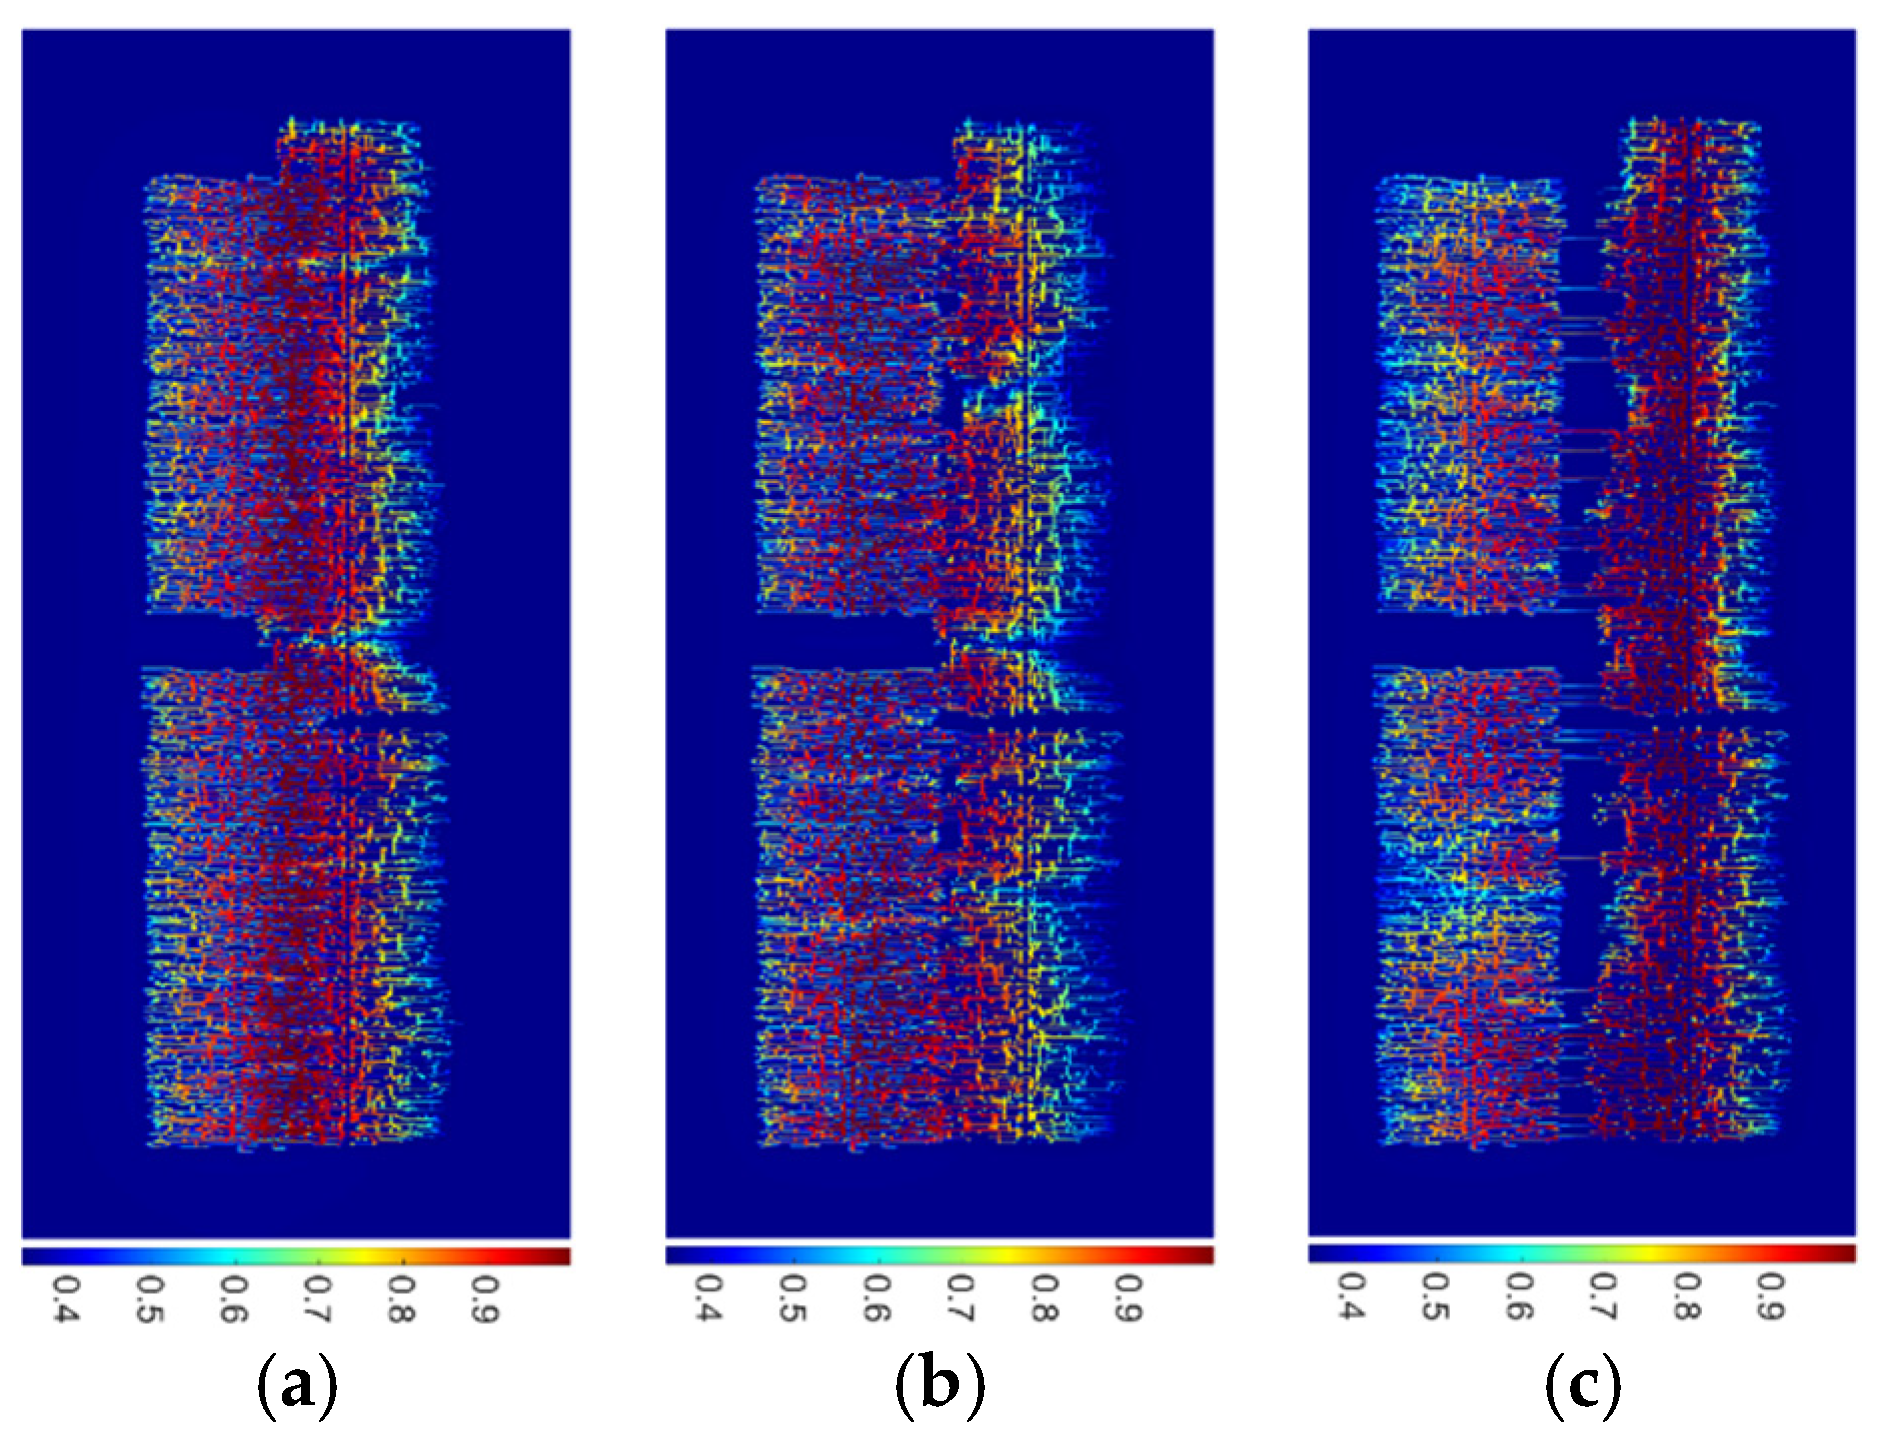
Figure 10 further illustrates the reservoir water saturation distribution following daughter well fracturing under different RSV conditions. In the Low RSV scenario, the fracturing fluid diffusion is confined primarily to localized areas near the main fractures extending toward the parent well, characterized by slow velocity and limited extent. Conversely, under Medium and High RSV conditions, the region of high water saturation markedly extends toward the parent well, forming an expansive channeling network, with distinct preferential channeling paths observable in the near-wellbore region. This saturation pattern confirms that increasing the SRV significantly enhances the fluid’s channeling capacity, fundamentally altering the reservoir fluid distribution and consequently impacting overall development performance.
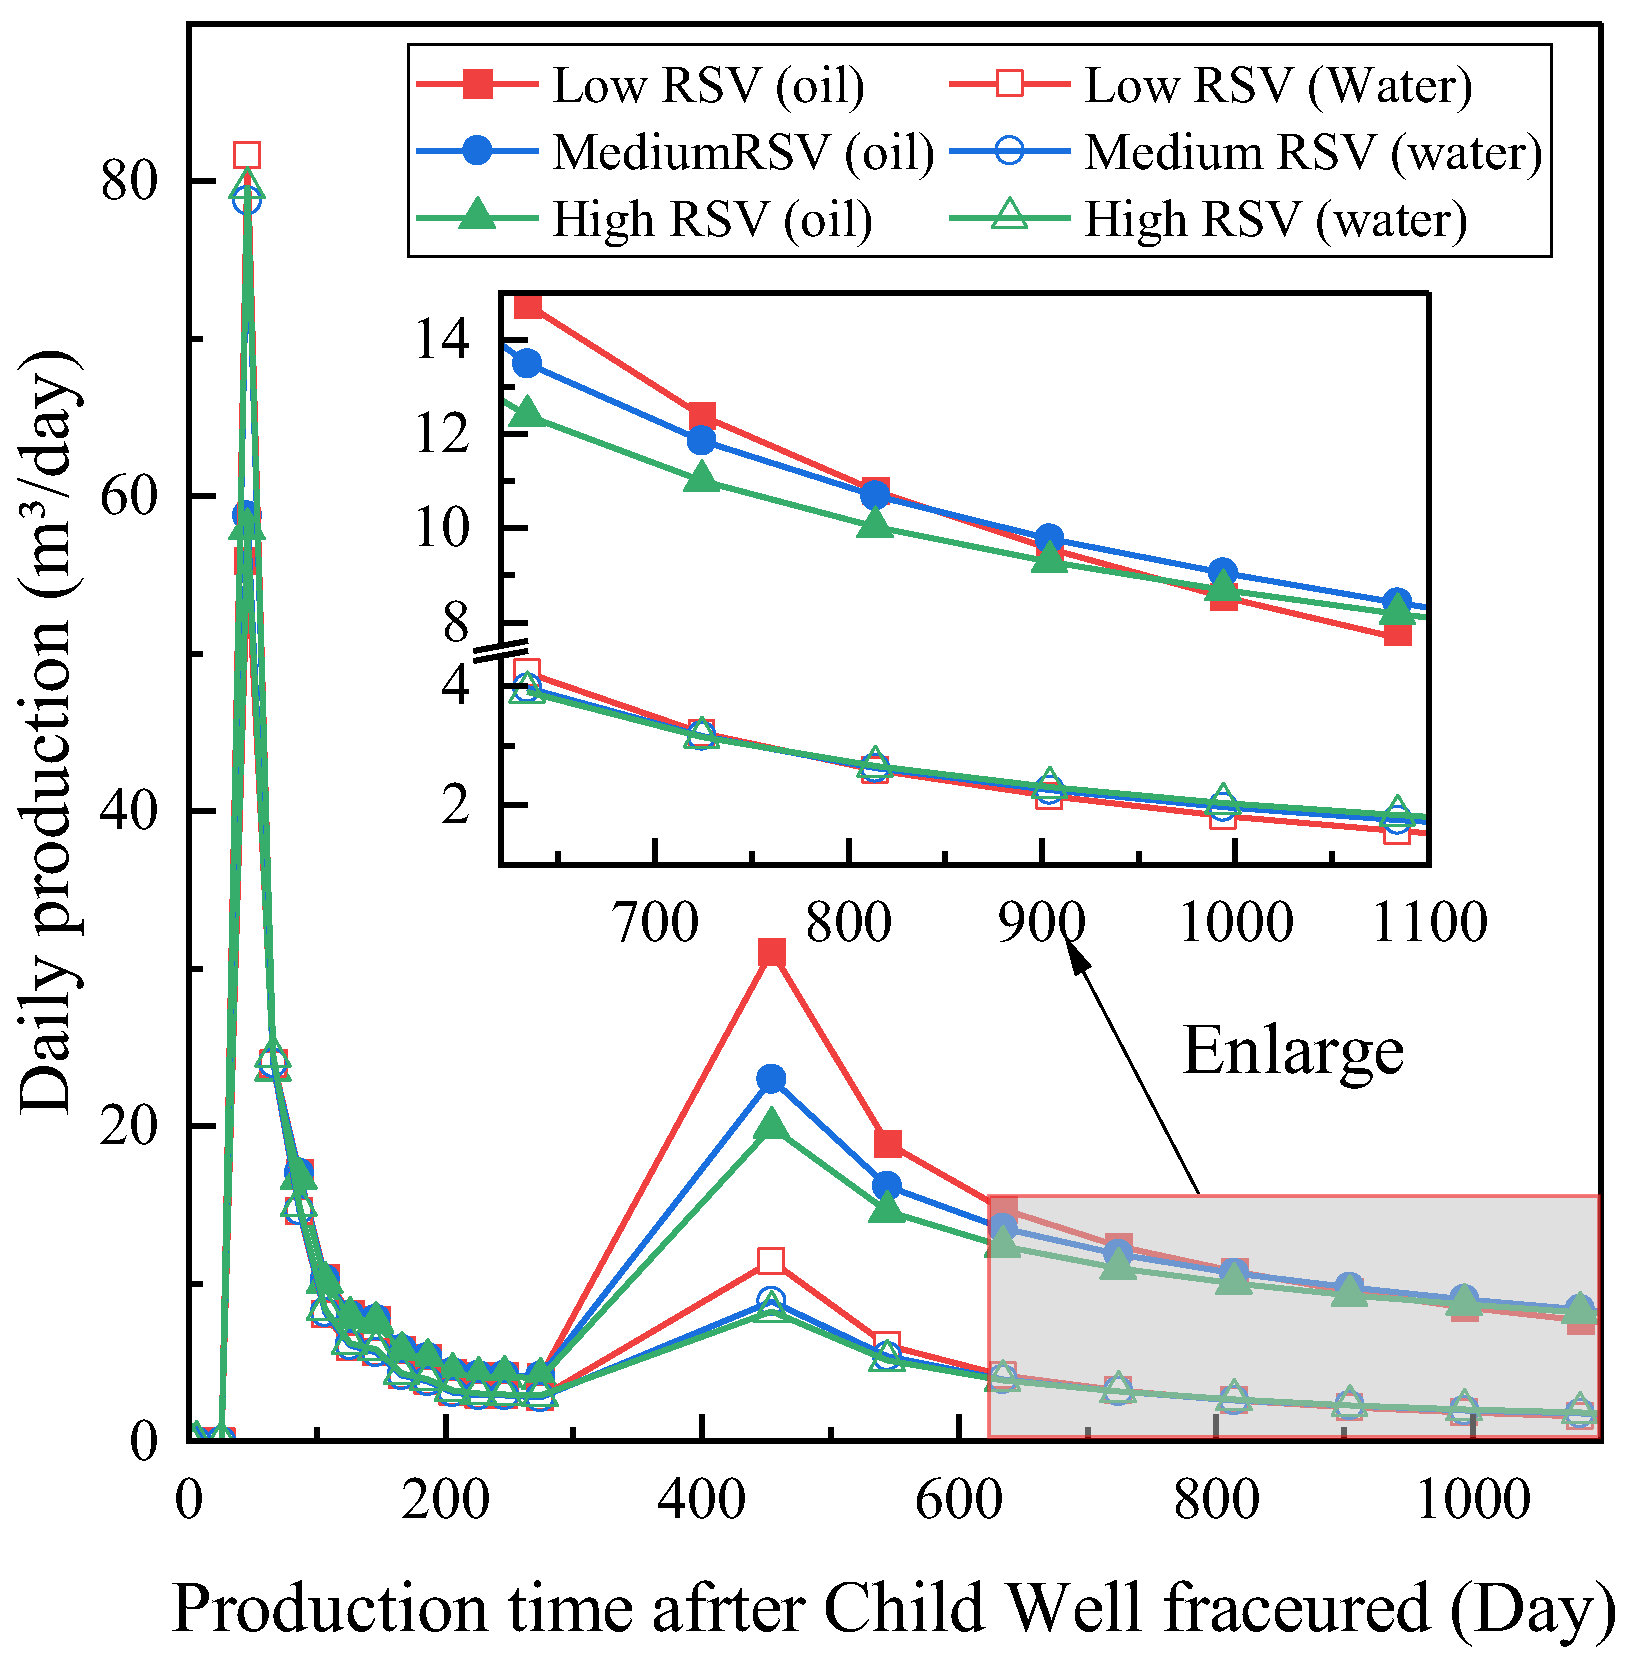
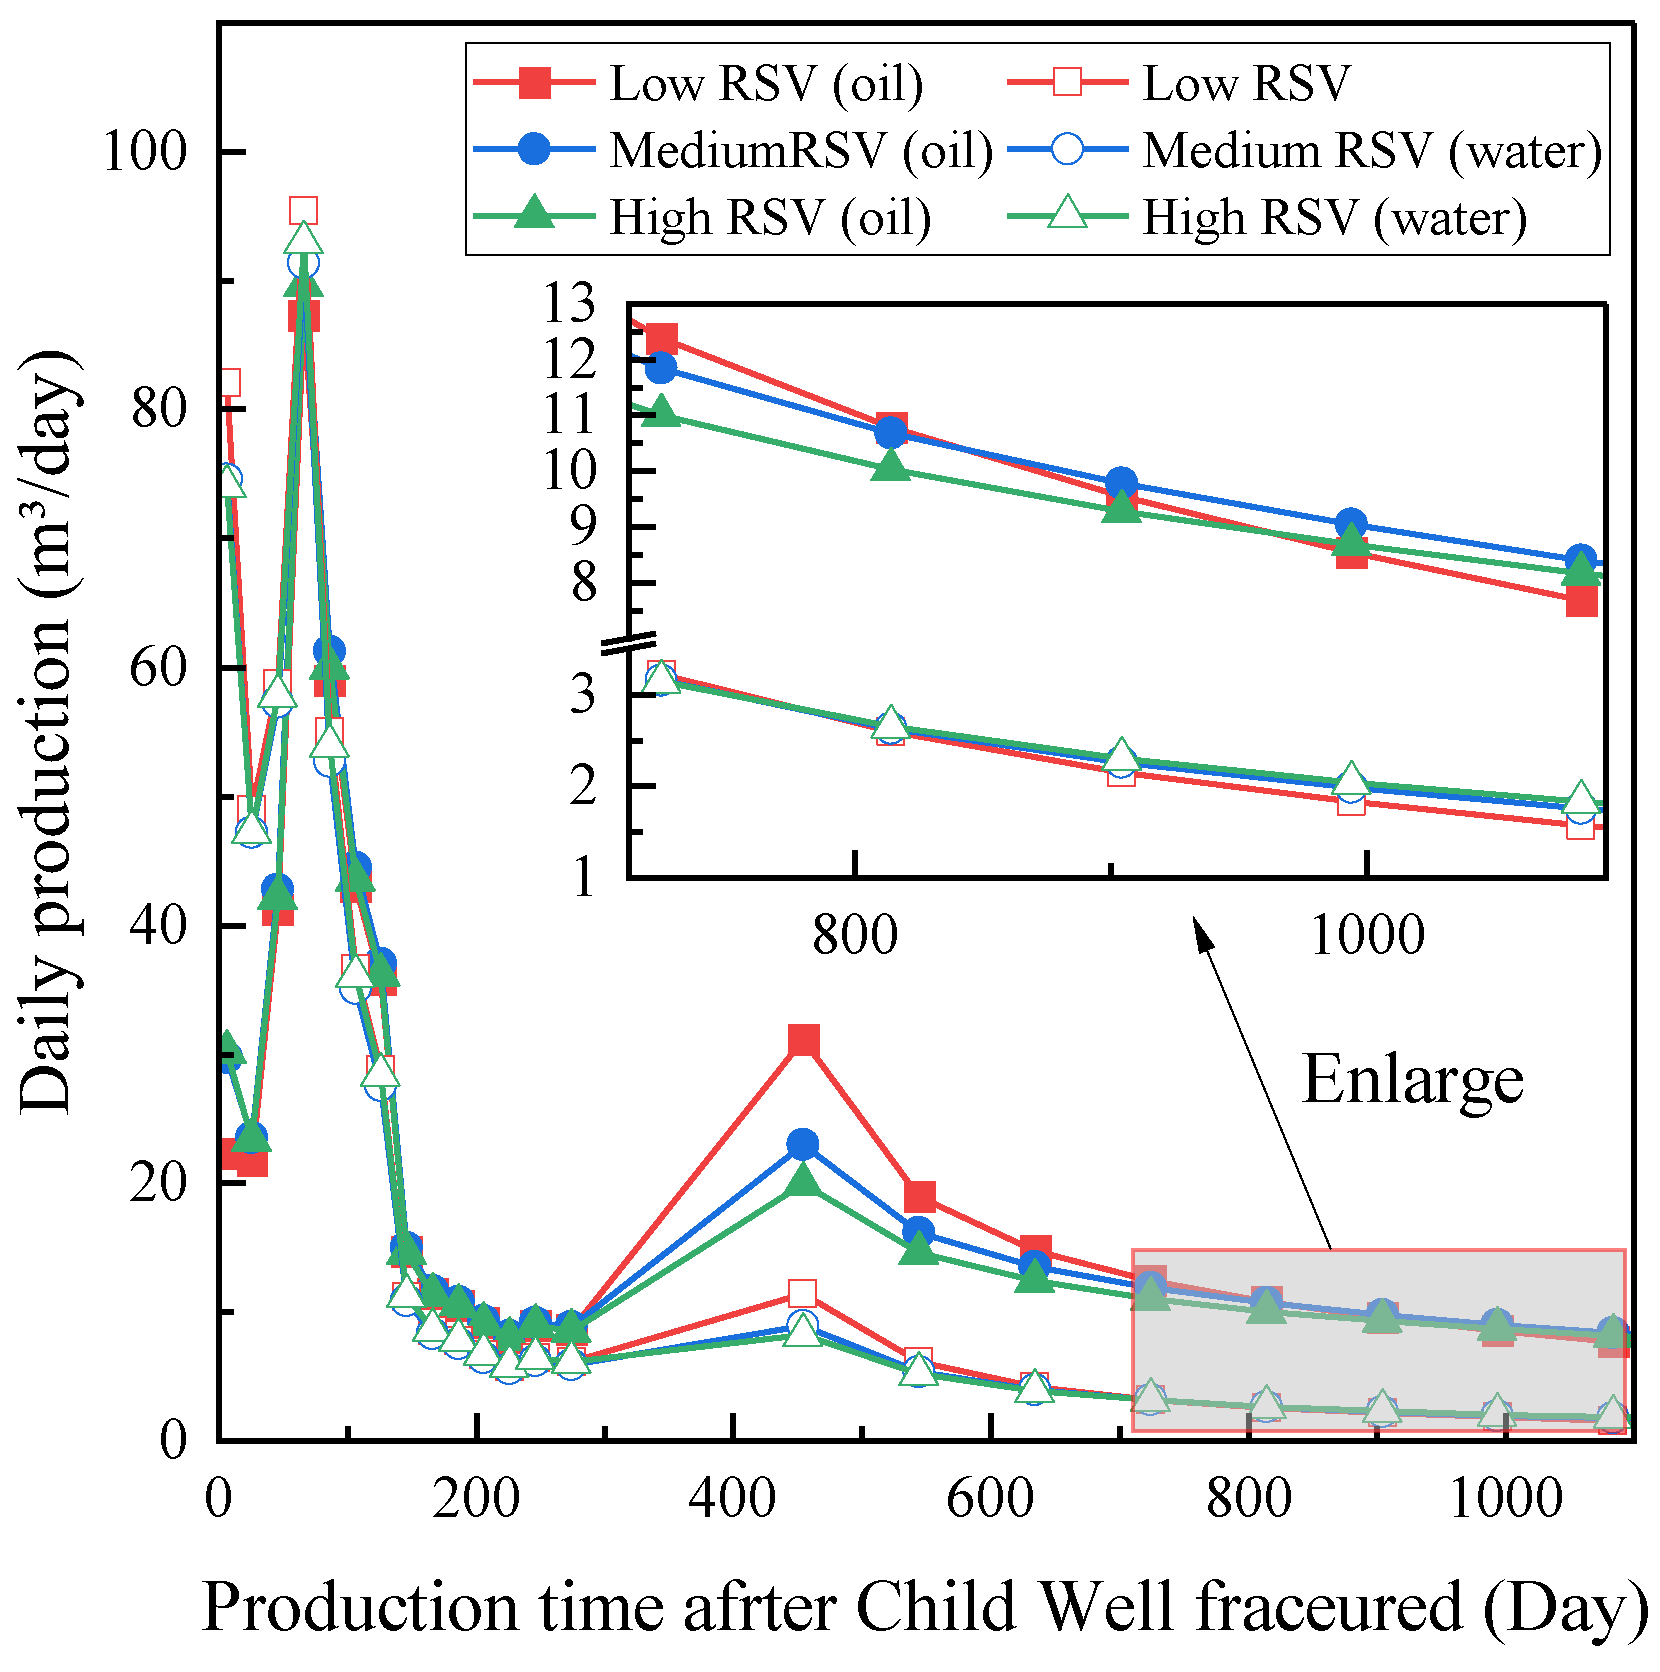
To quantitatively assess the long-term implications of fracturing-driven interference, 5-year production simulations were conducted for the parent–child well pair under a constant bottom-hole pressure of 6 MPa. The simulations compared Low, Medium, and High RSV conditions, with the key results for cumulative production and water cut shown in Figure 11 and Figure 12.
The simulations reveal a key trade-off between short-term and long-term well performance. The Low RSV condition provides the highest initial oil rate—about 25% higher for the parent well compared to the High RSV case—but leads to rapid depletion, with rates declining over 70% within the first year. As a result, it yields the lowest 5-year cumulative oil EUR. In contrast, the High RSV scenario offers a more moderate initial rate but superior long-term stability and drainage, delivering the highest EUR—37% and 28% greater for the parent and child wells, respectively, than the Low RSV case.
Low RSV shows a sharp water-cut increase that quickly stabilizes near 65%, indicating rapid water channeling through limited pathways and inefficient sweep. High RSV exhibits a gradual, continuous rise in water cut, reaching about 75% after five years. This suggests a more extensive and controlled water influx through a connected fracture network, supporting more effective long-term displacement and superior oil recovery despite the higher final water cut.
From an engineering perspective, RSV represents a fundamental design choice. A lower RSV prioritizes early production and reduces initial water handling, while a higher RSV maximizes ultimate recovery but requires managing a different water production profile. This quantitative link between fracture geometry (RSV) and forecasted performance provides a clear framework for optimizing development decisions.

4.2. Uncertainties Discussion

The reliability of the simulated RSV is subject to model assumptions and input data limitations. Key simplifications include: (i) representing the reservoir as a homogeneous, isotropic medium with predefined fracture corridors; (ii) employing linear elastic fracture mechanics, neglecting plasticity or creep; (iii) calculating stress shadow effects based on static perturbations rather than fully coupled dynamic geomechanics; and (iv) lacking characterization of the anisotropic properties of natural fractures.
Furthermore, model validation relied on pressure and rate data. While this provides confidence in the predicted relative trendsand interference patterns—the primary focus for risk ranking—it introduces uncertainty in quantifying the absolute dimensionsof the fracture network. Consequently, the absolute RSV values carry an estimated uncertainty of 15–20%. These assumptions imply that the model is most robust for comparative scenario analysis under consistent geological settings rather than providing universal quantitative predictions. Future work will integrate more detailed geological characterization to reduce these uncertainties.
Furthermore, the macroscopic permeability values assigned to the matrix and fracture systems are effective parameters that integrate sub-grid heterogeneities, including variability in Total Organic Carbon (TOC) and its effect on pore structure. While these values are representative of the studied interval, their spatial variability, particularly related to TOC distribution, is a source of uncertainty. A dedicated sensitivity analysis of the impact of TOC-driven permeability heterogeneity on the predicted RSV represents an important direction for future work to further refine the model’s predictive accuracy

5. Conclusions

This study presents a quantitative evaluation of fracturing-driven interference in shale parent–child wells using the RSV metric. The results are derived from specific geological and completion parameters in our model, serving as a proof of concept and methodological framework rather than universal constants. The main contribution is a consistent workflow linking engineering controls to overlap risk. For any specific asset, absolute values will differ; therefore, site-specific modeling is essential to establish local design criteria that balance development efficiency with interference mitigation. In the study, simulation results identify critical operational parameters for risk mitigation:
(1)
Well Spacing is the most effective control, with 300 m providing the optimal balance.
(2)
Fluid Volume must be kept below a critical threshold of 2288 m3/stage to prevent excessive fracture over-extension (which can triple the overlap ratio).
(3)
Parallel fracture corridor arrangement is superior to staggered designs.
While high RSV offers a short-term parent well production increase, it severely compromises long-term recovery and overall development efficiency. Based on these findings, we recommend controlling the RSV within the 10–15% range during development planning. This integrated evaluation methodology provides essential quantitative guidance for risk pre-warning and safe, efficient shale resource development.

Author Contributions

Conceptualization, Z.L. and X.X.; Methodology, Z.Y. and G.S.; Validation, Z.L., Z.Y., X.X. and C.L.; Formal analysis, G.L., X.X. and C.L.; Investigation, Z.L., G.L. and C.L.; Resources, G.L.; Data curation, G.L., X.X. and C.L.; Writing—original draft, Z.Y.; Writing—review and editing, Z.Y. and G.S.; Visualization, Z.Y. and G.S.; Supervision, G.S., G.L. and X.X.; Project administration, Z.L. and G.S.; Funding acquisition, Z.L., G.S. and X.X. All authors have read and agreed to the published version of the manuscript.

Funding

This study was supported by the State Key Laboratory of Shale Oil and Gas Enrichment Mechanisms and Effective Development (Grant No. 30200018-24-ZC0613-0156), National Natural Science Foundation of China (Grant No. 52474029), Sinopec Key Scientific and Technological Research Project “Study on the Mechanism of CO2 High-Pressure Huff-and-Puff Enhanced Oil Recovery in Jiyang Shale Oil” (P25184).

Data Availability Statement

The original contributions presented in this study are included in the article. Further inquiries can be directed to the corresponding author.

Conflicts of Interest

Authors Zupeng Liu, Guang Lu and Xiangdong Xing were employed by the Shengli Oilfield Company. The remaining authors declare that the research was conducted in the absence of any commercial or financial relationships that could be construed as a potential conflict of interest.

Abbreviations

The following abbreviations are used in this manuscript:
RFVRepeated Fracture Volume
RFORatio of Fracture Overlap
PHFPorous Hydraulic Fracturing
RSVRepeatedly Stimulated Volume
DFNDiscrete Fracture Network
SRVStimulated Reservoir Volume
TOCTotal Organic Carbon

References

  1. Weng, D.; Lei, Q.; Guan, B.; He, C.; Sun, Q.; Huang, R. Progress and development direction of shale oil and gas reservoir stimulation technology in China and the United States. Acta Pet. Sin. 2023, 44, 2297–2307. [Google Scholar]
  2. Shen, C.; Guo, X.; Chen, M.; Yong, R.; Fan, Y. Fracturing technology for deep shale gas horizontal well reservoirs. Nat. Gas Ind. 2019, 39, 68–75. [Google Scholar]
  3. Lei, Q.; Yun, X.; Bo, C.; Guan, B.; Wang, X.; Bi, G.; Li, H.; Li, S.; Ding, B.; Fu, H.; et al. Progress and prospects of horizontal well fracturing technology for shale oil and gas reservoirs. Pet. Explor. Dev. 2022, 49, 191–199. [Google Scholar] [CrossRef] [Scilit]
  4. Lin, Y.; Liu, S.; Gao, S.; Yuan, Y.; Wang, J.; Xia, S. Study on the optimal design of volume fracturing for shale gas based on evaluating the fracturing effect—A case study on the Zhao Tong shale gas demonstration zone in Sichuan, China. J. Pet. Explor. Prod. 2021, 11, 1705–1714. [Google Scholar] [CrossRef] [Scilit]
  5. Lu, B.; Hu, C.; Ma, J. Influencing factors and countermeasures of inter-well interference of fracturing horizontal wells in Nanchuan shale gas field. Pet. Reserv. Eval. Dev. 2023, 13, 330–339. [Google Scholar] [CrossRef]
  6. He, Y.; Guo, J.; Tang, Y.; Xu, J.; Li, Y.; Wang, Y.; Lu, Q.; Patil, S.; Rui, Z.; Sepehrnoori, K. Interwell fracturing interference evaluation of multi-well pads in shale gas reservoirs: A case study in WY Basin. In Proceedings of the SPE Annual Technical Conference and Exhibition, Virtual, 27–29 October 2020; p. D021S010R002. [Google Scholar]
  7. Liu, Y.; Luo, L.; Naiser, S.; Sylvester, G.; Medina, M.R.; Zhang, J.; Song, D.; Evans, G.; Howard, P.; Thom, D.; et al. Eagle Ford parent well frac hit (frac driven interaction) impact characterization, prediction, and mitigation. In Proceedings of the Unconventional Resources Technology Conference, Denver, CO, USA, 13–15 June 2023; pp. 1168–1182. [Google Scholar]
  8. Li, Y.; Song, Y.; Li, J.; Hang, Y.; Zhang, J.; Shao, S. Research status and implications of inter-well interference in horizontal well fracturing in North American shale gas. Nat. Gas Ind. 2023, 43, 34–46. [Google Scholar] [CrossRef]
  9. Pei, Y.; Sepehrnoori, K. Investigation of parent-well production induced stress interference in multilayer unconventional reservoirs. Rock Mech. Rock Eng. 2022, 55, 2965–2986. [Google Scholar] [CrossRef] [Scilit]
  10. Kumar, A.; Shrivastava, K.; Elliott, B.; Sharma, M. Effect of parent well production on child well stimulation and productivity. In Proceedings of the Society of Petroleum Engineers-SPE Hydraulic Fracturing Technology Conference and Exhibition, The Woodlands, TX, USA, 4–6 February 2020. [Google Scholar]
  11. Carpenter, C. Study Reviews Eagle Ford Parent-Well Frac-Hit Analysis, Prediction, and Mitigation. J. Pet. Technol. 2023, 75, 95–97. [Google Scholar] [CrossRef] [Scilit]
  12. Liu, F.; Mou, Y.; Wen, F.; Yao, Z.; Yi, X.; Xu, R.; Zhang, N. A Damage-Based Fully Coupled DFN Study of Fracture-Driven Interactions in Zipper Fracturing for Shale Gas Production. Energies 2025, 18, 4722. [Google Scholar] [CrossRef] [Scilit]
  13. Li, Y.L.; Li, X.H.; Chen, Z.Y.; Li, C.S.; Ou, Z.P.; Wang, Y.M.; Cao, B.; Wang, R. Experimental study on pressure response characteristics of parent wells during frac hits. Geosyst. Eng. 2025, 1–15. [Google Scholar] [CrossRef] [Scilit]
  14. Wang, Q.; Wang, Y.F.; Zhao, J.Z.; Song, Y.; Shen, C.; Hu, Y. Numerical simulation of fracturing and interfaces in deep shale gas wells and integrated production. Nat. Gas Ind. 2025, 45, 53–66. [Google Scholar]
  15. Zhao, H.; Zhan, W.; Chen, Z.; Rao, X. A novel connection element method for multiscale numerical simulation of two-phase flow in fractured reservoirs. SPE J. 2024, 29, 4950–4973. [Google Scholar] [CrossRef] [Scilit]
  16. Sun, H.; He, N.; Gurkalo, F. Application and research of microseismic monitoring system and hydraulic fracturing technology in coal mines. Water 2024, 16, 1062. [Google Scholar] [CrossRef] [Scilit]
  17. Fu, Y.; Dehghanpour, H. How far can hydraulic fractures go? A comparative analysis of water flowback, tracer, and microseismic data from the Horn River Basin. Mar. Pet. Geol. 2020, 115, 104259. [Google Scholar] [CrossRef] [Scilit]
  18. Jouanna, P. A summary of field test methods in fractured rocks. Flow Contam. Transp. Fract. Rock 1993, 437–544. [Google Scholar]
  19. Maxwell, S.C.; Rutledge, J.; Jones, R.; Fehler, M. Petroleum reservoir characterization using downhole microseismic monitoring. Geophysics 2010, 75, 75A129–75A137. [Google Scholar] [CrossRef] [Scilit]
  20. Salman, A.; Kurtoglu, B.; Kazemi, H. Analysis of Chemical Tracer Flowback in Unconventional Reservoirs. In Proceedings of the SPE/CSUR Unconventional Resources Conference, Calgary, AB, Canada, 30 September–2 October 2014; Volume 22. [Google Scholar]
  21. King, G.E. Tracking fracture fluid movement with chemical and gamma a-emitting tracers with verification by microseismic recording. In Proceedings of the EPA Hydraulic Fracturing Workshop, Arlington, VA, USA, 24–25 February 2011; pp. 24–25. [Google Scholar]
  22. Liu, G.; Wu, X.; Romanov, V. Unconventional wells interference: Supervised machine learning for detecting fracture hits. Appl. Sci. 2024, 14, 2927. [Google Scholar] [CrossRef] [Scilit]
  23. Stephenson, H.; Nguyen, T.; Murrell, G.; Shahkarami, A.; Klenner, R. Artificial Intelligence for Real-Time Monitoring of Fracture Driven Interactions and Simultaneous Completion Optimization. In Proceedings of the SPE Canada Unconventional Resources Conference, Virtual, 28 September–2 October 2020; p. D033S004R001. [Google Scholar]
  24. Du, Y.P. Study on the Evolution Law of Inter-Well Pressure Channeling in Shale Gas Horizontal Wells. Doctoral Dissertation, Liaoning University of Engineering and Technology, Jinzhou, China, 2024. [Google Scholar] [CrossRef]
  25. Biot, M.A. Theory of Elasticity and Consolidation for a Porous Anisotropic Solid. J. Appl. Phys. 1955, 26, 182–185. [Google Scholar] [CrossRef] [Scilit]
  26. Yang, Y.; Jiang, H.; Li, M.; Yang, S.; Chen, G. A mathematical model of fracturing fluid leak-off based on dynamic discrete grid system. J. Pet. Explor. Prod. Technol. 2016, 6, 343–349. [Google Scholar] [CrossRef] [Scilit]
  27. Zhao, H.; Sheng, G.L.; Huang, L.Y.; Ma, J.; Ye, Y.; Leng, R. Calculation of reservoir fracture networtk propagation based on lighmning breakdown path simulation. Sci. Sin. Technol. 2022, 52, 499–510. (In Chinese) [Google Scholar] [CrossRef] [Scilit]
  28. Wen, G.; Zhao, W.; Zou, H.; Huang, Y.; Liu, Y.; Liu, Y.; Zhao, Z.; Wang, C. Optimizing Multi-Cluster Fracture Propagation and Mitigating Interference Through Advanced Non-Uniform Perforation Design in Shale Gas Horizontal Wells. Processes 2025, 13, 2461. [Google Scholar] [CrossRef] [Scilit]
  29. Wu, K.; Wu, B.; Yu, W. Mechanism analysis of well interference in unconventional reservoirs: Insights from fracture-geometry simulation between two horizontal wells. SPE Prod. Oper. 2018, 33, 12–20. [Google Scholar] [CrossRef] [Scilit]
  30. Du, B.; Zhang, F.; Dontsov, E.; Meng, K. Numerical simulation of hydraulic fracturing optimization in multi-well and multi-layer shale gas development: Insights from inter-well interference analysis. Geoenergy Sci. Eng. 2025, 250, 213825. [Google Scholar] [CrossRef] [Scilit]
  31. Ren, L.; Dou, M.; Dong, X.; Chen, B.; Zhang, L.; Sun, J.; Jing, C.; Zhang, W.; Zhou, D.; Li, H. Quantitative characterization of stimulated reservoir volume (SRV) fracturing effects in naturally fractured unconventional hydrocarbon reservoirs. Front. Earth Sci. 2024, 12, 1419631. [Google Scholar] [CrossRef] [Scilit]
Figure 1. Identifying fracture interfaces through fracture construction curve.
Processes 14 00196 g001
Figure 2. Schematic diagram of simulated fracture hits effect.
Processes 14 00196 g002
Figure 3. Field validation of simulated channeling using production data from the Parent–Child wells.
Processes 14 00196 g003
Figure 4. RSV under different injection rates. Subfigures (ac) show the spatial distribution of RSV (color bar, in m3) for injection rates of 14, 16, and 18 m3/min, respectively. The parent and child well trajectories are shown in black and red lines. The results demonstrate a clear increase in the absolute RSV and its spatial extent as the injection rate increases, indicating a higher geometric overlap of fracture networks.
Processes 14 00196 g004
Figure 5. RSV under different fracturing fluid volumes per stage. Subfigures (ac) depict the RSV distribution for fluid volumes of 2000, 2288, and 2928 m3/stage, respectively. The calculated absolute RSV values carry an estimated uncertainty of 15–20%.
Processes 14 00196 g005
Figure 6. RSV distribution under different well spacing scenarios. Subfigures (ac) depict the RSV for well spacings of 240 m, 270 m, and 300 m, respectively. The RSV values are quantified as approximately 12.5 × 10⁴ m3, 9.6 × 10⁴ m3, and 8.6 × 10⁴ m3 for the three spacings.
Processes 14 00196 g006
Figure 7. Comparison of RSV under different fracture corridor arrangements. Subfigure (a) illustrates a parallel arrangement of fracture corridors, yielding an RSV of approximately 12.24 × 10⁴ m3. Subfigure (b) illustrates a staggered arrangement, yielding a lower RSV of approximately 9.59 × 10⁴ m3.
Processes 14 00196 g007
Figure 8. Reservoir pressure distribution under different RSV conditions following child well fracturing.
Processes 14 00196 g008
Figure 9. Fracturing fluid channeling flow rate evolution under different RSV conditions.
Processes 14 00196 g009
Figure 10. Water saturation distribution under different RSV conditions following child well fracturing: (a) Low RSV; (b) medium RSV; (c) High RSV.
Processes 14 00196 g010
Figure 11. Parent well production rate change.
Processes 14 00196 g011
Figure 12. Child well production rate change.
Processes 14 00196 g012
Table 1. Channeling risk classification.
RFOClassification of Fracture NetworkChanneling Risk LevelRecommended Action
RFO ≤ 10%Fracture networks are relatively independent.Low RiskMonitor production.
10% < RFO ≤ 20%Local fracture network overlap is present.Moderate RiskOptimize fracturing parameters for future stages/wells.
RFO > 20%Extensive, large-scale fracture network overlap.Significant RiskImplement real-time mitigation and control measures.
Table 2. Comparison of volumetric overlap metrics for staggered versus parallel perforation cluster arrangements.
ArrangementInter-Well RSV (×104 m3)Inter-Stage RSV (×104 m3)Total RSV (×104 m3)Total Stimulated Volume (×104 m3)RFO (%)
Staggered5.207.0412.267.9818.01
Parallel1.148.469.6064.8714.79
Table 3. Ranking of operational and geometric parameters by their impact on the ΔRFO.
RankParameterTested Condition vs. BaselineMean ΔRFOPrimary Effect Uncertainty
1Well Spacing240 m to 300 m (Increase)−7.45%Provides a larger buffer zone, drastically reduces probability of fracture intersection.
2Frac. ArrangementStaggered to Parallel−3.22%Aligns fracture corridors, creating a more predictable and confined interference zone.
3Fluid Volume Optimal(2288 m3) to High (2928 m3)+18.62%Causes fracture over-extension into the far-field, significantly increasing overlap.
4Injection Rate14 m3/min to 18 m3/min (Increase)+0.18%Promotes slightly greater fracture length and network complexity.
Table 4. Key input parameters for the numerical simulation model.
ParameterValueUnit
Model Dimensions2200 × 1000 × 10m
Initial Reservoir Pressure46MPa
Initial Oil Saturation0.65-
Matrix Porosity0.16-
Matrix Permeability0.05mD
Fracture Permeability1.0D
Natural Fracture Permeability1.0D
Young’s Modulus14GPa
Poisson’s Ratio0.22-
Rock Compressibility5.0 × 10−4MPa−1
Disclaimer/Publisher’s Note: The statements, opinions and data contained in all publications are solely those of the individual author(s) and contributor(s) and not of MDPI and/or the editor(s). MDPI and/or the editor(s) disclaim responsibility for any injury to people or property resulting from any ideas, methods, instructions or products referred to in the content.