Article

Composition and Distribution Characteristics of Volatile Products from the Rapid Pyrolysis of Refinery Water Treatment Sludge


1
State Key Laboratory of Chemistry and Utilization of Carbon Based Energy Resources, and Key Laboratory of Coal Clean Conversion & Chemical Engineering Process and Key Laboratory for Value-added Utilization of Heavy Carbon Resources (Xinjiang Uyghur Autonomous Region), School of Chemical Engineering and Technology, Xinjiang University, Urumqi 830017, China
2
Sinopec Petroleum Engineering Co., Ltd., Dongying 257000, China
3
Boxing Lutai Phospholipid Co., Ltd., Binzhou 256500, China
4
Xinjiang Yutouguo Science and Technology Co., Ltd., Aheqi 843500, China
*
Authors to whom correspondence should be addressed.
Processes 2026, 14(19), 3095; https://doi.org/10.3390/pr14193095
Submission received: 2 August 2026 / Revised: 4 September 2026 / Accepted: 20 September 2026 / Published: 27 September 2026
(This article belongs to the Section Environmental and Green Processes)

Abstract

Refinery water treatment sludge (RWTS) is a hazardous organic waste that requires effective treatment prior to disposal, yet its resource potential remains underexplored. In this work, the physicochemical properties and pyrolysis product distribution of RWTS collected from a refinery in Xinjiang, China, were systematically investigated using Fourier transform infrared (FTIR), thermogravimetric and derivative thermogravimetric (TG-DTG) analysis, and pyrolysis-gas chromatography/mass spectrometry (Py-GC/MS). Proximate analysis revealed a high volatile matter content (64.69%), while ultimate analysis showed a carbon content of 49.18% and an H/C molar ratio of 1.80, indicating that RWTS is a hydrocarbon-rich feedstock. FTIR analysis demonstrated that aliphatic C-H groups dominate the organic structure, while aromatic C=C and oxygen-containing functional groups are present in minor proportions. TG-DTG profiles revealed three distinct decomposition stages, with maximum weight-loss rates at 305, 445, and 655 °C, corresponding to the staged release of volatile compounds and the progressive cleavage of organic structures. Py-GC/MS analysis further showed a pronounced temperature dependence of the pyrolysis products. At 305 °C and 445 °C, the products were mainly alkanes, with relative contents of 84.9% and 89.1%, respectively, mainly distributed in the C11–C30 carbon-number range. In contrast, at 655 °C, extensive thermal cracking of long-chain aliphatic hydrocarbons generated large amounts of light hydrocarbons (C4–C10, 42.20%) and alkenes (56.0%), accompanied by the formation of monocyclic aromatic hydrocarbons. Results demonstrate that increasing the pyrolysis temperature shifts the dominant conversion pathway from the volatilization of indigenous hydrocarbons to the thermal cracking of long-chain aliphatic structures, providing new insights into the thermal conversion mechanism and resource utilization of RWTS.

1. Introduction

Refinery water treatment sludge (RWTS), as one of the oily sludges, is a hazardous waste generated during petroleum refining and its wastewater treatment process, among which dissolved air flotation (DAF) sludge is an important component [1,2,3]. It is estimated that global oil refineries produce more than 60 million tons of oily sludge annually, and this amount continues to increase year by year [3,4,5]. Notably, oily sludge was officially categorized in China’s National List of Hazardous Wastes in 2016, requiring mandatory harmless treatment. The treatment of oily sludge poses significant challenges due to its complex composition and diverse organic constituents [5,6,7]. Currently, various treatment methods have been researched, including solvent extraction, incineration, ultrasonic treatment, hot washing, pyrolysis, and biological treatment [8,9,10,11,12].
Compared with conventional oily sludge treatment methods, such as landfilling or incineration, pyrolysis demonstrates superior efficiency in energy and resource recovery while generating significantly lower environmental impact [13]. Broadly speaking, thermal conversion generally refers to the complex physical and chemical processes in which raw materials undergo thermal decomposition in a non-oxidative atmosphere [14]. During this process, thermally unstable adsorbates and chemical bonds are desorbed and cleaved, respectively, resulting in the formation of volatile compounds and carbonized residues [15]. Temperature, as the primary factor influencing the degree of thermal decomposition, has been extensively studied in terms of pyrolysis kinetics, product yield, and quality [16]. In comparison, pyrolysis treatment technology offers advantages such as high efficiency and high processing capacity [17].
As mentioned earlier, pyrolysis is an effective method for the hierarchical utilization of waste resources [18]. The pyrolysis of oil-containing sludge can produce char, pyrolysis oil, and product gas. However, by varying the operating conditions, there might be significant differences in the yield and distribution of pyrolysis products [19]. Pyrolysis-gas chromatography/mass spectrometry (Py-GC/MS), a commonly employed online analytical technique in thermochemical conversion studies, enables real-time separation and both the qualitative and quantitative analysis of pyrolysis volatiles, and is thus extensively utilized for examining pyrolysis behavior and product distribution [20,21].
Regarding Py-GC/MS, relevant studies have been carried out by several researchers. Chen et al. [22] investigated the evolution of volatile matter during the pyrolysis of oily sludge from one petroleum refinery wastewater treatment plant using TGA-MS and Py-GC/MS. They captured and analyzed the volatiles in two temperature ranges, 60–360 °C and 360–550 °C, and identified more than 300 compounds. It was found that in the 60–360 °C range, the volatiles were dominated by saturated aliphatic hydrocarbons (accounting for 68.69%), whereas in the 360–550 °C range, the proportions of light aliphatic hydrocarbons and monocyclic aromatic hydrocarbons increased, and the relative content of unsaturated aliphatic hydrocarbons rose to 33.81%. In another paper, Chen et al. [23] used TG-MS and Py-GC/MS for the first time to investigate the release characteristics of N/S/Cl pollutants in detail during the pyrolysis and combustion of oily sludge, establishing a database for pollutant release.
With respect to the effect of temperature on pyrolysis product distribution, studies have shown that pyrolysis temperature is a key parameter. Wan et al. [16] conducted fixed-bed pyrolysis experiments on refinery oily sludge in the range of 250–850 °C and found that the maximum oil yield occurred at 500 °C, while secondary cracking reactions occurred at higher temperatures to generate gas. The formation of polycyclic aromatic hydrocarbons (PAHs) also showed a clear temperature dependence, with 4-ring and 5-ring PAHs being mainly generated at higher temperatures. In addition, Hao et al. [24] systematically studied the rapid pyrolysis product distribution of oil sand bitumen using Py-GC/TOF-MS, and found that in the range of 500–700 °C, alkenes were the most abundant components in the volatiles, whereas aromatic hydrocarbons became dominant as the temperature was raised to 800 °C.
However, most of the above studies mainly focused on overall pyrolysis product yields of fixed-bed reactors, while seldom paying attention to the temperature-dependent evolution of group-composition and carbon-number distribution of volatiles by Py-GC/MS. Furthermore, the systematic investigation of the temperature-dependent evolution of the group composition of rapid pyrolysis products remains insufficient. Therefore, the chemical structure characteristics and transformation mechanisms of pyrolysis products in different temperature intervals are worth exploring.
In contrast, this study focused on refinery wastewater treatment sludge (RWTS), which has a distinct formation process and physicochemical composition. This study systematically investigated the physicochemical properties and pyrolysis characteristics of the RWTS collected from one refinery in Xinjiang, China, using proximate/ultimate analysis, Fourier transform infrared (FTIR), thermogravimetric (TG) analysis, and Py-GC/MS techniques. Its composition and structure characteristics were investigated. In addition, the composition and distribution of the rapid pyrolysis products derived from the sludge under different temperatures were also analyzed. This study innovatively integrates RWTS structural characterization with temperature-dependent volatile evolution, systematically correlating initial organic structure, TG-DTG decomposition, group composition, and carbon-number distribution to reveal the transition from indigenous-hydrocarbon volatilization to long-chain-aliphatic cracking upon temperature rise.

2. Materials and Methods

2.1. Experimental Materials

During oil-pipeline cleaning at the Urumqi Petrochemical Refinery, Xinjiang, China, high-temperature and high-pressure steam is introduced into the pipelines to remove residual oil and deposits. The resulting oil-water-sludge mixture is cooled and transferred to a settling tank. During settling, part of the solid material deposits at the bottom, while the lighter oil-containing fraction floats on the water surface and forms floating sludge (RWTS). The RWTS sample used in this study was collected from this floating fraction. The collected sample was naturally dried for 48 h prior to sample preparation. The moisture content of the resulting air-dried sample, determined according to Chinese National Standard GB/T 212–2008, was 0.90%. The dried sample was then ground using a mortar and passed through a 200-mesh sieve. The prepared sample was thoroughly mixed before subsequent analyses and temporarily stored in a desiccator to minimize moisture uptake. Although the potential loss of volatile organic compounds during natural drying cannot be completely excluded [24], the low residual moisture content indicates that the sample had reached a relatively stable low-moisture state before subsequent analyses. Therefore, the later results were interpreted based on the naturally dried RWTS.

2.2. Analytical Methods

The moisture, ash, volatile matter, and fixed carbon contents of the RWTS were analyzed according to Chinese National Standard GB/T 212–2008. Each determination of moisture, ash, and volatile matter was performed in triplicate, and the relative deviation among replicate measurements was controlled within 3%. The reported values represent the average of the replicate measurements. The contents of the major organic elements were determined using a Vario EL III elemental analyzer (Elementar Analysensysteme GmbH, Langenselbold, Germany), which was calibrated using sulfanilamide as the standard reference reagent; the relative deviations of two repeated measurements were both less than 5%, and the results met the evaluation criteria for elemental analysis testing.
The functional group distribution of the sample was analyzed using a VERTEX 70 RAMI Fourier transform infrared (FTIR) spectrometer (Bruker Optics GmbH & Co. KG, Ettlingen, Germany). The sample pellet was prepared by mixing the sludge sample with KBr (mass ratio of sludge sample to KBr was 1:160), and the pellet was dried in an oven at 60 °C for 8 h. The FTIR spectrum of the sample was recorded by collecting 64 scans at a resolution of 4 cm−1with a measuring region of 4000–400 cm−1. Peak deconvolution of the sample’s FTIR spectrum was performed using PeakFit 4 software (version 4.12, Systat Software, Inc., San Jose, CA, USA), and the Voigt function was employed for peak fitting of the infrared spectral data. A quadratic baseline without curvature constraints was selected for baseline correction. During the fitting process, strict constraints were imposed, including positive peak heights, full widths at half maximum (FWHM) in the range of 1–60 cm−1, and allowing each sub-peak position to shift within ±10 cm−1 relative to the standard functional group wavenumber to accommodate actual spectral deviations. The iterative fitting parameters were set with a maximum of 1000 iterations, 100 fine iterations, and a step size of 0.05. The convergence criteria were defined as a threshold of 1 × 10⁻⁶ for the coefficient of determination (R2), 1 × 10⁻⁵ for the chi-square change, and 1 × 10⁻⁴ for parameter variation, thereby ensuring the accuracy and stability of the peak-fitting results.
The mass loss (ML) of the sample during pyrolysis was conducted using high-purity nitrogen as the carrier gas, and heated from room temperature to 1000 °C at the rate of 10 °C·min−1 with a STA7300 thermogravimetric-differential thermal analyzer (TG-DTG, Hitachi High-Tech Science Corporation, Tokyo, Japan). The test sample mass was 8–10 mg, an alumina crucible was applied, and the gas flow rate was maintained at 50 mL/min. The TG-DTG experiment was conducted separately to investigate the overall thermal decomposition behavior of RWTS [25].
The composition and distribution of the pyrolysis products were qualitatively and quantitatively analyzed using pyrolysis-gas chromatography/mass spectrometry (Py-GC/MS), which combines flash pyrolysis with the GC/MS technique. The rapid pyrolysis experiments were performed using a Frontier EGA/PY3030D pyrolyzer (Frontier Laboratories Ltd., Koriyama, Fukushima, Japan)coupled with a Thermo Scientific TRACE 1310/ISQ LT GC/MS system (Thermo Fisher Scientific Inc., Waltham, MA, USA). The pyrolyzer was preheated and stabilized at 305, 445, or 655 °C before each experiment. During the experiment, approximately 8 mg of RWTS was placed in a quartz tube and introduced into the pyrolyzer preheated to the selected temperature for instantaneous pyrolysis for 12 s each time. The pyrolyzer–GC interface temperature was maintained at 280 °C, and the transfer line temperature was maintained at 250 °C. The GC oven temperature was initially maintained at 40 °C for 2 min, followed by heating to 300 °C at a rate of 10 °C·min−1 and holding at 300 °C for 5 min. The volatile products generated during rapid thermal decomposition were immediately transferred into the GC/MS system for separation and identification. A solid residue may remain after pyrolysis, but it was not collected or characterized in the present Py-GC/MS experiment. Similarly, permanent gaseous products were not quantitatively analyzed [26]. EI was the source (voltage 70 eV), and an Rtx-5 ms capillary column (30 m length × 0.25 mm internal diameter × 0.25 μm film thickness) was selected as the separation column, with high-purity helium as the carrier gas; the flow rate was 1.0 mL·min−1, the mass-to-charge ratio (m/z) scanning range was 40–500, and the split ratio was 50:1. The acquired data were processed using Agilent ChemStation software (version B.04.03, Agilent Technologies, Inc., Santa Clara, CA, USA). Compounds were identified by comparison with the NIST20.L standard spectral library, and only compounds with the first-ranked matching factor were retained in the table. Their relative contents were calculated using the peak area normalization method.

3. Results and Discussion

3.1. Proximate and Ultimate Analyses

The results of the proximate and ultimate analyses are presented in Table 1. Proximate analysis showed that the dried RWTS had a low moisture content but a high ash content of 28.50%. The ash is derived from natural inorganic matter entrained during crude oil extraction, transport, and refining, and likely consists of sediment, clay minerals (such as kaolinite), quartz sand, calcium carbonate (CaCO3), and various mineral salts. The volatile matter (V) content of RWTS was as high as 64.69%, while the fixed carbon (FC) content was only 5.91%, indicating that the RWTS is rich in volatile substances and contains readily decomposable organic components, which is favorable for the production of small-molecule compounds during pyrolysis.
Elemental analysis showed that RWTS had a carbon content of 49.18% and an H/C molar ratio of 1.80, indicating that it is rich in hydrocarbon components with pronounced aliphatic characteristics. Its oxygen content was also as high as 39.10%, suggesting the presence of abundant oxygen-containing functional groups. Furthermore, the sulfur and nitrogen in RWTS are primarily derived from crude oil, and are transferred and enriched into the sludge during refining and subsequent wastewater treatment.
Overall, the high volatile matter content, high H/C ratio, and abundant oxygen-containing functional groups indicate that RWTS is a suitable feedstock for thermochemical conversion, which provides a compositional basis for the subsequent TG-DTG and Py-GC/MS analyses.

3.2. FTIR Analysis

3.2.1. Types of Functional Group

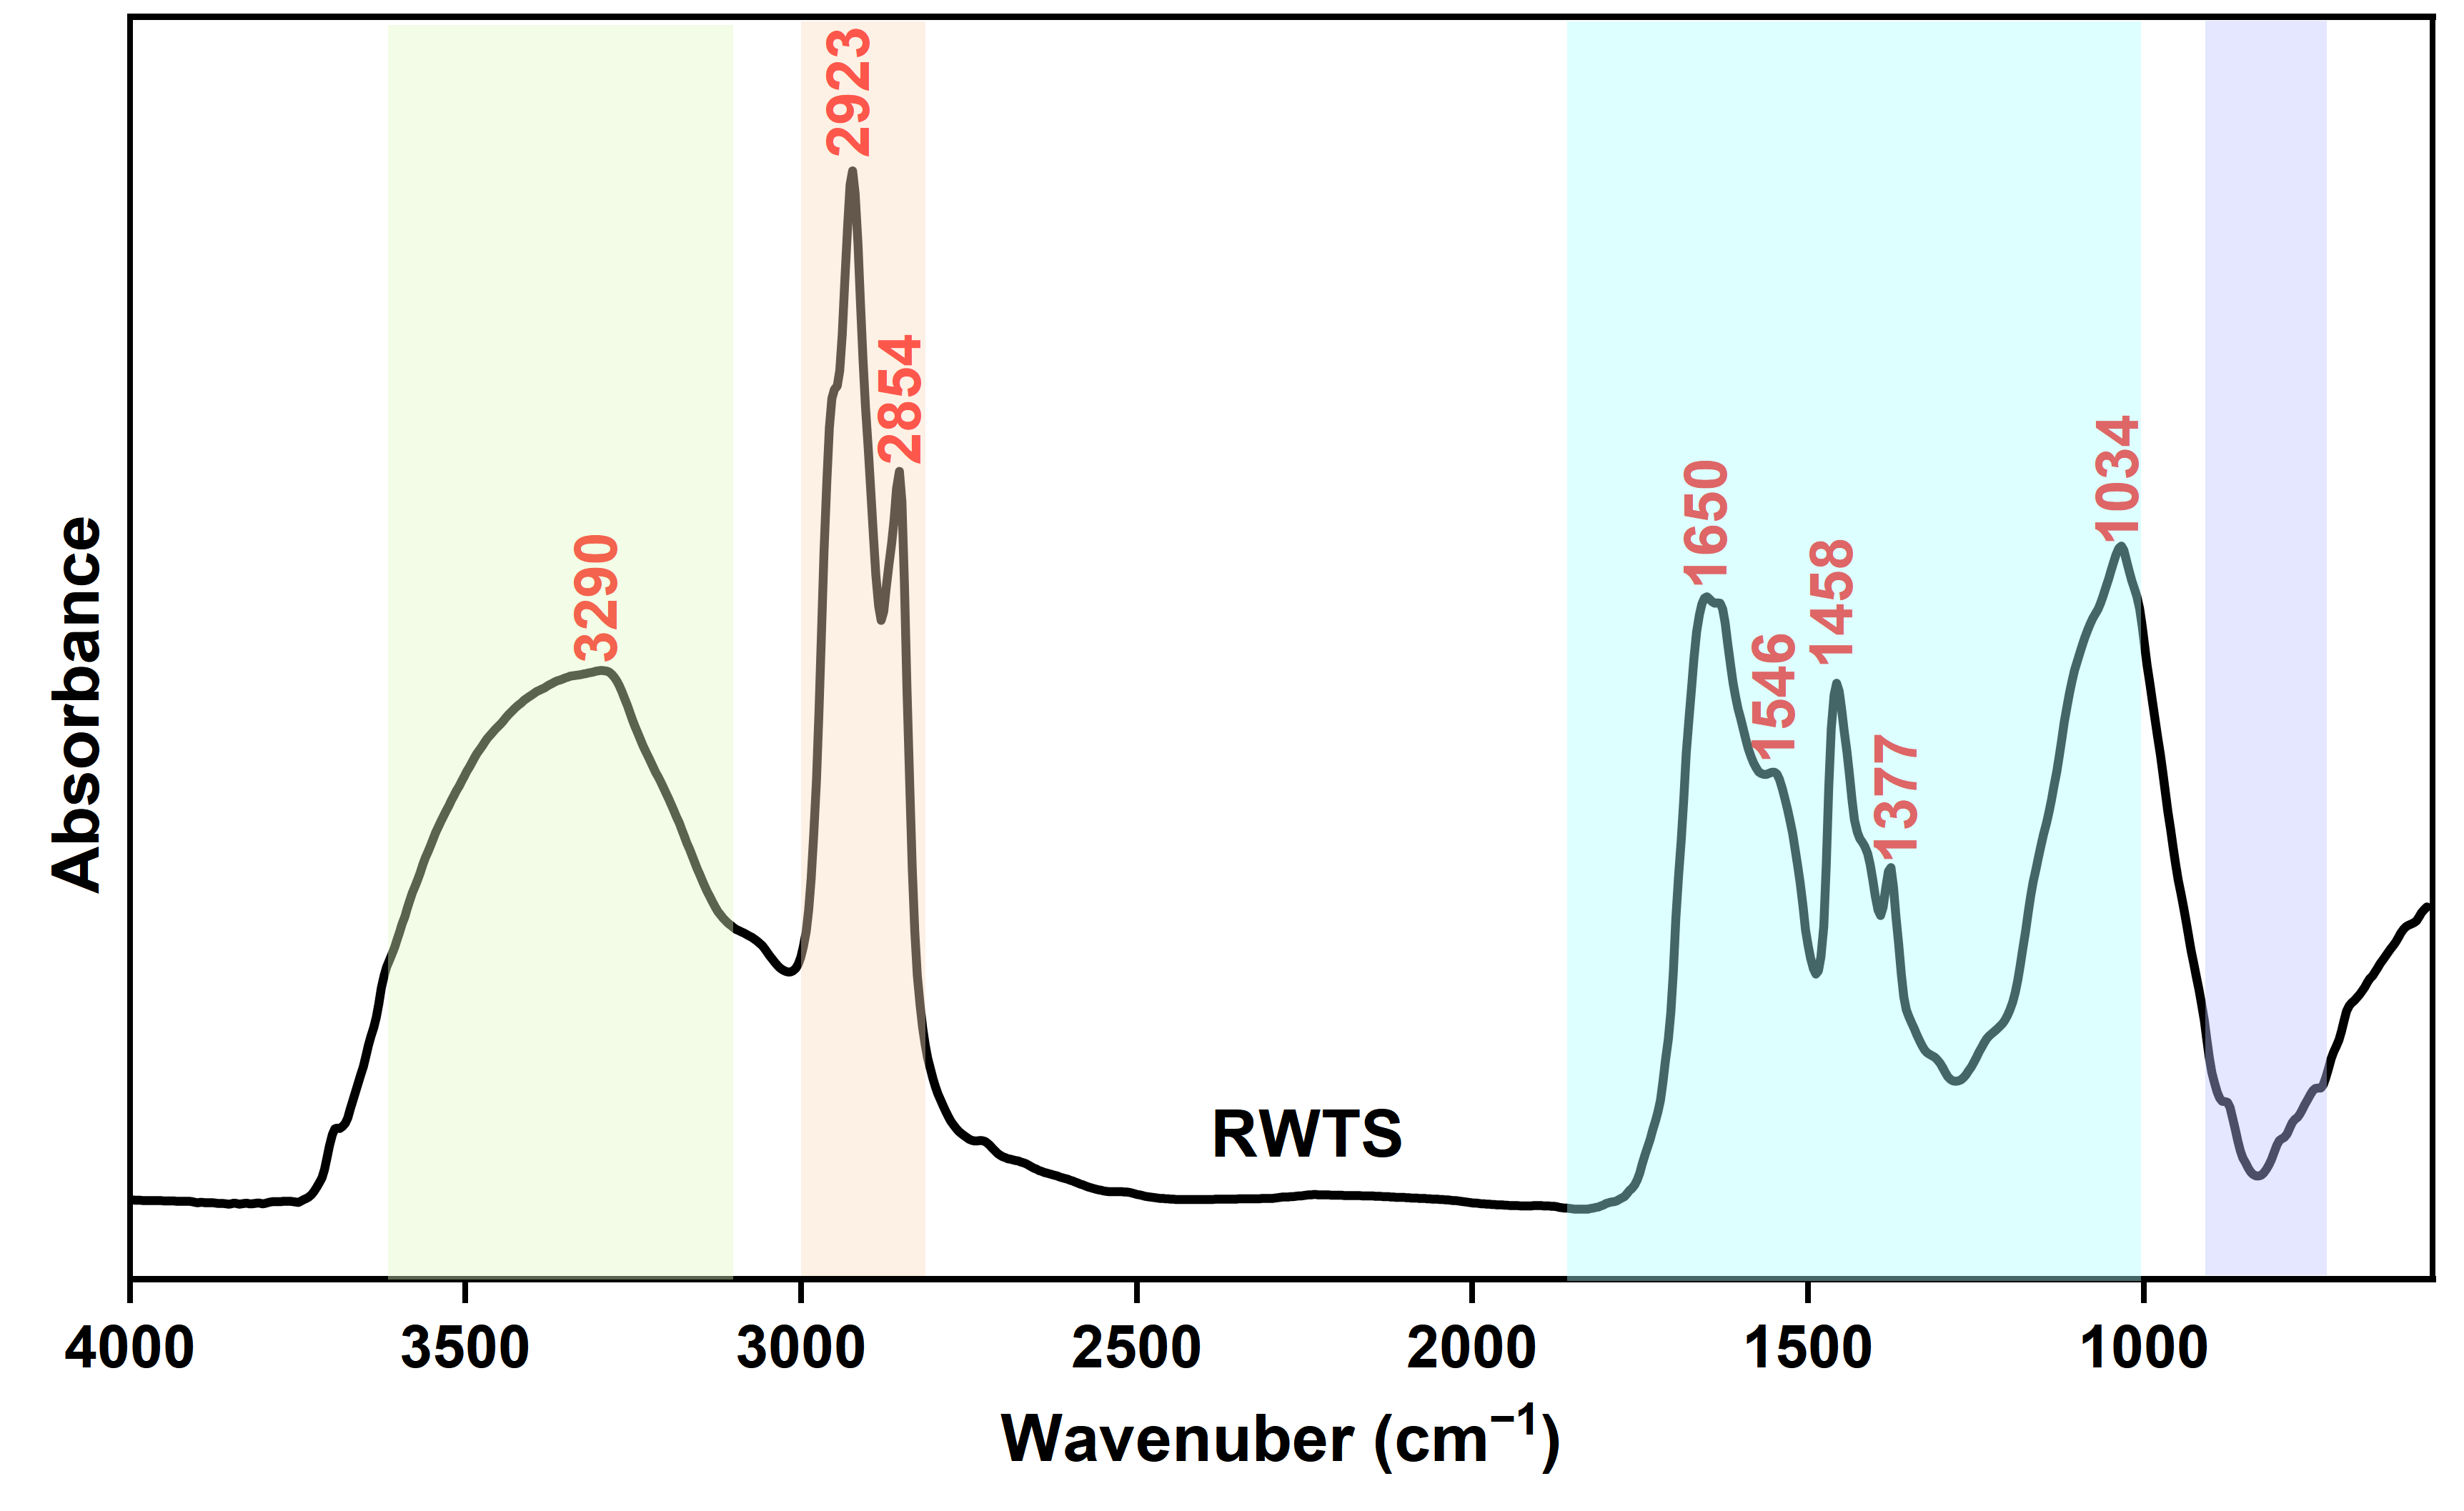
As observed in Figure 1, the FTIR spectrum of the RWTS exhibited a weak absorption peak in the 900–700 cm−1 region, indicating a low abundance of aromatic compounds. Minor peaks were present at 1377 cm−1 and 1458 cm−1, assigned to the asymmetric bending vibrations of -CH3 and -CH2 groups, respectively. Similarly, minor peaks observed at 1546 cm−1 and 1650 cm−1 were attributed to C=C stretching vibrations. However, considering the relatively high ash content of RWTS, the strong absorption around 1034 cm−1 may also contain a contribution from Si–O stretching vibrations of mineral matter. The strong and sharp peaks of pronounced intensity spanning the 3000–2800 cm−1 region arose from overlapping contributions of aliphatic C–H stretching, symmetric/asymmetric -CH2 stretching, and -CH3 stretching vibrations. These results suggest that the RWTS contains abundant aliphatic moieties, which is consistent with the ultimate analysis. Additionally, a broad peak at 3290 cm−1 assigned to hydroxyl (-OH) stretching vibrations and a strong peak at 1034 cm−1 attributed to C–O stretching vibrations were observed, suggesting that the RWTS is rich in oxygen-containing functional groups. It should be noted that the broad absorption band in the 3600–3100 cm−1 region may be influenced by residual adsorbed water, and the assignments of individual hydroxyl-related sub-peaks should therefore be regarded as semi-quantitative.

3.2.2. FTIR Semi-Quantitative Analysis

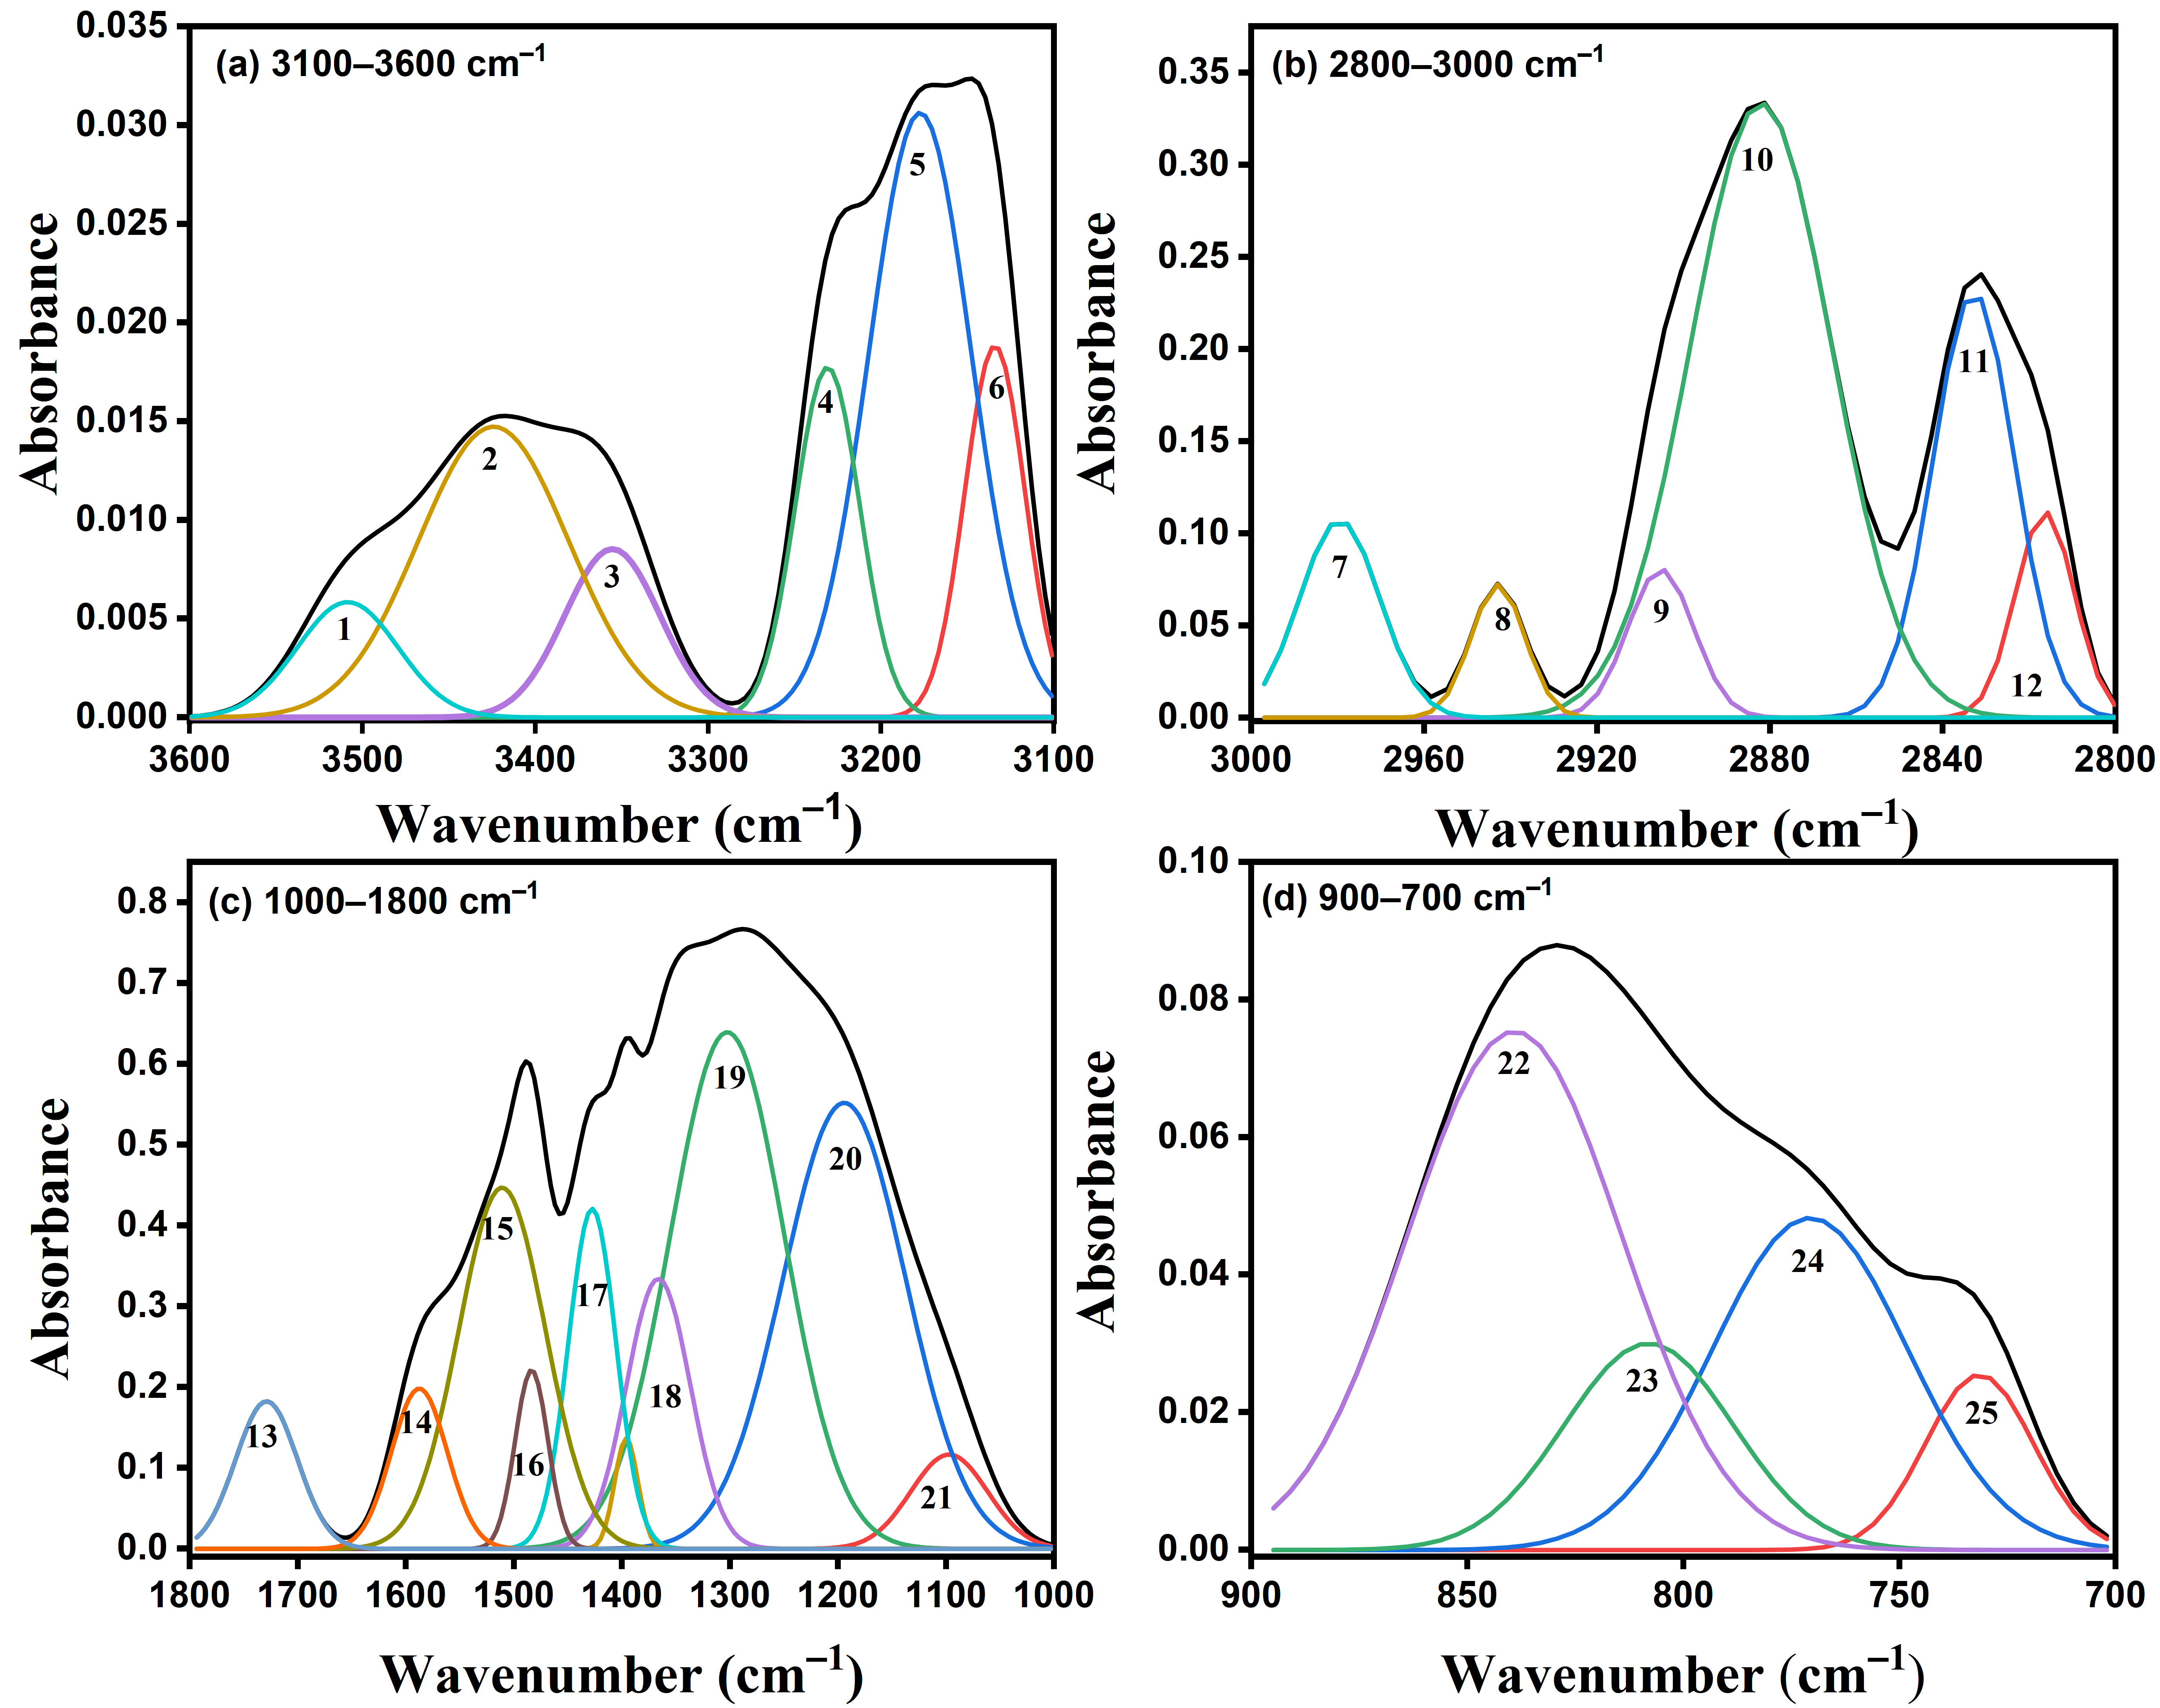
In complex multi-component systems such as RWTS, overlapping infrared bands make it difficult to resolve individual functional groups. Therefore, the FTIR spectra were deconvoluted using PeakFit 4 software [27] and divided into four regions (3600–3100, 3000–2800, 1800–1000, and 900–700 cm−1) for semi-quantitative analysis based on the integrated areas of the resolved sub-peaks. The results are presented in Figure 2, and the normalized area percentages of the sub-peaks are summarized in Table 2.
As shown in Figure 2a and Table 2, the absorption band in the 3600–3100 cm−1 region corresponded to hydroxyl (-OH) groups in the RWTS. The absorption peaks with different wavenumbers corresponded to different types of hydrogen-bonded hydroxyl groups. Self-associated hydroxyl (O–H···O) and cyclic OH-type hydrogen bonds exhibited relatively high contributions, with peak area percentages of 24.58% and 59.86%, respectively [28]. Hydroxyl-ether hydrogen bonds (O–H···O–C) showed a lower contribution of 9.01%, while hydroxyl-π bonds (O–H···π) accounted for only 6.55% [29]. These results indicate that the RWTS is rich in cyclic OH and associated hydroxyl hydrogen bonds, with only minor contributions from hydroxyl-ether and hydroxyl-π hydrogen bonds.
Figure 2b shows that curve fitting resolved the aliphatic C–H stretching vibrations into four distinct sub-peaks. The most abundant sub-peak, located at 2900–2870 cm−1 and assigned to aliphatic C–H stretching, accounted for 57.96% of the total integrated area. The second major contribution (28.19%) originated from symmetric CH2 stretching at 2870–2850 cm−1. Another sub-peak, attributed to aliphatic CH3 stretching in the 2950–2930 cm−1 range contributed 9.52%, while asymmetric CH2 stretching represented the smallest proportion (4.33%) [30]. The prevalence of aliphatic C–H bonds, particularly methylene and methyl groups, indicates that the RWTS is rich in saturated hydrocarbon chains. This structural feature is expected to favor the formation of light aliphatic hydrocarbons during pyrolysis, which is consistent with the high volatile matter content discussed in Section 3.1.
Table 2. Relative content of different functional groups in the RWTS [31].
PeakBand Position/cm−1Functional GroupArea Percentage/%
13600–3500OH-π6.55
2, 33500–3350Self-associated OH24.58
43350–3260OH-ether O9.01
5, 63260–3170Cyclic OH59.86
72950–2930Aliphatic -CH39.52
82930–2900Asymmetric aliphatic -CH24.33
9, 102900–2870Aliphatic -CH57.96
11, 122870–2850Symmetric aliphatic -CH228.19
131700Carboxylic acids C=O4.30
141650Conjugated C=O4.21
151710–1570Conjugated C=O17.52
161570–1480Aromatic C=C8.86
171480–1400Asymmetric -CH3, -CH28.13
18, 191400–1240Symmetric deformation -CH327.80
201160–1090Grease C–O25.76
211090–1030Alkyl ethers3.42
22900–860Five adjacent H deformation48.44
23860–810Four adjacent H deformation15.15
24810–750Three adjacent H deformation28.15
25750–720Two adjacent H deformation8.26
In the 1800–1000 cm−1 region (Figure 2c), the FTIR spectrum of RWTS was dominated by contributions from the symmetric deformation of -CH3, aryl ether C–O stretching, and conjugated C=O stretching vibrations [32], which together accounted for over 70% of the total integrated area. Among these, the symmetric deformation of -CH3 accounted for the largest proportion (27.80%). Aromatic C=C stretching, observed near 1514 cm−1, contributed 8.86%, while the asymmetric deformation of -CH3 and -CH2 groups near 1404 cm−1 accounted for 8.13%. In contrast, alkyl ether C–O stretching showed the lowest abundance at only 3.42%. The prominence of oxygenated functional groups (especially C=O and C-O) alongside aromatic C=C bonds suggests that RWTS contains a significant proportion of polar and aromatic structures. During pyrolysis, these functional groups are likely to decompose to form oxygen-containing and aromatic compounds. In addition, spectral overlap between conjugated C=O and aromatic C=C vibrations in the 1800–1500 cm−1 region may introduce uncertainty into the peak assignments.
Within the 900–700 cm−1 region (Figure 2d), the FTIR spectrum exhibited an uneven distribution of di-, tri-, tetra-, and penta-substituted benzene rings, with tri- and penta- substituted rings being the most abundant. The absorption band between 810–750 cm−1 was assigned to tri-substituted benzene rings, with a relative abundance of 28.15%. The band in the 900–860 cm−1 range corresponded to penta-substituted benzene rings and accounted for the highest proportion (48.44%). In contrast, di-substituted and tetra-substituted benzene rings contributed only 8.26% and 15.15%, respectively. The predominance of highly substituted aromatic rings (tri- and penta-) suggests that the aromatic structures in the RWTS are functionalized with alkyl or other substituents.

3.3. Thermogravimetric Analysis of the RWTS

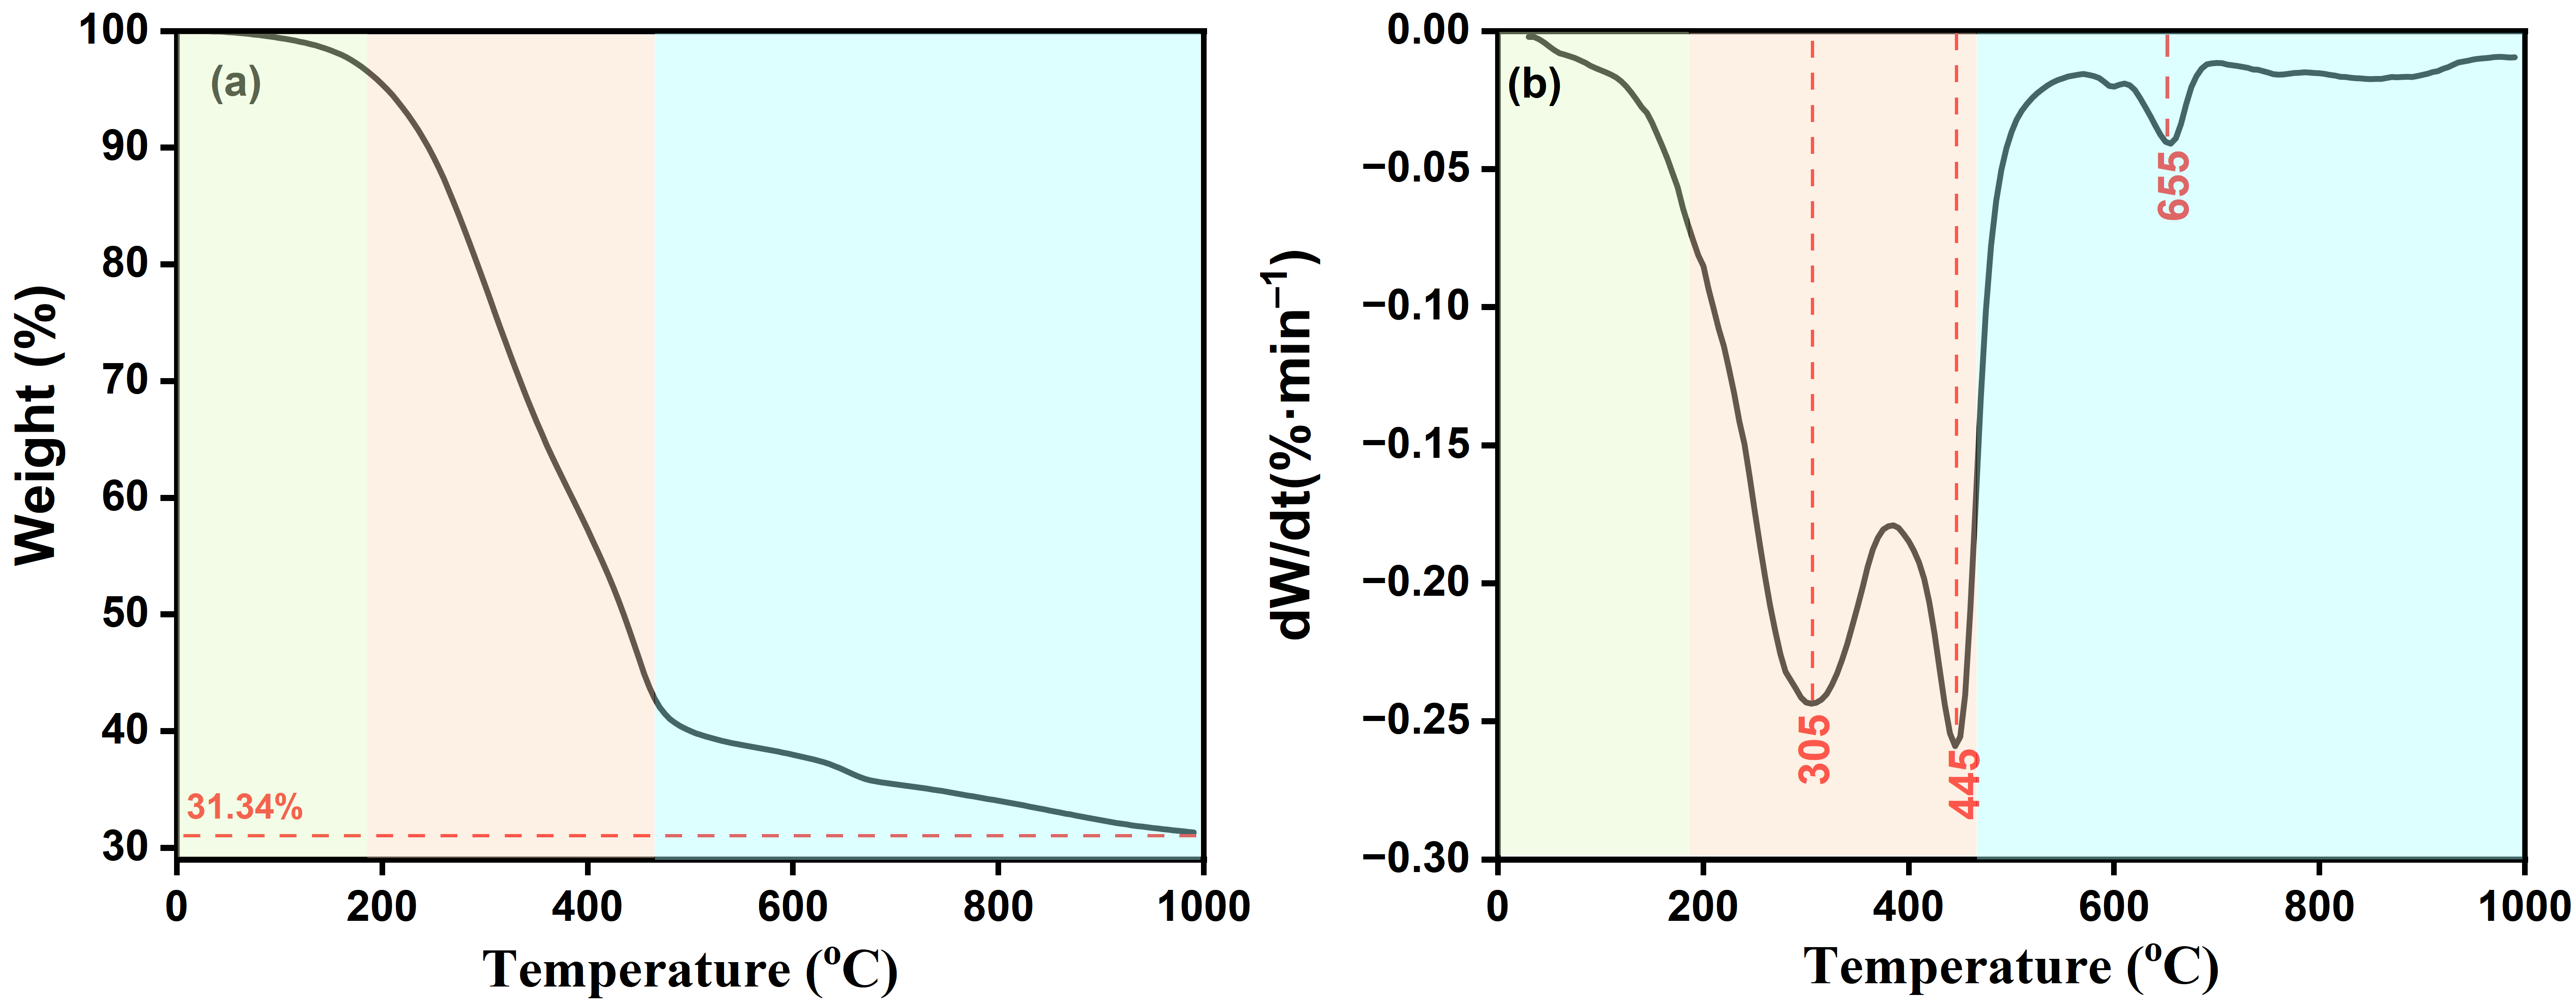
As observed from the thermogravimetric behavior (TG-DTG) profile under an inert atmosphere in Figure 3, the RWTS began to lose mass at around 40 °C, with mass loss essentially ceasing after 1000 °C. Calculations showed that the total mass loss for the RWTS sample was approximately 68.8%, indicating that under the thermogravimetric analysis conditions, the content of volatile compounds reached approximately 70%, which is close to the sum of the sample’s moisture (0.90%) and volatile content (64.69%). This result is consistent with the proximate analysis presented in Table 1.
Based on Figure 3, the pyrolysis process of the RWTS can be divided into three distinct stages. During the first stage (room temperature to185 °C), the mass loss is primarily attributed to the release of physically adsorbed moisture, bound water, and a small amount of adsorbed surface moisture and small molecules by the RWTS. Given that the sludge was air-dried, the mass loss is relatively minor.
The temperature range of 185–460 °C corresponded to the most significant stage of weight loss during the total pyrolysis process. The weight loss primarily results from the thermal decomposition of organic compounds and the release of volatiles [33]. The RWTS contains a substantial amount of organic compounds. As the temperature increases, most volatile organic compounds evaporate, while the C–C and C–H bonds in less volatile organic compounds are cleaved, generating non-condensable gases, such as CO2, CO, CH4, and H2, leading to a substantial mass reduction in the slag. The DTG curve indicates that the maximum weight loss rates occurred at 305 °C and 445 °C, reaching 0.2435%/min and 0.2589%/min, respectively. From an energy-saving perspective, the release of volatiles from the RWTS can be proceeded at lower temperatures. These two DTG peaks indicate that the decomposition of organic matter proceeds through at least two major reaction stages. Approximately 52.8% of the RWTS mass was lost during this stage, indicating that it is the dominant pyrolysis stage.
The third stage occurred within the temperature range of 460–990 °C. During this range, less volatile organic compounds continued to decompose, while some inorganic minerals also underwent thermal decomposition. Additionally, secondary reactions, such as condensation and polymerization, occurred in larger organic molecules generated by pyrolysis, leading to further weight loss. The DTG profile indicates that the maximum weight loss rate in this stage was approximately 0.04079%/min at around 655 °C, and the overall mass loss accounted for 12.45%.
Combined with the TG-DTG profiles, the two major mass-loss events at 305 °C and 445 °C were attributed to the volatilization of relatively labile organic components and the thermal cracking of more stable organic structures, respectively. Above 460 °C, aromatic structures become increasingly stable, whereas alkyl side chains and other thermally unstable substituents continue to undergo cleavage [34]. To further identify the composition and relative abundance of the pyrolysis products at these characteristic temperatures, Py-GC/MS analysis was subsequently performed.

3.4. Composition and Distribution of Py-GC/MS Products from the RWTS

3.4.1. Effect of Pyrolysis Temperature on the Group Composition of Pyrolysis Products

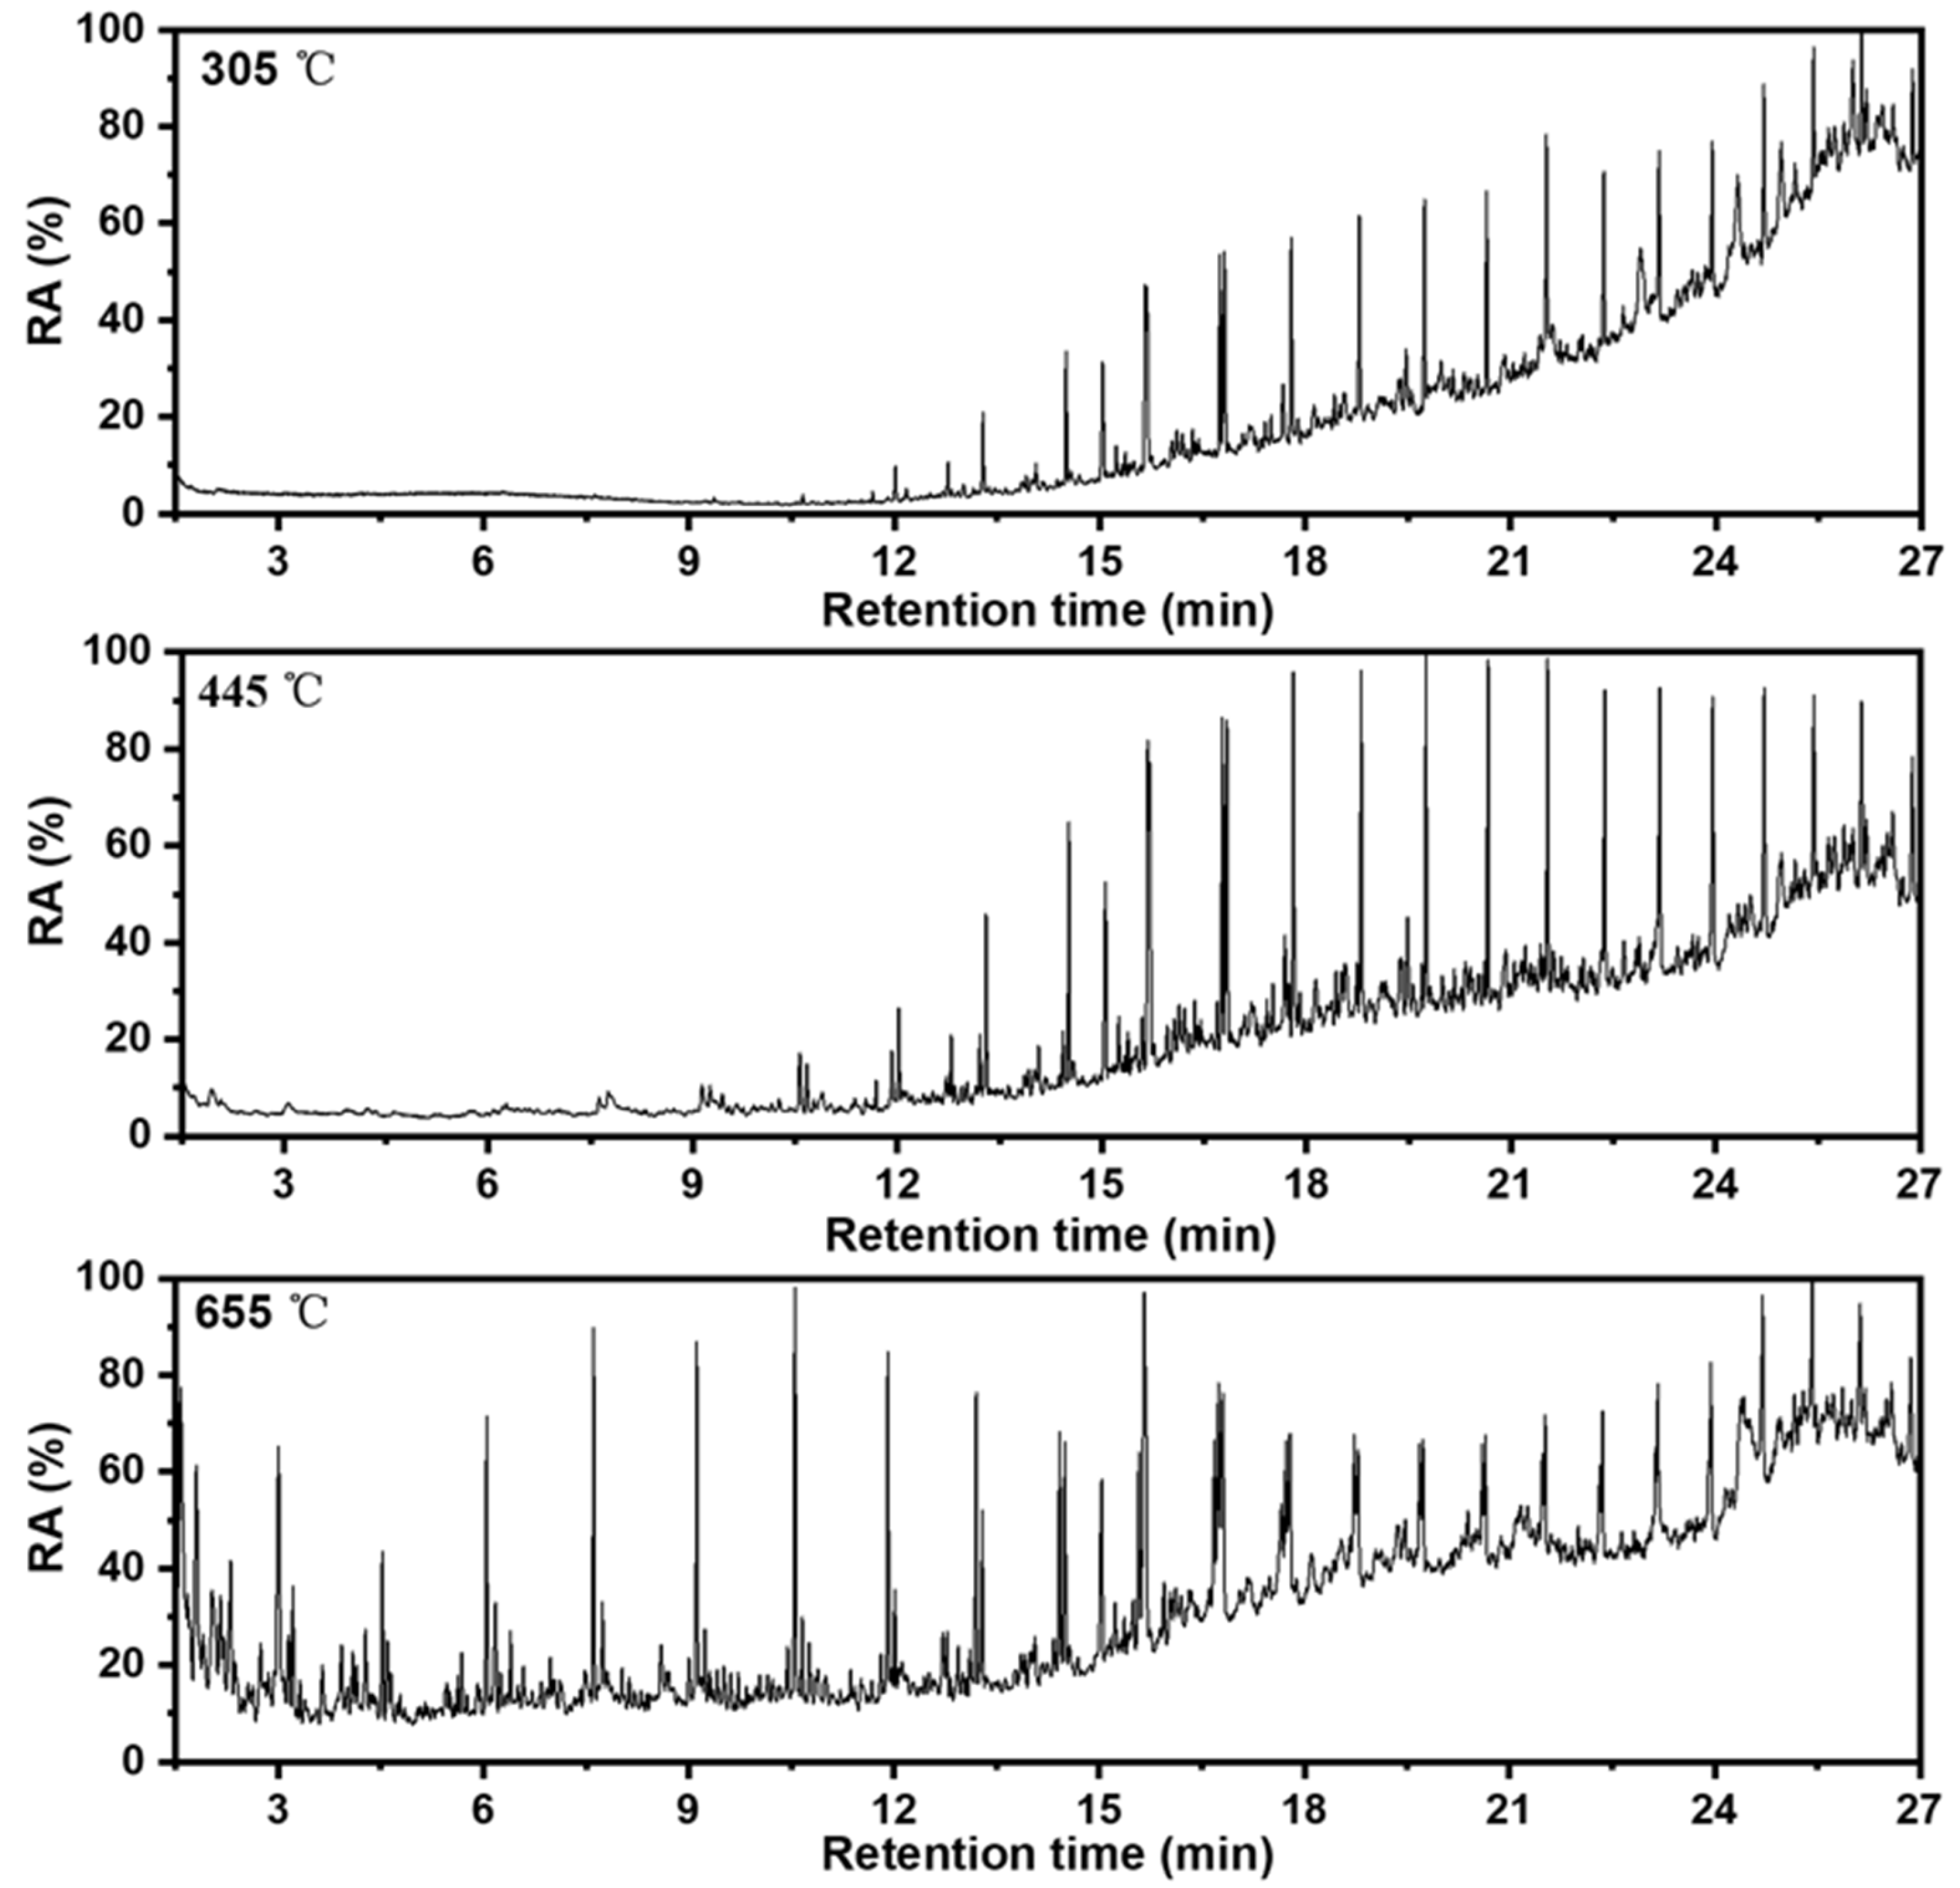
Based on the major thermal transformation regions identified by the TG-DTG analysis, 305, 445, and 655 °C were selected as representative temperatures for the Py-GC/MS experiments. The total ion chromatograms (TICs) obtained are shown in Figure 4, and baseline correction and normalization analysis were applied to the chromatograms, with the results presented in Figures S1–S3. The pyrolysis products identified at each temperature are listed in Tables S1–S3, respectively.
The TICs shown in Figure 4 reveal that the pyrolysis product distributions at 305 °C and 445 °C were broadly similar, with the majority of components eluting after a retention time of 10 min. These components were mainly the original volatile molecules in the RWTS. In contrast, the profile at 655 °C was distinctly different, characterized by a substantial proportion of light components eluting before 10 min. These low-molecular-weight compounds were likely generated from the thermal degradation of larger molecular structures in the RWTS under high-temperature conditions [35].
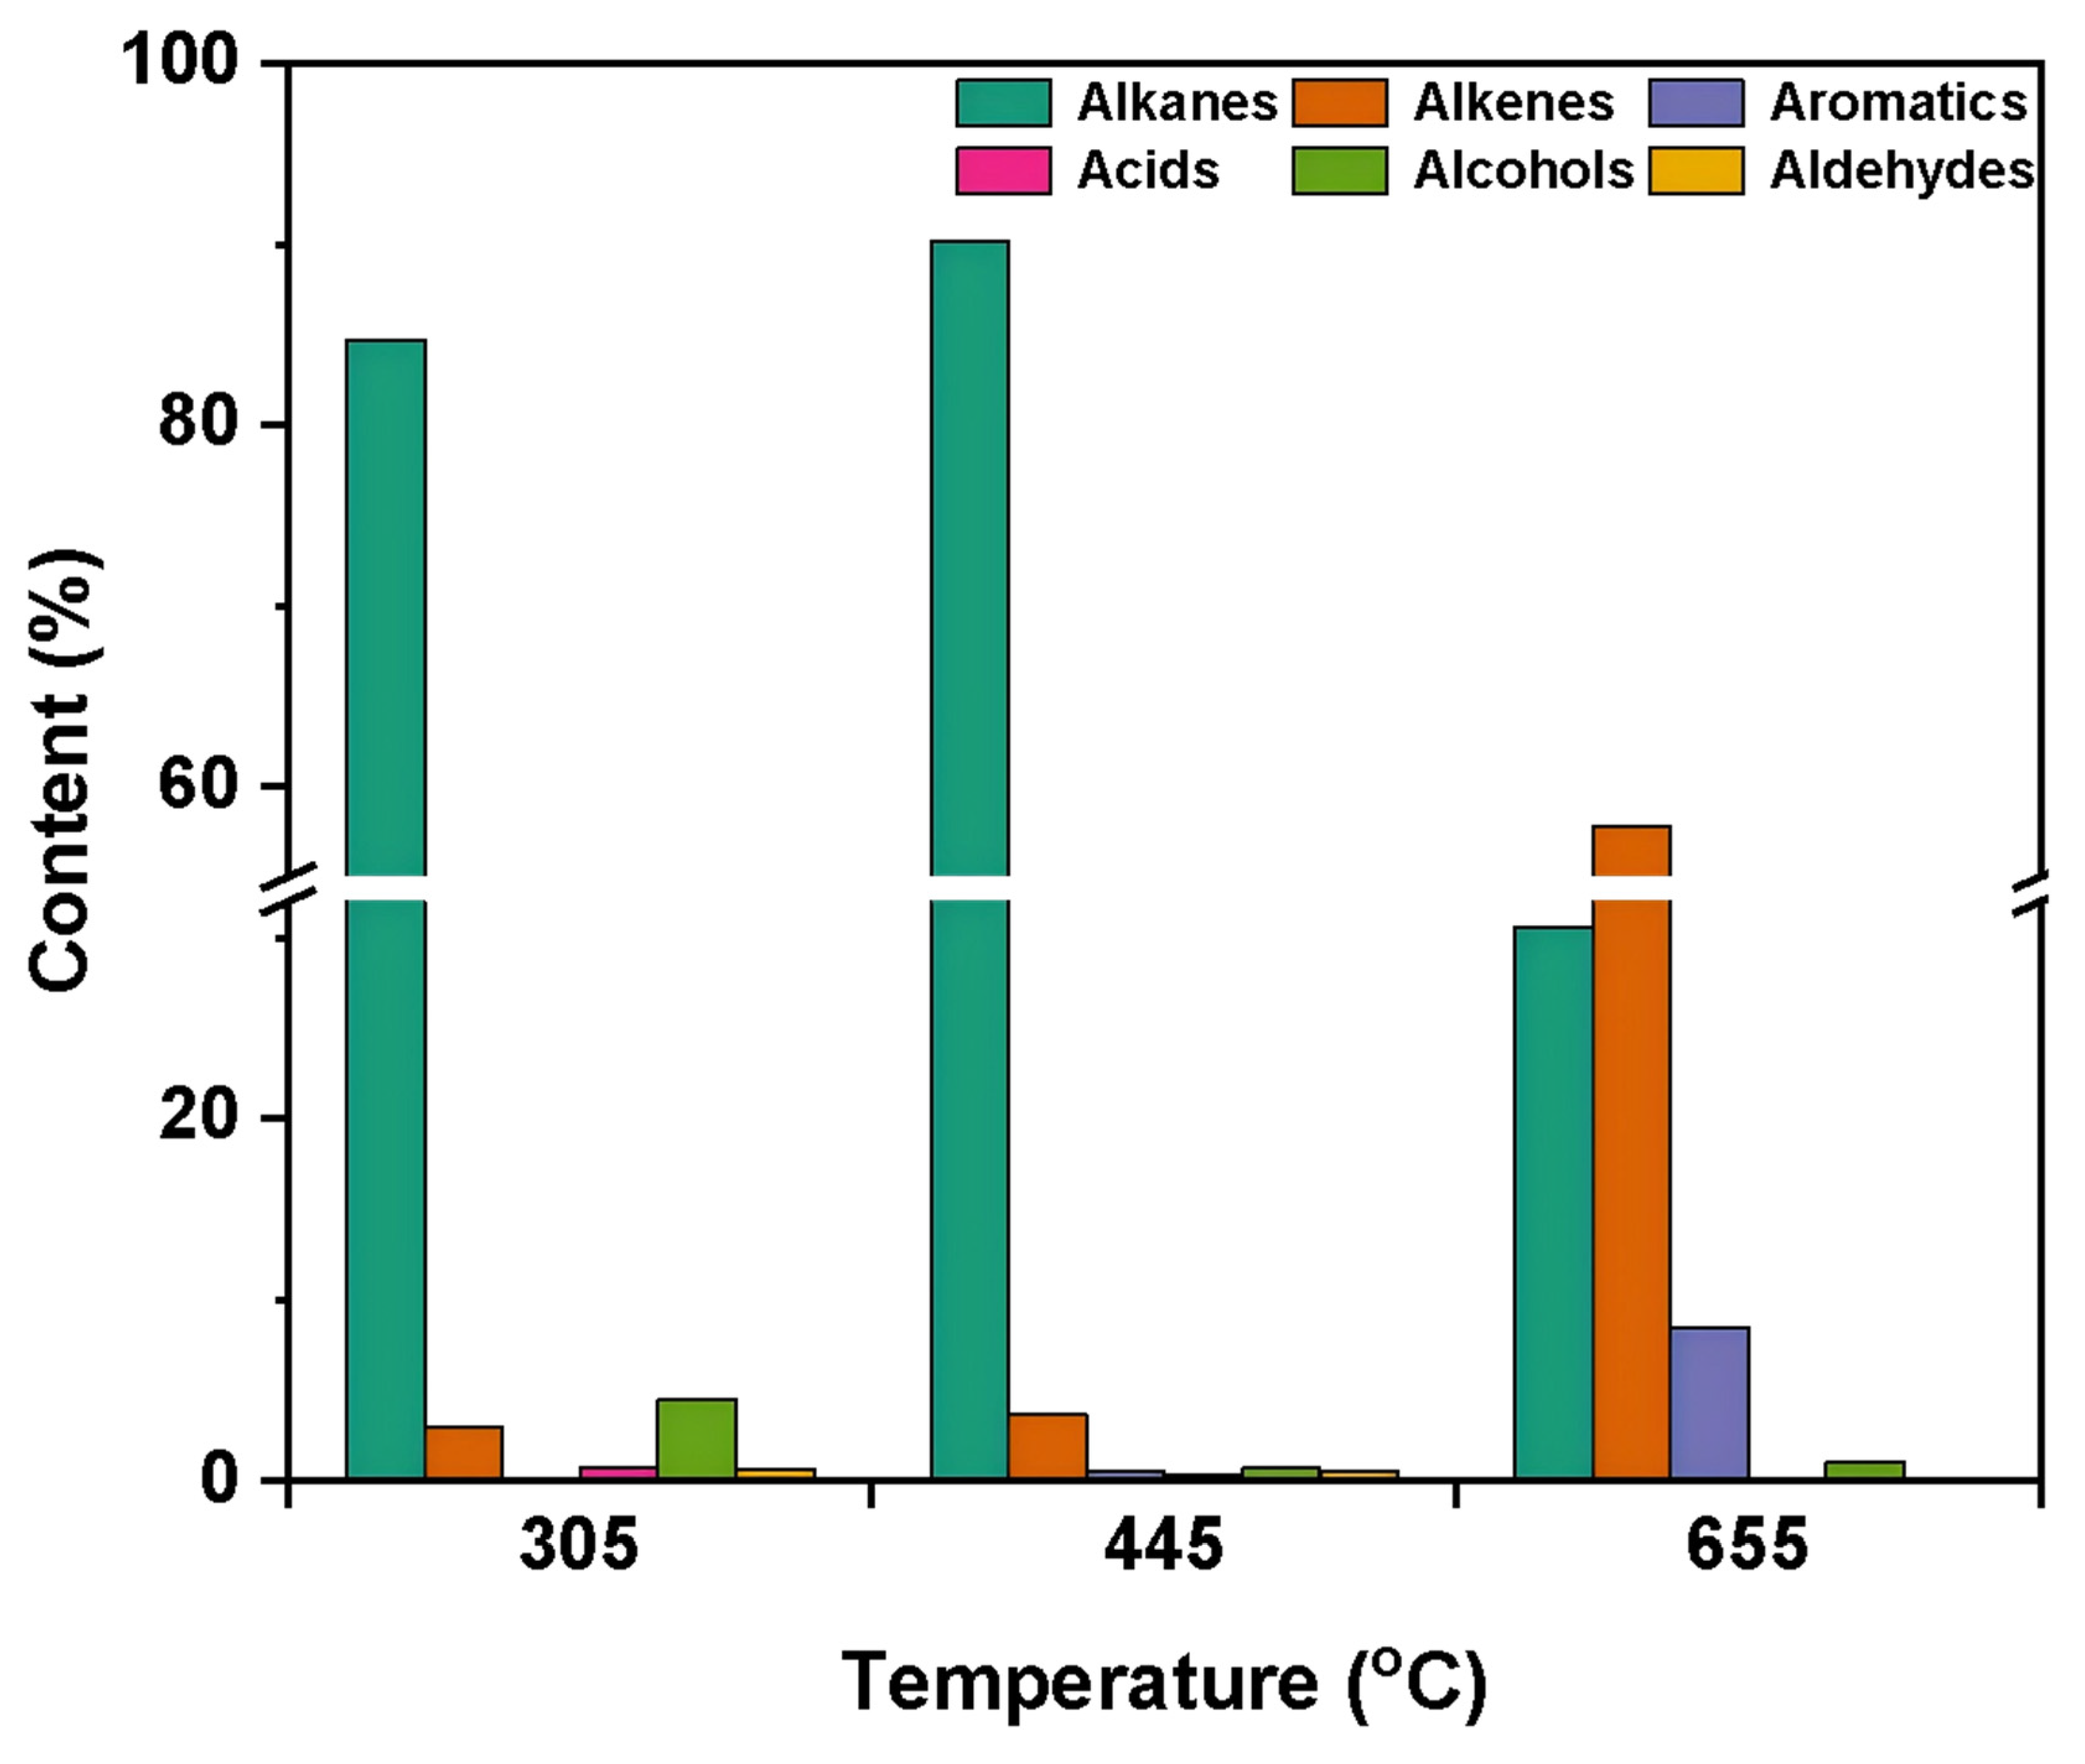
The group composition distributions of the pyrolysis products at different temperatures were analyzed according to the compound types and their relative contents as listed in Tables S1–S3, with the results illustrated in Figure 5. As shown in Figure 5, the product compositions obtained at 305 °C and 445 °C were similar, whereas those at 655 °C were notably different from those at the lower temperatures. This indicates that high temperatures promote the cleavage of strong covalent bonds in the RWTS, generating low-molecular-weight compounds, which is consistent with the TG-DTG results [36].
As presented in Tables S1 and S2 and Figure 5, alkanes dominated the pyrolysis products at 305 °C and 445 °C, with relative contents of 84.9% and 89.1%, respectively. In addition, small amounts of alkenes, alcohols, carboxylic acids, and aldehydes were also detected. These alkanes were mainly derived from the volatilization of hydrocarbons originally present in the RWTS during pyrolysis. This observation is consistent with the first major mass-loss stage in the TG-DTG curves, indicating that volatilization rather than extensive bond cleavage dominates at these temperatures. Compared with those at 305 °C, the pyrolysis products at 445 °C showed increased contents of alkanes and alkenes, while the alcohol content decreased markedly. This indicates that some alkanes may undergo cracking to form alkenes at higher temperatures, and alcohols may undergo deoxygenation to produce alkanes or alkenes [37]. Meanwhile, the increase in alkene content suggests that thermal cracking became more significant, although the volatilization of heavy hydrocarbons remained the dominant process at this stage.
As shown in Table S3 and Figure 5, in contrast to the products at 305 °C and 445 °C, those obtained at 655 °C showed a sharp decline in alkane relative abundance to 32.4%, accompanied by a substantial increase in alkenes to 56.0% and a moderate rise in aromatics to 6.7%. These observations strongly suggest that the alkenes are predominantly derived from the thermal cracking of alkanes at elevated temperatures. The marked increase in low-carbon alkenes indicates that extensive β-scission of long-chain aliphatic hydrocarbons occurs at high temperatures, producing a large number of small unsaturated molecules. The aromatic products are mainly monocyclic aromatic hydrocarbons, suggesting that the aromatic ring structures in the RWTS are predominantly monocyclic, which is consistent with the FTIR results showing a relatively low abundance of aromatic C=C structures.
Furthermore, at 655 °C, the pyrolysis products exhibited a marked reduction in oxygen-containing compounds (e.g., alcohols, aldehydes, and acids), suggesting that high temperatures favor the removal of oxygen-bearing functional groups, which are primarily released as CO, CO2, and H2O into the gas phase. This trend is also consistent with the FTIR analysis, which indicates the presence of abundant C–O and C=O functional groups that readily undergo deoxygenation, decarboxylation, and decarbonylation during pyrolysis. Meanwhile, sulfur- and nitrogen-containing compounds were scarcely detectable in the product stream, likely due to their conversion into gaseous products during pyrolysis or retention in the semi-coke in relatively stable forms. Overall, increasing the pyrolysis temperature shifts the dominant reaction pathway from the volatilization of native hydrocarbons to the thermal cracking of long-chain aliphatic compounds, resulting in the formation of more low-molecular-weight alkenes and aromatic hydrocarbons.

3.4.2. Temperature-Dependent Modulation of CN Distributions for Pyrolysis Products

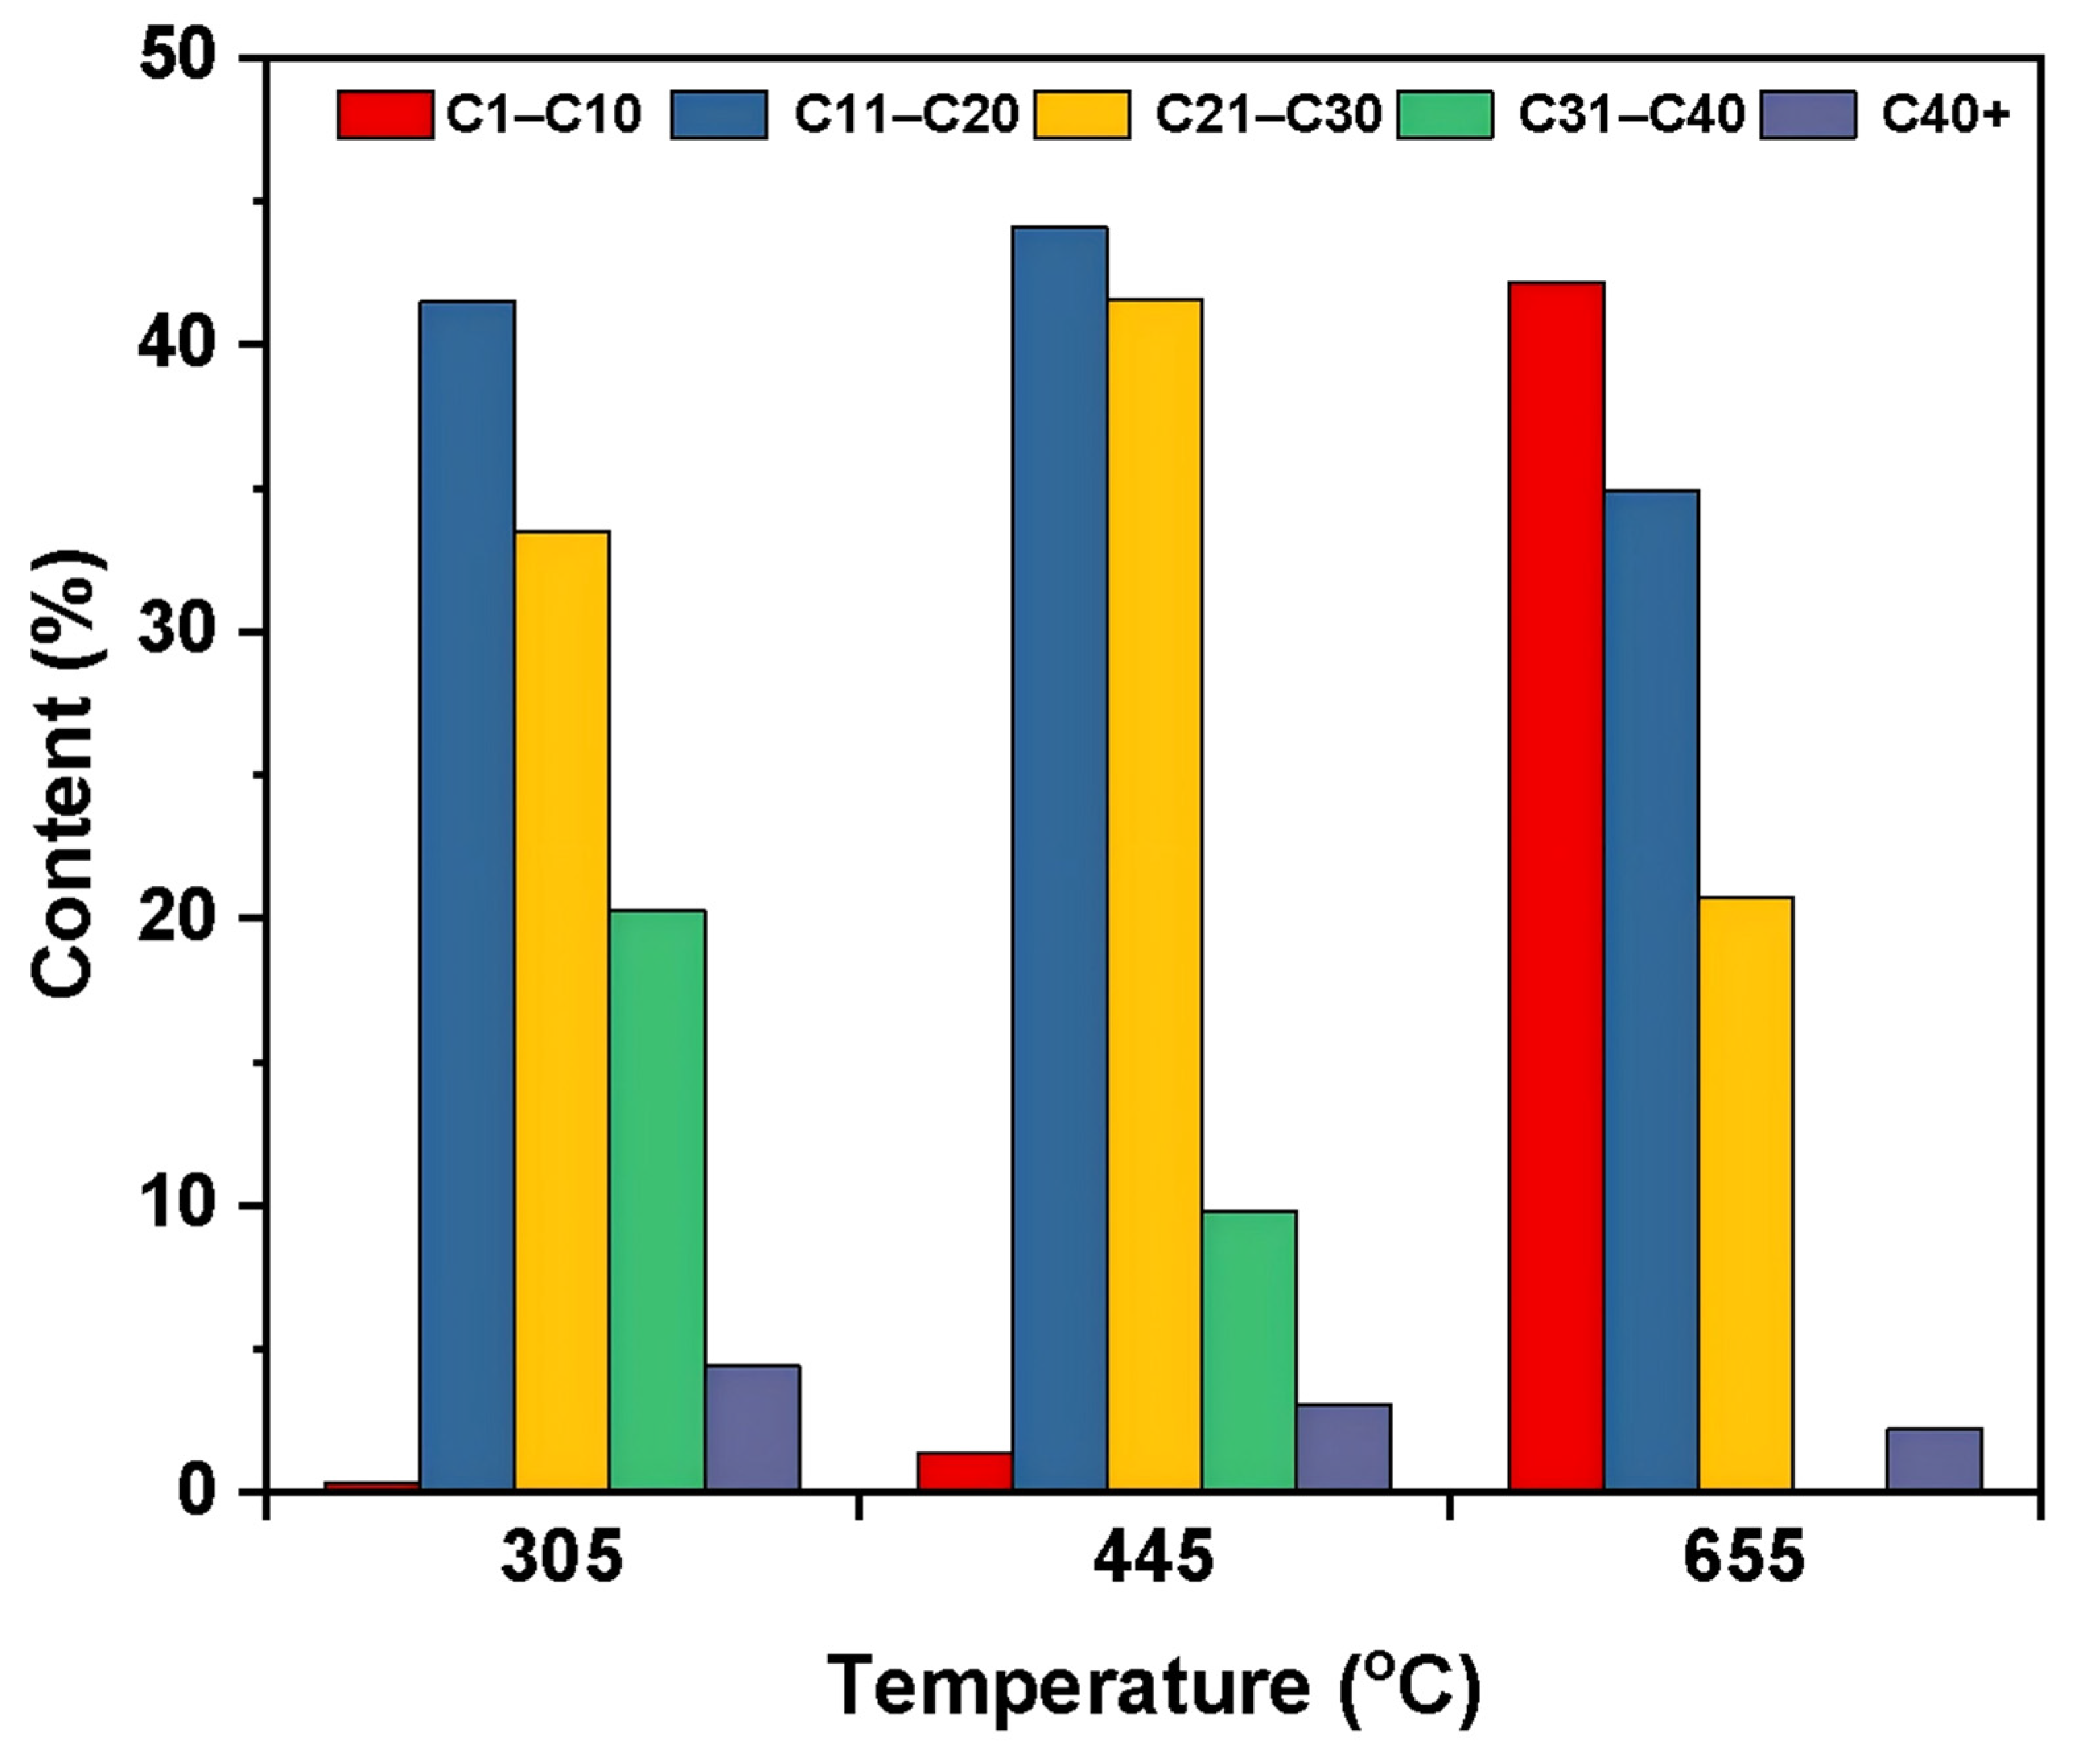
To gain deeper insight into the pyrolysis behavior of RWTS, the detected compounds at different temperatures were classified according to their CN, grouped into four fractions: C4–C10, C11–C20, C21–C30, and C31–C40. The relative abundances of these fractions at 305 °C, 445 °C, and 655 °C are summarized in Figure 6.
As the pyrolysis temperature increased, the CN distribution of the products shifted progressively toward lower carbon numbers. The proportion of C4–C10 compounds increased only slightly from 305 to 445 °C but rose sharply to 42.20% at 655 °C. In contrast, the relative abundance of C11–C20 compounds remained nearly constant below 445 °C and then decreased by 9.2% at 655 °C. The C21–C30 fraction first increased by 8.12% at 445 °C and then decreased markedly at 655 °C, whereas the abundance of C30+ compounds continuously declined from 24.66% at 305 °C to 12.90% at 445 °C and further to only 2.20% at 655 °C. These results demonstrate a progressive conversion of high-carbon-number hydrocarbons into lighter products with increasing temperature [21].
The evolution of the CN distribution provides direct evidence for the transformation pathway of organic matter during RWTS pyrolysis. At temperatures ≤445 °C, the products were dominated by medium- and long-chain hydrocarbons (C11–C30), indicating that the volatilization of indigenous hydrocarbons is still the primary process, accompanied by only limited thermal cracking. The temporary increase in the C21–C30 fraction at 445 °C may be associated with the release of indigenous high-boiling-point hydrocarbons. However, secondary reactions involving radical intermediates cannot be excluded. During thermal decomposition, radicals generated from the cleavage of C–C and C–H bonds may undergo recombination or condensation reactions, potentially contributing to the formation or enrichment of intermediate-molecular-weight products. Since the present Py-GC/MS analysis does not provide direct evidence for distinguishing these pathways, the observed increase in the C21–C30 fraction should be interpreted as the combined result of volatilization and possible secondary reactions. In contrast, at 655 °C, the sharp increase in C4–C10 products together with the almost complete disappearance of C30+ compounds indicates that extensive cleavage of long-chain aliphatic hydrocarbons became the dominant reaction pathway. This observation agrees well with the group-composition analysis (Section 3.4.1), in which alkenes became the predominant products at 655 °C. The simultaneous increase in low-carbon-number compounds and alkenes suggests that β-scission is the principal cracking mechanism responsible for converting long-chain hydrocarbons into light unsaturated products [38].
Furthermore, the CN evolution was generally consistent with the FTIR and TG-DTG results. FTIR analysis showed that RWTS contains abundant aliphatic C–H groups, which may provide a structural basis for the formation of long-chain hydrocarbons. The TG-DTG curves showed a major mass-loss region above 445 °C, indicating extensive thermal decomposition in this temperature range. With increasing pyrolysis temperature, the product distribution shifted from medium- and long-chain hydrocarbons toward low-carbon-number hydrocarbons and light alkenes. This trend may be associated with the enhanced thermal cracking of long-chain aliphatic structures at higher temperatures. The temperature-dependent evolution observed in this study is generally consistent with previous studies. These findings suggest that moderate temperatures may favor the recovery of relatively heavy hydrocarbons, whereas higher temperatures promote the formation of light hydrocarbons and olefin-rich products [39].

4. Conclusions

This study systematically investigated the physicochemical properties and rapid pyrolysis product distribution of the RWTS using proximate/ultimate analysis, FTIR, TG-DTG, and Py-GC/MS.
Proximate, ultimate, and FTIR analyses demonstrated that RWTS is characterized by high volatile matter (64.69%), a high H/C molar ratio (1.80), abundant aliphatic C–H groups, and oxygen-containing functional groups, indicating that aliphatic hydrocarbons constitute the dominant organic structures and provide the material basis for thermal conversion. TG-DTG analysis showed that the pyrolysis of RWTS proceeds through three successive stages. The major decomposition occurs between 185 and 460 °C, while the characteristic DTG peaks at 305 and 445 °C correspond to the volatilization of indigenous hydrocarbons and the decomposition of more stable organic structures, respectively. Above 460 °C, thermal cracking becomes dominant, leading to the further decomposition of residual organic matter. Py-GC/MS results revealed a distinct temperature-dependent evolution of pyrolysis products. At 305 and 445 °C, the products are dominated by alkanes released mainly through the volatilization of indigenous hydrocarbons. At 655 °C, alkenes become the predominant products owing to the extensive thermal cracking of long-chain aliphatic hydrocarbons, accompanied by deoxygenation and a moderate increase in monocyclic aromatic hydrocarbons.
The evolution of carbon-number distribution, together with the FTIR and TG-DTG results, demonstrates that increasing the pyrolysis temperature shifts the dominant conversion pathway from the volatilization of native hydrocarbons to the thermal cracking of long-chain aliphatic structures, resulting in the formation of low-carbon-number hydrocarbons and light alkenes. These findings provide new insights into the thermal conversion mechanism of RWTS and offer a theoretical basis for its efficient thermochemical utilization.

Supplementary Materials

The following supporting information can be downloaded at: https://www.mdpi.com/article/10.3390/pr14193095/s1, Figure S1: Total ion flow chromatography of pyrolysis products from scum sample at 305 °C; Figure S2: Total ion flow chromatography of pyrolysis products from scum sample at 445 °C; Figure S3: Total ion flow chromatography of pyrolysis products from scum sample at 655 °C; Table S1: Main pyrolysis products obtained by Py-GC/MS analysis at 305 °C; Table S2: Main pyrolysis products obtained by Py-GC/MS analysis at 445 °C; Table S3: Main pyrolysis products obtained by Py-GC/MS analysis at 655 °C.

Author Contributions

H.L.: Writing—original draft, Formal analysis, Data curation, Conceptualization. G.-H.Z.: Visualization. J.-L.H.: Validation. X.Z.: Supervision, Resources. Y.-Y.M.: Writing—review & editing, Methodology, Conceptualization. W.-L.M.: Writing—review & editing, Supervision, Resources, Project administration, Methodology, Conceptualization. M.-S.Z.: Writing—review & editing, Supervision. H.-Q.Z.: Resources. X.-Y.W.: Writing—review & editing, Supervision. X.F.: Writing—review & editing, Supervision. All authors have read and agreed to the published version of the manuscript.

Funding

This research was funded by the Tianshan Innovation Team Plan (2025D14013) from the Xinjiang Uygur Autonomous Region, the Science and Technology Plans from Yili Prefecture (YJC2025B11), and the Fourth Division of the Xinjiang Production and Construction Corps (2025GG015).

Data Availability Statement

The original contributions presented in this study are included in the article/Supplementary Materials. Further inquiries can be directed to the corresponding authors.

Conflicts of Interest

Author Mei-Song Zhu was employed by Sinopec Petroleum Engineering Co., Ltd. and Boxing Lutai Phospholipid Co., Ltd. Author Hui-Qiang Zheng was employed by Xinjiang Yutouguo Science and Technology Co., Ltd. The remaining authors declare that the research was conducted in the absence of any commercial or financial relationships that could be construed as potential conflicts of interest.

References

  1. Ge, Q.; Liu, Y.J.; Liu, P.; Yang, Z.; Yang, L.; Liu, Z.; Li, Z. Research on a harmless treatment method for oily sludge in coal chemical wastewater and the pollutant transformation mechanism of oily sludge during the treatment process. J. Hazard. Mater. 2024, 478, 135568. [Google Scholar] [CrossRef] [Scilit]
  2. Wang, Z.P.; Zheng, Z.G.; Yang, F.; Wang, D.; Liu, W.; Hanikai, D.; Liu, J.; Zhou, J.; Liu, D. Fly ash-catalysed pyrolysis of highly oily sludge: Kinetics and oil recovery. J. Environ. Chem. Eng. 2025, 13, 117313. [Google Scholar] [CrossRef] [Scilit]
  3. Guo, Y.; Zheng, J.; Wang, D.; Zhang, P.; Zhang, Y.; Lin, M.; Yuan, S. Research on thermochemical and gas emissions analysis for the sustainable co-combustion of petroleum oily sludge and high-alkali lignite. Sustainability 2025, 17, 6703. [Google Scholar] [CrossRef] [Scilit]
  4. Zhang, X.W.; Zhang, M.L.; Liu, Y.F.; Cao, Y.; Zhang, L. Insight into the desorption behavior of crude oil from oily sludge using solvent extraction: Impact of solvent types with typical molecular structures. Results Eng. 2026, 30, 110393. [Google Scholar] [CrossRef] [Scilit]
  5. Hasan, A.M.A.; Kamal, R.S.; Farag, R.K.; Abdel-Raouf, M.E. Petroleum sludge formation and its treatment methodologies: A review. Environ. Sci. Pollut. Res. Int. 2024, 31, 8369–8386. [Google Scholar] [CrossRef] [Scilit]
  6. Hu, J.Q.; Gan, J.H.; Li, J.P.; Luo, Y.; Wang, G.; Wu, L.; Gong, Y. Extraction of crude oil from petrochemical sludge: Characterization of products using thermogravimetric analysis. Fuel 2017, 188, 166–172. [Google Scholar] [CrossRef] [Scilit]
  7. Song, Q.; Zhao, H.Y.; Jia, J.W.; Zhang, F.; Wang, Z.; Lv, W.; Yang, L.; Zhang, W.; Zhang, Y.; Shu, X. Characterization of the products obtained by pyrolysis of oil sludge with steel slag in a continuous pyrolysis-magnetic separation reactor. Fuel 2019, 255, 115711. [Google Scholar] [CrossRef] [Scilit]
  8. Chen, L.; Zhang, X.D.; Sun, L.Z.; Xie, X.P.; Yang, S.X.; Mei, N. Study on the fast pyrolysis of oil sludge by Py-GC/MS. Pet. Sci. Technol. 2019, 37, 2108–2113. [Google Scholar] [CrossRef] [Scilit]
  9. Bao, D.D.; Li, Z.W.; Liu, X.; Wan, C.; Zhang, R.; Lee, D.-J. Biochar derived from pyrolysis of oily sludge waste: Structural characteristics and electrochemical properties. J. Environ. Manag. 2020, 268, 110734. [Google Scholar] [CrossRef] [Scilit]
  10. Zhou, J.B.; Zhuang, X.G.; Alastuey, A.; Querol, X.; Li, J. Geochemistry and mineralogy of coal in the recently explored Zhundong large coal field in the Junggar basin, Xinjiang province, China. Int. J. Coal Geol. 2010, 82, 51–67. [Google Scholar] [CrossRef] [Scilit]
  11. Shahbeig, H.; Nosrati, M. Pyrolysis of municipal sewage sludge for bioenergy production: Thermo-kinetic studies, evolved gas analysis, and techno-socio-economic assessment. Renew. Sustain. Energy Rev. 2020, 119, 109567. [Google Scholar] [CrossRef] [Scilit]
  12. Liu, J.G.; Jiang, X.M.; Zhou, L.S.; Han, X.; Cui, Z. Pyrolysis treatment of oil sludge and model-free kinetics analysis. J. Hazard. Mater. 2009, 161, 1208–1215. [Google Scholar] [CrossRef] [Scilit]
  13. Li, H.; Zhou, N.; Dai, L.L.; Cheng, Y.; Cobb, K.; Chen, P.; Ruan, R. Effect of lime mud on the reaction kinetics and thermodynamics of biomass pyrolysis. Bioresour. Technol. 2020, 310, 123475. [Google Scholar] [CrossRef] [Scilit]
  14. Zhao, G.H.; Ma, Y.Y.; Ren, Y.; Xiao, J.; Mo, W.-L.; Guo, J.; Wei, X.-Y.; Fan, X.; Naeem, A. Composition of the isopropanol soluble portion and fast pyrolysis products distribution of the insoluble part from Pakistan lignite. RSC Adv. 2025, 15, 602–615. [Google Scholar] [CrossRef] [Scilit]
  15. Yao, X.W.; Liu, Q.H.; Zhou, H.D.; Xu, K.L. Tar Cracking Removal Technology in Biomass Gasification Process. J. Northeast. Univ. (Nat. Sci.) 2024, 45, 890–896. [Google Scholar] [CrossRef]
  16. Wan, G.; Bei, L.; Yu, J.; Xu, L.; Sun, L. Products distribution and hazardous elements migration during pyrolysis of oily sludge from the oil refining process. Chemosphere 2022, 288, 132524. [Google Scholar] [CrossRef] [Scilit]
  17. Li, J.; Lin, F.; Li, K.; Zheng, F.; Yan, B.; Che, L.; Tian, W.; Chen, G.; Yoshikawa, K. A critical review on energy recovery and non-hazardous disposal of oily sludge from petroleum industry by pyrolysis. J. Hazard. Mater. 2021, 406, 124706. [Google Scholar] [CrossRef] [Scilit]
  18. Miao, W.J.; Li, X.G.; Wang, Y.B.; Lv, Y. Pyrolysis characteristics of oil-field sludge and the comparison of kinetic analysis with two representative methods. J. Pet. Sci. Eng. 2019, 182, 106309. [Google Scholar] [CrossRef] [Scilit]
  19. Yang, J.; Zhu, X.; Ai, Z.; Leng, L.; Li, H. Products distribution and heavy metals migration during catalytic pyrolysis of refinery oily sludge. Energy Rep. 2023, 9, 109–117. [Google Scholar] [CrossRef] [Scilit]
  20. Mishra, R.K.; Mohanty, K.; Wang, X. Pyrolysis kinetic behavior and Py-GC-MS analysis of waste dahlia flowers into renewable fuel and value-added chemicals. Fuel 2020, 260, 116338. [Google Scholar] [CrossRef] [Scilit]
  21. Chen, L.; Zhang, X.; Sun, L.; Xu, H.; Si, H.; Mei, N. Study on the Fast Pyrolysis of Oil Sludge and Its Product Distribution by PY-GC/MS. Energy Fuels 2016, 30, 10222–10227. [Google Scholar] [CrossRef] [Scilit]
  22. Chen, G.Y.; Li, J.T.; Li, K.; Lin, F.; Tian, W.; Che, L.; Yan, B.; Ma, W.; Song, Y. Nitrogen, sulfur, chlorine containing pollutants releasing characteristics during pyrolysis and combustion of oily sludge. Fuel 2020, 273, 117772. [Google Scholar] [CrossRef] [Scilit]
  23. He, Y.H.; Wang, Z.; Wang, J. Investigation of pyrolytic characteristics of three oily sludges with focus on properties of oil product. J. Anal. Appl. Pyrolysis 2023, 174, 106114. [Google Scholar] [CrossRef] [Scilit]
  24. Song, S.D.; Bai, Z.S.; Zhang, W.J.; Ma, L.; Liu, X. Impacts of drying treatment on pyrolysis of oily sludge: Kinetic analysis and product evaluation. Chin. J. Chem. Eng. 2026, 95, 252–262. [Google Scholar] [CrossRef] [Scilit]
  25. Coats, A.W.; Redfern, J.P. Kinetic parameters from thermogravimetric data II. J. Polym. Sci. Part B Polym. Lett. 1965, 3, 917–920. [Google Scholar] [CrossRef] [Scilit]
  26. Wang, Z.Y.; Gong, Z.Q.; Wang, Z.B.; Li, X.; Liu, J.; Tang, C.; Chu, Z. Pyrolysis performance and kinetic analysis of oily sludge. J. Therm. Anal. Calorim. 2021, 147, 4621–4633. [Google Scholar] [CrossRef] [Scilit]
  27. Wang, Q.; Ye, J.B.; Yang, H.Y.; Liu, Q. Chemical Composition and Structural Characteristics of Oil Shales and Their Kerogens Using Fourier Transform Infrared (FTIR) Spectroscopy and Solid-State 13C Nuclear Magnetic Resonance (NMR). Energy Fuels 2016, 30, 6271–6280. [Google Scholar] [CrossRef] [Scilit]
  28. López, K.J.; Ardila, D.M.; Rojas, C.C.; Toro, R.A.; Palma, A.; Henao, J.A. Synthesis, spectroscopic and structural characterization of three new ethyl (E)-2-formyl-4-styrylquinoline-3-carboxylates. J. Mol. Struct. 2025, 1348, 143526. [Google Scholar] [CrossRef] [Scilit]
  29. Yan, J.C.; He, J.; Yang, Q.T.; Bai, Z.; Lei, Z.; Li, Z.; Xue, C.; Wang, Z.; Ren, S.; Kang, S.; et al. A study of gasification behavior of residues from mild coal hydro-liquefaction. Fuel 2021, 293, 120456. [Google Scholar] [CrossRef] [Scilit]
  30. Huang, S.; Cao, S.; Zhang, Y.L.; Wu, S.; Wu, Y.; Gao, J. Effect of solvent quality on covalent bonds cleavage behaviors of lignite during pyrolysis/liquefaction processes. J. Energy Inst. 2023, 109, 101303. [Google Scholar] [CrossRef] [Scilit]
  31. Mo, W.L.; Wu, Z.F.; He, X.Q.; Qiang, W.J.; Wei, B.; Wei, X.; Wu, Y.; Fan, X.; Ma, F. Functional group characteristics and pyrolysis/combustion performance of fly ashes from Karamay oily sludge based on FT-IR and TG-DTG analyses. Fuel 2021, 296, 120669. [Google Scholar] [CrossRef] [Scilit]
  32. Lao, Q.F.; Yang, L.J.; Liu, S.Z.; Ma, X.; Tan, D.; Li, J.; Liao, B.; Wei, Y.; Pang, W.; Morais, C.L.M.; et al. Effects of Benzo (a) Pyrene and 2,2′,4,4′-Tetrabromodiphenyl Ether Exposure on the Thyroid Gland in Rats by Attenuated Total Reflection Fourier-Transform Infrared Spectroscopy. ACS Omega 2024, 9, 4317–4323. [Google Scholar] [CrossRef] [Scilit]
  33. Shi, L.; Liu, Q.Y.; Guo, X.J.; Wu, W.; Liu, Z. Pyrolysis behavior and bonding information of coal-A TGA study. Fuel Process. Technol. 2013, 108, 125–132. [Google Scholar] [CrossRef] [Scilit]
  34. Liu, F.J.; Gao, S.S.; Yang, Z.; Meng, B.; Zhao, Y.-P.; Huang, Z.-X.; Wei, X.-Y. Investigation on Compositional Structures of the Organic Matter and Biomarker Distributions in Shengli Lignite. ACS Omega 2024, 9, 3363–3372. [Google Scholar] [CrossRef] [Scilit]
  35. Li, H.; Jia, M.; Zhang, X.; Wang, Z.; Liu, Y.; Yang, J.; Yang, B.; Sun, Y.; Wang, H.; Ma, H. Laboratory investigation on fumes generated by different modified asphalt binders. Transp. Res. Part D. Transp. Environ. 2023, 121, 103828. [Google Scholar] [CrossRef] [Scilit]
  36. Pang, Y.X.; Yang, W.Q.; Mo, W.L.; Cai, J.; Zhu, M.; Huang, X.; Ren, T.; Wei, X.; Fan, X. Composition characteristics of the soluble component and fast pyrolysis products distribution of the insoluble part from coal tar residue. Energy Source Part A 2025, 47, 12130–12146. [Google Scholar] [CrossRef] [Scilit]
  37. Jin, X.; Teng, D.; Fang, J.; Liu, Y.; Jiang, Z.; Song, Y.; Zhang, T.; Siyal, A.A.; Dai, J.; Fu, J.; et al. Petroleum oil and products recovery from oily sludge: Characterization and analysis of pyrolysis products. Environ. Res. 2021, 202, 111675. [Google Scholar] [CrossRef] [Scilit]
  38. Ma, Z.Z.; Xie, J.H.; Gao, N.B.; Quan, C. Pyrolysis behaviors of oilfield sludge based on Py-GC/MS and DAEM kinetics analysis. J. Energy Inst. 2019, 92, 1053–1063. [Google Scholar] [CrossRef] [Scilit]
  39. Hao, J.H.; Zong, P.J.; Tian, Y.Y.; Zhang, J.; Qiao, Y. Distribution and chemical structure characteristic of the fast thermal-cracking products of Buton oil sand bitumen by Py-GC/TOF-MS and a fluidized bed reactor. Energy Convers. Manag. 2019, 183, 485–499. [Google Scholar] [CrossRef] [Scilit]
Figure 1. FTIR spectrum of the RWTS.
Processes 14 03095 g001
Figure 2. FTIR curve-fitting results of the RWTS in the regions of 3600–3100 cm−1 (a), 3000–2800 cm−1 (b), 1800–1000 cm−1 (c) and 900–700 cm−1 (d).
Processes 14 03095 g002
Figure 3. (a) TG; (b) DTG profiles of the RWTS in an inert atmosphere.
Processes 14 03095 g003
Figure 4. TICs of the pyrolysis products from the RWTS at different temperatures analyzed by Py-GC/MS.
Processes 14 03095 g004
Figure 5. Group distribution of the pyrolysis products from the RWTS at different temperatures.
Processes 14 03095 g005
Figure 6. CN distribution of the pyrolysis products from the RWTS at different temperatures.
Processes 14 03095 g006
Table 1. Proximate and ultimate analyses of the RWTS.
Proximate Analysis, w (ad, %)Ultimate Analysis, w (daf, %)H/CO/C
MAVFC #CHO #NSt,d
0.9028.5064.695.9149.187.3639.102.901.461.800.60
ad: air-dried base; daf: dry and ash-free base; #: by difference; St,d: total sulfur; H/C refers to the molar ratio of H atom to C atom; O/C refers to the molar ratio of the O atom to C atom.
Disclaimer/Publisher’s Note: The statements, opinions and data contained in all publications are solely those of the individual author(s) and contributor(s) and not of MDPI and/or the editor(s). MDPI and/or the editor(s) disclaim responsibility for any injury to people or property resulting from any ideas, methods, instructions or products referred to in the content.