Article

Industrial-Scale Valorization of Low-Grade Fruits Through Green Polyphenol Extraction: Integrating Process Simulation, Techno-Economic Analysis, and Environmental Assessment

by
Lefteris D. Melas
1,*,
Stamatia Skoutida
1,
Maria Batsioula
1,
Ioannis Mourtzinos
2,
Sotiris I. Patsios
3 and
Georgios F. Banias
1,*
1
Laboratory of Environmental Engineering and Sustainability, Institute for Bioeconomy and Agritechnology, Center for Research and Technology Hellas (CERTH), Thermi, 57001 Thessaloniki, Greece
2
Laboratory of Food Chemistry and Biochemistry, School of Agriculture, Aristotle University of Thessaloniki (AUTH), 54124 Thessaloniki, Greece
3
Laboratory of Natural Resources & Renewable Energies, Chemical Process & Energy Resources Institute, Center for Research and Technology Hellas (CERTH), Thermi, 57001 Thessaloniki, Greece
*
Authors to whom correspondence should be addressed.
Processes 2026, 14(18), 2975; https://doi.org/10.3390/pr14182975 (registering DOI)
Submission received: 30 July 2026 / Revised: 15 September 2026 / Accepted: 16 September 2026 / Published: 18 September 2026

Abstract

Ultrasound-assisted extraction (UAE) processes for the production of standardized polyphenol-rich powders were evaluated as a valorization route for second- and third-grade apples, figs, and pomegranates from Central Macedonia, Greece. Based on experimental results, the scaled-up process was modeled using SuperPro Designer to evaluate a continuous facility treating 7920 tonnes·yr−1 of feedstock. Material and energy balances revealed high utility demands, which were heavily mitigated through optimized closed-loop steam and cooling water regeneration systems. The techno-economic analysis showed that, driven by its high extraction yield (14.63 kg Gallic acid equivalent [GAE]·t−1), the optimized pomegranate extraction was the only profitable scenario, yielding an annual operating cost of EUR 6.35 M/yr and a Net Present value (NPV) of EUR 11.81 M at a EUR 80/kg selling price; low-yield apple and fig lines remained highly unviable. Capacity sensitivity analysis showed that high fixed capital costs limit smaller plants, while market price sweeps identified a break-even point at EUR 66.03/kg. Using 1 kg gallic acid equivalent (GAE) as the functional unit, the life cycle assessment confirmed that pomegranate processing achieved the best environmental performance, primarily governed by reduced feedstock and utility requirements per unit of active extract. Toxicity-related categories constituted the main hotspots across all configurations, with the fig line acting as the worst absolute environmental performer. However, because the regional residue availability of 8483 tonnes·yr−1 is dominated by apples, a standalone pomegranate processing plant is constrained at this scale, indicating that future work must focus on flexible multi-feedstock campaign processing or inter-regional feedstock aggregation.

1. Introduction

Global agricultural supply chains generate substantial quantities of second- and third-grade fruits, which are characterized by reduced market value due to aesthetic imperfections such as irregular color, size, or shape [1]. These products are typically diverted to low-value applications (e.g., jams and compotes) or disposed of in landfills [2]. Under anaerobic conditions, such organic residues emit methane (CH4), a greenhouse gas with a global warming potential approximately 28 times that of carbon dioxide (CO2) over a 100-year time horizon [3]. In addition to direct emissions, this practice reflects a major inefficiency in resource use, as the water, land, and energy invested in producing low-grade fruits, estimated at approximately 4.4 gigatonnes of CO2 equivalent annually worldwide, are effectively lost [4].
The transition towards a circular bioeconomy requires the efficient valorization of underutilized agricultural biomass into high-value products. In this context, low-grade fruits should be regarded as valuable feedstocks rather than waste. A key fundamental supporting this transition is cascading use, which prioritizes biomass utilization hierarchically: first for food and nutrition, followed by materials and chemicals, and finally for energy recovery [5,6]. This approach promotes the development of biorefinery systems, where secondary residues are valorized into high-added-value products, thereby enhancing both environmental sustainability and economic performance in the agricultural sector [7].
Changing consumer preferences toward healthier lifestyles have increased demand for functional foods with potential health benefits, including the prevention of chronic diseases. The growing demand for natural bioactive ingredients has accelerated the replacement of synthetic additives in the food, pharmaceutical, and nutraceutical industries [8,9]. Conventional synthetic antioxidants and preservatives, although effective in extending shelf life, have raised concerns regarding their potential adverse health and environmental impacts, stimulating the search for safer and more sustainable alternatives [10,11]. Consequently, there is a significant surge of interest in natural, non-toxic alternatives [12]. Phenolic compounds, a diverse group of plant secondary metabolites widely present in fruits and vegetables, represent promising natural alternatives. This group includes phenolic acids, flavonoids, tannins, and lignans, which contribute to food preservation by enhancing oxidative stability and maintaining sensory quality. In addition, they exhibit strong antioxidant, anti-inflammatory, and antimicrobial properties [13,14].
The recovery of polyphenols from low-grade fruit biomass provides an opportunity to retain resources within the food value chain while producing high-value ingredients for functional foods and nutraceuticals. Although the chemical synthesis of specific (poly)-phenolic compounds is feasible [15], there are concerns over the environmental sustainability, considering their long extraction times and the use of harmful solvents [16,17,18]. In contrast, green extraction technologies, such as ultrasound-assisted extraction (UAE), have emerged as more sustainable alternatives [19]. UAE employs acoustic cavitation to enhance mass transfer, thereby reducing extraction time and solvent consumption, and is considered an efficient method for recovering bioactive compounds from agro-industrial residues [20]. Given the industry trend toward sustainable chemical processes, quantifying the environmental impact and financial feasibility of these techniques through life cycle assessment (LCA) and techno-economic analysis (TEA) is essential to validate their transition from the laboratory to industrial application.
Despite the growing interest in the valorization of agro-industrial residues for the recovery of polyphenols, several research gaps remain. Existing studies have primarily focused on laboratory-scale extraction processes, with limited consideration of uncertainties associated with scaling-up to industrial applications. Moreover, LCA has been extensively applied to bioenergy systems, while comparatively fewer studies address the environmental performance of high-value compounds such as phenolic extracts [21]. Although some research has attempted to integrate environmental and economic assessments, these approaches are often case-specific and limited to single feedstocks, lacking a broader system-level perspective [22]. Recent studies also highlight the scarcity of comparative analyses across different biomass sources and extraction technologies, as well as the need for decision support frameworks to guide process optimization [23]. Furthermore, the economic viability of such valorization pathways remains uncertain, as not all bio-based processes are simultaneously environmentally and financially sustainable [24].
By leveraging fruit residues as high-potency bioactive compounds, agricultural waste can be transformed into a circular resource that captures the embedded environmental footprint of second-grade fruits while mitigating landfill methane emissions. However, a critical barrier remains to scaling-up, where a lack of integrated techno-economic and environmental assessments prevents the transition of laboratory-scale green extraction into viable industrial applications [25,26,27].
This study aims to evaluate the valorization potential of second- and third-grade apples, figs, and pomegranates in Central Macedonia through the recovery of phenolic compounds. The regional availability of lower-grade fruits is quantified using data from the Hellenic Statistical Authority. Experimental ultrasound-assisted extraction (UAE) data generated within the Fruit Value project (KMP6-0140563) are used to scale-up the process in SuperPro Designer v15 (Intelligen, Inc., Scotch Plains, NJ, USA), enabling the design of an industrial extraction system. The simulation model is then employed to derive key techno-economic indicators for assessing investment viability, while a life cycle assessment (LCA) is conducted in SimaPro v10.2 (PRé Sustainability B.V., Amersfoort, the Netherlands), incorporating assumptions on biomass collection logistics and processing plant location. By integrating process simulation, techno-economic analysis, and LCA across multiple fruit feedstocks, this study provides a decision-support framework for evaluating the environmental and economic performance of industrial-scale polyphenol recovery from low-grade fruit biomass. To address this gap, this work investigates the valorization of second- and third-grade apples, figs, and pomegranates through an integrated experimental, techno-economic, and environmental assessment framework.

2. Background: Experimental Extraction of Polyphenols from Second-Grade Fruits

2.1. Extraction of Phenolic Compounds—Experimental Data

The experimental extraction of bioactive compounds was carried out at the Laboratory of Food Chemistry and Biochemistry of the School of Agriculture, Aristotle University of Thessaloniki (AUTH). Upon arrival at the laboratory, second-grade apples, pomegranates, and figs were washed with tap and deionized water; they were dried on filter paper and freeze-dried (HyperCOOL HC8080 freeze-dryer, Gyrozen Co., Ltd., Gimpo, Republic of Korea) (−80 °C, 0.1 mbar). The dried samples were subsequently milled into fine homogeneous powders using a Pulverisette 11 Knife Mill (Fritsch GmbH, Idar-Oberstein, Germany) operating at 6000 rpm for 20 s in order to obtain fine uniform powders, and stored at −22 °C until further analysis.
The effect of extraction duration (min), extraction temperature (°C), and β-cyclodextrin concentration (mg/mL) on the recovery of phenolic compounds from freeze-dried fig, apple, and pomegranate samples was investigated using a composite central composite design (CCD), applying response surface methodology (RSM). The independent variables were defined as extraction time in min (X1), extraction temperature in °C (X2), and β-cyclodextrin concentration in mg/mL (X3). For each variable, five experimental levels were used, coded as follows: −α, −1, 0, +1, +α. The lowest level was set as −α and the highest as +α. The actual values of the variables were calculated based on Equation (1):
Coded Value = (Actual Value − (Highest Value + Lowest Value)/2)/((Highest Value − Lowest Value)/2)
The CCD comprised twenty (20) experimental runs (Table 1), with six replicates in which the values of the independent variables corresponded to the center level. The dependent variables were defined as the total phenolic content (TPC) (Y1), expressed in mg GAE/g dr fruit, and the antioxidant activity (DPPH) (Y2), expressed in µmol Trolox/100 g dry fruit. The experimental data series investigating the effect of extraction time (min) (X1), extraction temperature (°C) (X2), and β-cyclodextrin concentration (mg) (X3) obtained through the CCD were analyzed using multiple regression analysis. All statistical analyses were performed using Minitab 15.1.20.0 software (Minitab, Inc., State College, PA, USA). The significance level was set at p < 0.05. The model was subsequently evaluated under real experimental conditions. Model evaluation experiments were carried out at the optimum predicted combination of the independent variable values, drawing from established bioprocess model diagnostics [28] achieving uncertainty of ~5%. The experimental values obtained for the dependent variables were compared with the maximum values predicted by the mathematical model. In Table 1, X 1 , X 2 , and X 3 denote the independent extraction variables, while α , 1 , 0 , + 1 , and + α represent the coded axial, factorial, and center levels of the experimental design.
The experimental procedure was as follows: Freeze-dried second-grade fruit powders were subjected to ultrasonication using an Elmasonic S 30 sonication bath (Elma Schmidbauer GmbH, Singen, Germany) that had the following characteristics: frequency of 37 kHz and output of 80 W. More specifically, an appropriate amount of freeze-dried fruit powder (0.5 g) was added into a 50 mL Falcon tube and 10 mL of an aqueous solution of different concentrations of β-cyclodextrin was then added and the mixture was subjected to sonication for various time periods (min) and temperature values (°C). At the end of each process, the mixture was centrifuged at 6000× g for 10 min. The supernatant was collected and stored in the freezer (−20 °C) for further studies.

2.2. Determination of the Total Phenol Content (TPC) and In Vitro Antioxidant Activity

Total polar phenol content of the prepared fruits extracts was determined spectrophotometrically with the Folin–Ciocalteau assay according to the procedure described by Kyriakoudi et al. (2023) [28]. Gallic acid was used as a reference standard, and results were expressed as gallic acid equivalents (mg GAE/100 g dry fruits). In a 10 mL volumetric flask, 5 mL of water, an appropriate amount of each fruit extract, and 0.5 mL of Folin–Ciocalteau reagent were added. After 3 min, 1.0 mL of saturated sodium carbonate solution (37%, w/v) was added, and the mixture was agitated. The volume was adjusted with water and the flask left in the dark for 1 h at room temperature. The absorbance was measured at 750 nm (UV-1800 spectrophotometer, Shimadzu, Kyoto, Japan) against a blank prepared similarly using methanol instead of the extract. Measurements were performed at least in triplicate, and results were expressed as the mean value ± s.d.
The DPPH● scavenging activity (ADPPH) was determined according to Kyriakoudi et al. (2023) [29]. Radical scavenging activity (%RSA) was calculated using the formula %RSA = [Abs515(t = 0) − Abs515(t)] × 100/Abs515(t = 0) after blank correction.

2.3. Effect of Extraction Parameters on Total Phenolic Content and Antioxidant Activity of Apple, Pomegranate, and Fig Extracts

The effects of sonication time, temperature, and β-CD concentration on TPC and DPPH radical scavenging activity are summarized in Table A1. Extraction responses were highly matrix-dependent. As primary parameters of the cavitation process, sonication time and temperature initially enhanced cell disruption and mass transfer [19,20]. However, extreme conditions caused thermal and sonochemical degradation, lowering TPC and antioxidant activity. Aqueous β-CD improved recovery by forming stable inclusion complexes with hydrophobic phenolics [13,29], though its benefit was concentration-de- pendent: low levels limited complex formation, while excessive concentrations increased viscosity and impeded mass transfer [14].
For apple extracts, TPC ranged from 680 ± 71 to 1202 ± 60 mg GAE·100 g−1 dw, and DPPH from 4119 ± 196 to 8245 ± 533 μmol Trolox·100 g−1 dw. Both metrics increased with temperature and β-CD concentration, indicating that intensive conditions are required to liberate partially cell wall-bound phenolic acids and flavan-3-ols [1,29]. Pomegranate exhibited the highest overall phenolic richness [8,9], dominated by hydrolysable tannins and anthocyanins [26,29]. TPC ranged from 5980 ± 1318 to 7950 ± 643 mg GAE·100 g−1 dw, while DPPH reached up to 88,054 ± 10,549 μmol Trolox·100 g−1 dw. Maximum experimental antioxidant activity occurred rapidly (2.8 min), whereas prolonged sonication and higher temperatures degraded these labile compounds [4]. Fig extracts were exceptionally sensitive to sonication time. Peak TPC (457 ± 15 mg GAE·100 g−1 dw) occurred at just 2.8 min, falling sharply thereafter (185–287 mg GAE·100 g−1 dw at 62.5–122.2 min). This reflects the rapid ultrasound-induced degradation of key phenolics like rutin, chlorogenic acid, and caffeic acid [1,29]. Furthermore, maximum DPPH activity did not perfectly align with peak TPC, suggesting that specific low-molecular-weight phenolics dictate radical scavenging under certain conditions [19,20].

2.4. Statistical Analysis and Model Validation of the Extraction Optimization

The effects of sonication duration (X1), temperature (X2), and β-cyclodextrin concentration (X3) on TPC and DPPH radical scavenging activity were analyzed by multiple regression analysis on the CCD data (n = 20 runs per fruit, six center-point replicates), using Minitab 15.1.20.0 (Minitab Inc., State College, PA, USA). Second-order polynomial models were fitted to each response, and their adequacy was evaluated by analysis of variance (ANOVA), considering the F-ratio and p-value of the overall regression, the linear, quadratic, and interaction terms, and the coefficient of determination (R2 and R2adj). Terms with p > 0.05 were removed from the final reduced equations. A significance level of α = 0.05 was applied throughout. Where a statistically significant model (p < 0.05, non-significant lack of fit) could be obtained, the optimum extraction conditions were derived by response surface/desirability optimization in Minitab and subsequently confirmed experimentally, in triplicate, at the model-predicted optimum. Where the polynomial model did not reach statistical significance—as was the case for the fig matrix, whose TPC response peaked sharply at the shortest sonication time tested and could not be adequately described by a second-order surface—the optimum was instead identified directly from the triplicate-replicated experimental run showing the maximum response within the CCD, rather than from a fitted model prediction.
In case of apple fruits, the second-order model for TPC was statistically significant overall (regression F = 4.62, p = 0.013), with a significant linear component (F = 8.57, p = 0.004) and a significant interaction component (F = 5.04, p = 0.022), while the quadratic component was not significant (F = 0.26, p = 0.854); the lack-of-fit test was likewise non-significant (F = 4.43, p = 0.064), confirming that the model adequately describes the data. The model explained 63.2% of the total variance (R2adj). At the level of individual terms, temperature (p = 0.002), β-cyclodextrin concentration (p = 0.024), and the temperature × β-CD interaction (p = 0.041) were significant, whereas sonication duration and all quadratic terms were not. The reduced coded equation was as follows:
TPC = 9.438 + 0.890X2 + 0.545X3 − 0.632X2X3.
The DPPH model was also significant (regression F = 4.43, p = 0.015; linear F = 12.26, p = 0.001; quadratic and interaction terms non-significant, p > 0.05; lack-of-fit non-significant, F = 2.68, p = 0.152), explaining 61.9% of the variance (R2adj). Temperature (p < 0.001) and β-CD concentration (p = 0.040) were the only significant individual terms:
DPPH = 6044.2 + 940.4X2 + 399.6X3.
Both models therefore identify extraction temperature as the dominant factor governing apple phenolic recovery, followed by β-cyclodextrin concentration, with sonication duration playing a negligible role over the range tested—consistent with the process interpretation given in Section 2.
In the case of pomegranate, the TPC model was also statistically significant (regression F = 3.19, p = 0.042), driven mainly by a significant interaction term (F = 5.47, p = 0.017), while the linear (F = 0.90, p = 0.473) and quadratic (F = 3.21, p = 0.070) components did not individually reach significance; the lack-of-fit test was non-significant (F = 4.43, p = 0.662), and the model explained 51.0% of the variance (R2adj). At the term level, only the quadratic temperature term (X22, p = 0.012) and the duration × β-CD interaction (X1X3, p = 0.004) were significant:
TPC = 75.60 − 2.83X22 + 4.72X1X3.
The DPPH model was significant overall (regression F = 3.21, p = 0.042), with significant quadratic (F = 3.79, p = 0.047) and interaction (F = 4.20, p = 0.036) components and a non-significant lack of fit (F = 0.37, p = 0.849), explaining 51.1% of the variance (R2adj). The significant individual terms were the quadratic duration term (X12, p = 0.009) and the duration × temperature interaction (X1X2, p = 0.007):
DPPH = 76,077.9 + 3359.5X12 + 4712.3X1X2.
Unlike apple, the pomegranate models were found to be governed primarily by interaction and curvature effects rather than by strong single-factor (linear) effects, reflecting the narrower, more time- and temperature-sensitive optimum window characteristic of the labile punicalagin/anthocyanin fraction of this matrix.
In contrast to apple and pomegranate, the second-order model fitted to the figs’ TPC response did not provide an adequate description of the data. The overall regression was only borderline significant (F = 2.38, p = 0.097) and explained a nominal R2 of 68.2%, but this collapsed to an adjusted R2 of just 39.5% once corrected for the number of model terms, reflecting substantial overfitting. Moreover, the lack-of-fit test was found to be significant (F = 1266, p < 0.0001). This is consistent with recent large-scale benchmarking work, which cautions that the choice of regression model itself can affect the stability of predicted optima in extraction process optimization, independent of experimental error [30].
In order to validate the predicted optima, independent confirmation experiments (n = 3) were carried out at the proposed optimum conditions for apple and pomegranate. As shown in Table 2, the experimental values were in agreement with the model predictions in both cases, supporting the reliability of the fitted RSM models for describing UAE–β-CD extraction of these two matrices. For figs, no statistically significant second-order model could be fitted to either response, as described above. The reported optimum, i.e., 2.8 min, 52.5 °C, and 9.5 mg mL−1 β-CD, therefore corresponds directly to the triplicate-measured maximum within the CCD regarding the TPC, i.e., 457 ± 14.9 mg GAE/100 g dry fig, rather than to a model-extrapolated value. In Table 2, t , T , and β -CD denote time (min), temperature (°C), and β -cyclodextrin concentration (mg/mL), respectively, GAE represents gallic acid equivalents, dw indicates dry weight, n denotes sample replicates, and ± indicates standard deviation.
The optimal conditions, regarding time, temperature, β-CD concentration, and the defined output will be used in SuperPro designer to simulate a potential scale-up of the process.

3. Process Scale-Up: Case Study of the Region of Central Macedonia, Greece

Process scale-up was undertaken to evaluate the feasibility of a regional plant that recovers polyphenols from second- and third-grade figs, apples, and pomegranates using ultrasound-assisted extraction (UAE) under the optimized conditions determined experimentally. The approach combines (i) process simulation in SuperPro Designer to model a continuous industrial extraction system, (ii) estimation of fruit residue availability in the region of Central Macedonia, and (iii) economic and environmental assessments that compare performance across the three feedstocks. This integrated framework enables the identification of promising valorization routes within a circular bioeconomy context.

3.1. SuperPro Designer Modeling

The extraction process was modeled in SuperPro Designer v15.01.2100, as a continuous system to reflect modern industrial process intensification standards [31]. The plant’s annual operating time was set at 7920 h, corresponding to a 24 h daily schedule over 330 days, to support favorable economic performance [32,33]. The raw fruit feedstock was modeled as water, cellulose, and gallic acid to assign baseline physicochemical properties adjusted to 1000 kg/h. The targeted final output is a concentrated, polyphenol-rich powder, with gallic acid utilized in the simulation strictly as a representative surrogate component to define thermodynamic properties and close mass and energy balances based on Folin–Ciocalteu gallic acid equivalent (GAE) measurements. The hourly amounts of input are presented in Table 3.
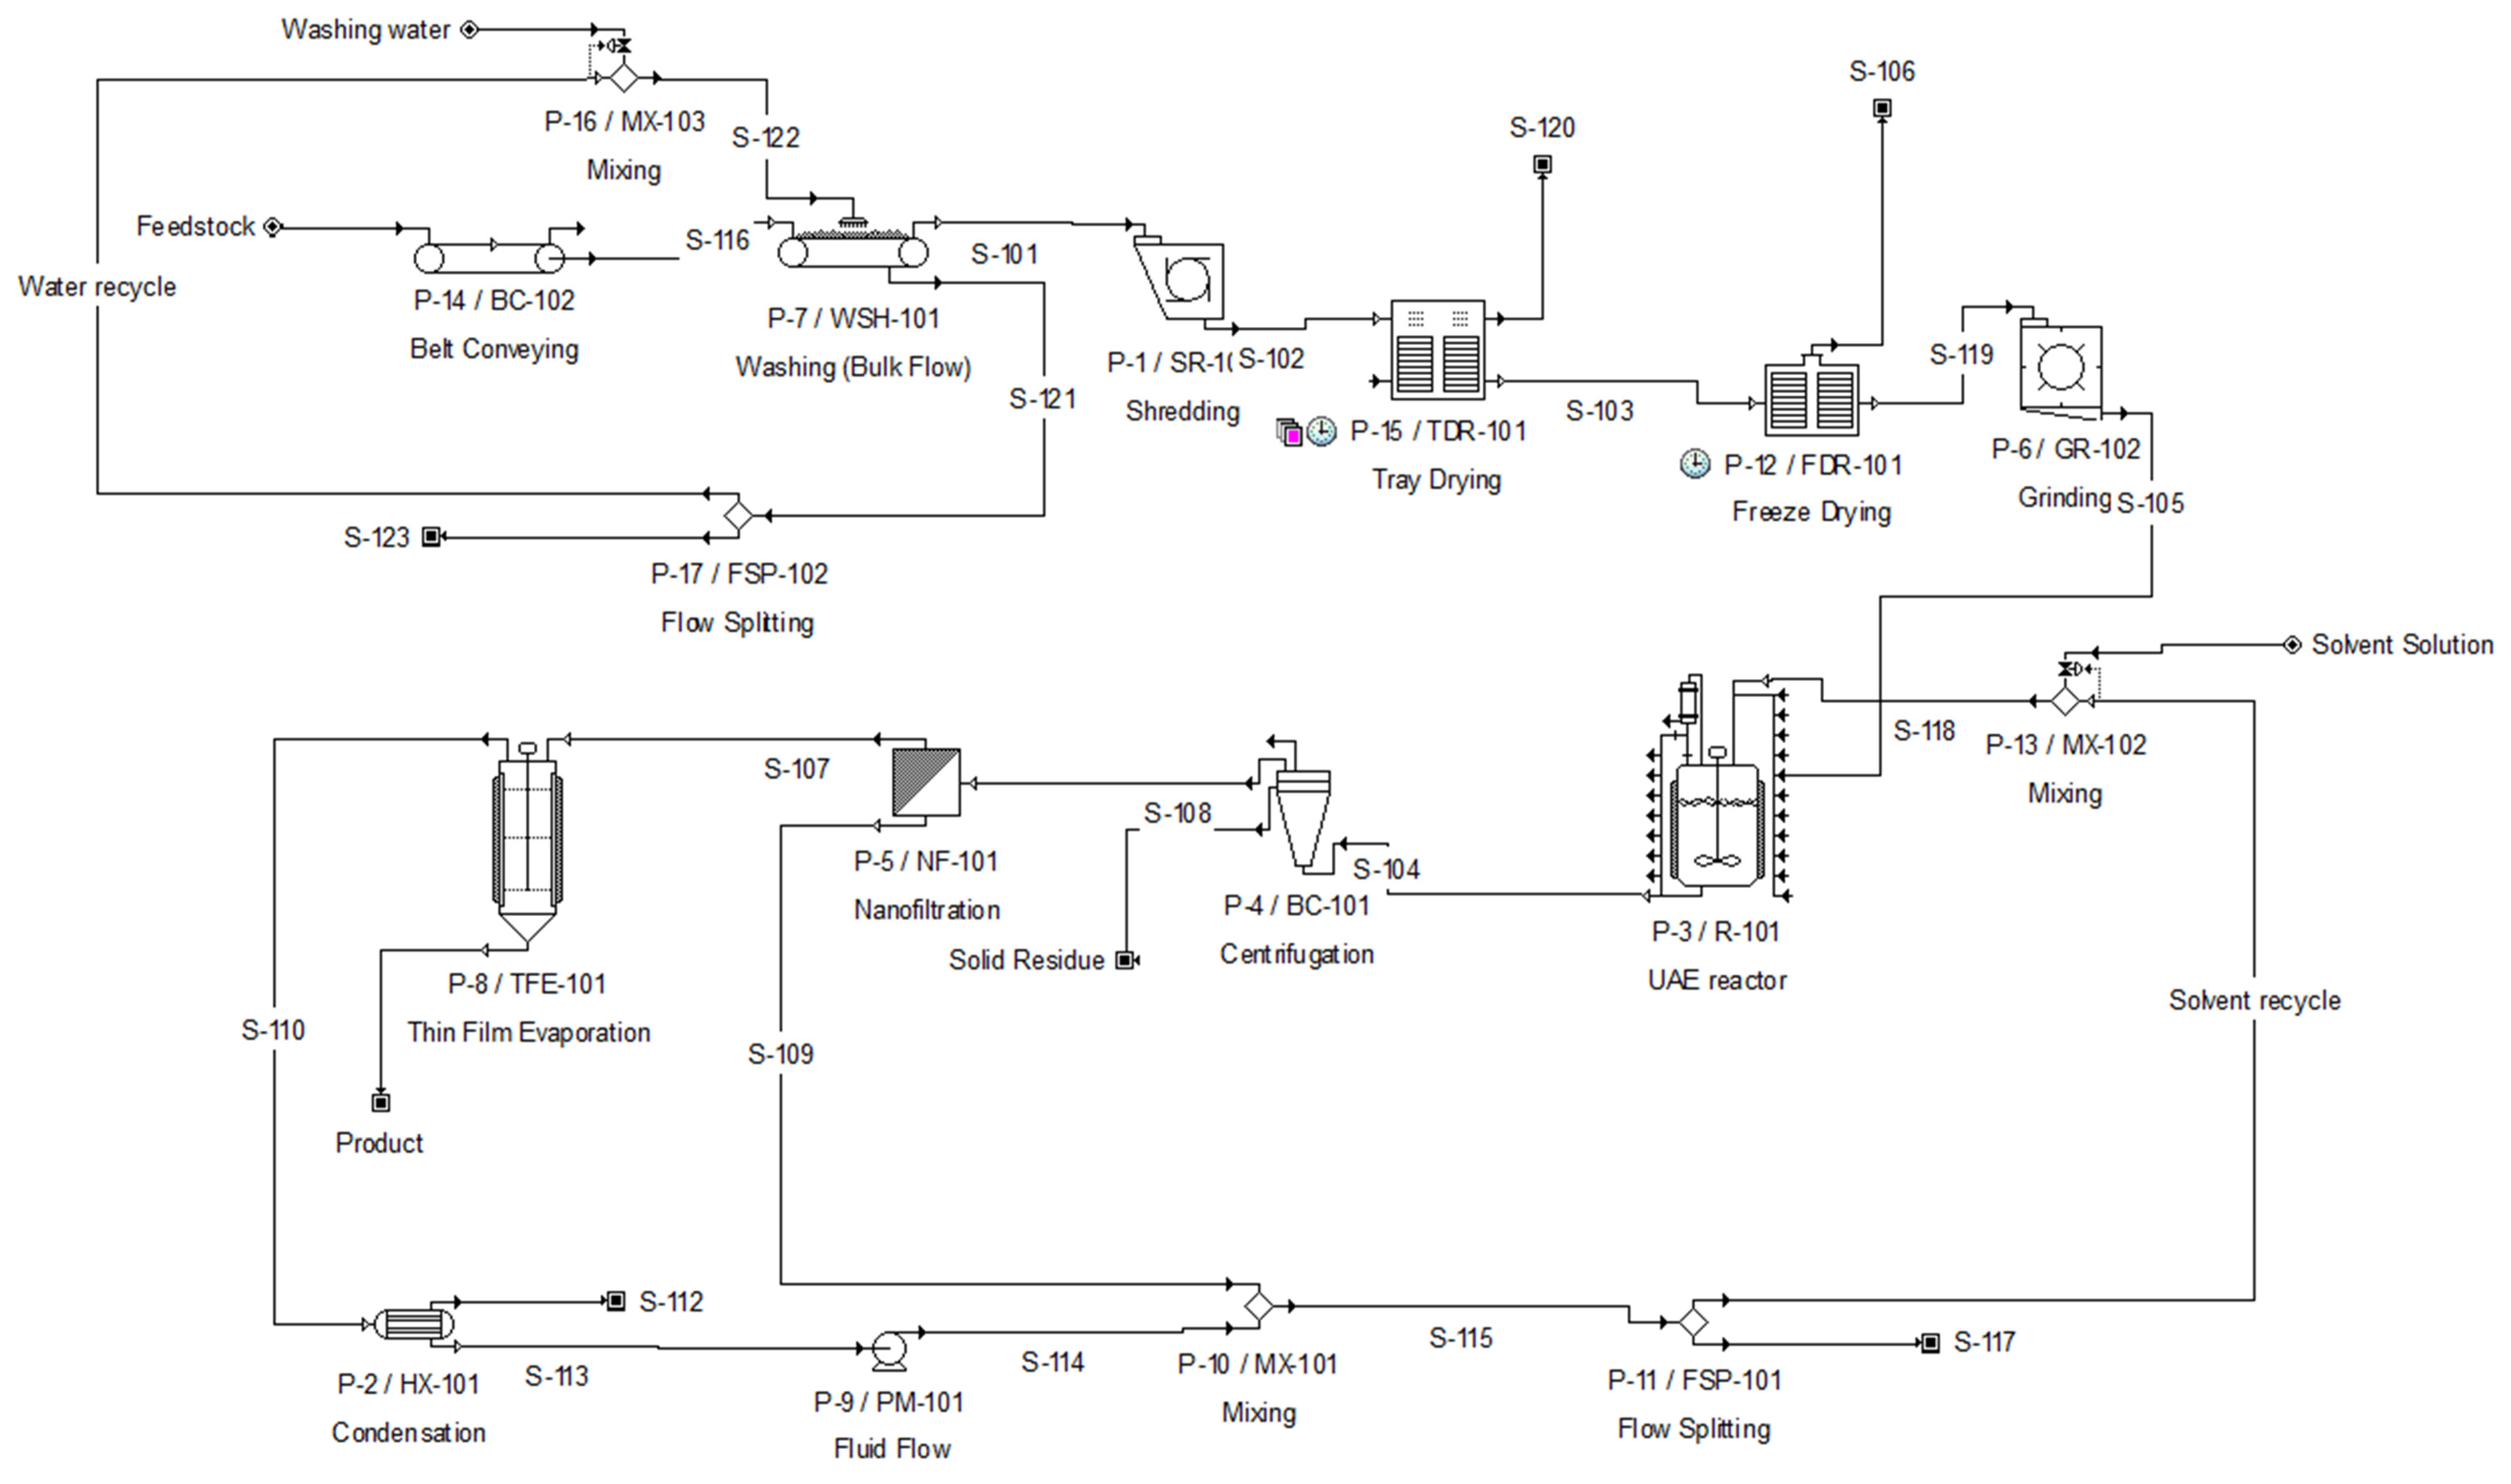
The process flow diagram shown in Figure 1 is based on the lab-scale process, with a significant modification involving two-stage drying, initially by tray drying, and the modeling of UAE as a continuous reactor. More specifically, the raw feedstock is first subjected to a washing stage (WSH-101) using 3500 L/h of water to remove surface contaminants, followed by mechanical comminution in a shredder (SR-101). The shredded fruits are then fed to a tray dryer (TDR-101), where moisture is reduced by 90%, and subsequently to a freeze-drying unit (FDR-101) to preserve the thermosensitive bioactive profile and enhance the effective diffusion coefficient. The freeze-dryer uses a cooling agent to freeze the fruits at −80 °C and 0.1 mbar, thereby removing more than 99% of the water. The freeze-dried fruits are then pulverized in a grinder (GR-102) into a fine powder, maximizing the surface to volume ratio and minimizing internal mass transfer limitations.
The extraction of target phenolics, modeled as gallic acid, is performed in a stirred reactor (R-101) configured as the UAE unit. The ultrasonic reactor is maintained at the respective matrix-specific extraction temperature (52 °C for pomegranate and fig, 64 °C for apple) using cooling water for temperature control. The solvent solution, prepared according to the laboratory-scale concentration reported in Table 1, is fed together with the powdered and dehydrated fruit stream.
Solid–liquid separation of the reactor output is achieved using a high-speed bowl centrifuge (BC-101). The solid fraction, modeled as cellulose, is discharged as a secondary by-product, while the phenolic-rich supernatant is directed to a nanofiltration unit (NF-101) to separate β-cyclodextrin from the mixture. Leaving the filtration, the stream enters a thin-film evaporator (TFE-101) to remove water under vacuum (0.1 bar, 45.9 °C), yielding the concentrated polyphenol-rich product stream. This unit operates at 0.1 bar pressure and 45.9 °C, allowing for the rapid evaporation of water and sustaining the quality of the product. The final output contains gallic acid as an equivalent, typical anti-oxidant molecule and water.
To reduce material losses, washing water (S-115) and β-cyclodextrin/pure water (S-121) are recycled by 80% and 70%, respectively. The β-cyclodextrin retentate from the filtration step is mixed with the water recovered from the evaporator in mixer MX-101 after condensation in HX-101. The mixed stream is then split in FSP-101, and 30% is purged to prevent the accumulation of impurities, inert materials, or degradation products within the recycle loop. The recycled stream is then combined with the fresh solvent feed in custom mixer MX-102, which regulates the flow rate. A detailed description of the equipment is provided in Table A2. In Figure 1, alphanumeric codes denote unit operations (e.g., WSH-101 for washing, BC-101 for centrifugation, and NF-101 for nanofiltration) and numbered labels (S-101 through S-123) indicate material and recycle stream pathways.

3.2. Economic and Environmental Evaluation

3.2.1. Case Study

The region of Central Macedonia (RCM) in northern Greece was selected as the study area because of its intensive agricultural profile. RCM contributes a significant share of national agricultural output, including 23% of apple production. This study examines the valorization of second- and third-grade figs, apples, and pomegranates, which represent biomass streams currently excluded from the fresh fruit supply chain. In accordance with the National Waste Management Plan and Regulation (EC) 1580/2007 [34], a conservative 10% loss rate during harvesting and sorting was applied to 2022 Hellenic Statistical Authority data, resulting in an estimated annual regional availability of 8483 t for these crops [35]. The biomass composition is dominated by apples (87.3%), followed by pomegranates (9.7%) and figs (3.0%). To evaluate system viability, a hypothetical processing facility was located in the Sindos Industrial Area, Thessaloniki, assuming 30% utilization of the regional potential.
The logistics model incorporates the spatial distribution of biomass across the seven regional units (RUs) of the RCM, as presented in Table A4. Transportation requirements were estimated using weighted average distances from each RU to the Sindos facility, ranging from 67.1 km for figs to 93.4 km for pomegranates, reflecting different degrees of geographic dispersion. This circular bioeconomy approach also addresses regional socioeconomic challenges, including a 14% GDP decrease and a circular material use rate of 3.1%, which remains well below the EU average of 11.5% [36,37,38]. By converting underutilized agricultural residues into high-value polyphenols and syrup, the proposed system aims to support regional income and employment while aligning with OECD benchmarks for greenhouse gas reduction and resource efficiency [39,40].
Consequently, the modeled system represents an upstream polyphenol extraction cascade which can be integrated ahead of a fruit syrup production line. The primary co-product of the extraction process is the isolated solid cellulose residue discharged from the decanter centrifuge, with annual outputs quantified at 1,071,734 kg·yr−1 for apples, 1,489,752 kg·yr−1 for figs, and 1,388,930 kg·yr−1 for pomegranates (Table 5). Because this solid stream is directly routed as the primary feedstock for downstream syrup processing, the incoming fruit residues enter the extraction stage without an initial raw material purchase cost burden (Table 2), while the subsequent economic conversion of the syrup remains outside the immediate scope of the present study which focuses on the polyphenols’ extraction stage.

3.2.2. Techno-Economic Analysis

The techno-economic evaluation of the extraction process was carried out using a systematic approach based on process simulation in SuperPro Designer, complemented by literature data within a unified assessment framework. The analysis relied on detailed mass and energy balances generated by the simulation to quantify raw material and utility requirements, as well as the production of phenolic compounds and by-products.
The simulation outputs were then used to estimate capital and operating costs. Capital expenditures (CAPEX) were calculated using the direct fixed capital (DFC) approach, while operating expenditures (OPEX) included energy consumption, labor, and waste management costs.
Overall economic performance was assessed through a discounted cash flow (DCF) analysis, allowing evaluation of profitability and economic robustness. A sensitivity analysis was also conducted to examine the influence of key parameters on project viability.
The economic feasibility of the process is quantified using the following indicators:
1. Direct Fixed Capital (DFC)
The capital investment is estimated as follows:
D F C = ( D C + I C + O C )
where DC represents direct costs (equipment purchase, installation, and piping), IC indirect costs (engineering and construction), and OC other costs (contractor fees and contingency).
2. Net Present Value (NPV)
N P V = k = 1 N N C F k 1 + i k
where NCFk is the net cash flow in year k, i is the discount rate, and N is the project lifetime.
3. Return on Investment (ROI)
R O I = Net   Profit Total   Investment × 100
4. Internal Rate of Return (IRR)
k = 1 N N C F k 1 + I R R k = 0
The operating costs and economic evaluation parameters inputs are presented in Table 4 and Table 5.
The economic parameters used in the techno-economic analysis were based on literature data and complemented by operational benchmarks from the Greek agro-food industry. The baseline selling price of EUR 80/kg reflects a high-potency, standardized polyphenol powder obtained downstream of centrifugation and nanofiltration stages. In techno-economic literature, prices for semi-purified botanical polyphenols targeting nutraceutical and cosmeceutical sectors span from EUR 25 to 210€/kg depending on active compound concentration [43], distinguishing them from low-value unrefined extracts (EUR 2–10/kg) and expensive analytical standards (EUR >500/kg). Market risk was addressed through sensitivity analysis, defining EUR 66.03/kg as the break-even floor for full capital amortization.
Table 5. Economic evaluation parameters for techno-economic analysis.
ComponentUnitValue
Construction periodMonths18
Startup periodMonths4
Project lifetimeYears20
Inflation%4
NPV interest%7
Income taxes%22

3.2.3. Life Cycle Analysis (LCA)

The goal of the LCA was to assess the cradle-to-gate environmental footprint of recovering 1 kg of GAE polyphenol-rich powder through the valorization of secondary and low-grade fruit biomass. Following LCA frameworks for agro-industrial residue valorization and cascading bioeconomy systems [21,24], system boundaries were defined from cradle to gate, encompassing primary agricultural fruit production, regional transportation logistics to Sindos, Thessaloniki, and industrial extraction processing. Upstream fruit cultivation was incorporated to account for the embedded agricultural burdens of the primary crops, allowing for a comprehensive comparison across distinct fruit feedstocks. The functional unit (1 kg of GAE polyphenol-rich powder) was selected to provide direct consistency with the process simulation mass balances and bioactive yield metrics. The environmental assessment followed ISO 14044 [46] and was performed in SimaPro v10.2 using the ReCiPe Midpoint (H) method, together with the ecoinvent v3.11 and Agri-footprint v6.3 databases. The key inventory for the extraction of 1 kg of GAE polyphenol-rich powder is presented in Table 6.
Inventory values for energy use, washing water, distilled water, β-cyclodextrin, and other consumables were derived from the SuperPro mass and energy balances and used as input data in SimaPro. In the process model, fruit biomass is represented as water, cellulose, and gallic acid, with a nominal feed rate of 1000 kg·h−1 and 7920 operating hours per year (330 days). The UAE unit was simulated as a continuous stirred tank reactor, and its energy demand was calculated using the software’s heating requirements to reach an outlet temperature of 50 °C. Transportation impacts for apples, figs, and pomegranates were calculated using their regional availability and the distances between collection areas and the Sindos facility. For figs, the nominal design capacity should be interpreted as a process benchmark, reflecting a potential deployment scenario rather than a fully supply-constrained regional case.

3.2.4. Key Assumptions

In the SuperPro model, the fruit biomass was represented by three components: water, cellulose, and gallic acid, with the latter serving as a stoichiometric surrogate for the recovered polyphenol-rich powder. It is acknowledged that modeling the recovered extract as pure gallic acid is a simplification required to close the process mass and energy balances; in practice, the polyphenol-rich powder is a compositionally complex mixture whose molecular weight, particle size, and structure vary with extraction method [28]. Because extraction methods have been shown to materially affect the yield, structure, and antioxidant performance of comparable plant-derived bioactive extracts, this simplification introduces uncertainty into the downstream mass balance and utility duty calculations that are not captured by a deterministic surrogate. This uncertainty is partially addressed through the propagation of experimental yield variability (~5%) into the techno-economic results (Table 9) and through validation of the major unit operations against manufacturer-rated equipment performance and published pilot-scale UAE process data.
A nominal feed rate of 1000 kg/h and an annual operating time of 7920 h/year were assumed, corresponding to 330 operating days per year and allowing for scheduled maintenance downtime. The UAE equipment was modeled as a continuous stirred tank reactor, and its energy demand was estimated using the software’s built-in cooling calculations to achieve an outlet temperature of 52 °C for figs and pomegranates and 64 °C for apples. The reactor’s power density was assumed to be 2 kW·m−3 to represent sonication energy requirements. The solvent to freeze-dried fruit powder ratio was set at 10:1.
The economic parameters used in the techno-economic analysis were based on literature data and complemented by information from the Greek industry. The baseline selling price was set at EUR 80/kg, representing a standardized, polyphenol-rich powder for B2B functional ingredient markets. In the life cycle assessment, transportation for apples, figs, and pomegranates was calculated from their regional availability and the distance between the collection areas and the processing facility in Sindos. For pomegranates and figs, the 1000 kg·h−1 design capacity serves as an unconstrained industrial process benchmark to evaluate scale economies, whereas regional supply constraints are explicitly addressed via capacity sensitivity modeling.
The system was tested against the most important key assumptions. Accordingly, TEA was conducted for polyphenol prices in the range of EUR 40 to 80/kg, feedstock capacities from 100 to 1000 kg/h, and reactor power densities from 2 to 30 kW/m3.

4. Results and Discussion

4.1. Material and Energy Balance

Steady-state process simulations were performed to evaluate the annual material and energy balances for the ultrasound-assisted extraction (UAE) of apples, figs, and pomegranates. To ensure comparability, all models were normalized to a standardized processing capacity of 7,920,000 kg·yr−1, corresponding to 1000 kg·h−1 of feedstock processed over 7920 operating hours (24 h·day−1 × 330 days). Pomegranate extraction process demonstrated the highest extraction yield, producing 115,870 kg·yr−1 of polyphenols expressed as gallic acid equivalents (GAE), which corresponds to 14.63 kg GAE per ton of feedstock. Apples and figs yielded 13,306 kg·yr−1 (1.68 kg GAE·t−1) and 7128 kg·yr−1 (0.90 kg GAE·t−1), respectively. The material and energy balances are presented in Table 7.
The solvent solution supply is regulated at a 10:1 ratio. Apple feedstock’s higher moisture content resulted in lower solvent solution consumption. However, double the amount of β-cyclodextrin is required for apple extraction compared to that for figs and pomegranates, which is reflected in the almost 1.5 times higher consumed amount compared to that for fig and pomegranate extraction. The apple extraction process required approx. 100,000 kwhyr−1 less electricity than fig and pomegranate extraction. After the tray-drying process the apple feedstock streams became lighter, due to the higher initial moisture content; as such, the overall handling required less energy.
Steam consumption is related to tray-drying and evaporation. While tray-drying handled more moisture in the apple line, the evaporator had to remove less water downstream compared to the fig and pomegranate feedstocks. As such, the hourly steam demand for apples (2616.36 kg·h−1) was more than 15% lower compared to that for fig (3125.82 kg·h−1) and pomegranate (3137.47 kg·h−1) extraction. Cooling water is consumed in the reactor and the condenser. Apple extraction presented more than 30% reduced hourly demand compared to fig and pomegranate extraction, due to a lower mass flow.
From a regional resource perspective, the assumption of 30% absorption for second- and third-grade apples, figs, and pomegranates limits the 7920 tonnes·yr−1 feedstock processing capacity. Apple extraction can be served considering their regional availability of 7407 t·yr−1. However, fig and pomegranate availability, at 254 t·yr−1 and 823 t·yr−1, respectively, are orders of magnitude lower than the simulated feedstock requirement. Consequently, the 1000 kg·h−1 configuration serves as an industrial scale-up benchmark, while the actual supply-constrained regional reality is evaluated through the downscaled capacity sensitivity analysis.
Before evaluating the economic and environmental performance of the scaled-up scenarios, several simplified modeling approaches used in the process design must be contextualized. From an operational standpoint, pre-treating the fresh fruit biomass via consecutive tray- and freeze-drying stages models the transformation of seasonal agricultural residues into a stable, dehydrated powder, enabling year-round storage and continuous biorefinery operation (330 days/year). Downstream, solid–liquid separation via centrifugation (BC-101) completely isolates structural cellulose as a separate by-product stream. Following nanofiltration and thin-film evaporation, a concentrated, polyphenol-rich powder stream is obtained. Additionally, recovering the β -cyclodextrin extraction additive is simplified in concept, but practically requires membrane separation in the nanofiltration (NF) range (~1.1 kDa) alongside thermal or solvent-induced dissociation of the phenolic– β -cyclodextrin inclusion complexes to prevent co-retention of the active compounds.

4.2. Technoeconomic Assessment

The economic viability of scaling-up UAE polyphenol extraction varies significantly depending on the processed feedstock. Table 8 summarizes the primary fixed capital metrics, annual operating costs, and profitability indicators for the three processing configurations at a uniform capacity of 7,920,000 kg/yr and EUR 80/kg polyphenol selling price.
Techno-economic analysis demonstrated that the pomegranate baseline scenario is the sole economically robust scenario investigated. This process achieved a positive net present value (NPV) of EUR 11.81 M at a 7.0% discount rate paired with an internal rate of return (IRR) of 13.84% and a return on investment (ROI) of 15.42% yielding a project payback period of 6.48 years. This financial viability is sustained by annual market revenues of EUR 9.52 M. These revenues offset an annual operating cost (AOC) of EUR 6.35 M and a direct fixed capital (DFC) investment of EUR 28.83 M. Propagating experimental yield uncertainty ( ± 5 % ) within the pomegranate model shifts annual revenues between EUR 9.05 and 10.00 M·yr−1 while maintaining strong investment feasibility (NPV: EUR 9.8–13.8 M), confirming that experimental variance does not alter project viability.
Although apple and fig extraction required lower capital and operating costs, the total annual revenues could not overcome the cost barrier. The low polyphenol yields of figs and apples were reflected in the negative NPV and ROI. Overall, the extraction process benefited from solvent solution and washing water recycling and saved EUR 1.5 M for apple extraction and almost EUR 1 M for figs and pomegranates.
To evaluate system feasibility against the supply-constrained reality of Central Macedonia, the biorefinery was evaluated across downscaled capacities ranging from 100 to 1000 kg/h (Table 9). At the 100 kg/h regional baseline capacity—which matches the physical availability of off-grade pomegranates in Central Macedonia—the facility is severely unviable, yielding an NPV of EUR −26.17 M. While 1000 kg/h serves as an unconstrained industrial engineering benchmark, the capacity sweep identifies 750 kg/h as the structural break-even processing threshold (NPV = EUR 2.74 M). The variations of feedstock capacity, NPV, CAPEX, and OPEX across these throughputs are exhibited in Table 9.
Table 9. Techno-economic sensitivity and scale-up indicators for the green polyphenol extraction process from pomegranate across discrete feedstock capacities.
Throughput (kg/h)NPV (EUR M)CAPEX (EUR M)OPEX (EUR M)
100−26.17316.1212.913
300−18.25719.5153.745
600−3.51824.5424.729
7502.73627.2895.540
100011.81430.4416.349
At the 100 kg/h regional baseline capacity, the biorefinery exhibits severe inefficiencies, yielding an unviable net present value (NPV) of EUR −26.173 M driven by a disproportionate capital investment (CAPEX) of EUR 16.121 M and an operating cost (OPEX) of EUR 2.913 M/yr. Evaluating the scale-up continuum highlights a clear economy of scale benefit across the throughput spectrum. Expanding feedstock capacity tenfold to 1000 kg/h requires a comparatively modest ~90% increase in CAPEX (to EUR 30.441 M) and a ~110% increase in OPEX (to EUR 6.349 M/yr). Driven by the linear scaling of annual revenues against these sub-linearly increasing capital and operational expenditures, the NPV moves upward from EUR −18.257 M at 300 kg/h to EUR −3.518 M at 600 kg/h, crossing the structural break-even line to reach EUR 2.736 M at 750 kg/h.
To evaluate the financial resilience and market feasibility of the proposed biorefinery process, a comprehensive sensitivity analysis was performed on the selling price of the recovered polyphenols. High-value bio-based compounds frequently exhibit significant market price volatility, driven by variations in final product purity, functional performance, and fluctuating industrial demand across the pharmaceutical, cosmetic, and nutraceutical sectors. Grounded in current industry insights, a realistic pricing spectrum ranging from EUR 40/kg to EUR 80/kg was established to model the system’s economic performance under diverse market conditions. This analysis systematically quantifies the direct impact of product revenue variations on the project’s overarching financial indicators, specifically the net present value (NPV), gross margin, and net profit. By mapping the NPV across this price distribution, this evaluation explicitly defines the margin of safety relative to the operating break-even threshold of EUR 66.03/kg, identifying the precise economic tipping point required for full capital recovery under a fixed 7.0% discount rate and 1000 kg/h design capacity. Ultimately, this sensitivity assessment provides critical risk-mitigation insights, ensuring the decision-support framework accounts for commercial uncertainties in the transition toward a circular bioeconomy. Table 10 presents annual revenue, gross profit, and NPV in a range of polyphenol selling prices between EUR 40 and 80 per kg.
A price range of EUR 40 to 80 per kg of polyphenol-rich powder was indicated by industry insights. The break-even point, EUR 66.03/kg, is above the average of the examined range of prices. The sensitivity analysis also highlighted that a 50% drop in selling price from the baseline scenario caused a 314% decrease in the NPV. The selling price to NPV rate of change exhibited a steep slope. A 21.6% increase above the economic break-even floor yields a EUR 11.81 M NPV and a gross margin increase of 55.63%. Below the critical economic break-even price, the process remains unsustainable due to fixed operating costs of EUR 6.35 M per year. The sensitivity analysis demonstrated a high volatility to the bioactive compound price trends.
The reactor’s power density assumption, 2 kW/m3, was examined in a sensitivity analysis in relation to OPEX and NPV and is presented in Table 11. Specifically, the reactor’s power densities of 10 and 30 kW/m3 were examined against OPEX and NPV. Specifically, a 15-fold increase in the power density of the reactor increases the annual operating costs by 0.19% and decreases the net present value (NPV) by 0.87%.
This sensitivity analysis demonstrated that while the economic viability of the pomegranate extraction process is heavily constrained by initial capital requirements, maintaining a B2B commercial pricing strategy above the break-even point ensures robust capital recovery and financial resilience against market volatility.

4.3. Life Cycle Assessment

A life cycle assessment (LCA) was conducted in accordance with ISO 14044 to quantify the environmental impacts associated with the production of 1 kg of GAE, from low-grade apples, figs, and pomegranates in the region of Central Macedonia. The industrial scale-up configurations were modeled using SimaPro v10.2, with datasets sourced from the ecoinvent v3.11 and Agri-footprint v6.3 databases. Environmental impact categories were evaluated using the ReCiPe Midpoint (H) methodology for 18 environmental indicators within the areas of ecosystems, resource depletion, and human health. The life cycle inventory (LCI) for the extraction facility included direct material inputs, β-cyclodextrin, process and washing water, waste management, and energy utilities, and is presented in Table 10. The inputs were derived by the mass and energy balances from the SuperPro Designer simulations and adjusted to the functional unit of 1 kg of GAE extraction.
Table 12 indicates that the production of 1 kg of GAE from apples and figs entails substantially higher inputs of feedstock, β -cyclodextrin, solvent water, washing water, grid electricity, steam, and cooling water compared with pomegranates, reflecting the markedly lower extraction yields of apples and figs. In particular, the specific requirements for thermal utilities, cooling water, and electricity are more than an order of magnitude higher for the apple and fig lines than for the pomegranate line. This implies that thermal utilities and water consumption are expected to dominate the environmental impact categories in the life cycle assessments for the apple- and fig-based systems, whereas the optimized pomegranate-based configuration is significantly less intensive in energy and water per unit of active product.
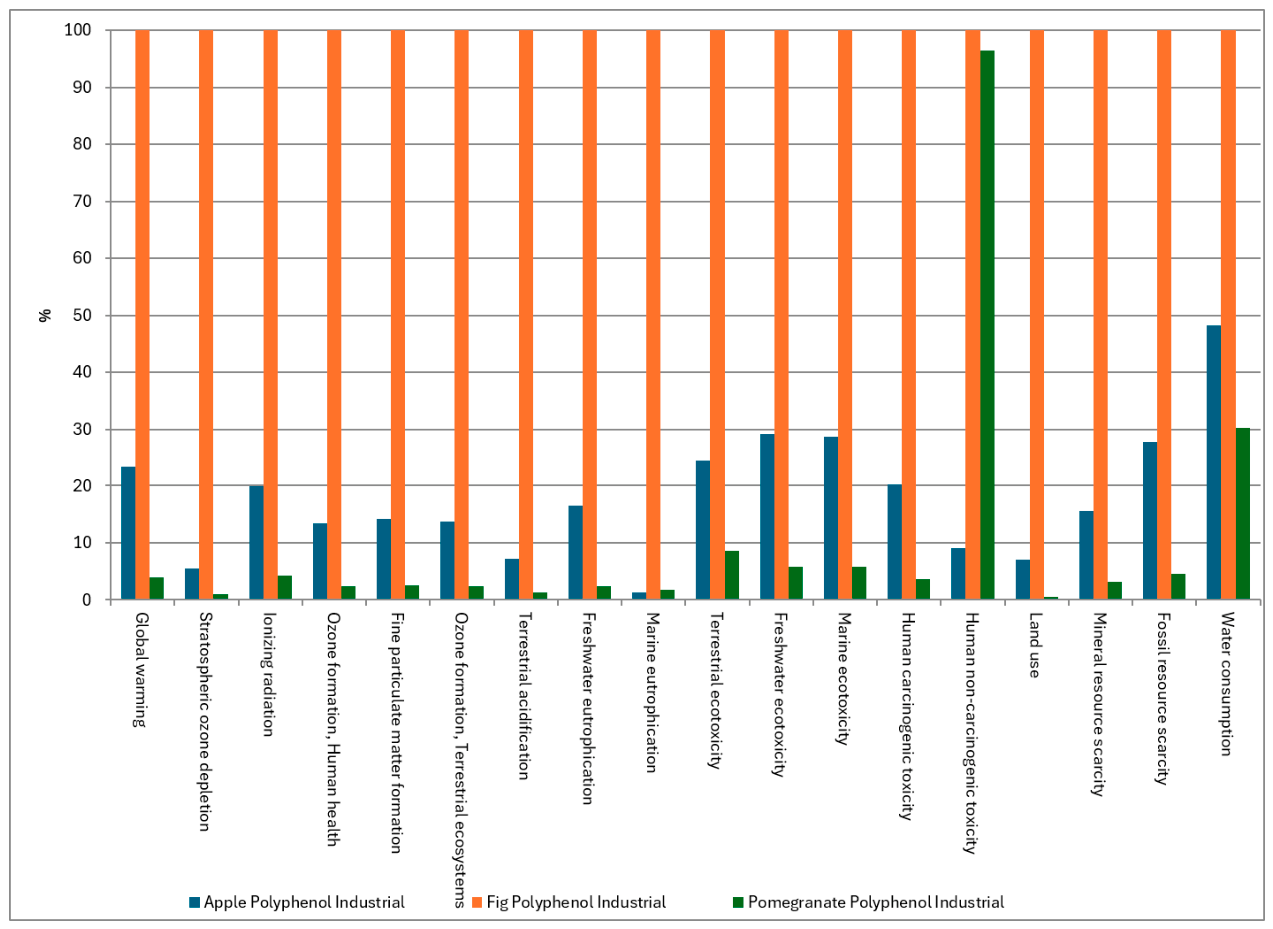
The midpoint characterization results are demonstrated in Figure 2 and Table A5. Overall, fig extraction exhibited the highest environmental impact, dominating all 18 ReCiPe Midpoint (H) categories at the maximum reference level of 100%. Apple extraction presented the second-highest environmental footprint across the board, showing mid-range contributions such as 23.29% in global warming and 48.28% in water consumption. On average, the optimized pomegranate configuration displayed the best environmental performance, remaining below 6% in nearly all indicators, with exceptional spikes observed only in water consumption (30.31%) and human non-carcinogenic toxicity (96.48%). Indicators related to the atmosphere and aquatic ecosystems were heavily dominated by the fig and apple lines rather than pomegranates. Ultimately, the massive feedstock demands of the fig line caused its land-use requirements to be over 169 times higher than pomegranates, while its high water volume drove a total consumption rate over 3 times higher than the pomegranate line.
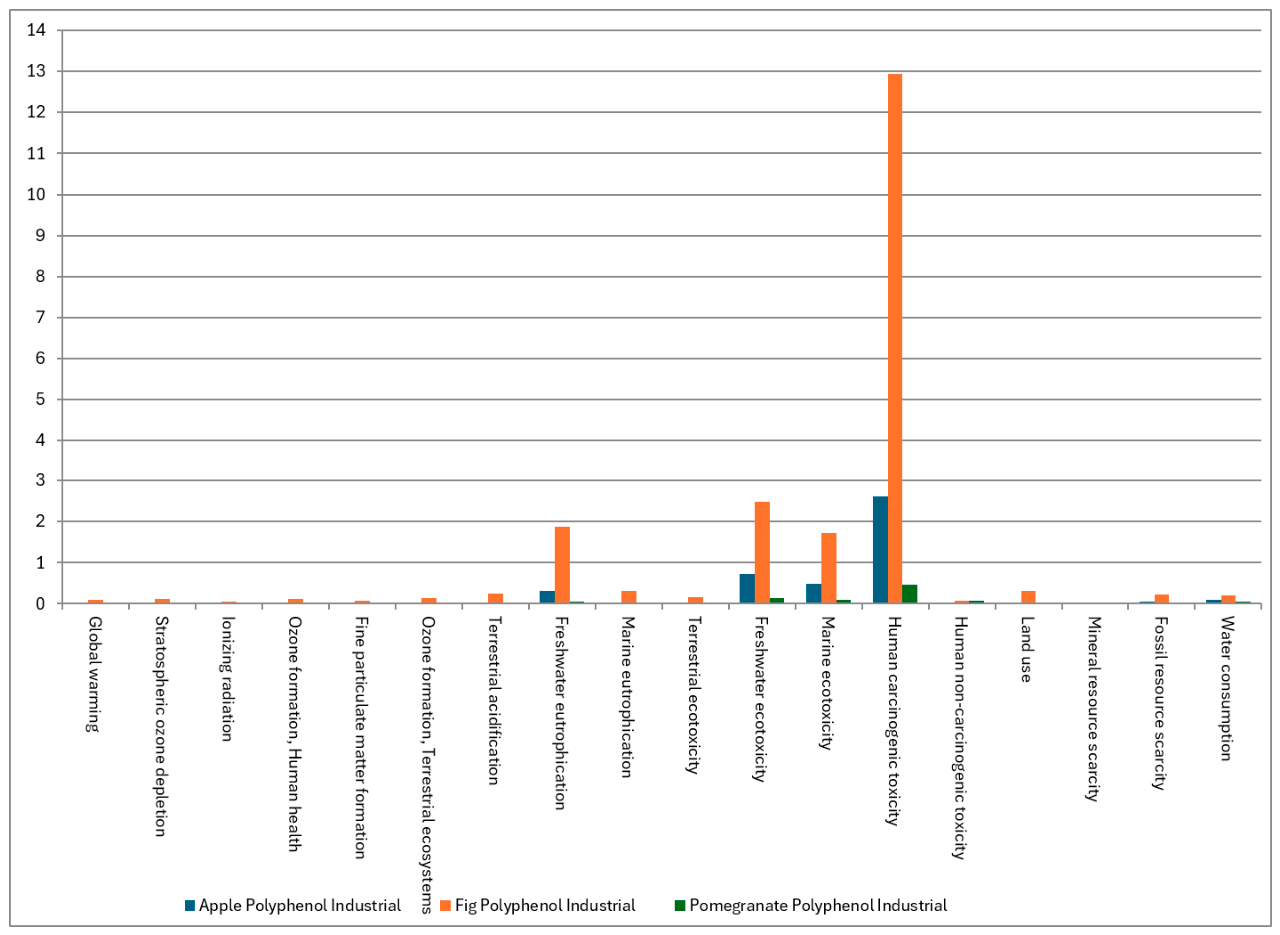
The normalized midpoint results are demonstrated in Figure 3 and Table A6. The results indicate that toxicity-related categories constitute the main environmental hotspots for all three configurations, with fig extraction clearly dominating the absolute scores. Fig extraction exhibited the highest overall normalized footprint, driven predominantly by human carcinogenic toxicity (12.95), with substantial secondary contributions from freshwater ecotoxicity (2.49), freshwater eutrophication (1.87), and marine ecotoxicity (1.72). Apple extraction demonstrated noticeably lower impact levels compared to the fig line, yielding normalized values of 2.62 for human carcinogenic toxicity, 0.73 for freshwater ecotoxicity, and 0.49 for marine ecotoxicity, alongside a minor peak in freshwater eutrophication (0.31). In comparison, the optimized pomegranate extraction displayed consistently lower normalized scores across the board, with its highest contribution being 0.47 for human carcinogenic toxicity and all other categories remaining under 0.15.
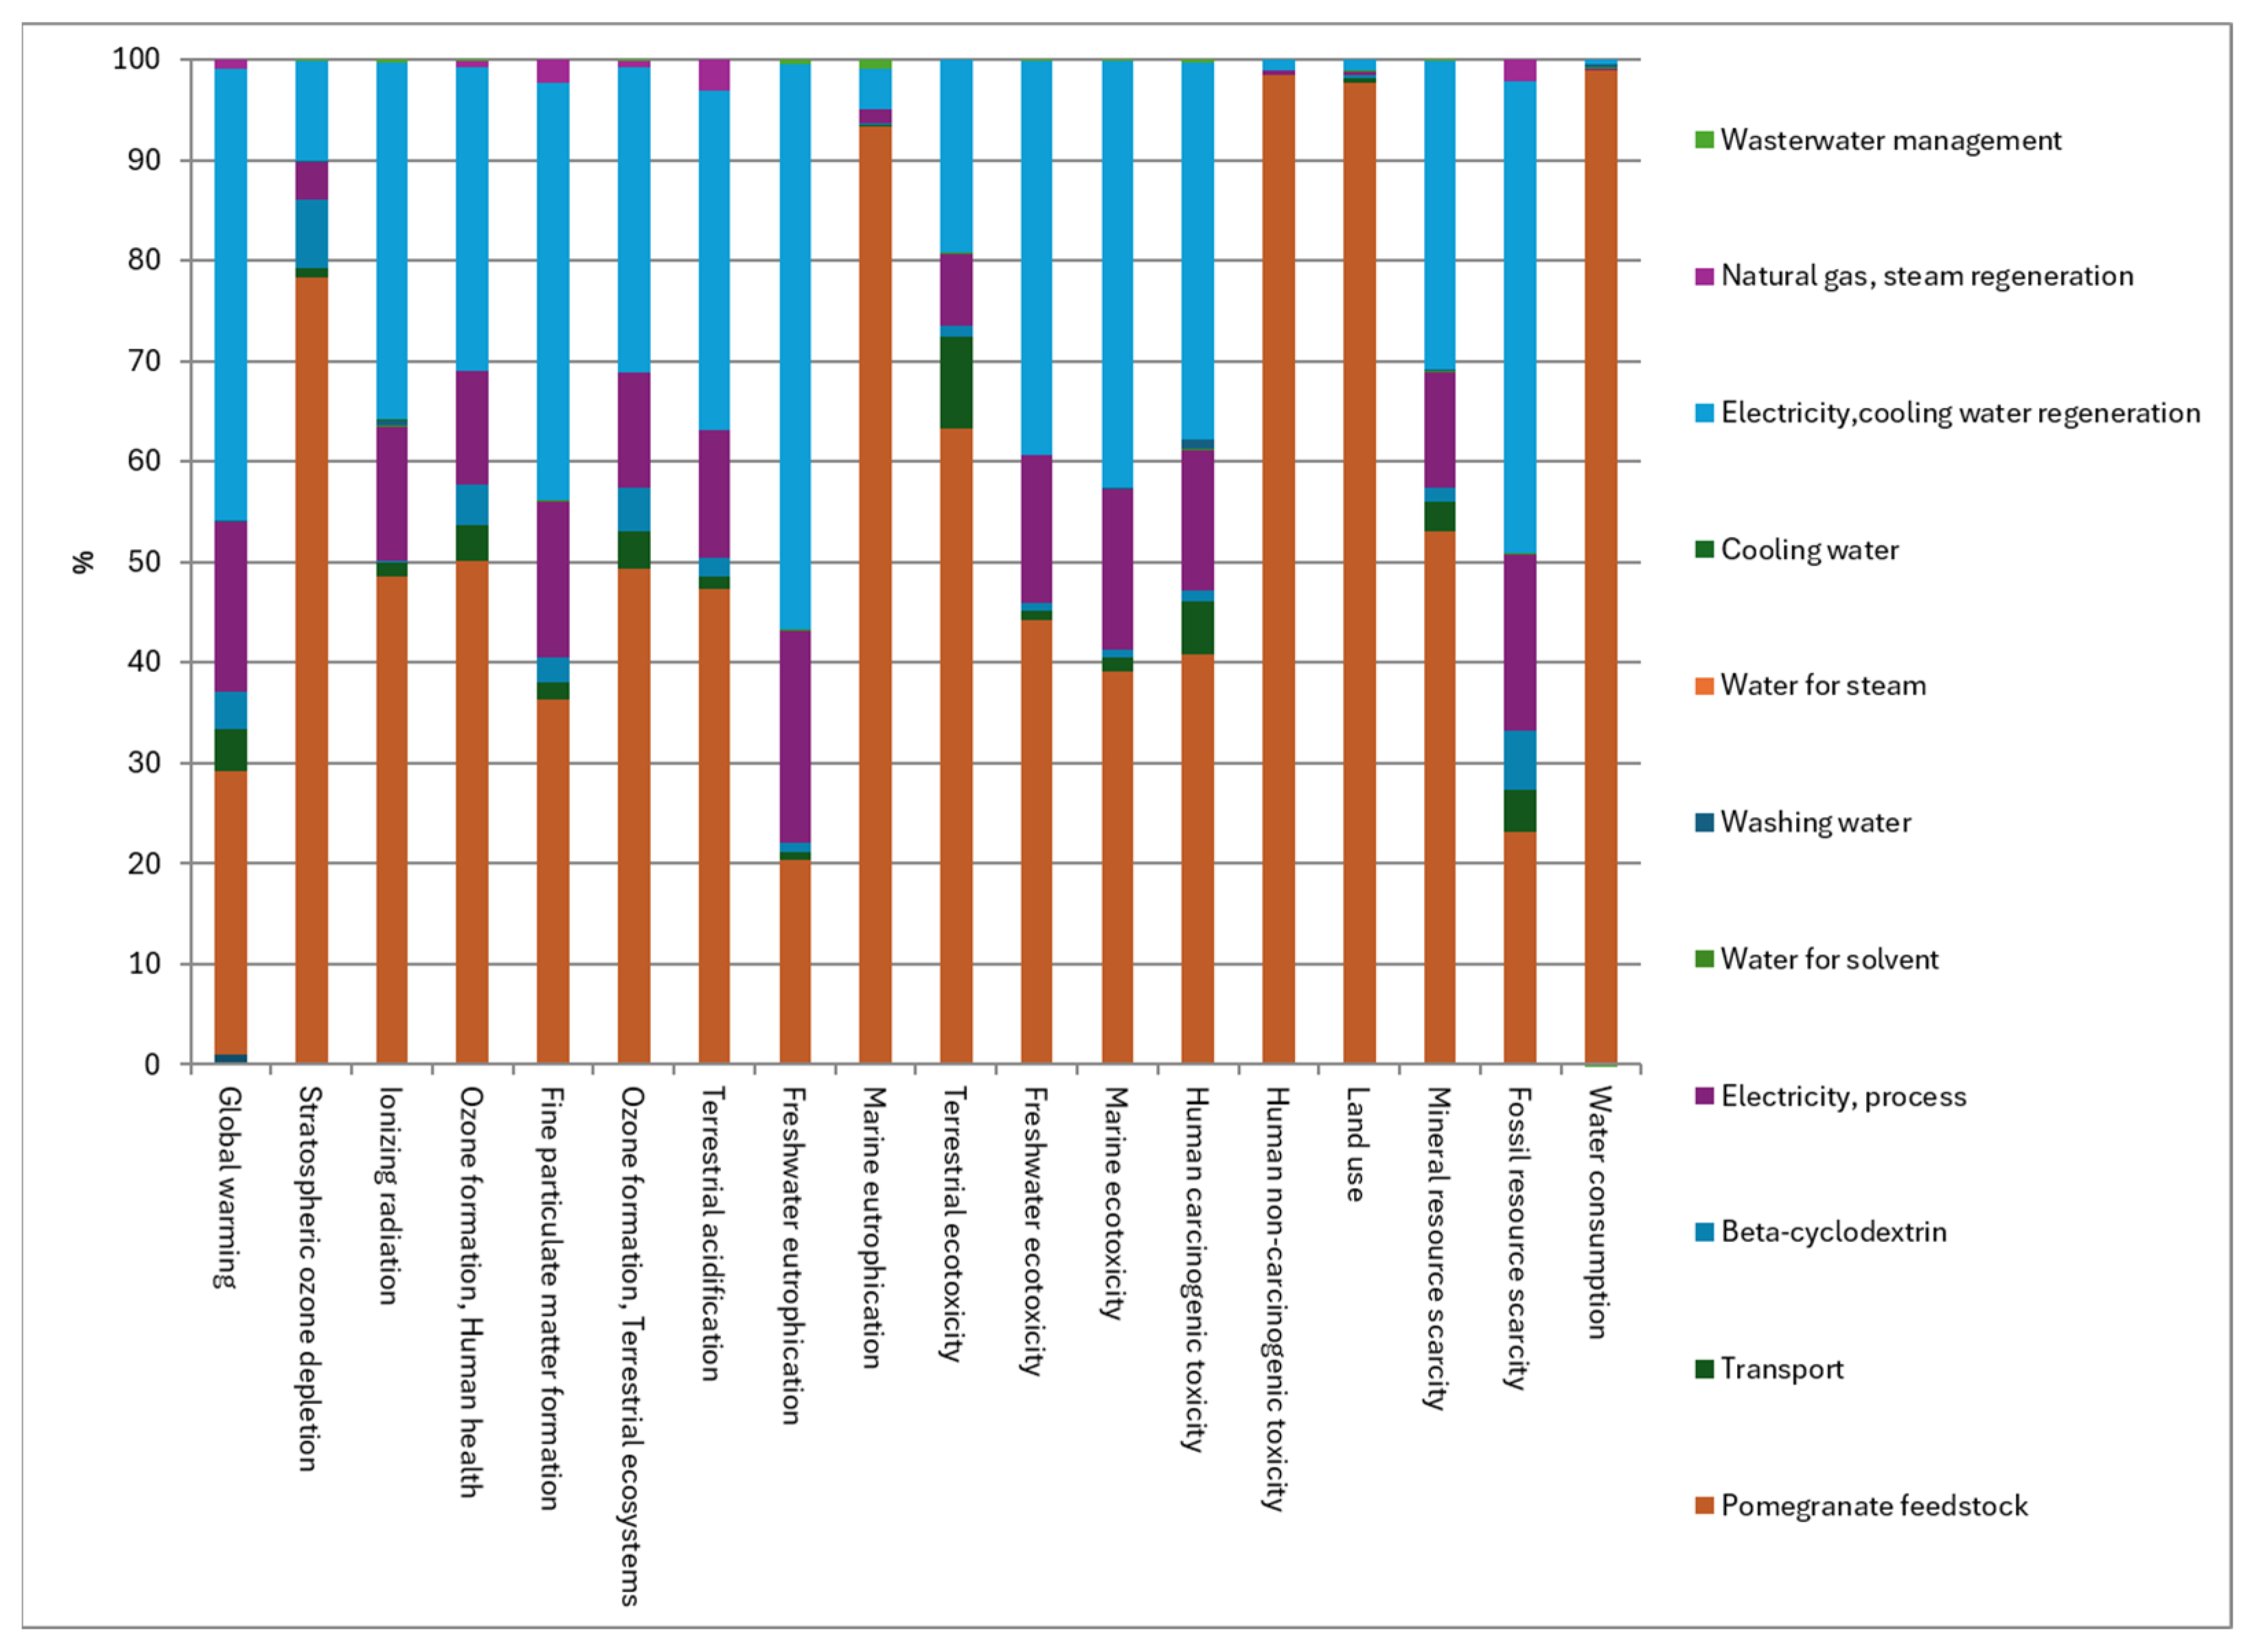
The process contribution analysis for the pomegranate extraction line is demonstrated in Figure 4 and Table A7. Cultivation of the pomegranate feedstock emerges as a primary environmental hotspot, accounting for the largest shares in several critical midpoint categories, such as human non-carcinogenic toxicity (98.45%), water consumption (98.88%), land use (97.66%), marine eutrophication (93.42%), and stratospheric ozone depletion (78.34%). The electricity required for cooling water regeneration represents the secondary critical hotspot, contributing major shares to global warming (45.02%), fossil resource scarcity (46.99%), fine particulate matter formation (41.55%), and marine ecotoxicity (42.54%). Furthermore, process electricity contributed noticeably to freshwater eutrophication (21.08%). In contrast, transport, β -cyclodextrin inputs, fresh water and steam makeups, natural gas for steam regeneration, and wastewater management remained minor contributors across all analyzed categories. To improve the environmental performance of the optimized pomegranate extraction process, focus should be drawn to lowering the heavy refrigeration electrical loads. Pomegranate crop production also remains a major target area, highlighting the need for more sustainable agricultural management practices to mitigate upstream cultivation impacts.

5. Conclusions

The present work assessed the valorization of low-grade fruit streams from Central Macedonia through the ultrasound-assisted extraction of standardized polyphenol-rich powders, integrating experimental data, process simulation, techno-economic analysis, and life cycle assessment. The results demonstrated a pronounced feedstock effect, with pomegranate consistently outperforming apples and figs in terms of polyphenol recovery and industrial production potential.
The modeled process varied from the laboratory framework, incorporating a tray-drying step prior to final freeze-drying to strip the stream of excess water. Because the high-moisture feed required considerable thermal duty, the tray-drying equipment drove the total capital investment (CAPEX) to EUR 30.44 M. Downstream of the extraction vessel, the stream was centrifuged to isolate the cellulose-rich solid residue, followed by nanofiltration to separate and recover the β-cyclodextrin macrocycles. Advanced utility configurations—specifically closed-loop steam regeneration and cooling water recirculation—were implemented to reduce net raw material and energy inputs.
From an economic perspective, pomegranate extraction demonstrated superior viability at the baseline industrial capacity primarily due to its high polyphenol yield (14.63 kg GAE·t−1), yielding an NPV of EUR 11.81 M and an annual operating cost of EUR 6.35 M/yr at a baseline selling price of EUR 80.00/kg. However, this commercial feasibility reflects process-scale performance; deplorability in Central Macedonia requires multi-feedstock campaign operations or inter-regional feedstock aggregation to overcome localized biomass deficits. By contrast, due to their markedly low extraction yields, the apple and fig lines remained highly unattractive, generating severe financial deficits. The financial sensitivity analysis revealed that the process is highly vulnerable to market price fluctuations, remaining viable only above the exact break-even selling price of EUR 66.03/kg. Conversely, sensitivity sweeps regarding the reactor agitation loops proved that the process is highly robust against ultrasound production energy; ramping the reactor power density fifteenfold (from 2 to 30 kW/m3) increased the annual OPEX by merely EUR 11,681/yr and decreased the lifetime project NPV by less than 0.9%.
The environmental life cycle assessment demonstrated significantly superior environmental performance for the pomegranate extraction line compared to the fig and apple alternatives per unit of active product. Based on the normalized ReCiPe Midpoint scores, toxicity-related indicators constituted the primary environmental hotspots across all three configurations, with the fig line exhibiting the worst absolute footprint (dominating all 18 indicators at 100%) due to its massive biomass and water throughput demands. On average, the apple and fig configurations generated environmental impacts that were more than an order of magnitude higher than the pomegranate line. Within the isolated pomegranate system, process contribution analysis revealed that upstream pomegranate cultivation was the dominant contributor to agricultural indicators, accounting for 98.88% of water consumption, 97.66% of land use, and 98.45% of human non-carcinogenic toxicity. Downstream, the heavy electrical duty required for cooling water regeneration emerged as the secondary operational hotspot, driving 45.02% of global warming and 46.99% of fossil resource scarcity impacts.
When put in a regional development perspective, the findings indicate that lower-grade pomegranate is the most promising feedstock among those investigated; however, regional biomass availability of 823 t·yr−1 remains a limiting factor for the implementation of a standalone industrial plant at the modeled scale. Future research should therefore address two main gaps. First, rather than direct stream blending, experimental and process optimization should focus on flexible, multi-feedstock campaign processing. Controlled studies are needed to evaluate how alternating seasonal feedstocks (apple, fig, and pomegranate) or integrating secondary co-products within the same biorefinery infrastructure impacts overall annual equipment utilization, solvent recovery efficiency, and operational costs. Second, a spatially explicit logistical optimization study should refine collection and consolidation strategies (hub locations, routing, time windows, and campaign scheduling) to minimize transport distances and on-site storage requirements. Moreover, a scale-up from laboratory to pilot experimentation can solidify power densities and feedstock to solvent ratio assumptions.

Author Contributions

Conceptualization, L.D.M., S.I.P., I.M., and G.F.B.; methodology, L.D.M., S.I.P., and G.F.B.; software, L.D.M.; validation, L.D.M., I.M., and S.I.P.; formal analysis, L.D.M., M.B., S.S., and S.I.P.; investigation, L.D.M., M.B., and S.S.; resources, L.D.M. and G.F.B.; data curation, L.D.M., M.B., S.S., and I.M.; writing—original draft preparation, L.D.M.; writing—review and editing, L.D.M., S.I.P., S.S., M.B., I.M., and G.F.B.; visualization, L.D.M.; supervision, G.F.B. and S.I.P.; project administration, G.F.B., L.D.M., and M.B.; funding acquisition, G.F.B. and I.M. All authors have read and agreed to the published version of the manuscript.

Funding

This research was co-funded by the European Regional Development Fund and Greece, Project code: KMP6-0140563.

Data Availability Statement

The data presented in this study are available within the article.

Acknowledgments

During the preparation of this manuscript, the authors used Gemini 1.5 Pro for the purposes of text editing. The authors have reviewed and edited the output and take full responsibility for the content of this publication.

Conflicts of Interest

The authors declare no conflicts of interest.

Abbreviations

The following abbreviations are used in this manuscript:
UAEUltrasound-assisted extraction
TPCTotal phenolic content
GAEGallic acid equivalents
TEATechno-economic analysis
LCALife cycle assessment
DFCDirect fixed capital
CAPEXCapital expenditures
OPEXOperating expenditures
DCFDiscounted cash flow
NPVNet present value
ROIReturn on investment
IRRInternal rate of return
RCMRegion of Central Macedonia
RURegional unit
GDPGross domestic product
CH4Methane
CO2Carbon dioxide
OECDOrganisation for Economic Co-operation and Development
EUEuropean Union
DWDry weight

Appendix A

Experimental Results

Table A1. Effect of sonication time (min), extraction temperature (°C), and β-cyclodextrin concentration (mg/mL) on total phenolic content (mg GAE/g dry weight) and DPPH radical scavenging activity (μmol Trolox/100 g dry fruit) of lyophilized apple, pomegranate, and fig fruits.
Duration of Sonication (min)Temperature (°C)Concentration of β-Cyclodextrin (mg/mL)Total Phenol Content
(mg GAE/g 100 g Dry Weight)
DPPH Radical Scavenging Activity
(μmol Trolox/100 g Dry Fruit)
ApplePomegranateFigApplePomegranateFig
122.2052.509.509.41 ± 0.3374.21 ± 2.62287 ± 1.346400 ± 75084,108 ± 82,264341 ± 5.9
62.5052.509.508.77 ± 1.0878.91 ± 4.19256 ± 2.75923 ± 85079,354 ± 2339332 ± 3.5
62.5023.079.507.62 ± 0.6065.30 ± 8.35208 ± 2.64119 ± 19076,200 ± 1712574 ± 4.7
62.5052.509.509.33 ± 0.6572.20 ± 0.21254 ± 3.15481 ± 26772,905 ± 10,388330 ± 3.3
98.0070.0015.008.67 ± 1.7876.70 ± 6.29248 ± 3.97918 ± 53987,933 ± 7381432 ± 5.1
98.0035.0015.009.69 ± 0.4375.80 ± 9.79209 ± 5.96114 ± 80374815 ± 4154208.6 ± 5.6
62.5052.509.509.45 ± 0.1773.00 ± 10.23255 ± 3.15718 ± 38273,123 ± 5216329 ± 2.1
62.5052.509.509.44 ± 0.3978.81 ± 4.45256.0 ± 2.76264 ± 30673,034 ± 6914331 ± 2.5
62.5052.500.257.21 ± 0.3071.76 ± 1.45230 ± 4.55102 ± 43478,943 ± 4225344 ± 1.9
62.5052.509.5010.20± 0.2671.16 ± 6.31252 ± 4.36289 ± 26473,470 ± 4496330 ± 1.5
2.8052.509.508.54 ± 0.0174.11 ± 1.85457 ± 14.96045 ± 14988,054 ± 10,549516 ± 4.9
27.0070.004.0010.65 ± 0.5573.31 ± 3.37219 ± 5.77069 ± 61373,766 ± 948552 ± 5.1
98.0035.004.008.16 ± 0.4359.80 ± 13.18185 ± 7.15332 ± 52571,378 ± 588366 ± 3.7
62.5081.939.509.88 ± 1.3470.00 ± 2.33227 ± 5.56899 ± 96779,309 ± 431475 ± 5.5
27.0035.0015.009.36 ± 0.6965.86 ± 3.11277 ± 7.16178 ± 35482,470 ± 438591 ± 5.7
62.5052.5018.759.78 ± 0.7874.91 ± 1.59319 ±2.96589 ± 49882,183 ± 4680211 ± 2.9
62.5052.509.509.61 ± 0.3679.50 ± 6.43255 ± 3.76765 ± 41984,406 ± 1685328 ± 3.3
98.0070.004.0011.02 ± 0.7271.52 ± 3.29210 ± 1.97831 ± 41786,156 ± 363209 ± 3.0
27.0070.0015.0012.02 ± 0.669.50 ± 0.85241 ± 6.18245 ± 53384,818 ± 367500 ± 5.3
27.0035.004.006.80 ± 0.7178.66 ± 2.87194 ± 3.55264 ± 22985,916 ± 479543 ± 4.7

Appendix B

Appendix B.1. Equipment List

Table A2. Principal process equipment in the ultrasound-assisted polyphenol extraction plant, including identification codes, equipment types, and main functions within the continuous fruit residue valorization pathway.
Equipment IDEquipment TypeMain Function
WSH-101WasherRemoves surface dirt and contaminants from incoming second-/third-grade fruits before processing
FSP-102SplitterSplits washing water recycling (80%) and a purge stream (20%)
MX-103MixerMixes fresh washing water and recycled washing water
SR-101ShredderReduces fruit size to facilitate freeze-drying and subsequent grinding
TR-101Tray-dryerInitial dehydration using steam
FDR-101Freeze-dryerDehydrates shredded fruits to preserve thermosensitive phenolics and improve diffusion during extraction
GR-102GrinderProduces fine fruit powders to maximize surface area and minimize internal mass transfer limitations
R-101Stirred reactorPerforms ultrasound-assisted extraction of phenolics, modeled as stoichiometric reaction, using aqueous β-cyclodextrin solution
BC-101Bowl centrifugeSeparates solid residue (cellulose) from phenolic-rich liquid phase
NF-101NanofiltrationSeparates β-cyclodextrin (retentate) from phenolic solution (permeate)
TFE-101Thin-film evaporatorConcentrates phenolic solution and removes water under mild thermal conditions
HX-101CondenserCondenses vapor stream from TFE-101 and cools recycled solvent before mixing
MX-101MixerMixes recovered β-cyclodextrin with condensed water to form recycled solvent stream
FSP-101Flow SplitterSplits mixed solvent stream into purge and recycle fractions
MX-102MixerCombines recycled solvent with fresh water and β-CD to achieve target solvent composition for extraction

Appendix B.2. Lower-Grade Apple, Fig, and Pomegranate Availability in RCM

Table A3. Available quantities of second- and third-grade apples, figs, and pomegranates in the regional units (RUs) of RCM for 2022.
Second- and Third- Grade Fruit Quantities (t/yr)
ApplesFigsPomegranates
RU Thessaloniki163.940.156.8
RU Imathia3121.266.943.4
RU Kilkis13.676.3179.2
RU Pella3601.728.1147.6
RU Pieria261.68.574.5
RU Serres219.716.4206.4
RU Chalkidiki25.217.5114.6
RCM7406.9253.8822.6
Table A4. Total distances to be covered by apples, figs, and pomegranates to reach the extraction plant placed in Sindos based on the percentage availability in each RU and the distance of each RU from the plant.
ApplesFigsPomegranatesDistance from Plant (km)
RU Thessaloniki2.2%15.8%6.9%20
RU Imathia42.1%26.4%5.3%75.1
RU Kilkis0.2%30.0%21.8%44.8
RU Pella48.6%11.1%17.9%73.1
RU Pieria3.5%3.3%9.1%64.8
RU Serres3.0%6.5%25.1%151
RU Chalkidiki0.4%6.9%13.9%154
Total distance (km)75.167.193.4

Appendix C

Appendix C.1

Table A5. LCIA characterization results of apple, fig, and pomegranate baseline scenario extraction using ReCiPe Midpoint (H).
LabelApple Polyphenol CompoundFig Polyphenol CompoundPomegranate Polyphenol Compound
Global warming23.29051003.9709
Stratospheric ozone depletion5.42191001.0036
Ionizing radiation19.86631004.2615
Ozone formation, human health13.37371002.3504
Fine particulate matter formation14.11861002.5535
Ozone formation, terrestrial ecosystems13.64761002.3872
Terrestrial acidification7.12591001.3839
Freshwater eutrophication16.49861002.3406
Marine eutrophication1.32451001.7888
Terrestrial ecotoxicity24.55551008.662
Freshwater ecotoxicity29.25081005.829
Marine ecotoxicity28.79881005.7823
Human carcinogenic toxicity20.24041003.6612
Human non-carcinogenic toxicity9.078210096.4768
Land use7.02191000.5906
Mineral resource scarcity15.57471003.1399
Fossil resource scarcity27.76741004.5754
Water consumption48.277210030.3135

Appendix C.2

Table A6. LCIA normalization results of apple, fig, and pomegranate baseline scenario extraction using ReCiPe Midpoint (H).
LabelApple Polyphenol CompoundFig Polyphenol CompoundPomegranate Polyphenol Compound
Global warming0.02280.0980.0039
Stratospheric ozone depletion0.00590.10840.001
Ionizing radiation0.00870.04360.0019
Ozone formation, human health0.01640.12280.0029
Fine particulate matter formation0.01210.0860.0022
Ozone formation, terrestrial ecosystems0.02010.14730.0035
Terrestrial acidification0.01820.2560.0035
Freshwater eutrophication0.30771.86510.0437
Marine eutrophication0.0040.30450.0054
Terrestrial ecotoxicity0.03860.1570.0136
Freshwater ecotoxicity0.72782.48820.145
Marine ecotoxicity0.49471.71790.0993
Human carcinogenic toxicity2.620212.94560.474
Human non-carcinogenic toxicity0.00730.08090.078
Land use0.0220.31270.0018
Mineral resource scarcity4.9 × 10−63.14 × 10−59.87 × 10−7
Fossil resource scarcity0.06020.21670.0099
Water consumption0.10230.2120.0643

Appendix C.3

Table A7. LCIA characterization results analysis of pomegranate extraction baseline scenario using ReCiPe Midpoint (H).
LabelPomegranate FeedstockTransportβ-CyclodextrinElectricity, ProcessWater for SolventWashing WaterWater for SteamCooling WaterElectricity, Cooling Water RegenerationNatural Gas, Steam RegenerationWastewater Management
Global warming28.22614.17823.771616.86180.03450.04915.92 × 10−50.00245.02431.7840.0681
Stratospheric ozone depletion78.34130.89586.87473.74180.01290.00961.68 × 10−50.00049.99140.00220.1297
Ionizing radiation48.5621.37550.231213.28490.1340.55820.00010.02335.473300.3577
Ozone formation, Human health50.143.5294.045911.27170.03440.0578.01 × 10−50.002430.09750.7390.083
Fine particulate matter formation36.3191.76732.396915.56150.05080.04096.83 × 10−50.001741.55212.26630.0434
Ozone formation, Terrestrial ecosystems49.36593.73934.356711.35080.0340.05597.74 × 10−50.002330.30880.70470.0816
Terrestrial acidification47.28871.351.836412.63550.05530.03584.44 × 10−50.001533.73923.01470.0428
Freshwater eutrophication20.42750.72030.988721.07840.01970.03713.87 × 10−50.001556.28330.00540.438
Marine eutrophication93.41770.05430.19881.45850.0020.00452.27 × 10−60.00023.89460.00920.9601
Terrestrial ecotoxicity63.34569.16451.01427.19070.0220.01971.2 × 10−50.000819.20060.00250.0393
Freshwater ecotoxicity44.16121.0440.72114.68430.0290.04062.04 × 10−50.001739.210.04160.0664
Marine ecotoxicity39.09791.41340.816415.93140.03210.04752.29 × 10−50.00242.53980.04440.0751
Human carcinogenic toxicity40.7745.26631.074214.0490.0830.96728.23 × 10−50.0437.51370.00190.2305
Human non-carcinogenic toxicity98.45120.05130.03350.39550.0010.0011.01 × 10−64.16 × 10−51.0560.00250.0079
Land use97.660.49490.27680.42370.00290.00463.48 × 10−60.00021.131400.0056
Mineral resource scarcity53.0332.911.44911.50930.07080.15463.66 × 10−50.006430.73200.1347
Fossil resource scarcity23.20344.1135.891717.59620.02750.03754.79 × 10−50.001546.98522.10320.0407
Water consumption47.2660.00730.02790.07660.07840.13350.660645.87785.8718−0.1272

References

  1. Lucarini, M.; Durazzo, A.; Bernini, R.; Campo, M.; Vita, C.; Souto, E.B.; Lombardi-Boccia, G.; Ramadan, M.F.; Santini, A.; Romani, A. Fruit Wastes as a Valuable Source of Value-Added Compounds: A Collaborative Perspective. Molecules 2021, 26, 6338. [Google Scholar] [CrossRef] [Scilit] [PubMed]
  2. Jeremić, M.; Matkovski, B.; Đokić, D.; Jurjević, Ž. Food Loss and Food Waste Along the Food Supply Chain—An International Perspective. Probl. Ekorozwoju 2024, 19, 81–90. [Google Scholar] [CrossRef] [Scilit]
  3. Yasim, N.S.E.M.; Buyong, F.; Asmat, A.; Latif, M.T. Estimating Landfill Methane Emissions Based on Climatic Conditions and Major Waste Components in Shah Alam, Selangor, Malaysia. J. Sustain. Sci. Manag. 2025, 20, 2339–2369. [Google Scholar] [CrossRef] [Scilit]
  4. FAO. Think Eat Save Tracking Progress to Halve Global Food Waste; FAO: Rome, Italy, 2024. [Google Scholar]
  5. Cansado, I.P.d.P.; Mourão, P.A.M.; Castanheiro, J.E.; Geraldo, P.F.; Suhas; Suero, S.R.; Cano, B.L. A Review of the Biomass Valorization Hierarchy. Sustainability 2025, 17, 335. [Google Scholar] [CrossRef] [Scilit]
  6. Vural Gursel, I.; Elbersen, B.; Meesters, K.P.H.; van Leeuwen, M. Defining Circular Economy Principles for Biobased Products. Sustainability 2022, 14, 12780. [Google Scholar] [CrossRef] [Scilit]
  7. Ortiz-Sanchez, M.; Solarte-Toro, J.C.; Inocencio-García, P.J.; Cardona Alzate, C.A. Sustainability Analysis of Orange Peel Biorefineries. Enzym. Microb. Technol. 2024, 172, 110327. [Google Scholar] [CrossRef] [Scilit] [PubMed]
  8. Bigliardi, B.; Galati, F. Innovation Trends in the Food Industry: The Case of Functional Foods. Trends Food Sci. Technol. 2013, 31, 118–129. [Google Scholar] [CrossRef] [Scilit]
  9. Siró, I.; Kápolna, E.; Kápolna, B.; Lugasi, A. Functional Food. Product Development, Marketing and Consumer Acceptance-A Review. Appetite 2008, 51, 456–467. [Google Scholar] [CrossRef] [Scilit] [PubMed]
  10. Varraso, R.; Camargo, C.A. Processed Meat Consumption and Lung Health: More Evidence for Harm. Eur. Respir. J. 2014, 43, 943–946. [Google Scholar] [CrossRef] [Scilit] [PubMed]
  11. Etemadi, A.; Sinha, R.; Ward, M.H.; Graubard, B.I.; Inoue-Choi, M.; Dawsey, S.M.; Abnet, C.C. Mortality from Different Causes Associated with Meat, Heme Iron, Nitrates, and Nitrites in the NIH-AARP Diet and Health Study: Population Based Cohort Study. BMJ 2017, 357, j1957. [Google Scholar] [CrossRef] [Scilit] [PubMed]
  12. Shahidi, F.; Ambigaipalan, P. Phenolics and Polyphenolics in Foods, Beverages and Spices: Antioxidant Activity and Health Effects—A Review. J. Funct. Foods 2015, 18, 820–897. [Google Scholar] [CrossRef] [Scilit]
  13. Wu, Q.; Zhou, J. The Application of Polyphenols in Food Preservation. In Advances in Food and Nutrition Research; Academic Press Inc.: Cambridge, MA, USA, 2021; Volume 98, pp. 35–99. [Google Scholar] [CrossRef] [Scilit]
  14. Costa, M.; Sezgin-Bayindir, Z.; Losada-Barreiro, S.; Paiva-Martins, F.; Saso, L.; Bravo-Díaz, C. Polyphenols as Antioxidants for Extending Food Shelf-Life and in the Prevention of Health Diseases: Encapsulation and Interfacial Phenomena. Biomedicines 2021, 9, 1909. [Google Scholar] [CrossRef] [Scilit] [PubMed]
  15. Pouységu, L.; Deffieux, D.; Malik, G.; Natangelo, A.; Quideau, S. Synthesis of Ellagitannin Natural Products. Nat. Prod. Rep. 2011, 28, 853–874. [Google Scholar] [CrossRef] [Scilit] [PubMed]
  16. Nair, A.; Maity, S.; Pai, V. Sustainable Extraction: A Comprehensive Review of Advancements beyond Conventional Methods. Microchem. J. 2026, 220, 116360. [Google Scholar] [CrossRef] [Scilit]
  17. Hu, X.; Sun, Y.; Wang, H.; Rahman, K.U.; Chen, Y.; Li, C.; Chi, X.; Cui, Z. Advances in Polyphenol Extraction: Green Solvents, Physical Field-Assisted Technologies, and Integration of LCA-TEA Frameworks. Microchem. J. 2026, 227, 118602. [Google Scholar] [CrossRef] [Scilit]
  18. Dudnik, A.; Gaspar, P.; Neves, A.R.; Forster, J. Engineering of Microbial Cell Factories for the Production of Plant Polyphenols with Health-Beneficial Properties. Curr. Pharm. Des. 2018, 24, 2208–2225. [Google Scholar] [CrossRef] [Scilit] [PubMed]
  19. Azmir, J.; Zaidul, I.S.M.; Rahman, M.M.; Sharif, K.M.; Mohamed, A.; Sahena, F.; Jahurul, M.H.A.; Ghafoor, K.; Norulaini, N.A.N.; Omar, A.K.M. Techniques for Extraction of Bioactive Compounds from Plant Materials: A Review. J. Food Eng. 2013, 117, 426–436. [Google Scholar] [CrossRef] [Scilit]
  20. Talmaciu, A.I.; Volf, I.; Popa, V.I. A Comparative Analysis of the “Green” Techniques Applied for Polyphenols Extraction from Bioresources. Chem. Biodivers. 2015, 12, 1635–1651. [Google Scholar] [CrossRef] [Scilit] [PubMed]
  21. Barjoveanu, G.; Pătrăuțanu, O.A.; Teodosiu, C.; Volf, I. Life Cycle Assessment of Polyphenols Extraction Processes from Waste Biomass. Sci. Rep. 2020, 10, 13632. [Google Scholar] [CrossRef] [Scilit] [PubMed]
  22. Croxatto Vega, G.; Sohn, J.; Voogt, J.; Birkved, M.; Olsen, S.I.; Nilsson, A.E. Insights from Combining Techno-Economic and Life Cycle Assessment—A Case Study of Polyphenol Extraction from Red Wine Pomace. Resour. Conserv. Recycl. 2021, 167, 105318. [Google Scholar] [CrossRef] [Scilit]
  23. Carpentieri, S.; Ghanem, A.; Khwaldia, K.; Silva, A.S.; Ferrari, G. Life Cycle Assessment of Agro-Industrial Residues Valorization Processes to Obtain Phenolic-Rich Extracts. Front. Sustain. Food Syst. 2025, 9, 1693181. [Google Scholar] [CrossRef] [Scilit]
  24. Arias, A.; Feijoo, G.; Moreira, M.T. Agri-Food Waste to Phenolic Compounds: Life Cycle and Eco-Efficiency Assessments. J. Environ. Manag. 2025, 380, 124935. [Google Scholar] [CrossRef] [Scilit] [PubMed]
  25. Fathi, M.; Hatamzadeh, A.; Ebadi, M.T.; Ghomi, H. Improvement of Antioxidant Phytochemicals and Color Quality of Green Tea (Camellia sinensis L.) as Influenced by Cold Plasma. J. Sci. Food Agric. 2025, 105, 5766–5779. [Google Scholar] [CrossRef] [Scilit] [PubMed]
  26. Panda, J.; Amrit, R.; Mishra, A.K.; Chakraborty, A.; Rustagi, S.; Nath, P.C.; Sarabandi, K.; Sarma, H.; Wagh, M.S.; Mohanta, Y.K. Sustainable Valorization of Fruit and Vegetable Waste for Bioactive Compounds: Advancing Functional Food and Wellness. Waste Biomass Valorization 2025, 16, 3357–3386. [Google Scholar] [CrossRef] [Scilit]
  27. Râpă, M.; Darie-Niță, R.N.; Coman, G. Valorization of Fruit and Vegetable Waste into Sustainable and Value-Added Materials. Waste 2024, 2, 258–278. [Google Scholar] [CrossRef] [Scilit]
  28. Li, Q.; Dou, Z.; Duan, Q.; Chen, C.; Liu, R.; Jiang, Y.; Yang, B.; Fu, X. A Comparison Study on Structure-Function Relationship of Polysaccharides Obtained from Sea Buckthorn Berries Using Different Methods: Antioxidant and Bile Acid-Binding Capacity. Food Sci. Hum. Wellness 2024, 13, 494–505. [Google Scholar] [CrossRef] [Scilit]
  29. Kyriakoudi, A.; Mourtzinos, I. Green Extraction Technology of Polyphenols from Food By-Products. Foods 2022, 11, 1109. [Google Scholar] [CrossRef] [Scilit] [PubMed]
  30. Tao, Y.; Yu, Z.; Chen, T.; Jin, W.; Jin, W.; Yu, L. Large-Scale Assessment of Regression Modeling Practices in Phytomedicine Extraction Process Optimization. iScience 2026, 29, 116883. [Google Scholar] [CrossRef] [Scilit] [PubMed]
  31. Gozan, M.; Khisan, G.; Safitra, E. Techno-Economic Analysis of Solanesol Production from Tobacco Leaves Using Ultrasound-Assisted Extraction. In Proceedings of the E3S Web of Conferences; EDP Sciences: Les Ulis, France, 2024; Volume 503. [Google Scholar] [CrossRef] [Scilit]
  32. Sun, C.; Theodoropoulos, C.; Scrutton, N.S. Techno-Economic Assessment of Microbial Limonene Production. Bioresour. Technol. 2020, 300, 122666. [Google Scholar] [CrossRef] [Scilit] [PubMed]
  33. Brown, R.M.; Struhs, E.; Mirkouei, A.; Reed, D. A Novel Continuous Ultrasound-Assisted Leaching Process for Rare Earth Element Extraction: Environmental and Economic Assessment. Sustain. Chem. 2025, 6, 33. [Google Scholar] [CrossRef] [Scilit]
  34. Ministry of Environment and Energy of the Hellenic Republic. National Energy and Climate Plan; Ministry of Environment and Energy of the Hellenic Republic: Athens, Greece, 2019. Available online: https://commission.europa.eu/publications/greece-final-updated-necp-2021-2030-submitted-2025_en (accessed on 16 May 2026).
  35. Greek Statistical Authority. Area and Production. Available online: https://www.statistics.gr/en/statistics/-/publication/SPG06/- (accessed on 21 May 2026).
  36. Greek Statistical Authority. Per Capita GDP 2021. Available online: https://www.statistics.gr/en/statistics/-/publication/SEL33/- (accessed on 21 May 2026).
  37. Insete Region of Central Macedonia. Annual Report on Competitiveness and Structural Adjustment in the Tourism Sector for the Year 2018. Available online: https://insete.gr/wp-content/uploads/2020/05/25-12_Central_Macedonia.pdf (accessed on 21 May 2026). (In Greek)
  38. ENA Institute. The Brain Drain Continues. Available online: https://enainstitute.org/publication/to-brain-drain-synechizetai-focus-ena-oikonomia/ (accessed on 21 May 2026).
  39. OECD. The Circular Economy in Central Macedonia, Greece. In OECD Regional Development Papers; OECD Publishing: Paris, France, 2024; Volume No. 103. [Google Scholar] [CrossRef] [Scilit]
  40. OECD. Air and GHG Emissions. In OECD Environment Statistics (Database); OECD Publishing: Paris, France, 2024. [Google Scholar] [CrossRef] [Scilit]
  41. Eurostat. Labour Cost Levels by NACE Rev. 2 Activity (lc_lci_lev); European Commission: Luxembourg, 2024; Available online: https://ec.europa.eu/eurostat/databrowser/view/lc_lci_lev/default/table (accessed on 23 May 2026).
  42. Fariñas-Mera, R.; Celeiro, M.; Prado-Acebo, I.; Lu-Chau, T.A.; García-Jares, C.; Eibes, G. Apple Pomace Valorisation into Antioxidant Polyphenols: Multi-Criteria Process Design. Ind. Crops Prod. 2025, 231, 121203. [Google Scholar] [CrossRef] [Scilit]
  43. Jin, Q.; O’Keefe, S.F.; Stewart, A.C.; Neilson, A.P.; Kim, Y.T.; Huang, H. Techno-Economic Analysis of a Grape Pomace Biorefinery: Production of Seed Oil, Polyphenols, and Biochar. Food Bioprod. Process. 2021, 127, 139–151. [Google Scholar] [CrossRef] [Scilit]
  44. Orive, M.; Cebrián, M.; Amayra, J.; Zufía, J.; Bald, C. Integrated Biorefinery Process for Olive Pomace Valorisation. Biomass Bioenergy 2021, 149, 106079. [Google Scholar] [CrossRef] [Scilit]
  45. Grand View Research Polyphenols Market Size, Share & Trends Analysis Report by Product (Grape Seed, Green Tea, Apple, Cocoa & Coffee Beans), by Application, by Region, and Segment Forecasts. 2026–2033. Available online: https://www.grandviewresearch.com/industry-analysis/polyphenols-market-analysis (accessed on 23 May 2026).
  46. ISO 14044:2006; Environmental Management—Life Cycle Assessment—Requirements and Guidelines. International Organization for Standardization: Geneva, Switzerland, 2006.
Figure 1. Process flow diagram of polyphenol extraction using ultrasound-assisted method.
Processes 14 02975 g001
Figure 2. Characterized life cycle impact calculations comparing the production of 1 kg of GAE polyphenol-rich powder from second-grade apples, figs, and pomegranates.
Processes 14 02975 g002
Figure 3. Normalized life cycle impact calculations comparing the production of 1 kg of GAE polyphenol-rich powder from second-grade apples, figs, and pomegranates.
Processes 14 02975 g003
Figure 4. Normalized life cycle impact calculations analyzing the production of 1 kg of GAE polyphenol-rich powder from second-grade pomegranates.
Processes 14 02975 g004
Table 1. Levels of the independent variables used for the experimental design of the model.
Independent ValuesLevels
Coded Values
−α−10+1
Uncoded Values
X1Duration of sonication (min)3276398123
X2Temperature
(°C)
2335537082
X3β-cyclodextrin concentration (mg/mL)049.51518.7
Table 2. Model predictions compared to experimentally confirmed responses at the optimum extraction conditions.
FruitOptimum Conditions
(t, T, β-CD)
ResponsePredictedExperimental (n = 3)
Apple56 min, 64 °C, 18.7 mg/mLTPC (mg GAE/100 g dw)1.001.23 ± 0.3
Apple56 min, 64 °C, 18.7 mg/mLDPPH (µmol Trolox/100 g dw)76008671 ± 73
Pomegranate12 min, 52 °C, 8.5 mg/mLTPC (mg GAE/100 g dw)76.0077.00 ± 2.7
Pomegranate12 min, 52 °C, 8.5 mg/mLDPPH (µmol Trolox/100 g dw)83,94083,056 ± 1039
Fig *2.8 min, 52.5 °C, 9.5 mg/mLTPC (mg GAE/100 g dw)- (no significant model)457 ± 14.9
* Fig optimum taken directly from the replicated CCD design point (see text); no statistically significant second-order model could be fitted for this matrix.
Table 3. The input components and mixtures of SuperPro Designer modeling for apples, figs, and pomegranates.
ComponentApplesFigsPomegranates
Feedstock, kg/hWater863811810
Cellulose135.3188.1175.4
Gallic acid1.70.914.6
Solvent solution, kg/hWater1345.91873.321885.78
β-cyclodextrin25.4717.8716.12
Washing water, kg/hWater350035003500
Table 4. Operating costs of the main input of the process and the selling price of the product.
Cost/Benefit ComponentsUnitPurchase Price
FeedstockEUR/kg0 (bought for subsequent syrup production)
B-cyclodextrinEUR/kg10
WaterEUR/kg0.0007
Steam (low P)EUR/MT24.8277
Cooling waterEUR/MT0.0828
Natural gasEUR/MWh21.87
Operator, laborEUR/h11.42 [41]
Electricity, std powerEUR/kWh0.0828
Selling Price
PolyphenolsEUR/kg80 [42,43,44,45]
Table 6. Life cycle inventory of extracting 1 kg of GAE polyphenol-rich powder from apples, figs, and pomegranates.
ApplesFigsPomegranates
Feedstock, kg553110468
Transportation (tkm)37.182.96.4
Table 7. Material and energy balances for one year’s operation of an extraction plant with apples, figs, and pomegranates as feedstock.
Process ParameterUnitApplesFigsPomegranates
Annual Material Inputs
Feedstockkg/yr7,920,0007,920,0007,920,000
Solvent solutionkg/yr3,259,2044,494,6254,520,088
- β-cyclodextrinkg/yr60,60942,53038,333
- Distilled waterkg/yr3,198,6954,452,0954,481,755
Washing waterkg/yr5,544,0005,544,0005,544,000
Annual Material Outputs and Streams
Cellulose residuekg/yr1,071,7341,489,7521,388,930
Product streamkg/yr15,60210,296119,038
- Gallic acidkg/yr13,3067128115,870
- Moisturekg/yr229631683168
Recycled solventkg/yr7,602,09110,483,62510,542,946
Annual Process Utility Consumption
Electricity dutykWh/yr963,108.371,061,377.251,095,898.65
Steamkg/yr2616.363125.823137.47
Natural gas (steam regeneration)kg/yr15,780.6218,853.4318,923.7
Cooling water kg/yr156,782.09227,279.32.228,982.28
Electricity for cooling water regenerationkWh/yr2,003,649.932,904,593.212,926,356.77
Table 8. Baseline scenario economic performance indicators (2026 prices) for apples, figs, and pomegranates.
ParameterUnitApplesFigsPomegranates
Direct fixed capital (DFC)EUR16,918 × 10318,818 × 10328,830 × 103
Total capital investmentEUR18,030 × 10320,021 × 10330,441 × 103
Annual operating cost (AOC)EUR/yr5,709,5755,952,1896,349,283
Total annual revenuesEUR/yr1,245,789822,6479,523,651
Gross margin%−358.31−623.5433.33
Return on investment (ROI)%−18.77−19.6715.42
Internal rate of return (IRR)%--13.84
Net present value (NPV at 7.0%)EUR−42,398 × 103−52,795 × 10311,814 × 103
Payback timeYears--6.48
Table 10. Sensitivity analysis of polyphenol selling price and its impact on the net present value (NPV) of the pomegranate biorefinery process at a feedstock throughput of 1000 kg/h.
Selling Price (EUR/kg)Annual Revenue (EUR M/yr)Gross Profit (EUR M/yr)Net Present Value (NPV) (EUR M)
404.77−1.59−25.2
505.96−0.4−14.35
607.140.794−4.68
66.03 (break-even)7.861.510
809.532.3511.81
Table 11. Techno-economic sensitivity analysis of reactor power density ( 2   to   30   kW / m 3 ) against annual operating cost (OPEX) and project net present value (NPV).
Power DensityAnnual Operating Cost (OPEX) (EUR M/yr)Net Present Value (NPV) (EUR M/yr)
2 kW/m36.34911.814
10 kW/m36.35311.784
30 kW/m36.36111.711
Table 12. Life cycle inventory of producing 1 kg of GAE polyphenol-rich powder from second- and third-grade apples, figs, and pomegranates.
Flow ElementUnitAppleFigPomegranate
Technosphere Inputs
Feedstockkg595.221111.1168.35
β-cyclodextrinkg4.555.970.33
Solvent waterkg240.39624.638.68
Washing waterkg416.65777.7847.88
Grid electricitykWh72.38148.99.46
Industrial process steamkg0.20.440.03
Natural gas (steam regeneration)kg1.192.640.16
Cooling waterkg11.7831.891.98
Electricity for cooling water regenerationkWh150.58407.4925.26
Technosphere Outputs
Cellulose (by-product)kg80.55208.9911.99
Solvent purge managementm30.2450.6310.004
Washing water purge managementm30.4170.7780.048
Disclaimer/Publisher’s Note: The statements, opinions and data contained in all publications are solely those of the individual author(s) and contributor(s) and not of MDPI and/or the editor(s). MDPI and/or the editor(s) disclaim responsibility for any injury to people or property resulting from any ideas, methods, instructions or products referred to in the content.