1. Introduction
Cosmetic products span emulsions, polymer-thickened aqueous systems, surfactant mesophases, suspensions, foams, anhydrous gels, wax–oil networks, dry powders (loose and pressed), and slurries. None behaves as an ideal liquid or an ideal solid. Instead, these materials combine viscous flow, elasticity, yield behavior, time-dependent breakdown, structural recovery, and thermal transitions. Rheology provides the quantitative language needed to describe how they respond during storage, mixing, pumping, filling, application, and post-application film formation. Davies and Amin emphasized that cosmetic complex fluids include surfactant mesophases, foams, and emulsions whose rheology must be considered alongside sensory performance [
1]. Foundational and cosmetic-specific studies likewise show that steady, oscillatory, and application-relevant measurements capture different aspects of product structure and skin feel [
2,
3,
4,
5].
Many industrial organizations still measure viscosity only at the end of a batch with a rotational viscometer. This is practical and can be suitable for routine release when the method is well controlled, but it offers only a narrow view of the material. Two batches may satisfy the same apparent-viscosity specification while differing in yield stress, storage modulus, thixotropic recovery, droplet-size distribution, air content, crystal structure, or susceptibility to wall slip. Those differences may later appear as difficult pumping, fill-weight variation, phase separation, poor suspension, stringiness, weak stick integrity, unacceptable spreadability, or altered afterfeel. The limitation is especially important for yield-stress, thixotropic, and wall-slipping materials, for which the reported value depends strongly on the imposed protocol and geometry [
6,
7,
8,
9,
10,
11].
Rheology matters industrially because formulation and processing cannot be separated. Integrated-design studies of cosmetic emulsions show that composition, manufacturing method, microscopic structure, and macroscopic properties are closely coupled [
2,
12,
13,
14,
15]. Thickener type and concentration, dispersed-phase fraction, emulsification energy, impeller tip velocity, and pumping capacity can all change droplet size, elasticity, viscosity, texture, energy demand, and physical stability [
13,
14]. A formulation that succeeds in the laboratory may therefore fail at production scale when the larger process creates a different shear, circulation, temperature, vacuum, or cooling history.
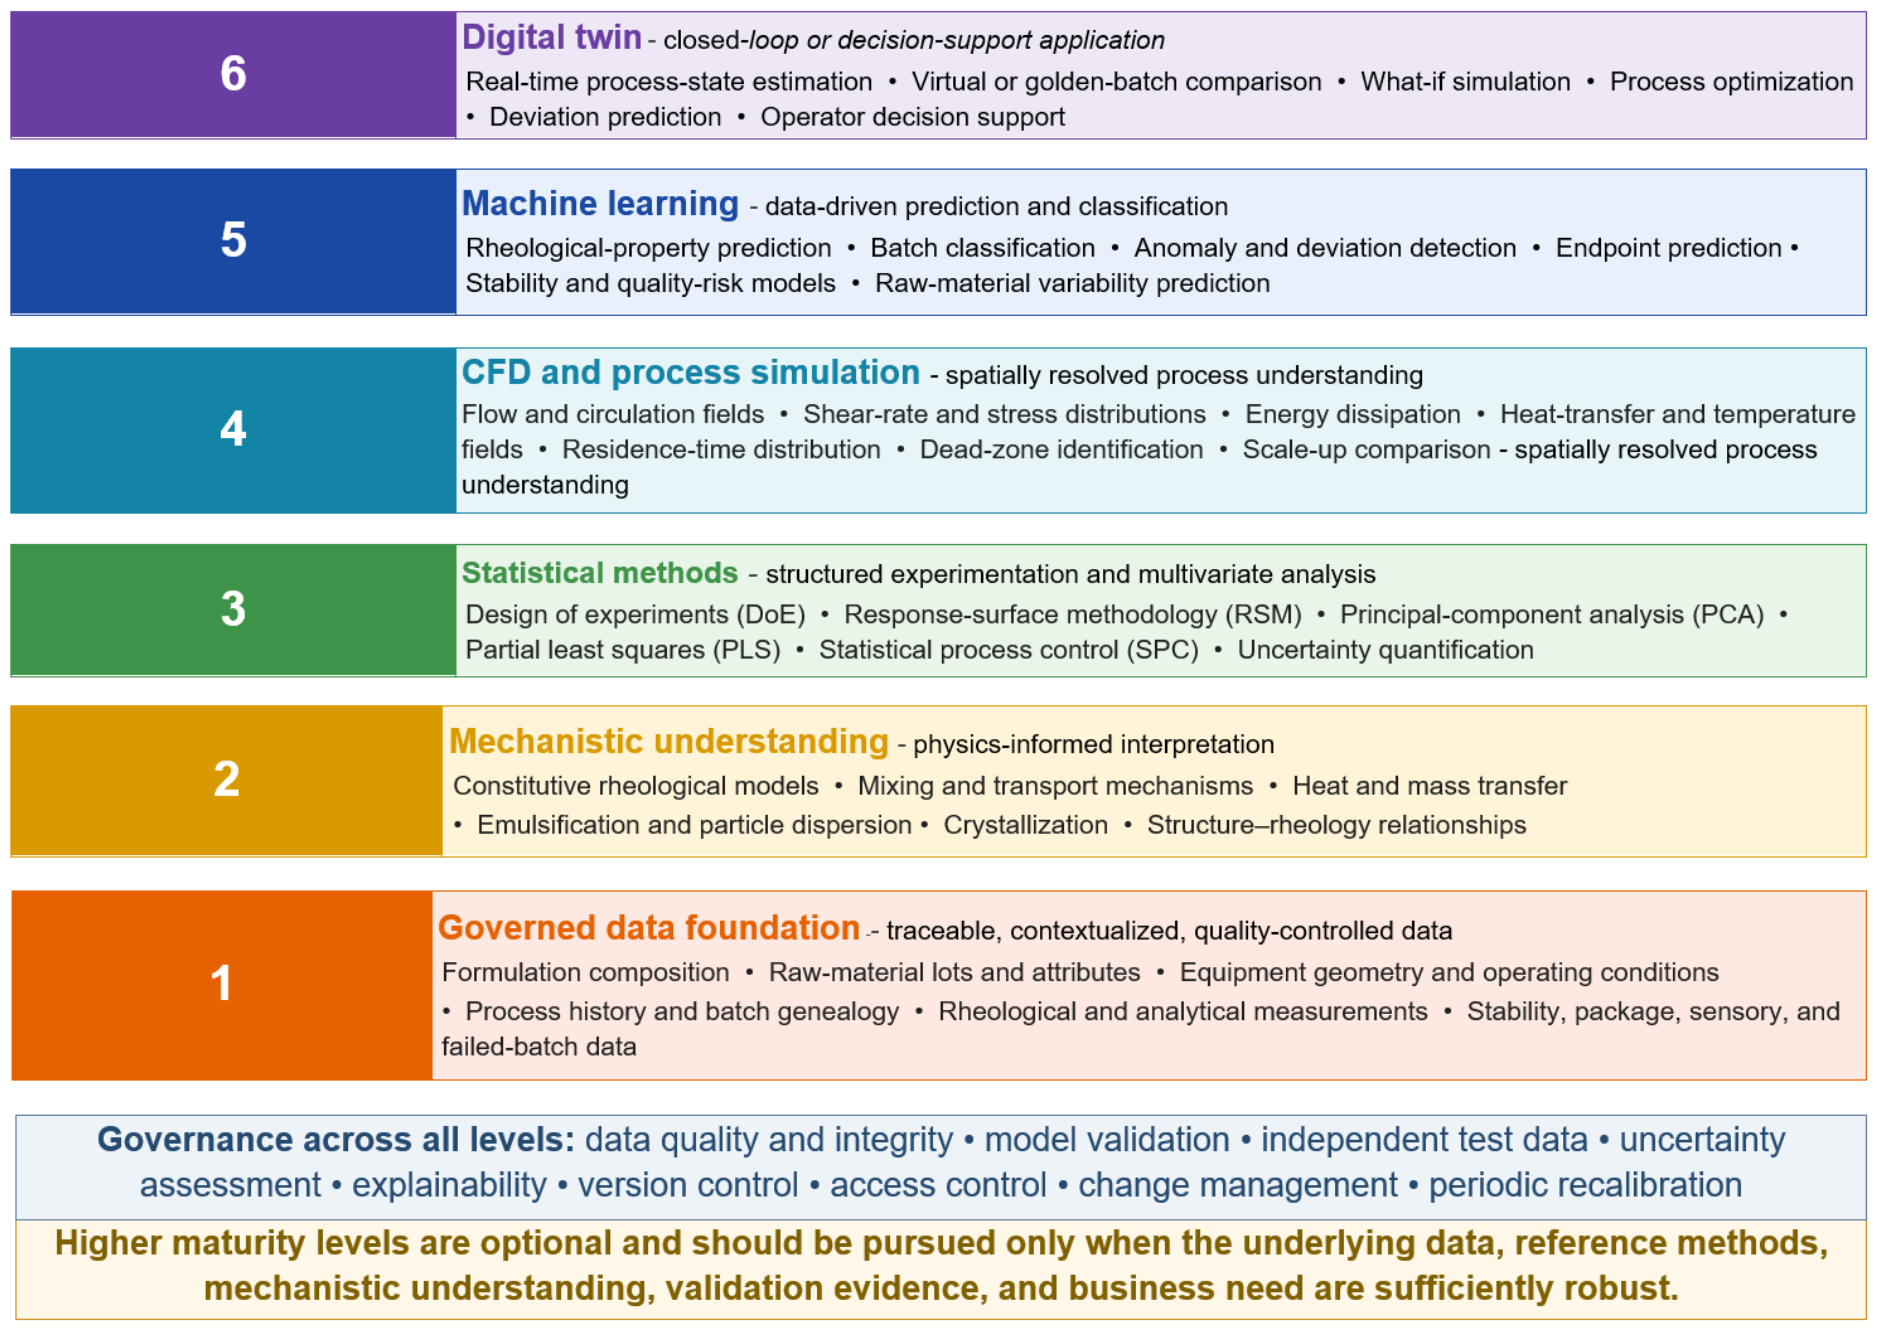
This review develops a practical industrial framework for applying rheology throughout the cosmetic-product lifecycle. It covers fundamental measurements, product microstructures, manufacturing operations, scale-up criteria, in-process control, quality release, stability, sensory correlation, and data-driven modeling. The central argument is that rheology is most useful as a connecting discipline—linking critical material attributes, critical process parameters, microstructure, critical quality attributes, and consumer performance—rather than as an isolated laboratory test.
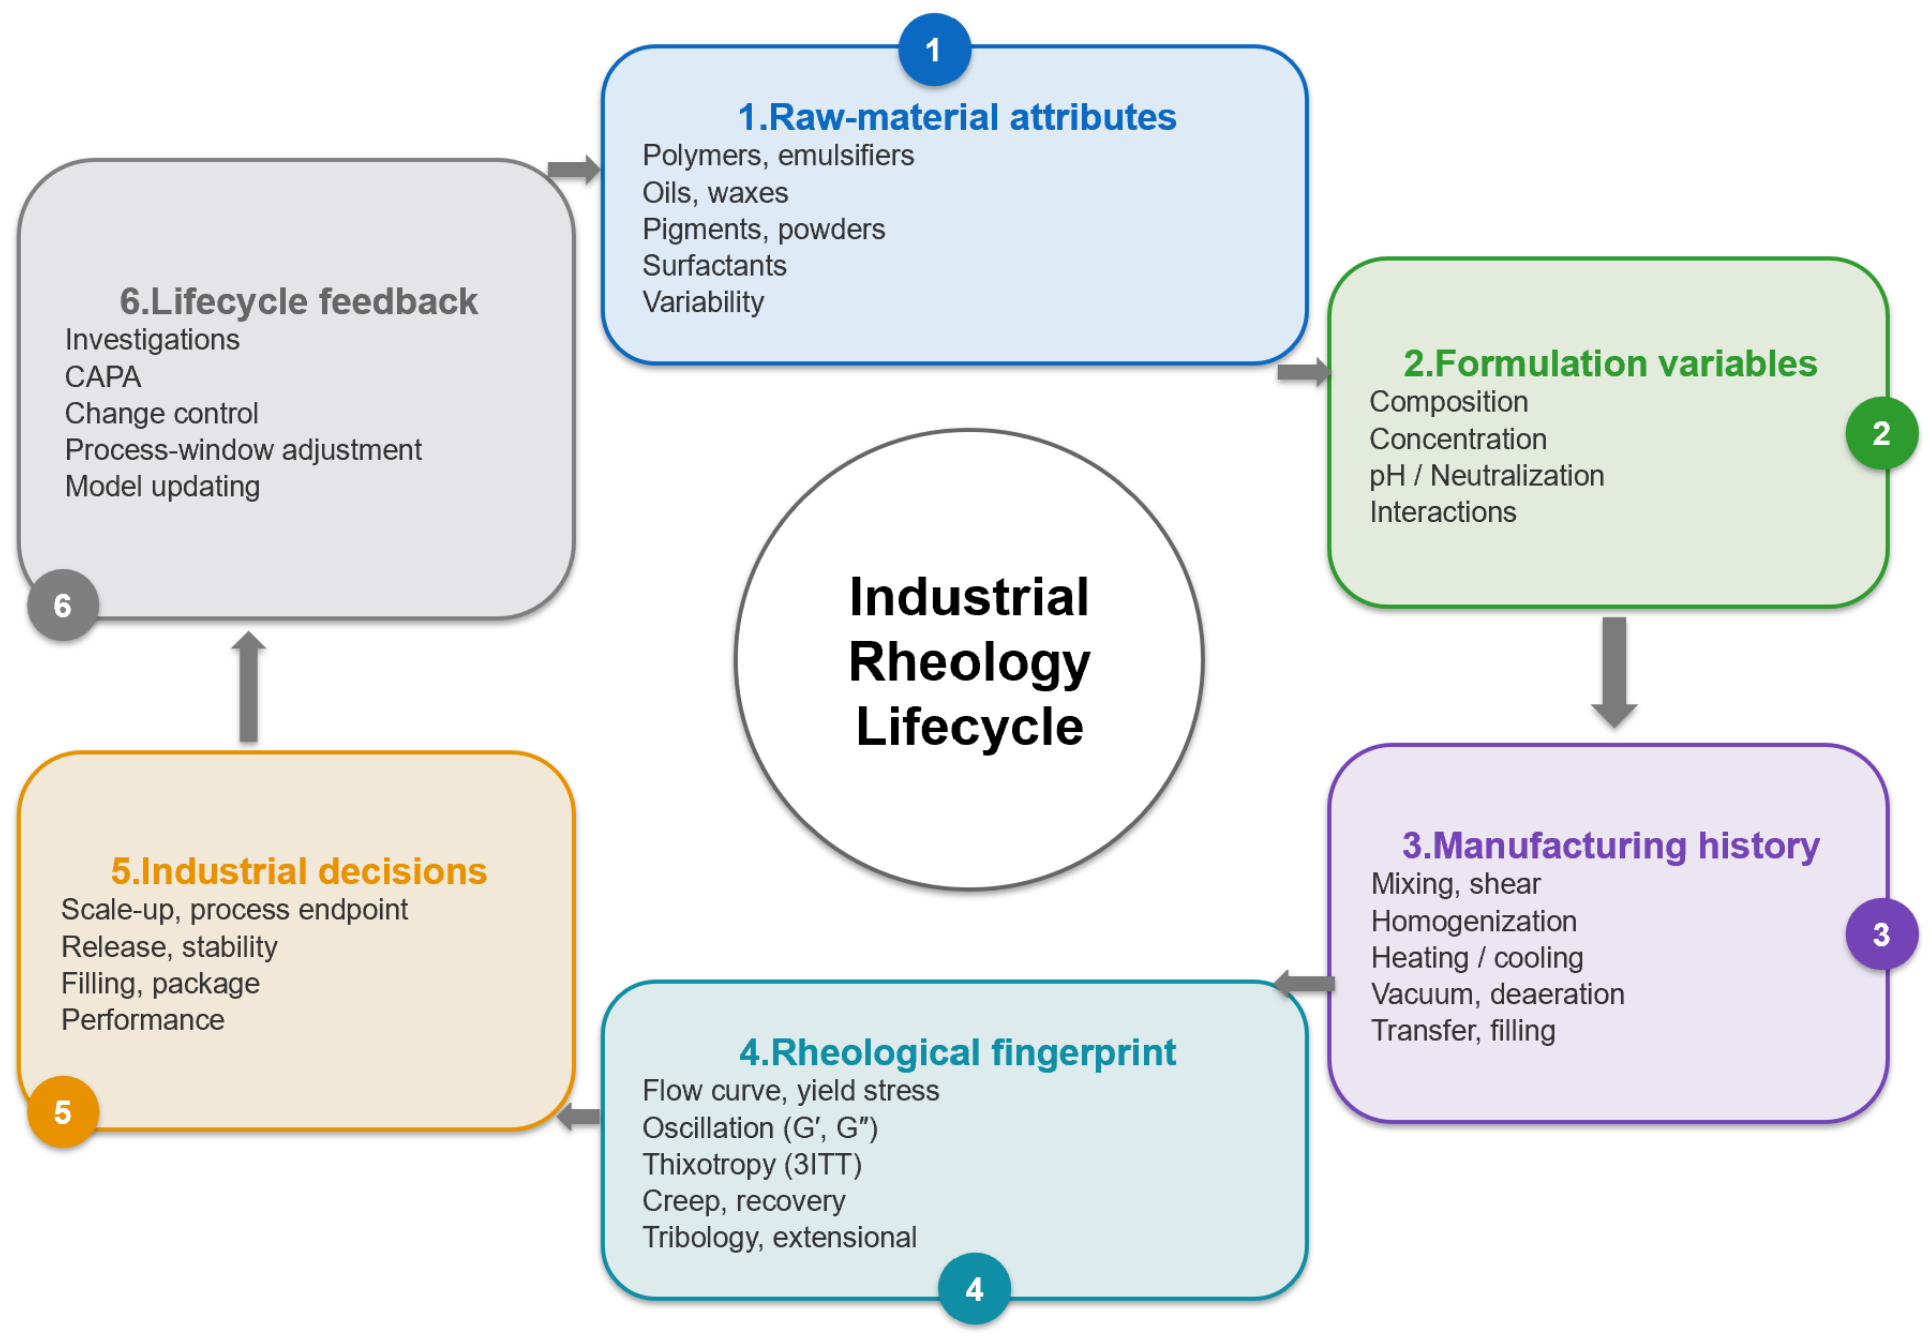
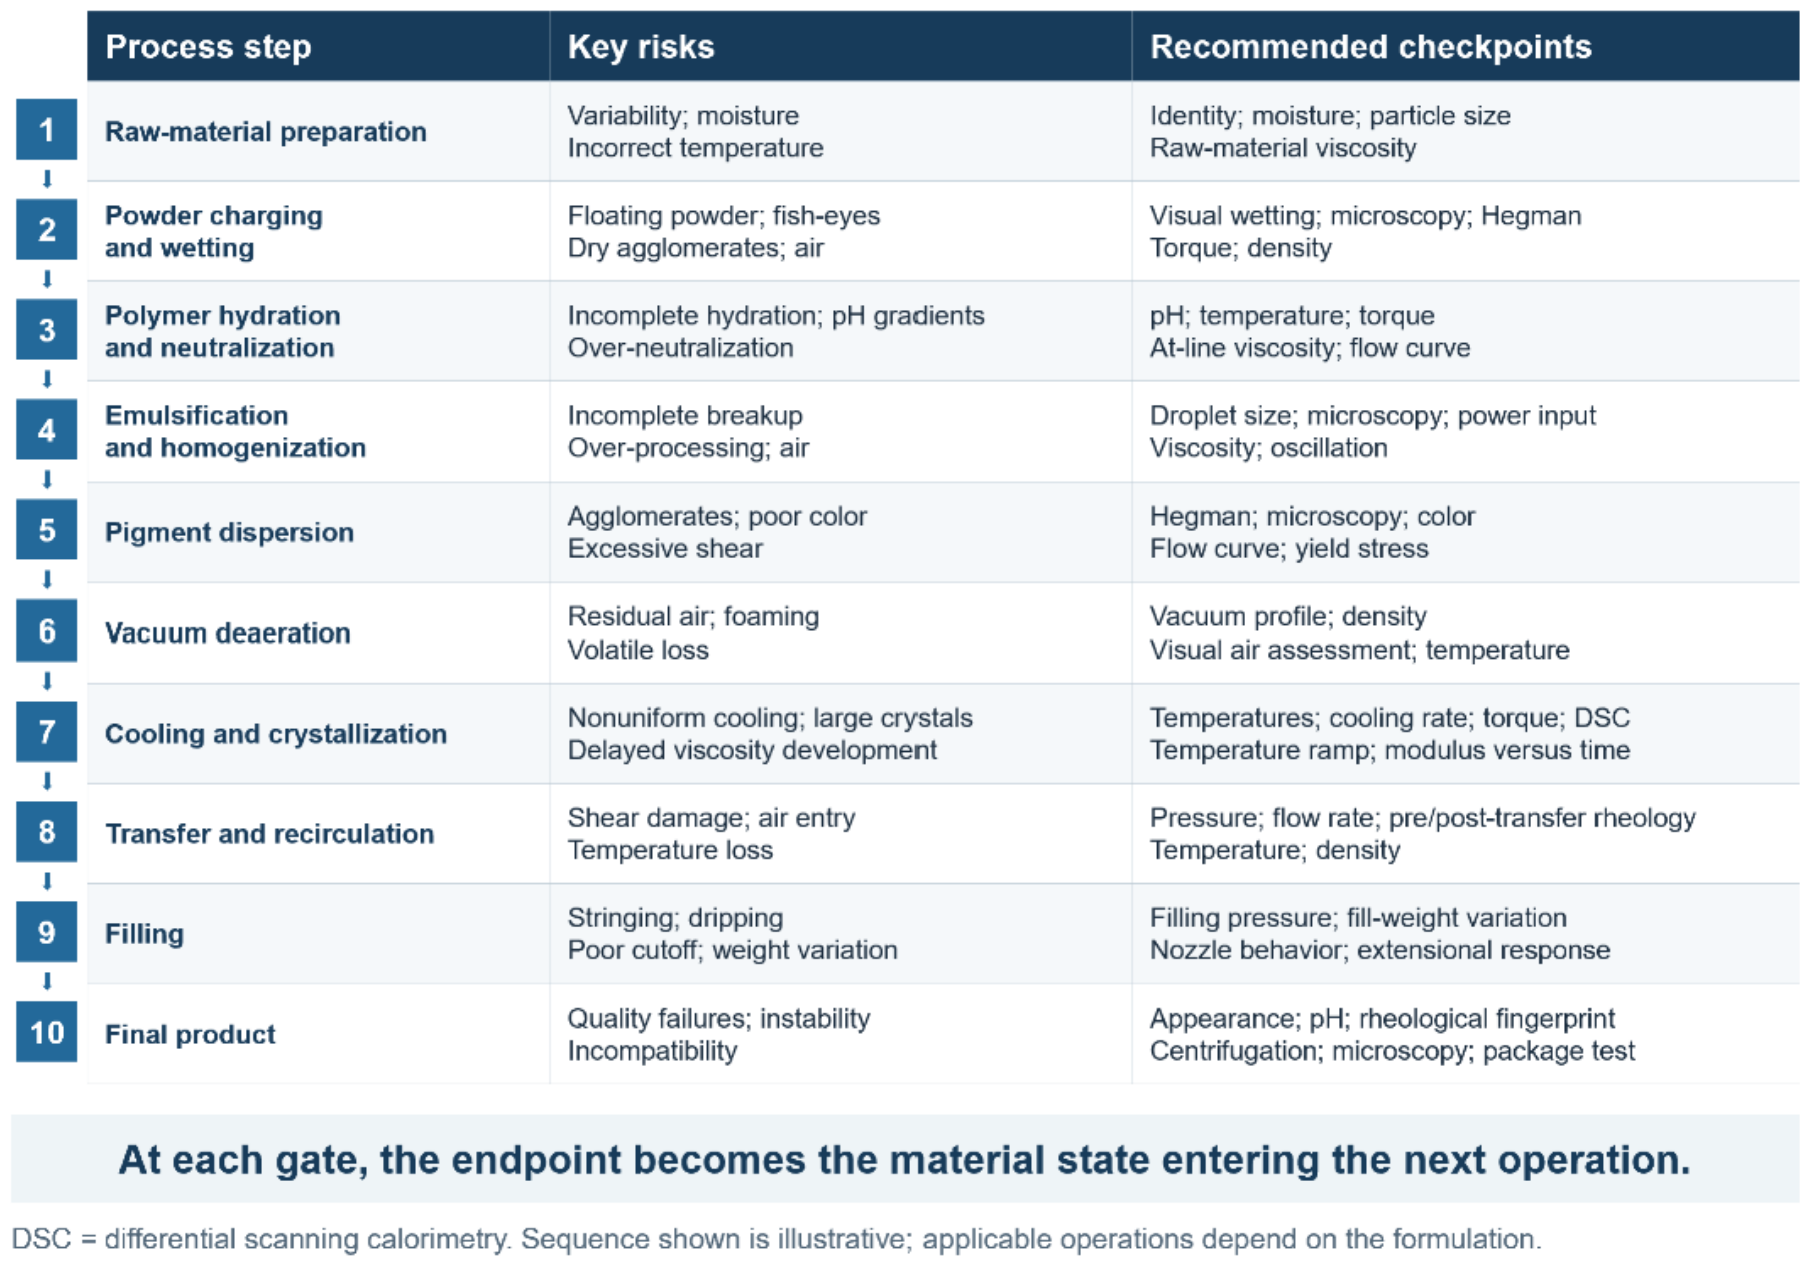
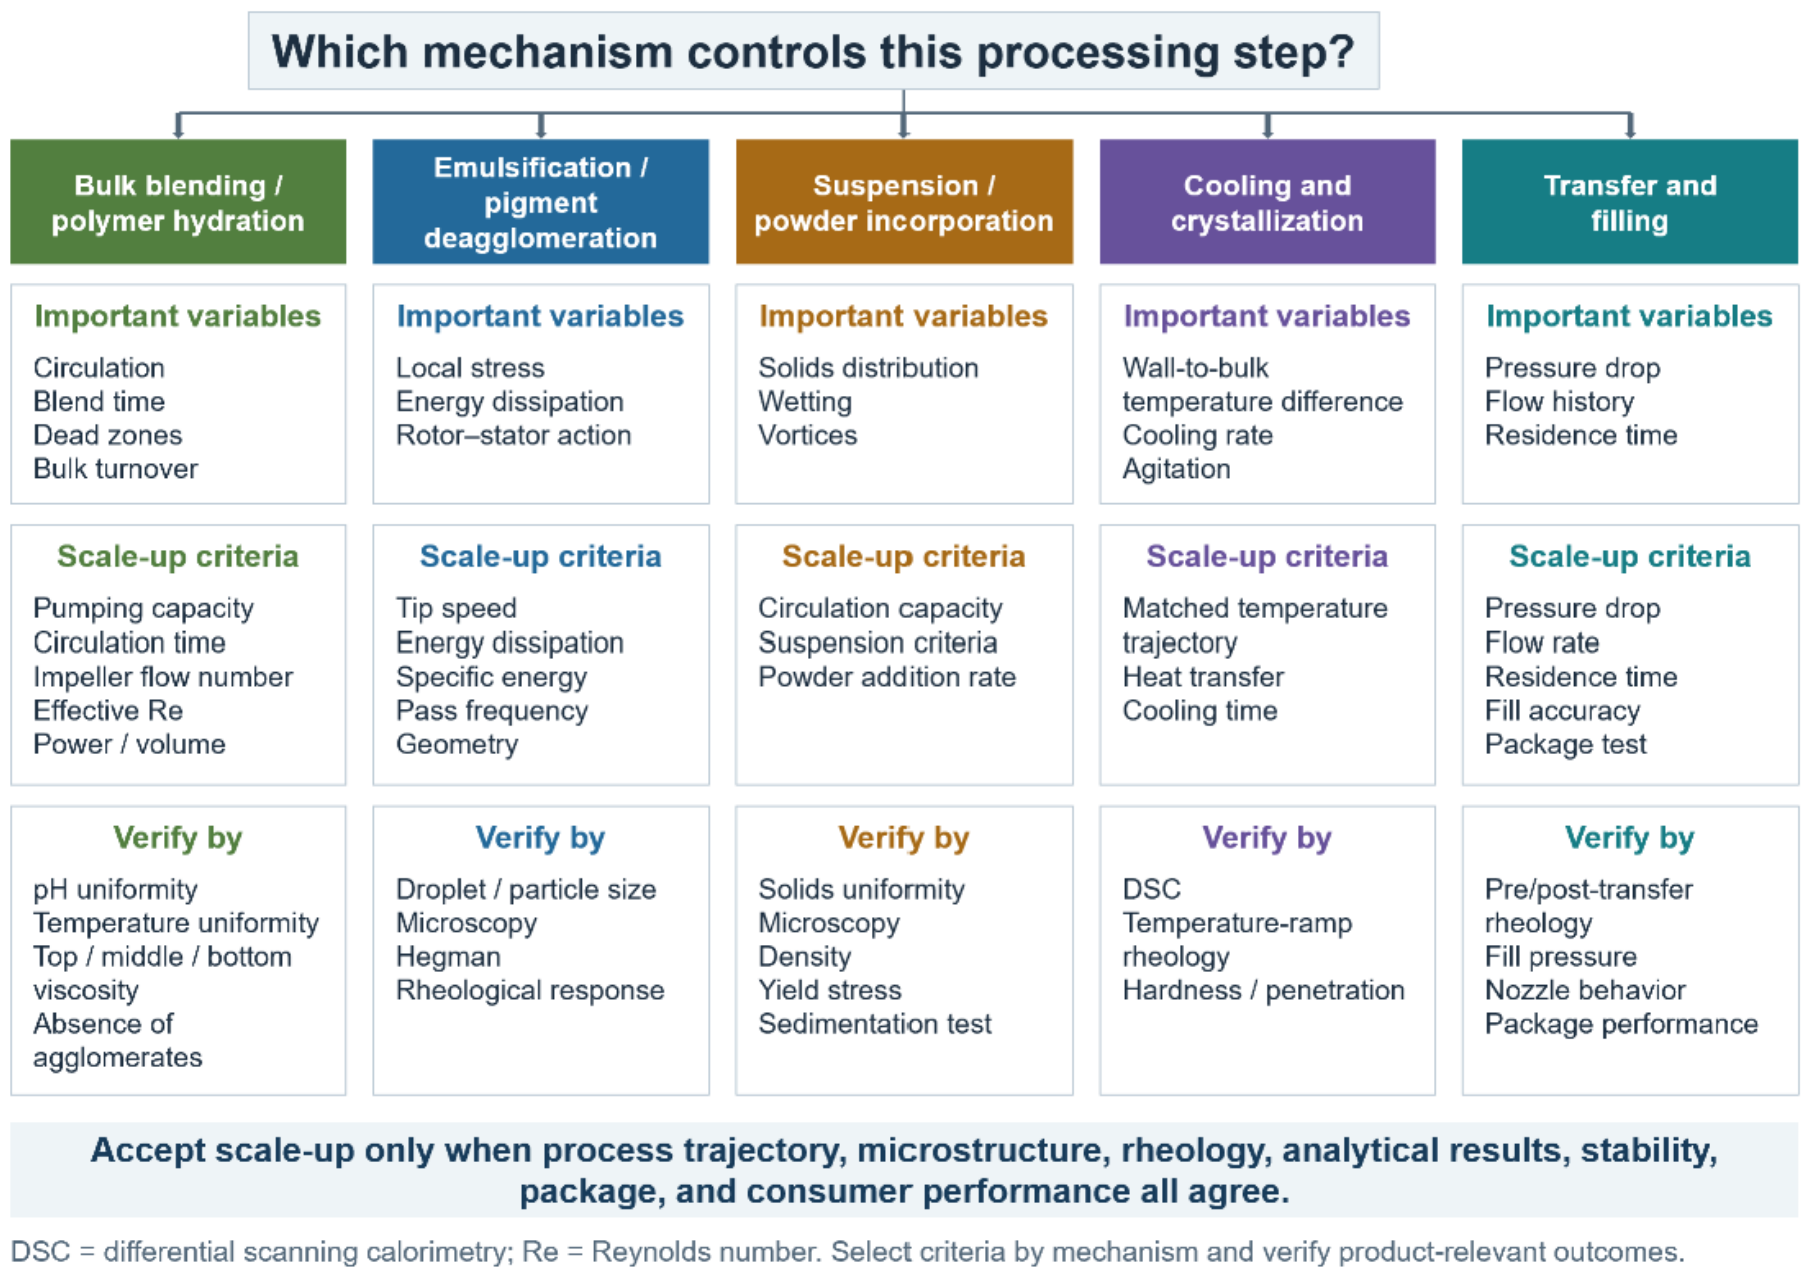
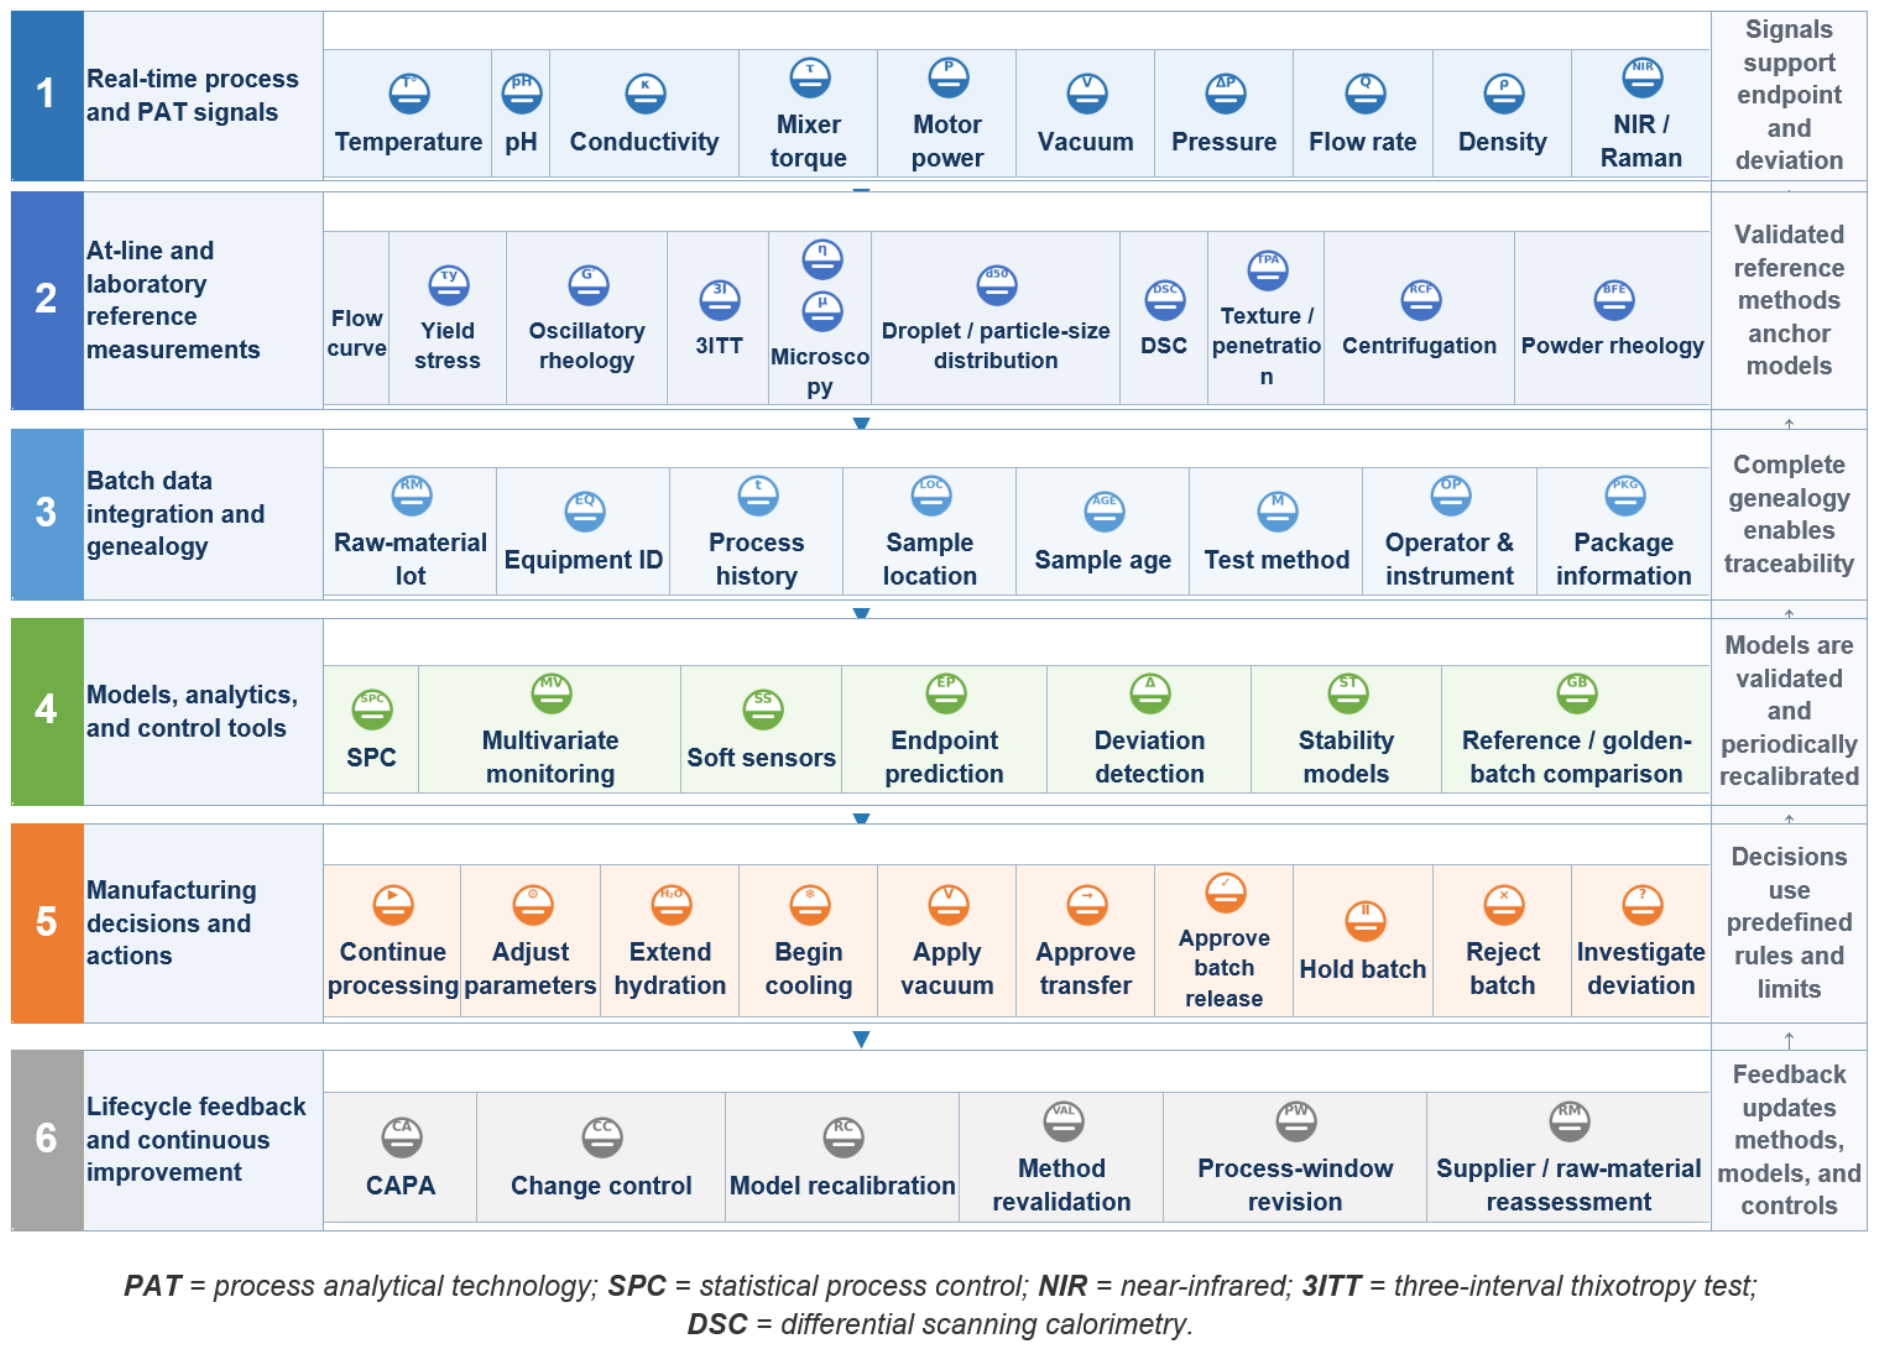
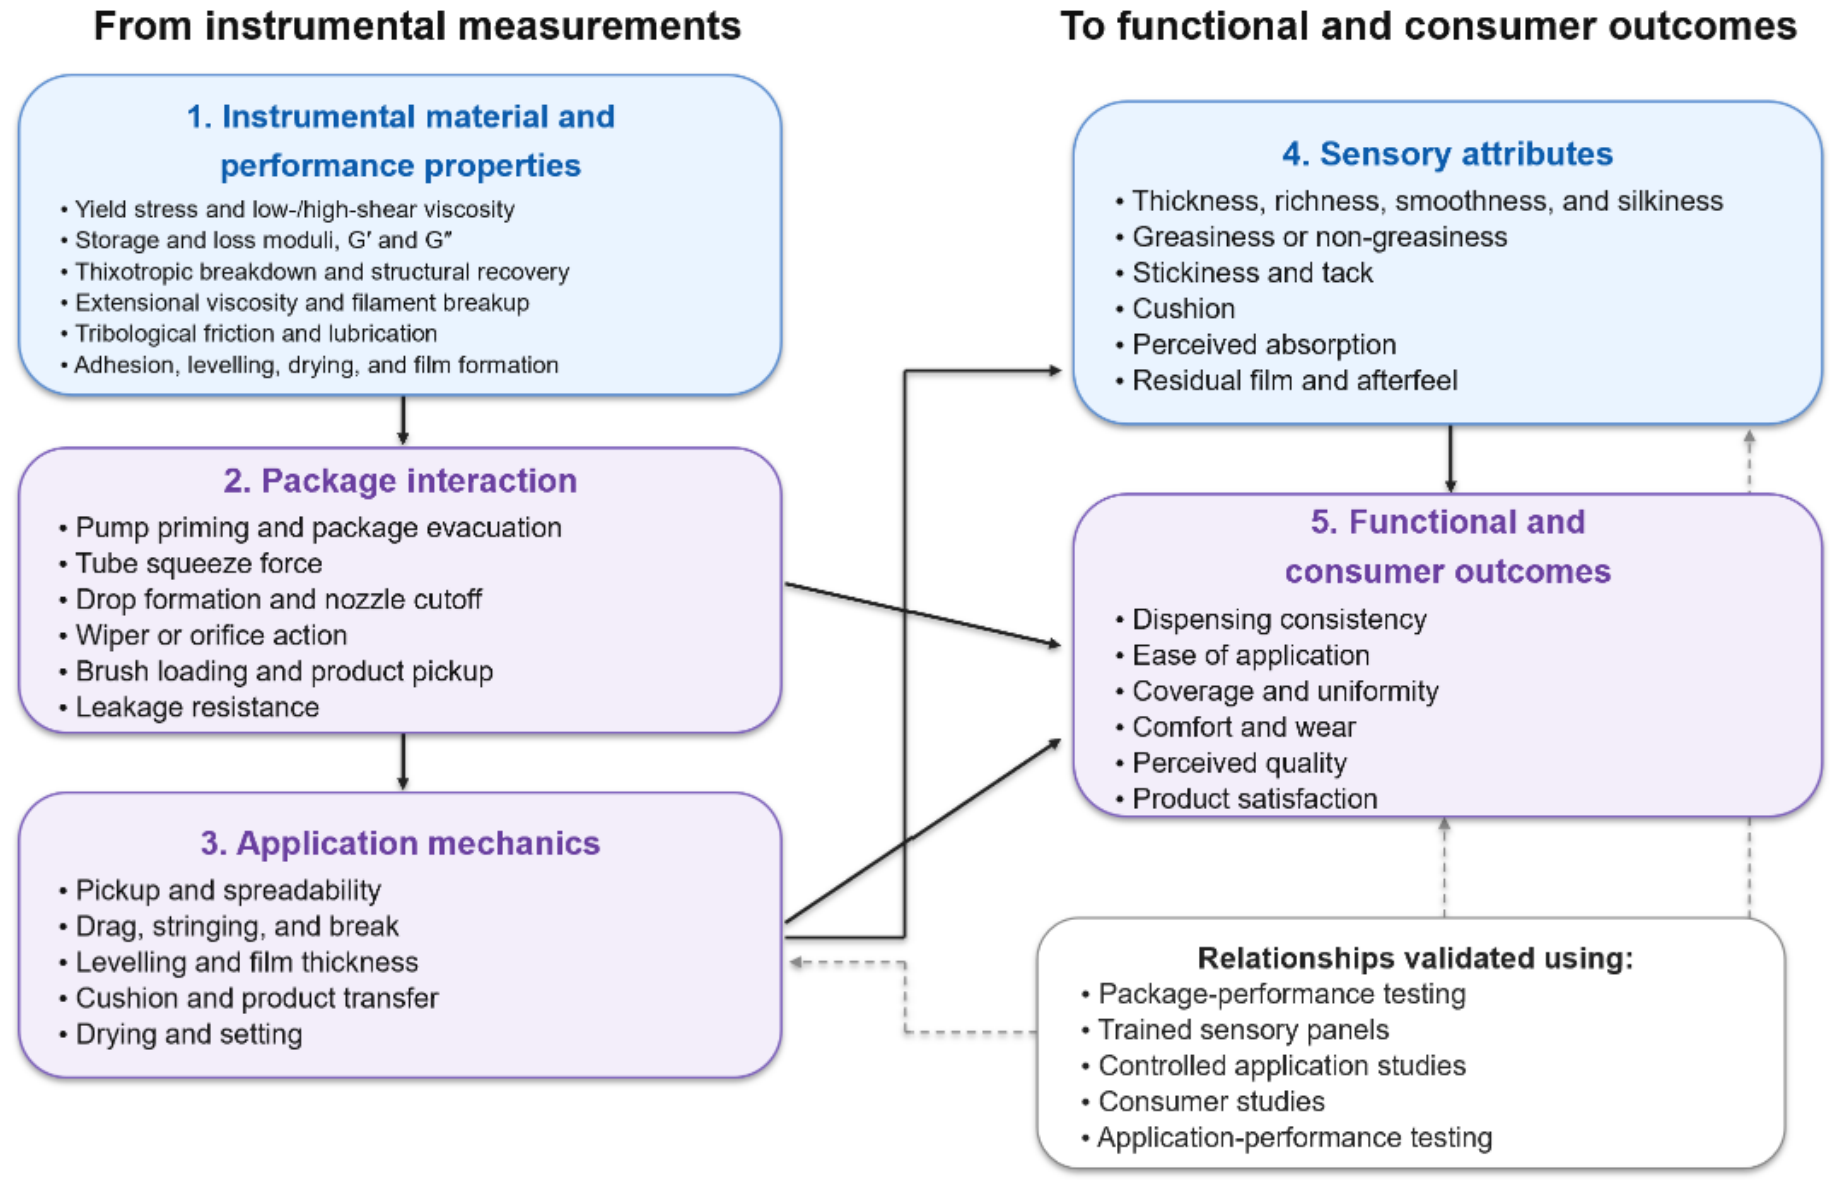
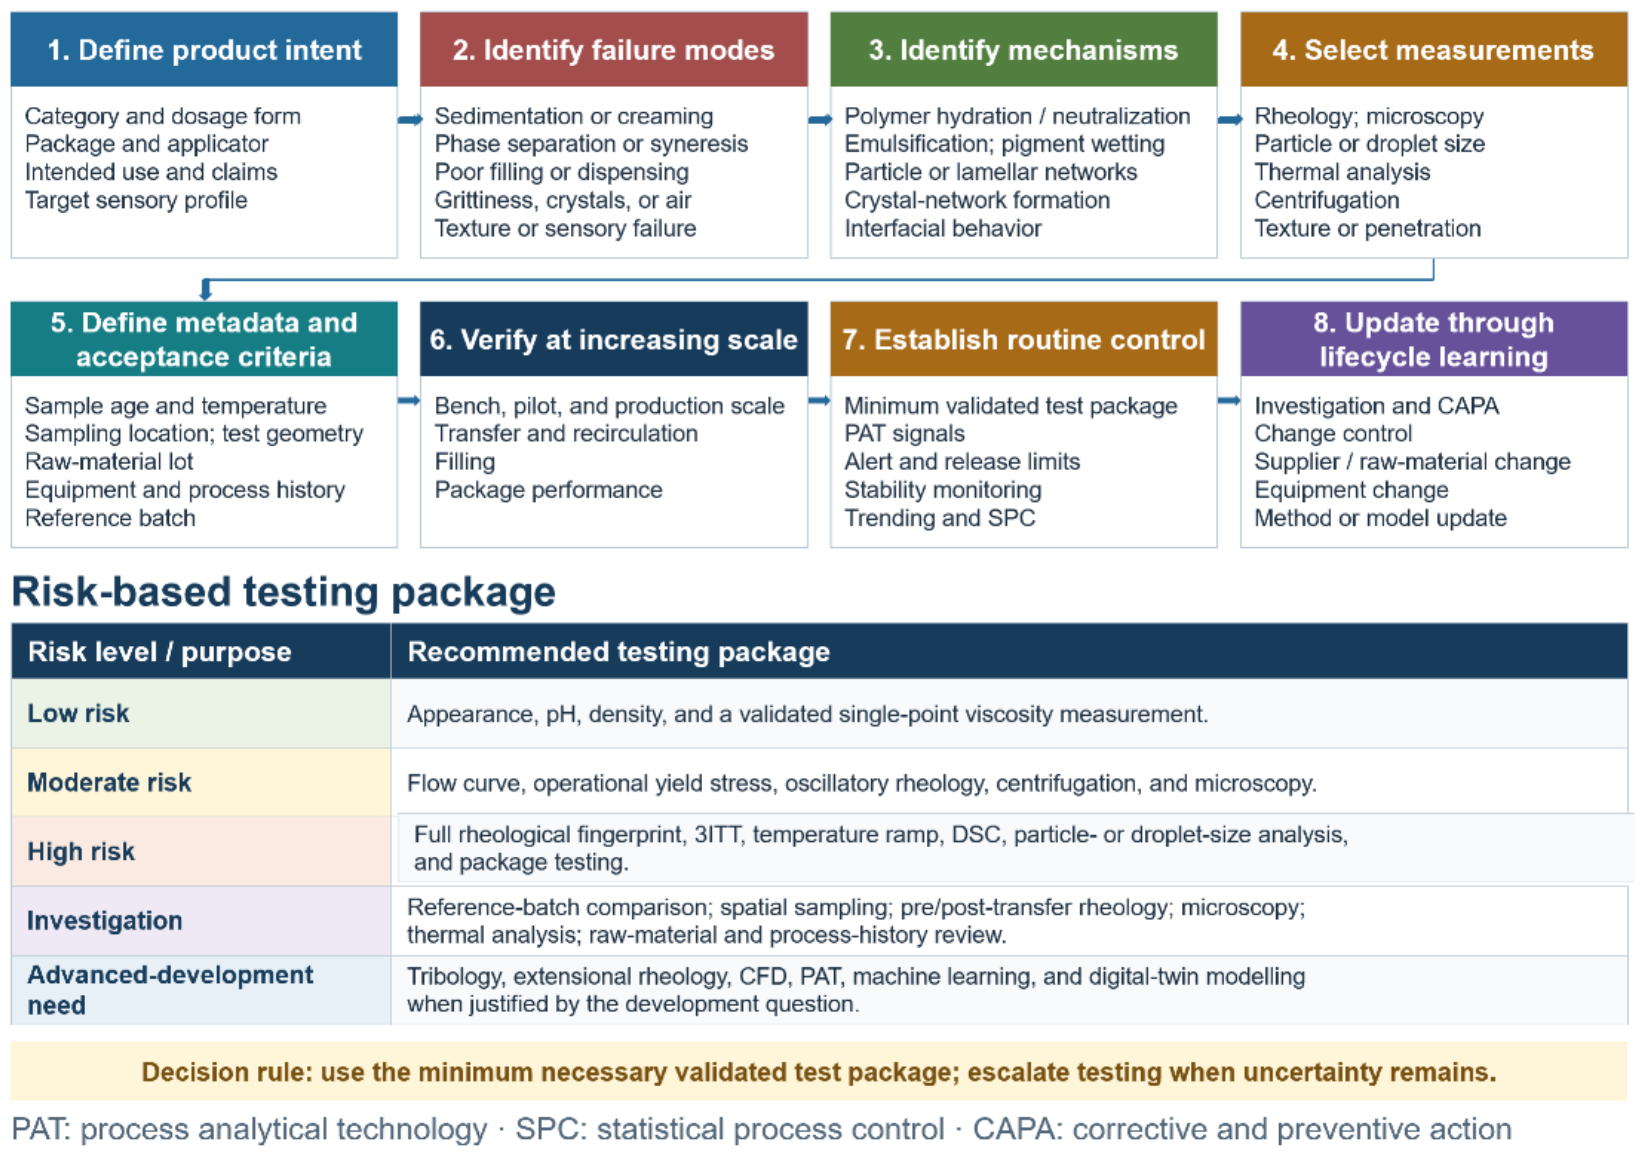
Figure 1 presents the organizing logic of the review: raw-material attributes and formulation variables are transformed by manufacturing history into a rheological fingerprint that supports scale-up, release, stability, filling, package, and performance decisions, with feedback through investigations and lifecycle change control. Within this framework,
Section 2 defines the review method;
Section 3,
Section 4 and
Section 5 establish the measurement, microstructure, and product-category foundations;
Section 6,
Section 7,
Section 8,
Section 9 and
Section 10 address manufacturing, scale-up, monitoring, quality, and stability; and
Section 11,
Section 12,
Section 13 and
Section 14 connect sensory performance, modeling, industrial implementation, and future research.
2. Review Scope and Literature-Search Methodology
This article is a structured narrative review of how rheology can be applied across the industrial lifecycle of cosmetic products. Its scope covers formulation and microstructure, rheological methods, manufacturing, scale-up, process monitoring, quality control, stability, filling and package performance, sensory response, dry-powder handling, wet slurries, data analytics, computational fluid dynamics (CFD), machine learning, and digital-twin applications.
Dry powders are included only where flowability, cohesion, aeration, segregation, charging, transfer, and loose-powder filling affect cosmetic manufacture or use. Wet slurries and pigment pastes are considered as concentrated solid–liquid systems within the broader rheological framework. Powder pressing, tablet compaction, and compact fracture mechanics fall outside the main scope, except where they offer directly transferable insight into powder handling or tactile performance.
The evidence base was assembled through structured, iterative searches of Scopus, Web of Science, and PubMed, with targeted full-text searches of ScienceDirect, Wiley Online Library, SpringerLink, ACS Publications, and the Royal Society of Chemistry. Standards and technical guidance were identified through ISO, ASTM International, FDA, NIST, and other relevant regulatory or industry sources. Citation chaining from key reviews and primary studies identified additional literature, and the searches were updated during manuscript development to capture recent evidence within the defined scope.
The search strategy combined cosmetic product classes with rheological methods, microstructure, manufacturing operations, performance attributes, and digital technologies. Representative search blocks covered cosmetic or personal-care rheology; emulsions, lamellar networks, polymer-thickened gels, surfactant mesophases, foams, powders, pigment slurries, and wax–oil systems; mixing, homogenization, powder wetting, deaeration, transfer, filling, cooling, and crystallization; yield stress, thixotropy, oscillatory and extensional rheology, tribology, stability, and sensory science; and PAT, multivariate monitoring, CFD, machine learning, model governance, and digital twins. Boolean operators, spelling variants, abbreviations, and product-specific terms were used where appropriate.
Peer-reviewed studies were included when they examined cosmetic products or closely related topical systems and provided interpretable information on rheological methods, formulation structure, process conditions, physical stability, texture, sensory performance, package behavior, or industrial application. Standards, authoritative reviews, and transferable studies from pharmaceutical, food, coatings, and soft-material processing were used when cosmetic-specific evidence was limited. Studies were deprioritized when they lacked essential methodological detail, addressed biological rheology without formulation relevance, or reported an isolated viscosity value without a meaningful connection to structure, processing, stability, or performance. For each selected source, the assessment considered product category, formulation structure, processing scale, equipment, thermal and shear history, sample conditioning, rheometer geometry, test conditions, measured parameters, complementary analyses, and principal industrial implications.
Table 1 summarizes the extraction fields used to organize this evidence.
The searches were iterative and were updated through manuscript finalization in August 2026. The final reference list contains 158 scholarly, standards, and regulatory sources. Because a prospective systematic-review log was not maintained, database yields, duplicate counts, and stage-wise exclusion counts cannot be reconstructed reliably and are therefore not reported. This limitation is stated explicitly to avoid retrospective estimation. The review was designed for mechanistic and industrial synthesis rather than effect-size estimation; no meta-analysis was performed. Reproducibility is supported by reporting the databases, representative search blocks, eligibility logic, evidence-extraction fields, citation chaining, and final update period.
3. Rheological Foundations and Measurement Framework
Cosmetic materials encounter a sequence of deformation and thermal histories rather than one fixed test condition. During storage, they experience very low stresses; during sampling and pumping, they undergo transient shear; during homogenization, filling, dispensing, brushing, or spreading, they may experience strong and rapidly changing deformations; and after processing or application, they may rebuild, level, crystallize, evaporate, or form a residual film. The purpose of a rheological method is not merely to generate a viscosity value but to reproduce a relevant material state, deformation mode, time scale, and temperature history. Cosmetic studies have shown that small-amplitude measurements primarily characterize the near-rest structure, whereas application may extend far beyond the linear regime and can involve effective shear rates approaching 10
4 s
−1 [
10,
18]. No single test can reasonably be expected to predict storage, manufacturing, filling, stability, and sensory performance simultaneously. Earlier and more recent cosmetic studies likewise show that application involves evolving film thickness, deformation rate, yielding, and structural breakdown that cannot be represented by one stationary viscosity value [
4,
5,
10,
18].
3.1. Rheological Testing Across the Cosmetic-Product Lifecycle
An industrial measurement framework should begin by identifying the question to be answered. Low-shear flow and creep are relevant to sedimentation, creaming, sag, and gravitational stability. Moderate-shear flow is relevant to bulk circulation, transfer, and package evacuation. Higher-shear measurements are more representative of pumping through restrictions, filling nozzles, brush application, or skin spreading. Oscillatory tests probe the intact network and its breakdown, while recovery tests determine whether the structure rebuilds within the time available before filling, packaging, or consumer use. Temperature and time sweeps are necessary when network development is controlled by polymer hydration, lamellar organization, melting, crystallization, or evaporation. The appropriate test window therefore depends on whether the target phenomenon is storage stability, process flow, package delivery, or skin application [
4,
5,
7,
8,
9,
10,
18].
The relevant shear-rate range should be estimated from the actual equipment geometry and flow conditions whenever possible. A value selected only because it is convenient for the rheometer may be repeatable but not mechanistically representative. Where direct estimation is difficult, a bracketed test should compare the material at low, medium, and high deformation levels and should record the recovery after each imposed history. This lifecycle approach also supports scale-up because bench, pilot, and production samples can be compared after standardized conditioning and after simulated process histories. This process-linked approach is consistent with integrated cosmetic-product design and rheological-fingerprinting studies that connect formulation, equipment history, and final performance [
12,
13,
14,
19].
3.2. Steady-Shear Behavior and Constitutive Models
Steady-shear measurements describe the relationship among shear stress (
), shear rate (
), and apparent viscosity (
). Most creams, gels, mascaras, foundations, sunscreens, and structured cleansers are shear-thinning: their apparent viscosity decreases as the imposed shear rate increases. This permits a product to maintain body or suspension at rest while flowing more readily during transfer, filling, or application. However, apparent viscosity is not a material constant for a non-Newtonian product; it is meaningful only when the shear rate or rotational speed, temperature, geometry, elapsed time, and shear history are stated. Standard rotational rheometry guidance and cosmetic application studies emphasize that apparent viscosity must always be reported with its defining test conditions [
4,
5,
7,
8,
9].
Constitutive models provide compact parameters for formulation comparison and process calculations. The power-law model describes shear thinning over a limited range but has neither a yield stress nor finite low- and high-shear viscosity plateaus. The Bingham and Herschel–Bulkley models include an operational yield stress, while the latter additionally represents shear thinning or shear thickening. The Casson model is sometimes applied to pigment-rich dispersions. Cross and Carreau–Yasuda models are useful when low- and high-shear viscosity plateaus can be measured. The principal equations, parameters, applications, and limitations are summarized in
Table 2. The classical Bingham, Herschel–Bulkley, Casson, Cross, Carreau, and Yasuda formulations provide the historical basis for the models summarized in
Table 2 [
20,
21,
22,
23,
24,
25].
For industrial use, fitted parameters should be reported together with the experimental shear-rate range, fitting procedure, units, confidence intervals or uncertainty, and goodness-of-fit diagnostics. Model selection should not be based only on the coefficient of determination; residual distributions, parameter correlation, physical plausibility, measurement artifacts, and relevance to the intended storage or processing condition should also be considered. The same batch can produce different K, n, or
values when the ramp duration, pre-shear, rest time, wall condition, or fitted range changes. Model parameters should therefore be treated as method-defined descriptors unless the protocol has been shown to represent the intended process. These cautions are consistent with published work on yield-stress method dependence, wall slip, constitutive fitting, and time-dependent yielding [
6,
11,
23,
24,
25,
26,
27,
28,
29].
In
Table 2,
is shear stress (Pa),
is shear rate (s
−1),
and
are viscosity and apparent viscosity (Pa·s),
is operational yield stress (Pa), K is the consistency index, n is the flow-behavior index,
is plastic viscosity,
is the Casson viscosity parameter,
and
are the zero- and infinite-shear viscosities,
is a characteristic time constant, and a and m control the breadth or shape of the shear-thinning transition. For the power-law and Herschel–Bulkley models, n < 1 denotes shear thinning, n = 1 denotes linear post-yield or Newtonian behavior, and n > 1 denotes shear thickening.
3.3. Yield Stress and Low-Shear Structure
Yield stress is especially important for cosmetic suspensions, foundations, mascaras, sunscreens, gels, and high-internal-phase emulsions because it describes the stress required to initiate sustained deformation under a specified procedure. Industrially, an adequate yield structure can reduce pigment settling, particle migration, runoff, and sag, but an excessive yield value can increase pump start-up pressure, impair levelling, and create incomplete package evacuation. The numerical value should be described as an apparent, static, dynamic, or operational yield stress unless the test definition is made explicit. The distinction among apparent, static, dynamic, and operational yield stress is supported by the broader yield-stress literature, which emphasizes material history and measurement-time dependence [
6,
26,
29].
Common methods include extrapolation of a steady-flow model, controlled-stress ramps, controlled-rate ramps, creep tests, oscillatory amplitude sweeps, and vane-in-cup measurements. These methods need not give the same result. Dinkgreve et al. demonstrated significant method-dependent differences even for relatively well-behaved materials [
26]. In personal-care gels, Ozkan et al. showed that wall slip and the selected yielding criterion can materially affect interpretation and correlation with sensory properties [
10]. A defensible review or industrial specification should therefore state the geometry, surface condition, loading history, pre-shear, rest period, ramp rate, and criterion used to identify yielding. Foundational vane and structured-fluid studies further demonstrate how geometry, loading history, and the selected yielding criterion influence the measured value [
27,
28,
29].
Creep testing is often the most direct way to distinguish arrested deformation from continuing flow: a series of constant stresses is applied below and above the expected yield region, and compliance is monitored with time. Vane tools can reduce loading damage and slip for highly structured materials. ASTM D7836-13(2025), although developed for paints and related liquids, is industrially informative because it recognizes coaxial-cylinder, cone/plate, plate/plate, controlled-stress, and vane approaches for yield-stress measurement [
27,
28,
30].
3.4. Small-Amplitude Oscillatory Shear
Small-amplitude oscillatory shear (SAOS) probes the near-rest viscoelastic structure while the imposed stress or strain remains within the linear viscoelastic region (LVR). An amplitude or stress sweep is normally conducted first at a defined frequency to identify the range in which the storage modulus G′ and loss modulus G″ are independent of amplitude. Frequency sweeps performed within that range then describe the response across experimental time scales. G′ represents recoverable elastic energy storage, G″ represents viscous dissipation, the complex modulus G* describes total resistance to oscillatory deformation, and tan delta = G″/G′ describes the relative viscous contribution [
8,
9,
16].
The common statement that G′ > G″ proves that a product is stable is too strong. It indicates a more elastic than viscous response only under the tested frequency, amplitude, temperature, sample age, geometry, and conditioning history. Physical stability must still be assessed using droplet or particle size, distribution, microscopy, centrifugation, acceleration, thermal aging, and other relevant methods. Even so, SAOS is valuable for comparing polymer-network formation, emulsion elasticity, suspension structure, lamellar organization, and scale-to-scale similarity. Cosmetic-emulsion studies have linked oscillatory moduli with thickener concentration, droplet structure, process energy, texture, and kinetic stability [
2,
13,
14,
15,
31].
Critical strain or stress at departure from the LVR can provide an operational measure of structural fragility, while crossover frequency, plateau behavior, and low-frequency trends can reveal characteristic relaxation or restructuring time scales. These descriptors must be reported together with the frequency, amplitude criterion, temperature, rest time, and test duration. Method-development work on topical creams has shown that sample application, temperature control, and rest time can materially affect oscillatory results [
16]. If the sample ages, sediments, evaporates, crystallizes, or slips during the sweep, the apparent frequency dependence may reflect evolving sample condition or measurement artifact rather than intrinsic relaxation behavior.
3.5. Time Sweeps and Temperature-Dependent Rheology
Time sweeps at constant small deformation are useful for tracking polymer hydration, neutralization, gelation, emulsion maturation, thixotropic rebuilding, solvent evaporation, and crystallization. The selected stress or strain should remain within the LVR as the structure evolves; otherwise, the monitoring test may itself disturb the process being measured. For manufacturing studies, the rheological time trace should be aligned with pH, temperature, mixer torque, microscopy, droplet size, density, or differential scanning calorimetry (DSC) so that modulus development can be distinguished from simple cooling, concentration change, or aging [
16,
32].
Temperature sweeps can identify melting, softening, network formation, crystallization, and a practical filling window. Filling a window is dependent on total shelf life that should be assigned based on ICH standards. Heating and cooling rates, hold times, gap, solvent protection, normal force, and prior thermal history strongly affect the result. ASTM D7867-13(2025)e1 provides useful control principles for rotational viscosity as a function of temperature, although cosmetic protocols must additionally address irreversible structural transitions and process-relevant cooling history [
33]. Multimodal lipstick measurements have demonstrated the value of combining thermal sweeps, creep, nonlinear oscillation, imaging, and mechanical testing for wax-oil networks [
32].
Temperature cycling should be interpreted as a comparative stress test rather than an automatic prediction of shelf life. Elevated temperature can accelerate creaming or coalescence, but it can also trigger phase inversion, polymer degradation, surfactant transitions, evaporation, or crystal changes that do not occur under normal storage. Accordingly, the mechanism observed during an accelerated thermal test should be confirmed with complementary structural measurements and real-time stability data [
15,
31].
3.6. Thixotropy and Structural Recovery
Shear thinning and thixotropy are related but distinct. Shear thinning is a rate-dependent decrease in apparent viscosity, whereas thixotropy is a time-dependent structural change under deformation followed by rebuilding after the deformation is reduced or removed. A hysteresis loop from an upward and downward flow ramp can provide a useful formulation or batch fingerprint, but the loop area is not a unique material property because it depends on ramp shape, duration, maximum rate, dwell times, preconditioning, wall slip, and instrument control [
16,
34]. Repeated loops may reveal progressive damage, structural aging, or incomplete recovery, but only when the complete sequence and timing are reported.
Three-interval thixotropy testing (3ITT) is practical for cosmetics when the intervals are linked to a real process. A first low-deformation interval establishes the initial structure, a high-deformation interval simulates pumping, filling, brushing, or spreading, and a final low-deformation interval quantifies recovery. The reported recovery metric must identify the measured property, reference value, and evaluation time. Depending on the method, X can be viscosity, stress, G′, or complex modulus.
Recovery should be reported as a function of time whenever the industrial decision depends on the waiting period before filling, package levelling, or application. A product recovering to 80% after five minutes is not equivalent to one recovering to 80% after five seconds. The imposed breakdown condition should be justified from process estimates or should bracket the expected deformation history. Because recovery can depend on rest time, temperature, and the selected rheological property, a 3ITT percentage is a method-defined performance index rather than a universal material constant [
16,
34].
3.7. Creep, Recovery, and Stress Relaxation
Creep and recovery tests separate instantaneous elastic deformation, delayed elastic deformation, irreversible flow, and post-load recovery. These responses are relevant to jar pickup, product sag, shape retention, long-term deformation, suspension, film leveling, and the mechanical integrity of soft sticks. A constant stress below the operational yield region should produce limited deformation in a stable weak solid, whereas continuing compliance growth indicates slow flow, wall slip, structural evolution, or a stress above the relevant arrest condition [
16,
26,
29]. After stress removal, the recovered fraction reflects the reversible component under that specific stress and duration.
Under a defined sub-yield stress, low creep compliance and a low creep rate indicate greater resistance to gravity-driven sag, shape loss, or long-term deformation. A larger recovered fraction indicates that more deformation was stored reversibly, whereas high residual strain or continuing compliance growth indicates irreversible flow, structural damage, wall slip, or yielding. Retardation time describes the rate of delayed elastic deformation and recovery. For soft sticks, these parameters should be interpreted together with hardness, bending or fracture resistance, and thermal history because resistance to small stress does not guarantee resistance to large deformation [
2,
32].
Maxwell, Kelvin-Voigt, Burgers, or generalized viscoelastic models may summarize creep data, but they should not be interpreted as unique microstructural mechanisms without complementary evidence. Structured cosmetics can undergo irreversible bond rupture, wall slip, thixotropic aging, phase migration, or crystallization that simple linear models do not capture. Stress relaxation after a step strain is complementary and can identify how rapidly internal stresses dissipate after dispensing, spreading, molding, or package deformation. Cosmetic emulsion and lipstick studies have used creep or recovery behavior to discriminate formulation structure, texture, and mechanical performance [
2,
32].
Stress magnitude, loading rise time, creep duration, recovery duration, geometry, surface condition, and sample history must be selected before comparing products. Method-development studies on topical creams demonstrate that apparently minor procedural variables can change creep-recovery outputs, supporting a fit-for-purpose validation strategy rather than adoption of one universal protocol [
16].
3.8. Large-Amplitude Oscillatory Shear and Nonlinear Rheology
Large-amplitude oscillatory shear (LAOS) extends characterization beyond the LVR and is useful because cosmetic application commonly involves yielding, structural rearrangement, wall slip, and nonlinear flow. Elastic and viscous Lissajous-Bowditch curves, Fourier harmonics, Chebyshev coefficients, and sequence-of-physical-processes analysis can distinguish intra-cycle strain stiffening or softening and intra-cycle shear thickening or thinning [
35,
36]. These analyses provide information that is lost when the response is reduced to first-harmonic G′ and G″ values.
Primary personal-care studies have used LAOS to identify yield and slip behavior, follow the transition from viscoplastic solid to structured fluid, and generate formulation fingerprints sensitive to thickener chemistry, molecular weight, pH, surfactants, emulsifiers, ionic charges (salts), and lamellar structures [
10,
18,
19,
37]. Lee et al. subsequently combined LAOS-derived sequence-of-physical-process parameters with machine learning to predict panel-rated spreadability [
38]. These results support LAOS as a development and mechanistic tool, but they do not make it a universal QC method.
Lee et al. compared conventional rheological variables with LAOS sequence-of-physical-process descriptors in linear and random-forest models of trained-panel spreadability. LAOS-derived features improved prediction, and the random-forest model performed best, indicating that nonlinear descriptors of the elastic-to-viscous transition during rubbing contain application-relevant information; however, errors for individual products and the formulation-specific dataset limit direct generalization [
38].
Protocol complexity, frequency and strain-rate dependence, waveform quality, wall slip, edge effects, and limited interlaboratory standardization remain important barriers. LAOS conclusions should therefore be supported by linear rheology, steady flow, visual inspection of the sample edge, and application-relevant performance tests. For routine industrial use, a small number of validated nonlinear descriptors is generally more defensible than a large unfiltered set of harmonic or geometric parameters [
16,
35,
36,
37].
3.9. Extensional Rheology and Filament Breakup
Shear rheology does not fully represent stretching, filament formation, adhesive separation, dripping, or nozzle cutoff. Extensional measurements are therefore relevant to serum dripping, lip-gloss stringiness, mascara fiber formation, eyeliner cutoff, pump tailing, applicator withdrawal, nail-lacquer brushing, and transfer between a finger, brush, wand, package, and skin. Useful outputs include filament-breakup time, maximum stretch length, filament-thinning profile, apparent extensional viscosity, extensional relaxation time, tensile force, and tack [
39,
40,
41].
Cosmetic evidence shows that extensional response can vary independently of conventional shear viscosity. Kibbelaar et al. demonstrated that the molecular weight of hyaluronic acid and the imposed stretching speed strongly affected the stringiness of concentrated emulsions [
40]. Jimenez et al. showed that commercial nail lacquers undergo capillarity-driven pinching during dripping and brush application and that extensional behavior supplied information not captured by shear measurements alone [
41]. Lee and Kim combined LAOS and extensional parameters in a machine-learning model for spreadability, thickness, softness, adhesiveness, and stickiness [
39].
More specifically, Lee and Kim combined LAOS and extensional descriptors to predict spreadability, thickness, softness, adhesiveness, and stickiness [
39]. Kibbelaar et al. found that persistent filaments formed for high-molecular-weight hyaluronic acid at high stretching speed, while conventional shear-flow measurements did not significantly distinguish the molecular-weight conditions [
40]. Jimenez et al. showed formulation-dependent, capillarity-driven necking and breakup in nail lacquers during dripping and brushing, providing information not resolved by shear rheology alone [
41].
In capillary-breakup methods, filament thinning reflects a balance among capillary pressure, viscosity, inertia, gravity, and elastic stress. Breakup time is a useful performance index, but it is not automatically an intrinsic material property. Quantitative estimates of viscosity or relaxation time require an appropriate thinning regime, adequate temporal and spatial resolution, and reliable surface-tension data [
42,
43]. Highly structured products may also exhibit neck localization, apparent extensional yielding, or nonuniform deformation that violates simple one-dimensional assumptions.
A liquid bridge becomes unstable to axisymmetric Rayleigh–Plateau disturbances when the disturbance wavelength exceeds the filament circumference (
for an ideal cylindrical thread). The minimum filament radius,
, should be examined on both linear and logarithmic scales to identify the governing thinning regime. During inertio-capillary thinning,
scales approximately as
, whereas in the viscocapillary regime it decreases approximately linearly with
. In the elastocapillary regime, exponential thinning may be used to estimate the relaxation time, but only over a verified fitting interval [
42,
43]. The Ohnesorge number,
, helps distinguish inertia-dominated from viscosity-dominated breakup. Highly elastic products may exhibit beads-on-a-string, finite extensibility, multiple necks, asymmetric breakup, or an inability to form a reproducible slender filament. Therefore, the frame rate, spatial resolution, local thinning slope, surface tension, identified regime, and fitted interval should be reported.
The method must control initial bridge geometry, sample volume, plate diameter, separation speed and acceleration, final gap, temperature, evaporation, surface tension, gravity, and image-analysis threshold. Low-viscosity samples may break during plate separation, whereas highly elastic or yield-stress materials may not form a reproducible slender filament. For industrial interpretation, the extensional protocol should reproduce the relevant package or applicator event and should be paired with high-shear viscosity, surface tension, tack or adhesion, and controlled dispensing or brush imaging. This combined approach is more defensible than using breakup time alone as a universal specification [
40,
41,
42,
43].
3.10. Tribology and Lubrication Behavior
Tribology measures friction and lubrication at the product-substrate interface and becomes particularly important after the bulk structure begins to break down. A Stribeck-type interpretation distinguishes boundary, mixed, and hydrodynamic lubrication as entrainment speed, load, viscosity, and film thickness change. However, topical contacts are soft, rough, absorbent, and time dependent, so cosmetic friction curves should not automatically be treated as classical steady-state Stribeck curves. During application, friction can evolve because water or volatile solvent evaporates, an emulsion breaks or reorganizes, particles deposit, and oils, waxes, polymers, or UV filters form a residual film [
37,
44,
45].
Results are strongly method dependent. The substrate may be excised skin, reconstructed skin, elastomer, polymer, glass, or another surrogate; each has different roughness, compliance, wettability, porosity, absorbency, penetration, and surface energy. Normal load, contact pressure, sliding speed, stroke length, applied mass, contact geometry, number of cycles, temperature, humidity, and drying time must be controlled. Direct comparison of excised skin and VitroSkin has shown that substrate selection can change measured friction and product ranking, so surrogate validation is essential [
45].
Published work supports combining friction with rheology, texture analysis, and sensory assessment. Farias and Khan linked nonlinear rheology and frictional response in polymer-thickened gels and emulsions [
37]. Savary et al. used in vivo tactile friction to characterize residual films from topical gels and emulsions [
44]. Cyriac et al. showed that wall slip, thixotropy, lubrication regime, and nonlinear rheology can influence instrumental sensory prediction [
46,
47]. Additional cosmetic and topical studies have connected oil-phase composition, emollient identity, film evolution, and tactile friction with slipperiness, greasiness, stickiness, and afterfeel [
17,
45,
48,
49,
50,
51,
52,
53].
Tribology is therefore complementary to, rather than a replacement for, trained sensory assessment. A friction coefficient should be interpreted together with the contact regime and time after application. The same formulation may feel initially slippery but become tacky or dry as the film thins and volatile components leave. Reporting only one friction value without the dose, substrate, speed, load, and drying history is generally insufficient for formulation comparison.
3.11. Pilling and Rub-Out Instability
Pilling should be included as an application-related film failure because it is a visible consumer defect that is not predicted reliably by bulk viscosity alone. Pilling refers to the formation of flakes, rolls, or small agglomerated particles when a topical product is rubbed on skin or when several skincare, sunscreen, and makeup layers are combined. Mechanistically, it is best treated as a coupled problem involving film cohesion, adhesion to the skin or underlying layer, friction, drying, dose, and application kinematics rather than as a single rheological property.
The first controlled study focused specifically on skincare pilling and found that most observed events occurred after sunscreen application, while foundation reduced sunscreen-associated pilling in many cases. Pilling was associated with lower skin hydration and oiliness, higher skin pH, smoother measured skin texture, and application by circular or linear rubbing rather than gentler placement methods [
54]. These findings demonstrate that skin condition and application method matter, but they do not establish universal ingredient-level causes or prove that one polymer, silicone, particulate filter, or emulsion type will always pill.
A defensible pilling protocol should standardize the substrate or volunteer conditioning, applied dose, layer sequence, waiting or drying time, rubbing path, speed, force, number of strokes, and endpoint grading. Useful outputs may include visual pilling grade, number or mass of detached pills, image-based particle area, friction evolution, and film integrity after rubbing. Film-forming literature also supports evaluating drying time, adhesion, flexibility, tack, and rub-off resistance when a persistent polymer film is intended [
55]. Instrumental pilling tests require validation against controlled consumer or trained-panel observations. Because direct peer-reviewed evidence remains sparse, pilling should be presented as an emerging research and method-standardization gap rather than as a fully established rheological test.
3.12. Interfacial Rheology
Bulk emulsion rheology emerges not only from phase viscosities and droplet packing but also from the mechanical properties of the oil-water interface. Interfacial shear and dilatational rheology quantify the resistance of an adsorbed surfactant, polymer, protein, or particle layer to in-plane deformation and area change. These properties can influence droplet deformation, Marangoni stresses, coalescence resistance, and the elastic response of concentrated emulsions [
31,
56,
57,
58].
Pal developed and tested viscosity models that incorporate interfacial rheology and Marangoni effects [
56]. Tsibranska et al. demonstrated that interfacial dilatational elasticity had a strong effect on bulk emulsion elasticity, a moderate effect on dynamic yield stress, and little effect on steady viscous stress for the tested saponin-stabilized systems [
57]. More recent work systematically varied droplet size, dispersed- and continuous-phase viscosity, volume fraction, and interfacial response, showing that their coupled effects govern apparent viscosity and shear thinning [
58].
Interfacial rheology is not a routine plant-floor test, and a high interfacial modulus does not guarantee bulk stability. Droplet concentration, size distribution, continuous-phase structure, adsorption kinetics, and processing history remain important. Even so, interfacial measurements can explain why emulsifiers with similar equilibrium interfacial tension produce different droplet mechanics, processing behavior, and long-term stability. They are most useful for mechanistic development or failure analysis when bulk rheology and droplet-size data alone do not explain product behavior [
31,
56,
57].
3.13. Sample Preparation, Geometry Selection, and Measurement Artifacts
Rheological data are reliable only when sample history and instrument limitations are controlled. Essential information includes sampling location, sample age, storage temperature, transport, deaeration, pre-shear, rest period, loading method, trimming, gap, solvent trap, equilibration, and test order. A top-of-vessel sample, a bottom sample, and a sample collected after transfer may legitimately have different rheology. Air bubbles can alter density, torque response, normal force, and optical interpretation. Evaporation can increase concentration during long sweeps, while sedimentation, creaming, or crystallization can change the material within the measurement gap. Analytical method-development work on topical creams has confirmed that sample application, temperature, and rest time are critical variables that should be evaluated and controlled [
16].
Wall slip is one of the most important artifacts for emulsions, suspensions, gels, and wax-rich materials. Pal reported differences of several orders of magnitude between smooth and serrated geometries at low stress for concentrated emulsions [
11]. Diagnostic approaches include testing multiple gaps, comparing smooth and roughened surfaces, using vane-in-cup tools, examining geometry dependence, and combining rheometry with velocimetry or visual observation [
11,
27,
28]. Rough surfaces can reduce slip but may fracture fragile structures, promote edge damage, or trap particles; therefore, surface selection must be validated rather than assumed.
Cone-and-plate geometry provides an approximately uniform shear rate but has a fixed small gap and may be unsuitable for particles, fibers, droplets, or crystals that are not small relative to the gap. Parallel plates permit gap variation and roughened surfaces but produce a radial shear-rate distribution. Concentric cylinders reduce free-surface and evaporation effects and are useful for lower-viscosity products. Double-gap tools increase sensitivity for low-viscosity liquids. Vane tools minimize pressure during loading and can improve operational yield-stress measurement. The instrument torque floor, inertia, normal-force limit, temperature accuracy, edge fracture, secondary flow, and data-acquisition rate should be checked for every protocol [
8,
9,
16].
ISO 3219-1:2021 defines vocabulary and symbols, and ISO 3219-2:2021 specifies general principles for rotational and oscillatory rheometry [
8,
9]. ASTM D2196-20(2026) covers apparent viscosity, shear thinning, and thixotropic properties over a stated rotational-viscometer range and notes that measurements at more than one speed provide better characterization than a single-speed value [
7]. These standards improve method discipline, but product-specific cosmetic protocols are still required because they do not define universal conditions for emulsions, surfactant mesophases, pigment suspensions, hot-pour wax networks, extensional behavior, tribology, or pilling. A fit-for-purpose method should therefore demonstrate repeatability, sensitivity to relevant product differences, and robustness to the principal method variables [
16].
3.14. Industrial Test-Selection Framework
In practice, an industrial program should distinguish routine release methods from development and investigation methods. A single-point rotational viscosity can be appropriate for release when it is validated, sensitive to process variation, and fully specified. Flow curves, yield measurements, SAOS, recovery, and thermal tests are appropriate for development, scale-up, and stability. LAOS, extensional rheology, tribology, interfacial rheology, pilling assessment, rheo-microscopy, and velocimetry are higher-level tools for difficult formulation, sensory, packaging, and failure-analysis questions. The industrial decision, rather than instrument availability, should determine the test [
1,
7,
8,
9,
16,
17].
Table 3 summarizes the principal tests and their industrial interpretation, while
Table 4 converts common manufacturing and performance questions into a primary method and complementary-evidence plan.
Table 3 and
Table 4 are complementary rather than duplicative.
Table 3 is method-centered, whereas
Table 4 is decision-centered and links an industrial question to a primary method and orthogonal evidence. They are retained because these are distinct selection axes.
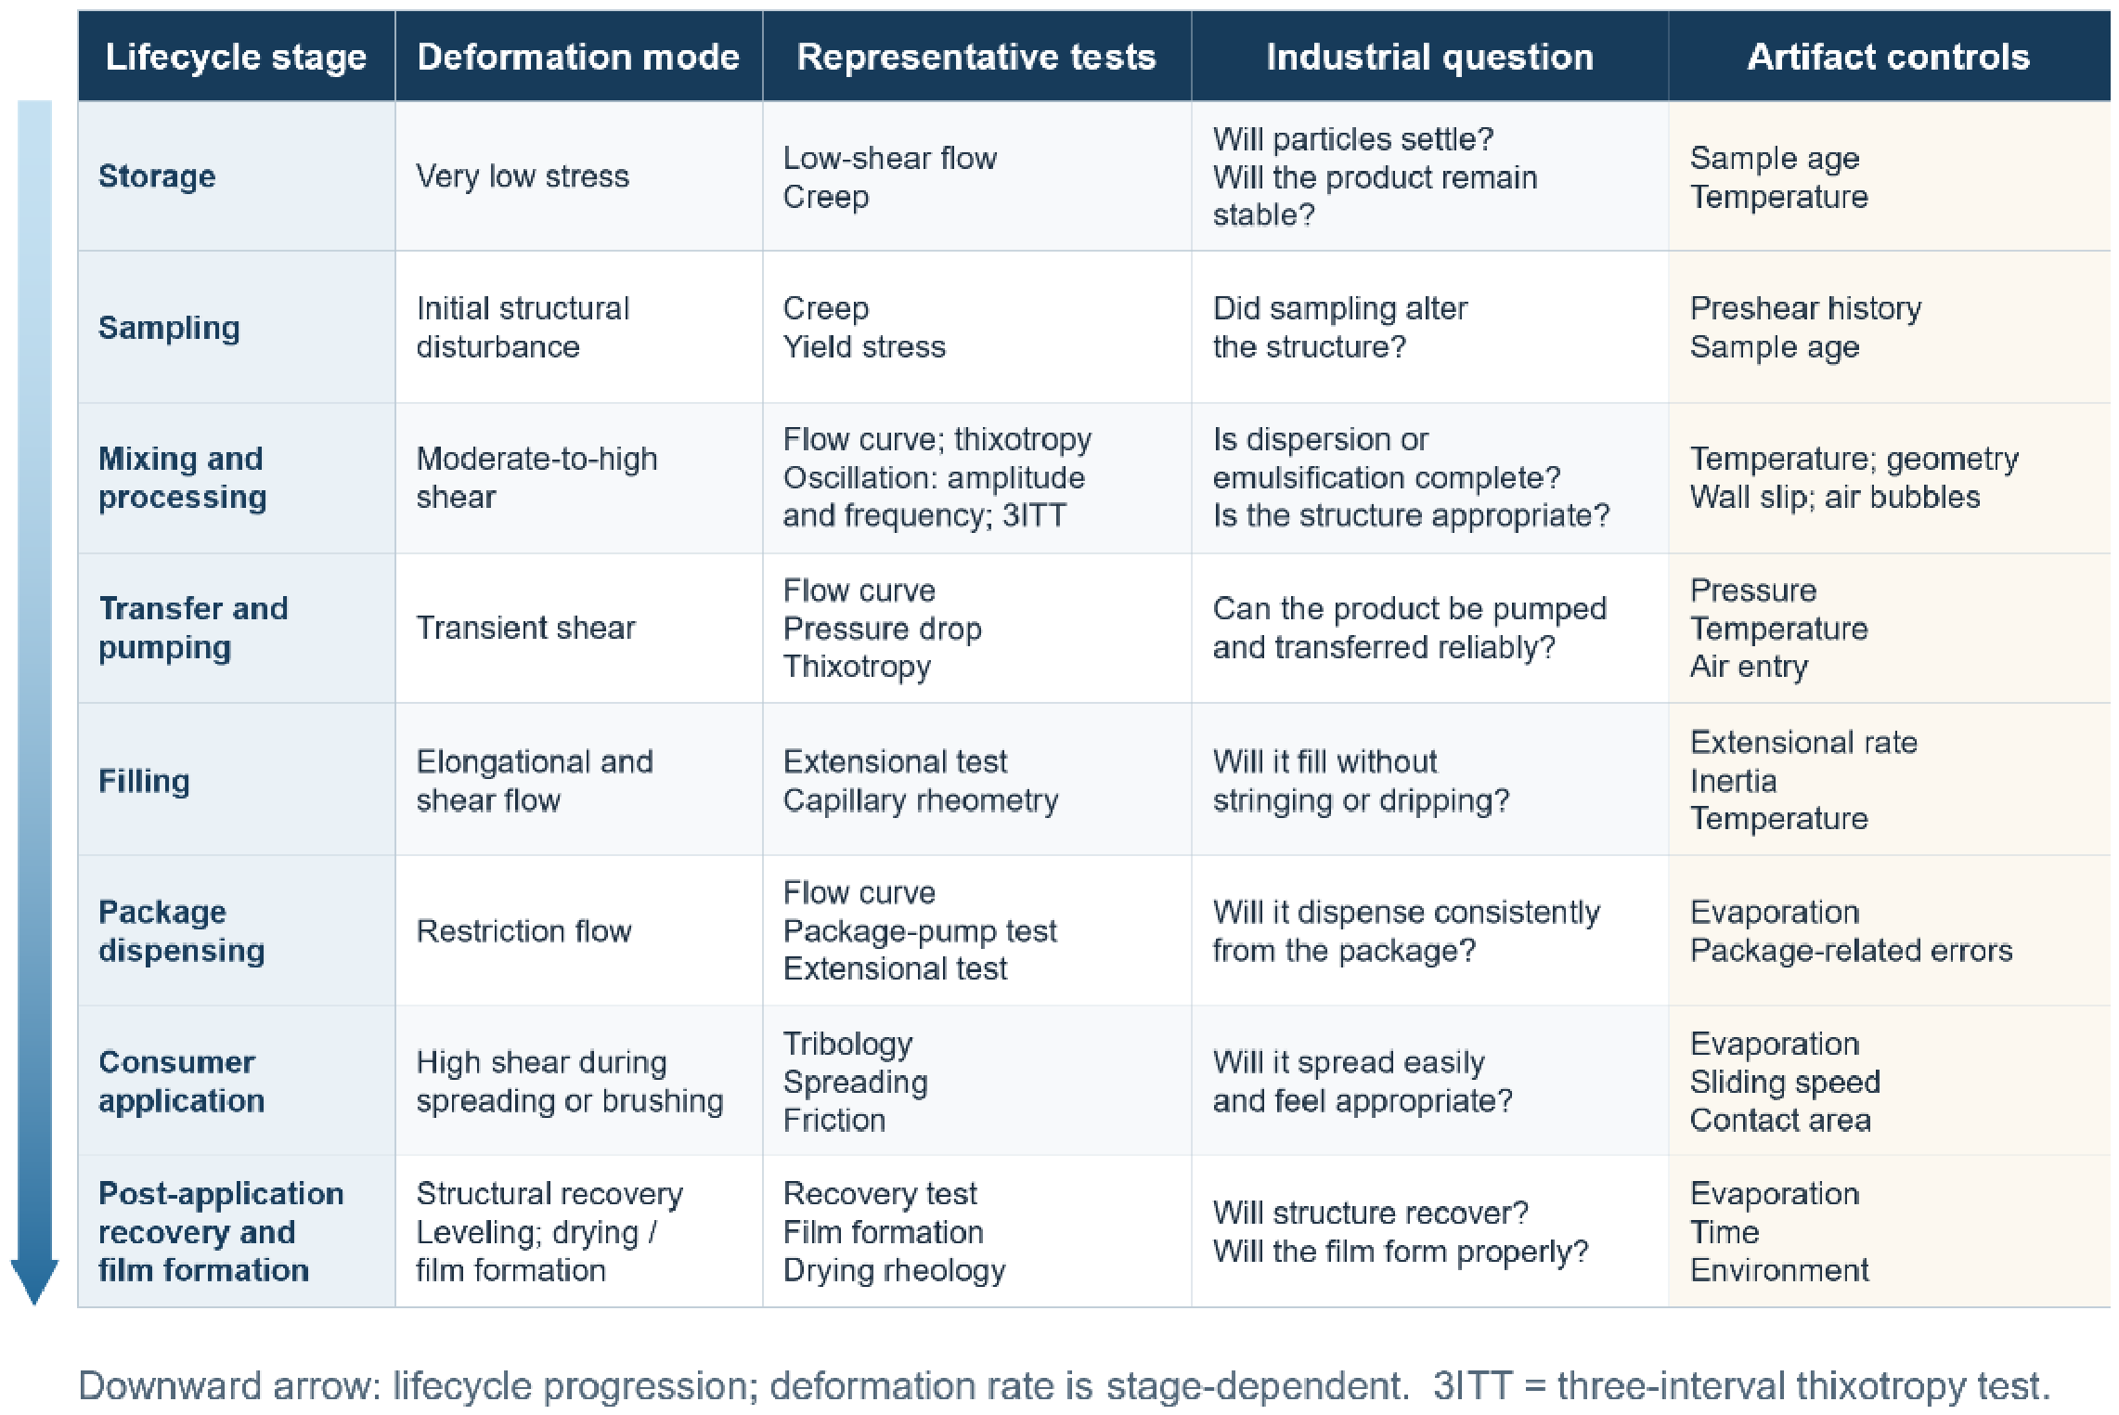
Figure 2 operationalizes the measurement framework by linking each lifecycle stage to the relevant deformation mode, representative tests, industrial questions, and artifact controls.
Unlike
Table 3, which compares individual methods and cautions, and
Table 4, which begins with a specific industrial question,
Figure 2 follows the product lifecycle and shows when the dominant deformation mode, measurement need, and artifact control change. Its distinct contribution is therefore temporal and relational: it connects formulation, processing, filling, storage, application, and investigation in a single navigation map.
4. Microstructure and Formulation Drivers
4.1. Emulsions and Lamellar Networks
Oil-in-water and water-in-oil emulsions are central to skin care, complexion products, sunscreens, and topical treatments. Their rheology is not controlled by droplet size alone. It emerges from the combined effects of dispersed-phase volume fraction, droplet-size distribution and deformability, continuous-phase viscosity, interfacial-film mechanics, droplet–droplet interactions, emulsifier self-assembly, interfacial charges, and any polymer or particulate network present. Increasing dispersed-phase fraction normally raises viscosity and elasticity as droplets become crowded, but the magnitude of the effect depends on polydispersity, interfacial mobility, flocculation state, and whether the continuous phase already forms a load-bearing network [
12,
13,
14,
31,
56,
57,
58].
Many semisolid creams are structured by mixed emulsifier–fatty alcohol systems rather than by droplets alone. During cooling, surfactants and long-chain fatty amphiphiles can form crystalline or liquid-crystalline bilayers that swell with water and generate a lamellar gel network in the continuous phase. This network can provide body, yield behavior, water immobilization, and long-term resistance to droplet movement. Eccleston described how the relative proportions of surfactant, fatty alcohol, oil, and water govern the formation and mechanical role of these mixed-emulsifier structures [
59]. Ribeiro et al. subsequently showed that adding different polymers to cetyl-alcohol/nonionic-surfactant creams altered creep, oscillatory response, and microstructure, demonstrating that polymer and lamellar structures can reinforce or reorganize one another rather than acting independently [
60].
One important implication is that a smaller mean droplet size does not automatically guarantee greater viscosity, stronger elasticity, or better stability. Smaller droplets increase interfacial area and may increase crowding, but they also require more complete interfacial coverage and can respond differently when the emulsifier film is fluid, brittle, or partially displaced by polymers or particles. Similarly, a high G′ may arise from a continuous-phase lamellar or polymer network even when the droplet contribution is modest. Rheological interpretation should therefore be paired with droplet-size distribution, polarized or cryogenic microscopy where available, thermal analysis, and interfacial measurements when the emulsifier film is suspected to control behavior [
13,
14,
15,
31,
56,
57,
59,
60].
The microstructure measured after manufacture may also change during storage and use (by time or temperature). Cooling, crystallization, water redistribution, evaporation, rubbing, and dilution by sweat or rinse water can shift the relative contributions of droplets, lamellae, and polymers. The topical-semisolid literature describes this in-use evolution as formulation metamorphosis and cautions that the rheology of the product in its package may differ from that of the residual film on skin [
61]. Industrial development should therefore distinguish the structure needed for vessel processing, package stability, dispensing, application, and post-application performance rather than assuming that one equilibrium microstructure governs the full lifecycle.
4.2. Polymer-Thickened Systems
Carbomers, acrylate copolymers, cellulose derivatives, xanthan gum, guar derivatives, starches, clays, and associative polymers generate structure through different mechanisms. Linear or branched polymers may thicken by chain overlap and entanglement; cross-linked carbomers swell into deformable microgel particles; gums and cellulose derivatives can form entangled or weakly associated networks; and hydrophobically modified polymers can bridge micelles, droplets, oils, or other hydrophobic domains. These mechanisms produce different combinations of yield behavior, elasticity, extensional response, recovery, salt tolerance, charge (ions) tolerance, and sensory break [
2,
16,
62,
63].
Carbomer systems illustrate why concentration alone is an incomplete formulation variable. Neutralization ionizes the poly(acrylic acid) network, promotes swelling, and can transform a low-viscosity dispersion into a jammed microgel with yield-like and elastoviscoplastic behavior. Piau described Carbopol gels as assemblies of swollen, deformable microgel particles whose macroscopic behavior depends on concentration, swelling, elasticity, yielding, and wall slip [
63]. In cosmetic formulations, final pH, neutralizer type and addition sequence, ionic strength, alcohol content, and time after neutralization can therefore alter both apparent viscosity and the integrity of the network. Electrolytes may deswell or screen charged polymers, while incomplete dispersion can leave fisheyes or locally over-neutralized regions.
Natural and modified-natural polymers introduce additional sensitivities. Hydration rate depends on particle wetting, molecular substitution, temperature, shear, electrolyte content, and the order in which surfactants, salts, and preservatives are added. Associative polymers and polymer–surfactant mixtures can produce strong viscosity enhancement when polymer hydrophobes connect micelles, but the same network may collapse when fragrance oils, excess surfactant, electrolyte, or temperature changes micellar size and connectivity. Gradzielski emphasized that electrostatic and hydrophobic polymer–surfactant interactions can generate responsive networks, but that their behavior is highly formulation-specific and not reliably predicted from the isolated ingredients [
64].
Gilbert and co-workers showed that polymer identity changes flow, creep, oscillatory response, texture, and sensory-related properties in cosmetic emulsions [
2,
62]. From an industrial perspective, a thickener should not be selected only to meet one viscosity target. Development should assess hydration and neutralization kinetics, process tolerance, yield and recovery, electrolyte and surfactant compatibility, temperature sensitivity, wall slip, and the rheology after realistic high-shear and aging histories. Microscopy, solids balance, pH mapping, and controlled rehydration or dilution studies are often needed to distinguish true polymer-network development from cooling, evaporation, air loss, or incomplete mixing.
4.3. Surfactant Mesophases and Cleansing Systems
Shampoos, body washes, facial cleansers, and micellar products may be structured by spherical, rodlike, or wormlike micelles, lamellar phases, vesicles, polymers, salts, or mixed surfactant–polymer networks. The transition between these structures can cause changes of several orders of magnitude in viscosity and can introduce elasticity, normal stresses, stringiness, and long relaxation times. The relevant microstructure is governed by surfactant concentration and architecture, counterion binding, ionic strength, temperature, cosurfactants, amphoterics, hydrotropes, fragrance oils, and polymers [
1,
64,
65,
66].
The familiar salt-thickening curve of many cleansing systems is therefore a structural transition rather than a simple concentration effect. Initial electrolyte addition can screen electrostatic repulsion and promote growth from shorter micelles toward entangled wormlike structures; further salt addition may shorten micelles, change branching, induce phase separation, or reduce viscosity. Recent work on sodium lauryl ether sulfate model systems shows that surfactant molecular architecture and polydispersity affect self-assembly and micellar rheology, helping explain why raw materials with the same nominal INCI name can produce different salt curves and elasticity [
66].
Polymer–surfactant interactions can either increase or decrease structure. Hydrophobically modified polymers may bridge micelles and form a transient network, whereas oppositely charged polymers can form complexes, precipitates, or coacervate-like domains. Fragrance oils and preservatives may partition into micelles, changing contour length and relaxation, while dilution during use can move the system through multiple phases or rheological regimes. Because these interactions are nonlinear, viscosity measured before fragrance, salt, color, or preservative addition may not predict the finished cleanser [
64,
65].
Industrial control should include addition order, salt-addition rate, temperature, mixing time, pH, conductivity, and equilibration time. Flow curves, frequency sweeps, stress relaxation, and extensional or filament tests can help distinguish a viscous salt-thickened liquid from an elastic wormlike micellar system. Temperature and dilution sweeps are particularly useful when bottle evacuation, pump delivery, stringiness, foam generation, and rinse behavior must all be balanced. Micellar thickening should be distinguished explicitly from polymer thickening because the two networks respond differently to shear history, electrolyte, fragrance, and temperature [
1,
64,
65,
66].
4.4. Suspensions, Pigments, Fillers, and Color Cosmetics
Foundations, concealers, sunscreens, mascaras, eyeliners, and color cosmetics often contain pigments, mineral fillers, pearlescent materials, clays, silica, or insoluble actives. Their behavior depends on particle size and shape, density mismatch, surface energy and treatment, wetting, agglomeration, flocculation, continuous-phase rheology, and particle–polymer or particle–surfactant interactions. Adequate low-shear structure can reduce settling, flotation, and runoff, but excessive cohesion can produce poor levelling, difficult pumping, nonuniform spreading, or a gritty and draggy sensory profile.
The distinction between flocculated and well-dispersed states is central. A weakly flocculated network may produce a useful yield structure and redisperse readily, whereas strong flocculation can generate high viscosity, trapped air, poor color development, hard sediment, and irreversible agglomerates. Conversely, complete deflocculation can lower process viscosity but accelerate settling if the continuous phase does not provide sufficient low-shear resistance. Surface treatments and dispersants alter wetting, adsorption, steric or electrostatic stabilization, oil or water affinity, and compatibility with emulsifiers and polymers; their effect should be assessed using rheology together with particle size, microscopy, sedimentation, zeta potential where meaningful, grind quality, color strength, or optical performance [
67,
68].
As particle volume fraction rises, hydrodynamic interactions and crowding increase strongly, and the system can approach a packing or jamming transition. The Krieger–Dougherty relation provides a useful conceptual framework for the rapid increase in relative viscosity as the solids fraction approaches a maximum packing fraction, although real cosmetic particles are polydisperse, nonspherical, surface-treated, and often flocculated [
69]. Dense-suspension research further shows that many-body interactions, particle migration, and contact stresses become important at high loading [
70]. Under sufficiently strong forcing, some dense suspensions can shear thicken or form frictional contact networks rather than continuing to shear thin [
71]. This possibility is relevant to highly loaded pigment pastes and mineral sunscreens and should be checked rather than excluded by assumption.
Pigment dispersion and emulsion formation may require different hydrodynamic conditions. High local stress may be needed for wetting and deagglomeration, while bulk circulation is required to expose the complete batch to the dispersion zone. Excessive processing can degrade a polymer network, overheat the batch, increase air incorporation, fracture fragile pearlescent particles, or alter the flocculation state. A defensible development program should therefore separate powder wetting, deagglomeration, stabilization, bulk circulation, and final structure building and should compare samples before milling, after milling, after let-down, and after aging.
4.5. Wet Slurries, Pigment Pastes, and Concentrated Dispersions
Wet slurries are concentrated dispersions of solid particles in a liquid carrier and are commonly prepared as intermediates before addition to the final cosmetic bulk. Examples include iron-oxide pastes for foundations and concealers; titanium-dioxide and zinc-oxide dispersions for sunscreens; carbon-black dispersions for mascara and eyeliner; and concentrates containing mica, lakes, clays, fillers, or insoluble actives. Their industrial lifecycle includes carrier selection, wetting, agglomerate breakdown, stabilization, milling or high-shear dispersion, storage, transfer, and final let-down.
Slurry rheology depends on solids volume fraction, particle-size distribution and shape, maximum packing, surface treatment, flocculation state, carrier viscosity, dispersant adsorption, pH, ionic strength, temperature, and process history. Dispersant optimization often produces a viscosity minimum: too little dispersant leaves attractive particle contacts, whereas excess dispersant can change continuous-phase chemistry, promote depletion effects, interfere with downstream emulsifiers, or reduce the low-shear structure needed for storage. In inorganic UV-filter suspensions, polymeric dispersants have been shown to alter flocculation, viscosity, and UV-protective performance [
67]. Sunscreen studies also demonstrate that rheology and spreadability influence film uniformity and measured protection [
68].
The industrial objective is a process window rather than a maximum or minimum viscosity. The slurry must be fluid enough for pumping, recirculation, milling, filtration, and vessel emptying while retaining sufficient structure to limit settling, separation, and hard sediment. Particle packing and contact networks can make high-solids slurries extremely sensitive to small composition changes [
69,
70,
71]. A controlled let-down study is therefore important: dilution into the final oil, water, polymer, surfactant, or emulsion matrix can destroy the original stabilization mechanism, cause reflocculation, or create a new yield network that is not predicted from the concentrate alone.
Recommended measurements include process-range flow curves, operational yield stress or creep, 3ITT, density, particle-size or grind assessment, microscopy, sedimentation, and controlled dilution. Method artifacts are especially important at high solids loading. Wall slip, particle migration, sedimentation during testing, incomplete steady-state attainment, air entrapment, edge fracture, and an insufficient geometry gap can all produce misleading results. The protocol should report solids content, carrier composition, dispersant level, sampling time after processing, geometry and surface roughness, gap, temperature, preconditioning, test duration, and whether the sample was deaerated.
4.6. Dry Cosmetic Powders and Powder Rheology
Dry cosmetic powders include loose setting powders, dry shampoos, powder cleansers, pigment and filler preblends, and the unpressed feed blends used for eyeshadows, blushes, highlighters, and powder foundations. Their behavior is governed by particle size and shape, surface roughness and treatment, cohesion, friction, consolidation, aeration, electrostatics, moisture, bulk density, and segregation. Because these are granular materials, liquid-rheology parameters such as viscosity, G′, and G″ do not adequately describe their flow.
The industrial question should determine the powder-flow assessment. Bulk and tapped density, compressibility indices, angle of repose, and flow-through-orifice tests provide rapid screening, while shear-cell or dynamic powder methods may be needed when cohesion, consolidation, wall interaction, aeration, or sensitivity to handling must be investigated. These methods probe different powder states, and no single index predicts blending, transfer, feeding, storage, and filling simultaneously [
72]. Moisture history should be controlled because relative humidity can change cohesion, aeration response, electrostatic behavior, caking, and dispersion performance [
73].
Cosmetic-specific studies show that powder-flow and compressibility measurements can support formulation comparison, raw-material substitution, preblending, and loose-powder filling. Lower flow resistance has been associated with improved payoff, while compressibility has been related to pressed-cake strength; talc replacement with fumed silica or cornstarch also produced concentration-dependent changes in powder behavior [
74,
75]. In this review, powder rheology remains limited to raw-material handling, segregation, charging, conveying, dosing, loose-powder filling, caking, and dusting. Detailed pressing and compact mechanics remain outside the scope.
4.7. Foams and Aerated Systems
Foams occur in facial cleansers, shampoos, shaving products, styling mousses, aerosol or pump foams, and whipped cosmetic systems. Their microstructure consists of gas bubbles separated by thin liquid films and connected through Plateau-border channels. Rheological behavior depends on gas volume fraction, bubble-size distribution, interfacial mobility and elasticity, liquid-phase viscosity and yield stress, and the rate at which bubbles rearrange under deformation. Concentrated foams commonly show elastic and yield-like behavior, but the measured modulus and yield response evolve as the foam ages [
1,
76].
Foam stability is controlled by drainage, coarsening, coalescence, and disproportionation. Drainage changes the local liquid fraction and therefore the mechanical response; coarsening increases bubble size and can reduce modulus; coalescence produces abrupt structural loss. Saint-Jalmes emphasized that surfactant chemistry and interfacial properties influence both drainage and coarsening [
77]. Oscillatory studies further show that surfactant type, liquid fraction, experimental protocol, and aging time materially affect foam-rheology measurements [
76]. Fragrance oils, antifoams, insoluble particles, and polymers may stabilize one mechanism while destabilizing another.
Marze et al. demonstrated that the linear viscoelastic range, yielding response, and post-yield behavior of aqueous foams depend on surfactant and interfacial properties, liquid fraction, bubble size, sample age, and oscillatory protocol [
76]. Saint-Jalmes showed that drainage redistributes liquid and changes local packing, while gas diffusion and coarsening increase bubble size and progressively alter stiffness and stability [
77].
Cosmetic foam testing should therefore report the foam-generation method, gas fraction or expansion ratio, bubble size, sample age, drainage time, temperature, humidity, and loading procedure. Bulk rheometry can be combined with drainage, image analysis, foam-height decay, density, texture, and package-dispensing tests. The relevant target may differ by product: a cleanser may require rapid foam generation and easy rinse, whereas a shaving or styling foam may require yield structure, shape retention, lubrication, and slow collapse. Foam rheology is thus an evolving property of a gas–liquid microstructure, not a fixed characteristic of the unfoamed liquid.
4.8. Anhydrous Gels, Wax–Oil Networks, and Hot-Pour Products
Lipsticks, balms, sticks, pomades, and other hot-pour products are structured by wax crystals, organogelators, polymers, fillers, pigments, oils, and sometimes volatile components. The molten-state viscosity controls mixing, pigment dispersion, transfer, and filling, whereas the finished product behaves as a composite solid or soft solid whose properties arise from a percolated crystal or gel network. Maximum temperature, hold time, wax dissolution, cooling rate, shear during crystallization, mold or package temperature, and post-fill conditioning can, therefore, be as important as nominal composition.
Wax identity and cooling history determine nucleation, crystal morphology, network connectivity, oil binding, shrinkage, hardness, and fracture. Wang et al. showed that wax components and cooling rate alter crystal morphology and the mechanical properties of wax–oil mixtures cast in lipstick-like geometries [
78]. More broadly, Blake and Marangoni demonstrated that cooling rate can be used to engineer wax-crystal network microstructure and oil-binding capacity [
79]. These findings support a key industrial principle: matching the final fill temperature without matching the complete thermal history may still produce a different final product.
Wang et al. directly linked wax composition and cooling rate to crystal morphology and mechanical response in wax–oil mixtures [
78]. Blake and Marangoni found that faster cooling produced shorter crystals and modified network architecture and oil-binding capacity [
79]. These findings explain why matching final fill temperature without reproducing the full cooling trajectory may not reproduce stick structure.
The oil phase also changes crystal growth, network plasticity, pigment wetting, lubrication, and deposit formation. Mixed waxes may crystallize sequentially or provide heterogeneous nucleation sites, while polymers and organogelators can reinforce, replace, or compete with the wax network. Organogel-based lipstick studies demonstrate that alternative low-molecular-weight gelators can substantially change thermal transitions, bending strength, rheology, sensory properties, and photoprotective performance [
80]. Such alternatives may support sustainability goals, but they must be assessed for syneresis, oil migration, sweating, brittleness, compatibility, and long-term polymorphic evolution.
Gautier and co-workers characterized commercial lipsticks using compression, linear and nonlinear oscillatory rheology, creep, polarized imaging, and thermal sweeps, revealing distinct mechanical textures, nonlinear strain stiffening, shear thinning, breakdown, and multiple relaxation regimes [
32]. A robust hot-pour protocol should therefore combine molten flow; controlled heating and cooling rheology; DSC; polarized microscopy or diffraction, where available; creep or nonlinear rheology; and product-relevant hardness, bending, payoff, and package tests. Laboratory cooling should reproduce both vessel and mold or package histories, or the difference should be explicitly reported.
4.9. Section Synthesis: Formulation–Microstructure–Rheology Coupling
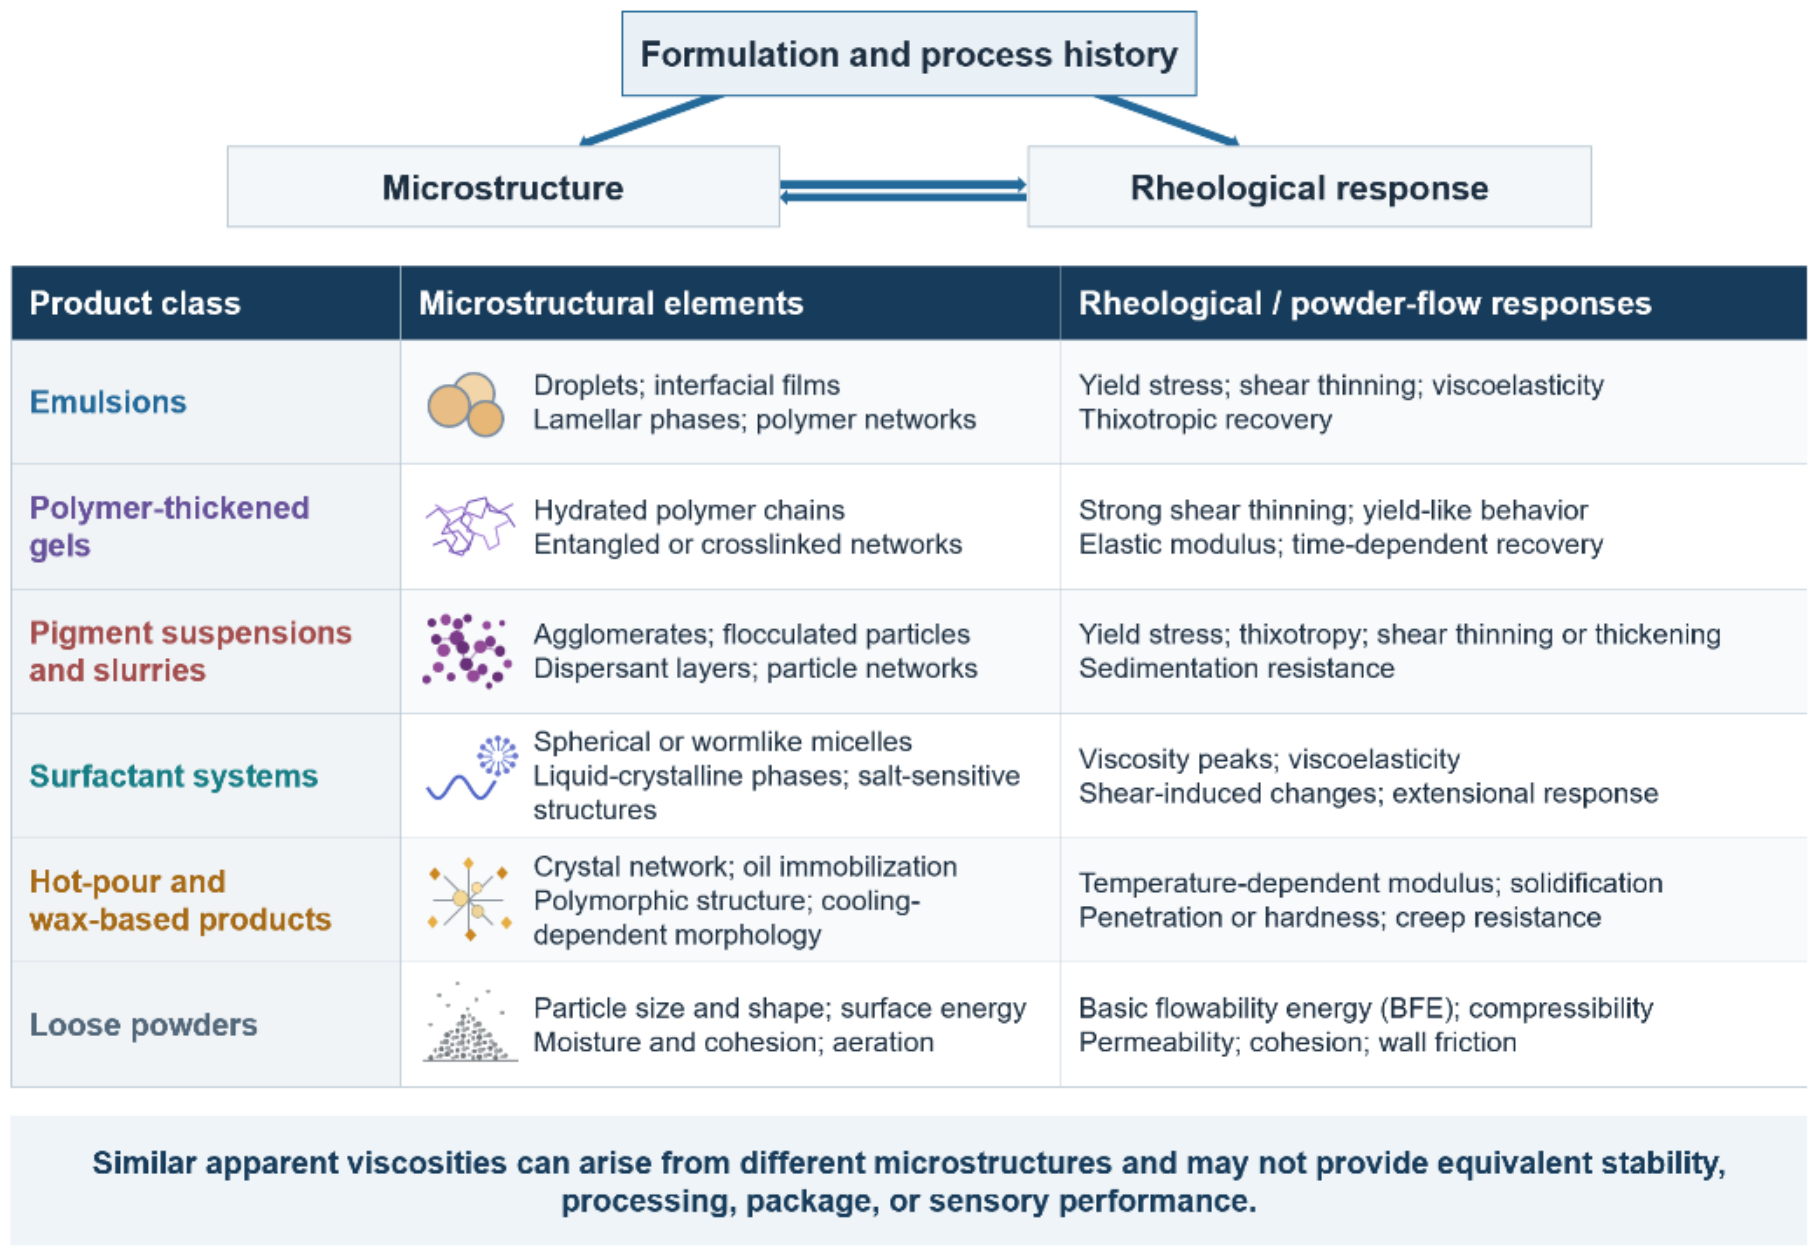
Across emulsions, polymer gels, micellar systems, particle suspensions, slurries, powders, foams, and wax–oil networks, no ingredient maps uniquely to a single rheological parameter. Similar flow curves may arise from very different droplet, polymer, micellar, particle, bubble, or crystal structures. Conversely, the same formulation may develop different rheology when its mixing, thermal, vacuum, storage, or application history changes. Rheological measurements are therefore best read as evidence of a process-defined microstructure, not as a complete structural identification.
For formulation studies, rheology is most informative when paired with the complementary method that is most sensitive to the suspected mechanism: droplet or particle size and microscopy for dispersions; DSC, polarized microscopy, SAXS/WAXS, or diffraction for lamellar and crystalline networks; conductivity and phase mapping for surfactant systems; interfacial rheology or tension for emulsifier films; image analysis and drainage for foams; and density, moisture, or segregation testing for powders. Critical formulation drivers and critical process parameters need to be reported together because composition alone does not define the final cosmetic microstructure.
Figure 3 captures the central formulation principle of this review: similar apparent viscosity values can arise from different microstructures and therefore may not provide equivalent processing, stability, package, or sensory performance.
5. Rheology by Cosmetic Product Category
Product-category rheology is best organized around the sequence of events a formulation must withstand: storage, package withdrawal, dispensing, application, film formation, wear, shelf life, and removal. A microstructural feature that is useful in one format may be undesirable in another. Rapid structural recovery, for example, can reduce serum runoff but preserve brush marks in a foundation, while high extensional elasticity may support mascara fiber formation yet cause stringing in a pump lotion.
Section 4 explained how formulation composition, processing history, and structural organization generate the rheological behavior of emulsions, polymer gels, surfactant systems, suspensions, powders, foams, and wax-based materials. Building on that mechanistic foundation, the present section translates rheological behavior into product-specific performance requirements, package interactions, credible failure modes, and minimum fit-for-purpose test packages. Microstructural mechanisms are revisited only when they are needed to explain a product-specific design decision;
Section 11 addresses the broader relationships among rheology, sensory perception, package performance, and consumer outcomes.
5.1. Skin-Care Creams, Lotions, and Body Moisturizers
Creams and lotions must remain physically stable at low stress, circulate and fill at manufacturing shear, leave the package reproducibly, spread under rapidly increasing deformation, and evolve into an acceptable residual film. Jar products additionally require controlled finger pickup and shape retention, whereas pump lotions require low enough process-range viscosity for priming and evacuation. Yield stress, low-shear viscosity, G′ and G’’, recovery kinetics, and tribology therefore answer different parts of the product journey rather than providing interchangeable measures [
2,
4,
5,
15,
44,
45,
48,
49,
50,
51,
59,
60,
61,
62,
81].
Instrumental-sensory studies consistently show that no single parameter predicts the complete cream experience. Thickening-agent studies link rheology and texture with firmness, adhesiveness, cohesiveness, and spreadability, but the strength and direction of correlations depend on formulation platform and test protocol [
62,
82,
83]. Pickering emulsions can differ from conventional emulsions in droplet organization, rheology, application texture, and residual-film behavior [
84]. A minimum development package should therefore combine a flow curve, operational yield or creep, SAOS, process-relevant recovery, texture or spreading measurements, and tribology when afterfeel is critical. Package evacuation and controlled-dose application should be tested directly.
5.2. Serums, Hydrogels, and High-Alcohol Gels
Serums and gels are often expected to dispense cleanly, resist immediate runoff, spread with little force, break rapidly during rubbing, and leave minimal tack or stringiness. These requirements separate low-shear structure from high-shear and extensional behavior. A microgel can provide a finite operational yield stress and clean filament breakup, whereas a linear polymer may provide similar low-shear viscosity but longer filaments and a stickier perception [
10,
16,
18,
19,
38,
40,
42,
43,
63].
The design principles demonstrated for thickened alcohol-based hand rubs are transferable to light cosmetic gels: low runoff requires sufficient yield structure or low-shear viscosity; spreadability requires strong shear thinning at application rates; and non-stickiness requires to be controlled extensional relaxation [
85]. Accordingly, a serum or gel should not be qualified by one rotational-viscosity value. Flow curves, creep or yield testing, 3ITT, filament breakup, controlled drop or pump imaging, and evaporation or drying studies are more informative. Volatile or high-alcohol products also require solvent protection during rheometry and testing over the actual use-temperature range.
5.3. Shampoos, Body Washes, and Facial Cleansers
Cleansing products must balance bottle or pump delivery, visual body, fragrance and salt tolerance, foam generation, dilution during use, lubrication during rubbing, and rapid rinsing. Products structured by wormlike micelles may exhibit long relaxation times, elasticity, normal stresses, and stringiness that are not evident from one viscosity reading. Products thickened mainly by polymers can have similar apparent viscosity but different dilution, recovery, deposition, and foam behavior [
1,
64,
65,
66].
The minimum test package should include a salt, temperature, and dilution series rather than characterization of the neat product alone. Flow curves and frequency or relaxation measurements describe bulk delivery; filament or extensional tests describe pouring and stringing; and foam expansion, drainage, bubble-size evolution, and collapse describe the aerated state [
1,
40,
76,
77]. Package geometry and cap or pump design must also be considered because a rheologically acceptable cleanser can still show poor bottle evacuation, messy cutoff, or uncontrolled dose.
5.4. Sunscreens and Photoprotective Suspensions
Sunscreens combine unusually demanding requirements: inorganic UV-filter systems are dispersions that must remain uniform during storage, whereas organic UV-filter systems are typically solutions; in both cases, the product must spread into a continuous film at a controlled dose, and the residual layer must retain coverage after drying and wear. Mineral systems add risks of settling, agglomeration, whitening, drag, and nonuniform distribution, while organic-filter systems may undergo solvent loss, crystallization, or major changes in continuous-phase viscosity. Yield stress and low-shear structure are relevant to suspension, but they do not independently establish film uniformity or protection [
53,
67,
68].
Gaspar and Maia Campos demonstrated that vehicle rheology can influence sunscreen film thickness, uniformity, and measured SPF [
68]. More recent work combines texture, rheology, and tribology to predict sunscreen sensory attributes, confirming that application and dry-down require a multimetric approach [
53]. The minimum package should include low-shear/yield testing, process-range flow, recovery, particle or droplet size, controlled spreading at the intended dose, film imaging or thickness assessment, and tribology during drying. Pilling and compatibility with underlying skincare or overlying makeup should be tested using standardized layer sequence and waiting time [
54].
5.5. Foundations and Concealers
Liquid and cream complexion products must suspend pigments, maintain shade uniformity, pass through pumps or applicators, spread without excessive drag, level without streaking, and rebuild sufficiently to limit runoff or particle migration. Coverage depends not only on pigment concentration but also on wetting, agglomerate breakdown, particle packing, film thickness, and the balance between breakdown and recovery. A highly elastic or rapidly rebuilding foundation can preserve brush or finger marks, whereas an inadequate low-shear structure can cause settling and nonuniform dosing [
67,
68,
69,
70,
71].
A defensible test package combines a flow curve, operational yield or creep, 3ITT, particle-size or grind assessment, microscopy, controlled application imaging, and color or coverage measurements. Friction and powder-particle properties become increasingly important during dry-down; suspensions of cosmetic powders show that particle identity and friction can change perceived smoothness, greasiness, slipperiness, and residual coating [
86]. Direct peer-reviewed studies connecting foundation rheology with full wear performance remain comparatively limited, so claims about coverage, transfer resistance, or shade uniformity should be supported by product-specific application tests rather than be inferred from viscosity alone.
5.6. Mascara, Liquid Eyeliner, and Brow Products
Mascara and liquid eyeliner couple formulation rheology with the applicator, wiper, fiber or brush geometry, and rapidly evolving film. The formulation must load the applicator, pass through the wiper, deposit on hair or skin, form a controlled filament or cutoff, resist clumping and sagging, and dry into a coherent film. Washable mascaras are often formulated as structured wax emulsions, tubing mascaras typically rely on polymer-based emulsion systems, whereas waterproof mascaras may be anhydrous or solvent-rich. Yield behavior, recovery, extensional response, adhesion, drying, and wax transitions are all relevant, but no single test represents the complete brush-wiper-lash sequence.
A thermoresponsive-polymer mascara study demonstrates that formulation design can be linked directly to curl retention and application performance rather than only bulk viscosity [
87]. Thermal analysis of commercial mascaras also indicates that incompatible or heat-sensitive wax combinations can accompany phase separation during accelerated storage [
88]. Development should combine flow and yield measurements, 3ITT after a wiper- or filling-relevant shear history, filament or tack testing, DSC for wax-rich systems, controlled applicator withdrawal, false-lash or substrate deposition, drying time, and wear or removal testing. The published rheological evidence for eyeliners and brow products is sparse; this should be identified as a research gap rather than filled with unverified analogies.
5.7. Lip Glosses, Liquid Lip Products, Lipsticks, and Balms
Lip products span low-wax glosses, pigmented liquid films, soft balms, and highly structured hot-pour sticks. Glosses and liquid lip products require controlled applicator loading, cushion, tack, shine, clean filament breakup, and resistance to migration. Shear viscosity alone may be misleading because products with similar flow curves can differ in extensional relaxation, probe tack, adhesion, and stringiness [
5,
39,
40,
42,
43]. Volatile liquid lip systems additionally evolve during drying, so rheology should be paired with mass loss, film formation, transfer, and flexibility.
Lipsticks and balms require a different test hierarchy. Molten flow determines mixing and filling, while cooling and crystallization determine hardness, creep, breakage, sweating, payoff, and application drag. Thermal history, wax-oil compatibility, crystal morphology, and organogel structure must therefore be combined with product-scale mechanical tests [
32,
78,
79,
80]. A minimum package includes molten viscosity, controlled heating/cooling rheology, DSC, microscopy, creep or nonlinear rheology, penetration or bending, and controlled payoff. Results from remelted rheometer samples cannot be assumed to represent sticks cooled in their production package. Needle-penetration methods adapted from wax testing can provide a complementary, method-defined index of finished-stick consistency when their relevance is validated for the cosmetic matrix [
89].
5.8. Nail Lacquers and Brush-Applied Films
Nail lacquers must suspend pigments and effect materials during storage; load and release from the brush; level after each stroke; resist sagging or edge pooling; and dry into a continuous film. These functions require a balance among low-shear structure, high-shear brushability, thixotropic recovery, surface tension, solvent evaporation, and extensional breakup. Excessive recovery can preserve brush marks, while slow recovery can promote settling, flooding, or uneven edges.
Jimenez et al. showed that commercial nail lacquers exhibit complex shear and capillary-pinching behavior and that extensional measurements provide information not available from shear rheology alone [
41]. Product development should combine flow and recovery tests with filament breakup, surface tension, controlled brush application, leveling and sag imaging, drying time, film thickness, gloss, adhesion, and wear. Volatile loss during rheometry must be controlled because even small solvent changes can alter both viscosity and drying.
5.9. Foams, Mousses, and Aerated Dispensing Formats
Foam and mousse performance are governed by both the precursor liquid and the generated gas–liquid structure. The liquid must flow through the valve or pump and generate a reproducible expansion ratio, while the foam must provide the required shape retention, drainage resistance, spreading, lubrication, and collapse or rinse profile. Bulk viscosity of the unfoamed liquid is, therefore, necessary but insufficient.
Oscillatory foam studies show that surfactant chemistry, liquid fraction, sample age, and protocol materially change the measured response [
76,
77]. A minimum product test should include package output and density, bubble size, expansion ratio, drainage, foam-height decay, small-deformation elasticity or yield response, spreading and collapse under application, and testing at defined sample age. Shaving foams, cleansing foams, and hair mousses should not share one specification because their required persistence and lubrication are different.
5.10. Loose Powders, Wet-Powder Hybrids, and Pigment Concentrates
Loose powders require reproducible preblending, transfer, sifter or orifice discharge, package filling, pickup, and deposition. Flowability, cohesion, aeration, density, compressibility, moisture sensitivity, and segregation should be interpreted against the actual operation rather than condensed into one universal ranking [
72,
73,
74,
75]. Product-use performance also depends on friction, particle shape, surface treatment, oil content, and interaction with the applicator or skin [
86].
Hybrid or oil-treated powders lie between dry granular materials and compactable wet powders. Recent constant-volume shear-cell work on sericite-oil mixtures demonstrated that stress relaxation, adhesion, and frictional descriptors can distinguish tactile properties associated with different oils [
90]. Wet slurries and pigment concentrates should remain within the suspension-rheology framework described in
Section 4.5 and
Section 6.1; their key tests are process-range flow, yield or creep, recovery, particle dispersion, sedimentation, and controlled let-down. Detailed pressed-powder compaction remains outside the scope of this paper.
Table 5 consolidates the minimum rheological requirements and complementary evidence for the major product categories discussed in this section.
5.11. Section Synthesis and Evidence Limitations
Product-category rheology is best treated as a minimum test package linked to a package and application sequence, not as a search for one universal target value. The most informative descriptors change with the dominant failure mode: low-shear structure for settling or runoff; process-range flow for pumping and filling; recovery for leveling and post-dispense rebuilding; extensional response for stringing and cutoff; thermal rheology for wax-rich products; foam aging for aerated formats; and friction or adhesion for residual films.
The evidence base is uneven. Creams, lotions, topical gels, sunscreens, and instrumental sensory prediction are supported by a comparatively mature literature [
2,
4,
5,
15,
44,
45,
48,
49,
50,
51,
53,
62,
68,
81,
82,
83,
84]. Direct peer-reviewed rheology studies remain limited for concealers, eyeliners, brow products, liquid lip products, and full package-applicator interactions. These gaps should be stated explicitly. Transferable evidence may guide test selection, but product-specific claims about wear, coverage, curl, transfer resistance, or consumer preference should require direct performance measurements and independent validation.
6. Rheology During Industrial Manufacturing
6.1. Manufacturing Logic, Unit-Operation Mapping, and Hold-Time Control
Cosmetic manufacture should be interpreted as a sequence of structure-changing unit operations rather than as one undifferentiated mixing step. Raw-material charging, wetting, hydration, phase combination, homogenization, milling, grinding, neutralization, cooling, deaeration, transfer, filtration, filling, and post-fill conditioning each create a distinct deformation, temperature, composition, and residence-time history. The relevant question is therefore not simply whether the final viscosity meets specification but whether each operation has achieved its intended endpoint without creating irreversible damage that becomes visible only later in filling, stability, shelf life, or consumer use.
For each unit operation, the development record should identify the critical material attributes, the critical process parameters, the expected microstructural transformation, and the measurable endpoint. Examples include disappearance of dry agglomerates during wetting, completion of polymer hydration, achievement of a target droplet-size distribution after homogenization, density reduction during deaeration, onset of lamellar or wax-network development during cooling, and recovery of structure before filling. A rheological fingerprint is most useful when it is linked to these process events and to complementary evidence such as pH, temperature, torque, density, microscopy, particle or droplet size, and thermal analysis.
Order of addition and bulk hold time are often treated as procedural details, but both can be critical process variables. The transferable semisolid-manufacturing literature recognizes order of addition, homogenization, and aging before packaging as factors that can alter product structure and performance [
91,
92,
93,
94]. Holding can permit hydration, emulsifier-film reorganization, lamellar maturation, crystallization, air release, or sedimentation. As a result, a sample taken immediately after mixing may not represent the material delivered to the filler several hours later.
6.2. Raw-Material Charging, Wetting, Polymer Hydration, and Neutralization
Surface incorporation, particle wetting, agglomerate breakup, molecular hydration, and chemical neutralization are different objectives and should not be collapsed into one ‘powder-addition’ step. The process is governed by the liquid depth and viscosity, impeller submergence and pumping pattern, powder-addition point and rate, surface vortex, temperature, vacuum, and the presence of surfactants, electrolytes, alcohols, oils, or preservatives. Rapid addition can create floating rafts, dusting, fisheyes, trapped dry cores, and air entrainment; excessively slow addition can extend cycle time and expose partially hydrated polymers to damaging shear.
Polymer hydration is especially sensitive to sequence and local composition. Carbomers require adequate dispersion before neutralization, while cellulose derivatives, gums, starches, and associative polymers may hydrate differently in water, electrolyte, surfactant, or polyol-rich phases. A bulk pH value can give a false sense of completion when neutralizer has entered a poorly circulated zone or when swollen agglomerates shield unhydrated material. High shear may remove lumps during early dispersion but can reduce molecular weight, rupture a developed microgel network, or change air content after hydration [
16,
63,
64].
A manufacturing endpoint should therefore combine appearance and microscopy with pH or conductivity mapping, temperature, density, and time-dependent rheology. Short time sweeps or repeated viscosity and SAOS measurements can distinguish continuing hydration from simple cooling or deaeration. Sampling should include regions that are most likely to be poorly circulated, rather than relying only on one convenient vessel sample. The validated process should define when high shear is beneficial, when it must be reduced, and how long the system must equilibrate before the next ingredient or phase is added.
6.3. Dry-Powder Handling, Pigment Slurries, Milling, and Let-Down
Dry powders and preblends can segregate by particle size, density, shape, or surface treatment during transport and charging. Cohesive arching, rat-holing, flooding after aeration, electrostatic adhesion, dust generation, and humidity-induced caking can produce nonuniform addition and local composition errors. Powder characterization should reproduce the consolidation, aeration, and moisture state created by storage and feeding; no single angle-of-repose or density value represents every handling operation [
72,
73,
74,
75]. Continuous semisolid manufacturing research further shows that powder feeding and residence-time distribution can be quantified and linked to downstream dispersion, providing a useful framework for controlled addition [
95].
Wet-slurry manufacture should be divided into carrier selection, wetting, dispersant adsorption, deagglomeration or milling, storage, transfer, and final let-down. Solids loading, particle packing, dispersant concentration, carrier viscosity, milling energy, temperature, residence time, and air content jointly control the process window. The viscosity minimum observed during dispersant optimization should not be treated automatically as the optimum formulation: very low slurry viscosity may improve milling but reduce storage stability or alter the structure of the final product [
67,
68,
69,
70,
71].
A stable concentrate can reflocculate when introduced into a final oil, polymer, surfactant, electrolyte, or emulsion matrix. Controlled let-down testing is therefore essential. Recommended checkpoints include flow curves, operational yield or creep, 3ITT, density, particle-size or grind assessment, microscopy, sedimentation, color strength or UV performance, mill pressure or energy, and sampling at defined times after processing. Samples collected before milling, after milling, after storage, and after let-down should be compared to distinguish deagglomeration from temporary shear breakdown or delayed reflocculation.
6.4. Emulsification and Homogenization
Emulsification requires both local stress sufficient to deform and break droplets and bulk circulation sufficient to expose the complete batch to the high-shear zone. Rotor–stator geometry, size, rotor speed, gap, flow rate, viscosity ratio, phase fraction, phase addition rate, interfacial tension, surfactant adsorption kinetics, phase-addition rate, and temperature determine the balance among droplet breakup, coalescence, and circulation. Direct cosmetic studies show that impeller tip velocity and pumping capacity are complementary variables rather than interchangeable scale-up rules [
14].
Rotor–stator studies demonstrate that droplet breakup depends on local device conditions and that batch, recycle, and continuous operation create different residence-time and pass-number histories [
96,
97,
98]. An endpoint based only on homogenization time or rotational speed is therefore weak. The same nominal time may expose nearly the whole bench batch to repeated passes but only a fraction of a large batch. Conversely, additional passes can become unproductive or harmful when surfactant adsorption cannot keep pace with newly created interface, when temperature rises, when a shear-sensitive polymer is damaged, or when fragile pearlescent particles are fractured.
Droplet-size distribution should be interpreted together with rheology, microscopy, temperature, power or torque, and sampling location. A smaller mean diameter does not prove a narrower distribution or better product, and a single mean can hide a bimodal population caused by incomplete circulation. Process development should define a droplet-size range and rheological endpoint or acceptable energy window, then verify whether further processing changes stability, texture, recovery, air content, or sensory performance.
Section 7 addresses scale-up criteria in greater detail; the role of
Section 6 is to define what transformation the homogenization step must achieve.
6.5. Air Entrainment, Foam Control, and Vacuum Deaeration
Entrained air changes apparent density, optical appearance, fill weight, pump response, oxidation exposure, heat transfer, and rheological measurement. Its effect on apparent viscosity or elasticity depends on gas fraction, bubble size and deformability, capillary pressure, continuous-phase rheology, and measurement geometry. Fundamental studies of bubbly shear-thinning liquids show that bubbles can alter both shear and extensional response rather than acting only as an inert density correction [
99,
100].
Air can enter during powder addition, vortexing, rotor–stator processing, recirculation, scraping, or transfer through leaky connections. Vacuum is therefore one part of an air-management strategy, not a universal correction applied at the end. Vacuum applied too early can promote foaming, pull powder into the headspace, or remove volatile ingredients; applied too late, it may be unable to release small bubbles trapped in a high-yield or rapidly crystallizing matrix. Degassing of shear-thinning viscoelastic liquids can occur through intermittent bubble cascades, illustrating why pressure level, hold time, surface renewal, and material structure matter [
101].
The process should compare density, visual or microscopic air content, vessel level, and rheological fingerprints before and after vacuum at defined temperature and sampling time. The vacuum endpoint should be based on a stable density or air-content window and acceptable volatile loss, not simply a fixed duration. Sampling immediately after vacuum release, after recirculation, and at the filler can reveal whether air has re-entered the product.
6.6. Heating, Cooling, Crystallization, and Bulk Maturation
Temperature changes viscosity directly and can also alter structure irreversibly through phase transition, emulsifier organization, polymer solubility, solvent loss, wax crystallization, and particle or droplet interactions. Phase temperatures should be selected to ensure complete melting or dissolution without unnecessary thermal exposure. Premature cooling during phase combination can create local crystallization, incomplete emulsification, wall deposits, or nonuniform lamellar structures.
During cooling, the wall-to-bulk temperature difference, heat-transfer area, scraper operation, agitation intensity, hold points, and time spent within the structure-forming temperature range govern the final network. Cosmetic and transferable semisolid studies show that cooling rate, holding temperature, and shear during cooling can alter microstructure, rheology, stability, and sensorial properties [
32,
78,
79,
80,
91,
92,
93]. In one emulsion-cream study, a defined hold during cooling improved stability, whereas additional shear during the hold could disrupt the developing structure depending on temperature [
92].
Manufacturing studies of topical semisolids reinforce this coupling. Chow et al. showed that process sequence and operating conditions altered ointment microstructure, stability, and sensory properties [
91]. In an emulsion cream, a controlled hold during cooling improved stability, whereas added shear during the hold could disrupt the developing structure depending on temperature [
92]. Yang et al. likewise showed that processing conditions and stabilizer selection jointly affected emulsion microstructure, stability, and rheology [
93].
Rheological temperature and time sweeps should be aligned with production thermocouple profiles, DSC, microscopy, density, and package or mold temperature. Laboratory cooling history must be reported because a small rheometer sample may cool much faster than a vessel but more slowly than a thin package wall. Bulk maturation may continue after the nominal final temperature is reached; viscosity, modulus, yield behavior, and hardness should therefore be followed through the actual vessel hold and post-fill conditioning period.
6.7. Transfer, Recirculation, Pumping, Heat Exchange, and Filtration
After batching, the product may pass through pumps, pipelines, valves, elbows, heat exchangers, filters, manifolds, and recirculation loops. These operations impose a distribution of shear rates, residence times, pressure gradients, extensional events, and temperatures. A kettle sample can therefore differ legitimately from a sample at the filler. Yield-stress and thixotropic products may undergo plug-like flow, wall slip, start-up pressure transients, and incomplete structural recovery, while recirculation can repeatedly expose only part of the batch to high stress.
Process-range rheology, rather than a single release viscosity, should guide pump selection and the operating point. Positive-displacement pumps, centrifugal pumps, lobe pumps, and diaphragm systems impose different shear and pulsation histories. Viscous dissipation or a warm transfer line can reduce viscosity temporarily, whereas a cold line or heat exchanger can initiate lamellar or wax crystallization. Pressure, flow rate, inlet and outlet temperature, pump speed, and residence time should be recorded together with before-and-after rheological fingerprints.
Filtration can remove agglomerates while simultaneously acts as safeguard to retain foreign matter, but it can also disrupt a weak network, retain functional particles, deaerate the product, or create a pressure-dependent filter cake. Pressure drop should be interpreted with flow rate, filter area and pore size, temperature, and product history. When transfer or filtration changes rheology, complementary density, particle or droplet size, microscopy, and air-content measurements are needed to distinguish shear breakdown from particle removal, cooling, heating, or deaeration.
6.8. Filling, Nozzle Behavior, and Package Deposition
Filling is a coupled shear, extension, free-surface, and recovery event. Product accelerates through valves and nozzles, stretches during cutoff, impacts the package, and then levels or rebuilds. Dripping, stringing, tailing, splashing, air pockets, poor leveling, surface peaks, and fill-weight variation cannot be predicted reliably from one apparent-viscosity value. High-shear viscosity affects nozzle flow, while yield behavior and recovery influence leveling and shape retention; extensional response and surface tension influence filament breakup [
40,
41,
42,
43].
The relevant variables include nozzle diameter and length, valve and suck-back design, fill speed and acceleration, cutoff timing, product temperature, head pressure, distance to the package, package geometry, and waiting time before the next operation. A formulation that fills cleanly at one temperature may tail or trap air after cooling, and a product that levels well in a wide jar may retain peaks in a narrow container.
Development should combine process-range flow and recovery testing with controlled dispensing or high-speed imaging, filament breakup, fill-weight statistics, package-surface inspection, and air assessment. The laboratory simulation should reproduce the estimated nozzle design and shear and the available recovery time. Final acceptance should be based on the formulation–filler–package system rather than on rheology alone.
6.9. Sampling Strategy, Bulk Hold, and Post-Fill Conditioning
Sampling is part of the manufacturing experiment. Top, middle, and bottom vessel samples, recirculation-loop samples, pre-filter and post-filter samples, and filler samples can differ because of thermal gradients, air content, particle distribution, wall buildup, incomplete circulation, or shear history. The sampling device and container can also preshear, cool, evaporate, or deaerate the material. Sample location, time, temperature, age, transport, and conditioning should therefore be predefined.
Bulk hold time can increase or decrease apparent viscosity and modulus through polymer hydration, lamellar maturation, crystallization, reflocculation, sedimentation, air release, evaporation, or chemical change. A release test performed only on the end-of-batch sample may miss drift during the production filling window. Hold-time studies should bracket the expected manufacturing delay and compare rheology, density, pH, microscopy, particle or droplet size, and package appearance.
Post-fill conditioning is especially important for emulsions and hot-pour products because package geometry changes cooling and surface-to-volume ratio. Finished units should be tested after defined conditioning times rather than immediately after filling only. Retained bulk and packaged samples should be compared to identify whether the observed change occurred in the vessel, during transfer, at the nozzle, or during package cooling and maturation.
6.10. Section Synthesis: Manufacturing Control Strategy
A robust manufacturing strategy does not aim for maximum shear, minimum viscosity, or one universal rheological endpoint. Instead, it defines an acceptable process window for each structure-changing operation and uses rheology together with complementary measurements to confirm that the intended transformation has occurred. The strongest evidence comes from paired samples collected immediately before and after a unit operation, followed by testing after the actual hold and conditioning periods.
Full-scale studies of cosmetic manufacturing remain limited. Pharmaceutical semisolid, food, and fundamental soft-material studies remain useful for understanding mechanisms and designing methods, but their operating conditions should not be treated as cosmetic specifications [
91,
92,
93,
94,
95,
96,
97,
98,
99,
100,
101]. A final industrial control plan should connect raw-material state, order of addition, shear and thermal history, vacuum, residence time, sampling location, and package conditions with the rheological fingerprint and the relevant quality or consumer outcome.
Table 6 and
Figure 4 translate this discussion into a unit-operation control plan in which each process step has a defined risk, checkpoint, and material-state endpoint for the next operation.
Figure 4 and
Table 6 serve different functions.
Figure 4 presents sequence and checkpoint location and therefore answers where and when measurements occur.
Table 6 is the corresponding stage-by-stage risk register and answers what can fail, what should be measured, and how the result should be interpreted. They are retained as complementary process map and risk matrix views.
7. Rheology-Based Scale-Up
7.1. Scale-Up as Matching Dominant Mechanisms
Scale-up is not the enlargement of a successful laboratory recipe by a volume factor. Increasing vessel size changes surface-to-volume ratio, liquid depth, hydrostatic pressure, impeller-to-tank geometry, local shear distribution, circulation time, heat-transfer area, addition time, rotor-stator pass frequency, vacuum response, and cooling history. These changes occur simultaneously, and geometric similarity cannot preserve tip speed, power per volume, Reynolds number, blend time, interfacial stress, and thermal history at the same time. The appropriate scale-up rule must therefore be chosen from the mechanism that controls the critical product attribute [
12,
13,
14,
91,
92,
93,
96,
97,
98].
A cosmetic process normally contains several mechanisms that require different similarity criteria. Bulk blending and polymer hydration depend mainly on circulation and the elimination of poorly mixed regions. Pigment deagglomeration and emulsification depend on local stress, energy dissipation, and repeated exposure to the high-shear zone. Suspension and powder addition depend on solids distribution, wetting, feed rate, and local liquid motion. Cooling and crystallization depend on wall-to-bulk heat transfer and time within the structure-forming temperature range. Vacuum deaeration depends on surface renewal, gas disengagement, pressure history, and product yield structure. A defensible scale-up strategy should therefore be operation-specific rather than based on one plant-wide constant.
The rheology used for scale-up must also represent the process state. A formulation may move from a low-viscosity phase mixture to a concentrated emulsion, hydrated polymer network, yield-stress suspension, or crystallizing wax system during the batch. Using final-product viscosity to calculate early-stage mixing conditions can be as misleading as using the low-viscosity initial phase to represent the finished batch. Process calculations should use temperature- and time-appropriate rheological data and should be updated when the material crosses a major structural transition.
7.2. Rheology-Aware Similarity Variables and Dimensionless Groups
Common scale-up variables characterize different aspects of mixing performance and should not be interpreted as interchangeable. The impeller tip speed is defined as
where
N is the impeller rotational speed and
D is the impeller diameter. The power input per unit volume,
, characterizes the average rate of energy dissipation within the vessel. The specific energy input is given by
where
is the specific energy input,
is the instantaneous power consumption,
m is the batch mass, and
and
are the initial and final processing times, respectively. For constant power input, Equation (
2) reduces to
where
is the processing duration.
The pumping capacity of an impeller can be represented by the dimensionless flow number,
where
Q is the volumetric flow rate generated by the impeller. A characteristic circulation time may then be estimated as
where
V is the working fluid volume. These quantities describe different physical processes and should not be treated as equivalent. For example, a high-flow, low-shear impeller and a low-flow, high-shear device may consume similar amounts of power while producing substantially different circulation patterns and local deformation rates.
For shear-thinning fluids, Metzner and Otto proposed an effective shear rate of the form
where
is the Metzner–Otto constant [
102]. The apparent viscosity evaluated at this effective shear rate can be used to define a generalized Reynolds number:
where
is the fluid density and
is the apparent viscosity evaluated at the effective shear rate. The corresponding power number is
The Metzner–Otto approach remains useful for engineering correlations; however,
depends on the impeller geometry, measurement method, and rheological regime. Moreover, a single vessel-averaged effective shear rate cannot reproduce the broad spatial distribution of local shear rates. Direct velocity measurements in Carbopol systems have shown that local and average shear fields can differ considerably from predictions based on simple effective-shear-rate assumptions [
103]. Studies involving anchor and close-clearance impellers similarly indicate that the Metzner–Otto constant should be validated for the specific impeller geometry and rheological regime under consideration [
104,
105].
For systems involving droplet, bubble, or particle deformation, the Weber number compares inertial stresses with interfacial stresses and may be written as
where
is the interfacial tension. The capillary number compares viscous stresses with interfacial stresses:
where
is the viscosity of the continuous phase,
is a characteristic local shear rate, and
L is a characteristic length scale.
The applicability of these dimensionless groups depends on selecting physically defensible characteristic stresses, length scales, shear rates, and energy-dissipation rates. In highly localized devices such as rotor–stator mixers, tank-scale quantities based on N and D may not adequately represent the stresses experienced within the rotor–stator gap. Dimensionless similarity is therefore most credible when supported by measured power consumption, pumping capacity, residence-time distribution, local flow characteristics, and product-structure data rather than by nominal equipment dimensions alone.
7.3. Bulk Mixing, Circulation, and Yield-Stress Flow
Many cosmetic creams, gels, suspensions, and wax-rich intermediates are processed in the laminar or transitional regime and may exhibit yield stress. In these systems, increasing speed does not necessarily produce whole-vessel motion. A well-mixed region or cavern can form around the impeller while quiescent material remains near the wall, surface, or vessel bottom. The risk increases when the central impeller produces intense local motion but limited axial pumping, when the batch height increases, or when viscosity rises during hydration or cooling.
Close-clearance anchors, helical ribbons, multi-impeller systems, and coaxial mixers are used to combine wall renewal and bulk circulation with localized dispersion. Power consumption, mixing time, cavern size, and the balance between central-impeller and anchor speeds depend strongly on yield stress, consistency index, flow index, geometry, and speed ratio [
104,
106,
107]. Studies of Herschel–Bulkley fluids demonstrate that rheological parameters can materially change both power draw and mixing efficiency, supporting the use of formulation-specific rather than water-based scale-up correlations [
106].
Blend time and circulation time should be distinguished. A tracer-based blend time measures macromixing under a specified detection criterion, whereas
estimates nominal vessel turnover. In continuous or strongly recirculated systems, the mean residence time must be sufficiently long relative to the batch mixing time; experiments with non-Newtonian fluids showed increasing non-ideal mixing when the residence-time-to-blend-time ratio became too small [
108]. For cosmetics, this principle applies to inline addition, recirculating homogenization, continuous powder feeding, and transfer loops even when the process is nominally a batch.
7.4. Rotor–Stator Homogenization and High-Shear Dispersion
Rotor–stator scale-up requires separate treatment of power, pumping, exposure frequency, rotor–stator design, and local gap conditions. Part 1 of the Silverson scale-up studies established scale-dependent power constants, including laminar power, Metzner-Otto, and turbulent power behavior [
109]. Part 2 showed that mixing time, surface aeration, and equilibrium droplet size did not follow one universal rule and depended on both power and circulation [
98]. These findings are consistent with direct cosmetic evidence that tip velocity and pumping capacity are complementary variables during emulsification [
14].
Batch and inline devices can deliver similar nominal power but different residence-time and pass-number distributions. A batch rotor–stator continually draws material from the vessel, so the whole-batch result depends on the head pumping rate, tank circulation, and probability of repeated passage. An inline device imposes a more defined single-pass or recycle exposure but introduces flow-rate dependence, pressure drop, and bypass or recirculation design. Continuous, recycle, and batch studies demonstrate that emulsification kinetics and final droplet size depend on operating mode and exposure history [
96,
97].
A practical scale-up record should include rotor and stator geometry, diameter ratio (rotor–stator/total kettle), gap, rotational speed, estimated or measured power, head flow rate, batch volume, number of nominal turnovers or passes, phase-addition time, temperature rise, and product viscosity during processing. Constant rotor speed or constant tip speed alone is rarely sufficient. An endpoint based on droplet-size distribution, microscopy, rheology, and recovery is more defensible than a fixed homogenization time.
7.5. Droplet Breakup, Coalescence, and Interfacial Time Scales
Emulsion scale-up is controlled by both breakup and coalescence. Davies related practical emulsion drop sizes to turbulent energy-dissipation rates and emphasized the importance of intense local dissipation rather than only vessel-average power [
110]. Zhou and Kresta later showed that mean drop size was better correlated when maximum local energy dissipation and bulk flow were considered together [
111]. Thus, equal P/V at two scales does not guarantee equal droplet-size distribution when impeller geometry, local dissipation, pumping, or phase distribution changes.
Interfacial tension measured at equilibrium may also be insufficient during rapid homogenization. A newly created interface must be covered by emulsifier before recoalescence occurs, and the adsorption time may be comparable with or longer than the droplet-deformation event. Hakansson and Nilsson showed that finite emulsifier adsorption kinetics can delay deformation and alter the breakup pathway under turbulent conditions [
112]. Phase-addition rate, emulsifier phase location, temperature, and pre-emulsification, therefore, affect scale-up even when the final composition is identical.
The scale-up target should normally include the full droplet-size distribution, not only the mean. Broad or bimodal distributions can indicate incomplete circulation, different pass histories, or competing breakup and coalescence populations. Measurements should be performed at defined times after processing because recoalescence, flocculation, and lamellar maturation can continue after the high-shear step. Rheology and droplet size should be interpreted together, since a polymer or lamellar network may dominate the final modulus even when droplet size changes.
7.6. Thermal History, Cooling, Addition, and Vacuum Scale-Up
Heat-transfer similarity is often more important than mechanical similarity for structured emulsions and hot-pour products. As scale increases, heat-transfer area per unit volume decreases and thermal gradients become larger. The overall cooling time depends on vessel geometry, jacket or coil performance, overall heat-transfer coefficient, heat capacity, agitation, scraper action, and viscosity. Classical non-Newtonian heat-transfer studies show that rheology affects convective heat transfer and that Newtonian correlations cannot be transferred without modification [
113].
For cosmetic products, the critical variable is frequently the time-temperature-shear trajectory through the structure-forming region rather than the final temperature alone. Cooling holds, shear during lamellar development, wall scraping, and package cooling can alter rheology, stability, wax morphology, and sensory performance [
32,
78,
79,
80,
91,
92,
93]. Scale-up should compare the vessel temperature distribution and cooling curve, not just the set point. A laboratory temperature sweep is useful only when its heating and cooling rates are related explicitly to the pilot and production histories.
Addition and vacuum operations also lose similarity with scale. The same absolute powder- or phase-addition time represents a smaller fraction of vessel turnover at large scale and can create local concentration gradients. The addition rate should therefore be related to circulation capacity, wetting rate, or number of turnovers. Vacuum deaeration changes with free-surface area, headspace volume, bubble travel distance, pressure ramp, agitation, and yield structure. Density and air-content endpoints should be compared at scale rather than assuming that equal vacuum pressure and time create equal deaeration.
7.7. Scale-Down Models, Pilot Studies, and Scale-to-Scale Comparability
A useful scale-down model reproduces the dominant stresses and time scales of the manufacturing process; it is not merely a smaller geometrically similar vessel. A bench model may need independent control of bulk circulation, rotor-stator exposure, cooling rate, vacuum, and addition rate to reproduce production behavior. In some cases, one laboratory setup cannot reproduce all mechanisms, and separate scale-down tests are needed for emulsification, thermal structure development, transfer shear, and filling.
Pilot-scale studies should be designed to discriminate among competing scale-up rules. Rather than testing one proposed speed, a structured experiment can vary tip speed, P/V, circulation, energy per mass, and thermal history within safe ranges, then compare the resulting rheology and microstructure. The output should be a multidimensional process window, not a single scale-up factor. The direct cosmetic literature supports multiscale comparison using formulation, processing, droplet size, rheology, texture, and stability together [
12,
13,
14].
Scale-to-scale comparability should include process metadata and standardized product fingerprints. Recommended attributes include viscosity at selected process-relevant shear rates, operational yield behavior, G′ and G″, critical strain, recovery at defined times, density, droplet or particle-size distribution, microscopy, pH, air content, and the complete temperature history. Hot-pour products require thermal transitions and mechanical properties. A golden batch can be used as a reference only after analytical repeatability and normal process variation have been established.
7.8. Scale-Up Decision Framework and Evidence Limitations
A practical scale-up decision sequence begins with the critical quality attribute and the unit operation that creates it. The next step is to identify the controlling mechanism—bulk flow, local stress, interfacial breakup, residence-time distribution, heat transfer, vacuum, or structural recovery—and then select one primary similarity criterion with one or more supporting criteria. Rheological and microstructural comparability provide the final verification. When comparability fails, the response should be a mechanism-based investigation, not an arbitrary change in mixer speed (such as a change in processing parameters).
No dimensionless group or scale-up rule applies universally to cosmetic manufacturing. Tip speed may be appropriate for a local shear-limited step (P/V) for some turbulent operations or circulation time for bulk turnover or for interfacial deformation and matched thermal history for crystallization or lamellar development. Complex products often require a constrained compromise among several criteria. Both the selected scale-up rule and the criteria intentionally not held constant need to be reported transparently.
Direct evidence from full-scale cosmetic manufacturing remains limited, and much of the engineering basis is transferred from liquid–liquid dispersion, non-Newtonian mixing, pharmaceutical semisolids, and other soft-material processes [
91,
92,
93,
94,
96,
97,
98,
99,
100,
101,
102,
103,
104,
105,
106,
107,
108,
109,
110,
111,
112,
113]. This transfer is scientifically appropriate when the underlying mechanisms are comparable, but published operating values should not be adopted as cosmetic specifications without product- and equipment-specific validation. For that reason, the criteria summarized in
Table 7 are best used as decision-support tools rather than universal scale-up rules.
7.9. Scale-Up Verification Package
The minimum verification package should compare the same sampling points and conditioning history at bench, pilot, and production scale. It should include the complete process timeline; equipment geometry; power, speed, flow, addition, vacuum, and temperature records; and a standardized rheological fingerprint. Droplet or particle size, microscopy, density, pH, air content, DSC or hardness, and application-relevant tests should be added according to the product class.
Acceptance ranges should be defined before scale-up trials and should account for analytical uncertainty and normal batch variation. When one attribute fails, the investigation should trace the difference to local stress, circulation, residence time, interfacial kinetics, thermal history, air content, or recovery rather than changing several process variables simultaneously. This strategy turns scale-up from empirical troubleshooting into a testable engineering hypothesis.
Figure 5 summarizes the scale-up decision logic by separating bulk blending, local high-shear dispersion, powder incorporation, thermal structuring, and transfer or filling, each of which requires different similarity criteria and verification measurements.
8. Process Monitoring and Process Analytical Technology
Rheological and microstructural quality is built throughout material charging, hydration, emulsification, dispersion, heating, cooling, deaeration, transfer, and filling. Effective monitoring, therefore, links measurable process conditions to the evolving material state and to the critical quality attributes of the finished product. The discussion in this section considers how process analytical technology, representative sampling, in-line and at-line measurements, soft sensors, multivariate data analysis, and feedback-control strategies can be combined to detect deviations, support endpoint decisions, and improve batch-to-batch consistency. It also addresses practical limitations associated with sensor location, fouling, calibration, sampling delay, data interpretation, and implementation in complex cosmetic processes.
8.1. PAT Scope and Monitoring Hierarchy
Process analytical technology (PAT) is best understood as a framework for process understanding, timely measurement, and control rather than as a particular sensor. The FDA framework emphasizes measurement of critical material and process attributes during manufacture so that quality is built into the process instead of inferred only from end-product testing [
114]. The principles of ICH Q8(R2), Q9(R1), and Q10 similarly connect product development, risk management, control strategy, knowledge management, and continual improvement [
115,
116,
117]. Although these documents were developed for pharmaceuticals, the scientific logic is transferable to industrial cosmetics.
The regulatory status of these concepts must be distinguished from their scientific utility. ICH Q8(R2), Q9(R1), Q10, Q6A, and Q14 and the FDA PAT and pharmaceutical process-validation guidances were developed for medicinal products; they do not create mandatory PAT, real-time-release, pharmaceutical-validation, or ICH filing requirements for cosmetics. Cosmetic compliance instead follows the applicable jurisdictional framework, including Regulation (EC) No. 1223/2009 in the European Union, the U.S. Federal Food, Drug, and Cosmetic Act as amended by the Modernization of Cosmetics Regulation Act of 2022 (MoCRA), and ISO 22716 good-manufacturing-practice guidance [
121,
122,
123]. In this review, pharmaceutical frameworks are cited only where their risk-based concepts are transferable as voluntary industrial practices. Terms such as critical quality attribute, PAT, validation, OOS investigation, and real-time release are therefore adapted quality-engineering vocabulary unless made applicable by a cosmetic law, standard, customer requirement, or company procedure.
The monitoring location should be described explicitly. In-line measurements are made directly in the process stream; on-line systems divert and return or discard a sample through a bypass loop; at-line measurements are performed near the process on a manually collected sample; and off-line measurements are performed in a separate laboratory. These modes differ in response time, representativeness, cleanability, calibration burden, and exposure to sampling error. A slower at-line method may be more useful than a nominally real-time probe if the probe is located in an unrepresentative or fouling-prone position.
8.2. Direct and Indirect Measurement of Rheological State
A process sensor rarely reproduces the complete flow curve, yield behavior, oscillatory response, and recovery measured by a laboratory rheometer. Direct process-rheology tools include pressure-drop or capillary devices, bypass-loop rheometers, rotational or vibrational process viscometers, and systems that impose several flow rates to estimate a non-Newtonian response. Indirect indicators include mixer torque, motor current, power, pump pressure, recirculation flow, density, temperature, pH, conductivity, vacuum, and acoustic signals.
The distinction matters because many process viscometers report a method-specific apparent viscosity at one effective deformation condition. That signal can be highly valuable for endpoint detection and batch consistency, but it should not be interpreted automatically as zero-shear viscosity, yield stress, or a universal material property. Calibration must include the expected range of temperature, flow, air content, solids loading, and structural history.
8.3. In-Line and On-Line Viscometry and Rheometry
Direct process viscometry is most useful when the measurement condition can be related to a real unit operation and when the signal is calibrated against a validated reference method. Pu et al. showed that an in-line process viscometer could detect concentration and process-condition changes during hydrogel dispersion and provide reproducible batch profiles, while also concluding that it should complement, rather than replace, off-line rheometry [
118]. This is directly relevant to polymer hydration and structured cosmetic gels.
The reported approaches were successful within their validated applications. Pu et al. obtained reproducible in-line profiles and detected hydrogel concentration and process-condition changes, supporting batch monitoring but not replacement of off-line rheometry [
118]. Qwist et al. obtained on-line flow and oscillatory information over manufacturing-relevant conditions [
119], and Luo et al. demonstrated continuous in-line capillary rheometry while observing greater disagreement at low stresses [
120]. Thus, technical success was demonstrated for trend monitoring and process discrimination, but quantitative equivalence remained method- and operating-range-dependent.
More advanced systems can measure pressure drop at several controlled flow rates to estimate a flow curve. Qwist et al. developed an online pressure-difference apparatus capable of obtaining flow and oscillatory information for semisolid formulations over manufacturing-relevant ranges [
119]. Luo et al. demonstrated non-Newtonian capillary rheometry for continuous and in-line coatings production but also reported larger disagreement at low stresses, illustrating the limits of extrapolating process devices into yield-dominated regions [
120].
Critical validation variables include sensor temperature, flow or oscillation condition, pressure range, wall slip, pulsation, air bubbles, particle size relative to the measuring gap, fouling, cleaning, and sample residence time. A bypass loop can provide controlled temperature and flow but may delay the signal or selectively exclude highly structured material. A vessel-mounted sensor may respond quickly but measure only its local environment. Process rheology should therefore be validated as a defined measurement method, not marketed or interpreted as a universal viscosity value.
8.4. Conventional Process Signals and Soft Sensors
Existing manufacturing signals can provide substantial process information before specialized PAT hardware is installed. Mixer torque, agitator power, motor current, pump pressure, flow rate, bulk and wall temperature, density, vessel level, pH, conductivity, and vacuum may track hydration, phase combination, emulsification, cooling, deaeration, transfer, or filling. The semisolid-manufacturing studies discussed in
Section 6 show that temperature, shear history, holding, and processing conditions can be linked to final microstructure and rheology [
91,
92,
93].
A soft sensor combines several readily measured signals to estimate a difficult-to-measure attribute such as process viscosity, modulus, droplet size, hydration endpoint, or probability of acceptable filling. Data-driven soft sensors are useful when the target attribute is measured intermittently, but their development requires representative calibration data, variable selection, time alignment, uncertainty assessment, and a maintenance plan [
124]. The model must include normal raw-material, equipment, seasonal, and operator variability; otherwise, it may learn one narrow campaign rather than the process.
Torque or motor current alone should not be interpreted as viscosity. The signal also depends on speed, fill level, geometry, temperature, aeration, bearing condition, wall buildup, and flow regime. A more defensible approach normalizes the signal where appropriate and combines it with temperature, speed, level, and reference rheology.
8.5. Spectroscopic PAT: NIR and Raman
Near-infrared (NIR) and Raman spectroscopy can provide rapid, non-destructive information on composition, water or solvent content, raw-material identity, phase changes, and selected physical attributes when combined with chemometric models. Reviews of pharmaceutical PAT show that both technologies can support in-process monitoring, but their success depends as much on sampling, preprocessing, calibration design, and model maintenance as on the spectrometer itself [
125,
126].
Cosmetic and semisolid matrices present particular challenges. Multiple scattering, opacity, pigments, pearlescent particles, bubbles, changing droplet size, probe fouling, temperature, and variable path length can alter spectra independently of composition. A spectral model may therefore predict an attribute through indirect covariance rather than a stable causal relationship. FDA guidance for NIR analytical procedures emphasizes calibration-set design, independent validation, model performance, instrument standardization, and lifecycle management [
127].
Transmission Raman spectroscopy has been used for non-destructive quantitative analysis of a crystal-dispersion ointment, demonstrating that semisolids can be analyzed through their packaging or bulk matrix when the optical and chemometric conditions are appropriate [
128]. For cosmetics, spectroscopy is most defensible for specific questions such as water content, solvent loss, ingredient concentration, or phase transition. It should not be assumed to measure rheology directly unless the calibration is validated against rheological data across independent lots, scales, and process states.
8.6. Particle, Droplet, and Dispersion-State Monitoring
Particle and droplet monitoring can complement rheology when suspension, milling, emulsification, or crystallization is the dominant process. Focused beam reflectance measurement (FBRM) provides an in situ chord-length distribution and count rate rather than a direct particle-size distribution. Probe angle, location, agitation rate, concentration, particle shape, optical properties, and window fouling can materially affect the signal [
129].
FBRM has been used to monitor suspension homogeneity, sedimentation, redispersion, attrition, and continuous particle processing [
129,
130]. The technology can detect a changing population in real time, but conversion of chord length into a conventional size distribution requires assumptions and external calibration. Particle vision microscopy, in-line imaging, laser-based probes, and ultrasound or acoustic methods may provide complementary information, especially when optical scattering or opacity limits one technique.
For cosmetic pigment slurries and emulsions, the strongest approach combines a process signal with periodic microscopy, laser diffraction or another validated size method, grind assessment where relevant, and rheology. Sensor placement should target a representative circulating region rather than a local dead zone or the immediate high-shear discharge unless that location is the intended control point.
Table 8 summarizes the roles, strengths, limitations, and validation needs of representative process-monitoring and PAT tools.
8.7. Multivariate Batch Monitoring and Endpoint Detection
Cosmetic manufacture is commonly a multistage batch process in which the normal trajectory changes during charging, heating, phase addition, homogenization, cooling, vacuum, and filling. Independent univariate limits can miss a fault expressed as an abnormal relationship among otherwise acceptable variables. Multivariate statistical process control uses correlated process data to describe the normal operating region and identify deviations in scores, Hotelling-type statistics, residuals, or contribution plots [
131,
132].
Batch models require time or maturity alignment because batches rarely reach events at exactly the same clock time. Phase-based or event-based models are often more interpretable than one model spanning the complete batch. Principal-component and partial-least-squares approaches can monitor trajectories and predict endpoint quality, while more advanced data-driven methods can support fault detection and diagnosis [
132,
133]. The model should identify which variables, process phase, and time window caused an alarm; a black-box alarm without diagnostic value is difficult to use in manufacturing.
Endpoint detection should be distinguished from quality prediction. A stable torque or spectral signal may indicate that no further change is detectable under that sensor, but it does not prove that every critical attribute is acceptable. Endpoint decisions require validation against independent rheological, structural, and product-performance measurements.
8.8. Calibration, Validation, Drift, and Model Lifecycle
A PAT model is an analytical method with a lifecycle. Development should define the intended use, reference method, calibration range, precision (sensitivity range of sensors), preprocessing, variable selection, validation design, prediction uncertainty, alarm logic, and response to missing or bad data. Independent validation should include raw-material lots, seasons, operators, equipment conditions, scales, and expected process disturbances rather than random splits of one homogeneous dataset [
124,
126,
127].
Sensor drift, fouling, lamp or probe replacement, software changes, maintenance, cleaning, and formulation changes can invalidate the original relationship. Model performance should be trended using reference samples and prediction residuals, with predefined rules for recalibration, revalidation, and change control. Adaptive models may be useful, but uncontrolled updating can absorb a developing process fault and redefine it as normal.
Data integrity requires synchronized clocks, traceable sensor identifiers and calibration records, retention of raw and processed data, documented preprocessing, user access control, and auditable model versions. Missing data, manual substitutions, and sensor downtime should be visible rather than silently interpolated.
8.9. From Monitoring to Process Control and Real-Time Release
PAT implementation can progress through four levels: observation, advisory endpoint detection, feed-forward or feedback adjustment, and—only where justified—real-time quality assurance. Monitoring is generally the safest starting point. An advisory system may recommend ending hydration or homogenization; a controlled system may adjust temperature, speed, addition rate, or vacuum within a validated operating region.
Closed-loop control requires a sensor response faster than the process dynamics, an actuator capable of changing the relevant mechanism, robust alarm and fail-safe logic, and evidence that correction does not damage another quality attribute. For example, increasing mixer speed may correct an apparent dispersion endpoint while increasing air, temperature, polymer damage, or pearlescent fracture.
PAT does not automatically justify real-time release or elimination of laboratory testing. FDA and ICH frameworks require product and process understanding, risk-based control, method validation, process validation, and lifecycle oversight [
114,
115,
116,
117,
134]. For cosmetic manufacture, PAT is more appropriately presented as an industrial control and knowledge management framework unless product-specific evidence supports a stronger claim.
8.10. Implementation Roadmap and Evidence Limitations
A practical implementation sequence is: define the failure mode and critical quality attribute; identify the unit operation and earliest measurable precursor; select the least complex sensor with adequate sensitivity and response time; conduct a placement and scale-of-scrutiny study; align sensor and reference samples; build and externally validate the model; establish alarms and operator actions; and maintain the system through calibration, drift monitoring, and change control.
The business case should include reduced sampling delay, fewer rejected or reworked batches, shorter cycle time, better filling consistency, and improved process knowledge, but also installation, cleaning, sanitation, good manufacturing practices (GMP), automation, cybersecurity, calibration, and model-maintenance costs. A technically sophisticated probe that cannot be cleaned, represented in the batch record, or supported by plant personnel is not an effective PAT solution.
Direct cosmetic-specific PAT studies remain scarce. Much of the present framework is transferred from pharmaceutical semisolids, coatings, suspensions, and general process systems [
118,
119,
120,
124,
125,
126,
127,
128,
129,
130,
131,
132,
133,
134]. This evidence is strong for measurement principles and model governance but does not establish universal cosmetic endpoints or limits. Future work should publish full-scale cosmetic case studies that connect in-process signals with validated rheological fingerprints, microstructure, filling behavior, stability, and consumer performance.
9. Quality Control and Batch Release
Batch release is where formulation and process knowledge are converted into a practical quality decision. Rheological, physical, analytical, and performance-based tests must work together to confirm consistency, identify meaningful deviations, and support scientifically justified acceptance criteria. This section focuses on test purpose, method precision, sampling, specification setting, comparison with reference batches, stability relevance, and the distinction between routine release methods and the broader methods used during development or investigation.
9.1. Role of Rheology Within the Control Strategy
Quality control should verify that a batch is suitable for its intended use, but it should not attempt to reproduce every development experiment. A control strategy links critical material attributes, critical process parameters, in-process controls, finished-product tests, specifications, and monitoring frequency. The principles in ICH Q6A, ICH Q8(R2), ICH Q9(R1), ICH Q10, and ISO 22716 provide a transferable basis for defining scientifically justified tests and acceptance criteria, although cosmetic products require category-specific interpretation [
115,
116,
117,
121,
134,
135].
Rheology belongs in the control strategy when it is sensitive to a material or process change that matters to storage, package delivery, filling, application, or stability. A single-point apparent viscosity may be appropriate for routine release if it is precise, discriminating, and fully specified. It becomes inadequate when two unacceptable structures can produce the same value or when the result is dominated by temperature, wall slip, sample age, or uncontrolled shear history. Development, release, stability, and investigation methods should therefore be distinguished explicitly.
9.2. Critical Quality Attributes and Tiered Test Selection
The critical quality attribute, rather than instrument availability, should determine the test package. Suspension and runoff may require operational yield or creep; pump and filler behavior require process-range flow; delayed rebuilding requires recovery kinetics; wax or lamellar structure requires time-temperature methods; stringing requires extensional measurements; and afterfeel may require tribology. The same method need not be used at every lifecycle stage.
A tiered program is preferable. Tier 1 contains robust release tests with short cycle time. Tier 2 contains enhanced fingerprinting for validation batches, raw-material or equipment changes, and stability. Tier 3 contains mechanistic tools for investigations and model development. Advancement to a higher tier should be triggered by risk, trend, change, or unexplained performance rather than applied indiscriminately to every batch.
9.3. Fit-for-Purpose Method Development and Validation
A rheological method should begin with an analytical target profile describing the intended decision, measurand, matrix, reportable range, required precision, and acceptable uncertainty. ICH Q14 and Q2(R2) emphasize that analytical procedures should be fit for purpose, developed through scientific and risk-based understanding, and validated against predefined performance criteria [
136,
137]. These principles are directly useful for cosmetic rheology even when the method is not part of a pharmaceutical registration.
Relevant performance characteristics include repeatability, intermediate precision, reproducibility where transfer is expected, range, response, selectivity or discriminatory power, robustness, sample stability, and system suitability. Conventional accuracy is difficult for yield stress or modulus because a true reference value may not exist. In that case, accuracy should be replaced by comparison with an orthogonal or reference procedure, recovery of designed formulation or process changes, or agreement with a characterized reference material. Chiarentin et al. demonstrated an analytical-quality-by-design approach for topical rheology in which sample application, rest time, temperature, and other method variables were studied systematically [
16].
Validation should challenge the method with known sources of meaningful variability. Examples include thickener concentration, neutralization, homogenization energy, air content, storage temperature, and aging. A method that is highly repeatable but cannot distinguish a known under-hydrated or over-sheared batch is not suitable for release. Conversely, a very sensitive research method may be unsuitable for routine control if it is too dependent on operator loading or long equilibration.
9.4. Sampling, Conditioning, Homogeneity, and Measurement Uncertainty
Sampling can introduce greater variability than the rheological measurement itself. Therefore, the sampling plan should clearly define the sampling location within the vessel or package, including whether the sample is collected from the top, middle, or bottom of the batch; the sampling time relative to processing, such as at the beginning, middle, or end of the batch; sample amount; sampling tool and container; sample temperature; transport conditions; deaeration procedure; and the elapsed time between sampling and rheological testing. Top, middle, and bottom samples may be required during validation or investigation to demonstrate homogeneity. Packaged-product testing may be necessary when cooling, evaporation, or package interaction changes the structure after filling.
The method should specify loading, trimming, geometry, surface roughness, gap, pre-shear, rest time, measurement sequence, and temperature. Measurement uncertainty should combine repeatability, analyst, day, instrument, sample, and preparation effects where relevant. Guard bands may be justified when method uncertainty is not negligible relative to the specification width. Raw curves and instrument status should be retained because a single reported number can conceal slip, edge fracture, unstable torque, sedimentation, or incomplete equilibration.
9.5. Specifications, Reference Fingerprints, and Statistical Limits
Specifications need to be linked to product performance and process capability, not selected as arbitrary percentages around one development batch. A reference fingerprint can include several standardized outputs such as apparent viscosity at defined conditions, Herschel–Bulkley parameters over a validated range, operational yield, storage and loss moduli, critical strain, recovery at defined times, density, and temperature response. Not every parameter requires a release limit; some may be monitored as characterization or investigation variables.
Alert and action limits should be distinguished. Alert limits identify drift while the batch may still meet release criteria; action limits require investigation or disposition. Statistical process control, capability analysis, and multivariate distance-from-reference approaches can support these limits when sufficient representative data exist [
131,
132]. Historical data should not be pooled blindly across formulation revisions, instruments, sites, or method versions.
9.6. Instrument Transfer, System Suitability, and Data Integrity
Method transfer should consider geometry equivalence, torque and normal-force range, temperature control, software calculations, inertia correction, and surface condition. Comparative testing on representative low, middle, and high samples is more informative than testing one standard fluid. ICH Q2(R2) and Q14 recognize comparative transfer, partial revalidation, and lifecycle management as appropriate when procedures move between laboratories or instruments [
136,
137].
System suitability may include temperature verification, geometry zero and gap checks, torque verification, a reference material or control sample, duplicate agreement, and acceptance of curve-quality diagnostics. Electronic records should preserve raw data, metadata, calculations, audit trails, method version, and any reprocessing. FDA data-integrity guidance provides transferable principles for complete, consistent, accurate, and attributable records [
138].
9.7. OOS, OOT, and Atypical-Result Investigations
An out-of-specification result is a formal failure against an acceptance criterion; an out-of-trend result is an unexpected change relative to history; and an atypical or out-of-control result may indicate abnormal curve shape, sample behavior, or process trajectory even when a numerical limit is met. These categories should be defined in procedures because they require different decisions.
The first phase should assess obvious laboratory causes without discarding the original result: sample identity and history, temperature, instrument status, method accuracy, loading, bubbles, slip, evaporation, transcription, calculation, and raw-curve quality. Retesting should follow a predefined plan and should not continue until a passing value is obtained. If no assignable laboratory cause is demonstrated, the investigation should expand to process history, raw materials, sampling location, density, microstructure, stability, and package behavior. FDA OOS guidance provides a rigorous, transferable framework for this sequence and for avoiding test-into-compliance practices [
139].
Where an investigation identifies a correctable laboratory, material, process, equipment, or procedural cause, the outcome should include proportionate corrective and preventive action (CAPA), effectiveness verification, and evaluation of whether methods, specifications, training, or the control strategy requires revision.
9.8. Batch-Release Decision and Lifecycle Review
The batch-release decision should integrate validated test results, in-process data, deviations, trend status, ranges (min and max for each parameter), and product-specific performance. One passing viscosity result should not override evidence of nonuniformity, abnormal air content, unstable particle size, or failed filling. Conversely, a statistically unusual but scientifically understood result should be assessed against risk and performance rather than rejected automatically.
The control strategy should be reviewed after raw-material, formula, process, equipment, package, site, or analytical-method changes. Continued verification should track method performance and product results so that specifications remain meaningful and not merely historical. The tiered program in
Table 9 is intended as a decision framework rather than a universal mandatory test list.
Figure 6 integrates process signals, laboratory reference measurements, batch genealogy, analytical models, quality decisions, and lifecycle feedback; it also provides the transition from routine release control to the mechanism-based stability assessment developed in
Section 10.
10. Physical Stability and Failure Investigation
10.1. Stability as a Mechanism-Based, Time-Dependent Problem
Physical stability means preserving an acceptable microstructure and product performance during storage, transport, package use, product shelf life, and environmental exposure. Rheology can reveal changes in mobility, network strength, yielding, and recovery, but it cannot identify every destabilization mechanism. Apparent viscosity may remain unchanged even while droplets grow, particles migrate, crystals transform, air is lost, or phase separation begins. A sound stability assessment, therefore, combines rheology with structural, thermal, optical, and package-specific evidence [
15,
31,
140,
141,
142].
ISO/TR 18811 explicitly recognizes that the diversity of cosmetics prevents one universal stability protocol and places responsibility on the manufacturer to justify product-specific conditions, methods, and criteria [
140]. The protocol should start from plausible failure mechanisms, intended markets, distribution, package, use pattern, shelf life, and formulation sensitivities rather than from a generic sequence of temperatures.
10.2. Gravitational Separation, Sedimentation, and Creaming
Sedimentation and creaming are governed by density difference, particle or droplet size, continuous-phase resistance, interactions, and structural arrest. Low-shear viscosity, operational yield stress, creep, and low-frequency viscoelasticity can support mechanistic assessment, but the numerical yield value must be compared with the gravitational stress and time scale relevant to the product. Wall slip, sample aging, and instrument torque limits can exaggerate apparent arrest.
Top-middle-bottom sampling, concentration profiles, microscopy, particle or droplet size, centrifugation, and multiple light scattering should accompany rheology. Weakly controlled flocculation may slow sedimentation and allow redispersion, while strong flocculation can form a hard sediment. A formulation that resists separation in a small vial may behave differently in a tall package because the hydrostatic and settling distances change.
10.3. Flocculation, Coalescence, Ripening, and Phase Inversion
Flocculation changes the effective dispersed-phase volume and may increase low-shear viscosity and elasticity without permanent droplet fusion. Coalescence decreases interfacial area and irreversibly changes the droplet population. Ostwald ripening produces molecular transfer from smaller to larger droplets. Phase inversion changes the identity or connectivity of the continuous phase. These mechanisms can produce similar visual or rheological trends but require different corrective actions.
Droplet-size distributions, microscopy, conductivity for emulsion type, interfacial measurements, dilution behavior, and thermal history are needed to distinguish them. Rheology is most useful when interpreted with the full distribution rather than one mean diameter. Temperature cycling or centrifugation can accelerate separation but may also induce phase transitions or inversion that are not relevant to intended storage.
10.4. Suspension and Slurry Failures
Pigment and mineral suspensions can fail through settling, flotation, reflocculation, agglomeration, particle migration, hard sediment, or interaction with polymers and surfactants. Slurries may be stable before let-down but destabilize after dilution into the final matrix. Flow curves, yield or creep, recovery, density, sedimentation, grind or particle size, microscopy, and controlled let-down should be combined [
67,
68,
69,
70,
71].
Investigation should compare samples before dispersion, after milling, after storage, after let-down, and after accelerated stress. A decrease in viscosity may represent successful deagglomeration, polymer breakdown, temperature change, or loss of a flocculated network. Color strength and hue, optical performance, or UV performance can help distinguish beneficial dispersion from destabilization.
10.5. Gel Syneresis, Polymer Collapse, and Network Aging
Polymer-thickened products can lose water, contract, precipitate, become heterogeneous, or continue to hydrate after manufacture. Electrolyte migration, pH drift, solvent loss, polymer-surfactant interaction, microbial or chemical degradation, and freeze–thaw stress can alter the network. Syneresis may occur even when a bulk viscosity remains within specification because local contraction and liquid release are not represented by the sampled region.
Useful evidence includes time sweeps, SAOS, creep, recovery, mass balance, pH, conductivity, microscopy, water activity where relevant, and top-middle-bottom sampling. Reversible thermal changes should be distinguished from irreversible molecular or structural damage. Rewarming a cold-stored sample before measurement can hide a package-visible failure if the released liquid is re-incorporated during handling.
10.6. Crystallization, Polymorphism, Sweating, and Hot-Pour Failures
Wax, butters, fatty alcohol, surfactant, oil, and active-ingredient crystals can evolve during storage. Crystal growth, polymorphic transition, network coarsening, oil expulsion, sweating, shrinkage, graininess, hardness drift, and breakage depend on composition, dropping point, melting point, crystallization point, DSC profile and thermal history. A single elevated-temperature condition is not sufficient because different transitions occur at different temperatures and rates [
32,
78,
79,
80].
DSC, polarized microscopy, diffraction where available, temperature-dependent rheology, creep, hardness, bending, oil migration, and package inspection should be combined. Samples should retain their original manufacturing and package cooling history whenever possible; remelting and recasting can erase the mechanism being investigated.
10.7. Accelerated Testing and Relevance of Stress Conditions
Accelerated testing is valuable when it shortens the time to a mechanism that also occurs under normal storage. Elevated temperature, freeze–thaw, UV light exposure, thermal cycling, centrifugation, vibration, light, humidity, and transport simulation should be selected from product risk. Excessive stress can create evaporation, phase inversion, polymer degradation, crystal transitions, or package deformation that would not occur in the market [
140].
A scientifically strong protocol includes real-time controls, multiple stress levels, sufficient sampling times, and predefined failure criteria. The rate of change should be examined rather than only pass/fail at the final time. In accordance with ICH stability guidance, extrapolation from accelerated conditions to establish shelf life should be scientifically justified and supported by evidence that the same degradation mechanism and relevant kinetics apply under the proposed storage conditions; accelerated failure data alone should not be treated as a definitive shelf-life model.
10.8. Multiple Light Scattering and Multi-Analytical Early Prediction
Multiple light scattering can track concentration gradients and changes in backscattering or transmission in concentrated emulsions and suspensions without dilution. The Turbiscan approach can detect creaming, sedimentation, clarification, flocculation, and size-related changes earlier than visual inspection, but optical signals remain sensitive to concentration, refractive index, particle or droplet size, and sample geometry [
141].
Recent cosmetic work combined granulometry, turbidimetry, rheology, and statistical analysis to improve anticipation of emulsion stability [
142]. This is a stronger model than treating any one technique as a universal predictor. The calibration and prediction set should include independent formulations and stress conditions, and the model should report uncertainty and failure modes.
10.9. Package Compatibility and In-Use Stability
The package can change stability through water or solvent permeation, volatile loss, oxygen and other gases ingress, adsorption or extraction, headspace, pump recirculation, and repeated contamination or shear. Narrow nozzles, airless systems, jars, wipers, and flexible tubes create different histories. Bulk stability in glass does not establish package compatibility.
Package studies should include mass change, dose and evacuation, seal integrity, component compatibility, appearance at contact surfaces, rheology of retained product, and comparison of early and late dispensed fractions. In-use simulation may be required for products that are repeatedly opened, pumped, wiped, or exposed to water, and microbiological integrity should also be evaluated using appropriate compendial methods, including relevant USP requirements such as USP <51>, USP <60>, and USP <61>.
10.10. Root-Cause Investigation and Evidence Hierarchy
A stability investigation should define the observed phenotype, localize when and where it arose, generate competing mechanisms, and select discriminating tests. Retained reference, passing and failing batches, raw materials, top-middle-bottom samples, bulk and packaged product, and multiple storage conditions should be compared under the same measurement history.
The evidence hierarchy is strongest when an intervention reproduces or reverses the failure. Correlation between lower G′ and separation is useful but not proof that modulus caused the failure. Reprocessing, controlled temperature history, dispersant or electrolyte challenge, microscopy, and mass balance can test causality.
Table 10 links common failures with useful evidence and interpretive cautions.
11. Rheology, Sensory Attributes, and Product Performance
11.1. Sensory Performance as a Dynamic Product-Substrate-Process Interaction
Consumer perception develops over time, beginning with package interaction and pickup and continuing through spreading, rub-out, absorption or drying, residual-film formation, wear, removal, and overall product efficiency. Rheology influences each stage, but perception also depends on dose, application speed and force, substrate, temperature, humidity, skin condition, applicator, and expectation. Instrumental methods should therefore reproduce a clearly defined stage of use rather than being described as direct measurements of a sensory attribute.
The same formulation can feel different on dry and oily skin or on a forearm and face. Residual-film perception may be controlled by evaporation, emulsion metamorphosis, particle deposition, and lubrication rather than by bulk viscosity. This explains why correlations developed for one product family, substrate, and time point often fail after reformulation or transfer to another category [
3,
4,
5,
15,
17,
37,
44,
45,
46,
48,
49,
50,
51,
52,
53,
61,
81,
143].
11.2. Panel Design, Vocabulary, and Controlled Test Conditions
A sensory study requires a defined objective, panel type, lexicon, reference materials, application protocol, randomization, replication, and statistical plan. ISO 13299 provides general guidance for establishing sensory profiles, while ISO 8589 addresses the design of controlled test rooms [
144,
145]. Trained descriptive panels are suitable for quantitative attribute profiling; consumers are suitable for liking, preference, and use acceptance; and expert panels may support rapid technical screening but should not be treated as consumer evidence.
Cosmetic protocols should standardize dose per area, substrate or body site, conditioning, washing history, room temperature and humidity, application strokes, force or speed, waiting times, and assessment sequence. For human-subject studies, panelist safety and informed consent should be ensured in accordance with the ethical principles of the Declaration of Helsinki. Reference anchors should be selected within the product category and periodically reassessed, since panel drift may otherwise be misinterpreted as formulation drift.
11.3. Stage-Based Sensory Framework
A stage-based framework improves instrumental mapping. Pre-application attributes include package force, pickup, scoopability, firmness, and stringing. During spreading, relevant attributes include initial slip, resistance, cushion, thickness, break, whitening, soaping, wetness, and absorption. Post-application attributes include tack, greasiness, powderiness, smoothness, residue, tightness, transfer, glossy, matte, blurring effects, and film integrity. The timing of each assessment should be reported.
Static endpoint scores can miss short-lived but important events. Boinbaser et al. used Temporal Check-All-That-Apply questions to characterize how cream sensations changed during application [
146]. Temporal methods are particularly relevant to products that break, evaporate, foam, dry, or change lubrication rapidly.
11.4. Texture Analysis and Bulk Rheology
Texture methods such as penetration, compression, back-extrusion, spreadability fixtures, extrusion, and tack tests can reproduce package pickup or mechanical deformation more directly than small-amplitude rheology. Bulk rheology provides complementary information on rate dependence, yielding, recovery, and time scale. Studies of cosmetic emulsions show relationships among flow, creep, oscillatory behavior, texture, and sensory attributes, but also demonstrate that correlations are formulation dependent [
2,
62,
82,
83].
Instrument settings should be justified from the application event. Probe geometry, speed, depth, sample container, trigger force, temperature, and waiting time change the result. A texture parameter named firmness or adhesiveness is an operational output and is not automatically identical to the panel meaning of the same word.
11.5. Tribology, Skin Surrogates, and Lubrication Transitions
Tribology becomes important after the bulk structure is disrupted and the contact is governed by a thin evolving film. Load, speed, substrate roughness and compliance, dose, drying time, and number of cycles control the measured friction. The product can pass from hydrodynamic or mixed lubrication to boundary lubrication as water or solvent leaves and particles, oils, polymers, or waxes remain [
37,
44,
45,
46,
47,
53].
Skin surrogates require validation because they may rank products differently from excised or in vivo skin [
45]. A friction curve should be paired with film thickness, mass loss, imaging, or composition when possible. One friction coefficient at one time cannot represent initial slip, absorption, tack, and dry afterfeel simultaneously.
11.6. Extensional Response, Tack, Adhesion, and Film Formation
Filament breakup, tensile force, probe tack, peel, rub-off, and controlled deposition tests address stringiness, cutoff, applicator loading, adhesion, transfer, and film integrity. These responses can vary independently of shear viscosity [
39,
40,
41,
42,
43]. The protocol must control bridge geometry, separation speed, surface energy, evaporation, dose, contact time, and substrate.
For sunscreens, liquid lip products, mascaras, eyeliners, foundations (pigmented emulsions/gels), and nail lacquers, performance develops as a film dries or crystallizes. Measurements should therefore be time resolved and combined with mass loss, microscopy, gloss, flexibility, transfer, water resistance, or wear. A high tack value may support adhesion but reduce comfort; an optimum is product and stage specific.
11.7. Product-Specific Efficacy and Package Performance
Instrumental sensory prediction should not replace efficacy or package tests. Sunscreen protection depends on applied dose and film uniformity; foundation performance depends on coverage, color and wear; mascara depends on deposition, curl, clumping, wear and removal; hot-pour products require payoff and breakage; and pumps or droppers require dose, cutoff and evacuation. Sunscreen efficacy could be assessed according to applicable ISO and USP standards for UVB and UVA protection. Rheology should be positioned as one part of a causal chain linking formulation and process to the final outcome [
32,
53,
54,
68,
78,
79,
80,
86,
87,
88,
90].
Package and applicator geometry can dominate the experienced product. A formulation that feels acceptable when applied by finger may behave differently through a wiper, brush, sponge, pump, or aerosol. Product-applicator-substrate testing should therefore be included during final validation, not deferred until after rheological targets are fixed.
11.8. Sensory-Model Development and Validation
Predictive models should use independent formulations and batches, not only replicate measurements of the same samples. The split between training and test data should occur at the formulation, batch, scale, or campaign level to prevent data leakage. Prediction error, uncertainty, calibration, residuals, and applicability domain should be reported in addition to correlation coefficients [
38,
39,
52,
53].
Variable selection should be guided by the sensory stage and mechanism. Large sets of rheological harmonics, texture outputs, and friction points can overfit small panel datasets. Dimension reduction, regularization, nested cross-validation, and external testing are preferable. Models should be recalibrated only through controlled change management; panel drift, instrument drift, raw-material variation, and changing consumer expectations can all reduce performance.
11.9. Evidence Limitations and Recommended Reporting
The strongest literature connects creams, gels, sunscreens, and selected powder or mascara systems with instrumental and sensory data. Evidence remains limited for concealers, foundations, eyeliners, brow products, liquid lip products, package-applicator interactions, and long-term wear. Transferable findings should be labeled as hypotheses for product-specific validation.
Reports should provide formulation class, dose, substrate, panel description, lexicon, references, environment, timing, application protocol, instrumental settings, replication, statistical model, prediction error, and independent validation.
Table 11 maps common attributes to stages and candidate measurements while emphasizing that no instrument measures perception in isolation.
Table 11 and
Figure 7 show how bulk, extensional, tribological, package, and application measurements contribute to sensory and functional outcomes, while emphasizing the need for validation against controlled package, panel, application, and consumer evidence.
12. Modeling, Data Analytics, CFD, and Digital Twins
12.1. Modeling Hierarchy and Intended Use
Modeling tools range from empirical regressions and constitutive equations to mechanistic CFD, population-balance models, machine learning, hybrid models, and digital twins. The required level of complexity depends on the decision. A simple, validated regression may be enough for batch release, whereas equipment design or scale-up may require spatially resolved flow and heat-transfer models. Whatever its form, a model is useful only when its intended use, inputs, outputs, assumptions, uncertainty, and validation domain are clearly defined.
Machine learning, CFD, and digital twins are not interchangeable terms. A fitted viscosity equation is not a digital twin; a static CFD simulation is not a synchronized twin; and a predictive algorithm without lifecycle governance is not a control strategy.
12.2. Design of Experiments, Response Surfaces, and Formulation Design Space
Design of experiments can estimate main effects, interactions, curvature, and robust operating regions more efficiently than one-factor-at-a-time studies. Factor selection should reflect formulation and process mechanisms, and responses should include rheology, microstructure, stability, package behavior, and sensory or efficacy where relevant. ICH Q8(R2) and Q9(R1) provide a transferable risk-based framework for defining design space and control strategy [
115,
116].
Box–Behnken and response-surface methods have been applied to optimize cosmetic physical, sensory, and moisturizing properties [
147]. The fitted optimum should not be accepted without confirmation batches and external conditions. Designs must address mixture constraints, impossible ingredient combinations (ingredients chemical compatibility), batch effects, and interactions between composition and process. A statistically significant effect may be industrially negligible, while a nonlinear or conditional effect may be missed by a narrow design.
12.3. Rheological Constitutive and Kinetic Models
Power-law, Herschel–Bulkley, Cross, Carreau-Yasuda, viscoelastic, thixotropic, structural-kinetic, and crystallization models can compress data and support process calculations. Parameters should be estimated over the validated range with residual diagnostics, uncertainty, and parameter-correlation assessment [
16,
23,
24,
25,
26,
27,
28,
29]. A high coefficient of determination is insufficient when extrapolation, slip, non-steady data, or over-parameterization is present.
Time-dependent models are particularly challenging because structure changes with shear and rest history. The model requires validation against independent deformation histories rather than fitted to one ramp. Parameters should not be assigned unique microstructural meaning unless supported by complementary evidence.
12.4. CFD of Non-Newtonian Mixing, Transfer, and Filling
CFD can estimate velocity, shear rate, pressure, energy dissipation, residence time, temperature, and dead-zone distributions that cannot be measured everywhere [
148,
149,
150,
151]. For non-Newtonian cosmetics, credible simulation requires a constitutive equation and temperature dependence obtained over relevant rates, realistic vessel and impeller geometry, moving-wall or rotating-frame treatment, free-surface and air assumptions, and validated boundary conditions [
102,
103,
104,
105,
106,
107,
108,
109,
110,
111,
112,
113].
Verification should include mesh and time-step independence, solver and conservation checks, and sensitivity to uncertain rheological parameters. Validation should compare torque or power, flow or velocity, pressure drop, blend time, temperature, and product outcomes. Agreement with one scalar output does not validate the spatial field. Yield-stress CFD is especially sensitive to regularization and to whether unyielded regions are treated physically.
12.5. Multiphase CFD and Population-Balance Modeling
Emulsification, suspension, aeration, and crystallization may require population-balance or multiphase models that represent breakup, coalescence, growth, aggregation, and transport. CFD-PBM studies of dense emulsions in rotor-stator mixers demonstrate the value of coupling local hydrodynamics with droplet-population evolution [
152]. The kernels for breakup and coalescence, however, are often empirical and may not transfer across surfactants, viscosity ratios, concentrations, and equipment.
Validation should use full size distributions and, where possible, pass number or residence-time data rather than one mean size. Model parameters fitted to final droplet size can compensate for incorrect hydrodynamics. Interfacial adsorption, recoalescence, non-Newtonian continuous phase, temperature, and scale should be considered explicitly.
12.6. Machine Learning and Predictive Analytics
Machine learning can relate formulation and process variables to rheology, sensory scores, stability indicators, or manufacturing outcomes. Published cosmetic studies have used nonlinear rheology, extensional data, tribology, and texture to predict sensory attributes [
38,
39,
52,
53]. Computational modeling has also been applied to semisolid rheological behavior [
153].
The main risks are small sample size, leakage, non-independent replicates, confounded formulation platforms, and extrapolation outside the training domain. Splits should be made by formulation, batch, raw-material lot, scale, or campaign. Nested cross-validation, external testing, uncertainty, calibration, residual analysis, and comparison with simple baselines should be reported. Feature importance is not causality and can change when correlated inputs or preprocessing changes.
12.7. Soft Sensors and Hybrid Models
Soft sensors combine process signals with data-driven or mechanistic relationships to estimate difficult attributes. Hybrid models can embed material balances, heat transfer, or rheological constraints within a statistical or machine-learning layer. These approaches can reduce data requirements and improve extrapolation, but only when the mechanistic component is itself valid [
118,
119,
120,
124,
125,
126,
127,
128,
129,
130,
131,
132,
133,
134].
The prediction must be synchronized with process phase and sample location. A model trained on end-of-batch laboratory data may not estimate the local in-process state without accounting for sampling delay and residence time. Drift monitoring and periodic reference measurements remain necessary.
12.8. Digital Twins: Definition, Architecture, and Maturity
A manufacturing digital twin is a fit-for-purpose digital representation connected to an observable manufacturing element through managed data exchange. ISO 23247 provides a reference architecture for digital twins in manufacturing, and NIST has illustrated implementation use cases [
154,
155]. A digital model with manual updates is not equivalent to a digital shadow or a bidirectionally connected twin.
A cosmetic-manufacturing twin may integrate raw-material attributes, equipment geometry, process signals, rheological models, temperature history, PAT, quality results, and maintenance state. Useful early applications include batch-trajectory comparison, what-if analysis, anomaly detection, scale-up support, and prediction of filling or cooling windows. Closed-loop optimization is a later maturity stage and requires validated models, reliable data, and defined authority.
12.9. Model Governance, AI Risk, and Data Integrity
Model governance should define ownership, intended use, data lineage, version control, performance criteria, independent validation, change control, drift detection, fallback procedures, and retirement. NIST AI RMF 1.0 provides a voluntary framework for governing, mapping, measuring, and managing AI risk, while ISO/IEC 42001 provides an organizational management-system framework for AI [
156,
157].
Trustworthiness includes validity, reliability, safety, security, resilience, accountability, transparency, explainability where needed, privacy, and management of harmful bias. In an industrial review, these principles should be connected to practical risks such as false release prediction, undetected drift, cyber manipulation, missing data, and automated changes outside a validated process window. Data-integrity principles also apply to model training, preprocessing, and prediction records [
138].
12.10. Staged Implementation Roadmap and Evidence Limitations
A staged roadmap begins with structured data and reference rheology, progresses to descriptive dashboards and statistical monitoring, then to validated predictive models and soft sensors, and finally to digital-twin or closed-loop applications where justified. Each stage should deliver a measurable decision benefit before additional complexity is added.
Direct cosmetic digital-twin and externally validated machine-learning studies remain limited. The current evidence supports methods and governance more strongly than universal model architectures. Publication of negative results, independent datasets, uncertainty, and scale-transfer performance is needed.
Table 12 summarizes model classes, validation expectations, and common failure modes.
Current modeling barriers can be reduced through a staged, risk-based strategy. Rheological data should be generated with validated, application-relevant protocols and complete composition, batch, lot, temperature, process-history, geometry, and slip metadata. Parsimonious constitutive or hybrid models should be preferred when data are limited and calibrated only within the measured domain. CFD should undergo mesh and time-step verification and scale-relevant validation against torque, power, temperature, circulation, pressure drop, residence time, or velocity. Machine-learning data should span formulations, lots, scales, and campaigns, with grouped rather than random splitting to prevent leakage. External validation, uncertainty intervals, out-of-domain detection, drift monitoring, periodic recalibration, shared reporting standards, benchmark datasets, change control, fallback procedures, and human oversight are required before predictive or closed-loop use [
156,
157].
Table 12 and
Figure 8 present a staged modeling-maturity pathway in which governed data and mechanistic understanding support statistical methods, CFD, machine learning, and digital-twin applications.
13. Proposed Industrial Workflow and Test Matrix
13.1. Lifecycle Workflow from Product Intent to Continued Verification
An effective workflow begins with product intent, package, application, market conditions, and the critical quality and performance attributes. The expected microstructure and dominant failure mechanisms are then mapped to the relevant material attributes and process parameters. Only after this causal map is established are the rheological tests selected.
During development, the objective is to establish a rheological and microstructural design space rather than one target viscosity. During pilot and validation, the objective is to demonstrate that the process and package create a comparable product across scale and time. During routine production, the objective is to control the process with the minimum validated test set and to detect drift. During stability, investigation, and change management, the method set expands according to risk.
13.2. Risk Assessment and Test-Selection Logic
A practical risk assessment can rank failure modes by severity, probability, and detectability while recognizing uncertainty and knowledge gaps. The selected rheological test should be sensitive to the mechanism and feasible at the lifecycle stage. For example, operational yield and creep are more defensible for runoff or settling than a high-shear viscosity; extensional tests are more relevant to stringing; and thermal rheology is more relevant to crystallization.
Redundancy is justified when methods provide orthogonal evidence. Rheology and microscopy can distinguish network change from droplet growth; density can distinguish air loss from structural thickening; DSC can distinguish cooling-related crystallization from polymer aging. Redundancy is not justified when several outputs are mathematical transforms of the same unrepresentative test.
13.3. Minimum Product-Family Protocols
Minimum protocols should be standardized within product families but remain adaptable to formulation, package, and process.
Table 13 proposes a development-level minimum package. Routine release should normally use a validated subset. Numerical conditions should be defined through method development and process relevance rather than copied as universal values.
Table 13 is product-family-centered and proposes a development package for each formulation type, whereas
Table 14 is lifecycle-stage-centerd and defines expected evidence and decision gates from development through continued verification. They are retained because product family and lifecycle stage are distinct selection axes.
13.4. Stage-Wise Test Matrix and Decision Gates
Table 14 separates the evidence expected during formulation development, pilot scale-up, process validation, routine release, stability, and investigation. Decision gates should be defined before experiments: a formulation should not progress because it has the highest viscosity, and a scale-up should not be accepted solely because one release test passes.
At each gate, the project should document the decision, supporting evidence, uncertainty, unresolved risks, and conditions that trigger escalation. This creates traceability from product intent through commercialization and supports efficient change control.
13.5. Technology Transfer and Change Management
Technology transfer should compare raw-material specifications and functionality, equipment geometry and operating range, process sequence, sampling, analytical methods, package conditions, and environmental controls. Analytical transfer should use representative samples and evaluate method-equipment equivalence [
136,
137]. Manufacturing transfer should use the scale-up verification package in
Section 7 and the monitoring framework in
Section 8.
Changes in supplier, grade, particle size, polymer substitution, surfactant and emulsion composition, fragrance, preservative, mixer, pump, filter, batch size, cooling utility, package, site, or test method may affect rheology. A risk-based comparability plan should define which fingerprints and performance tests are repeated. Historical equivalence should not be assumed when a change affects the mechanism that creates structure.
13.6. Reporting Checklist and Reproducibility
A publishable or transferable rheology study should report formulation structure, relevant ingredient grades, process sequence, equipment and scale, temperature and shear history, sampling location and age, loading and conditioning, rheometer and geometry, surface, gap, test sequence, raw-curve diagnostics, fitted range, uncertainty, complementary measurements, and industrial decisions. Missing process history is a major barrier to interpretation.
For models, reports should add data structure, preprocessing, split strategy, validation set, uncertainty, applicability domain, and code or sufficient algorithm detail. For sensory studies, panel, substrate, dose, environment, time points, and application method are required. For stability, the stress mechanism and real-time comparator should be stated.
13.7. Implementation Maturity Model
Figure 9 consolidates the proposed industrial workflow: product intent and credible failure modes define the controlling mechanisms, test package, metadata, scale-verification plan, routine controls, and lifecycle-learning requirements.
Organizations can implement the framework progressively. Level 1 standardizes sample history and routine viscosity. Level 2 adds validated flow, yield, SAOS, recovery, and complementary structure tests. Level 3 links fingerprints to scale-up, stability, sensory, and investigations. Level 4 integrates process signals, PAT, SPC, and soft sensors. Level 5 uses governed hybrid models or digital twins for prospective decision support. Progression should be based on decision value, not technology novelty.
14. Research Gaps and Future Directions
14.1. Standardization, Interlaboratory Comparability, and Reference Materials
Cosmetic rheology still lacks broadly adopted, product-specific protocols for sample history, geometry, deformation history, temperature, and reporting. Interlaboratory studies are needed for representative creams, gels, cleansers, suspensions, slurries, wax systems, foams, and powders. Reference or control materials should challenge yield, slip, recovery, particles, and thermal structure rather than relying only on Newtonian calibration oils.
Future studies should report repeatability, intermediate precision, reproducibility, measurement uncertainty, and robustness. Consensus should focus first on intended use and reporting rather than one universal numerical protocol.
14.2. Full-Scale Manufacturing and Scale-Up Evidence
Most published cosmetic studies use laboratory batches and omit complete equipment, power, circulation, vacuum, cooling, residence time, and sampling data. Full-scale studies should compare at least two scales, measure process trajectories, and link local and bulk histories to final microstructure and performance. Negative or non-equivalent scale-up results are especially valuable because they reveal the limits of simple rules.
Research should address yield-stress mixing, coaxial and close-clearance systems, rotor-stator pass distributions, powder induction, deaeration, heat transfer, transfer lines, filtration, and filling with industry-relevant formulations.
14.3. Underrepresented Product Categories and Product-Applicator Systems
Evidence remains limited for concealers, foundations, eyeliners, brow products, liquid lip products, dry shampoos, styling products, hybrid powders, and complete package-applicator-substrate interactions. Studies should report not only bulk rheology but deposition, film formation, wear, removal, dose, and package performance.
Pressed-powder compaction and cake performance warrant a separate dedicated framework, consistent with the scope boundary of this paper.
14.4. Stability Prediction and Accelerated-Test Validity
The field needs studies that compare early rheological, optical, particle-size, thermal, and imaging indicators with long-term real-time stability. Multi-analytical approaches are promising [
142], but models require independent products, packages, and stress conditions. Research should establish when accelerated tests preserve the normal mechanism and when they create false positives or false negatives.
Mechanistic shelf-life models should report kinetics, uncertainty, and package effects rather than only classification accuracy (ICH protocol).
14.5. Sensory Science, Temporal Perception, and Population Diversity
Instrumental-sensory models should include dynamic perception, different skin sites and conditions, applicators, climates, and diverse users. Temporal methods such as TCATA can reveal transient attributes that endpoint ratings miss [
146]. Studies should distinguish trained descriptive data from consumer liking and should publish independent prediction error.
Substrate surrogates, dose, force, speed, and drying conditions require harmonization. More work is needed on pilling, residue, film flexibility, transfer, wear, and removal.
14.6. Sustainable Materials and Raw-Material Variability
Replacement of silicones, petrochemical polymers, talc, waxes, surfactants, and microplastics can change particle morphology, interfacial behavior, hydration, crystallization, friction, and processing. Sustainability claims should be studied together with process energy, water use, waste, stability, package compatibility, and consumer performance.
Natural and bio-based materials often show lot, season, origin, and processing variability. Future studies should characterize functional material attributes and design robust formulations rather than treating INCI identity as sufficient equivalence.
14.7. PAT, Soft Sensors, and Digital Twins
Cosmetic-specific PAT case studies should connect sensor placement and trajectory data with reference rheology, microstructure, filling, stability, and complaints. Models should be tested after raw-material, scale, equipment, and seasonal changes. Digital-twin research should define architecture, synchronization, uncertainty, human authority, and economic benefit rather than presenting static simulations as twins [
154,
155,
156,
157].
14.8. Open Datasets, Benchmark Problems, and Model Governance
Progress in machine learning and CFD is limited by small proprietary datasets and inconsistent reporting. Anonymized benchmark datasets could include formulation descriptors, process histories, rheological curves, microscopy, stability, and sensory results. Standard train-test splits by batch or formulation would improve comparison.
Models should report code or sufficient detail, uncertainty, negative results, applicability domain, bias and drift analysis, and prospective validation. Benchmark CFD problems should include measured torque, velocity, temperature, and mixing outcomes for non-Newtonian cosmetic analogues.
14.9. Recommended Design of Future Studies
High-value future studies should define a causal mechanism, include controlled formulation and process variation, characterize sample history, use at least one orthogonal structural method, and connect the result to an industrial or consumer decision. Studies should include multiple batches or lots, realistic packaging or equipment, and independent validation.
Table 15 ranks priority areas and proposes evidence that would materially advance industrial practice. The priorities are intended to guide collaborative academic-industry studies rather than prescribe one universal research agenda.
15. Conclusions
Rheology offers a common quantitative framework for connecting cosmetic formulation, microstructure, manufacturing history, package delivery, physical stability, sensory perception, and consumer performance. Its greatest industrial value comes from selecting measurements for a defined mechanism and decision, rather than treating them as isolated viscosity numbers.
No single test can represent the entire product lifecycle. Low-shear and creep measurements address gravitational stability and shape retention; process-range flow describes mixing, transfer, and filling; oscillatory and recovery methods capture near-rest structure and rebuilding; extensional and tribological methods address dispensing, application, and residual films; and thermal methods follow lamellar and wax-crystal development. Every result remains sensitive to sample history, geometry, temperature, time, and measurement artifacts.
Formulation and processing are inseparable. Droplets, polymers, micelles, particles, bubbles, lamellae, and crystals are created or reorganized during charging, hydration, homogenization, cooling, vacuum, transfer, filtration, filling, and storage. Scale-up, therefore, needs to preserve the dominant mechanism—local stress, circulation, residence time, interfacial kinetics, thermal trajectory, or air removal—rather than one convenient equipment variable.
A tiered control strategy provides the most practical path. Development and investigation need broad rheological fingerprints supported by orthogonal microstructural evidence. Scale-up and validation require process metadata and scale-to-scale comparability, while routine release should rely on a minimal, validated, and discriminating method set. Stability assessment needs to be mechanism based, and OOS or OOT results should be investigated using retained raw curves and process history. Analytical procedures and models also require lifecycle management, transfer, data integrity, uncertainty assessment, and change control.
PAT, multivariate monitoring, machine learning, CFD, soft sensors, and digital twins can extend this framework, but they cannot replace fundamental process understanding or independent validation. A digital model is not a twin unless it has managed synchronization and a defined manufacturing use case. Predictive models need to be tested across formulations, batches, raw-material lots, equipment, and time, with uncertainty and failure boundaries reported.
The evidence is strongest for emulsions, gels, selected sunscreens, rheological–sensory relationships, and transferable semisolid processing. Important gaps remain in full-scale cosmetic manufacturing, underrepresented color and applicator-based products, standardized pilling and extensional methods, validated stability prediction, and industrial digital twins. Closing these gaps will require transparent academic–industry studies that report complete material, process, measurement, package, and performance metadata.
The central recommendation is therefore not to maximize rheological testing but to use rheology selectively within a traceable evidence framework that connects product intent and failure risk with formulation and process mechanisms, fit-for-purpose measurements, validated control strategies, and ultimately quality, stability, and consumer performance. This framework provides a more robust, transferable, efficient, and scientifically defensible basis for cosmetic-product development and manufacturing.





 ,
,