Article

Experimental Study on CO2–Crude Oil Phase Behavior, Miscibility and Threshold Pressure Gradient for CCUS in Ultra-Low Permeability Reservoir

1
Research Institute of Exploration and Development, PetroChina Changqing Oilfield, Xi’an 710018, China
2
Petroleum Engineering College, Yanta Campus, Xi’an Petroleum University, Xi’an 710312, China
*
Author to whom correspondence should be addressed.
Processes 2026, 14(18), 2970; https://doi.org/10.3390/pr14182970 (registering DOI)
Submission received: 3 July 2026 / Revised: 14 September 2026 / Accepted: 15 September 2026 / Published: 17 September 2026
(This article belongs to the Special Issue Advanced Strategies in Enhanced Oil Recovery: Theory and Technology)

Abstract

The Chang 8 reservoir in the Baima Middle Block of the Ordos Basin is an ultra-low-permeability reservoir that has faced formation-pressure depletion, a rising water cut, and poor remaining-oil recovery during long-term water-injection development. CO2 flooding in CCUS can simultaneously enhance oil recovery and achieve carbon sequestration; however, comprehensive and integrated research on the CO2–crude oil phase behavior, miscibility characteristics, and nonlinear flow in porous media for this block is still lacking. To address this gap, this study used crude oil and natural cores from the block and natural cores to conduct a series of experiments at 70 °C, including PVT high-pressure physical-property tests, CO2 constant-mass-expansion tests, slim-tube minimum-miscibility-pressure (MMP) tests, pendant-drop oil–gas interfacial-tension measurements, and CO2-flooding threshold-pressure-gradient measurements in cores of different permeability. The results showed that as the CO2 mole fraction increased from 0% to 61.78%, the bubble-point pressure of the crude oil rose from 17.424 to 22.575 MPa, the viscosity decreased from 9.026 to 4.906 mPa·s, and the volumetric expansion coefficient increased from 1.0000 to 1.1454. As the water cut increased from 0% to 80%, the apparent MMP of CO2 increased from 15.83 to 17.69 MPa. The oil–gas interfacial tension gradually decreased with increasing system pressure, and droplet instability and atomization occurred under near-miscible high-pressure conditions. The CO2-flooding threshold pressure gradient decreased with core permeability following a power-law relationship, and a knee-like trend appeared near 0.5 mD within the limited permeability dataset of this study; this trend cannot be generalized without further experimental evidence. This study comprehensively reveals the coupled mechanisms of phase behavior, miscibility, and nonlinear flow during CO2 flooding in the target block, providing experimental and theoretical support for optimizing the injection pressure and reservoir-stimulation schemes of CCUS-EOR in ultra-low-permeability reservoirs.

1. Introduction

Against the backdrop of global climate-change governance and the transition toward low-carbon development, carbon capture, utilization, and storage (CCUS) has become a key technology pathway for China to achieve its “dual carbon” goals while ensuring the clean and efficient development of fossil fuels [1,2]. As an important application form of the CCUS system, CO2-enhanced oil recovery (CO2-EOR) exploits the interaction between CO2 and formation crude oil to improve oil recovery and, at the same time, to achieve the deep geological storage of CO2, which delivers both economic benefits for resource development and environmental benefits through carbon reduction. The Ordos Basin contains abundant low-permeability to ultra-low-permeability oil and gas resources and is surrounded by numerous high-emission enterprises, such as coal-chemical and thermal-power plants, which can provide stable CO2 sources [3,4,5]. The close match between the CO2 sources and the reservoir space makes the basin an advantageous area for large-scale CCUS engineering applications in China [6,7,8,9,10,11].
However, the CCUS development of low-permeability and ultra-low-permeability reservoirs differs substantially from that of conventional medium- and high-permeability reservoirs and faces additional technical challenges. Such reservoirs are characterized by complex pore structures, fine pore throats, high flow resistance, and strongly nonlinear fluid-migration behavior, which greatly increase the difficulty of mixing CO2 with crude oil and impose stringent requirements on the reservoir conditions. The oil reservoirs of the Changqing Oilfield in the Ordos Basin generally exhibit the “three lows” of low permeability, low pressure, and low abundance [12,13,14]. Because of the insufficient natural energy of the formation, these reservoirs rely on long-term water injection to supplement energy and maintain stable production. The main oil-bearing interval of the Baima Middle Block investigated in this study is the Chang 8 reservoir, with an average effective thickness of 11.2 m, an average effective porosity of 10.5%, and an average permeability of only 1.21 mD, which is a typical ultra-low-permeability reservoir. During long-term water-injection development, the block has progressively encountered problems such as uneven formation-pressure distribution, a continuously increasing water cut, and difficulty in stabilizing production [15,16,17,18,19], making it difficult for the traditional water-flooding development model to effectively exploit the remaining-oil potential. Therefore, CO2 displacement development based on CCUS technology, together with an accurate understanding of the phase-behavior laws, miscibility characteristics, and porous-media flow mechanisms of the CO2-crude oil system, is a key prerequisite for optimizing injection parameters and improving development performance in the block [20,21].
Extensive experimental research on CO2 flooding has been carried out worldwide, and substantial progress has been made in individual aspects, including the high-pressure physical properties of crude oil, the minimum miscibility pressure (MMP), and the permeability characteristics of reservoirs [22,23,24,25]. With regard to the high-pressure physical properties of crude oil, PVT experiments have clarified the influence of CO2 dissolution on physical parameters such as viscosity, the volume coefficient, and the dissolution characteristics of crude oil. With regard to miscibility, slim-tube experiments and bubble-point tests are the mainstream methods for determining the MMP of CO2–crude oil systems [26,27,28,29,30,31,32]; for example, previous studies in the Changqing Oilfield block measured the MMP of the regional crude oil as 22.12 MPa. With regard to flow mechanisms, it has been confirmed that CO2 flooding in low-permeability reservoirs exhibits a significant threshold pressure gradient, and the seepage curve presents a two-stage “curve segment + straight-line segment” characteristic [33,34,35,36,37]; in addition, the oil-swelling and viscosity-reduction effects caused by the dissolution of CO2 in crude oil can effectively improve the fluid seepage capacity. Nevertheless, several gaps remain in existing research. First, most experimental studies are fragmented, with results obtained from different blocks, rock cores, and crude-oil samples, and systematic and integrated testing data for the same target reservoir with the same set of core and fluid samples are lacking. Second, there is little research establishing the intrinsic relationship between the evolution of the crude-oil phase and the seepage response in porous media, and in particular, quantitative comparisons of the threshold pressure gradient between pure CO2 flooding and CO2-water flooding are scarce. As a result, the influence of the injection-medium type on the threshold pressure gradient remains unclear, and accurate theoretical support for the optimization of parameters such as the injection-production well spacing and the injection pressure in ultra-low-permeability reservoirs cannot be provided, which seriously restricts the refined design and efficient implementation of the CCUS-EOR scheme in the Baima block [38,39,40,41,42,43].
To fill the above gaps, this study took the Chang 8 reservoir in the Baima Middle Block of the Ordos Basin as the research object and, using on-site crude oil and natural core samples, systematically conducted high-pressure PVT physical-property tests, CO2 expansion experiments, slim-tube MMP tests, pendant-drop interfacial-tension measurements, and threshold-pressure-gradient experiments on natural cores. The results reveal the phase evolution, miscibility mechanism, and nonlinear flow law of CO2 flooding in ultra-low-permeability reservoirs, providing experimental and theoretical support for the optimization of CCUS-EOR injection schemes in the target block.

2. Experimental Apparatus and Steps

2.1. CO2–Crude Oil High-Pressure Physical Property Experiments

CO2–crude oil high-pressure physical property experiments were conducted to determine the basic PVT parameters of the crude oil in the Baima Middle Block formation. According to the GB/T26981-2020 standard [44], the processed crude oil was mixed with gas to a gas–oil ratio of 77.59 m3/m3 (49.5% CH4, 15.5% C2H6, 17.9% C3H8, etc.), and single degassing, constant mass expansion, and viscosity tests were carried out at 70 °C and 21.3 MPa to obtain key physical property indicators such as the fluid composition, bubble point pressure, and volume coefficient.

2.1.1. Single Degassing Experiment

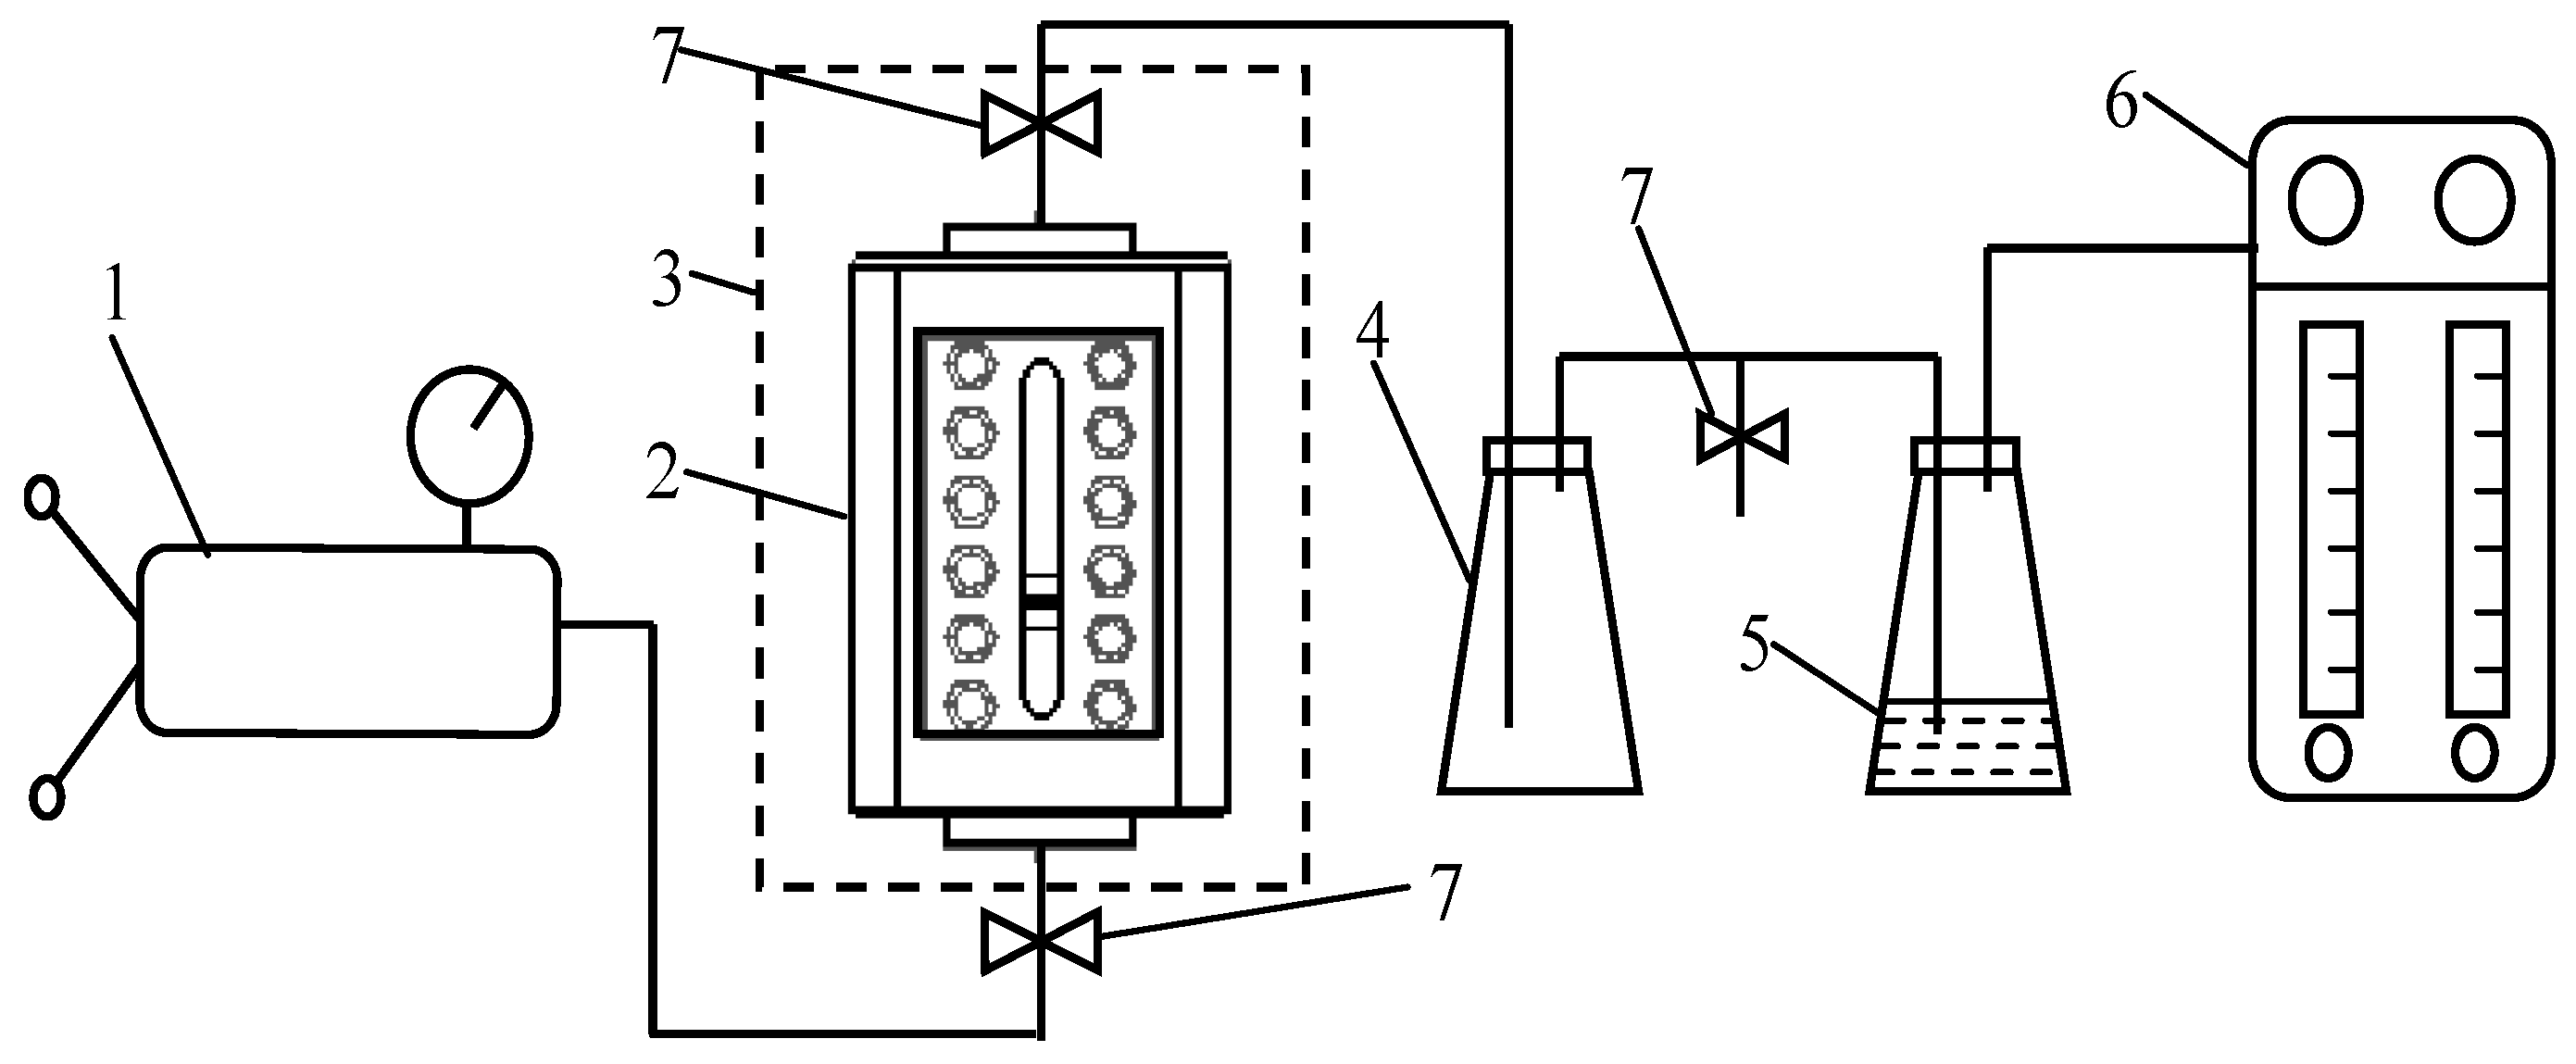
The single degassing experiment used a high-temperature and high-pressure PVT analyzer to flash the formation fluid from reservoir temperature and pressure to atmospheric conditions. The volumes of the separated gas and oil were measured with the separation bottle and the gas meter, and the chromatographic data of the single-degassed gas and liquid phases were obtained (as shown in Figure 1). Parameters such as the formation-fluid composition, fluid volume coefficient, density, and gas-oil ratio were then calculated.

2.1.2. CO2 Injection Constant Mass Expansion (CCE) Experiment

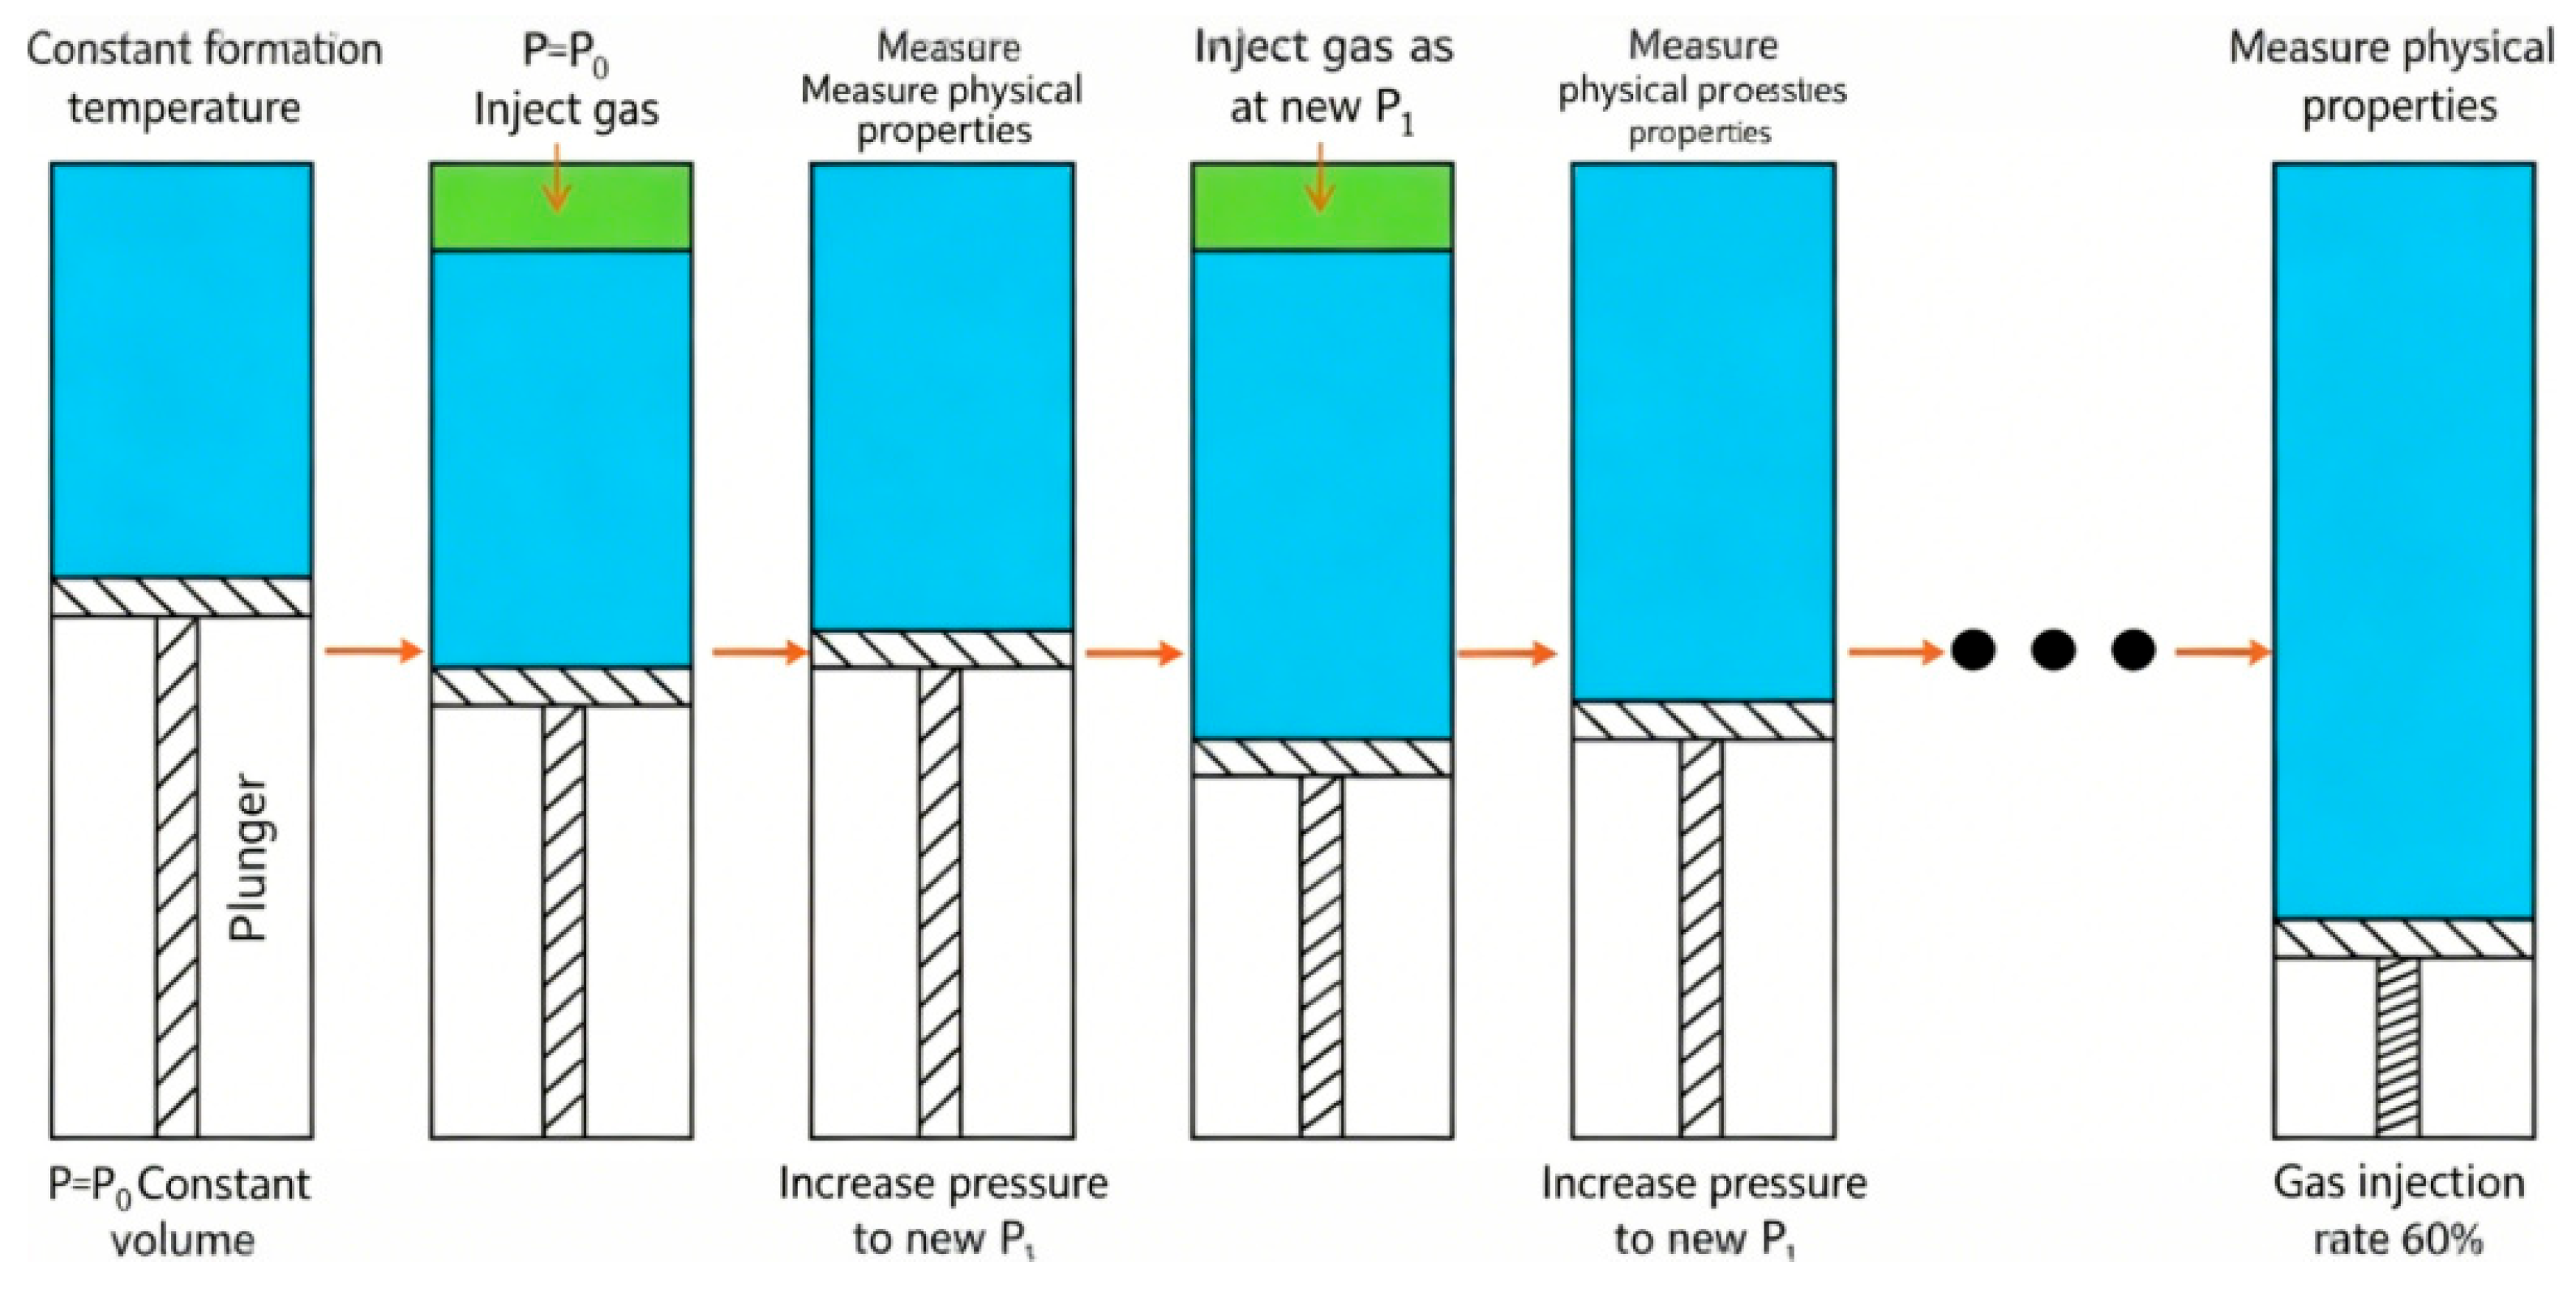
The formation fluid was sealed in a PVT container under formation temperature and pressure, and the pressure–volume relationship of the constant-mass fluid was tested at constant temperature to obtain the saturation pressure, relative volume, single-phase oil density, Y function, and isothermal compressibility coefficient. As shown in Figure 2, gas was injected into the fluid in multiple stages, and the pressure was raised each time so that the gas was completely dissolved; the saturation pressure, solution gas–oil ratio, volume coefficient, viscosity, density, and fluid composition corresponding to different injection volumes were measured.
CO2 injection ratios of 20 mol%, 40 mol%, and 60 mol% were used to conduct expansion experiments on the composite crude-oil samples, and the changes in the PVT phase parameters of the formation crude oil under the three CO2 injection ratios were clarified.

2.2. Minimum Miscibility Pressure Experiment

2.2.1. Slim-Tube Experiment Instruments and Scheme

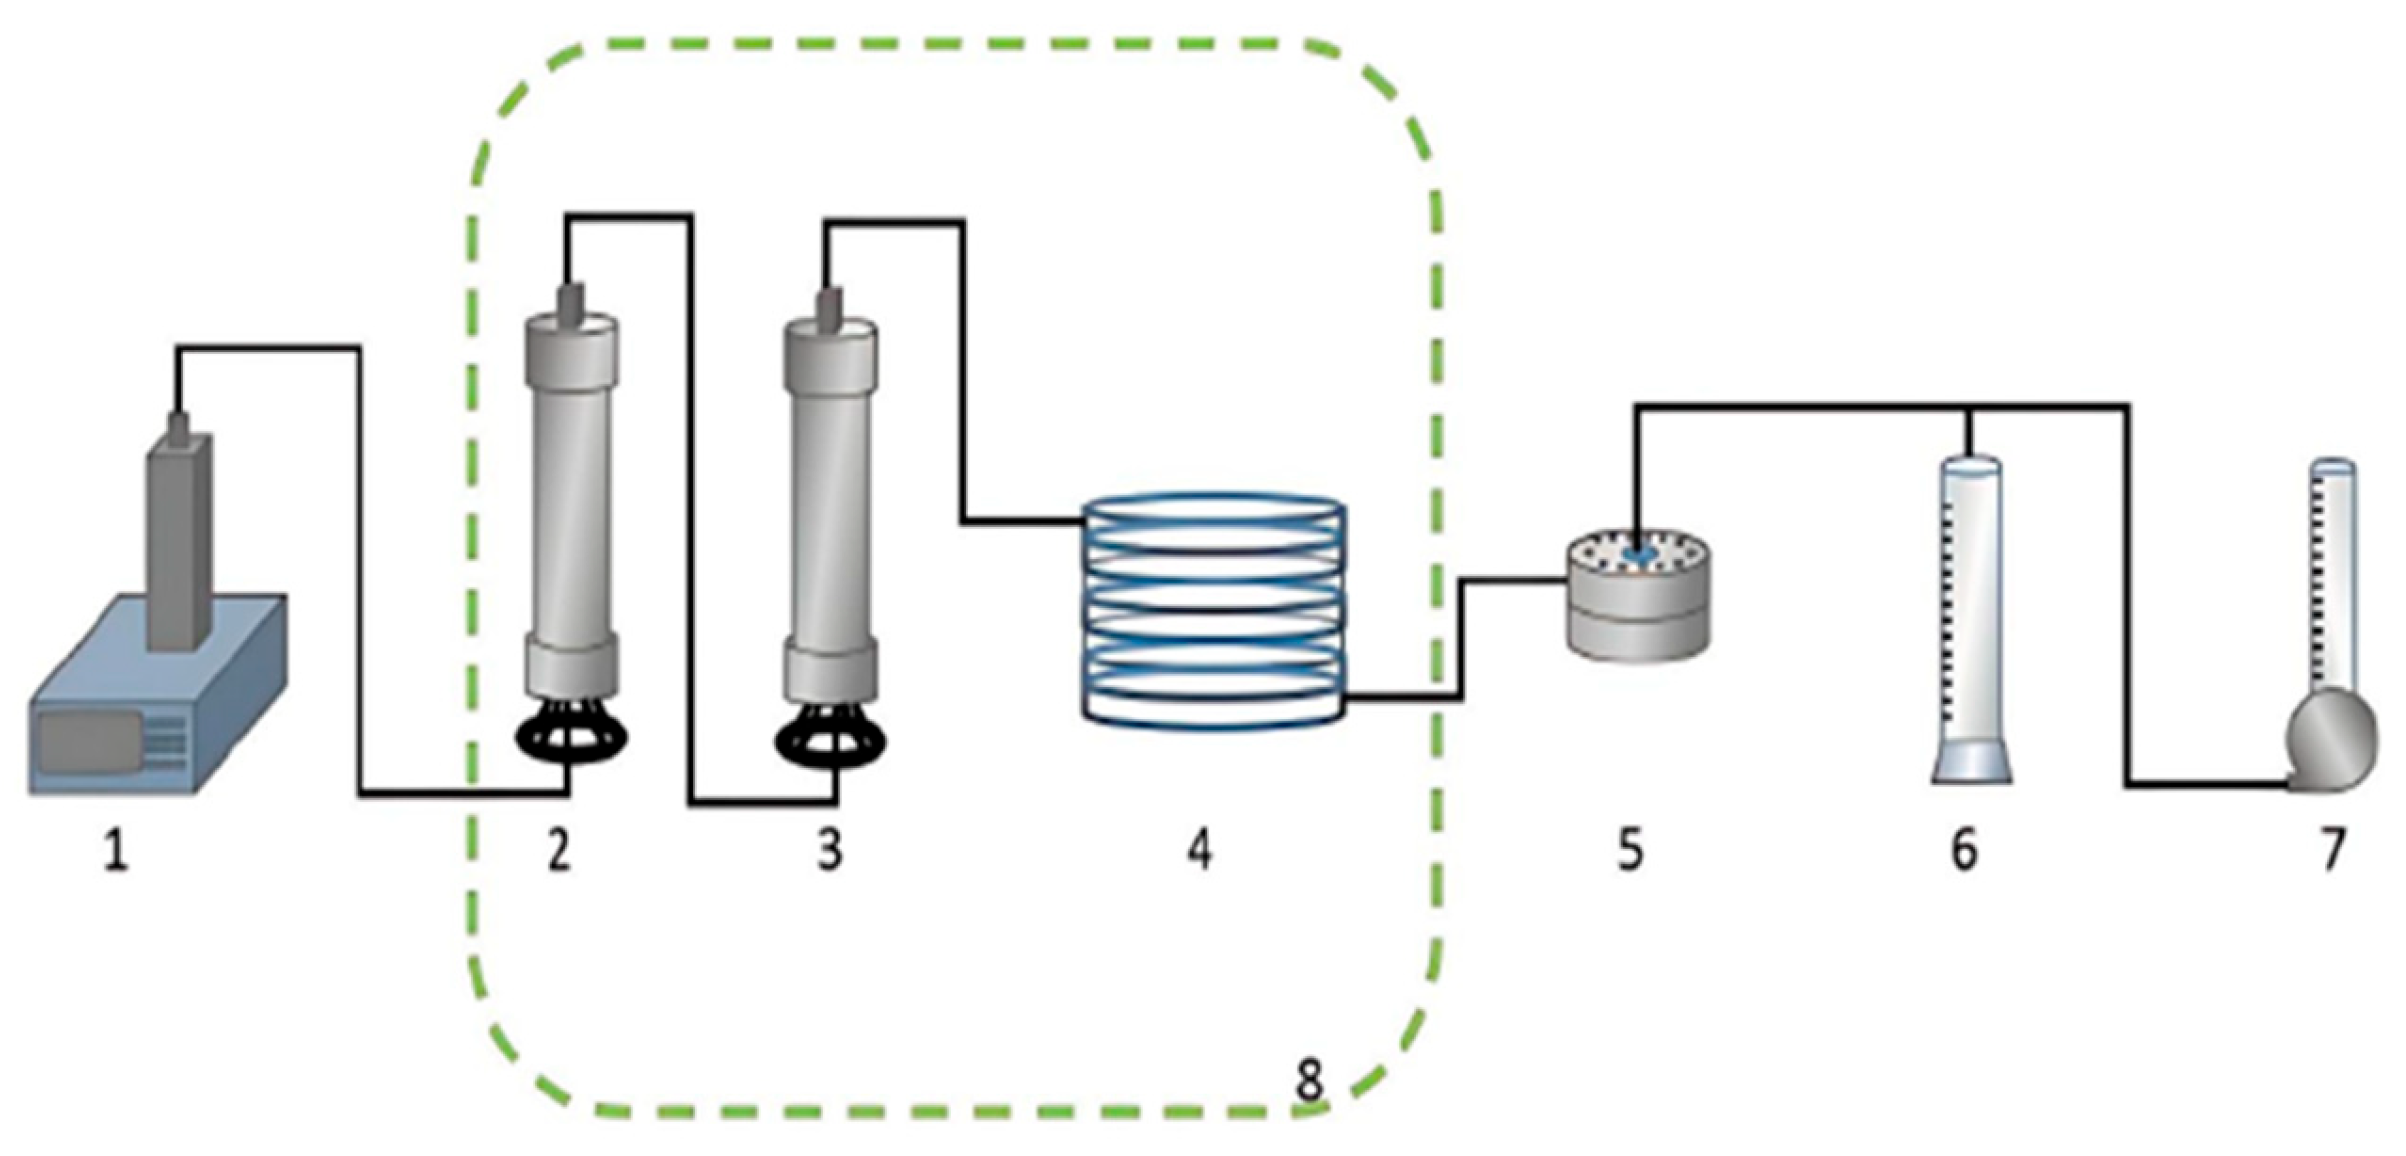
The slim-tube experiment mainly used high-pressure displacement pumps, intermediate containers, thin tubes, constant temperature chambers, back pressure pumps, etc. At the same time, some measuring devices such as pressure gauges, thermometers, and flow meters were also used (Figure 3). The thin tube used stainless steel coil with an inner diameter of 4 mm, a length of 12 m, and a sand particle range of 200 mesh. The detailed parameters are shown in Table 1.
Slim-tube experiments were conducted with the composite crude oil under simulated formation conditions at 70 °C to determine the minimum miscibility pressure of the crude oil and CO2. The experimental temperature was maintained at 70 °C, the experimental pressure ranged from 12 to 21 MPa, and the water cut ranged from 0% to 80%. The detailed parameters are shown in Table 2.

2.2.2. Experimental Steps of Slim-Tube Experiment

(1)
Preparation of the slim tube and airtightness test: Sand with a mesh size of 160–200 was sieved and dried, and the clean, dry slim tube was filled with the sand under continuous vibration to ensure even and dense packing. The experimental pipeline was connected, and high-pressure nitrogen was introduced for 1 h; if the pressure drop was ≤0.15 MPa, the airtightness was considered qualified.
(2)
Evacuation and back-pressure setting: A vacuum pump was used to evacuate the slim tube and the downstream pipeline until the vacuum degree at the front and rear ends of the slim tube was consistent, and the pressure was held stable for 6 h. The back-pressure pump was then adjusted manually to set the back-pressure valve to the target experimental pressure
(3)
Oil-sample saturation: Under constant-temperature conditions, the oil sample was transferred from the sampler to an intermediate container and stabilized to the experimental pressure with a high-pressure displacement pump. The valve was then slowly opened, and the water in the slim tube was displaced with the oil sample at a low flow rate of 0.1 mL/min to establish a water-cut system of 0–80%.
(4)
CO2 oil displacement experiment: CO2 oil displacement was injected under constant temperature, constant pressure, and constant flow rate of 0.1 m/min; the oil production, displacement pump readings, and inlet and outlet pressures of the thin tube were recorded for every 0.1 PV injection. When the cumulative gas injection was ≥1.4 PV or oil production was completely stopped, the displacement was terminated.
(5)
Reset and repetition: CO2 was removed from the pipeline, and the slim tube and accessories were disassembled, cleaned, and dried (or replaced); the above steps were then repeated for the next pressure point.
(6)
Recovery rate calculation: After injecting 1.4 PV CO2, the final crude oil recovery rate was calculated by dividing the volume of degassed crude oil extracted by the volume of saturated oil sample.

2.3. Experiment on Interfacial Tension of CO2 and Crude Oil at Different Pressures

Pendant-Drop Method: Procedure and Principle

Measure the interfacial tension between crude oil and CO2 using the hanging drop method. After cleaning and vacuuming the high-pressure hanging drop kettle, fill it with CO2 at a constant temperature, gradually increase the pressure, and let it stand stable. Use a high-pressure micro pump to extrude 1–3 mm3 of crude oil at low speed, forming symmetrical suspended droplets at the probe tip. After the gas–liquid two-phase equilibrium, capture the droplet profile.
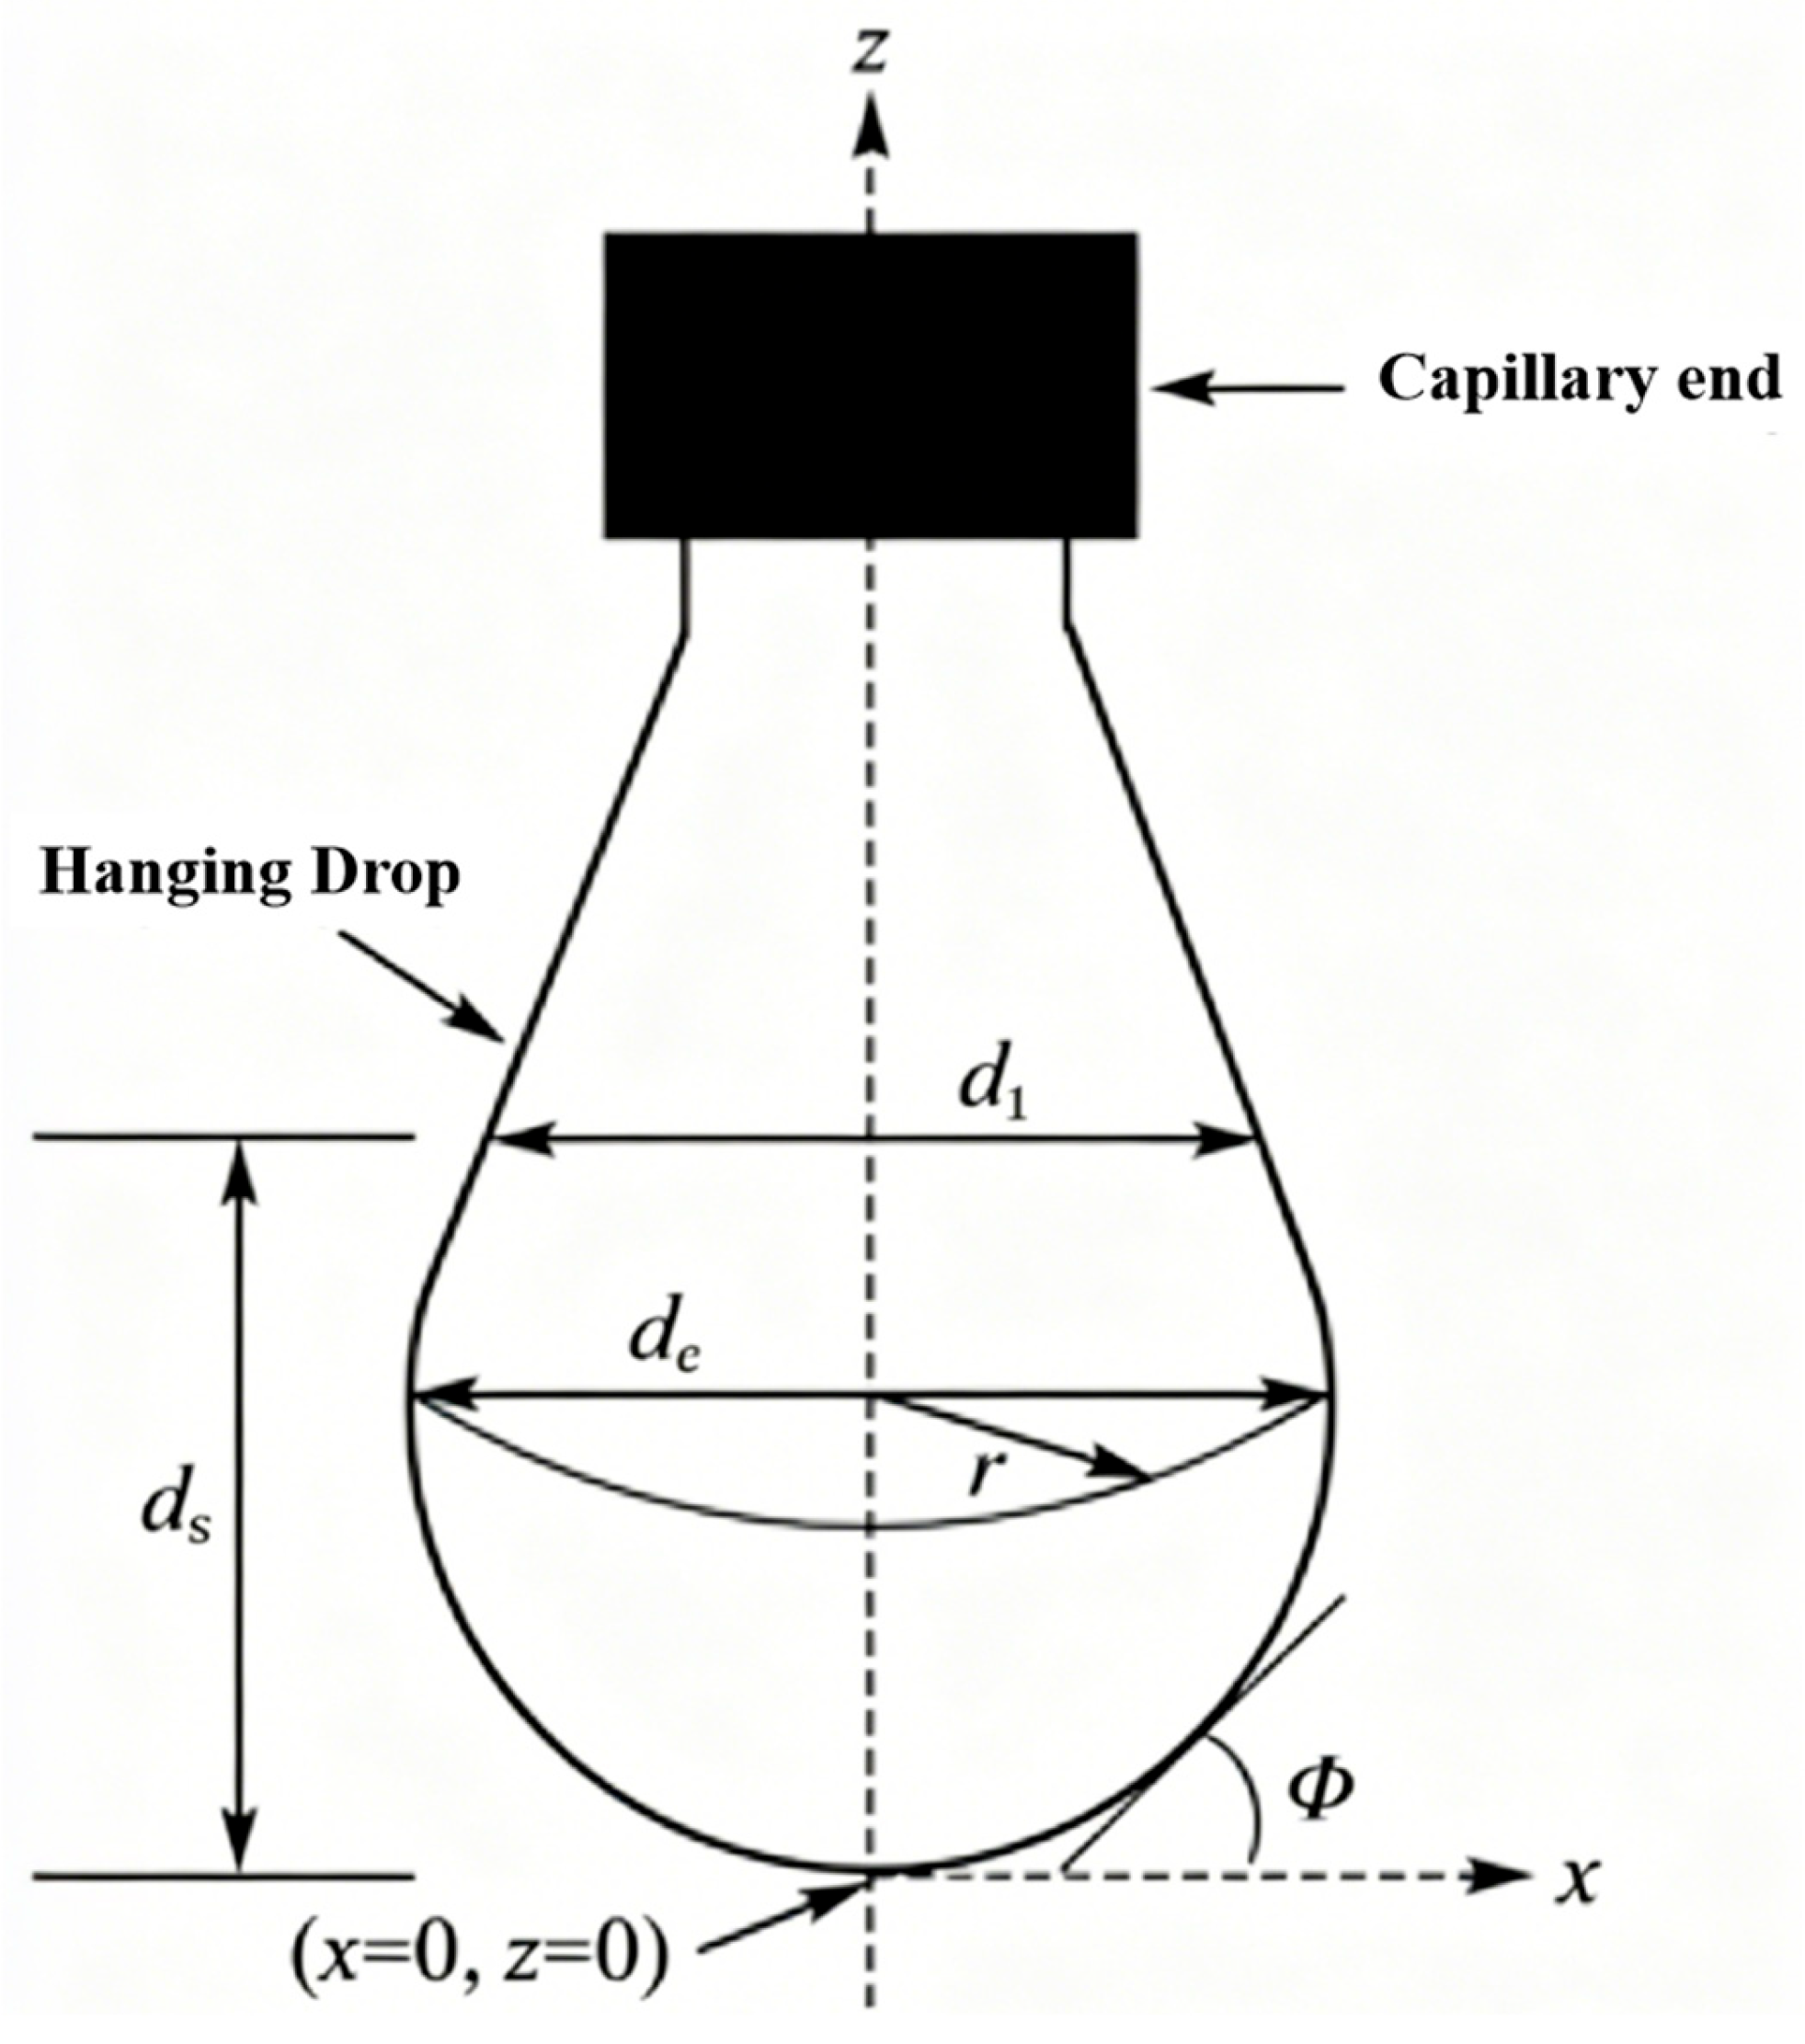
By using the empirical formula for calculating interfacial tension using the Andreas hanging droplet method (a general engineering formula for measuring high-pressure interfacial tension in petroleum), gravity and interfacial tension cancel each other out when the hanging droplet is in equilibrium. The dimensionless coefficient H is obtained from the characteristic size ds and de of the droplet by looking up a table. Combined with parameters such as droplet volume and two-phase density difference, the interfacial tension between CO2 and crude oil can be calculated by substituting them into Formulas (1) and (2). The principle is shown in Figure 4. The experimental temperature is maintained at 70 °C and the experimental pressure is 2–12 MPa. The droplet morphology image is collected by a camera system, and the oil–gas interfacial tension is calculated through image processing and analysis.
H = f ( d g / d e )
σ = ρ d c 2 g / H
where σ denotes oi–gas interfacial tension, mN/m; ρ is the density difference between gas and liquid, g/cm3; de represents the maximum diameter of the droplet, mm; dg is the droplet diameter at the selected interface, mm; g stands for gravitational acceleration, cm/s2; H is the shape correction factor, a function related to dg and de; f is the fitting coefficient.

2.4. CO2 Drive Start Pressure Gradient Experiment

2.4.1. Experimental Steps and Plan

(1)
Experimental plan
The experiment used high-temperature and high-pressure rock core displacement equipment, selecting rock cores with different permeability ranging from 0.1 to 10 mD. The rock cores taken in the experiment were all natural rock cores from the Baima Middle Block, with a length of about 6 cm. The experimental temperature was maintained at 70 °C, and CO2 displacement was used as the displacement method, with an injection rate of 0.01–1.5 mL/min and a water content of 60%, as shown in Table 3.
(2)
Experimental steps
Pre-treatment before the experiment
Select ten natural rock cores with different permeabilities, and measure porosity and permeability after high-temperature oil washing and drying. Load the core into the gripper and apply a constant confining pressure, then vacuum and saturate the formation water for at least 6 h. After saturation, oil-drive the core at a flow rate of 0.1 mL/min, stop the pump after the effluent state stabilizes, and age at 70 °C for 48 h to establish the bound water saturation of the core.
After the core preparation is completed, water flooding was carried out at a flow rate of 0.1 mL/min. After the water content stabilized at 60%, the flooding was stopped and aged for 6 h to complete the experimental preparation.
CO2 flooding start-up pressure gradient test
Load CO2 into an intermediate container and inject it into the core at a constant flow rate of 0.5 mL/min. Monitor the inlet and outlet pressures and obtain the minimum start-up pressure difference for CO2 flooding after the pressure stabilizes. Set four levels of back pressure, namely, 2 MPa, 4 MPa, 6 MPa, and 8 MPa, and test the stable displacement pressure difference under each back pressure to determine the starting pressure under different operating conditions. Calculate the corresponding CO2 drive starting pressure gradient.

2.4.2. Experimental Principle

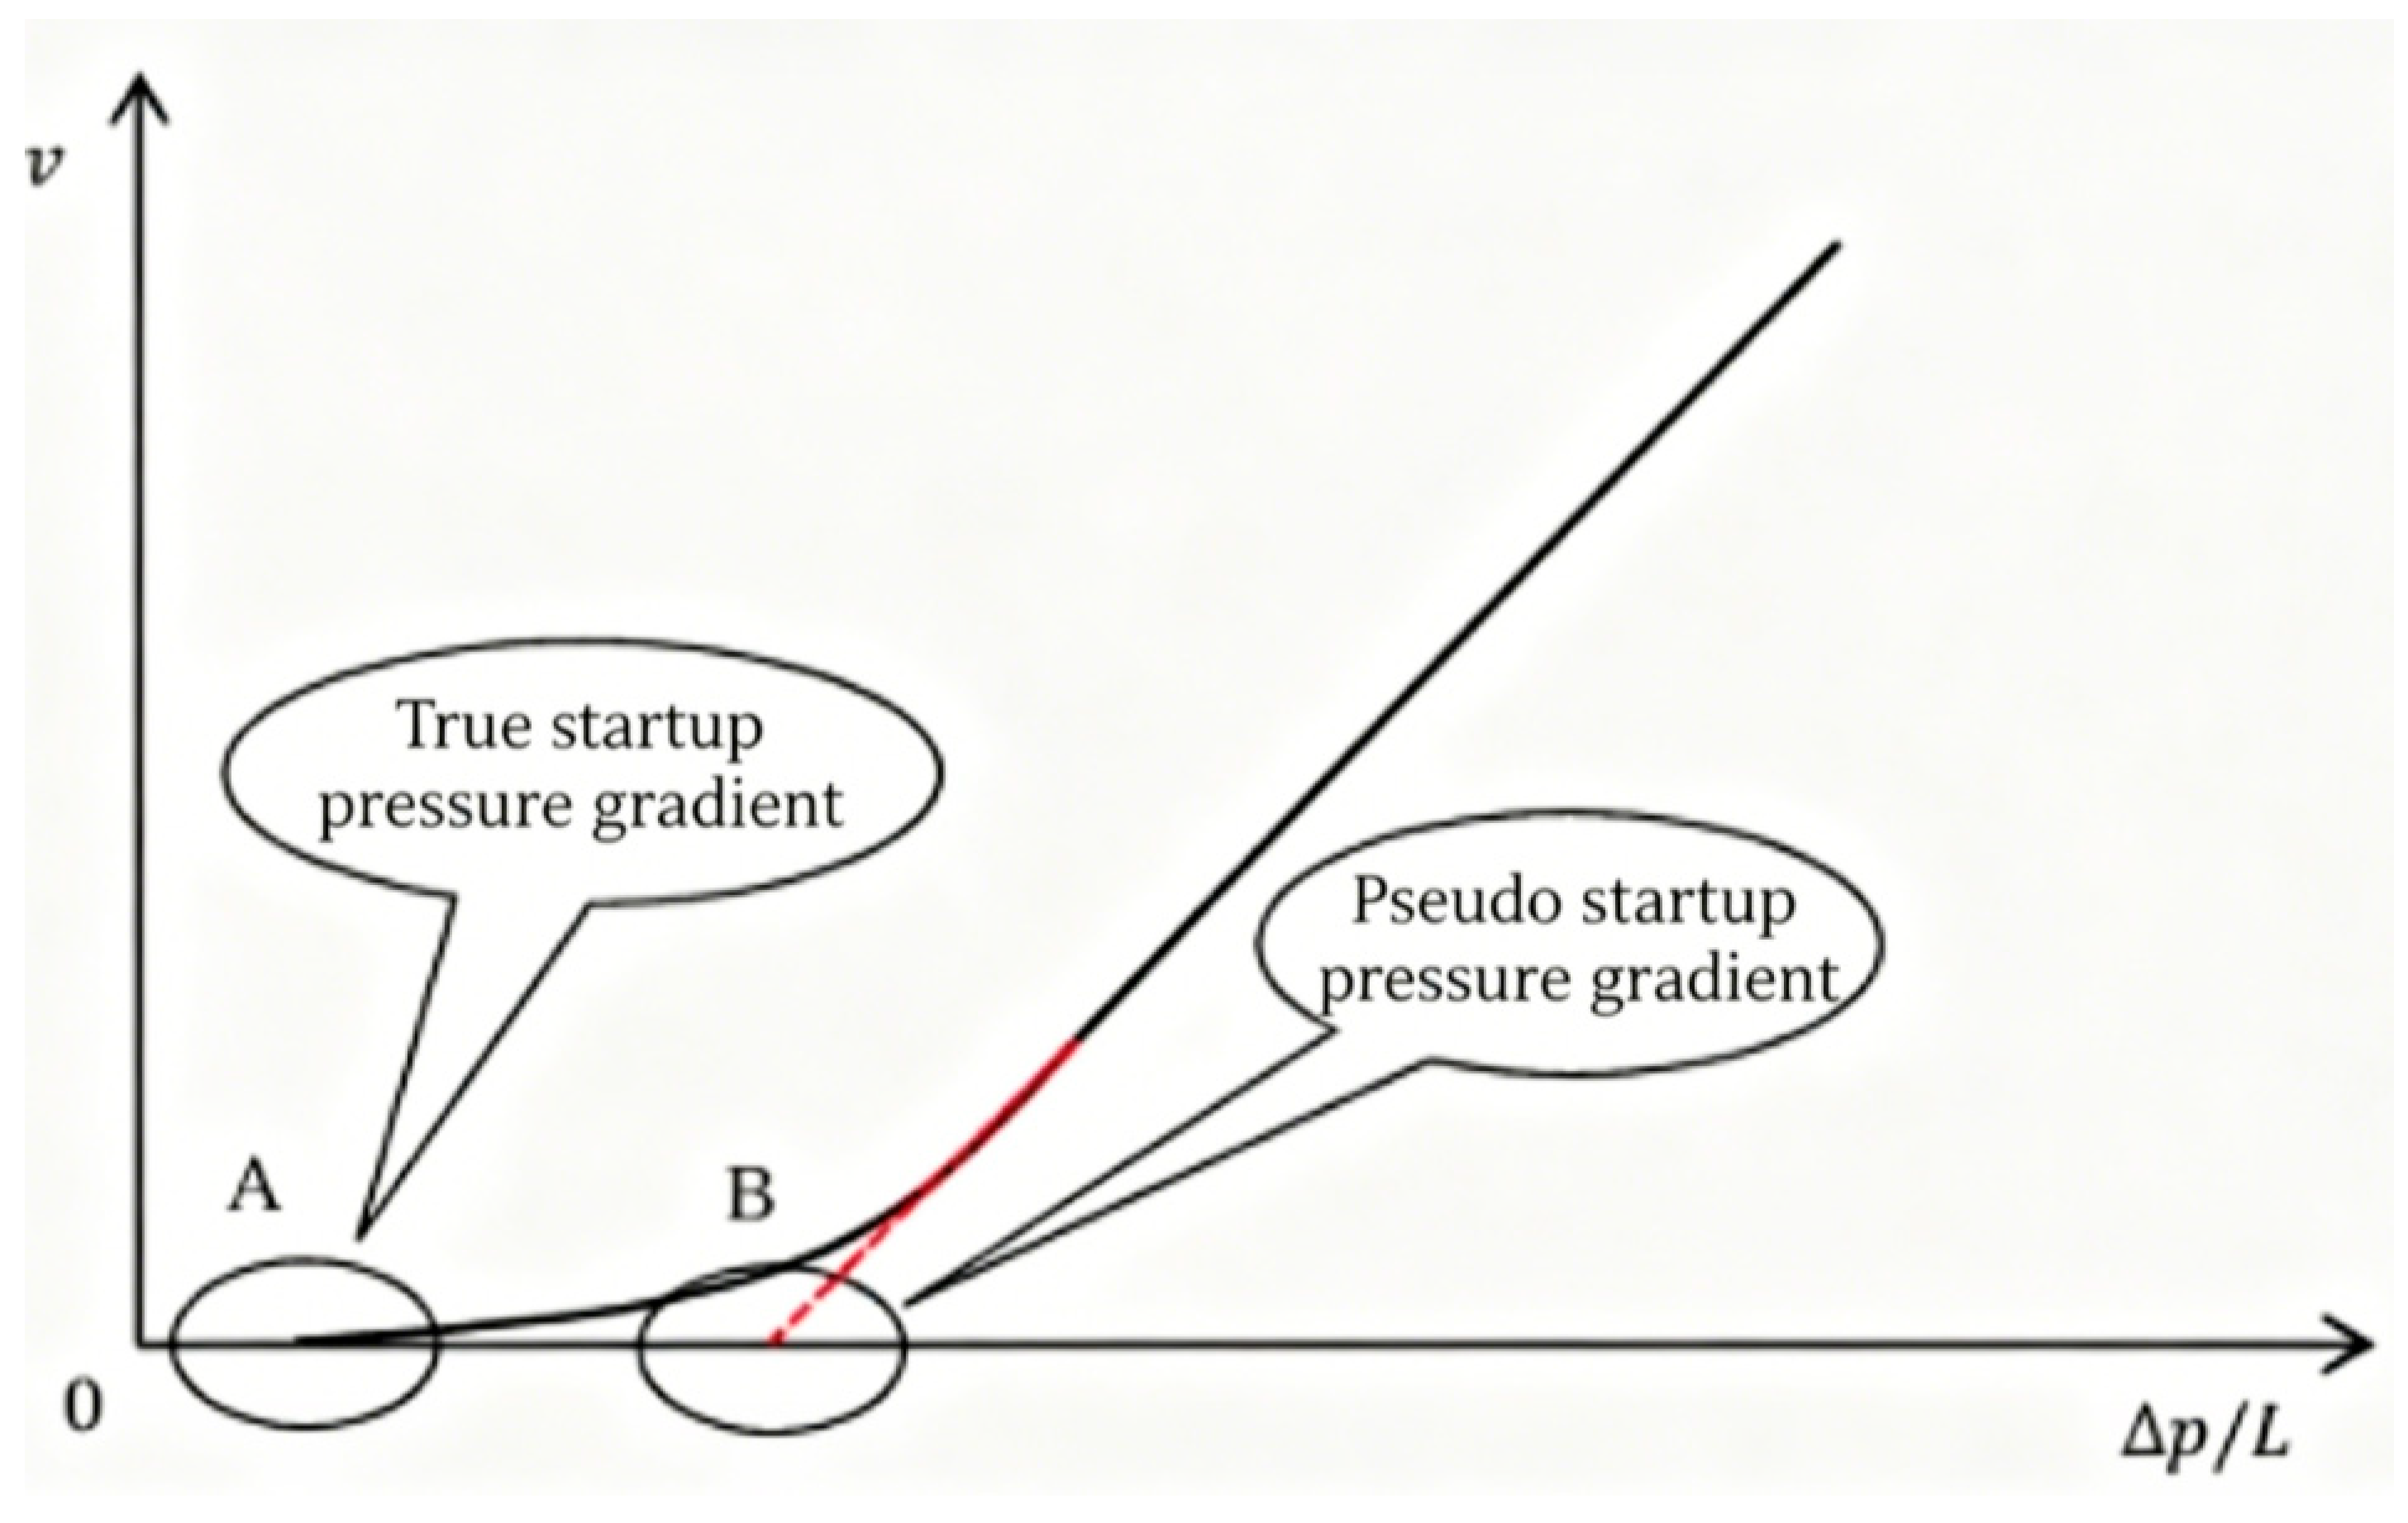
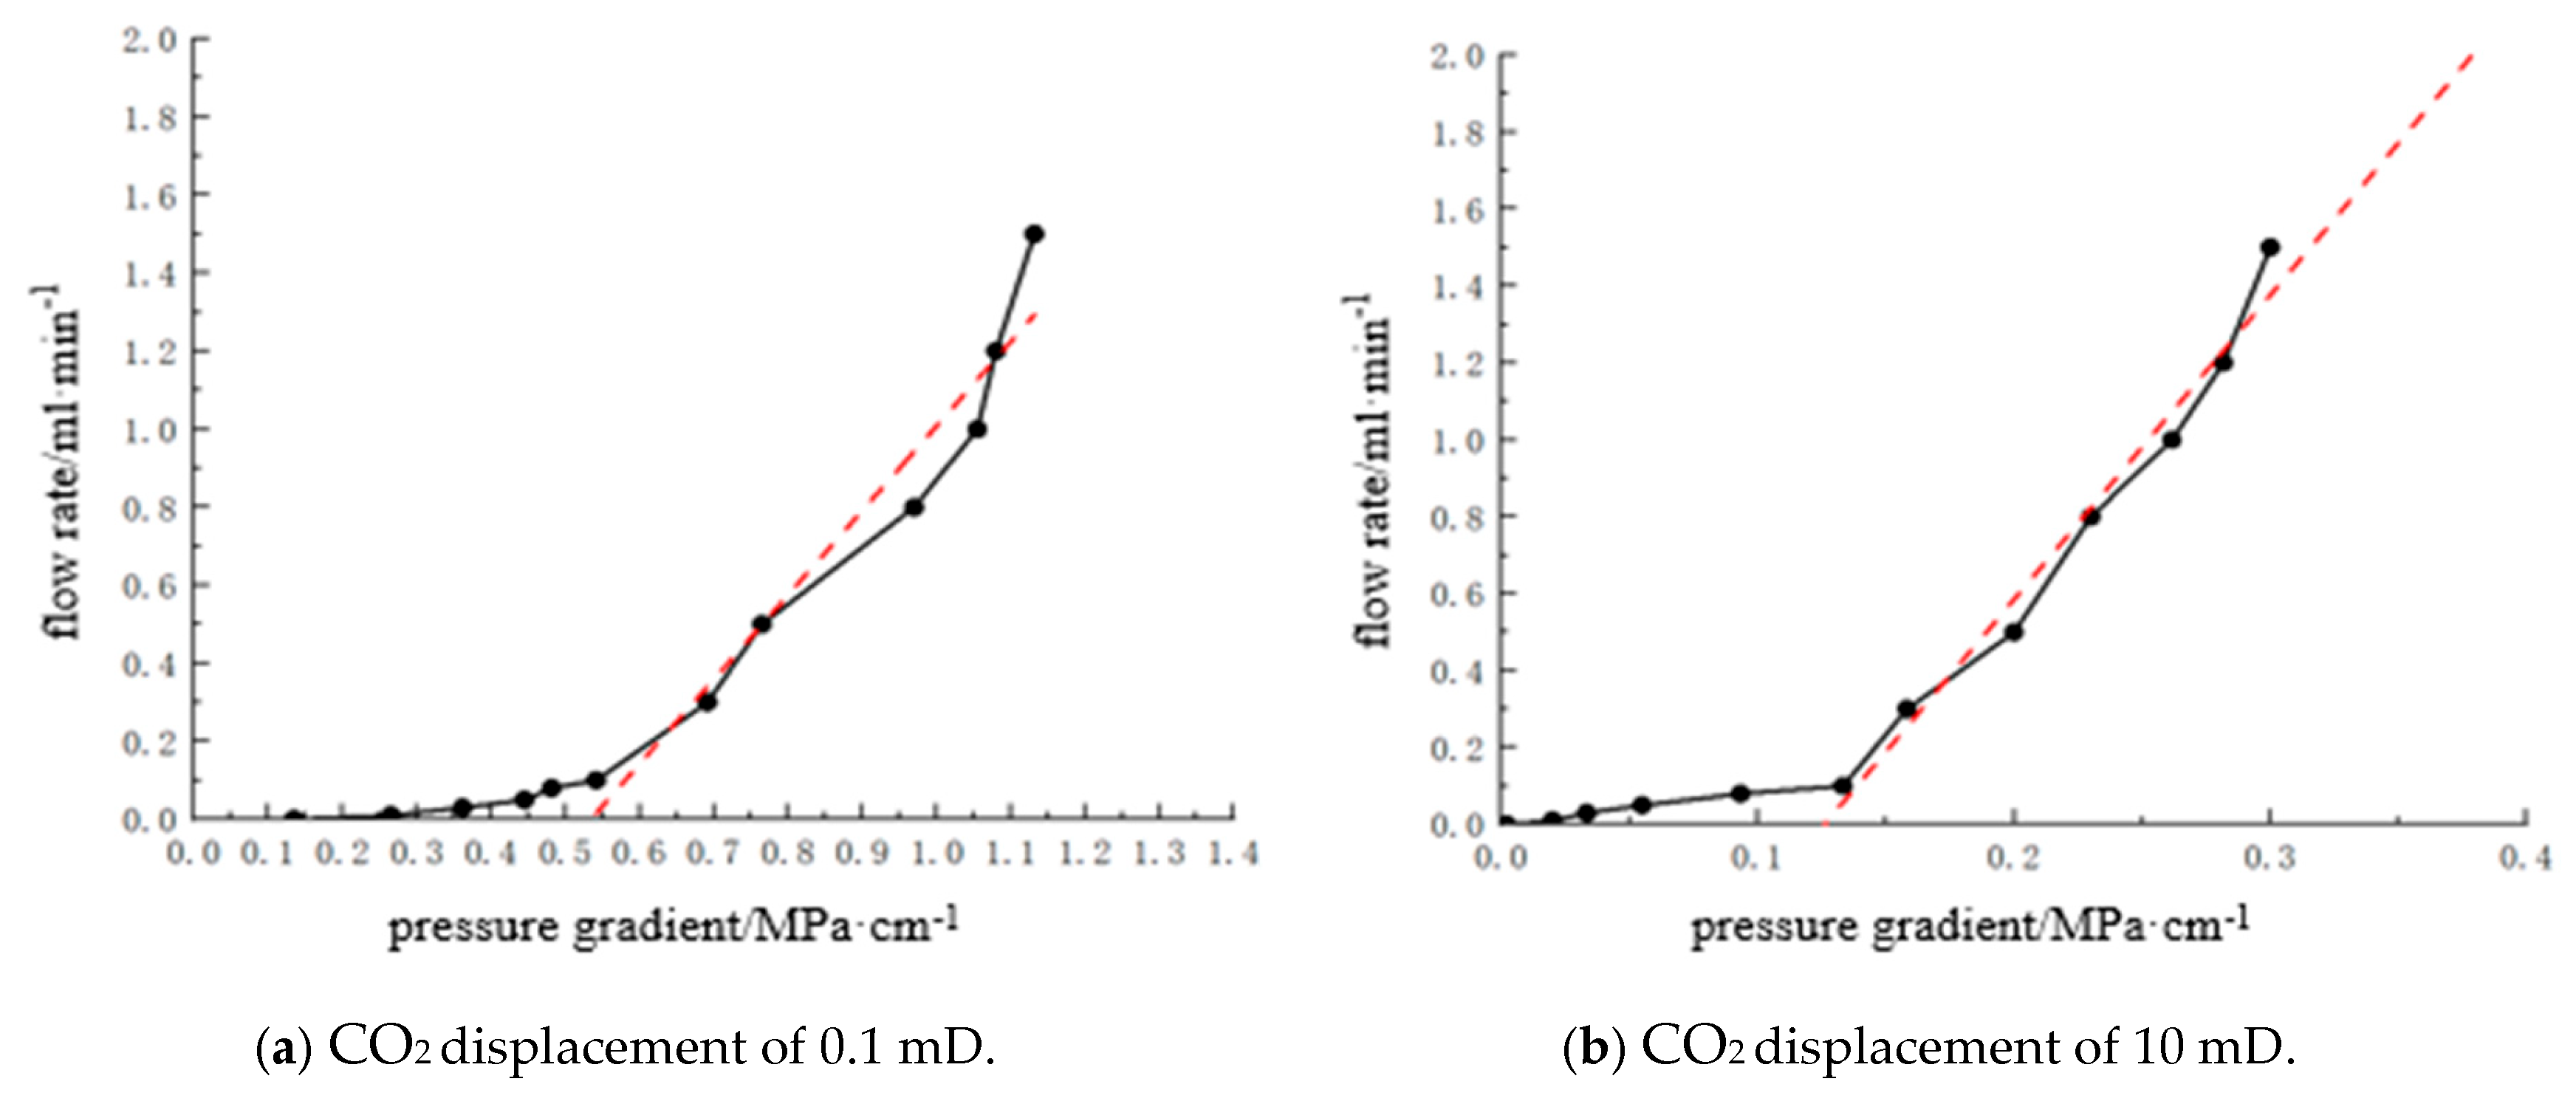
The experimental measurement was conducted using a combination of flow pressure difference method and unstable equilibrium method. Firstly, the core was placed in a stable seepage state, and the seepage velocity at both ends of the core was changed. After the displacement pressure difference had stabilized, the displacement pressure difference at both ends of the core was measured at different seepage velocities to draw a flow–pressure gradient relationship curve. By reverse extension, the intercept of the curve on the pressure gradient coordinate axis was found, which was the proposed starting pressure gradient of the core, as shown at point B in Figure 5. After the pressure gradient measurement was completed, the inlet end of the rock core was sealed to allow the pressure difference between the two ends of the rock core to naturally decrease. When the final pressure stabilized, the pressure difference between the two ends of the rock core was the true starting pressure of the rock core, and the corresponding pressure gradient was the true starting pressure gradient of the rock core, as shown at point A in Figure 5.

3. Results and Discussion

3.1. CO2–Crude Oil High-Pressure Physical Property Analysis

3.1.1. Relationship Between Different CO2 Injection Amounts and Bubble Point Pressure

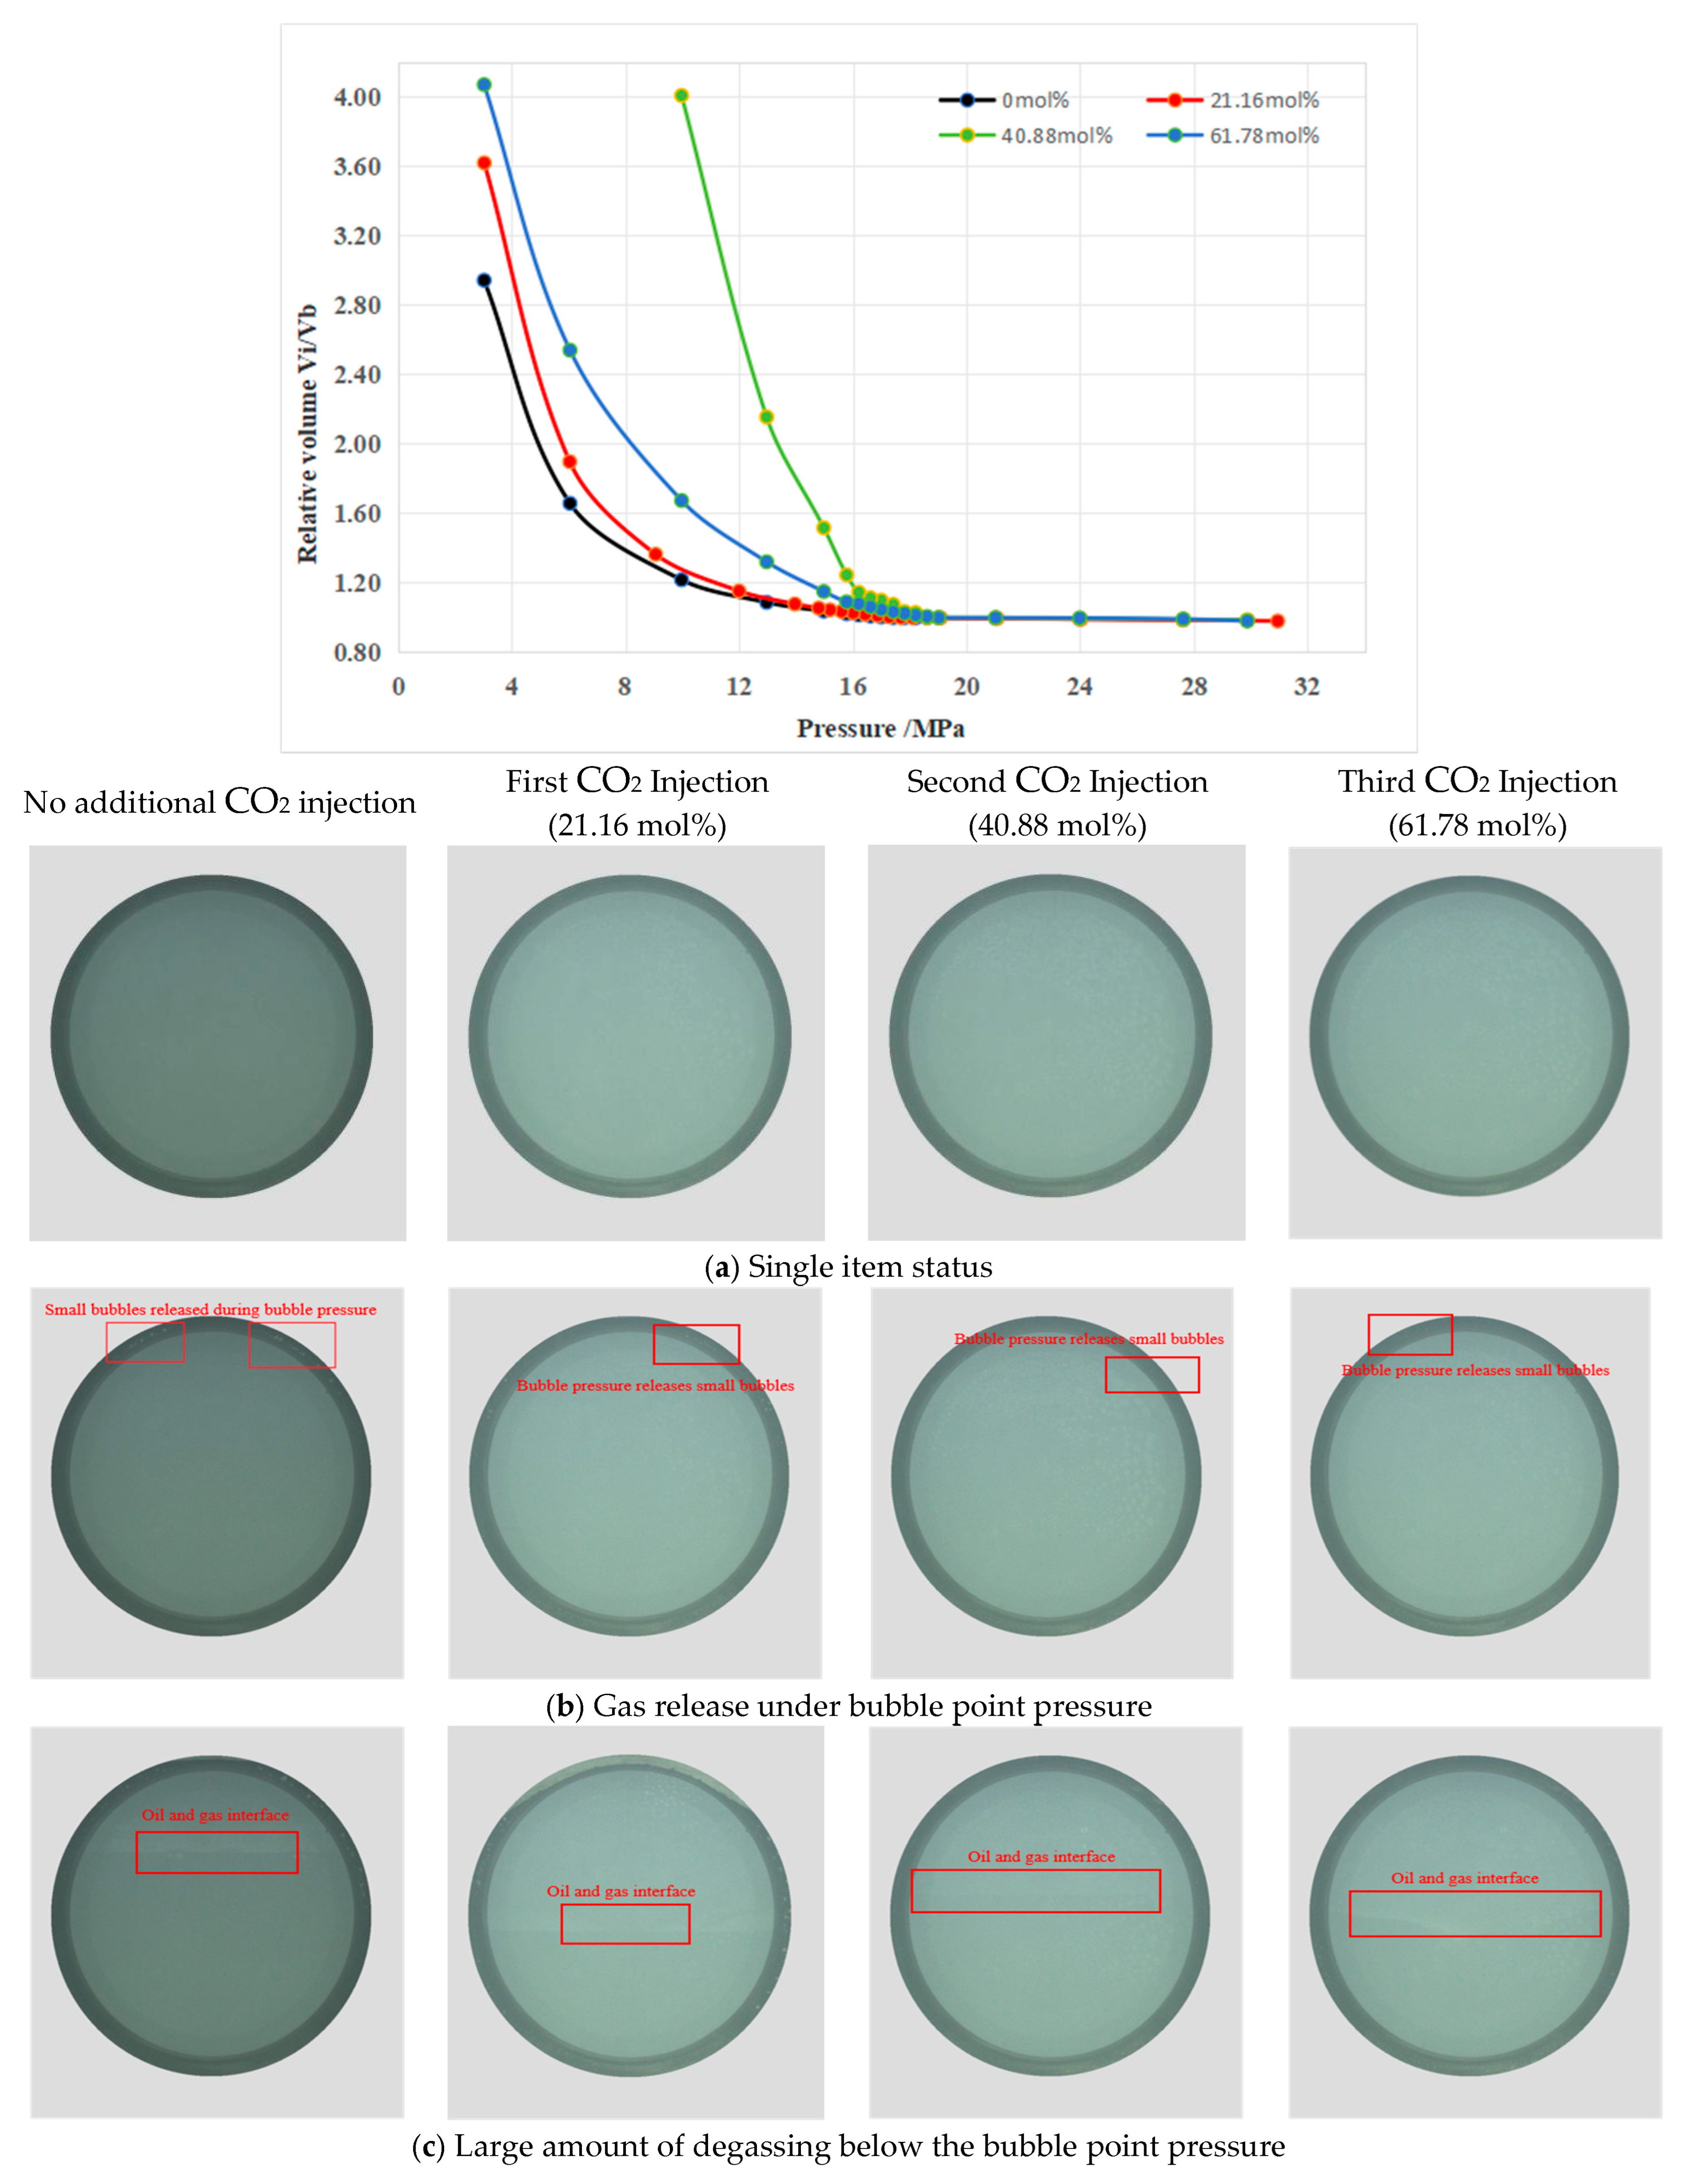
Through the constant mass expansion (CCE) experiment and CO2 injection expansion experiments, as shown in the following figure, it was found that as the CO2 injection ratio increased, the bubble point pressure of crude oil gradually increased, and the fluid degassing expansion effect was significantly enhanced when the pressure was lower than the bubble point.
As shown in Figure 6, the crude oil without gas injection is in a single state under formation pressure (a). When the crude oil reaches the bubble point pressure, small bubbles are released (b), and the recorded bubble point pressure is 17.424 MPa. After the first stage of CO2 injection (21.16%), the bubble point pressure of the blended crude oil increases to 17.690 MPa. The bubble point pressure of the second stage CO2 injection (40.88%) is 19.951 MPa. The third stage CO2 injection (61.78%) has a bubble point pressure of 22.575 MPa.
The inherent mechanism is that the large amount of CO2 dissolved in crude oil increases the dissolved gas content of the system, thereby increasing the bubble point pressure. When the formation pressure is lower than the bubble point, the CO2 system is prone to produce a large amount of free gas, which changes the fluid flow characteristics of the reservoir. This has important reference significance for maintaining formation pressure and optimizing production systems in the CO2 flooding development process.

3.1.2. Phase Diagram Analysis of Crude Oil with Different Gas–Liquid Ratios and CO2 Injection Amounts

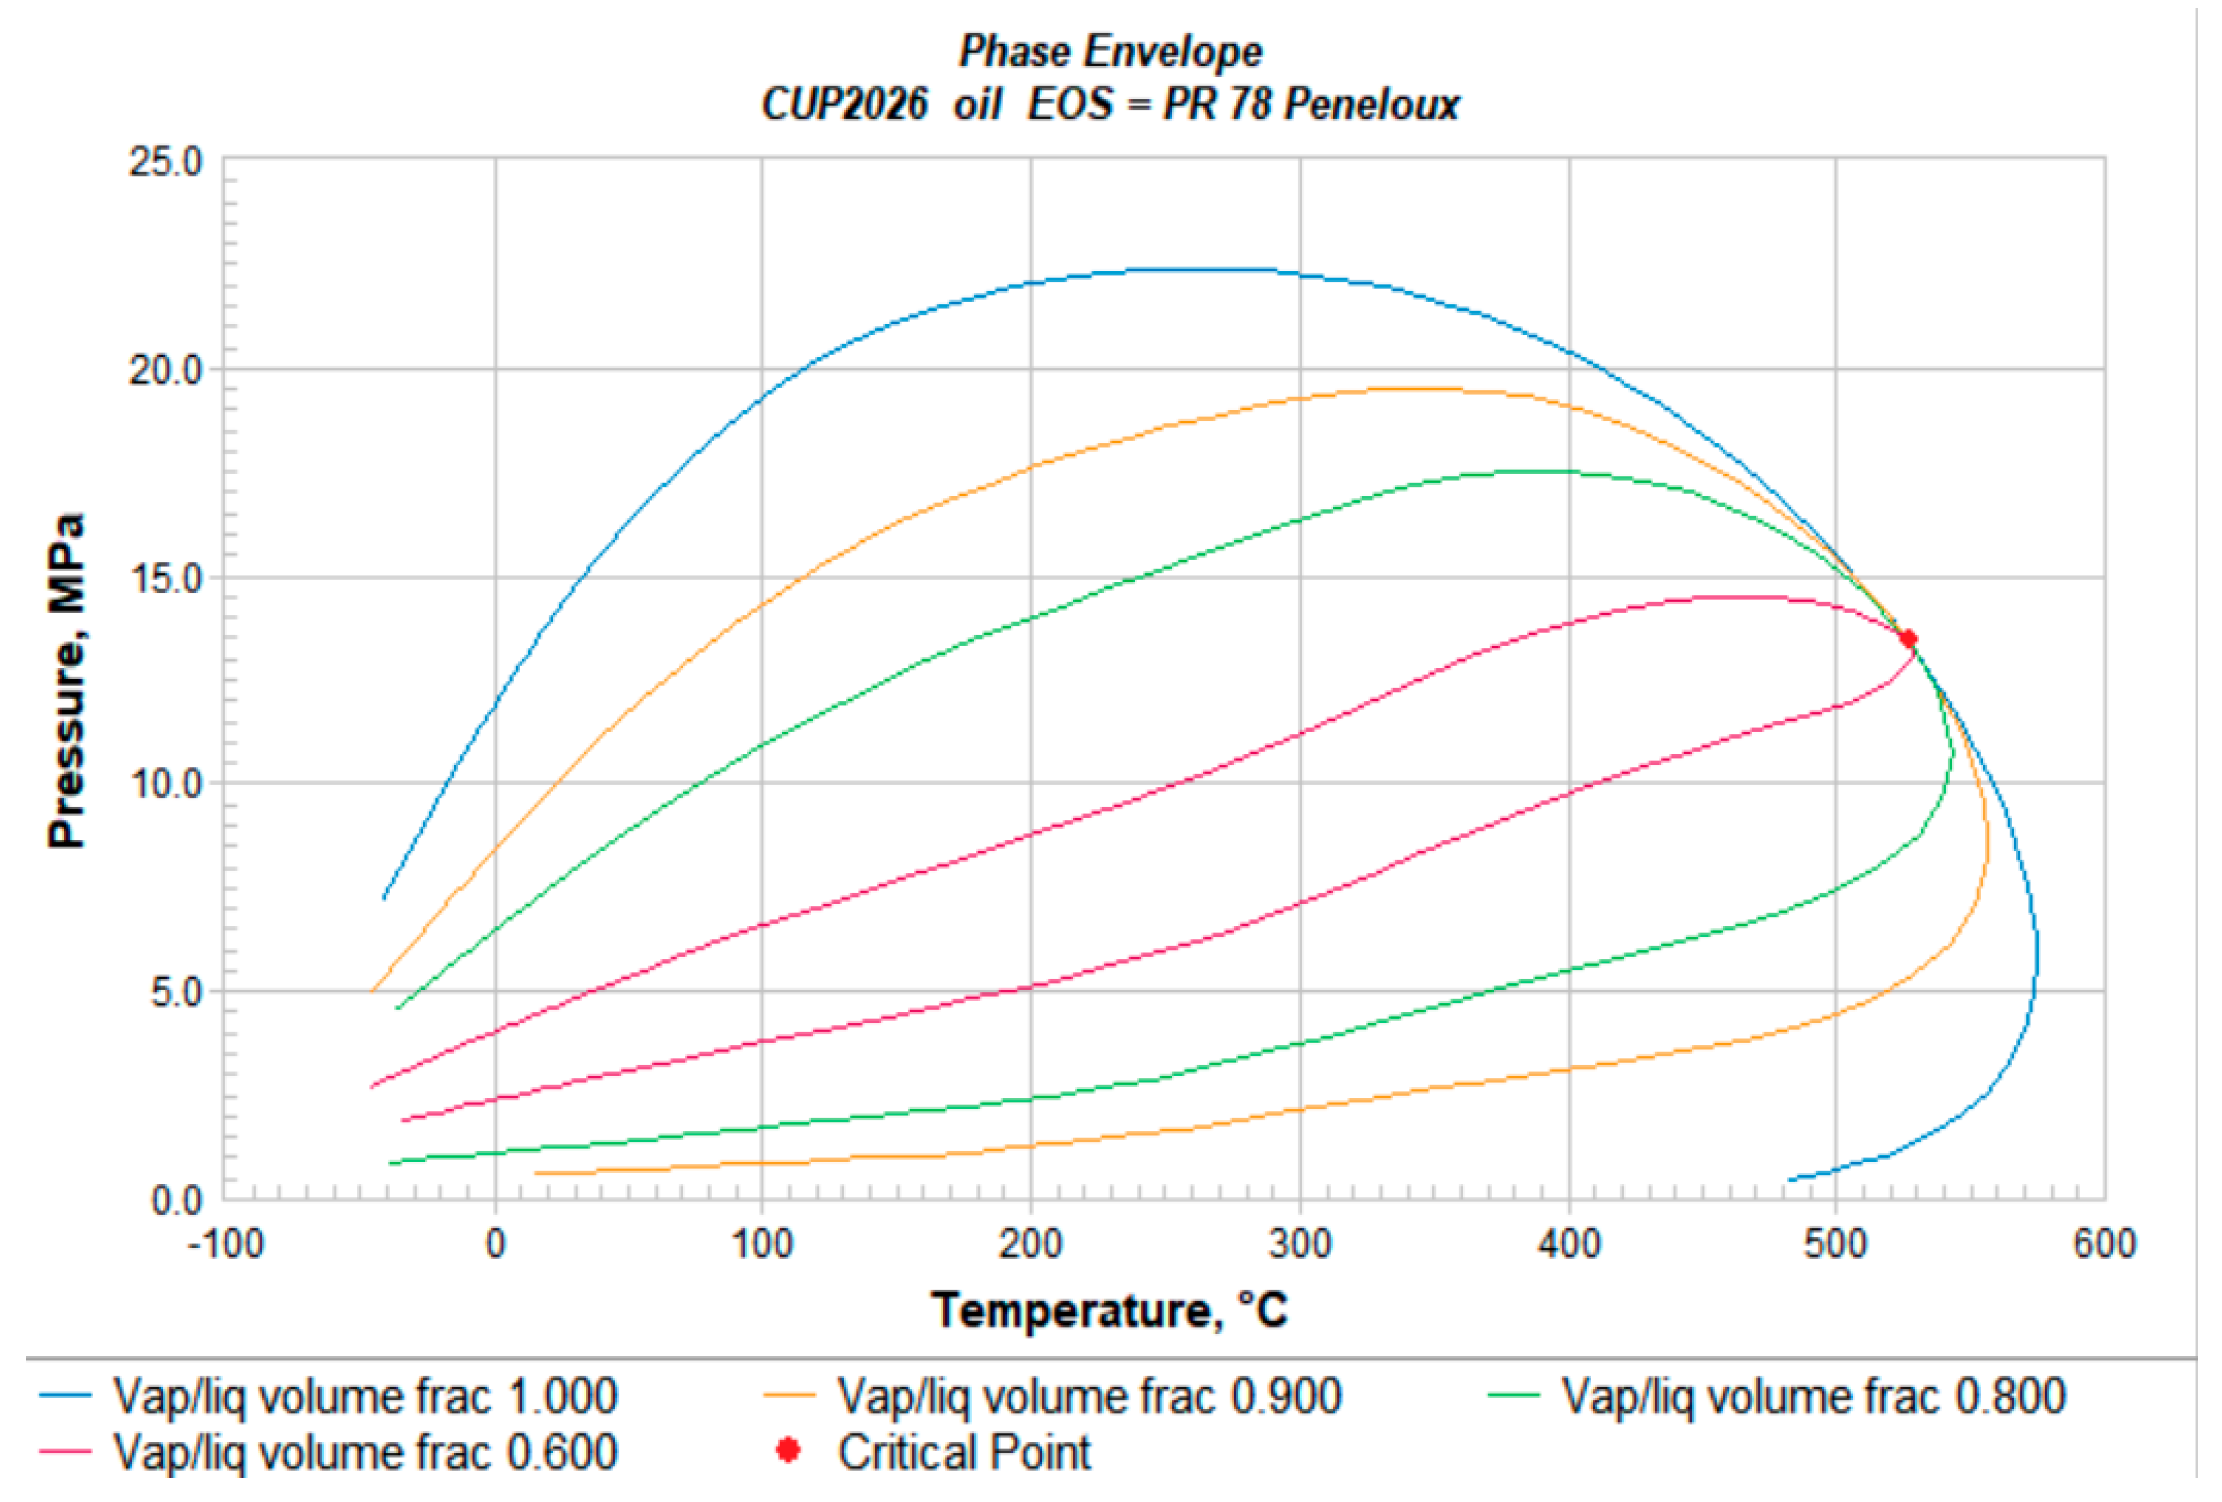
Crude oil prepared with different gas–liquid volume ratios, as shown in Figure 7, has a gas–liquid two-phase zone inside the curve, where each ratio curve intersects at the same critical point; As the gas–liquid volume ratio increases from 0.6 to 1.0, the overall phase envelope expands outward, and the temperature and pressure range of two-phase coexistence continues to increase. At the same temperature, the required pressure for phase separation is higher, and the phase boundaries of each curve in the low-temperature range differ significantly. As the critical temperature approaches, the curves gradually converge. The increase in the proportion of gas phase increases the probability of gas–liquid two-phase formation in crude oil, which can easily cause two-phase seepage in the reservoir. This law can provide a basis for reservoir pressure control and gas-injection drive-phase state control.
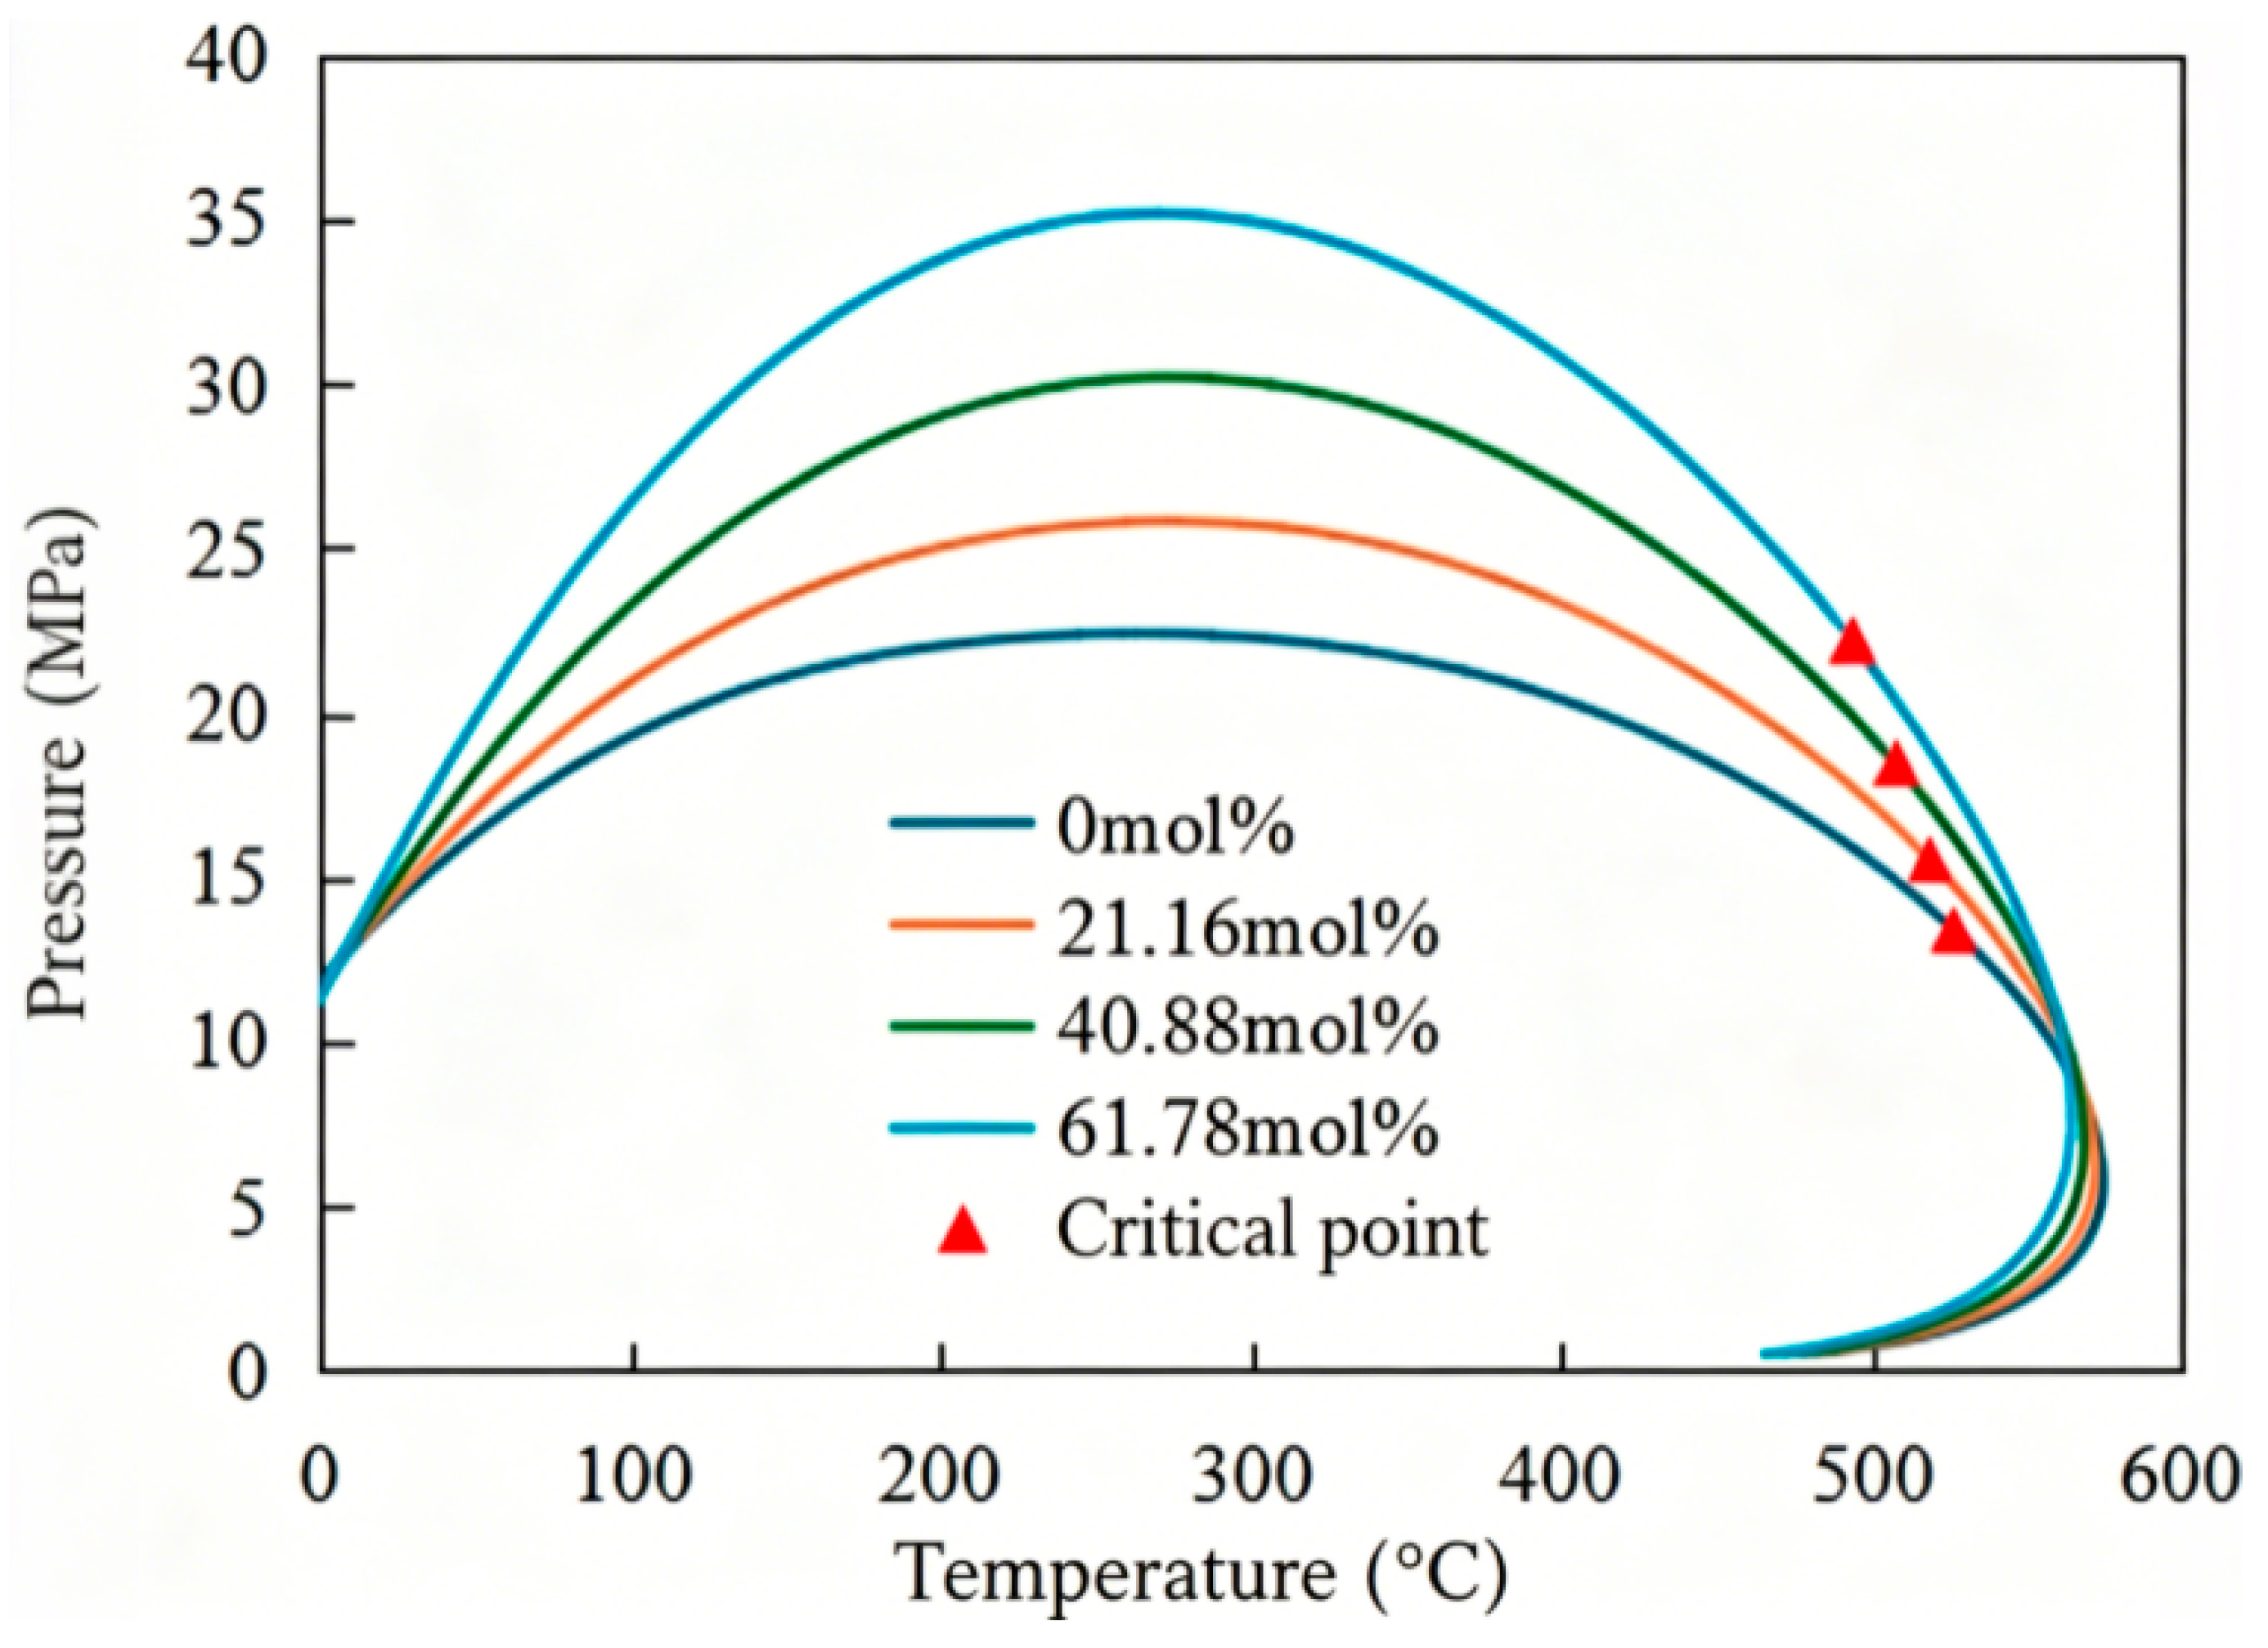
Figure 8 shows the temperature–pressure phase-envelope diagram of crude oil systems with different CO2 molar injection ratios. The interior of the curve is the gas–liquid two-phase region, and the triangle marks the critical points of each system. As shown in the table, with the increase in CO2 mole fraction from 0% to 61.78%, the bubble point pressure of the formation crude oil increases, the volume expands, and the viscosity decreases, indicating that CO2 can effectively supplement energy, improve the flow capacity of crude oil, and provide basic parameters and relevant basis for CO2 injection development of the target reservoir; The phase envelope expands outward, and the temperature and pressure range of the coexistence of the two phases continues to widen. The critical point shifts synchronously towards high temperature and high pressure, and the regulatory effect of CO2 on the phase state is more significant in the low temperature range. The dissolution of CO2 increases the gas-liquid phase separation range of crude oil, which can easily cause two-phase flow in the reservoir, providing a phase basis for maintaining formation pressure and controlling phase mixing in CO2 flooding (see Table 4).

3.2. Analysis of Minimum Mixed-Phase Pressure in Slim-Tube Experiment

Analysis of Minimum Mixed-Phase Pressure of CO2 Under Different Moisture Content Conditions

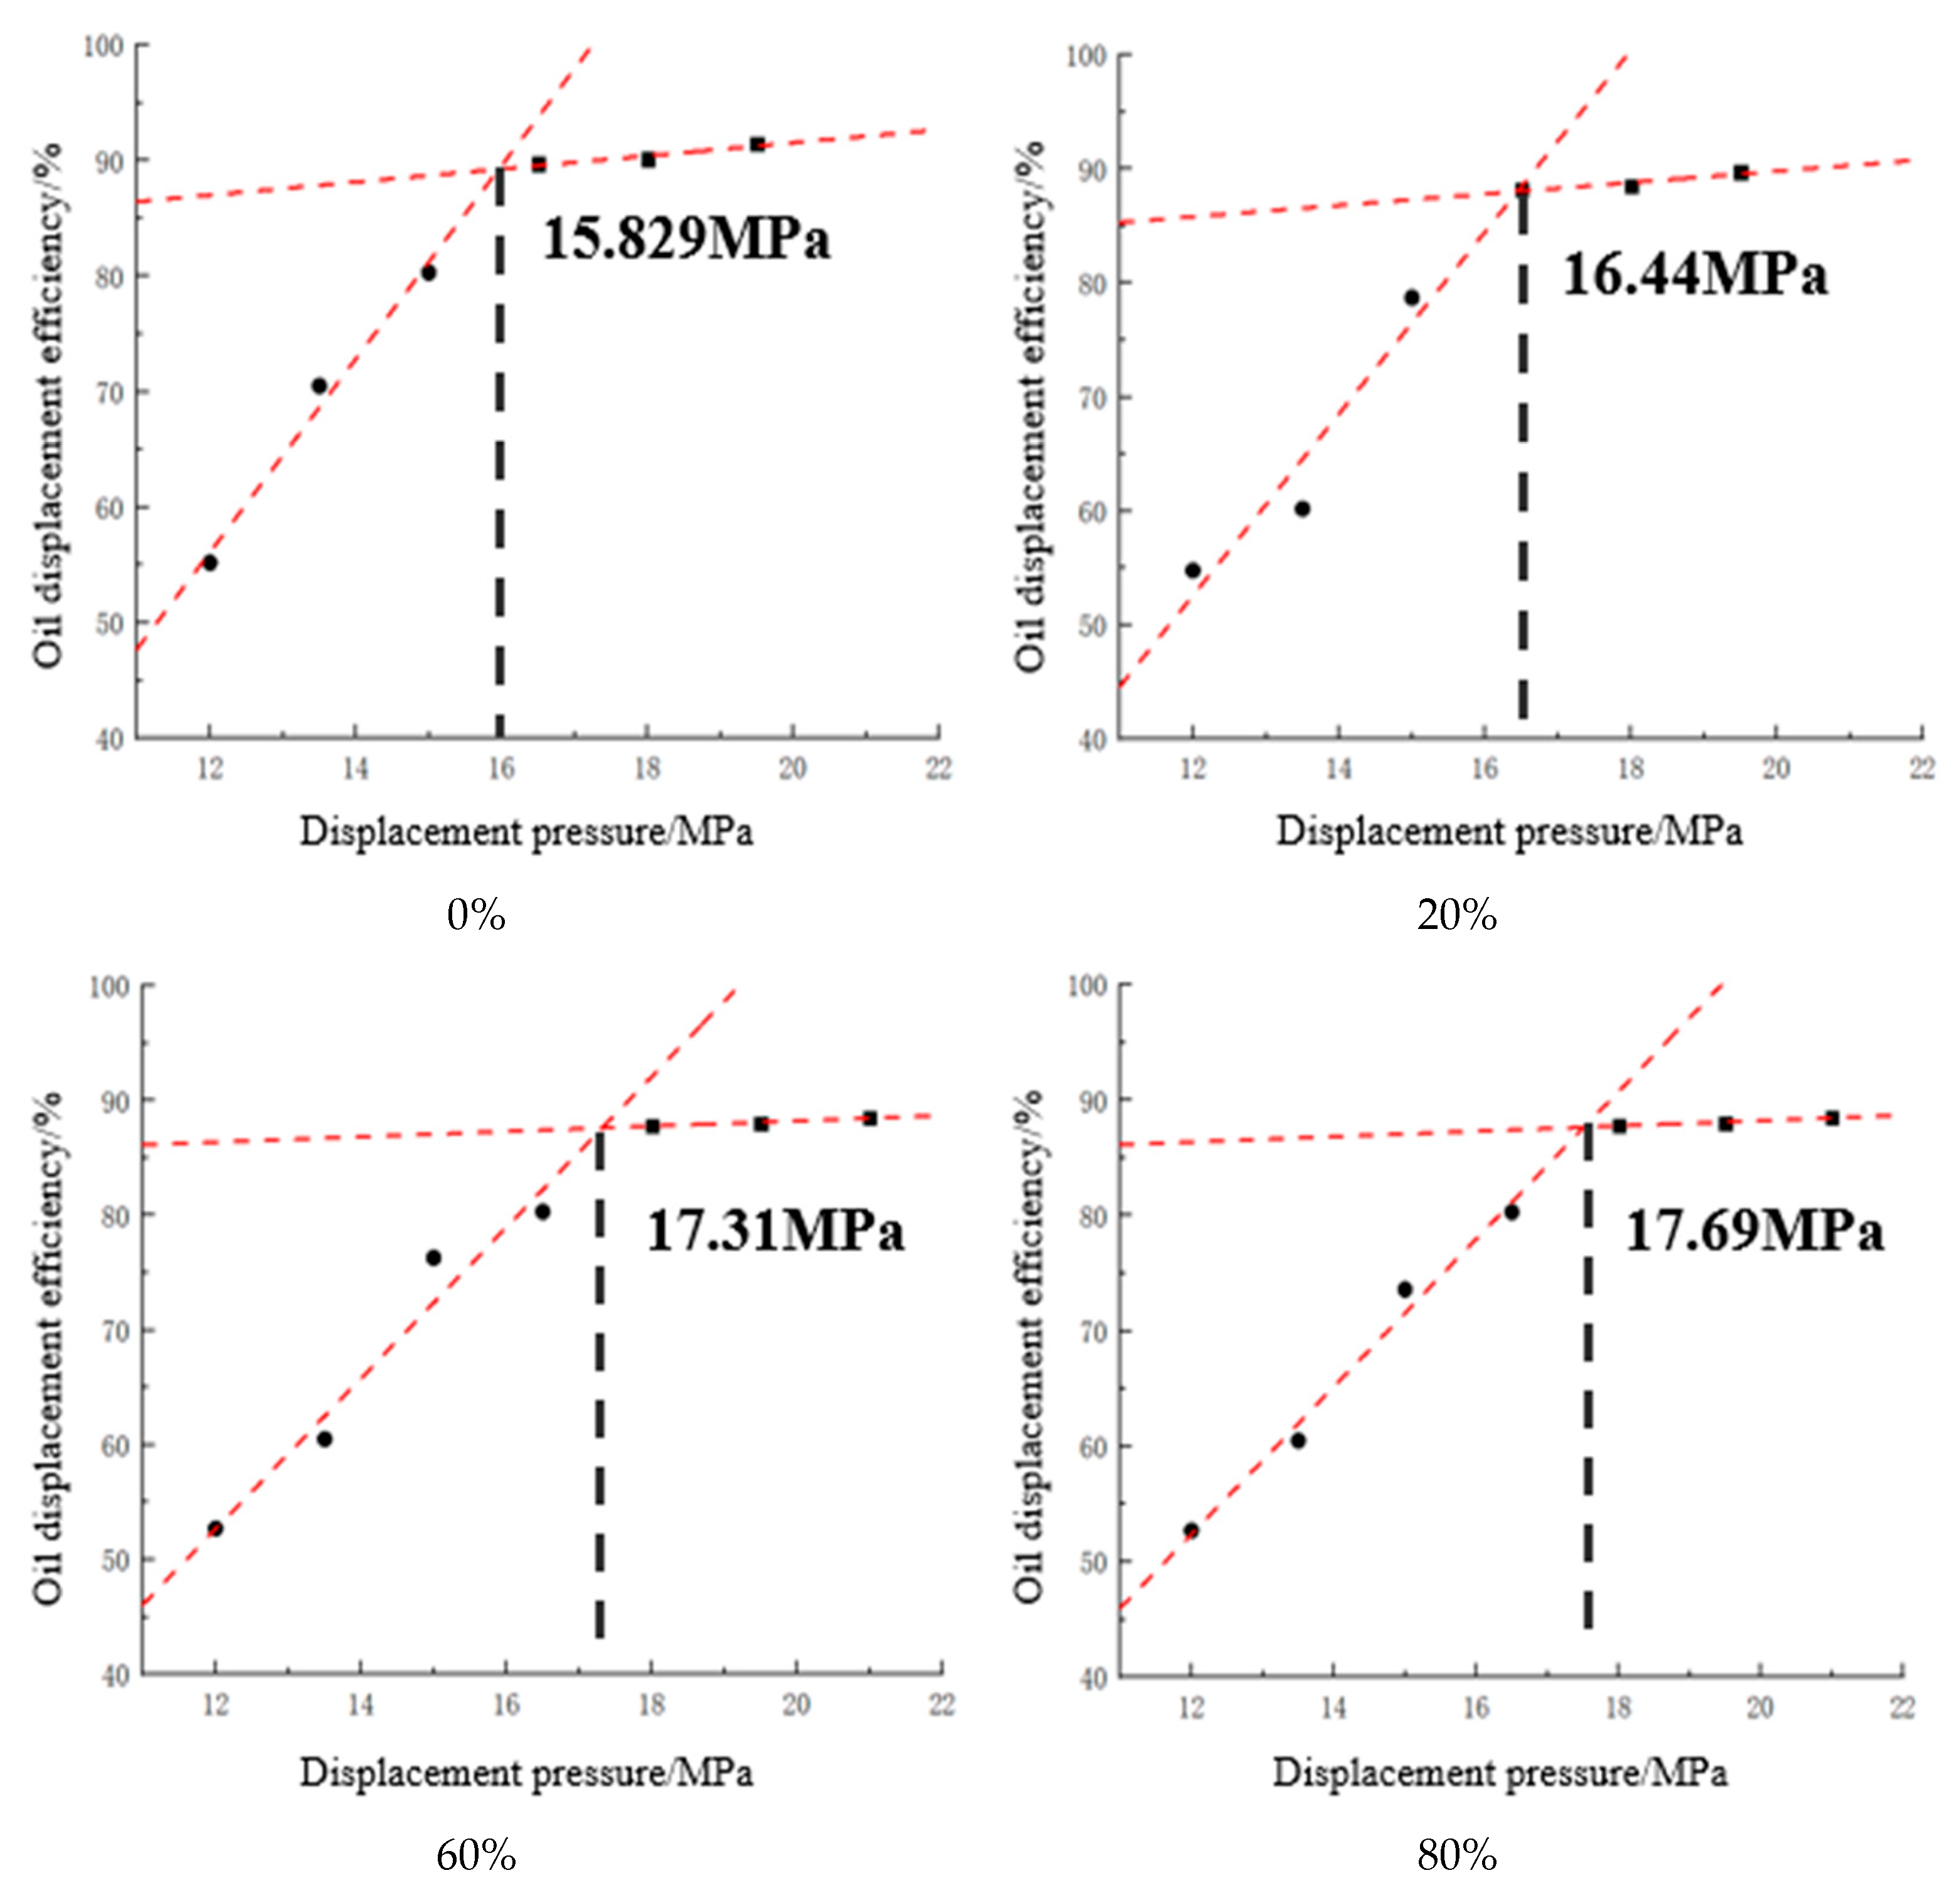
Using a thin-tube model experiment to calculate the mixed-phase pressure, thin-tube displacement experiments were conducted at different pressure points of 12.0 MPa, 13.5 MPa, 15.0 MPa, 16.5 MPa, 18.0 MPa, 19.5 MPa, and 21.0 MPa with a formation temperature of 70 °C and water content of 0%, 20%, 60%, and 80%. By measuring the oil displacement efficiency under different water content conditions and fitting the data (as shown in Figure 9), the minimum miscibility pressure under different water content conditions was obtained.
As shown in Table 5, when the experimental pressure is lower than the apparent MMP, the oil-displacement efficiency increases significantly with increasing experimental pressure. When the experimental pressure exceeds the apparent MMP, the experimental pressure has no significant influence on the oil-displacement efficiency. As the water cut gradually increases from 0% to 80%, the apparent minimum miscibility pressure (apparent MMP) obtained from slim-tube displacement-efficiency fitting rises monotonically from 15.83 MPa to 17.69 MPa. This elevated apparent MMP originates from complicated multiphase-flow effects inside the slim-tube system under high water-cut conditions, rather than representing an increase in the intrinsic thermodynamic critical miscibility pressure of the pure CO2–crude-oil fluid system.
Pressure < MMP (non-miscible drive): There is a clear gas–liquid interface between CO2 and crude oil, which relies on extraction and evaporation to achieve mass transfer of light components. The interface tension is high, and a large amount of residual oil is retained by capillary action in the pores and throats. As the pressure increases, the density of CO2 increases, the interfacial tension between oil and gas decreases, the ability of CO2 to extract crude oil increases, and the oil washing efficiency continues to improve.
Pressure ≥ MMP (mixed phase drive): CO2 and crude oil reach dynamic mixing, the interface between the two phases disappears, there is no capillary binding, and the crude oil in the matrix pores can be fully driven out. When continuing to increase pressure, the differences in oil and gas composition are no longer significant, and the recovery rate is no longer significantly improved.

3.3. Analysis of Interfacial Tension Between CO2 and Crude Oil

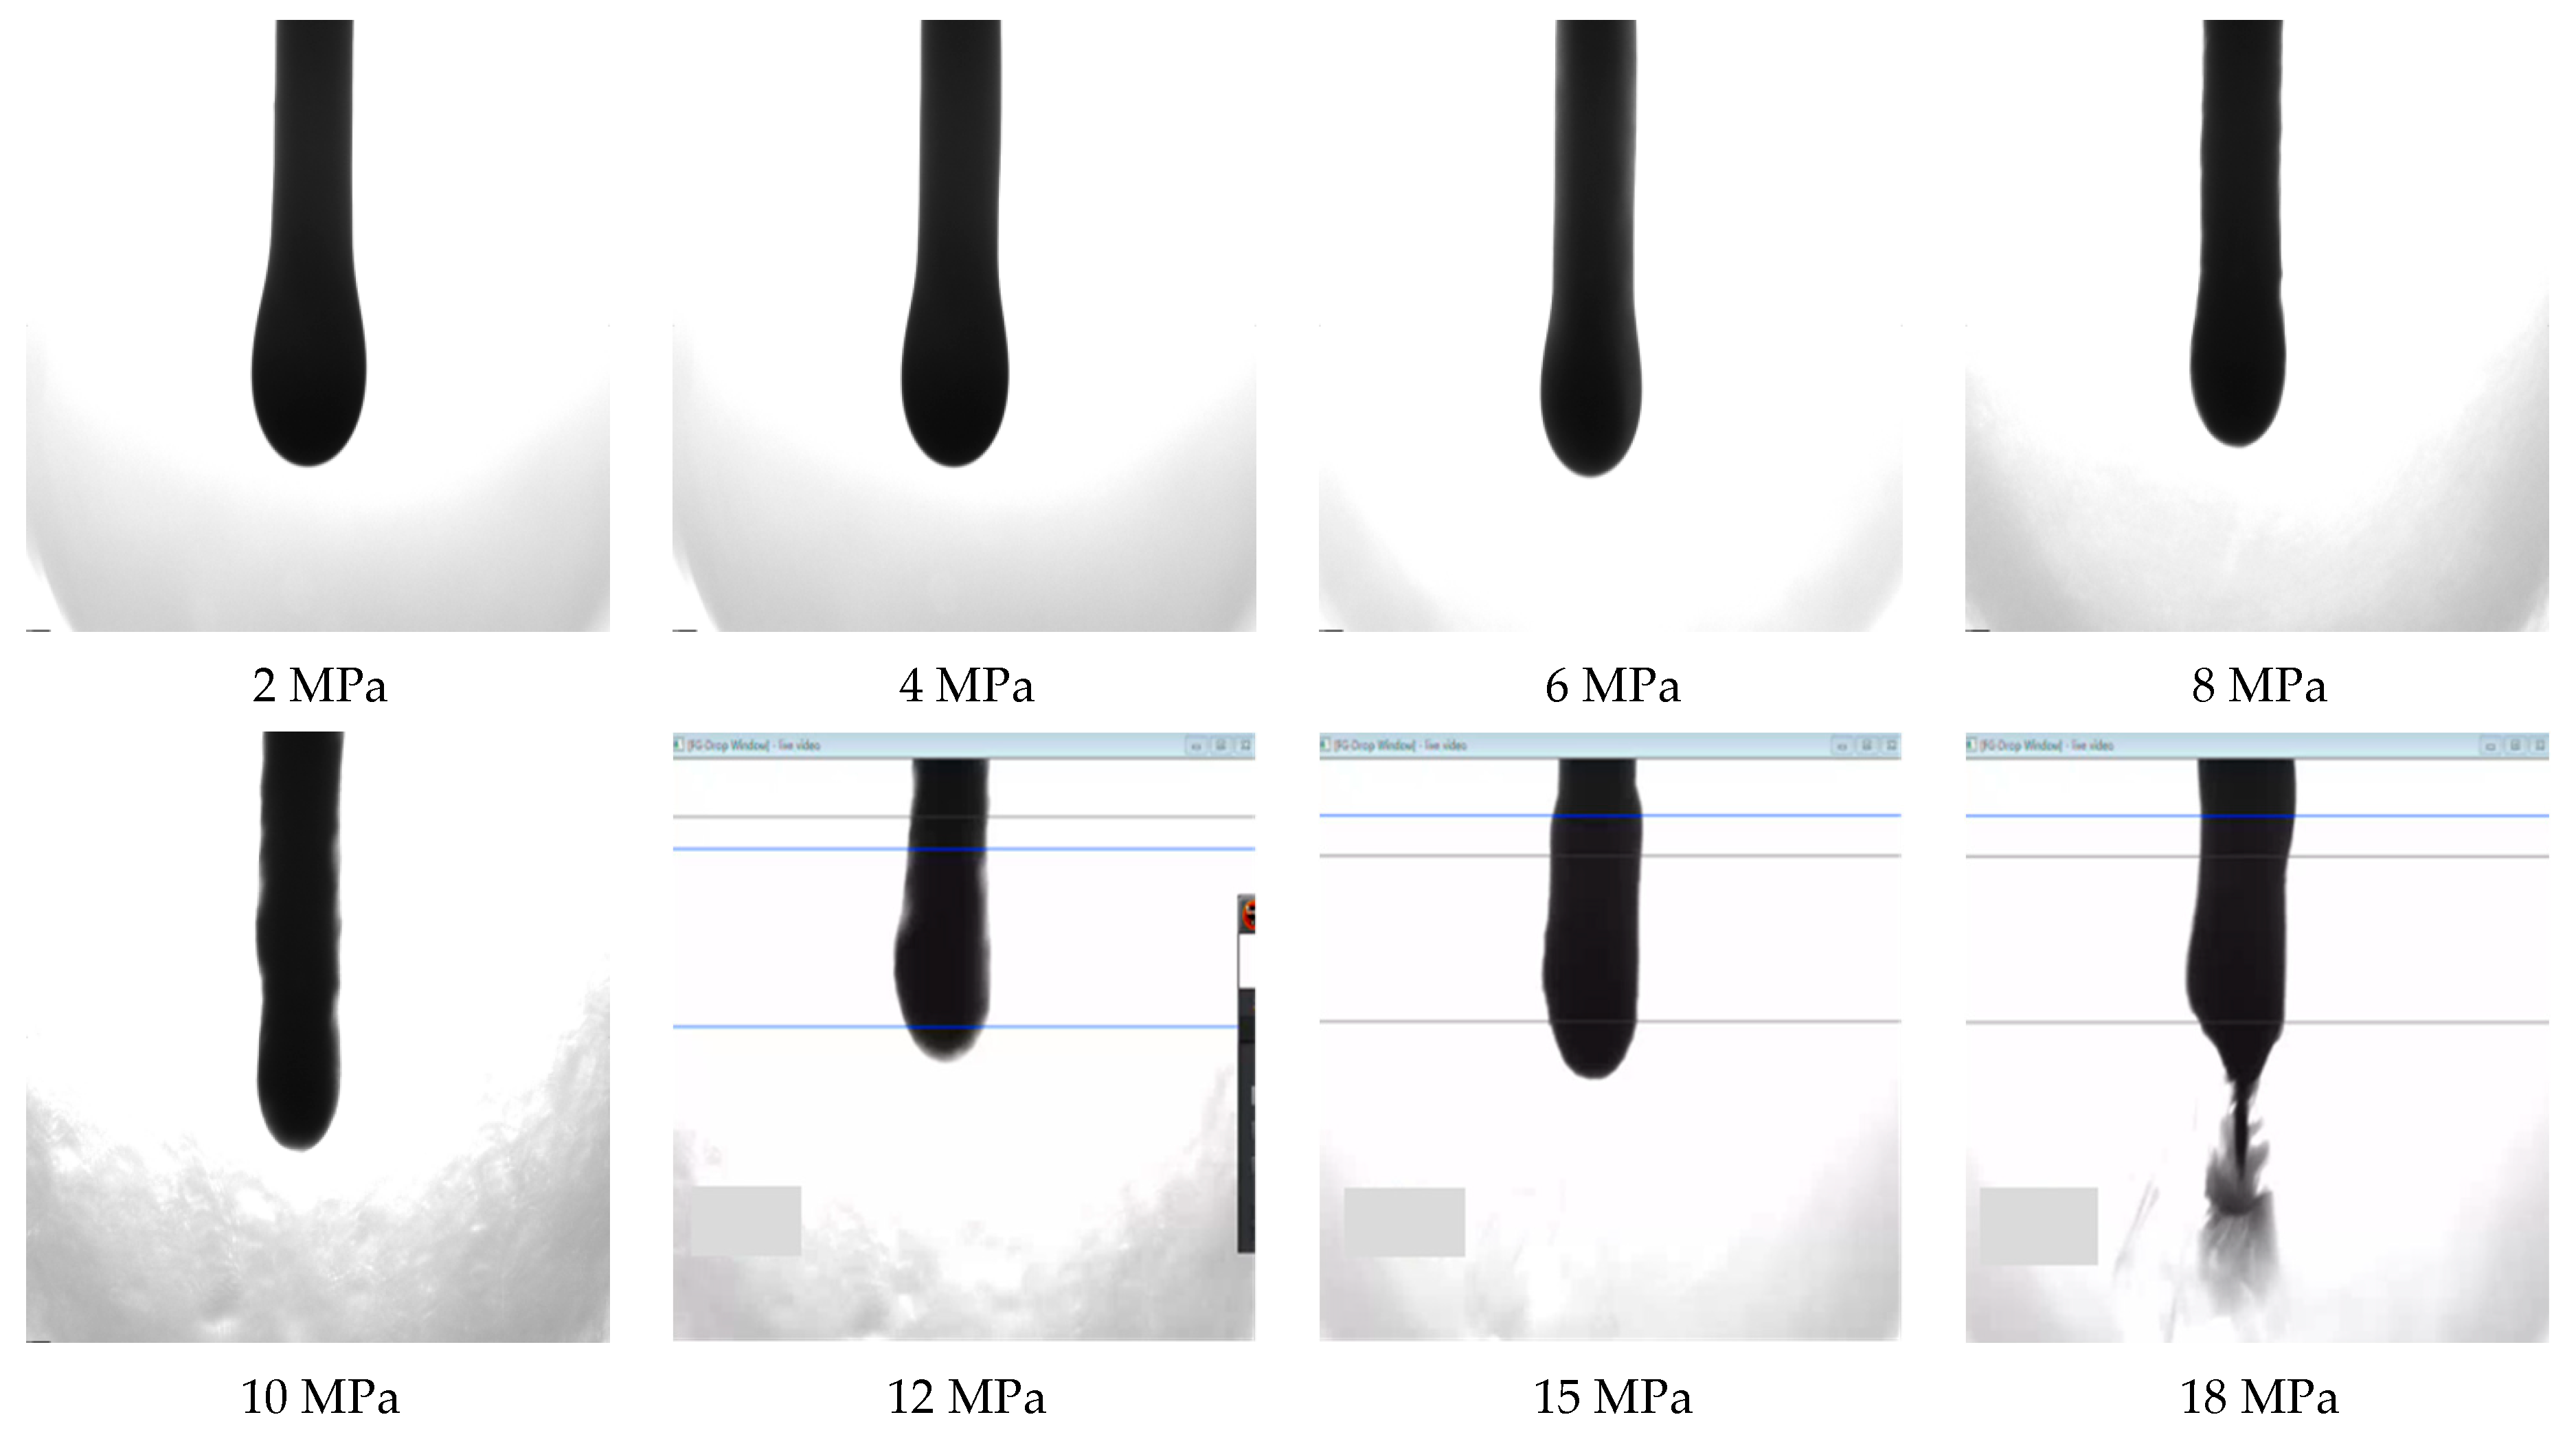
By using a camera system to capture images of droplet morphology under different pressures, and after settling into two-phase equilibrium, a suspended droplet contour image was collected (as shown in Figure 10). As the pressure increased from 2 MPa to 12 MPa, the oil droplets became full and regular, and the interfacial tension under that pressure was measured by parameters such as the volume of the suspended droplet.
The interfacial tension between oil and gas was calculated through image processing and analysis (see Table 6). As the experimental pressure continued to rise, the density of CO2 continued to increase, and the interfacial tension between CO2 and crude oil gradually decreased. As the pressure increased from 2 MPa to 10 MPa, the contour of the crude oil droplet was smooth and fully pear shaped, and the bottom of the droplet was rounded without stretching, shrinkage, or dispersion. The overall volume of the droplet was stable, the boundary was clear and complete, and there was no significant elongation of the droplet below the needle tip; As the pressure increased to 18 MPa, the bottom of the droplet became completely unstable, and the crude oil dispersed and atomized downwards from the tip of the needle. The original intact hanging droplet shape was completely broken, and stable and intact droplets could not be formed, with flocculent dispersed fluid appearing. No direct experimental measurements of interfacial tension were available for the pressure range of 12–18 MPa. Relevant values in this interval were derived from polynomial extrapolation based on valid experimental data from 2–12 MPa and should not be interpreted as experimentally observed decreasing trends.
Under high pressure, a large amount of CO2 dissolved in crude oil, and the properties of the oil phase and CO2 gas phase components were significantly similar. The interfacial energy between the two phases sharply decreased, and the interfacial tension dropped to an extremely low level (near mixed-phase interface state). When the interfacial tension was too low, a stable liquid gas interface could not be maintained, and droplets could not maintain a complete suspended droplet structure, resulting in shrinkage, atomization, and dispersion. That pressure was close to the minimum miscible pressure of CO2 and crude oil, and the two phases tended to be miscible.

3.4. Analysis of CO2 Drive Pressure Gradient

We selected rock cores with different permeabilities ranging from 0.1 to 10 mD, obtained data through experiments, and used the flow pressure difference method to fit the curve. Then, we determined the magnitude of the proposed and actual starting pressure gradients for water/CO2 flooding under different permeability conditions.

CO2 Flooding Start-Up Pressure Gradient Under Different Permeability Conditions

Analysis of the starting pressure gradient of CO2 flooding in rock cores with different permeabilities:
As shown in Figure 11, different permeability cores of 0.1 and 10 mD were selected, and data were obtained and fitted through experiments. The permeability was 0.1 mD, and the simulated pressure gradient for CO2 flooding was 0.2416 MPa/cm, with a true pressure gradient of 0.0212 MPa/cm. The permeability was 10 mD, the simulated pressure gradient for CO2 flooding was 0.1260 MPa/cm, and the actual pressure gradient was 0.0021 MPa/cm (see Table 7).
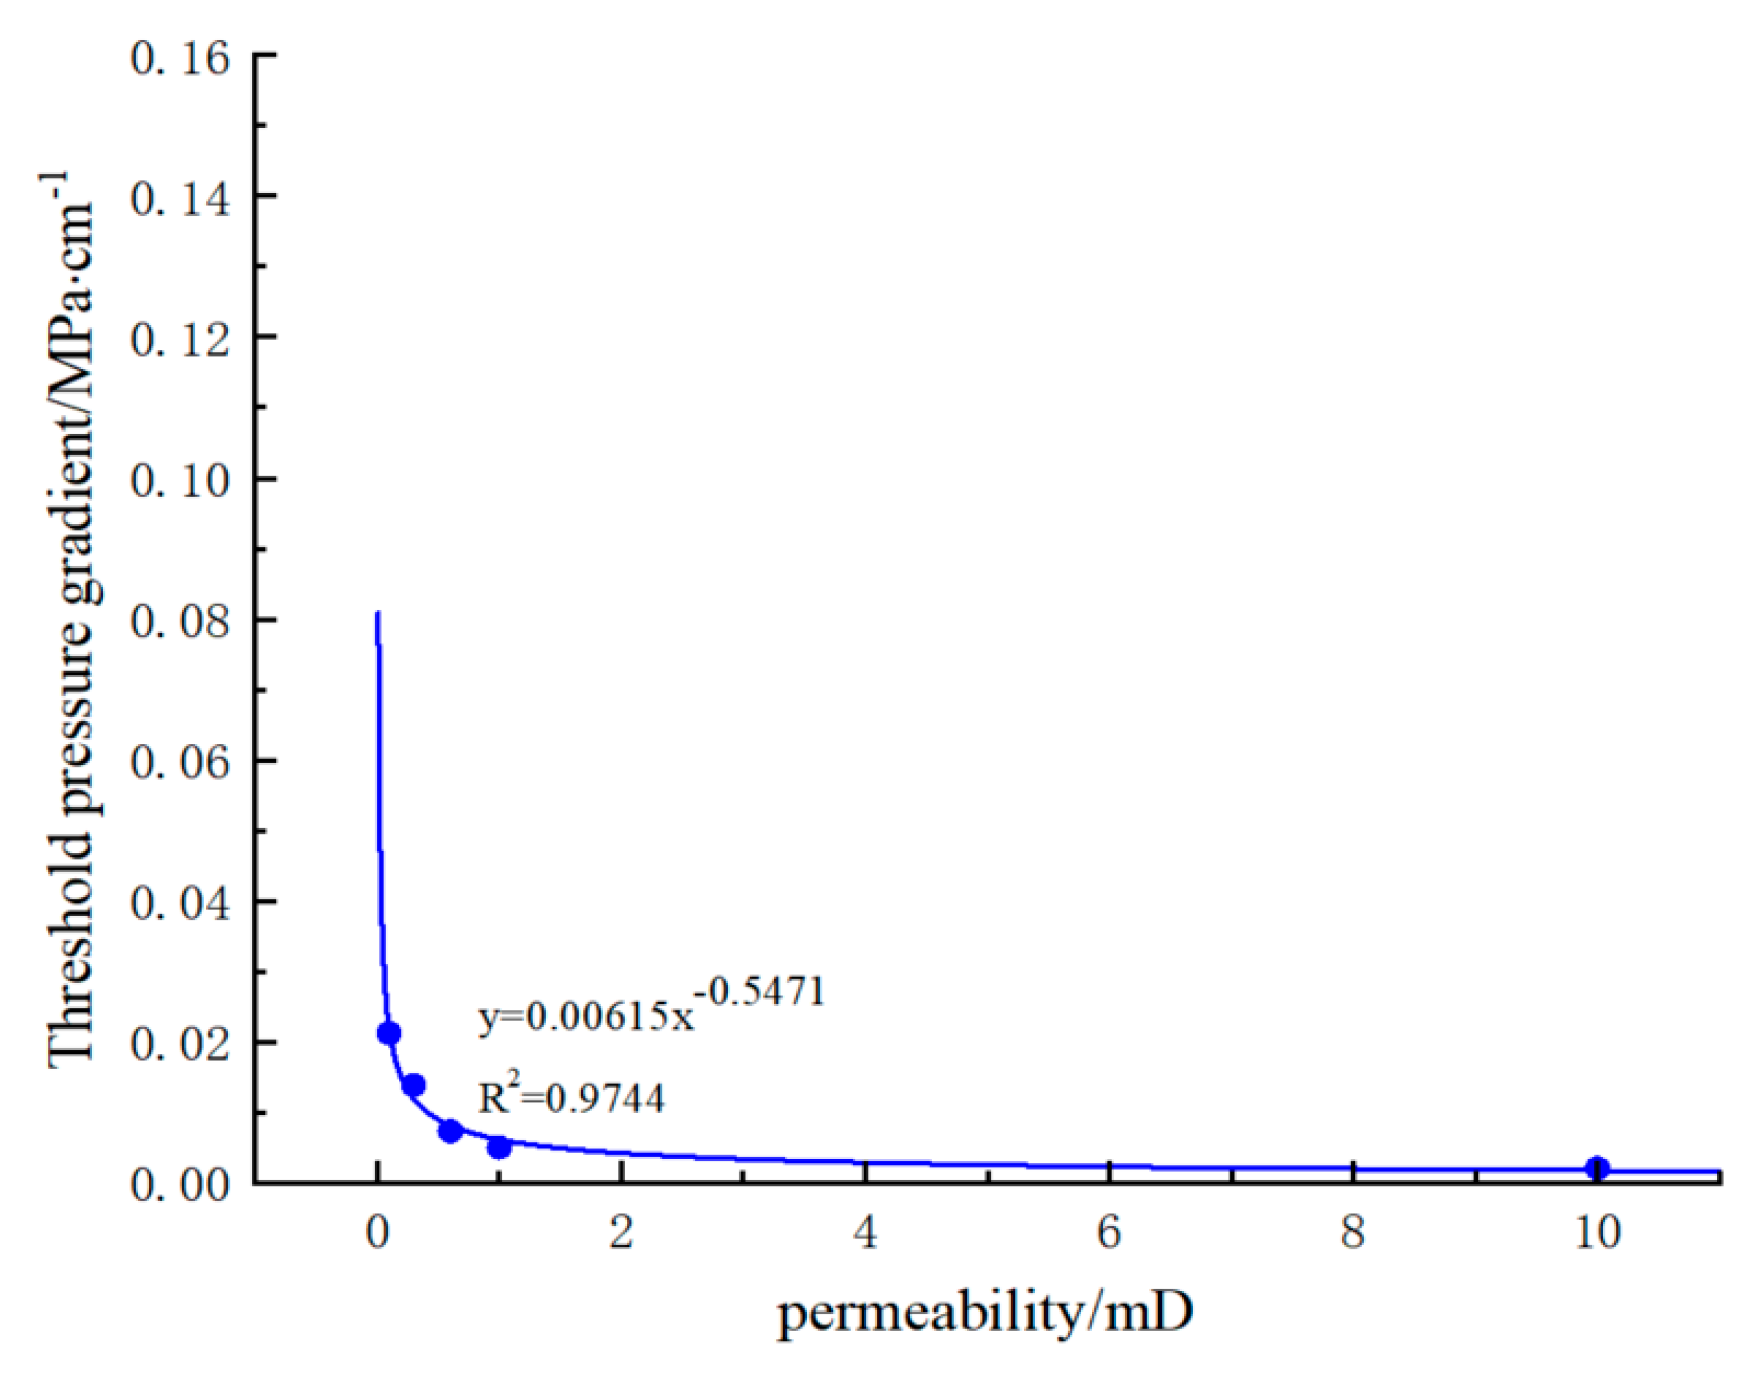
As shown in Figure 12, the starting pressure gradient of CO2 flooding decreases as a power law with increasing permeability. A knee-like trend can be observed near 0.5 mD based on the limited number of permeability data points in this study. This should not be interpreted as a well-defined universal critical threshold. For cores with permeability lower than 0.5 mD in our tests, the threshold pressure gradient rises sharply as permeability decreases. The pore throats of the core are small, and the pore properties are poor. The pore walls adsorb crude oil, CO2 and the interfacial tension between crude oil produce strong capillary resistance, and the near wall viscous boundary layer almost blocks most of the flow channels. When the permeability is greater than 0.5 mD, the pressure gradient tends to flatten, the pore space is spacious enough, and the capillary and adsorption binding effects weaken. The flow resistance of CO2 mainly comes from the viscosity of the gas itself and fluid friction. When continuing to increase the permeability, the drag reduction effect brought by the improvement of the flow channel decreases marginally, the starting pressure gradient slowly approaches zero, and the curve tends to flatten.

4. Conclusions

This study focused on the ultra-low-permeability Chang 8 reservoir in the Baima Middle Block of the Ordos Basin. Through fluid-property testing and core-displacement experiments using natural cores from the study area, the phase behavior, miscibility, and nonlinear-flow characteristics of CO2 flooding were systematically analyzed. The results provide technical guidance for the CCUS-EOR development of this block and similar ultra-low-permeability reservoirs.
  • The injection ratio of CO2 directly affected the physical properties and displacement effect of crude oil. As the molar fraction of CO2 injection increased from 0 to 61.78%, the system bubble point pressure rose to 22.575 MPa, the volume expansion coefficient increased to 1.1454, and the viscosity of single-phase crude oil decreased to 4.906 mPa·s. This confirms that CO2 dissolution has significant solubilization, expansion, and viscosity reduction effects on formation crude oil, expands crude oil, and broadens the gas–liquid two-phase zone. On site, it is necessary to maintain the formation pressure above the bubble point pressure to avoid the influence of free gas on the displacement effect.
  • The results of the slim-tube experiment showed that an increase in moisture content significantly increased the difficulty of mixing, and the minimum mixing pressure continued to increase with the increase in moisture content, rising from 15.83 MPa under 0% moisture content to 17.69 MPa under 80% moisture content.
  • The measurement of interfacial tension under different pressures using the hanging drop method showed that the oil–gas interfacial tension gradually declined with the increase in pressure. At low pressure of 2–10 MPa, crude-oil droplets were full and regular. When the pressure approached the apparent minimum miscibility pressure at high pressure, the droplets broke and atomized. Under high-pressure conditions, a large amount of CO2 dissolved into crude oil, the physical properties of the two-phase fluids converged, the interfacial energy decreased significantly, and it was difficult to maintain a stable oil–gas interface. Low pressure 2–10 MPa crude oil droplets were full and regular. When the high pressure approached the minimum mixed-phase pressure, the droplets broke and atomized. Under high pressure, a large amount of CO2 was dissolved in crude oil, and the physical properties of the two phases converged. The interfacial energy was significantly reduced, and the interfacial tension almost disappeared, making it difficult to maintain a stable oil–gas interface.
  • The core-flooding experiments demonstrated that the threshold pressure gradient decreased with permeability following a power-law relationship. Within the limited dataset of this study, a knee-like trend appeared near 0.5 mD: for the measured samples with K < 0.5 mD, the threshold pressure gradient increased sharply as the permeability decreased, whereas for the samples with K > 0.5 mD, the decreasing rate became much slower, and the gradient gradually approached zero. This practical threshold was derived from the present core-flooding measurements and requires further experimental data for broader validation

Author Contributions

Conceptualization, C.G., J.S., X.L., J.M. and C.Y.; Methodology, C.G., Y.Y., J.S. and X.L.; Formal Analysis, C.G., Y.Y. and J.M.; Investigation, J.S., X.L., J.M. and C.Y.; Resources, W.F., J.S., X.L., J.M. and C.Y.; Data Curation, C.G., J.S., X.L., J.M. and C.Y.; Writing—Original Draft, C.G., Y.Y., W.F., J.S., X.L., J.M. and C.Y.; Writing—Review and Editing, C.G., Y.Y., W.F., J.S., J.M. and C.Y.; Visualization, C.G. and J.S.; Supervision, C.G., Y.Y., W.F., J.S. and C.Y.; Project Administration, C.G., Y.Y., W.F., J.S., X.L. and C.Y.; Funding Acquisition, C.G. and C.Y. All authors have read and agreed to the published version of the manuscript.

Funding

This research was funded by Subject of the National Key R&D Program of China: Large-scale secured and efficient CO2 enhance oil recovery and saline aquifer storage technology, grant number 2023YFB4103904; and Science & Technology Project, Changqing Oilfield, PetroChina: Research on Fine Reservoir Characterization and Coordination of CO2 EOR and Carbon Sequestration, grant number 26CQYTSG044-01.

Data Availability Statement

The original contributions presented in this study are included in the article. Further inquiries can be directed to the corresponding author.

Conflicts of Interest

Chunning Gao, Yingjie Yuan, Wei Fan and Xinhui Lei were employed by PetroChina Changqing Oilfield. The authors declare that there are no other competing interests. The remaining authors declare that the research was conducted in the absence of any commercial or financial relationships that could be construed as a potential conflict of interest. The funders had no role in the design of the study; in the collection, analyses, or interpretation of data; in the writing of the manuscript; or in the decision to publish the results.

References

  1. Shen, B.; Yang, S.; Zhang, Y.; Gao, X.-Y.; Bi, L.-F.; Du, K.; Zhao, E.-M.; Zeng, H.-B. An integrated deep learning framework for full-cycle CCUS-EOR evaluation and optimization under carbon neutrality. Pet. Sci. 2026, 23, 2288–2307. [Google Scholar] [CrossRef] [Scilit]
  2. Lyu, W.; Zhang, H.; Zhou, T.; Gao, M.; Zhang, D.; Yang, Y.; Zhang, K.; Yu, H.; Ji, Z.; Lyu, W.; et al. Progress in CO2 flooding and storage techniques for lacustrine oil reservoirs and development directions of their large-scale application in China. Pet. Explor. Dev. 2025, 52, 1086–1101. [Google Scholar] [CrossRef] [Scilit]
  3. Wang, J.; Zhou, Y.; Zhang, X.; Lao, J.; Song, H. Development of a large language model-driven intelligent agent for predicting relative permeability in oil and gas reservoirs. Theor. Appl. Mech. Lett. 2026, 16, 94–101. [Google Scholar] [CrossRef] [Scilit]
  4. Tian, Z.; Xia, Y.; Zhang, J.; Wang, D.-L.; Liu, Z.-J.; Zhao, C.-Y.; Xia, Y.-X.; Su, J.-W.; Liu, D.-K.; Cai, J.-C. Feasibility of underground gas storage construction from large-scale low-permeability lithologic gas reservoirs: Insights into microscopic storage spaces. Pet. Sci. 2026, 23, 1606–1623. [Google Scholar] [CrossRef] [Scilit]
  5. Zhao, H.; Luo, J.; Li, X.; Yao, W.-J.; Ji, L.; Zhen, H.-B. Experimental investigation into the fracture propagation behavior of horizontal well multi-stage and multi-cluster fracturing within the roof of crushed soft coal seams. Pet. Sci. 2025, 22, 4682–4713. [Google Scholar] [CrossRef] [Scilit]
  6. Sennaoui, B.; Ling, K. Numerical Analysis of CO2 Storage Associated with CO2-EOR Utilization in Unconventional Reservoirs. Energies 2026, 19, 1311. [Google Scholar] [CrossRef] [Scilit]
  7. Khalili, Y.; Abbasi, S.; Bagheri, M. A comprehensive review of gas-based enhanced oil recovery (gas-based EOR) techniques: Mechanisms, applications, and future trends. Can. J. Chem. Eng. 2026, 104, 3546–3573. [Google Scholar] [CrossRef] [Scilit]
  8. Dabiri, A.; Karaei, A.M. Reducing CO2-crude oil minimum miscibility pressure through tailored SiO2 nanoparticle size and concentration: Experimental insights and response surface optimization for enhanced oil recovery and CCUS applications. Sep. Purif. Technol. 2026, 386, 136645. [Google Scholar] [CrossRef] [Scilit]
  9. Garifullina, A.C.; Indrupskiy, M.I.; Klimov, S.D.; Ibragimov, I.I.; Lutfullin, A.A.; Zakiev, B.F.; Akhmetzyanov, F.M. Experimental and simulation study of geochemical processes during interaction of carbonated formation water with terrigenous and carbonate rocks. Pet. Sci. 2025, 22, 4954–4974. [Google Scholar] [CrossRef] [Scilit]
  10. Kang, N.; Sarsenbekuly, B.; Wu, H. Progress of CCUS technology with enhanced oil recovery. J. CO2 Util. 2025, 102, 102103233. [Google Scholar] [CrossRef] [Scilit]
  11. AlRassas, M.A.; Alimi, A.D.; Zosseder, K.; Al-Qaness, M.A. AI-driven predictive framework for CO2 sequestration and enhanced oil recovery: Insights from a depleted oil reservoir. J. Clean. Prod. 2025, 519, 146054. [Google Scholar] [CrossRef] [Scilit]
  12. Cui, L.; Xiu, H.; Wang, W. Analysis of Factors Influencing Overflow in Changqing Advanced Water Injection Areas. Acad. J. Sci. Technol. 2026, 19, 88–94. [Google Scholar] [CrossRef] [Scilit]
  13. Chen, Z.; Liu, H.; Han, W.; Li, H. An experimental study of the effect of electric field enhancement on the adsorption characteristics of coalbed methane. Sci. Rep. 2025, 16, 2296. [Google Scholar] [CrossRef] [Scilit]
  14. Han, W.; Chen, Z.; Liu, H.; Yuan, Q. Influences of electric field action on methane adsorption properties in anthracite: An experimental study. Acta Geophys. 2025, 74, 2. [Google Scholar] [CrossRef] [Scilit]
  15. He, Y.; Li, W.; Yang, R.; Chen, R.; Yi, C.; Xu, H.; Jiang, H. Research on Profile Control Potential Evaluation and Optimization Design Technology in Block M of Gudong Oilfield. Processes 2025, 13, 3131. [Google Scholar] [CrossRef] [Scilit]
  16. Pi, Z.; Hui, G.; Wang, Y.; Chen, Z.; Li, J.; Qin, G.; Meng, F.; Song, Y.; Yao, F.; Bao, P.; et al. Coupled 4D Flow-Geomechanics Simulation to Characterize Dynamic Fracture Propagation in Tight Sandstone Reservoirs. ACS Omega 2025, 10, 1735–1747. [Google Scholar] [CrossRef] [Scilit]
  17. Lin, L.; Xu, C.; Lyu, H.; Chen, Y.; Cong, S.; Yang, X.; Bu, W. Property Changes of Low-Permeability Oil Reservoirs Under Long-Term Water Flooding. Processes 2024, 12, 2317. [Google Scholar] [CrossRef] [Scilit]
  18. Chen, J.; Cai, D.; Zhang, T.; Yu, L.; Zhou, D.; Cheng, S. Asynchronous Injection–Production Method in the High Water Cut Stage of Tight Oil Reservoirs. Energies 2024, 17, 4838. [Google Scholar] [CrossRef] [Scilit]
  19. Lei, Z.; Wang, Z.; Mu, L.; Peng, H.; Li, X.; Bai, X.; Tao, Z.; Li, H.; Peng, Y. A technique for enhancing tight oil recovery by multi-field reconstruction and combined displacement and imbibition. Pet. Explor. Dev. Online 2024, 51, 152–163. [Google Scholar] [CrossRef] [Scilit]
  20. Wang, F.; Liao, G.; Su, C.; Wang, F.; Ma, J.; Yang, Y. Carbon emission reduction accounting method for a CCUS-EOR project. Pet. Explor. Dev. 2023, 50, 989–1000. [Google Scholar] [CrossRef] [Scilit]
  21. Li, X.; Dong, C.; Quaye, A.J.; Tang, Y.; Zhang, B.; Hu, C. Carbon dioxide storage in carbonate rocks: Review and perspectives. J. Earth Sci. 2026, 1–56. Available online: https://link.oversea.cnki.net/urlid/42.1788.P.20260520.1813.019 (accessed on 14 September 2026).
  22. Liang, X.; Hu, Q.; Pu, X.; Wang, Q.; Zhang, T.; Han, W. Lithofacies-dependent pore structure heterogeneity governing microscopic oil mobilization during supercritical CO2 huff-and-puff in shale. Energy Geosci. 2026, 7, 100589. [Google Scholar] [CrossRef] [Scilit]
  23. Zhao, Y.; Fan, Y.; Zhang, T.; Wang, Q.; Zhang, T.; Han, W. Microscopic investigation of pore structure effects on salt precipitation mechanisms during CO2 flooding. Gas. Sci. Eng. 2026, 152, 205943. [Google Scholar] [CrossRef] [Scilit]
  24. Li, Y.; Li, Z.; Zhao, Q.; Wang, R.; Liu, Y. Carbon capture, utilization, and storage: Advances made by Sinopec and future prospects. Energy Geosci. 2026, 7, 100561. [Google Scholar] [CrossRef] [Scilit]
  25. Zhang, F.; Cao, W.; Lu, R.; Rui, Z.; Babadagli, T.; Xia, Q.; Ji, Z. Multiphase flow model of CO2 and formation fluid for production wellbores in CO2 geological storage. Fuel 2026, 410, 137903. [Google Scholar] [CrossRef] [Scilit]
  26. Pu, W.; Kuang, J.; Yang, F.; Li, B.; Li, J.; Wang, A. CO2 flooding technology for enhanced oil recovery in tight oil reservoirs: A review. Energy Geosci. 2026, 7, 4–21. [Google Scholar] [CrossRef] [Scilit]
  27. Liu, X.; Chen, H.; Li, Y.; Zhu, Y.; Liao, H.; Zhao, Q.; Zhou, X.; Zeng, H. Oil production characteristics and CO2 storage mechanisms of CO2 flooding in ultra-low permeability sandstone oil reservoirs. Pet. Explor. Dev. 2025, 52, 196–207. [Google Scholar] [CrossRef] [Scilit]
  28. Chen, S.; You, H.; Xu, J.; Wei, M.; Xu, T.; Wang, H. Leakage monitoring of carbon dioxide injection well string using distributed optical fiber sensor. Pet. Res. 2025, 10, 166–177. [Google Scholar] [CrossRef] [Scilit]
  29. Xiong, Y.; Chen, F.P.; Pu, F.W.; Jiang, R.; Pang, Q. Study on the phase behavior and minimum miscible pressure of CO2-shale oil in nanopores with confinement effect. Pet. Sci. 2026, 23, 777–790. [Google Scholar] [CrossRef] [Scilit]
  30. Einspänner, E.; Mattern, H.; Grossmann, H.; Khadhraoui, E.; Müller, S.J.; Garza, A.P.; Dunay, I.R.; Schregel, K.; Guttmann, C.R.; Fuchs, E.; et al. A multimodal 7T MRI and biomarker study reveals reversible brain changes following acute sleep deprivation. Sleep Med. 2025, 137, 108663. [Google Scholar] [CrossRef] [Scilit]
  31. Elsayyad, E.M.N.; Elkady, A.O.; Swidan, M.M.; Rashed, H.M.; Sakr, T.M.; Abdelhamid, A.M.; Zaafan, M.A.; El-Laithy, H.M. Zonisamide nanodiamonds for brain targeting: A comprehensive study utilising in silico, in vitro, in vivo, and molecular investigation for successful nose-to-brain delivery for epilepsy management. Drug Deliv. Transl. Res. 2025, 16, 3286–3309. [Google Scholar] [CrossRef] [Scilit]
  32. Hao, H.; Xian, B.; Peng, M.; Deng, S.; Cheng, L.; Wu, H.; Gao, X.; Qu, M.; Zhao, K. Study of Different Gas Floodings on Minimum Miscibility Pressure and Oil Recovery in a Low-Permeability Reservoir with Medium Viscous Oil. ACS Omega 2025, 10, 9426–9440. [Google Scholar] [CrossRef] [Scilit]
  33. Du, X.; Li, X.; Thakur, C.G. Enhanced Solubility and Miscibility of CO2-Oil Mixture in the Presence of Propane under Reservoir Conditions to Improve Recovery Efficiency. Energies 2024, 17, 4790. [Google Scholar] [CrossRef] [Scilit]
  34. Zhao, Y.; Chen, J.; Li, M.; Liu, S.; Huang, M.; Zhang, Y.; Liu, Y.; Song, Y. In situ measurement of CO2-oil mixture phase behavior properties in porous media for CO2-enhanced oil recovery. Fuel 2025, 379, 132970. [Google Scholar] [CrossRef] [Scilit]
  35. Du, X.; Salasakar, S.; Thakur, G. A Comprehensive Summary of the Application of Machine Learning Techniques for CO2-Enhanced Oil Recovery Projects. Mach. Learn. Knowl. Extr. 2024, 6, 917–943. [Google Scholar] [CrossRef] [Scilit]
  36. Yan, Y.; Lyu, W.; Yu, H.; Lv, W.; Ni, S. Mechanisms of CO2 flooding front migration and injection-production regulation in heterogeneous reservoirs: A large-scale visual physical simulation study. J. CO2 Util. 2026, 105, 103339. [Google Scholar] [CrossRef] [Scilit]
  37. Yang, G.; Cui, H.; Huang, T.; Liang, B.; Zhang, J.; Wang, L.; Liu, Z.; Du, C.; Li, X. Stress corrosion cracking behavior and mechanism of stainless steel coiled tubing served for CO2 flooding injection well in CCUS-EOR environments. Eng. Fail. Anal. 2025, 180, 109847. [Google Scholar] [CrossRef] [Scilit]
  38. Qian, C.; Rui, Z.; Liu, Y.; Zhou, K.; Du, K.; Zhao, Y.; Zou, J.; Song, K.; Li, X. Microfluidic investigation on microscopic flow and displacement behavior of CO2 multiphase system for CCUS-EOR in heterogeneous porous media. Chem. Eng. J. 2025, 505, 505159135. [Google Scholar] [CrossRef] [Scilit]
  39. Zhang, M.; Li, B.; Zheng, L.; Xin, Y.; Xing, W.; Li, Z. Experimental study on CO2 flooding within a fractured low-permeability reservoir: Impact of high injection rate. Fuel 2025, 384, 134002. [Google Scholar] [CrossRef] [Scilit]
  40. Wen, X.; Rui, Z.; Zhao, Y.; Liu, Y.; Du, K. An improved prediction model for miscibility characterization and optimization of CO2 and associated gas co-injection. Geoenergy Sci. Eng. 2024, 242, 213284. [Google Scholar] [CrossRef] [Scilit]
  41. Zhang, Z.; Sun, L.; Huo, X.; Liu, X.; Pan, X. Rheological properties and gas channeling plugging ability in CO2 flooding of a hydrophobic nanoparticle-enhanced smart gel system constructed with wormlike micelles. Chem. Eng. Res. Des. 2024, 202, 506–516. [Google Scholar] [CrossRef] [Scilit]
  42. Wang, R.; Zhang, Y.; Lyu, C.; Lun, Z.; Cui, M.; Lang, D. Displacement characteristics of CO2 flooding in extra-high water-cut reservoirs. Energy Geosci. 2024, 5, 216–222. [Google Scholar] [CrossRef] [Scilit]
  43. Yanping, M. Experimental Study on Starting Pressure Gradient of Percolation in Low Permeability Sandstone Reservoir Based on Single Well Productivity Sequence. Institute of Management Science and Industrial Engineering. In Proceedings of the 2019 4th International Workshop on Materials Engineering and Computer Sciences (IWMECS 2019), Xi’an, China, 16–17 March 2019; Francis Academic Press: London, UK, 2019; pp. 150–154. [Google Scholar]
  44. GB/T26981-2020; Analysis Methods for Fluid Properties in Oil and Gas Reservoirs. Standardization Administration of the People’s Republic of China: Beijing, China, 2020.
Figure 1. Flow chart of the single-degassing experiment. Among them, 1—high pressure metering pump; 2—PVT container; 3—constant temperature bath; 4—separation bottle; 5—gas indicator bottle; 6—gas meter; 7—valve.
Processes 14 02970 g001
Figure 2. Schematic diagram of CO2 injection expansion experiment process.
Processes 14 02970 g002
Figure 3. Schematic of the slim-tube experimental apparatus.
Processes 14 02970 g003
Figure 4. Geometric shape of droplets.
Processes 14 02970 g004
Figure 5. Schematic diagram of classical non-Darcy flow curve.
Processes 14 02970 g005
Figure 6. P-V relationship curve of constant mass expansion process (70 °C).
Processes 14 02970 g006
Figure 7. Phase diagram of crude oil with different gas−liquid ratios.
Processes 14 02970 g007
Figure 8. Phase diagram of crude oil with different injection gas ratios (70 °C).
Processes 14 02970 g008
Figure 9. Minimum miscible pressure of CO2 at different moisture contents.
Processes 14 02970 g009
Figure 10. Droplet geometry for pressures between 2 and 18 MPa.
Processes 14 02970 g010
Figure 11. The magnitude of the pressure gradient during the start−up of CO2 flooding in rock cores.
Processes 14 02970 g011
Figure 12. Starting pressure gradient of CO2 flooding under different permeabilities.
Processes 14 02970 g012
Table 1. Slim-tube parameters.
Slim-Tube ParametersMaximum Working PressureTemperatureLengthOuter DiameterInner DiameterPermeability
Value70 MPa200 °C1200 cm0.6 cm0.4 cm1 D
Table 2. Slim-tube experiment conditions.
Water CutExperimental Pressure (MPa)
0%1213.51516.51819.5/
20%1213.51516.51819.5/
60%1213.51516.51819.521
80%1213.51516.51819.521
Table 3. Experimental plan for CO2 drive start pressure gradient.
Experimental Temperature (°C)Water Cut (%)Penetration Rate (mD)Inject Medium
70600.1CO2 displacement
0.3
0.5
1
10
Table 4. PVT analysis data table for CO2 injection.
StageCO2 Injection Mole Fraction (mol%)Bubble Point Pressure (MPa)Solution
Gas–Oil Ratio
(m3/m3)
Oil Formation Volume Factor at Bubble Point PressureDensity at Bubble Point Pressure
(g/cm3)
Viscosity (mPa·s)Volume
Expansion
Coefficient
No Gas Injection0.0017.42477.591.19630.77619.0261.0000
Stage 121.1617.69093.701.26980.77137.8241.0534
Stage 240.8819.951124.081.36150.77356.2271.1015
Stage 361.7822.575161.371.45960.77774.9061.1454
Table 5. Minimum miscibility pressure under different displacement pressures and water-content conditions.
Displacement Pressure (MPa)Water Content
0%20%60%80%
Oil Displacement Efficiency (%)
1255.254.852.749.6
13.570.560.260.557.2
1580.378.776.373.6
16.589.788.280.377.5
1890.188.587.887.5
19.591.489.78887.9
21//88.588.2
MMP (MPa)15.8316.4417.3117.69
Table 6. CO2 crude oil interface tension at different pressures.
Temperature °CPressure (MPa)CO2 Density (kg/m3)Interfacial Tension (mN/m)
70263.01219.69
363.01216.59
463.01215.51
5100.1414.02
6100.1412.50
7142.1510.95
8142.1510.45
9189.997.72
10189.996.25
11244.294.84
12244.294.48
Table 7. Starting pressure gradient of CO2 flooding for different permeability rock cores.
Penetration Rate
(mD)
Proposed to Initiate Pressure Gradient
(MPa/cm)
Threshold Pressure Gradient (MPa/cm)
0.10.24160.0212
0.30.26030.0138
0.50.21030.0073
10.23330.0050
100.12600.0021
Disclaimer/Publisher’s Note: The statements, opinions and data contained in all publications are solely those of the individual author(s) and contributor(s) and not of MDPI and/or the editor(s). MDPI and/or the editor(s) disclaim responsibility for any injury to people or property resulting from any ideas, methods, instructions or products referred to in the content.