Article

CO2 Gas Channel Identification in the CCUS-EOR Process Based on the Fuzzy Comprehensive Evaluation Method


1
Petro China Zhejiang Oilfield Branch Company, Hangzhou 310000, China
2
College of New Energy, China University of Petroleum (East China), Qingdao 266580, China
*
Author to whom correspondence should be addressed.
Processes 2026, 14(18), 2943; https://doi.org/10.3390/pr14182943
Submission received: 21 July 2026 / Revised: 31 August 2026 / Accepted: 11 September 2026 / Published: 16 September 2026

Abstract

In CO2 flooding, variations in mobility and formation heterogeneity may cause gas to traverse high-permeability or interconnected channels, leading to ineffective gas circulation. This limits recovery rates, ultimately leading to reduced financial benefits. Consequently, the identification of CO2 gas channeling becomes crucial for developing targeted management strategies and improving the efficacy of CCUS-EOR operations. This paper applies an established AHP–fuzzy comprehensive evaluation framework to the screening and prioritization of gas-channeling risk in an ultra-low-permeability CO2-EOR reservoir. This approach combines six static geological parameters and three dynamic production parameters as indicators, enabling a comprehensive analysis of potential gas channeling in the A block of the Haian Oilfield. This method was applied to the production data from the A block, showing strong consistency with the observed production response. The results offer significant technical assistance and theoretical understanding for the scientific identification, risk evaluation, and subsequent management of CO2 gas channeling in oilfields.

1. Introduction

Exploration data on oil and gas resources show that low-permeability reservoirs make up about two-thirds of China’s proven reserves [1]. These reservoirs typically have low porosity and poor permeability, and water injection often fails to deliver satisfactory results, making it a primary technical challenge for production [2]. Studies indicate that CO2, owing to its superior permeability, can more efficiently displace crude oil within reservoir pores, and CO2-enhanced oil recovery (EOR) technology can augment recovery rates by more than 10% [3]. However, during the extraction process, CO2 flooding may result in gas channeling due to reservoir heterogeneity, variations in fluidity, and the effects of gravitational segregation. Recent coupled multiphase-flow studies have also demonstrated that formation heterogeneity can significantly affect CO2 migration and gas-production behavior [4]. This phenomenon significantly affects oil recovery efficiency [5]. Consequently, precisely identifying the predominant gas channeling pathways is crucial for executing effective prevention, control, and management strategies.
The current methods for gas channeling determination mainly include the production dynamic parameter discrimination method [6], the PVT parameter fitting plate method [7], the well-logging data analysis method [8], the tracer prediction method [9], the mathematical model method [10], and the fuzzy comprehensive evaluation method [11,12]. For example, Duan et al. [6] used the production dynamic parameter discrimination method to determine the time of gas channeling based on the trend of the gas–oil ratio and divided the process into three stages: gas breakthrough, gas channel development, and gas channeling. However, this method could not describe the gas channel pathways quantitatively. Xu et al. [7] used injection profiling and the pressure index method to draw a dimensionless parameter plate to identify and classify the gas channels; however, this method is unable to determine the development direction of the gas channels and is not adapted to the situation of low gas–oil ratio in the early stage of exploitation. Anees et al. [8] used well-logging data analysis to identify the horizontal distribution and geometry of the gas channels formed in the sandstone reservoirs, but this method is highly dependent on the availability of well-logging data and exhibits limited accuracy [13]. Li et al. [10] presented the concept of a mainstream channel index and utilized mathematical models to categorize channel sizes into three distinct categories and elucidate the flow relationship between the matrix and fractures. This method is particularly suited for fractured reservoirs. In practice, gas channeling results from the complex interplay between geological heterogeneity, fluid properties, and development processes. Therefore, conventional approaches relying on a single method or limited datasets often fail to capture this complexity fully, especially when systematic and holistic evaluations are necessary. As a result, there is a critical need to adapt multi-criteria frameworks to integrate geological, engineering, and production data for comprehensive identification of CO2 gas channeling pathways under CCUS-EOR conditions.
The fuzzy comprehensive evaluation method is a multi-criteria decision-making method based on fuzzy mathematical theory. Its core lies in quantifying qualitative indicators by establishing membership functions, thereby effectively dealing with uncertainty and ambiguity in the decision-making process [14]. This method has unique advantages in dealing with complex systems, fuzzy information, or subjective evaluation. It has been widely used in the fields of mineral development and groundwater protection [15], geothermal resource development and evaluation [16], and geotechnical engineering safety assessment [17]. In recent years, this method has gradually expanded to the field of oil and gas field development, such as oil field remaining potential assessment [18], water flooding effect evaluation [19], and shale reservoir evaluation [20]. However, the identification and evaluation of complex gas channeling phenomena during gas-water alternating flooding remain a challenge, since they involve multiple coupling factors such as geological characteristics, well-logging, and dynamic production response. In particular, the heterogeneous nature of these indicators and the uncertainty of gas-channeling classification boundaries make quantitative discrimination difficult. The analytic hierarchy process (AHP) [21] is a structured method that derives the relative weights of indicators through pairwise comparisons, providing a transparent and reproducible weighting scheme. Fuzzy comprehensive evaluation converts the heterogeneous indicators into comparable membership degrees, whereas AHP supplies their relative weights; the combination of the two methods is therefore well suited to integrating multi-source information with uncertain classification boundaries. Nevertheless, the application of such an integrated framework to the quantitative discrimination of CO2 gas channeling remains relatively limited and requires further investigation.
Given the limitations of existing methods in dealing with the multi-factor coupling and complexity of gas channeling in the CCUS-EOR process, this study adapts and parameterizes an established AHP–fuzzy comprehensive evaluation framework by integrating six static geological and three dynamic production indicators. The method comprehensively selected discrimination indicators, including 6 static geological indicators (reservoir physical properties, connectivity, etc.) and 3 production dynamic indicators (gas–oil ratio, water cut change trend, etc.). Subsequently, the analytic hierarchy process was used to determine the weight of each evaluation factor. On this basis, the fuzzy comprehensive evaluation model was used to calculate the comprehensive discrimination coefficient, which characterizes the development degree of gas channeling in the reservoir. Finally, the effectiveness and practicality of the constructed model were examined through practical application in Haian Oilfield. The research results provide a scientific basis and technical tools for the screening, identification and quantitative evaluation of gas channeling in the CCUS-EOR development process, which is of great significance in improving the effect of reservoir development.

2. Principle of the Fuzzy Comprehensive Evaluation Method

The fuzzy comprehensive evaluation method aims to describe fuzzy phenomena using membership functions by replacing absolute judgments with membership degrees in the interval [0, 1], thereby eliminating the impact of differences in parameter magnitudes on the results. The main steps of this method are as follows: (1) selection of evaluation indicators; (2) calculation of the weights for each indicator; and (3) computation of the membership degrees for each indicator.

2.1. Determination of Evaluation Indicators and Discrimination Matrix

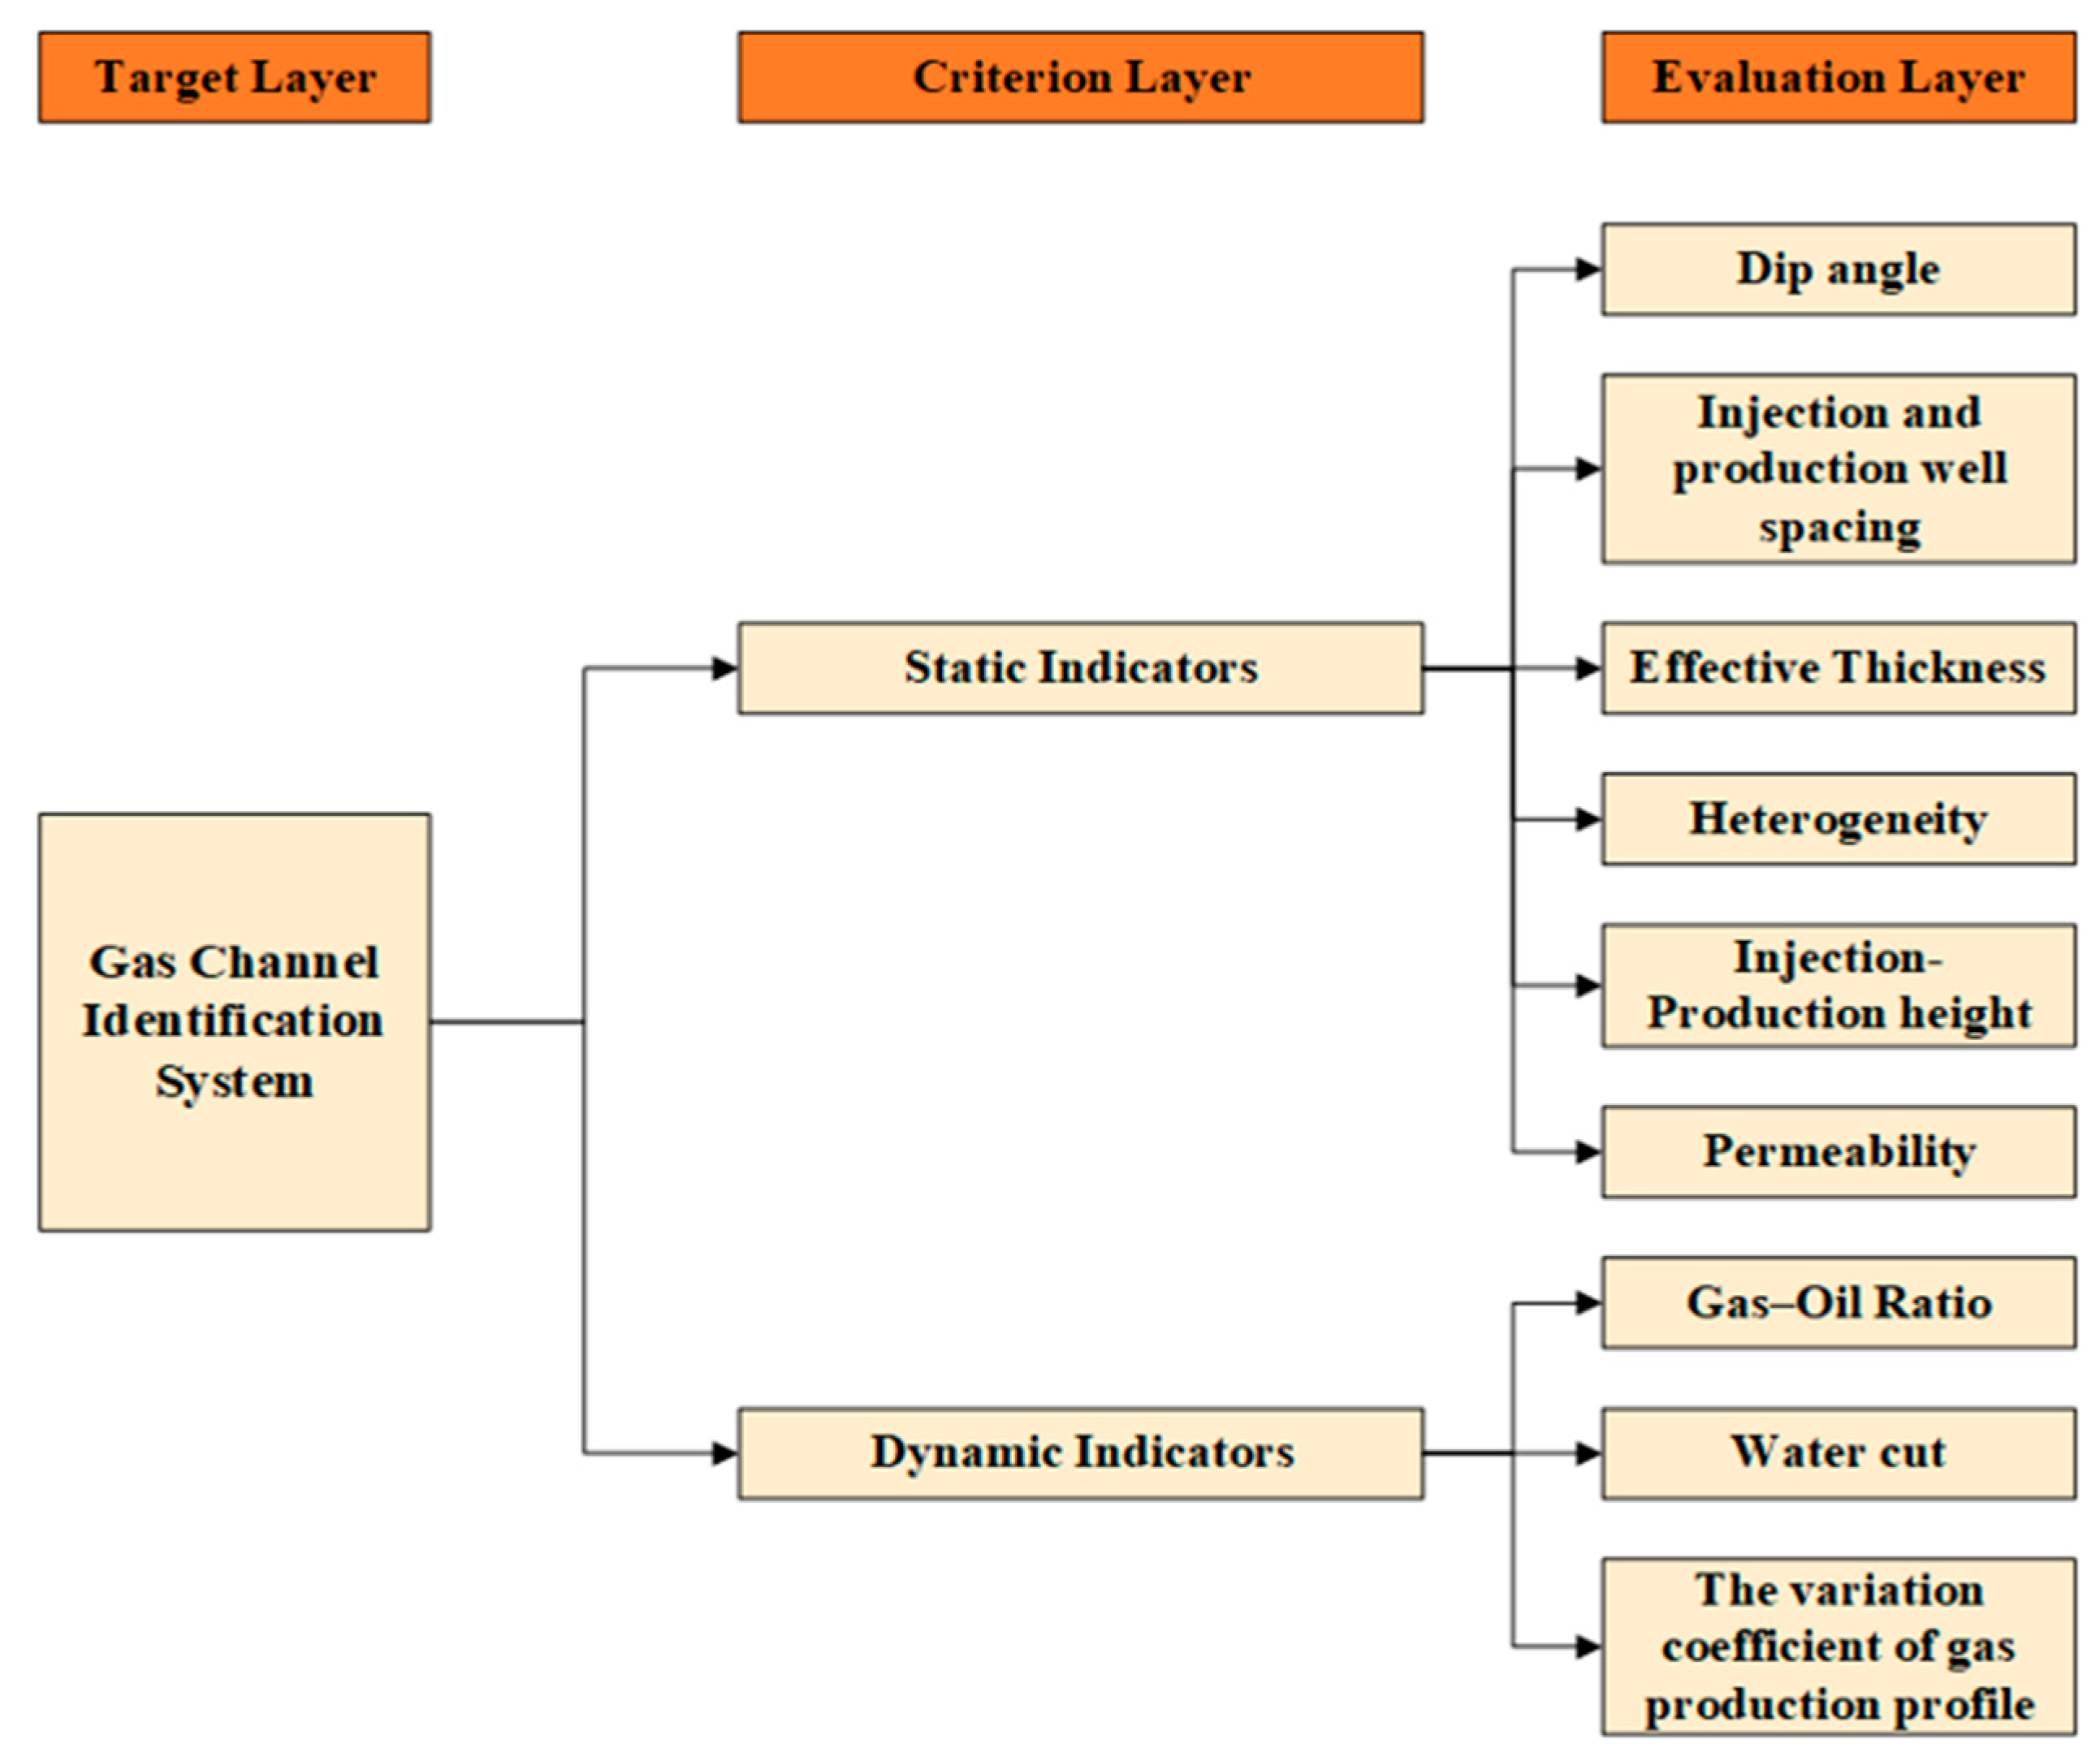
The occurrence of gas channeling is a complex process affected by different factors, including static factors and dynamic production parameters. Static factors are the foundation for gas channeling formation and mainly include parameters reflecting the geological characteristics of the reservoir [22], such as permeability, heterogeneity, well spacing between injection and production wells, and reservoir dip angle. Pore-structure characteristics and their anisotropic evolution have also been shown to directly influence seepage capacity and flow-network connectivity [23]. Dynamic factors reflect the formation and evolution of gas channeling pathways and consist of parameters related to the development process, such as the gas–oil ratio and water cut [24]. Based on the above analysis, this study selects the following indicators: Static indicators include permeability, heterogeneity, well spacing between injection and production wells, injection-production height, and dip angle, effective thickness; dynamic indicators include gas–oil ratio, water cut, and the variation coefficient of gas production profile. The indicators are represented as Ci, i = 1, 2, 3, …, n, where n is the total number of indicators.
To determine the relative importance of each indicator in the evaluation of gas channeling, this study adopts the analytic hierarchy process [25]. It can address multi-criteria decision-making problems that combine both qualitative and quantitative factors, which include the target layer, the criterion layer, and the evaluation layer. Based on the selected indicators, the analytic hierarchy model in this study can be given in Figure 1.
The analytic hierarchy process is accomplished by performing comparisons between any two elements within the same level to quantify their relative importance or priority to a particular criterion in the upper level. The quantification of these evaluations strictly follows the nine-point scale method [21], which provides a systematic framework for accurately expressing different degrees of relative importance or preference between two elements. The main characteristics of the nine-point scale method are summarized in Table 1.
Taking the evaluation layer as an example, this hierarchy analysis process involves a comparison between static and dynamic indicators. According to the definition of the nine-point scale, when any indicator is compared with itself, its importance is considered completely equal; therefore, the elements along the main diagonal of the discrimination matrix (e.g., static indicator compared with static indicator) are all assigned a value of 1. It is concluded that the importance of dynamic indicators lies between “equally important” (value of 1) and “slightly more important” (value of 3). According to the nine-point scale, an intermediate strength judgment between 1 and 3 corresponds to a value of 2. Static indicators describe geological conditions favorable for gas channeling, whereas dynamic indicators reflect production responses already observed during CO2 injection. Following Liu et al. [12], the dynamic-to-static comparison was set to 2:1, giving normalized weights of 0.667 and 0.333. This ratio is used as an engineering weighting choice rather than an exact physical-effect ratio. Its influence is evaluated in Section 3.3. Based on this method, three discrimination matrices are obtained, as shown in Table 2, Table 3 and Table 4.
The pairwise comparison matrices were established by field engineers and reservoir-evaluation researchers based on the geological and production data of the studied block and relevant AHP–fuzzy studies. Differences in judgment were resolved through group discussion until consensus was reached. The derived weights therefore represent engineering judgments informed by field data and literature. To ensure the rationality and reliability of the discriminant matrix, it is essential to perform a consistency test. To assess whether a discrimination matrix exhibits satisfactory consistency, an empirical criterion is typically employed. It is widely accepted that when the consistency ratio (CR) is less than 0.1, the matrix is considered to possess acceptable consistency. The consistency ratio can be expressed as
CR = CI RI
where CI is the consistency index, and RI represents the random index, which varies with the number of judgment criteria, with values listed in Table 5.
CI = λ max n n 1
where λmax is the maximum eigenvalue; n represents the order of the discrimination matrix.
λ max = i = 1 n ( AW ) i n W i
where A is the discrimination matrix, Wi denotes the normalized weight vector, and (AW)i refers to the product of matrices A and W. The normalized weight vector Wi can be expressed as
W i = W i ¯ i = 1 n W i ¯
W i ¯ = j = 1 n a i j
a ij ¯ = a ij i = 1 n a ij ( i , j = 1 , 2 , , n )
where aij denotes the value at the ith row and jth column of the discrimination matrix.
The consistency ratios of different matrices are calculated and listed in Table 6. It can be seen that all the CRs are smaller than 0.1, indicating that the discrimination matrix exhibits satisfactory consistency. Then, based on the discrimination matrix, the weight vectors of indicators at each level are computed. The resulting weights of the indicators at various levels, relative to their respective upper-level goals, are summarized in Table 7.

2.2. Determination of Membership Degree

The calculation of membership degrees is a critical step in the fuzzy comprehensive evaluation method. Its primary purpose is to transform the original on-site evaluation indicator data into dimensionless membership values ranging between [0, 1]. The determination of membership degrees is mainly achieved through appropriate membership function models. Commonly used membership functions include the triangular membership function, trapezoidal membership function, and S-shaped membership function. In this study, the trapezoidal membership function was selected based on the characteristics of the problem. Considering that different influencing factors may have different effects on gas channeling, that is, an increase in indicator values could either exacerbate or alleviate the phenomenon. Therefore, the trapezoidal membership function, which reflects such trends, can be further divided into two types: semi-increasing and semi-decreasing forms, as shown in Equations (7) and (8), respectively. Based on the analysis of the gas channeling mechanism in oil wells, indicators such as permeability, water cut, reservoir heterogeneity, and effective thickness are positively correlated with the formation of gas channeling pathways. That is, the larger the values of these indicators, the more favorable the conditions for gas channeling. Therefore, a semi-increasing membership function is recommended for these indicators. On the other hand, indicators such as injection-production well spacing and reservoir angle, when larger, are less conducive to the formation of effective gas channeling pathways. Therefore, a semi-decreasing membership function is recommended for these indicators.
μ ( x ) = 0 x a x a b a a < x < b 1 x b
μ ( x ) = 1 x a b x b a a < x < b 0 x b
where a is the lower boundary of the indicator and b is the upper boundary as listed in Table 8. The half-trapezoidal membership function was retained as the baseline because it provides a direct monotonic transition between the calibrated boundaries and has been adopted in previous gas-channeling fuzzy-evaluation studies [11,12]. To evaluate the sensitivity of the evaluation results to the membership-function form, triangular-type shoulder, Gaussian-type, and sigmoidal functions were additionally tested using the same boundary parameters a and b.
The parameters a and b are calibration boundaries rather than sample extrema and were determined with reference to the field-data distribution together with reservoir-specific engineering or model-calibration criteria.

2.3. Criteria for Identifying Gas Channeling Pathways

The fuzzy comprehensive evaluation coefficient is defined as the weighted sum of the membership values for each indicator. The comprehensive discrimination coefficients for the static and dynamic indicators are calculated separately, and the overall evaluation coefficient is then determined by integrating the decision-level weights.
N = i = 1 n W i μ i
where Wi is the weight value of the ith indicator and μi is the membership degree. Then the comprehensive evaluation coefficient can be calculated as
N = NjWj + NdWd
where Wj and Wd represent the weights of the static and dynamic indicators, respectively. Nj and Nd denote the discrimination coefficients for the static and dynamic indicators, respectively.
To quantitatively characterize the severity of gas channeling, this study divides the gas channeling intensity into three levels based on empirical judgment: no gas channeling, weak gas channeling, and strong gas channeling. The classification standards for each level are determined according to the comprehensive discrimination coefficient (N) calculated in Equation (10). When the comprehensive discrimination coefficient is less than 0.3, no gas channeling is considered to have occurred; when 0.3 < N < 0.5, it is classified as weak gas channeling; and when N > 0.5, it is classified as strong gas channeling, as listed in Table 9. Related studies have employed different grading thresholds [11,12], indicating that the specific boundaries depend on the evaluation framework and classification objective. In the present study, the upper classification threshold of 0.50 is consistent with Wang et al. [11], who adopted 0.50 as the criterion for judging whether a gas-channeling pathway is developed, while 0.30 is adopted as the lower threshold of the three-level engineering screening scheme.

3. Application of Fuzzy Comprehensive Evaluation Method

3.1. Calculation of Membership Values

To demonstrate the application of the constructed comprehensive fuzzy evaluation method, the A Block of Haian Oilfield in China was selected as a case study. The overview of the selected block is as follows: The reservoir of the A Block is located at a depth of approximately 3400 m, with formation temperatures around 120 °C and an inclination of about 45°, belonging to the category of ultra-low permeability reservoirs. The reservoir’s physical properties vary considerably, with porosity ranging from 5.2% to 24.2% and permeability ranging from 0.58 mD to 6.78 mD. It should be noted that this permeability range represents the overall geological characteristics of the block, whereas the permeability values used for the specific evaluation samples in Table 10 range from 0.5 mD to 3.0 mD. Notably, the coefficient of variation for porosity is greater than 0.7, indicating significant interlayer heterogeneity within the reservoir. The connectivity within the well pattern in this area is relatively high. The single well stratification is divided into five sub-layers, labeled as layer 1 to layer 5. In this block, the A-T1 and A-T2 well groups were selected as study targets. In the A-T1 well group, there are six production wells: A-P1-1, A-P1-2, A-P1-3, A-P1-4, A-P1-5, and A-P1-6. In addition, the A-T2 well group comprises three production wells: A-P2-1, A-P2-2, and A-P2-3. Based on the above fuzzy comprehensive evaluation method, the development characteristics of gas channeling in each sublayer of the production wells within the study area were analyzed. The geological parameters and production parameters used in the analysis are detailed in Table 10 and Table 11.
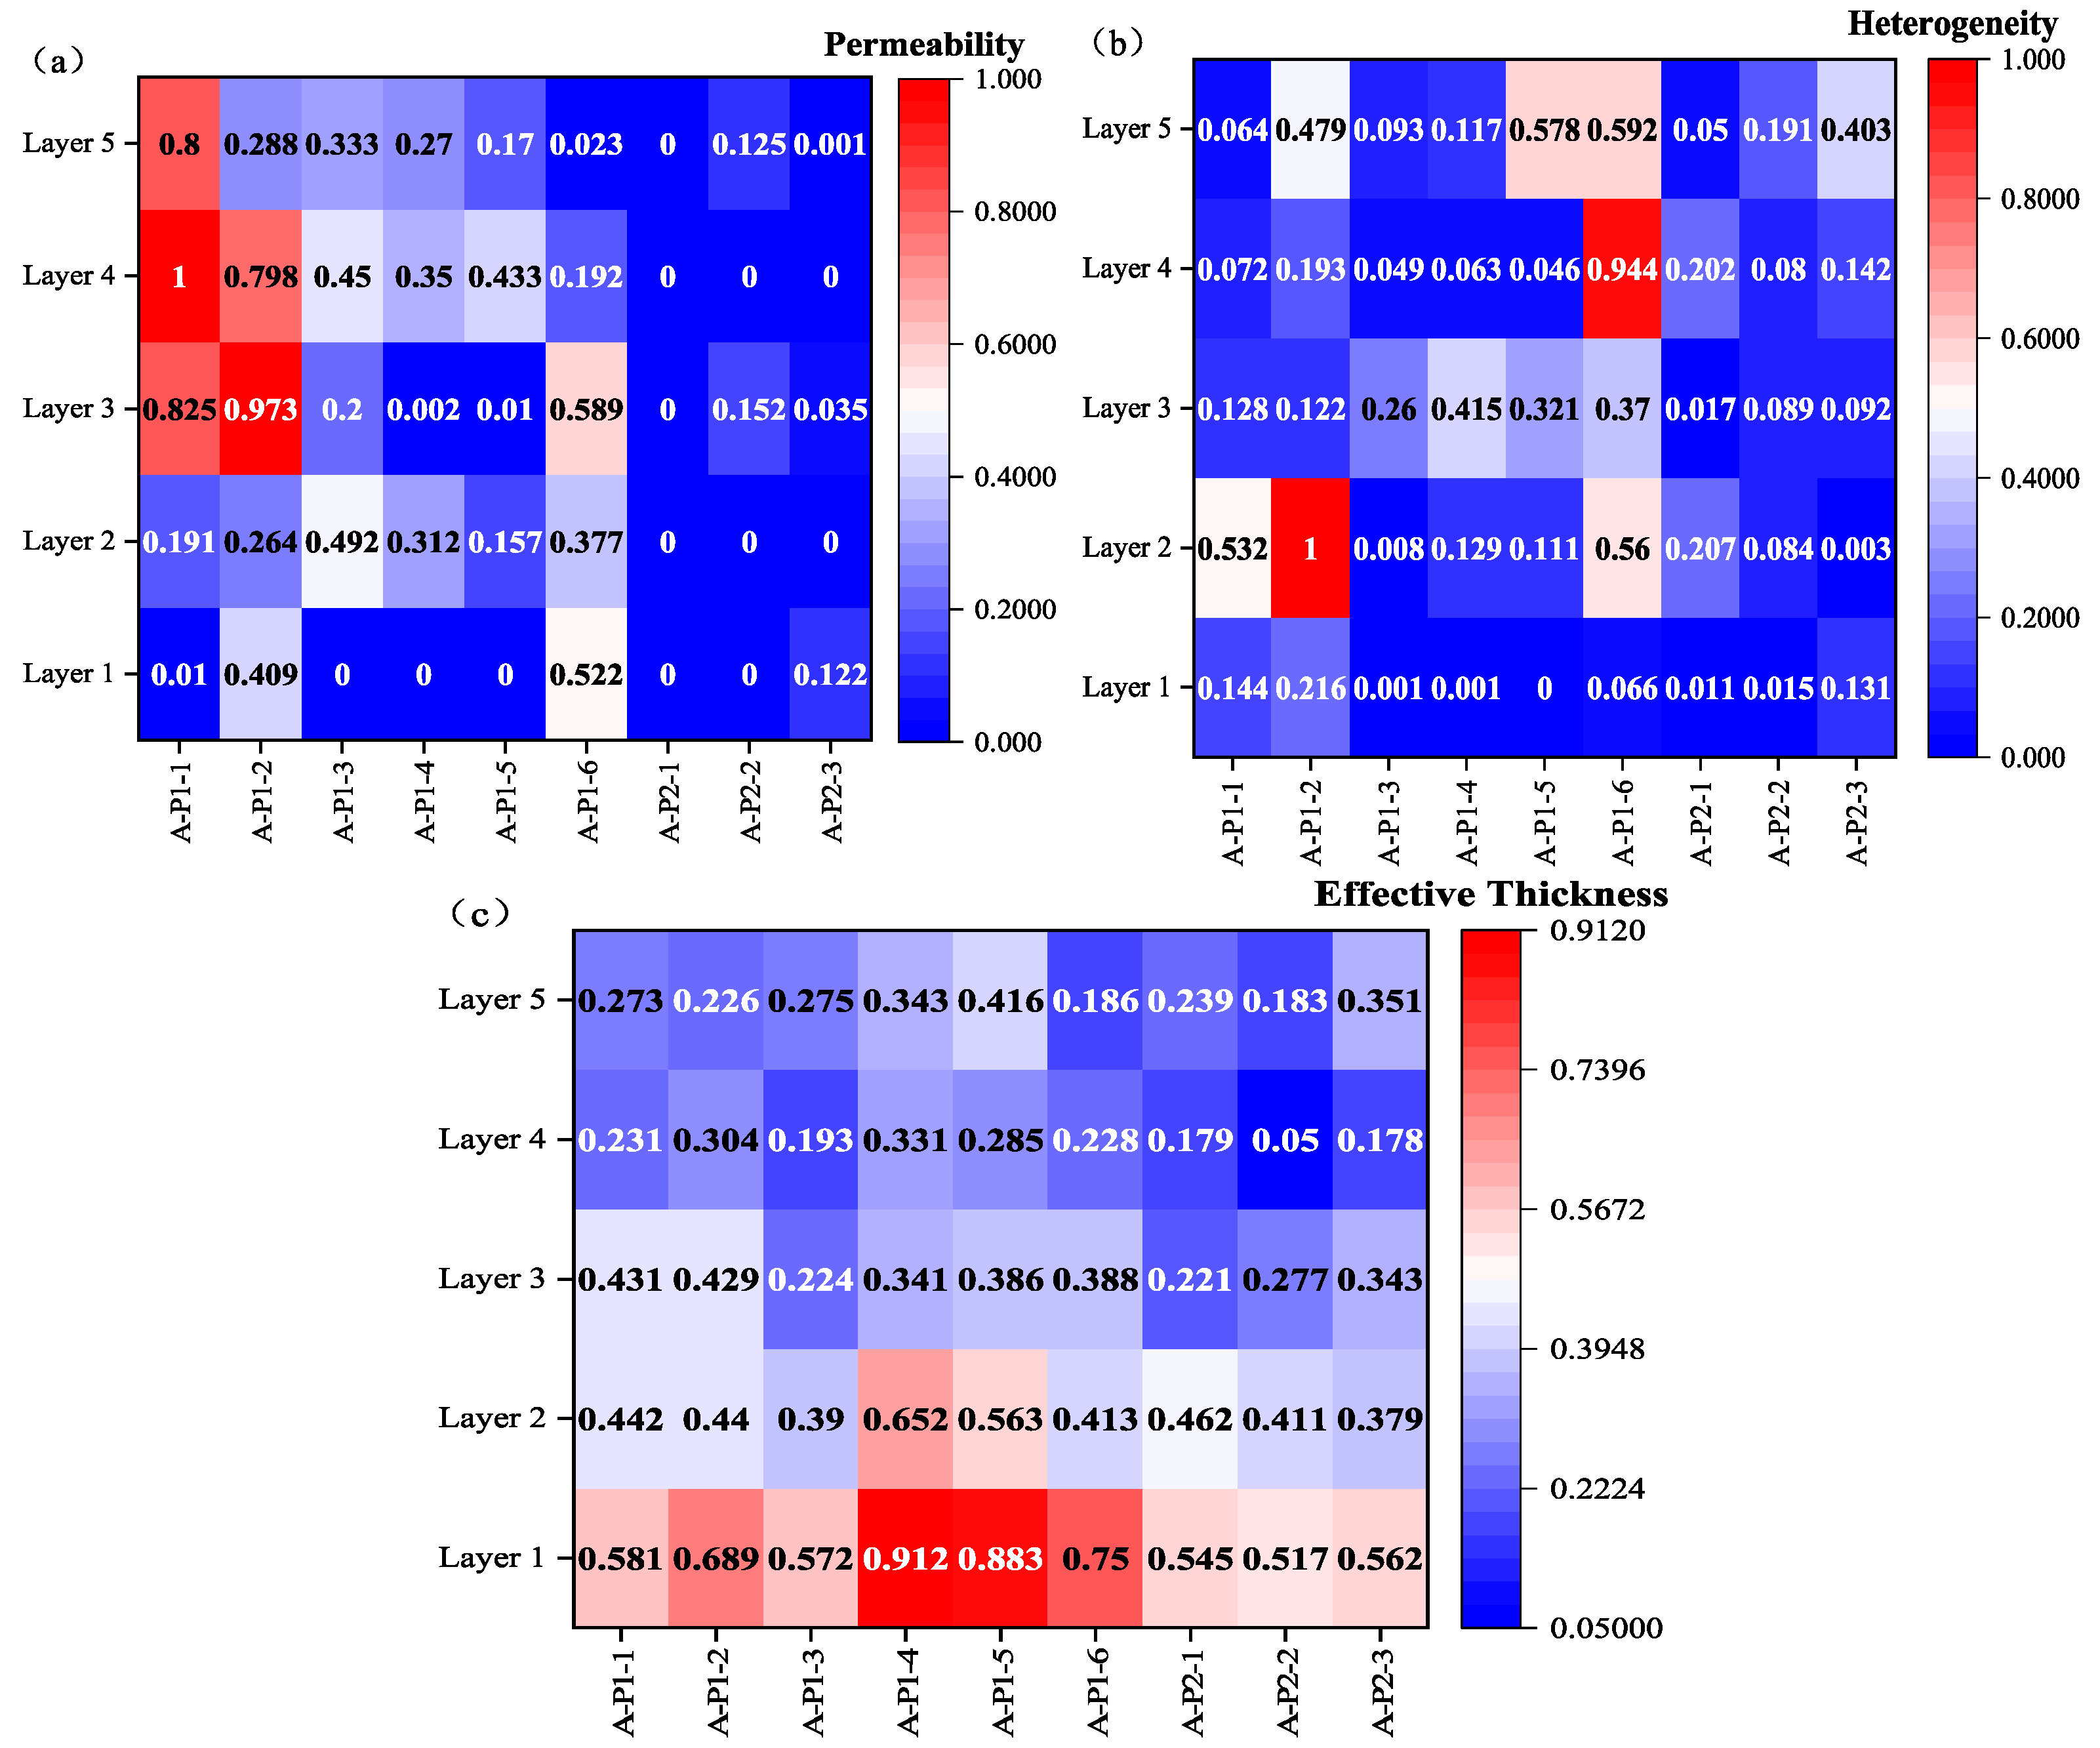
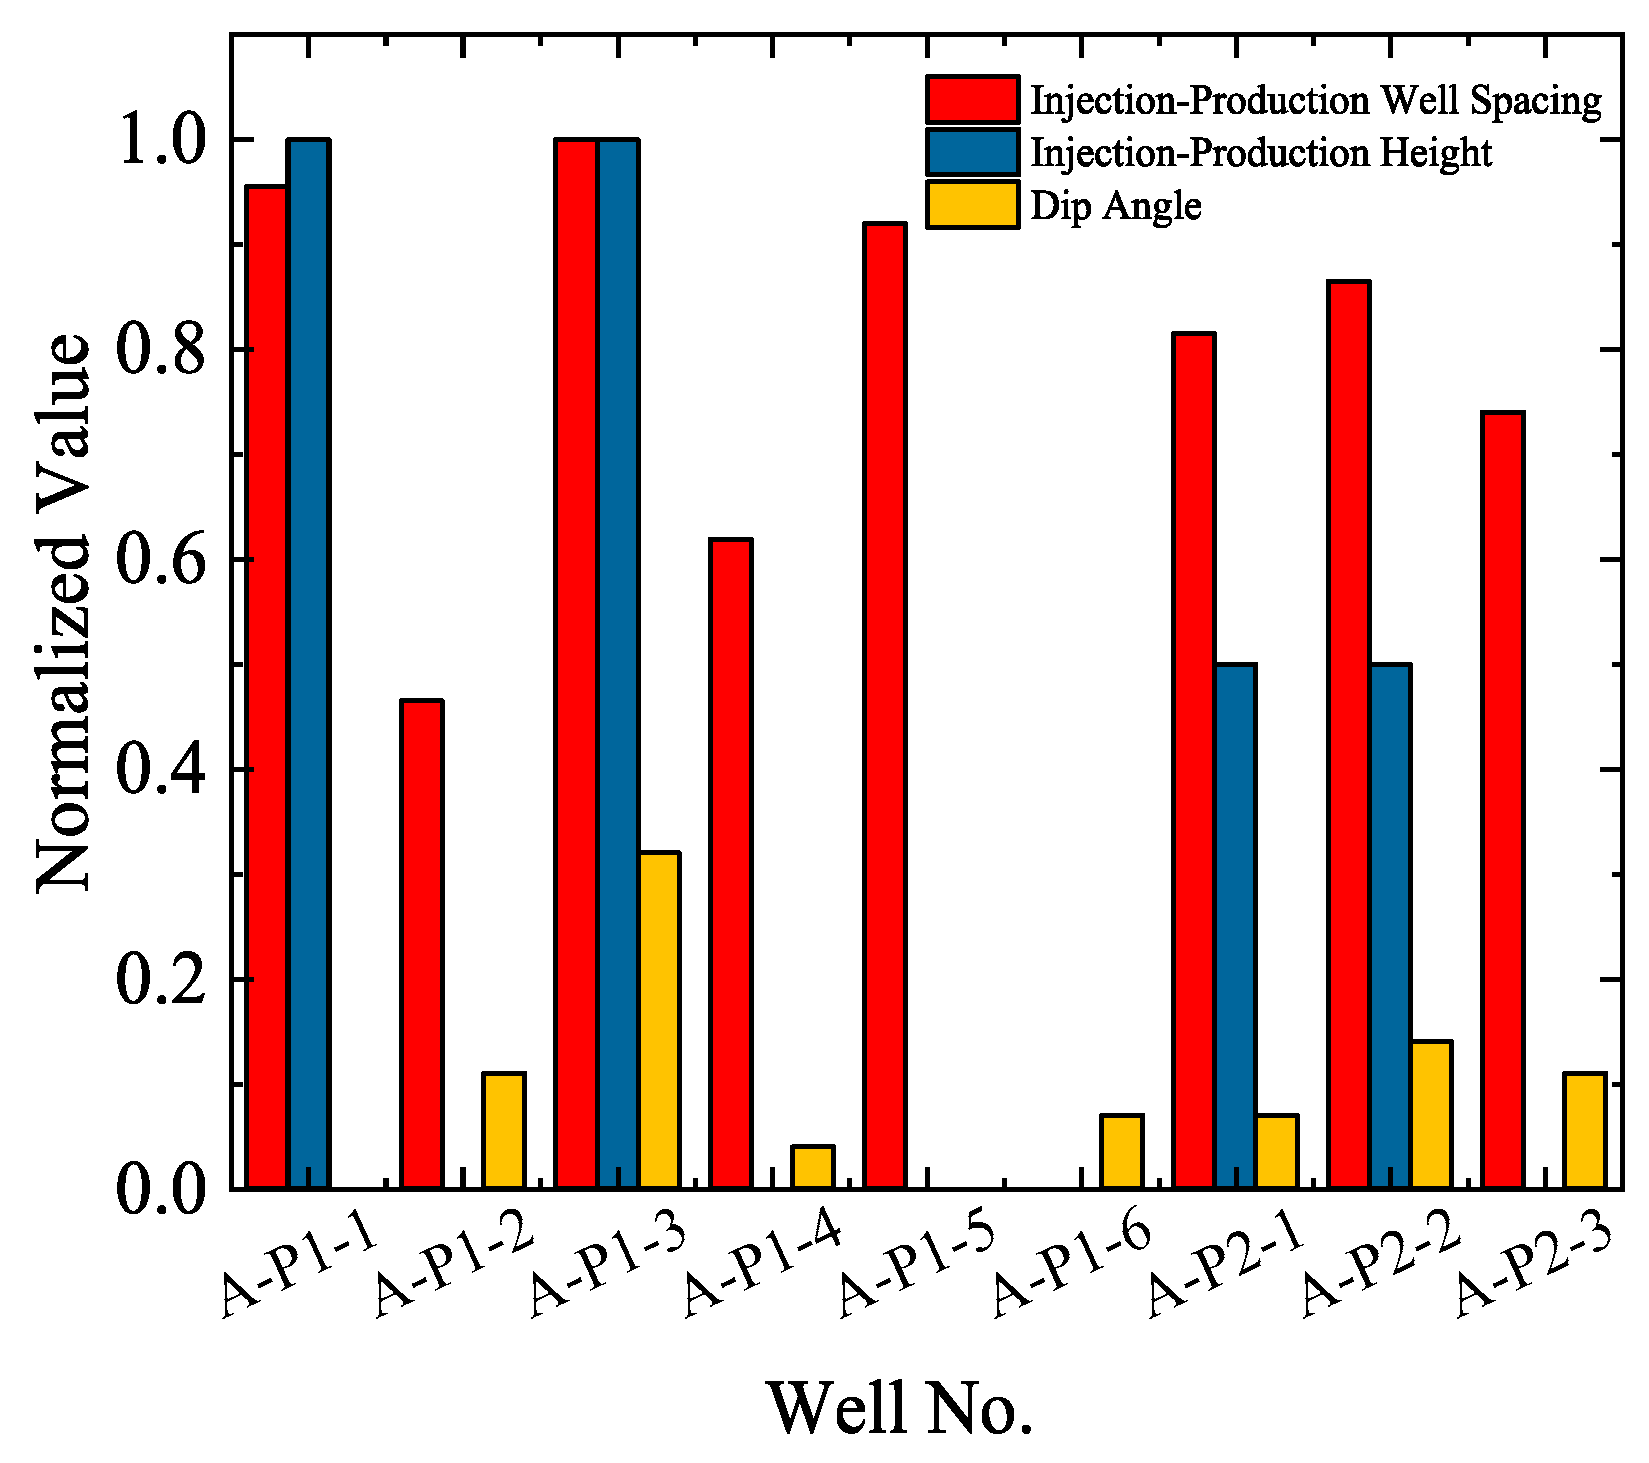
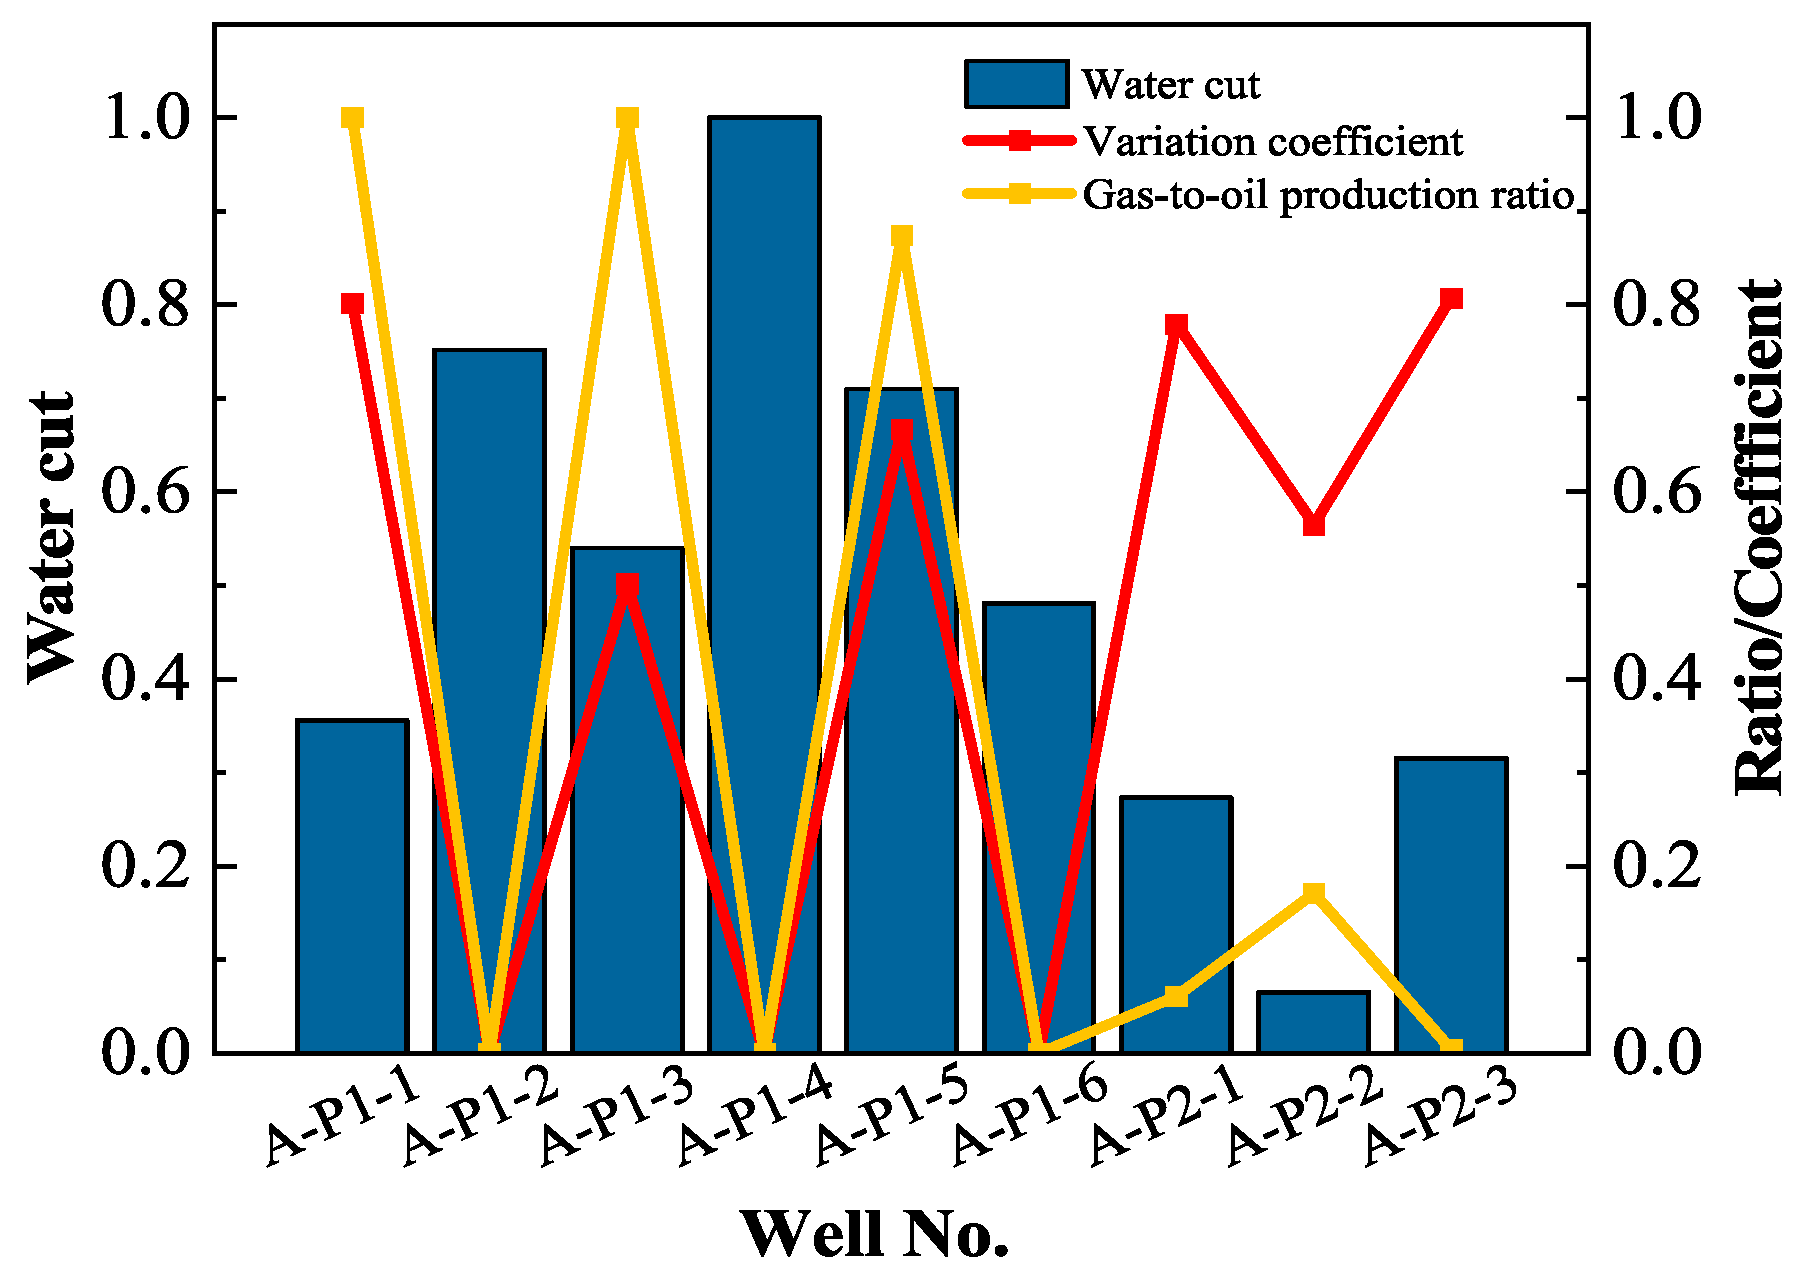
Based on the geological parameters and production dynamic parameters listed in Table 10 and Table 11 for the A Block, this study applies the trapezoidal membership function model as shown in Equations (7) and (8) to calculate the membership values for each evaluation indicator. The specific calculation results and the membership values for each indicator are detailed in Figure 2, Figure 3 and Figure 4.

3.2. Gas Channeling Analysis

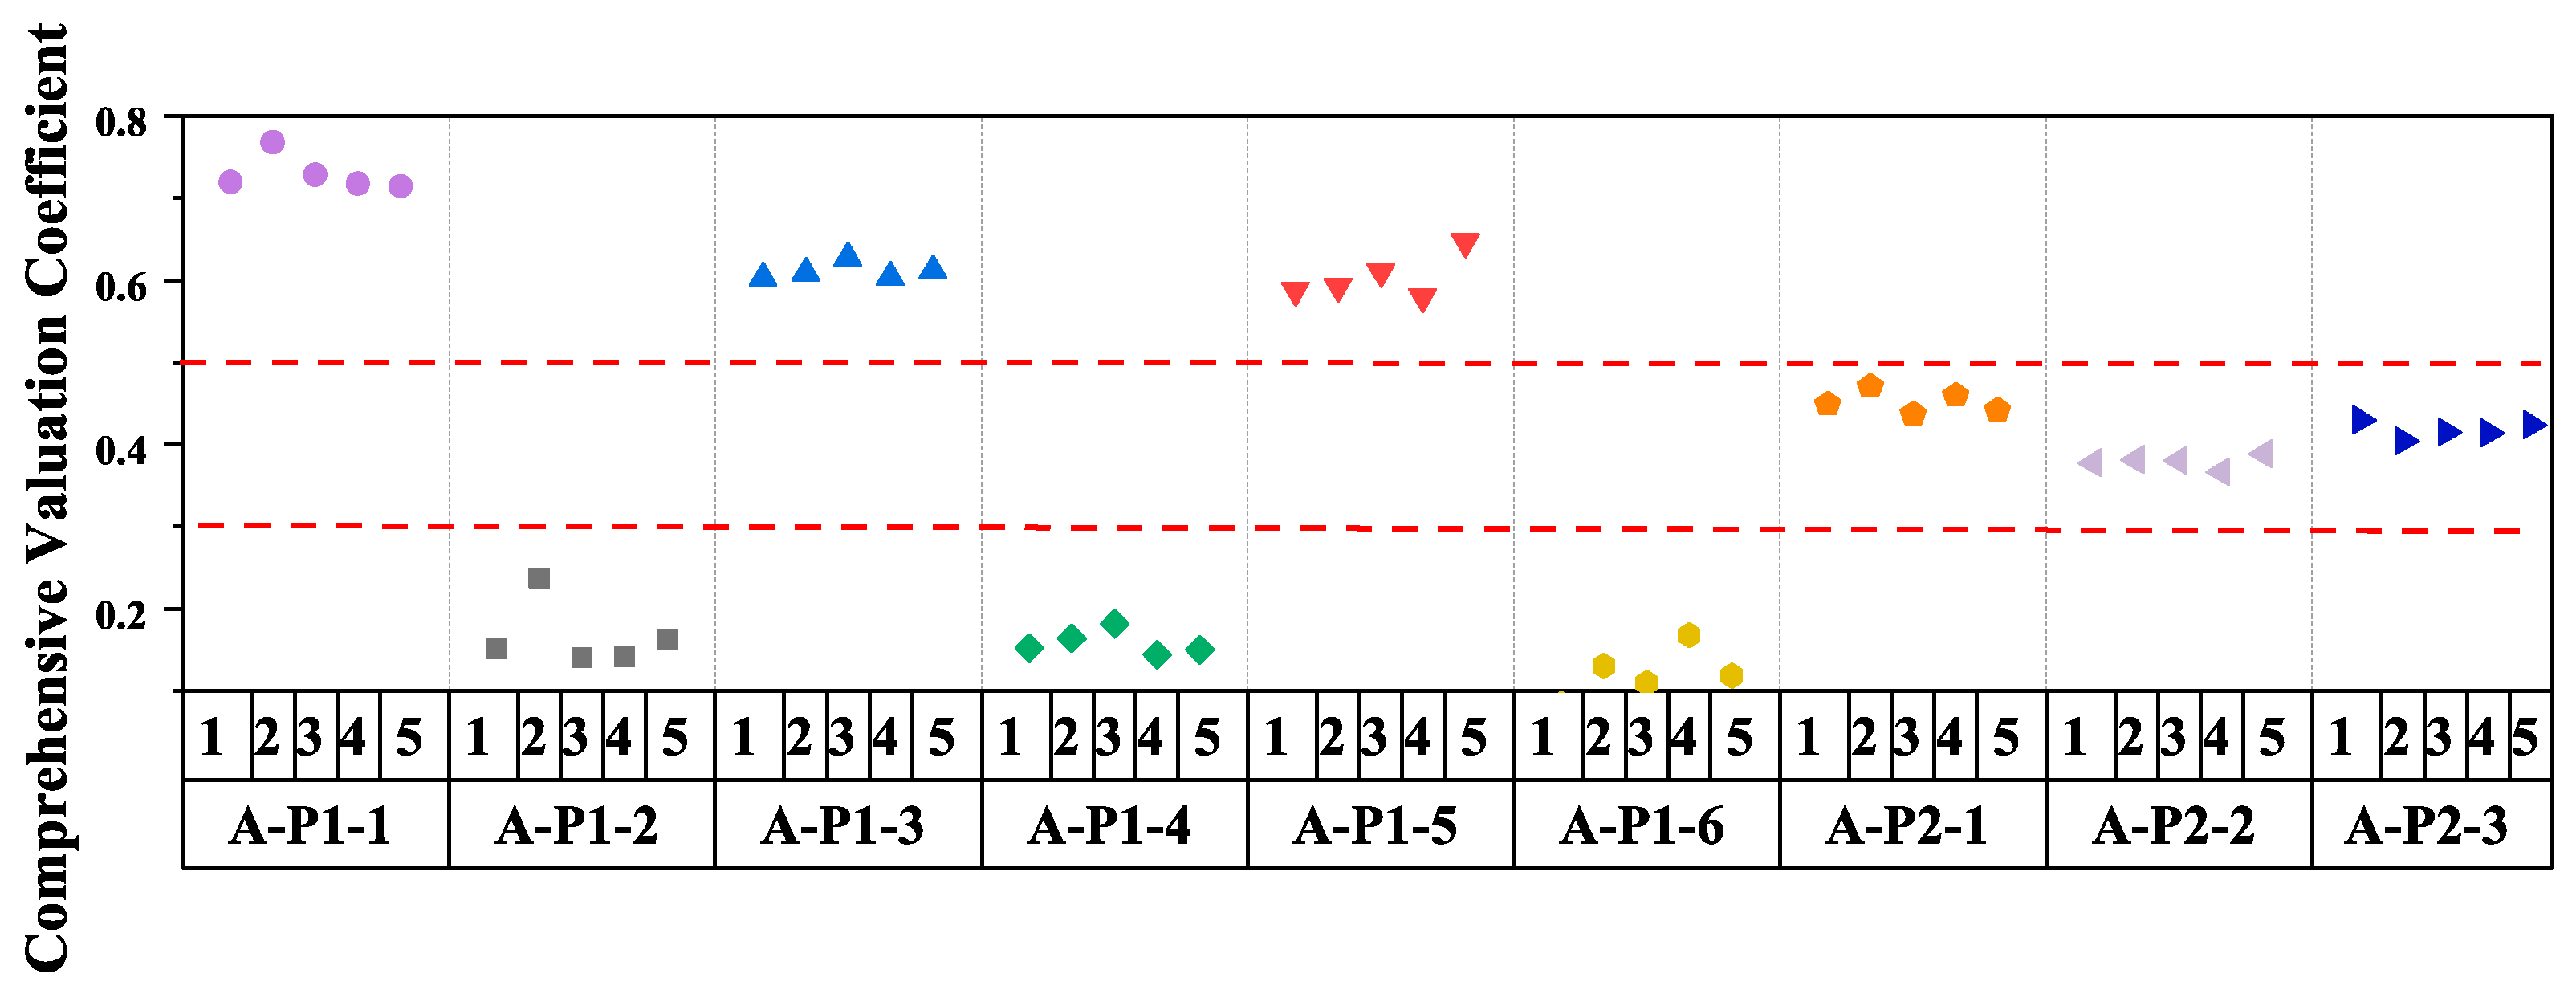
The comprehensive evaluation coefficients for each layer were calculated using Equations (9) and (10) as shown in Figure 5. The results show that the comprehensive evaluation coefficients of wells such as A-P1-1, A-P1-3, and A-P1-5 are significantly greater than 0.6, indicating that these wells have a high risk of gas channeling. Therefore, timely measures or adjustments to the gas injection strategy should be implemented for these high-risk wells to effectively mitigate gas channeling and enhance production efficiency. In contrast, the comprehensive evaluation coefficients of wells A-P1-4 and A-P1-6 are both less than 0.3, indicating a low degree of gas channeling. Their gas injection development can maintain the existing plan.
The static and dynamic evaluation coefficients were calculated for individual layers, and the results are presented in Table 12. According to the analysis of evaluation indicators based on static geological parameters, the static evaluation coefficients of layers 2 and 3 in the A-T1 well group exceed 0.5 in multiple wells (e.g., 0.671 and 0.547 in layer 2, 0.556 and 0.561 in layer 3), indicating a relatively high risk of gas channeling. Therefore, layered control measures can be prioritized for these layers. For the A-T2 well group, the interlayer gas channeling differences are relatively small, which suggests that when formulating control plans, overall control or plugging measures can be prioritized instead of complex targeted stratification treatment.
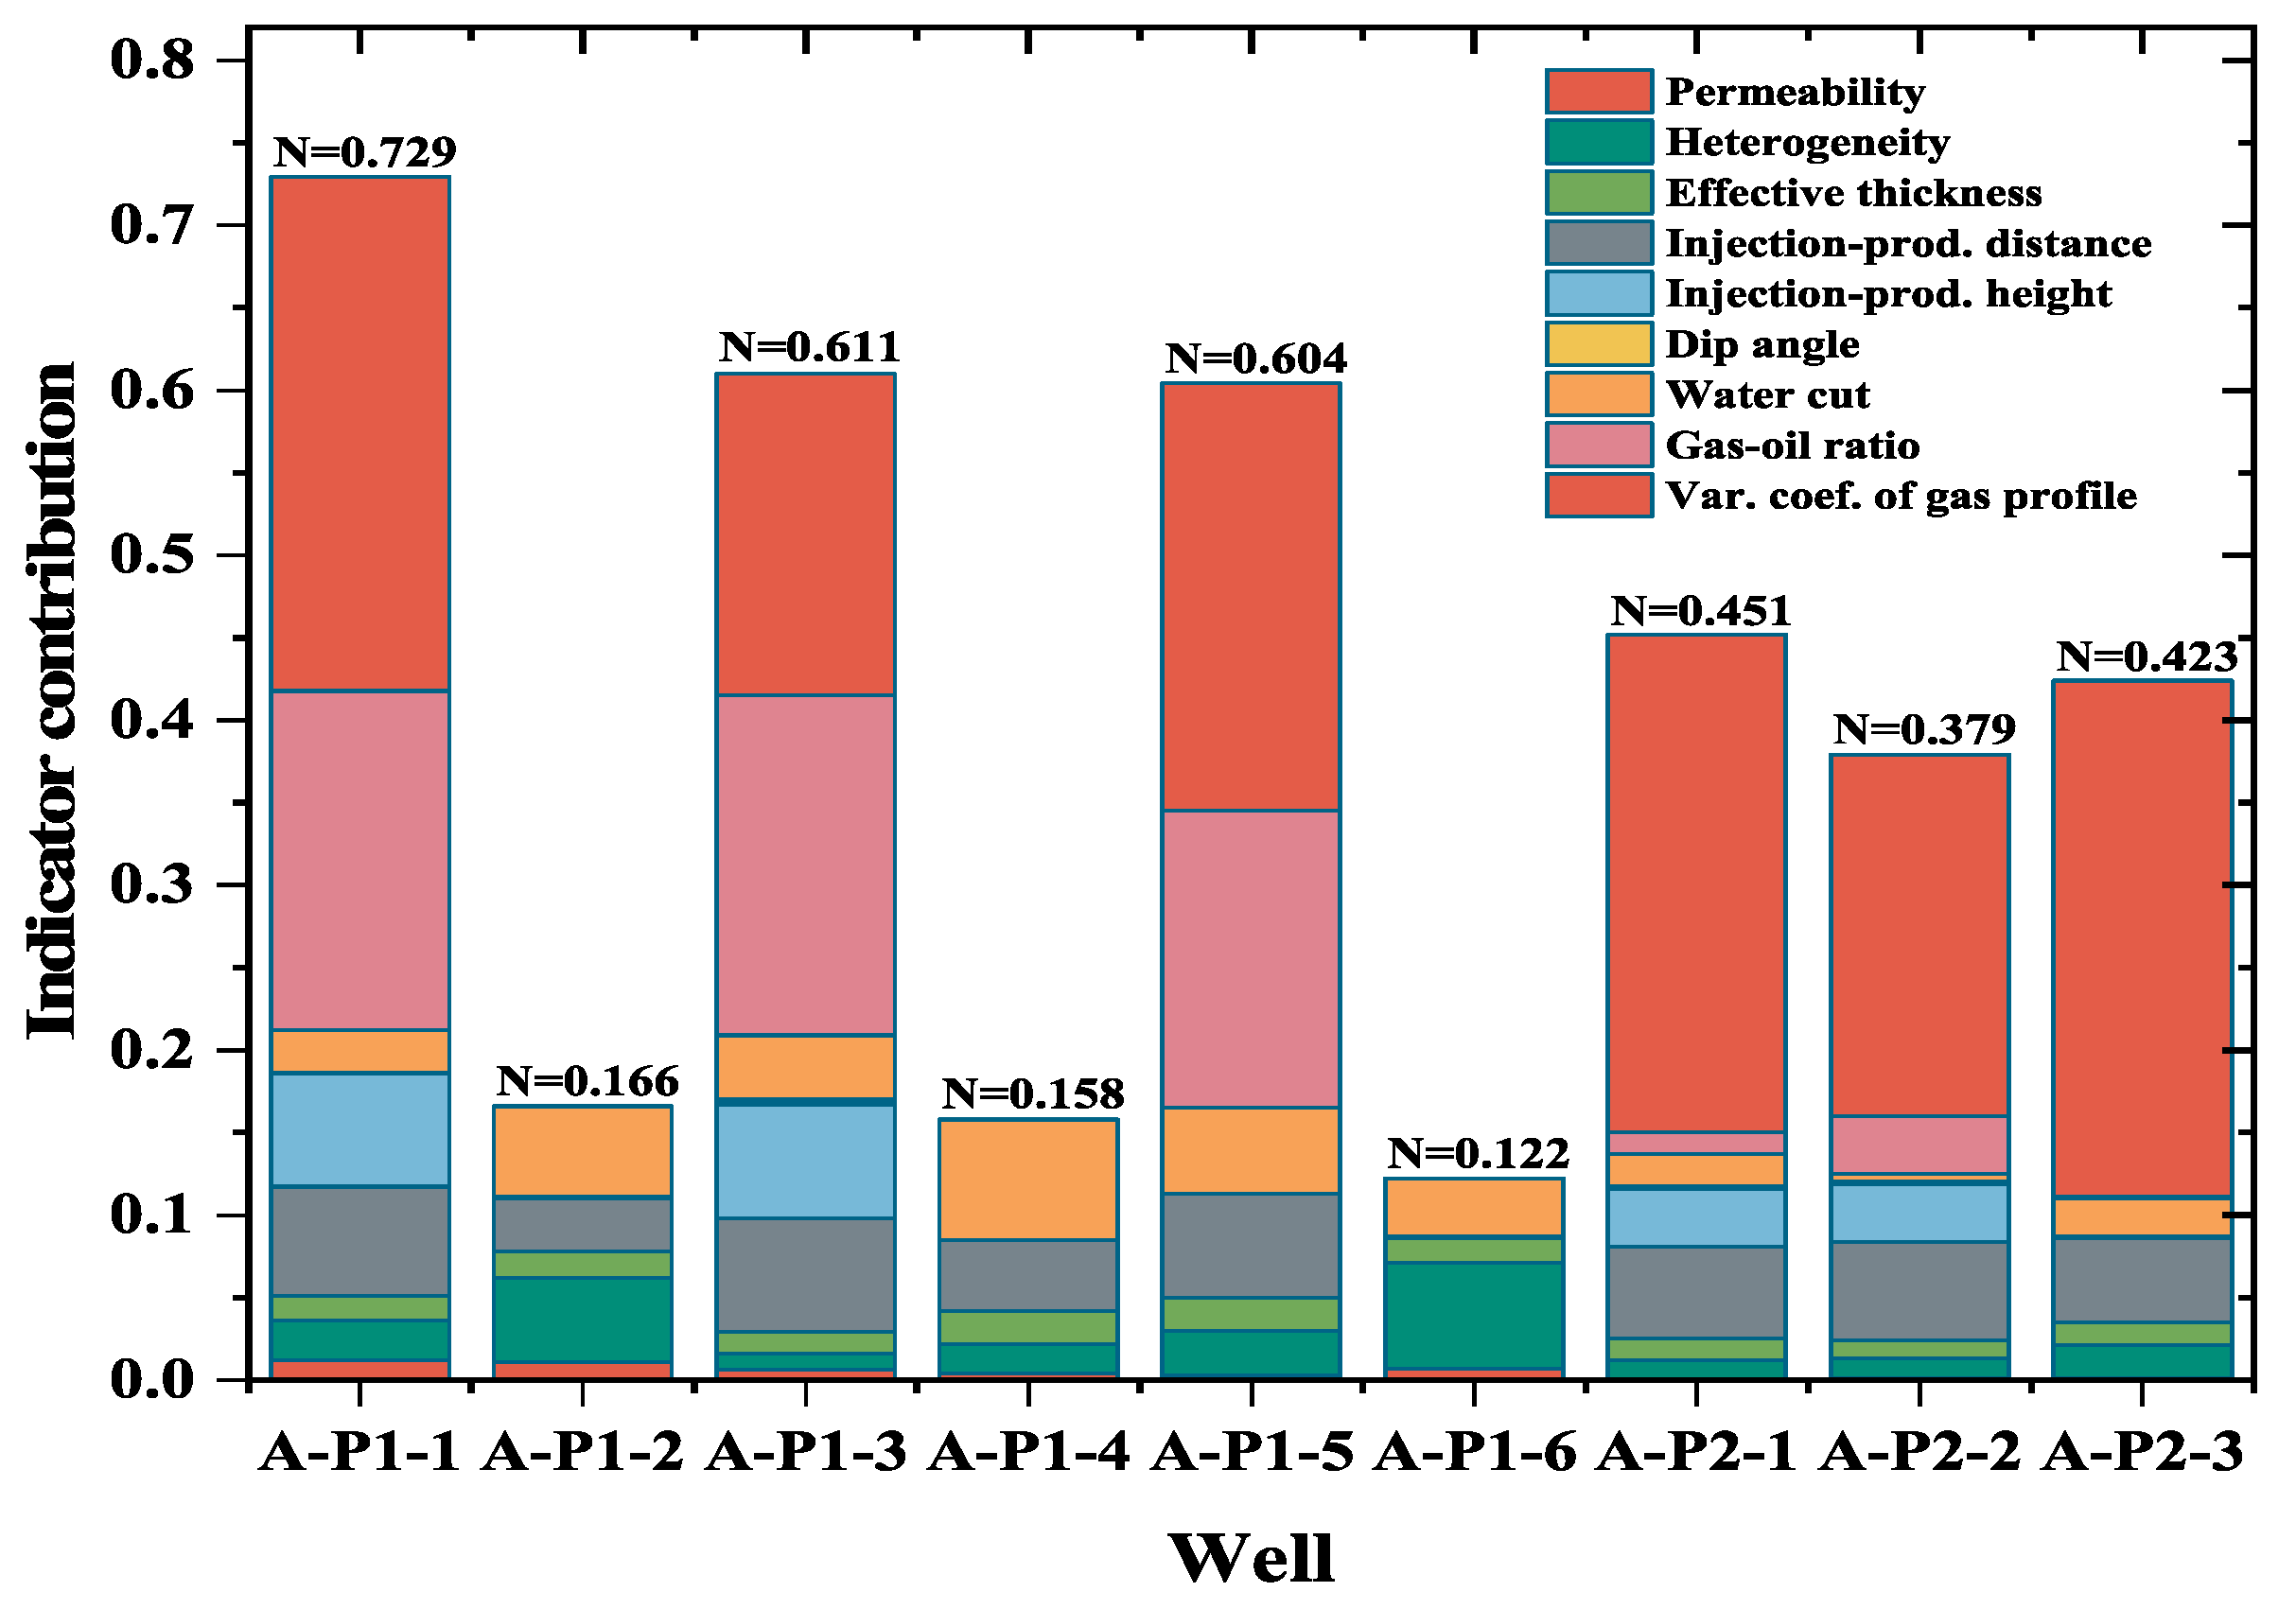
To identify which indicators determine the classification of each well, the well-level coefficient N was decomposed into nine individual-indicator contributions Ci = Wgroup × wi × μi, where wi is the AHP weight of indicator i within its group, μi is its membership degree, and Wgroup is the weight of the corresponding group. As shown in Figure 6, for the High wells A-P1-1, A-P1-3, and A-P1-5, the combined contributions of the gas–oil ratio and the variation coefficient of the gas production profile account for approximately 71%, 66%, and 73% of N, respectively, showing that their classifications are mainly driven by the observed gas-production response. For A-P1-4, water cut is the largest contributor, accounting for 46% of N, indicating that its screening result is dominated by the water-production response. For the Low wells, the contributions from the gas–oil ratio and the variation coefficient of the gas production profile are negligible, indicating a distinctly different contribution pattern from that of the High wells. Accordingly, gas-production-profile behavior should receive particular attention in A-P1-1, A-P1-3, and A-P1-5, whereas water-production response deserves greater attention for A-P1-4.
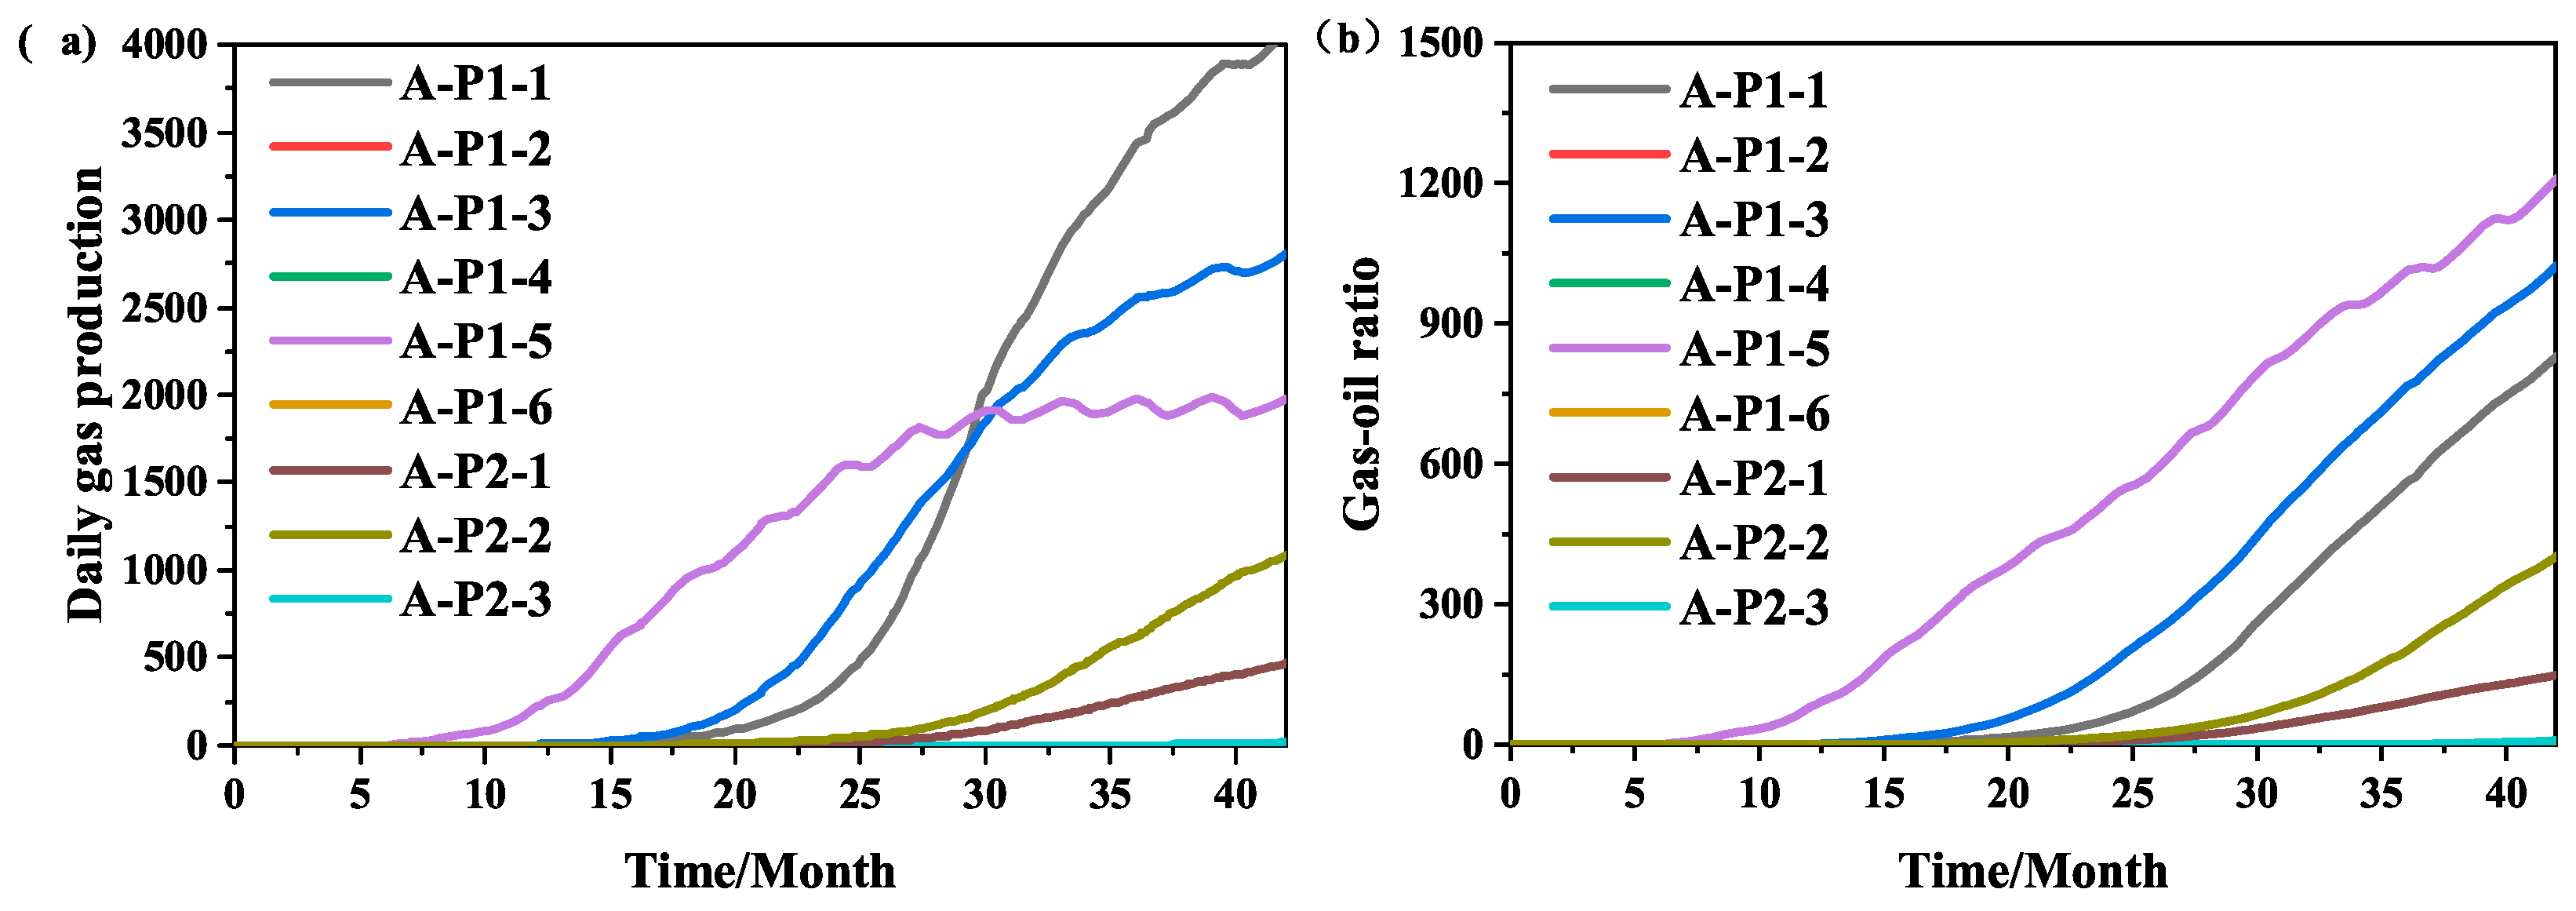
To compare the results predicted by the fuzzy comprehensive evaluation method with the production response, we plotted the daily gas production and gas–oil ratio curves for each production well as shown in Figure 7a,b. It can be seen from the figures that the gas production and gas–oil ratio of production wells A-P1-1, A-P1-3, and A-P1-5 are significantly higher than those of other production wells, while the gas production and gas–oil ratio of A-P1-2, A-P1-4, and A-P1-6 are lower. In the process of CO2 flooding, a higher gas production rate and gas–oil ratio are usually important indicators of gas channeling, indicating a higher risk of gas channeling. Therefore, production wells A-P1-1, A-P1-3, and A-P1-5 are prone to gas channeling, while wells A-P1-2, A-P1-4, and A-P1-6 are not prone to gas channeling. This is consistent with the fuzzy comprehensive evaluation method’s judgment that the comprehensive discrimination coefficients of production wells A-P1-1, A-P1-3, and A-P1-5 are all greater than 0.5 in each layer, indicating their high gas-channeling risk; the comprehensive discrimination coefficients of production wells A-P1-2, A-P1-4, and A-P1-6 are all less than 0.3, which also supports the judgment of low gas-channeling risk. The above consistency demonstrates good agreement between the fuzzy comprehensive evaluation results and the production response. It should be noted that while the fuzzy comprehensive evaluation method can be used to identify gas channeling risks in wells and sublayers, it cannot quantitatively characterize the geometric configurations of gas channeling pathways.

3.3. Sensitivity and Robustness Analysis

The decision-level weighting between the static and dynamic indicator groups (2:1 in the base case) is the strongest assumption in the present AHP model. To test whether the final ranking is robust to this assumption, the static/dynamic weight pair was varied among 1:1, 2:1, and 3:1, respectively. For each scenario, the well-level coefficient was recomputed as N = Ws·Ns + Wd·Nd, where Ns and Nd are the static and dynamic sub-coefficients of Section 3.2. The layer-averaged N of each well is listed in Table 13. Under all three scenarios, the nine wells keep the same High/Moderate/Low classification: A-P1-1, A-P1-3, and A-P1-5 remain high-risk; A-P1-2, A-P1-4, and A-P1-6 remain low-risk; and the three A-P2 wells remain moderate-risk. The N values of the high- and low-risk wells change by less than 0.1 across scenarios, confirming that the ranking is not governed by the specific 2:1 weighting. At the layer level, only one layer crosses a classification boundary: A-P1-2 Layer 2 changes from Moderate (N = 0.315 at 1:1) to Low (N = 0.237 at 2:1 and 0.199 at 3:1), because its N lies close to the 0.3 threshold. This single borderline case does not affect the well-level ranking. It indicates that the overall evaluation is robust to reasonable variations in the decision-level weighting, while layers near a threshold are more sensitive and should be treated cautiously in field application.
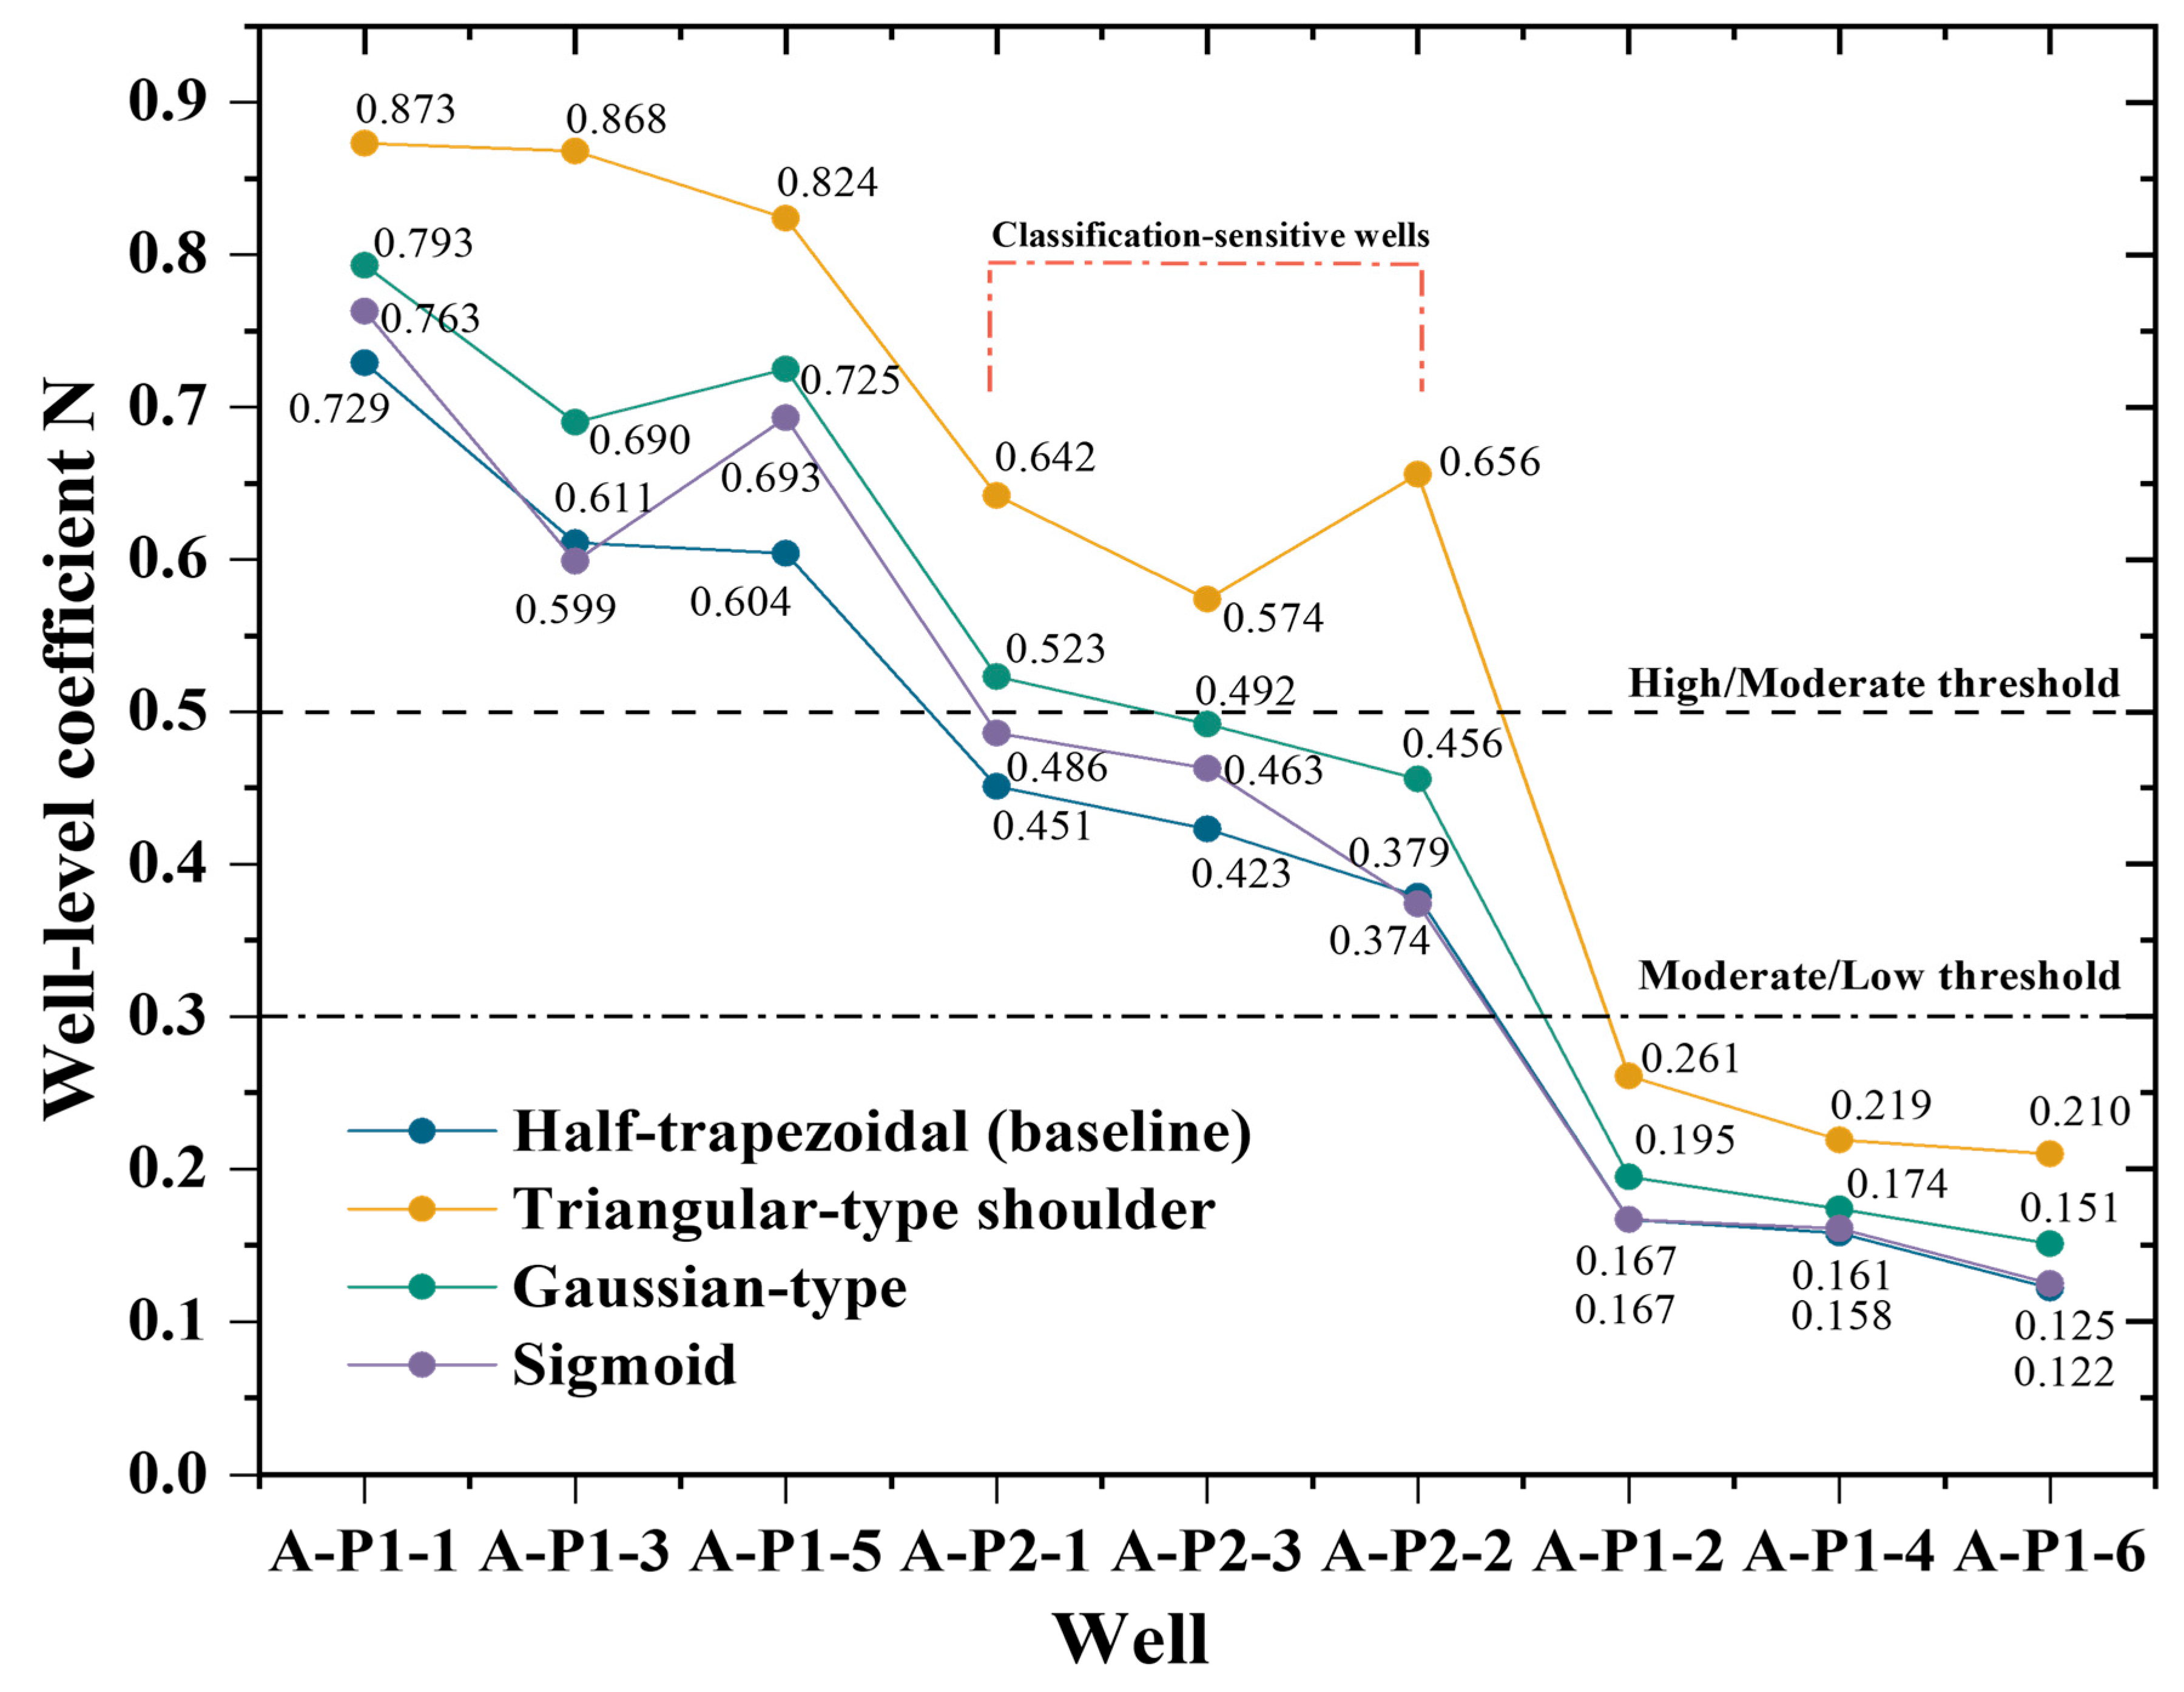
The influence of the membership-function form was further examined using the half-trapezoidal baseline together with triangular-type shoulder, Gaussian-type, and sigmoidal functions as shown in Figure 8. The same boundary parameters a and b were used for all four functions.
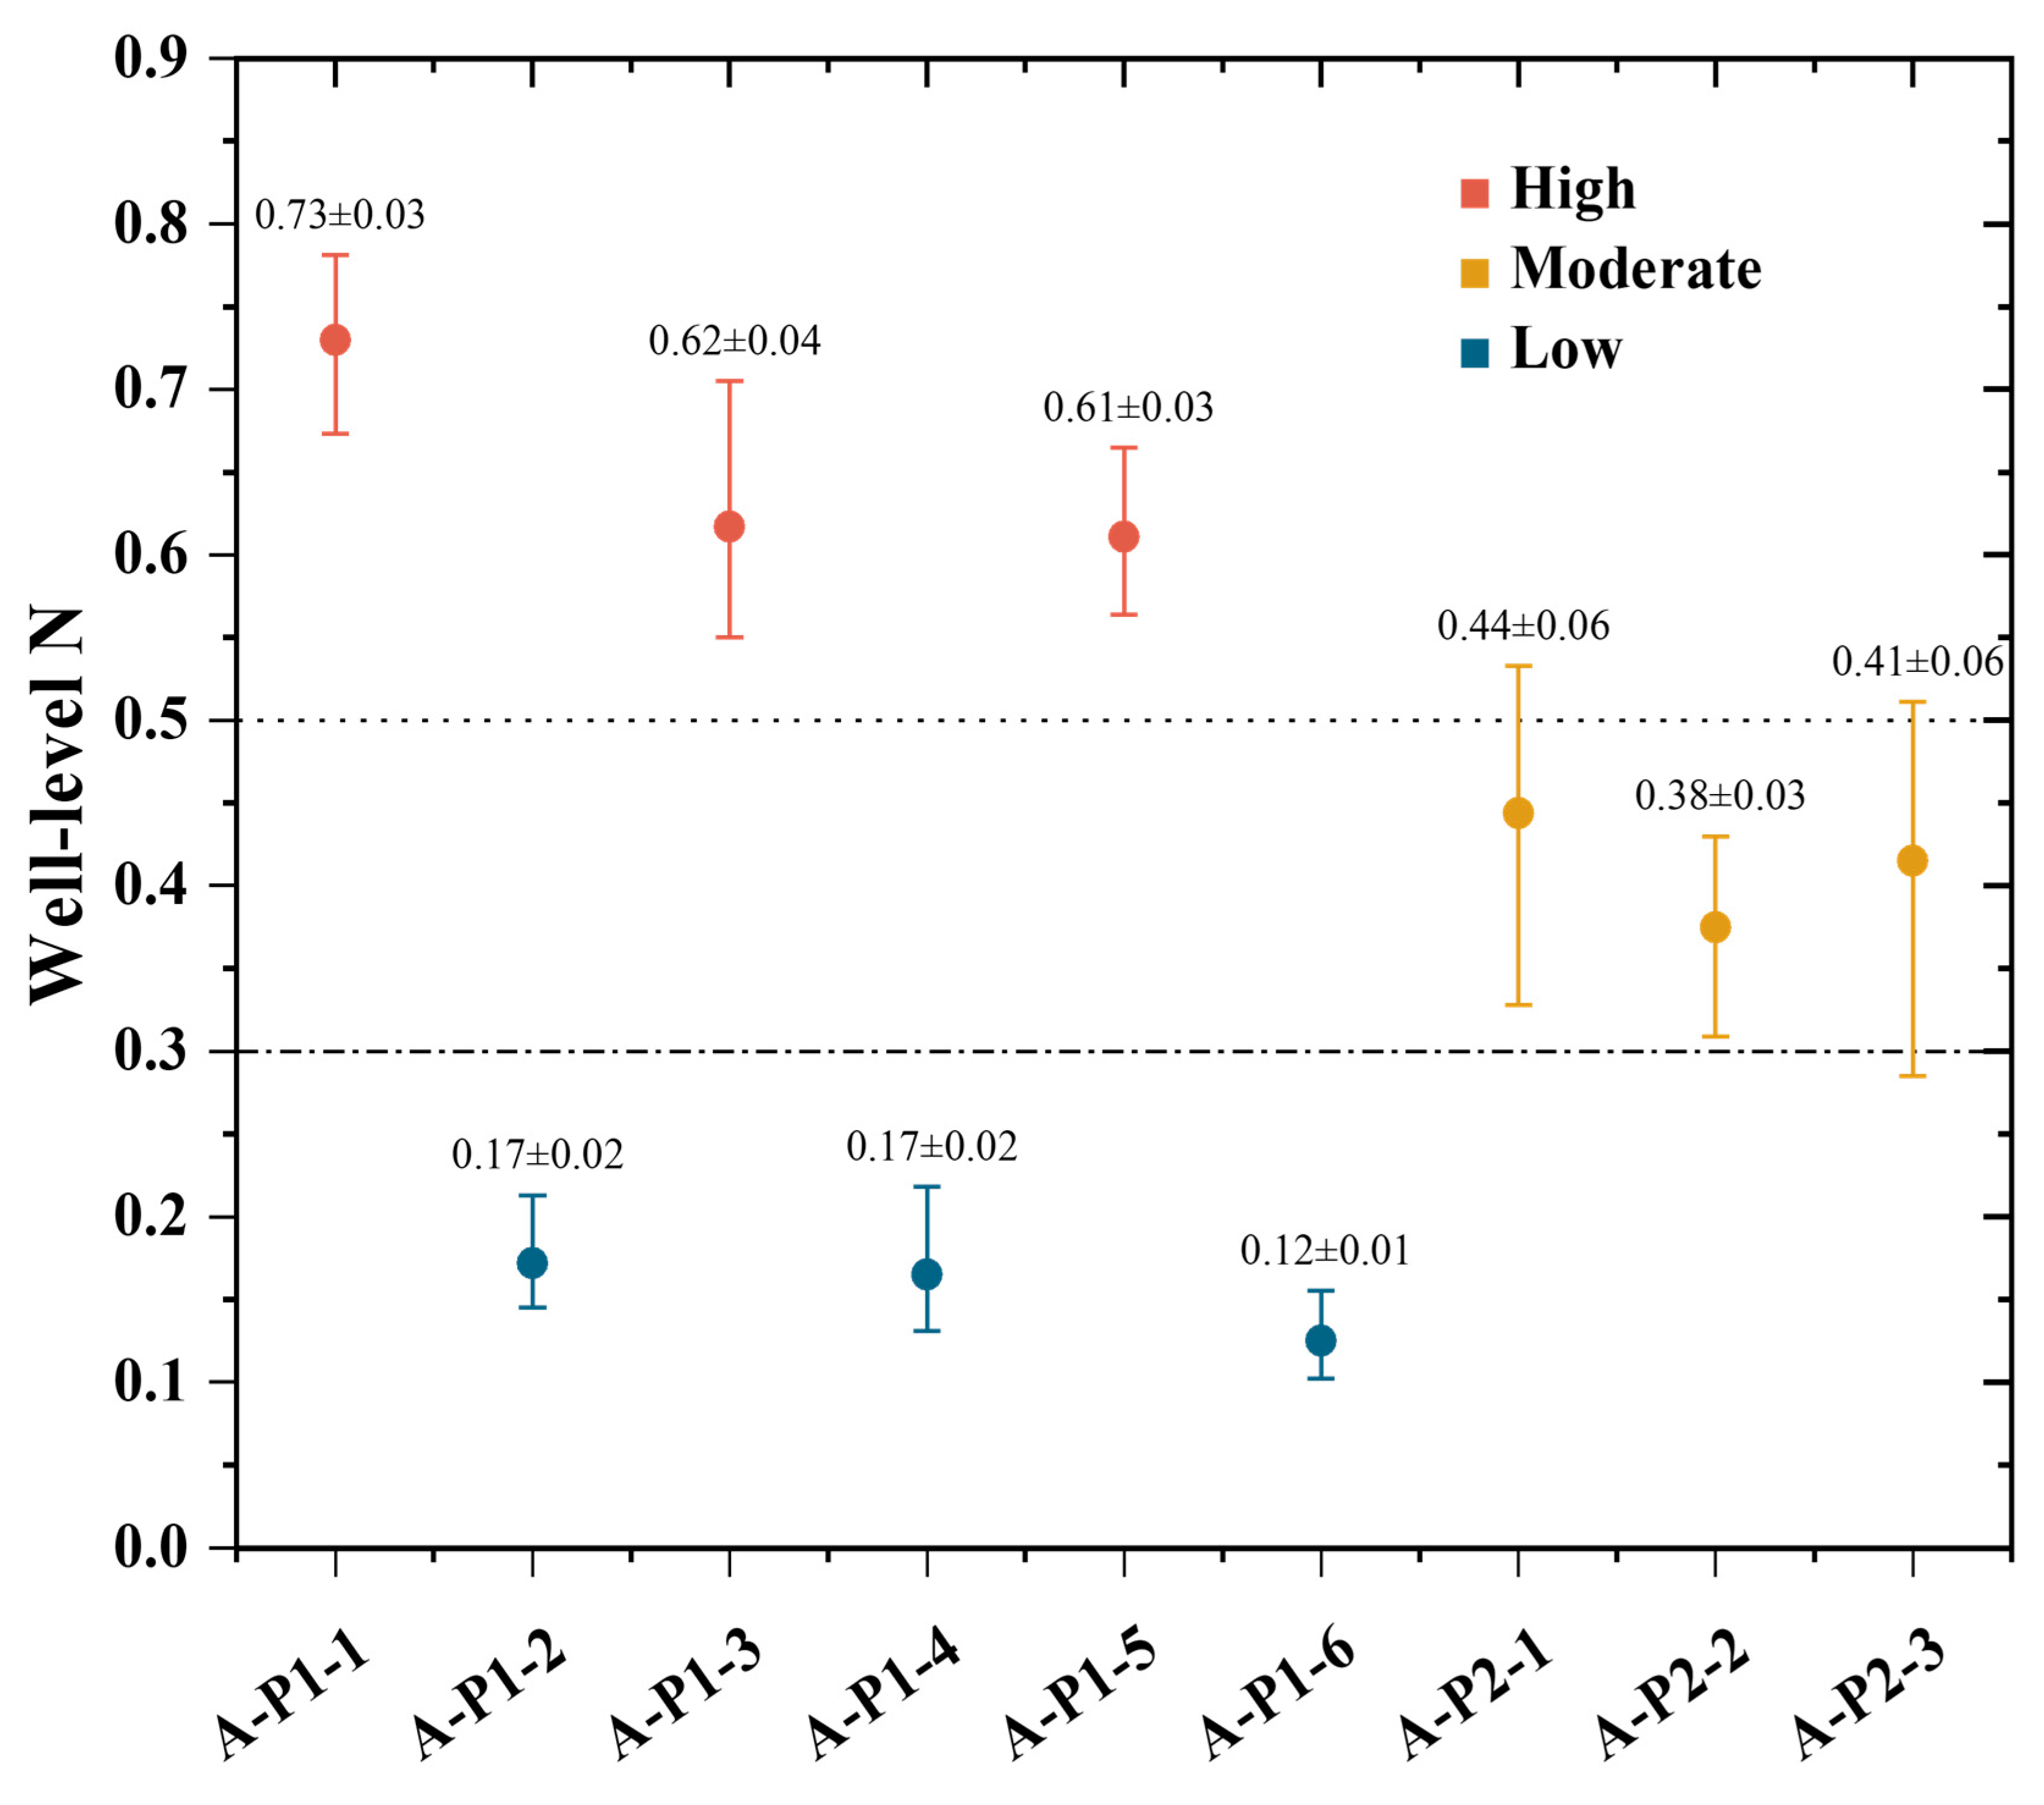
The classifications of A-P1-1, A-P1-3, and A-P1-5 remain High under all four functions, whereas A-P1-2, A-P1-4, and A-P1-6 remain Low. In contrast, classification changes are observed for the three A-P2 wells. Under the half-trapezoidal baseline, A-P2-1, A-P2-2, and A-P2-3 have N values of 0.451, 0.379, and 0.423, respectively, and are all classified as Moderate. Under the triangular-type shoulder function, their N values increase to 0.642, 0.656, and 0.574, respectively, causing all three wells to cross the N = 0.50 boundary and be classified as High. Under the Gaussian-type function, only A-P2-1 crosses the boundary (N = 0.523), whereas A-P2-2 (N = 0.456) and A-P2-3 (N = 0.492) remain Moderate. The sigmoidal function gives the same classifications as the half-trapezoidal baseline for all three A-P2 wells. These results show that the classifications of the clearly High and Low wells are insensitive to the membership-function form, whereas the A-P2 wells, which lie closer to the N = 0.50 boundary, are more sensitive to the functional form. As an additional robustness check, the lower classification threshold was varied from 0.25 to 0.35 and the upper threshold from 0.45 to 0.55, giving 25 combinations. The main High and Low well groups remained unchanged throughout the tested range. Only A-P2-1 (N = 0.451) changed from Moderate to High when the upper threshold was reduced to 0.45, indicating that the main classification pattern is robust while cases close to a threshold are more sensitive.
To further assess the robustness of the evaluation results under simultaneous uncertainty in both the AHP judgments and the measured indicators, a Monte Carlo analysis (2000 samples) was performed by perturbing each pairwise judgment by −2, −1, 0, +1, or +2 levels of the nine-point scale (with reciprocal entries updated accordingly) and the measured indicator values using x′ = x(1 + ε), with ε ~ N(0, 0.05), corresponding to a 5% relative standard deviation. Only samples satisfying the AHP consistency criterion (CR < 0.1) were retained. The High and Low wells retained their classifications in all samples, whereas the Moderate A-P2 wells showed wider Monte Carlo uncertainty intervals and greater classification variability near the decision thresholds, as shown in Figure 9. These results indicate that the main classification pattern is robust under the uncertainty ranges considered in this analysis. More refined, field-calibrated uncertainty quantification can be incorporated as additional uncertainty information becomes available. Cases that exhibit classification changes under the sensitivity or uncertainty analyses can be regarded as borderline cases. In practical application, these cases should receive additional attention and be further evaluated through subsequent monitoring and diagnosis rather than being judged solely by the discrete category label.
As an additional consistency check, a simple rule-based exceedance-count criterion was applied to the nine wells. The criterion was defined as the number of indicators with membership degree μ ≥ 0.5. The resulting ranking shows a positive association with the fuzzy comprehensive evaluation results (Table 14), indicating broad agreement between the two screening approaches, particularly for the highest- and lowest-ranked wells. Differences are mainly observed among wells with intermediate and tied screening results, because the fuzzy comprehensive evaluation retains continuous membership information and indicator weights, whereas the exceedance-count criterion uses only binary exceedance information. Accordingly, the AHP-fuzzy framework is positioned as an engineering screening tool for integrating geological and production information, rather than as a predictive model benchmarked against supervised machine-learning methods.

4. Conclusions

This study adopts a combined approach that integrates the analytic hierarchy process with a fuzzy comprehensive evaluation method to quantitatively analyze six static indicators and three dynamic production indicators during the early development stage of the well group in the A Block of Haian Oilfield. Various factors that influence the formation of gas channels were investigated, and the main conclusions are drawn as follows:
  • The gas channel identification results based on the fuzzy comprehensive evaluation method align well with the dynamic production response observed in production wells, showing the practical applicability of the fuzzy comprehensive evaluation method for detecting gas channels.
  • The evaluation results demonstrate considerable variability in the formation of gas channels among different well groups and sublayers. Specifically, wells such as A-P1-1, A-P1-3, and A-P1-5 exhibit higher comprehensive discrimination indices, indicating more advanced development of gas channels. In contrast, wells like A-P1-4 and A-P1-6 show lower indices, suggesting that their gas channels are less developed.
  • The fuzzy comprehensive evaluation method is applicable in handling multi-source uncertain information and conducting an integrated assessment. However, this method mainly focuses on assessing the overall risk level or development degree of gas channels and does not directly quantify their specific geometric features. In practical applications, combining this approach with other gas channel diagnostic techniques may provide a more thorough and precise identification of gas channel geometries.
Overall, the proposed framework provides a practical approach for gas-channeling screening in CO2-EOR operations, while its applicability can be further strengthened through independent surveillance for channel characterization (e.g., tracer tests, PLT logs, pressure-transient analysis) and uncertainty quantification of the evaluation results.

Author Contributions

Conceptualization, Y.-T.T. and Z.-T.H.; methodology, Y.-T.T. and N.Z.; software, T.-S.L. and N.Z.; validation, T.-S.L. and N.Z.; formal analysis, T.Z. and C.-Y.Z.; investigation, Z.-T.H. and T.Z.; resources, T.-S.L. and T.Z.; writing—original draft preparation, Y.-T.T. and N.Z.; writing—review and editing, T.Z. and C.-Y.Z.; visualization, Z.-T.H. and N.Z.; supervision, Z.-T.H. and C.-Y.Z.; project administration, C.-Y.Z.; funding acquisition, T.-S.L. All authors have read and agreed to the published version of the manuscript.

Funding

This research was funded by PetroChina Zhejiang Oilfield Branch Company through the project “Research on Supporting Technologies for CCUS-EOR Engineering in the Subei Oilfield” (No. HX20231380).

Data Availability Statement

The data presented in this study are available on request from the corresponding author. The data are not publicly available due to confidentiality requirements and restrictions associated with proprietary data of PetroChina Zhejiang Oilfield Branch Company.

Conflicts of Interest

Authors Yuan-Tao Tang, Zan-Tong Hu and Tian-Shun Liu were employed by the PetroChina Zhejiang Oilfield Branch Company. The remaining authors declare that the research was conducted in the absence of any commercial or financial relationships that could be construed as a potential conflict of interest. The authors declare that this study received funding from PetroChina Zhejiang Oilfield Branch Company (No. HX20231380). The funder was not involved in the study design, collection, analysis, interpretation of data, the writing of this article or the decision to submit it for publication.

References

  1. Li, X.; Yang, Z.; Li, S.; Huang, W.; Zhan, J.; Lin, W. Reservoir Characteristics and Effective Development Technology in Typical Low-Permeability to Ultralow-Permeability Reservoirs of China National Petroleum Corporation. Energy Explor. Exploit. 2021, 39, 1713–1726. [Google Scholar] [CrossRef] [Scilit]
  2. Cao, J.; Hao, M.; Chen, Y.; Li, B.; Liu, Z.; Liu, Y.; Xu, J. Advancing PetroChina’s Development Strategies for Low-Permeability Oil Reservoirs. Processes 2024, 12, 351. [Google Scholar] [CrossRef] [Scilit]
  3. Yuan, S.; Ma, D.; Li, J.; Zhou, T.; Ji, Z.; Han, H. Progress and Prospects of Carbon Dioxide Capture, EOR-Utilization and Storage Industrialization. Pet. Explor. Dev. 2022, 49, 955–962. [Google Scholar] [CrossRef] [Scilit]
  4. Li, L.; Abdallah, K.B.; Hamdi, E.; Hou, B.; Cui, Z.; Elsworth, D.; Liu, J. CO2-Enhanced Multiphase Flow in Heterogenous Coal Measures: Thermal-Hydraulic-Mechanic (THM) Model for Enhancing Gas Co-Production with CO2 Geo-Sequestration. Fuel 2026, 407, 137479. [Google Scholar] [CrossRef] [Scilit]
  5. Kang, W.-L.; Zhou, B.-B.; Issakhov, M.; Gabdullin, M. Advances in Enhanced Oil Recovery Technologies for Low Permeability Reservoirs. Pet. Sci. 2022, 19, 1622–1640. [Google Scholar] [CrossRef] [Scilit]
  6. Duan, X.; Hou, J.; Zhao, F.; Ma, Y.; Zhang, Z. Determination and Controlling of Gas Channel in CO2 Immiscible Flooding. J. Energy Inst. 2016, 89, 12–20. [Google Scholar] [CrossRef] [Scilit]
  7. Xu, A.; Shan, F.; Yang, X.; Li, J.; Wang, C.; Li, J. Thief Zone Identification and Classification in Unconsolidated Sandstone Reservoirs: A Field Case Study. J. Pet. Explor. Prod. Technol. 2021, 11, 3451–3462. [Google Scholar] [CrossRef] [Scilit]
  8. Anees, A.; Shi, W.; Ashraf, U.; Xu, Q. Channel Identification Using 3D Seismic Attributes and Well Logging in Lower Shihezi Formation of Hangjinqi Area, Northern Ordos Basin, China. J. Appl. Geophys. 2019, 163, 139–150. [Google Scholar] [CrossRef] [Scilit]
  9. Brigham, W.E.; Abbaszadeh-Dehghani, M. Tracer Testing for Reservoir Description. J. Pet. Technol. 1987, 39, 519–527. [Google Scholar] [CrossRef] [Scilit]
  10. Li, X.; Lu, D.; Luo, R.; Sun, Y.; Shen, W.; Hu, Y.; Liu, X.; Qi, Y.; Guan, C.; Guo, H. Quantitative Criteria for Identifying Main Flow Channels in Complex Porous Media. Pet. Explor. Dev. 2019, 46, 998–1005. [Google Scholar] [CrossRef] [Scilit]
  11. Wang, T.; Wang, L.; Qin, H.; Zhao, C.; Bai, Z.; Meng, X. Identification of Gas Channeling and Construction of a Gel-Enhanced Foam Plugging System for Oxygen-Reduced Air Flooding in the Changqing Oilfield. Gels 2022, 8, 373. [Google Scholar] [CrossRef] [Scilit] [PubMed]
  12. Liu, Y.; Hao, M.; Bi, R.; Bian, C.; Wang, X. Research on Gas Channeling Identification Using the Fuzzy Comprehensive Evaluation Method. Energies 2024, 17, 3908. [Google Scholar] [CrossRef] [Scilit]
  13. He, F.; Yue, M.; Zhou, Y.; He, H.; Jiang, W.; Liu, L.; Qian, C.; Shu, P. Research on the Data-Driven Inter-Well Fracture Channeling Identification Method for Shale Gas Reservoirs. Front. Earth Sci. 2024, 12, 1371219. [Google Scholar] [CrossRef] [Scilit]
  14. Zadeh, L.A. Fuzzy Sets. Inf. Control 1965, 8, 338–353. [Google Scholar] [CrossRef] [Scilit]
  15. Chi, M.; Zhang, D.; Fan, G.; Zhang, W.; Liu, H. Prediction of Water Resource Carrying Capacity by the Analytic Hierarchy Process–Fuzzy Discrimination Method in a Mining Area. Ecol. Indic. 2019, 96, 647–655. [Google Scholar] [CrossRef] [Scilit]
  16. Guo, T.; Tang, S.; Sun, J.; Gong, F.; Liu, X.; Qu, Z.; Zhang, W. A Coupled Thermal–Hydraulic–Mechanical Modeling and Evaluation of Geothermal Extraction in the Enhanced Geothermal System Based on Analytic Hierarchy Process and Fuzzy Comprehensive Evaluation. Appl. Energy 2020, 258, 113981. [Google Scholar] [CrossRef] [Scilit]
  17. Liu, H.; Ren, F.; He, R.; Li, G.; Zhang, J. Application of Fuzzy Comprehensive Assessment and Rock Engineering System to Assess Cavability in Block Caving Mining and Establishment of Its Regionalized Model. Environ. Earth Sci. 2021, 80, 15. [Google Scholar] [CrossRef] [Scilit]
  18. Sun, L. The Application of Fuzzy Comprehensive Evaluation Method in Evaluating Remaining Oil Potential of Oil Layer. IOP Conf. Ser. Earth Environ. Sci. 2021, 781, 022030. [Google Scholar] [CrossRef] [Scilit]
  19. Zhang, P.; Feng, G. Application of Fuzzy Comprehensive Evaluation to Evaluate the Effect of Water Flooding Development. J. Pet. Explor. Prod. Technol. 2018, 8, 1455–1463. [Google Scholar] [CrossRef] [Scilit]
  20. Tian, F.; Fu, Y.; Liu, X.; Li, D.; Jia, Y.; Shao, L.; Yang, L.; Zhao, Y.; Zhao, T.; Yin, Q.; et al. A Comprehensive Evaluation of Shale Oil Reservoir Quality. Processes 2024, 12, 472. [Google Scholar] [CrossRef] [Scilit]
  21. Saaty, T.L. A Scaling Method for Priorities in Hierarchical Structures. J. Math. Psychol. 1977, 15, 234–281. [Google Scholar] [CrossRef] [Scilit]
  22. Li, X.; Chen, S.; Wang, X.; Zhu, Y.; Chang, M.; Uwamahoro, C. Pore Structure Heterogeneity of the Xiamaling Formation Shale Gas Reservoir in the Yanshan Area of China: Evaluation of Geological Controlling Factors. Acta Geol. Sin. 2019, 93, 588–603. [Google Scholar] [CrossRef] [Scilit]
  23. Wu, L.-J.; Wang, W.; Elsworth, D.; Liu, J. Physics-Informed Coordinate-Mapping Categorizations for Deciphering Pore Geometry and Seepage Capacity in Oil Shales. Pet. Sci. 2026; in press. [CrossRef] [Scilit]
  24. Luo, J.; Wang, L. Research on Gas Channeling Identification Method for Gas Injection Development in High-Pressure Heterogeneous Reservoir. Processes 2022, 10, 2366. [Google Scholar] [CrossRef] [Scilit]
  25. Gerbacia, W.E.; Al-Shammari, H. Multi-Criteria Decision Making in Strategic Reservoir Planning Using the Analytic Hierarchy Process. In Proceedings of the SPE Annual Technical Conference and Exhibition, New Orleans, LA, USA, 30 September–3 October 2001. [Google Scholar] [CrossRef]
  26. Lin, C.; Kou, G.; Ergu, D. An Improved Statistical Approach for Consistency Test in AHP. Ann. Oper. Res. 2013, 211, 289–299. [Google Scholar] [CrossRef] [Scilit]
Figure 1. Analytic hierarchy structure model.
Processes 14 02943 g001
Figure 2. Membership values of static indicators: (a) permeability; (b) heterogeneity; (c) effective thickness.
Processes 14 02943 g002
Figure 3. Membership values of static indicators.
Processes 14 02943 g003
Figure 4. Membership values of the dynamic indicator.
Processes 14 02943 g004
Figure 5. Comprehensive evaluation coefficients for the five layers of each production well. Different colors and marker shapes distinguish the nine production wells, while the numbers 1–5 denote Layers 1–5. The dashed lines indicate the N = 0.50 and N = 0.30 classification thresholds.
Processes 14 02943 g005
Figure 6. Contribution decomposition of the well-level coefficient N into nine individual-indicator contributions Ci = Wgroup × wi × μi.
Processes 14 02943 g006
Figure 7. Production characteristic curves of production wells in A-T1 and A-T2 well groups: (a) daily gas production variation curve; (b) gas–oil ratio variation curve.
Processes 14 02943 g007
Figure 8. Well-level N under different membership-function forms. Dashed and dotted lines denote the N = 0.50 and N = 0.30 classification thresholds, respectively.
Processes 14 02943 g008
Figure 9. Monte Carlo uncertainty intervals of the well-level coefficient N (thresholds: 0.3 and 0.5).
Processes 14 02943 g009
Table 1. Characteristics of the nine-point scale method.
ScaleMeaning
1Elements Ci and Cj are equally important.
3Compared to Cj, Ci is slightly more important.
5Compared to Cj, Ci is much more important.
7Compared to Cj, Ci is very strongly more important.
9Compared to Cj, Ci is extremely important.
2, 4, 6, 8The importance of Ci compared to Cj falls between two adjacent levels.
1, 1/2, …… 1/9The ratio of importance between Ci and Cj is the reciprocal of the Ci to Cj ratio.
Table 2. Discrimination matrix for the criterion layer [12].
ScaleStatic IndicatorsDynamic Indicators
Static indicators11/2
Dynamic indicators21
Table 3. Discrimination matrix for static parameters.
ScalePermeabilityHeterogeneityEffective ThicknessWell SpacingInjection-Production HeightDip Angle
Permeability11/51/21/41/33
Heterogeneity512349
Effective thickness21/211/41/36
Well spacing41/3411/28
Injection-production height31/43217
Dip angle1/31/91/61/81/71
Table 4. Discrimination matrix for dynamic parameters.
ScaleWater CutGas–Oil RatioThe Variation Coefficient of Gas Production Profile
Water cut11/31/5
Gas–oil ratio311/2
The variation coefficient of gas production profile521
Table 5. Values of random index [26].
n2345678910
RI00.520.891.121.261.361.411.461.49
Table 6. Parameters for matrix calculation.
Discrimination MatrixλmaxCIRICR
Decision level2000
Static indicators6.51450.10291.260.0817
Dynamic indicators3.00370.00180.520.0036
Table 7. Calculation results of weights for each indicator level.
IndicatorWeightIndicatorWeight
Static parameters0.333Permeability0.062
Heterogeneity0.380
Effective thickness0.117
Injection and production well spacing0.207
Injection and production height0.208
Dip angle0.026
Dynamic parameters0.667Water cut0.110
Gas–oil production ratio0.310
The variation coefficient of gas production profile0.580
Table 8. Final membership-function parameters of the nine indicators.
IndicatorabDirectionUnit
Permeability0.53.0AscendingmD
Heterogeneity1.02.886Ascending
Effective thickness0.2355.0Ascendingm
Injection–production distance171.98728.02Descendingm
Injection–production height01Ascending
Dip angle2553Descending°
Water cut0.1690.649Ascending
Gas–oil ratio02500Ascendingm3/m3
Variation coefficient of gas-production profile01.77Ascending
Table 9. Criteria for gas channeling identification.
Comprehensive Discrimination CoefficientDegree of Gas Channeling
N < 0.3No gas channeling
0.3 < N < 0.5Weak gas channeling
N > 0.5Strong gas channeling
Table 10. Static indicator parameters.
Well No.LayerStatic Index
PermeabilityHeterogeneityEffective ThicknessInjection-Production DistanceInjection-Production HeightDip Angle
A-P1-1layer 10.5251.2723.00196.8153
layer 20.9782.0042.34
layer 32.5631.2432.29
layer 431.1351.33
layer 52.51.1211.54
A-P1-2 layer 11.5231.4073.52469.56050
layer 21.1612.8862.33
layer 32.9321.2302.28
layer 42.4961.3641.69
layer 51.221.9041.31
A-P1-3 layer 10.5011.0012.96171.98144
layer 21.7291.0152.09
layer 311.4911.30
layer 41.6251.0931.16
layer 51.3331.1761.55
A-P1-4 layer 10.51.0014.58384.05052
layer 21.2811.2443.34
layer 30.5051.7831.86
layer 41.3751.1201.81
layer 51.1741.2211.87
A-P1-5layer 10.51.0004.44216.7053
layer 20.8931.2102.92
layer 30.5251.6062.07
layer 41.5831.0871.59
layer 50.9252.0912.22
A-P1-6layer 11.8061.1253.81728.02051
layer 21.4422.0562.20
layer 31.9721.6992.08
layer 40.982.7821.32
layer 50.5572.1171.12
A-P2-1layer 10.5001.0202.833274.660.551
layer 20.5001.3902.437
layer 30.5001.0331.289
layer 40.5001.3811.086
layer 50.5001.0951.375
A-P2-2layer 10.5001.0292.698246.810.549
layer 20.5001.1582.192
layer 30.8801.1681.558
layer 40.5001.1510.474
layer 50.8131.3601.106
A-P2-3layer 10.8061.2482.915316.32050
layer 20.5001.0072.041
layer 30.5881.1731.868
layer 40.5011.2681.082
layer 50.5021.7601.907
Table 11. Dynamic indicator parameters.
Well No.Dynamic Index
Water CutGas–Oil Ratio (GOR)Variation Coefficient
A-P1-10.342851.171.42
A-P1-20.5300
A-P1-30.4283467.480.889
A-P1-40.64900
A-P1-50.512187.261.18
A-P1-60.400
A-P2-10.3153.2681.38
A-P2-20.2428.6431
A-P2-30.3210.541.43
Table 12. Evaluation coefficients for each layer.
Well No.LayerStatic Evaluation CoefficientDynamic Evaluation Coefficient
A-P1-1layer 10.5290.815
layer 20.6710.815
layer 30.5560.815
layer 40.5220.815
layer 50.5120.815
A-P1-2layer 10.2870.082
layer 20.5470.082
layer 30.2560.082
layer 40.2580.082
layer 50.3260.082
A-P1-3layer 10.4900.660
layer 20.5020.660
layer 30.5610.660
layer 40.4920.660
layer 50.5110.660
A-P1-4layer 10.2350.110
layer 20.2730.110
layer 30.3270.110
layer 40.2130.110
layer 50.2300.110
A-P1-5layer 10.2930.736
layer 20.3080.736
layer 30.3580.736
layer 40.2680.736
layer 50.4690.736
A-P1-6layer 10.1470.053
layer 20.2860.053
layer 30.2250.053
layer 40.4000.053
layer 50.2500.053
A-P2-1layer 10.3420.502
layer 20.4070.502
layer 30.3070.502
layer 40.3720.502
layer 50.3210.502
A-P2-2layer 10.3530.388
layer 20.3660.388
layer 30.3620.388
layer 40.3230.388
layer 50.3880.388
A-P2-3layer 10.2790.505
layer 20.2010.505
layer 30.2330.505
layer 40.2310.505
layer 50.3500.505
Table 13. Layer-averaged comprehensive evaluation coefficient N of each well under different decision-level weight scenarios.
Well1:12:13:1Classification
A-P1-10.6860.7290.750High
A-P1-20.2090.1670.146Low
A-P1-30.5860.6110.623High
A-P1-40.1830.1580.146Low
A-P1-50.5380.6040.637High
A-P1-60.1570.1220.105Low
A-P2-10.4260.4510.464Moderate
A-P2-20.3740.3790.381Moderate
A-P2-30.3820.4230.444Moderate
Table 14. Well-level comparison between the AHP–fuzzy comprehensive coefficient N and the rule-based exceedance count (number of indicators with μ ≥ 0.5).
WellN (AHP–Fuzzy Method)Rank by NExceedance Count (Indicators with μ ≥ 0.5)
A-P1-10.729015
A-P1-30.610625
A-P1-50.603735
A-P2-10.451343
A-P2-30.423252
A-P2-20.378563
A-P1-20.166572
A-P1-40.158383
A-P1-60.122491
Disclaimer/Publisher’s Note: The statements, opinions and data contained in all publications are solely those of the individual author(s) and contributor(s) and not of MDPI and/or the editor(s). MDPI and/or the editor(s) disclaim responsibility for any injury to people or property resulting from any ideas, methods, instructions or products referred to in the content.