Article

Numerical Study on the Influence of Cavity Geometry on Rock Materials Under Uniaxial Compression


1
School of Resources, Environment and Safety Engineering, Hunan University of Science and Technology, Xiangtan 411201, China
2
School of Civil Engineering, Hunan University of Science and Technology, Xiangtan 411201, China
*
Author to whom correspondence should be addressed.
Processes 2026, 14(18), 2927; https://doi.org/10.3390/pr14182927
Submission received: 23 July 2026 / Revised: 10 September 2026 / Accepted: 11 September 2026 / Published: 15 September 2026

Abstract

Roadway cross-sectional geometry dominates surrounding rock deformation and failure, yet most existing numerical studies adopt oversimplified ideal cavities rather than practical coal mine roadway profiles, lacking systematic comparisons of real engineering section shapes. This work aims to reveal how practical cavity geometries alter rock mechanical behaviors and fracture mechanisms under uniaxial compression. Twelve equal-area cavity models corresponding to four common underground coal mine roadway types (circular, arched, rectangular, trapezoidal) were constructed, and two-dimensional discrete element method (DEM) uniaxial compression simulations were performed. The results indicate that uniaxial compressive strength and elastic modulus continuously decrease as cavity shapes shift from smooth circular arcs to angular asymmetric profiles, with degradation aggravated by increasing sharp corners; cavity geometry exerts limited influence on Poisson’s ratio but enlarges surrounding rock radial displacement at sharp edges. Angular cavities trigger severe coupled tensile–compressive–shear stress concentration, advance microcrack nucleation and expansion, and generate broader X-type conjugate shear bands, significantly weakening rock bearing capacity. This study clarifies the mesoscopic stress evolution law of rock around roadways, offering theoretical support for roadway section optimization and surrounding rock disaster prevention in underground engineering.

1. Introduction

The mechanical properties of rock masses serve as the core basis for predicting instability and failure in various rock engineering projects [1,2], and they are of great significance for ensuring the long-term safety and stability of underground excavations, underground energy storage repositories, high-level radioactive waste disposal, open-pit rock slopes, hydraulic dam foundations, urban underground spaces, and marine geotechnical engineering [3]. It should be noted that natural rock masses are widely distributed with primary structural defects such as joints [4], cracks, cavities and faults [5,6], which can drastically alter their macroscopic mechanical deformation and fracture response characteristics. Furthermore, varying roadway cross-sectional geometries adopted in mining excavation, tunneling and metro construction also impose marked effects on underground engineering stability.
Extensive research has been conducted on rock masses containing single [7,8], double [9,10,11] or multiple joints [12,13,14], namely discrete fracture networks [15,16] (DFN). Wing tensile cracks and secondary shear cracks in single-fracture specimens all initiate at fracture tips; specimens with multiple fractures exhibit diverse crack coalescence patterns, which are primarily governed by the rock bridge length and fracture dip angle. Similarly, with regard to cavity factors, numerous scholars have adopted experimental or numerical simulation approaches to investigate the effects of parameters including the cavity diameter [17], cavity quantity [18], spatial distribution of cavities [19], cavity geometry [20] and rock bridge length [1] on the mechanical properties of rock masses. For instance, Zeng et al. [3] systematically investigated the influences of seven cavity geometries (regular hexagon, circle, ellipse, rhombus, square, saddle and trapezoid) on the mechanical behaviors of brittle sandstone and concluded that the strength and deformation parameters of sandstone exhibit weak correlation with cavity geometry. Nevertheless, this study lacked effective control over the single variable of cavity volume. Existing studies [18,21] have revealed that increases in cavity diameter and cavity number drastically degrade the compressive strength, elastic modulus and Poisson’s ratio of rock masses, leading to controversial conclusions among the literature. Furthermore, Fang et al. [20] adopted ellipses with various aspect ratios and regular polygons with different side counts to investigate the influences of cavity elongation and angularity on the mechanical properties of rock masses. Their results demonstrated that as cavities become more elongated and angular, the stress concentration at sharp corners grows increasingly severe, which substantially reduces the compressive strength and elastic modulus of rock masses, whereas Poisson’s ratio remains nearly constant. Nevertheless, their study [20] adopted over-idealized cavity geometries. In practical underground engineering such as coal mines, roadway cross sections mainly fall into rectangular, arched and circular categories, which renders the aforementioned conclusions weakly correlated with real engineering scenarios.
Laboratory tests struggle to directly capture the internal stress and displacement fields within specimens, yet such information is critical to revealing fracture mechanisms. The Discrete Element Method (DEM) conceptualizes rock masses as an assemblage of rigid or deformable blocks, where discontinuities are represented via contact interactions at block boundaries [22,23]. Capable of generating intuitive mesoscopic evolution data and extracting such microscale information, DEM has therefore been widely implemented to simulate crack propagation in brittle rock masses [24,25,26]. In view of this, this study will systematically investigate the effects of four major types of cavity geometries on the macroscopic and mesoscopic mechanical properties and crack evolution characteristics of rock specimens under uniaxial compression via 2D DEM. This work is organized as follows. First, the typical roadway cross-section configurations and the establishment procedure of numerical models are elaborated. Secondly, the macroscopic mechanical properties of rock specimens are comprehensively analyzed. Furthermore, the crack propagation behavior and the stress field distribution are elucidated. Finally, the main conclusions of the work are provided.

2. Model Generation

2.1. Cavities with Various Geometries

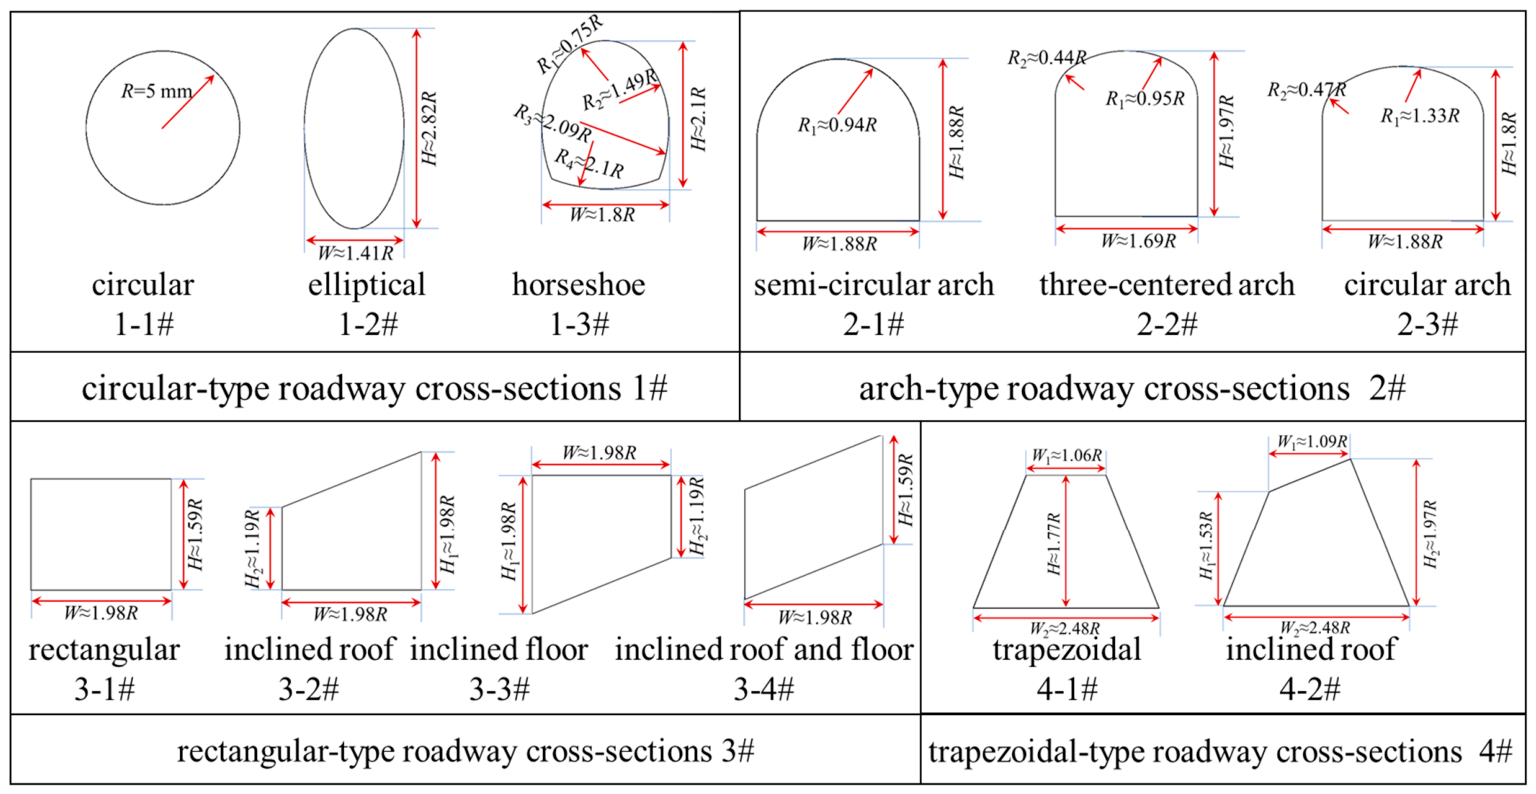
In this study, based on the roadway cross sections widely adopted in underground coal mines, this study classifies four categories based on their contour geometries: rectangular, trapezoidal, arched, and circular roadway cross sections. Figure 1 presents the detailed geometric configurations of all cavities. Specifically, circular roadway cross sections mainly include circular, elliptical and horseshoe configurations; arched roadway cross sections cover semi-circular arches, circular-arc arches and three-centered arches; rectangular roadway cross sections consist of rectangles, rectangles with inclined roofs, rectangles with inclined floors, and rectangles with inclined roofs and floors; trapezoidal roadway cross sections involve standard trapezoids and trapezoids with inclined tops. Since this study mainly aims to compare the overall response under different cavity geometries, quantitative parametric analysis for each single geometric factor is not performed herein; this will be addressed in future work.

2.2. Uniaxial Compression Numerical Simulation

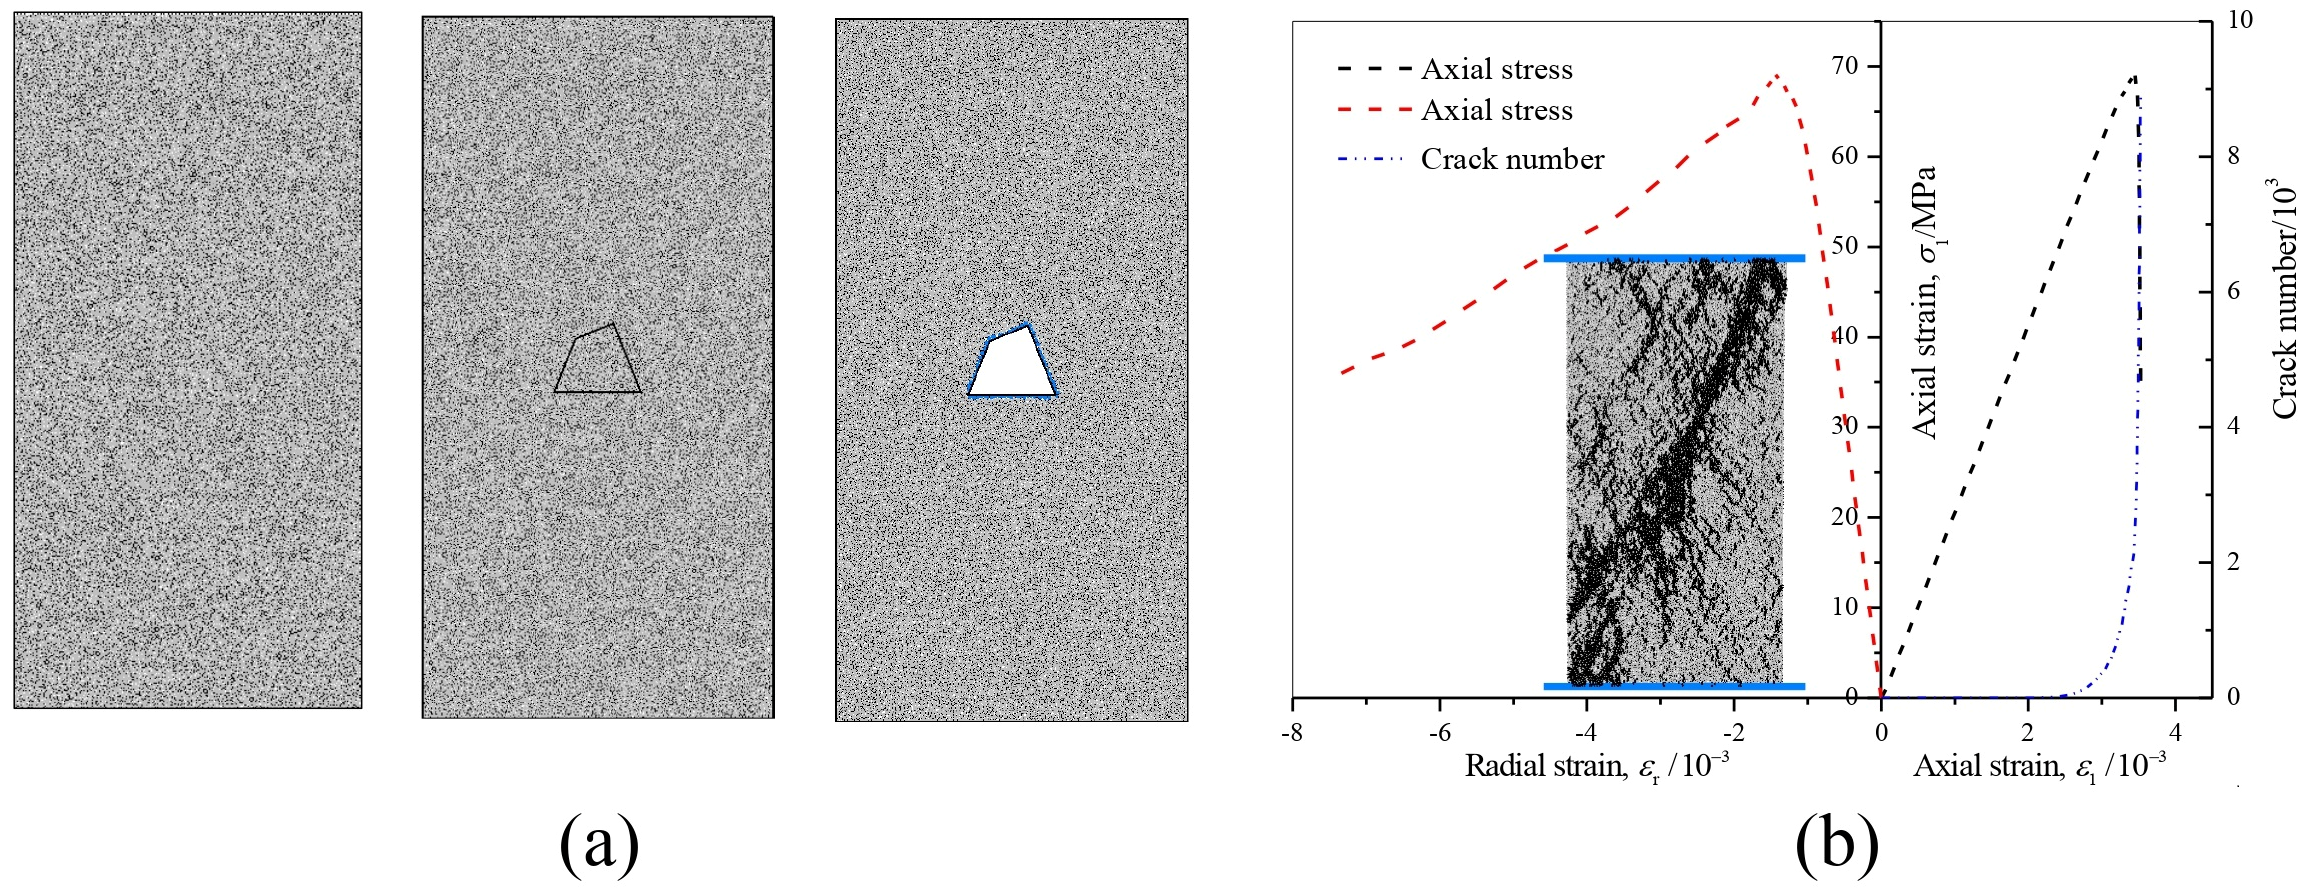
The widely used commercial software Particle Flow Code 2D (PFC2D, Version 6.0) was adopted in this study. Prior to simulation, numerical models containing cavities of various geometries were established. Firstly, rigid walls forming a 50 mm × 100 mm rectangle were generated, and 10,000 balls were packed within the rectangular domain using the radius expansion method. The ball radii are uniformly distributed within 0.18–0.36 mm, yielding a radius ratio of 2.0. Although GPU-based parallel computing algorithms for the DEM are available [27], parallel computation is not required for this work, considering the limited particle quantity, simple particle geometry, and only uniaxial-compression loading condition adopted in simulations. Subsequently, cavities of diverse geometries were generated in the center of the specimen by wall segments, and balls inside the cavities were deleted. Ultimately, the numerical model was fully established when the particle assembly achieved static equilibrium, and all walls were deleted thereafter, as illustrated in Figure 2a. Herein, balls in contact with the cavity-defining walls are assigned to an independent group to facilitate subsequent analysis of cavity displacement evolution. For variable control purposes, the areas of all cavities are kept consistent and set equal to that of a circle with a radius of R = 5 mm. Notably, the main aim of this study is to compare the mechanical responses of various practical roadway-section geometries with fixed specimen size. Accordingly, further sensitivity analyses for the cavity-to-specimen size ratio are not performed in this investigation. In this study, the projected area of pores with different shapes is kept identical, which acts only as an area-constrained control condition. It should be noted that an equal pore area cannot guarantee equivalent mechanical responses. The stress concentration around pores is predominantly controlled by perimeter, curvature distribution and sharp-corner characteristics, which are the target variables to be explored in this work.
All balls are bonded together via the linear parallel bond model [28,29] to simulate brittle sandstone. Uniaxial compression numerical simulations are performed on intact rock specimens without cavities to calibrate the parallel-bond parameters. First, horizontal rigid walls are generated at the upper and lower ends of the intact specimen. These walls are moved toward one another at 0.01 m/s to compress the specimen until full failure is achieved. The ultimate outcomes are illustrated in Figure 2b. Evidently, a sharp decline in axial stress occurs once the peak stress is attained, exhibiting remarkable brittleness. Herein, the slope of the stress-displacement curve (i.e., elastic modulus) is governed by the effective modulus, while the peak stress is determined by the cohesive strength and tensile strength. The Poisson’s ratio is controlled by the normal-to-shear stiffness ratio. All macroscopic parameters are positively correlated with their corresponding microscopic parameters. Iterative trial-and-error calculations were performed to obtain mesoscopic parameters that match the macroscopic mechanical properties of sandstone. All micro-bond parameters are listed in Table 1. At this time, the uniaxial compressive strength of the specimen is 69 MPa, the elastic modulus is 20 GPa, and the Poisson’s ratio is 0.3, which are consistent with the mechanical properties of typical sandstone.

3. Macroscopic Mechanical Properties

3.1. Strength Characteristics

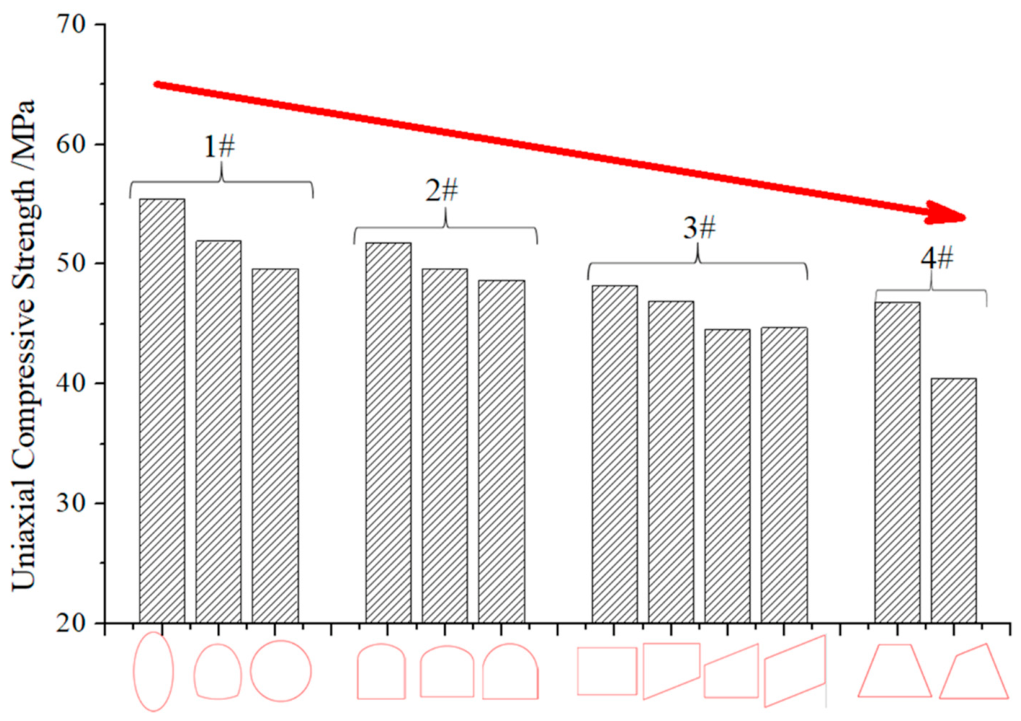
The bar graph in Figure 3 presents the evolution of uniaxial compressive strength for sandstone specimens embedded with cavities of various geometries. It is observed that the uniaxial compressive strength of specimens decreases continuously as the cavity geometry transforms from circular geometry to arched, rectangular and trapezoidal geometries. This may be attributed to the uniform stress distribution and low stress concentration around continuous circular arc cross sections. With the transition of cavity geometry to arched, right-angled rectangular and sharp-cornered trapezoidal configurations, the number of geometric sharp corners and contour discontinuities rises steadily. The stress concentration surrounding the cavities becomes more severe, which gradually lowers the crack initiation stress and peak compressive strength of the specimens. Furthermore, minor strength discrepancies were observed among specimens in each group. Within the same category of cavity geometry, more distinct corners and a higher geometric asymmetry of the cavity induce a more remarkable drop in compressive strength. Such behavior is particularly pronounced for rectangular and trapezoidal cavities with inclined upper or bottom edges. Cai et al. [30] and Zhou et al. [31] also found that the bearing capacity of rock mass decreases with the increase of cavity angularity. It is worth noting that Fang et al. [20] found that the uniaxial compressive strength declines as elongation rises. Similar phenomena have also been reported in another paper [30]. This is inconsistent with the trends obtained for circular and elliptical cavities in this study. It is speculated that this discrepancy is related to the azimuth of the major axis of the ellipse. In the model proposed by Fang et al. [20], the major axes of elliptical cavities are randomly distributed in all directions. By contrast, the major axes of elliptical cavities in Cai et al. [30]’s model are perpendicular to the loading direction, whereas those in the present study are parallel to the loading direction. For an elliptical cavity with its major axis parallel to the loading direction, the circumferential tensile stress concentration at the horizontal flanks of the cavity is substantially lower than that surrounding a circular cavity. Crack initiation is postponed, as evidenced by the early-stage crack distribution in Section 4.1, and the vertical intact rock possesses a larger bearing area. As a result, the specimen achieves higher uniaxial compressive strength than the specimen with a circular cavity. Zeng et al. [3] further verified the conjecture in this study via experiments and numerical simulations.

3.2. Deformation Characteristics

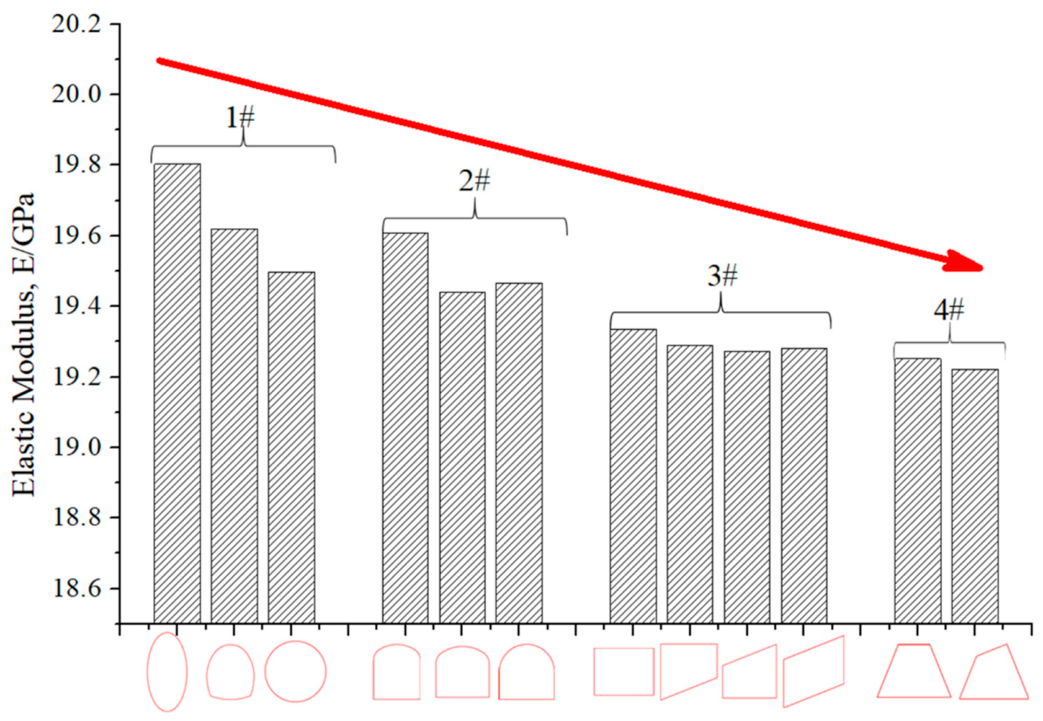
The bar graph in Figure 4 presents the evolution of the elastic modulus for sandstone specimens embedded with cavities of various geometries. Interestingly, consistent with the trend of uniaxial compressive strength (Figure 3), the elastic modulus of specimens declines steadily when the cavity cross section transforms from smooth circular geometry to arched, rectangular and trapezoidal configurations. Similar phenomena were also observed by Fang et al. [20], using regular polygons with different side numbers. The plausible explanation is that sharp corners substantially aggravate local stress concentration and induce strain localization, where the strain at corner regions greatly surpasses the average strain. In addition, the relatively reduced effective bearing area lowers the macroscopic ability of the material to resist elastic deformation, thus decreasing the elastic modulus. Furthermore, minor discrepancies in elastic modulus exist among specimens in each group, which stem from differences in the cavity curvature, the gentleness of corner transition and geometric asymmetry.
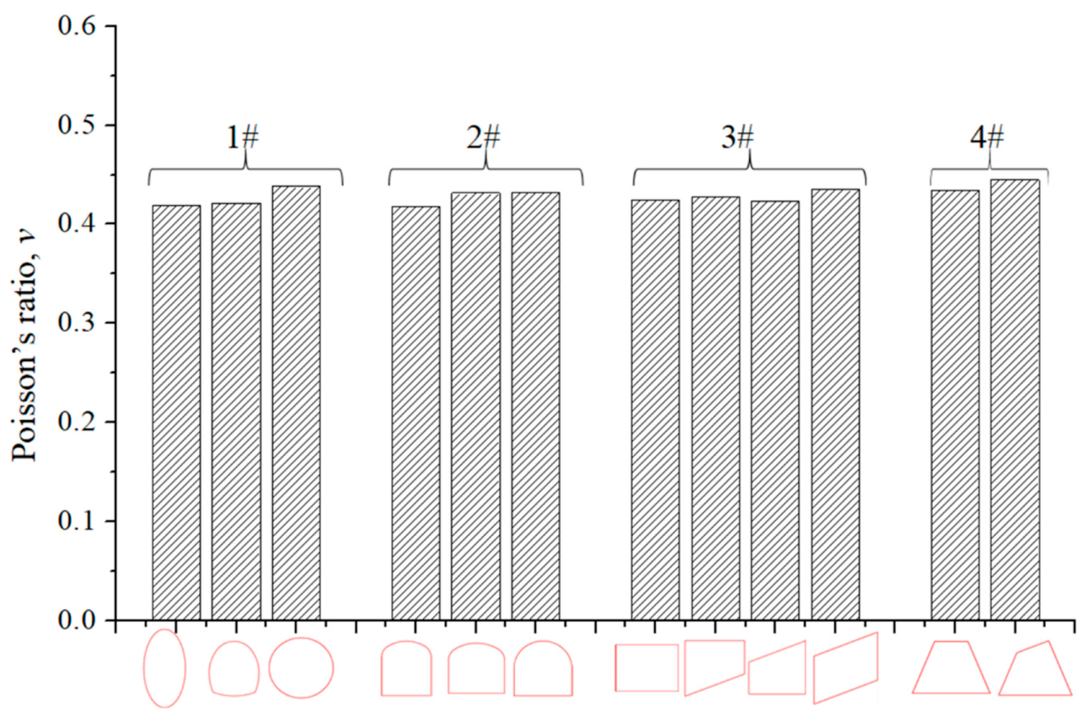
Figure 5 presents the correlation between the cavity geometry and Poisson’s ratio of specimens. It is observed that the Poisson’s ratios with various cavity geometries are concentrated in the range of 0.41–0.45, all exceeding the Poisson’s ratio of intact rock (i.e., 0.3). The presence of a cavity induces lateral elastic tensile deformation around the cavity wall and weakens the lateral confinement of rock mass. Under identical axial compression, the lateral expansion strain of the specimen is remarkably higher than that of intact sandstone without a cavity, which accounts for the larger Poisson’s ratio of rock containing a cavity. Furthermore, cavity geometry has a secondary influence on Poisson’s ratio compared with its influence on the uniaxial compressive strength and elastic modulus. A closer examination reveals that the average Poisson’s ratio of specimens rises marginally from the 1# cavity to the 4# cavity. It is speculated that, for specimens with smooth curved cavity, the surrounding rock exhibits uniform lateral strain and weak lateral expansion. Increased sharp corners and geometric asymmetry of the cavity amplify local lateral tensile strain, leading to more prominent lateral expansion under identical axial deformation and thereby a marginal rise in Poisson’s ratio. Minor differences in cavity curvature and corner transition within the same group also result in a slight scatter of Poisson’s ratio. The detailed quantitative results of uniaxial compressive strength, elastic modulus and Poisson’s ratio for each specimen are summarized in Table 2.

3.3. Deformation Characteristics of the Cavity

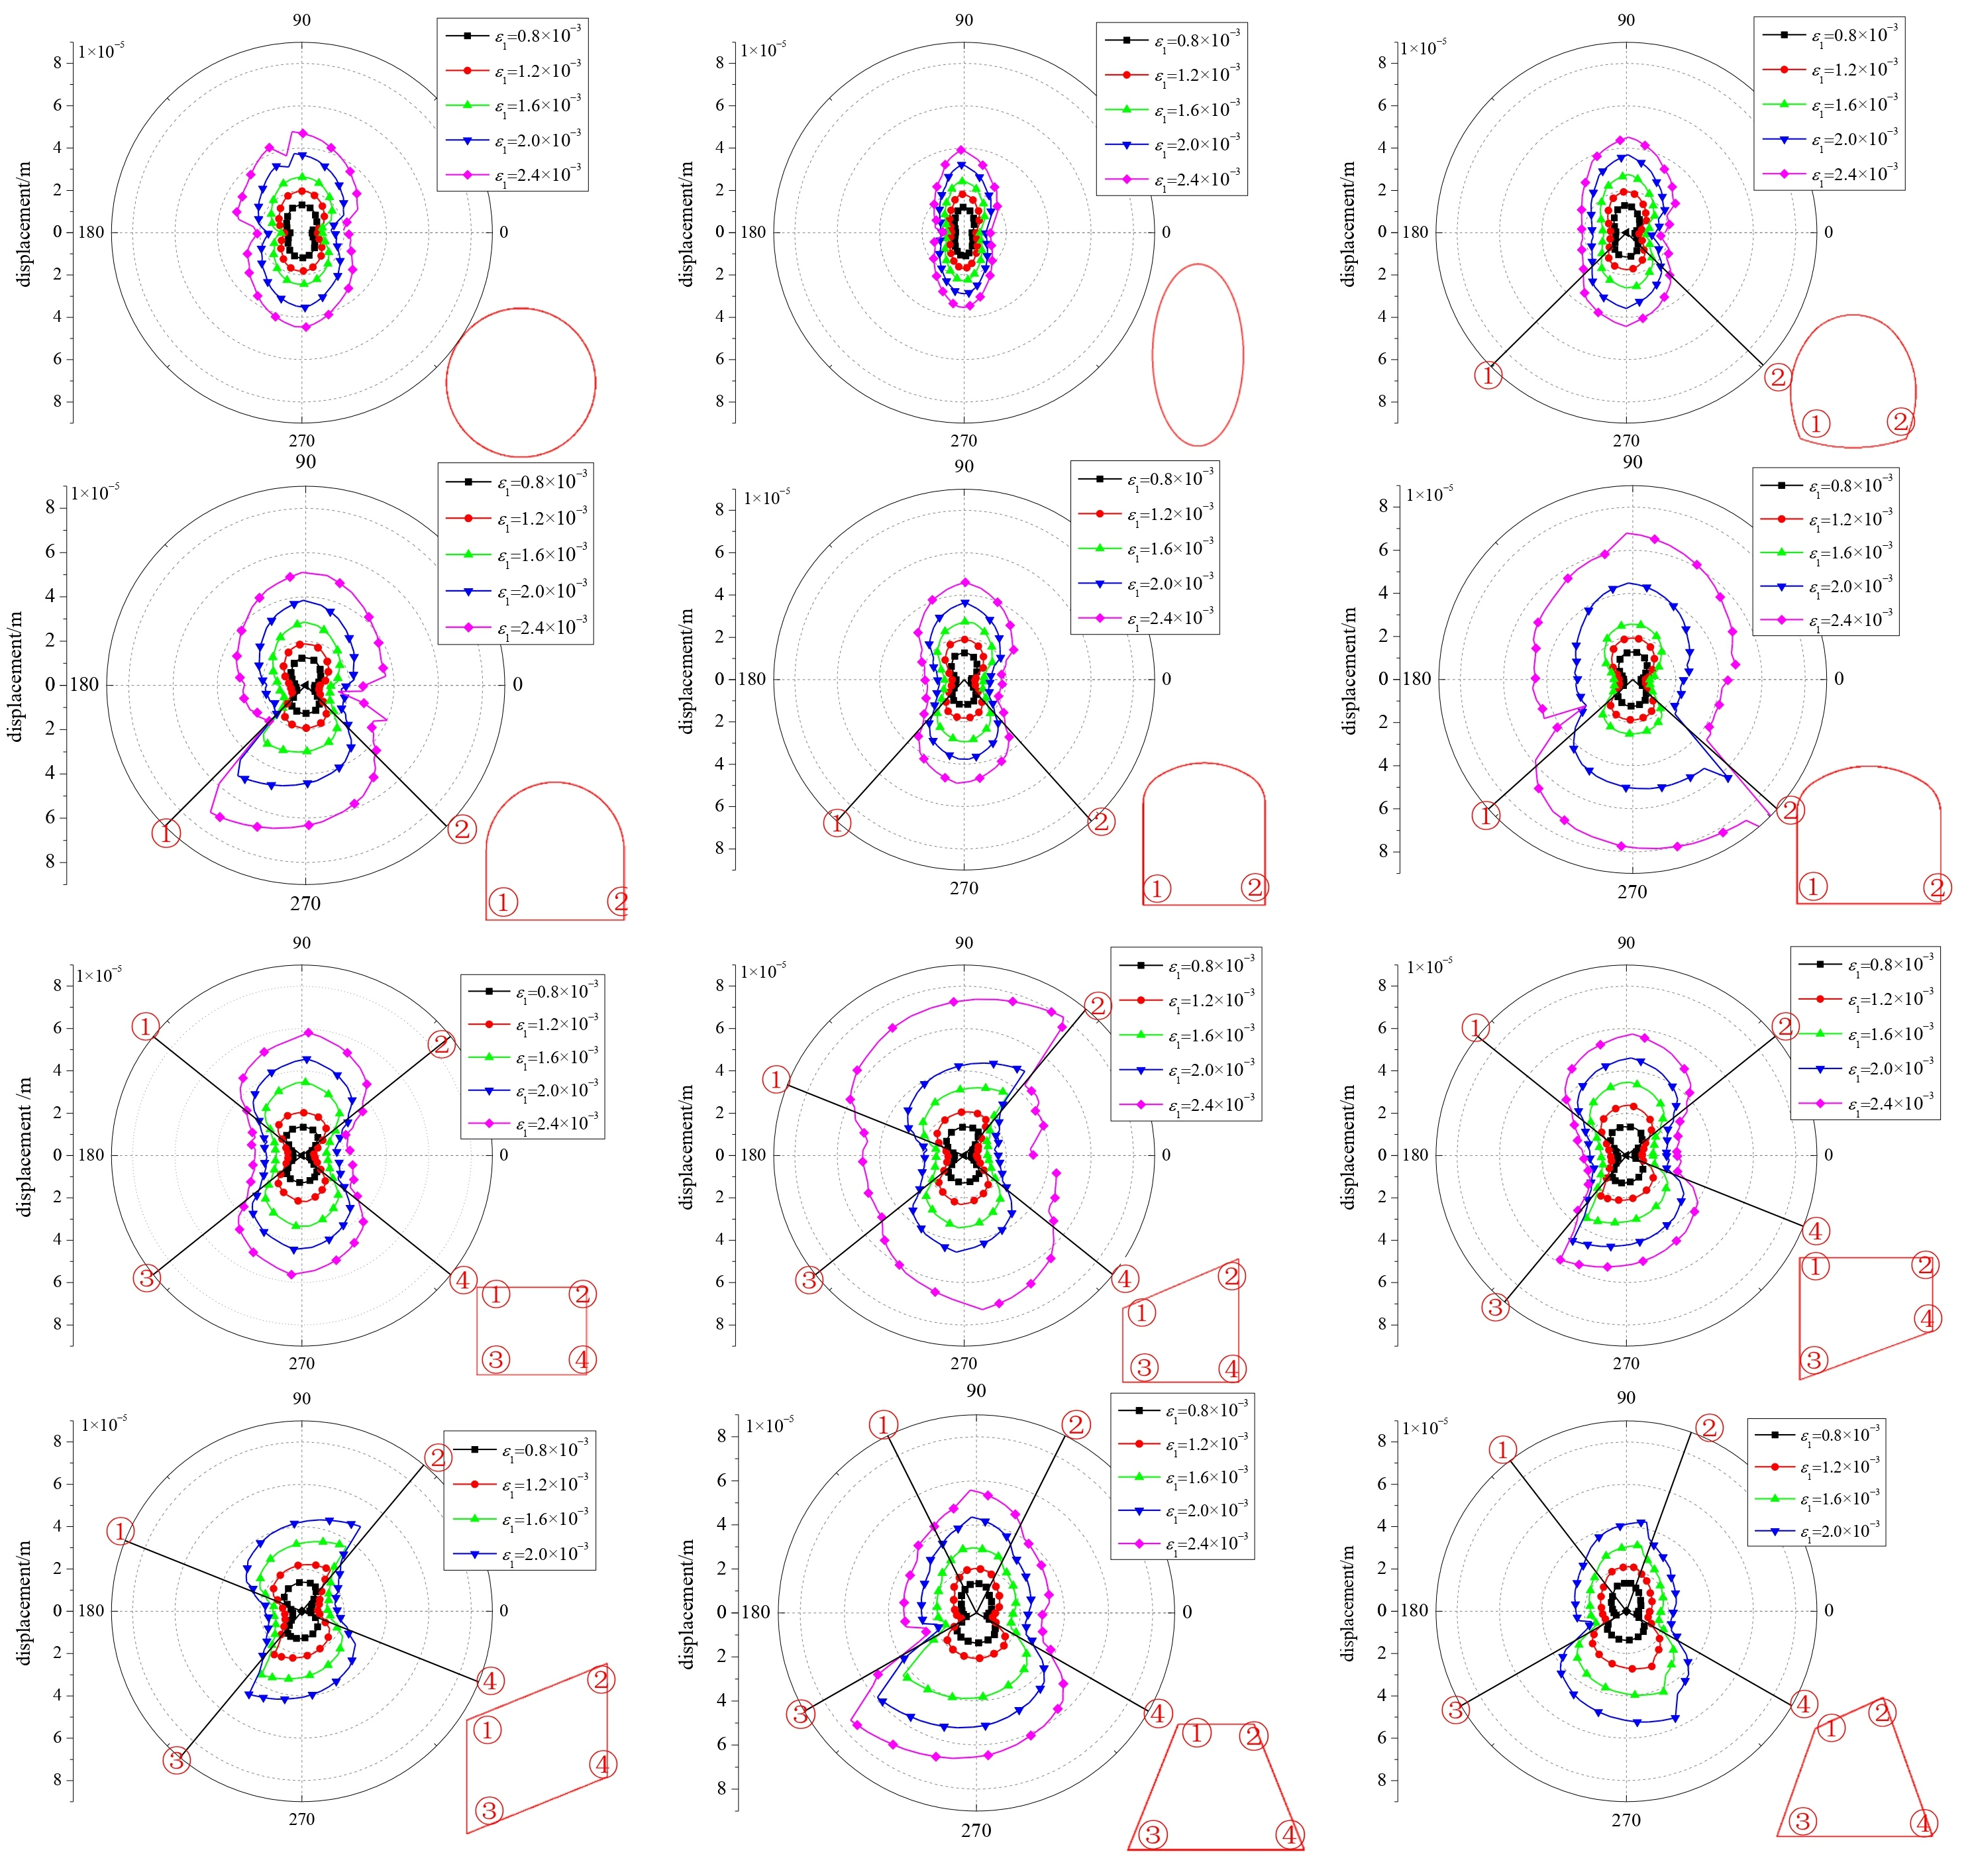
Figure 6 presents the evolution of cavity displacement with axial strain under various cavity geometries. For all cavity geometries, continuous loading leads to a synchronous rise in radial displacement over the entire cavity boundary, accompanied by the outward propagation of high-displacement contours. Another paper [30] notes comparable phenomena. In addition, cavities with sharper corners and higher geometric asymmetry show a more pronounced displacement increment and faster deformation expansion rate during strain growth. Lin et al. [32] draw similar conclusions and attribute this behavior to pronounced stress-concentration effects around corner regions. In the low-strain stage, vertical displacement markedly exceeds horizontal displacement under axial load. In the high-strain stage, rectangular and trapezoidal cavities possessing sharp corners experience an abrupt strain increase at corner regions. More significantly, cavity geometry has a pronounced effect on cavity displacement. Consistent with the variation trends of uniaxial compressive strength (Figure 3) and elastic modulus (Figure 4), the maximum radial displacement around the cavity rises progressively under the same axial strain as the cavity geometry transforms from circular, arched, rectangular to trapezoidal geometries. The surrounding rock undergoes the largest deformation and expansion for the inclined trapezoidal cavity featuring sharp upper corners. A plausible explanation is that smooth continuous circular profiles are free of stress concentration, leading to coordinated surrounding rock deformation with low magnitude. Sharp corners on the cross section induce elastic stress concentration, which intensifies local radial expansion deformation under the same load. Asymmetric cross sections further disrupt the deformation coordination on both sides and amplify the unilateral displacement. Consequently, the overall surrounding rock displacement reaches the maximum for trapezoidal cavities and the minimum for curved cavities. Sharp corners and asymmetric cross sections amplify the deformation around cavities and substantially raise the local strain. Such features not only reduce the elastic stiffness of rock mass but also induce fracture initiation in advance. Accordingly, a general law is formed: larger cavity displacement corresponds to synchronous reductions in uniaxial compressive strength and elastic modulus.

4. Failure Characteristics and Stress Field Distribution

4.1. Crack Initiation and Propagation

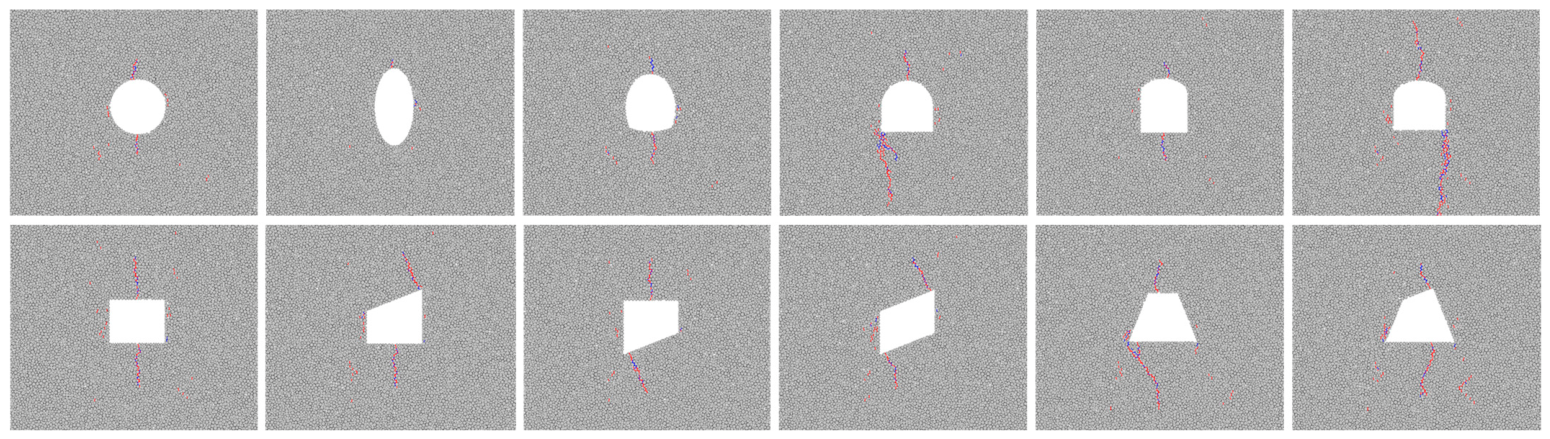
Figure 7 illustrates the early-stage microcrack distribution under different cavity geometries at axial strain ε1 = 2 × 10⁻³. Red represents shear cracks, and purple denotes tensile cracks. At this strain stage, compressive stress concentration zones and tensile stress concentration zones separately occur at the left–right and top–bottom ends of the cavity [18,33]. As the distance from the upper and lower cavity boundaries increases, tensile stress gradually decays and converts into compressive stress, which restricts further crack propagation [34]. It can be found that microcracks at early stage with various cavity geometries all initiate at locations with significant stress concentration along the cavity profile. Obvious differences in the scale and distribution pattern of crack development exist with variations in the geometric characteristics of cavities. Xia et al. [33] also hold that the initial crack initiation site and propagation tendency are governed by cavity-end positions. Specifically, under identical axial strain, microcracks all initiate in the stress-concentrated zones of the cavity. Only a small number of short cracks are generated at the upper and lower ends of smooth curved cavities. As the cavity gradually transforms into arched, polygonal and trapezoidal geometries, sharp corners and geometric asymmetry increase progressively, which intensifies stress concentration at corners. Accordingly, the quantity, branching degree and extension length of microcracks keep increasing, and specimens with trapezoidal cavities exhibit the most prominent initial fracture damage. Sharper corners induce more intense stress concentration. This not only aggravates local deformation and reduces the effective bearing area, resulting in a decline in elastic modulus, but also facilitates preferential initiation and accelerated propagation of microcracks at corner regions, thereby leading to a substantial degradation in uniaxial compressive strength.
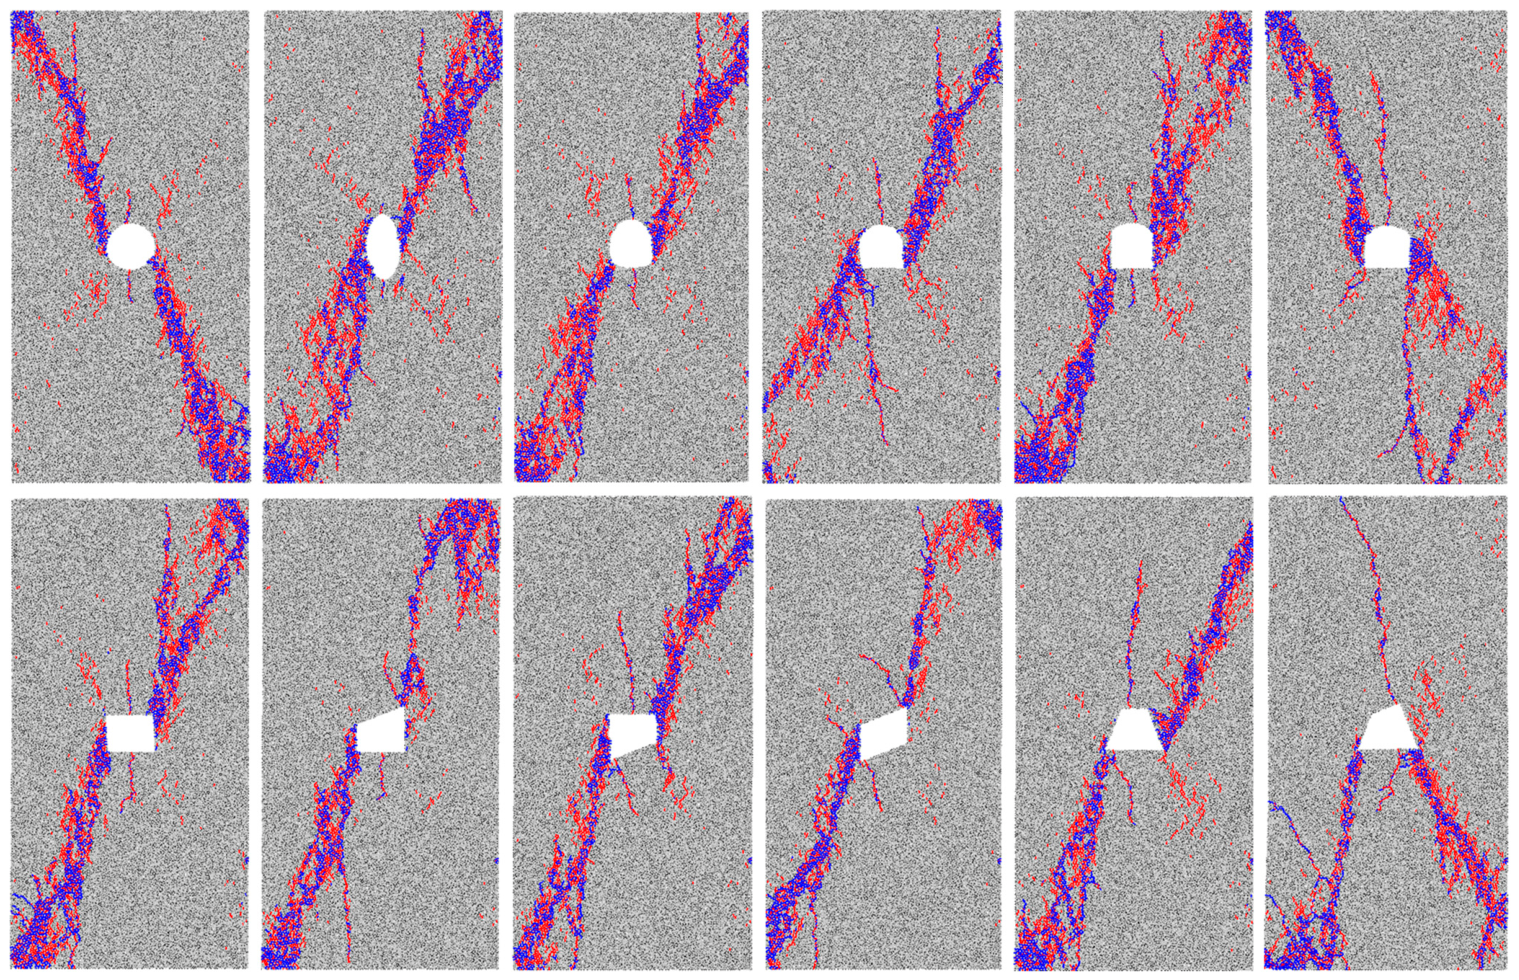
Figure 8 displays the overall microcrack distribution patterns of sandstone specimens after complete failure. As illustrated, despite varied cavity geometries that modify the local stress concentration factor and initial crack nucleation locations, the macroscopic principal stress field within the rock mass governs the failure mode under high axial compression. All specimens therefore tend to form a through-going X-shaped or single-inclined shear band. Other physical experiments and numerical simulations support such failure features [30,34,35]. This indicates that cavity geometry controls local damage, whereas the stress field dictates global failure. However, cavities possessing sharp corners lead to broader shear bands and more extensive fractured regions, which further explains the remarkable degradation in rock strength for specimens with angular cavities.

4.2. Stress Field Distribution

Stress components (i.e., σ11, σ22 and τ12) for each ball are available within the PFC2D platform. On this basis, the maximum principal stress σ1 and maximum shear stress τmax of each ball can be obtained according to Equations (1) and (2).
σ 1 , 2   = σ 11 +   σ 22 2 ± σ 11   σ 22 2 2 + τ 12 2
τ max   = σ 1   σ 2 2
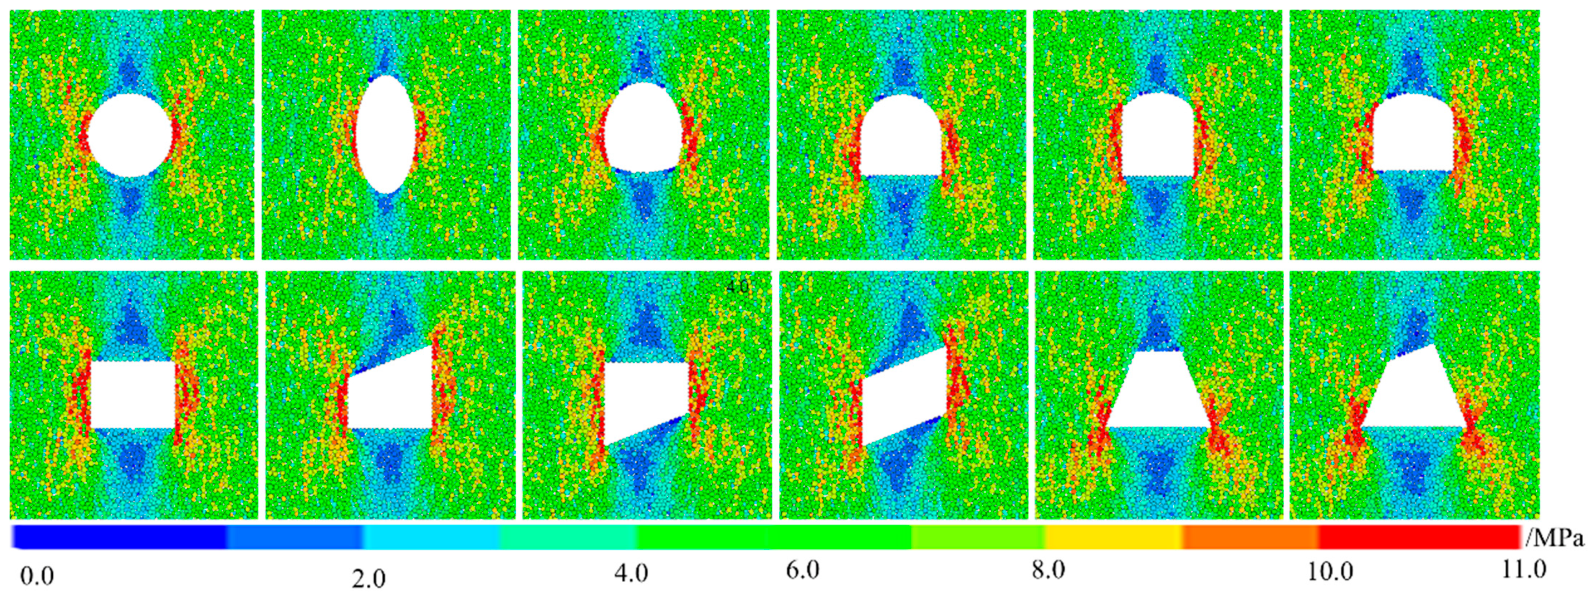
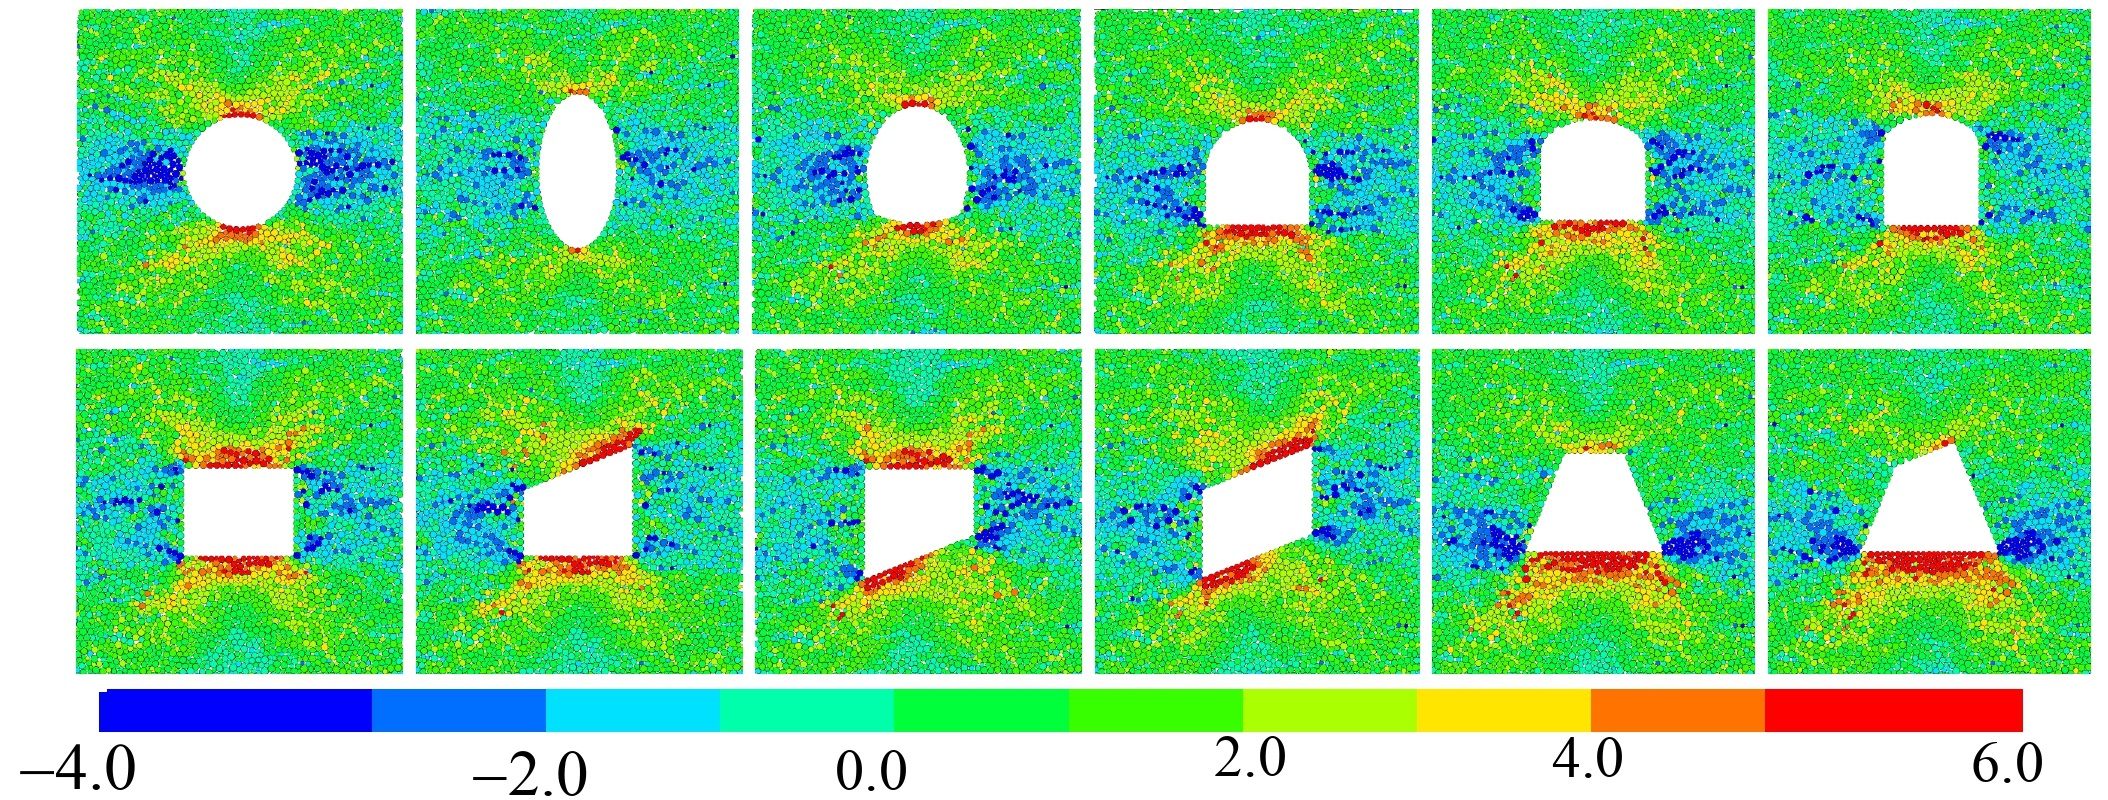
Figure 9 illustrates the maximum principal stress contours for various cavity geometries at an axial strain of 1 × 10⁻³. Herein, positive σ1 (σ1 > 0) indicates a tensile stress state, and negative σ1 (σ1 < 0) indicates a compressive stress state of the material. As observed, all specimens exhibit typical tensile–compressive zoning characteristics. Under axial compressive loading, obvious red high-stress zones corresponding to tensile stress concentration appear at the upper and lower cavity ends parallel to the loading direction. Meanwhile, remarkable blue low-stress zones associated with compressive stress concentration or stress release develop on the bilateral cavity sides perpendicular to the loading direction. This distribution conforms to the classical theory of hole effect in elasticity mechanics: the existence of a cavity disrupts the continuity of in situ stress and leads to stress redistribution around the cavity. In addition, maximum principal stress contours verify that angular cavity geometries are the primary reason for the degradation of local stress environments within the rock mass. Circular and arched cavities facilitate efficient stress dispersion and sustain a comparatively stable stress field. However, rectangular and trapezoidal geometries produce severe tensile stress concentration at cross-sectional corners and trigger widespread compressive stress regions on both flanks. The complex stress state characterized by coexisting high compressive stress and high tensile stress greatly increases the probability of mixed-mode failure (shear plus tension) in rock mass, thereby inducing obvious degradation of macroscopic mechanical properties (elastic modulus and compressive strength). This is consistent with the previous conclusions regarding the degradation of elastic modulus and uniaxial compressive strength (Figure 3 and Figure 4).
Figure 10 illustrates the maximum shear stress contours corresponding to different cavity geometries when the axial strain reaches 1 × 10⁻³. When the axial strain reaches 1 × 10⁻³, the maximum shear stress contours of specimens containing different cavity geometries all display incipient X-shaped conjugate shear bands surrounding the cavity. Zones of high shear stress (red and orange areas) predominantly extend toward corners along orientations inclined at roughly 45° to the loading axis. This conforms to the maximum shear stress plane theory in rock mechanics and predicts prospective propagation routes of macroscopic shear cracks, as shown in Figure 8. The distribution features reveal that the dominant shear failure mechanism inside the rock mass stays consistent despite variations in cavity geometries; shear slip planes preferentially evolve along the orientations of maximum shear stress. More significantly, cavity geometry exerts a remarkable influence on the symmetry and local concentration level of X-shaped shear bands. Circular and elliptical cavities possess relatively uniform and symmetric shear stress distributions. With the emergence of straight edges and sharp corners in cavities (such as rectangular and trapezoidal geometries), high shear stress regions evidently accumulate at geometric discontinuities including corners and vertices, generating asymmetric stress hotspots. Such intense local shear stress concentration not only accelerates the nucleation of microcracks at sharp corners but also defines the initiation locations and propagation orientations of subsequent primary shear bands. Accordingly, it controls the evolution path of the global failure mode.

5. Conclusions

In this study, twelve cavities with different roadway geometries were constructed based on four typical roadway cross sections widely adopted in underground coal mines, namely circular, arched, rectangular and trapezoidal geometries. The 2D DEM was employed to systematically investigate the effects of cavity geometry on the mechanical properties and failure characteristics of rock masses under uniaxial compression. Notably, the DEM parameters were calibrated solely from intact rock; so, the results provide only qualitative-trend insight without guaranteed quantitative accuracy for pore-adjacent stress-concentration and crack-initiation zones, requiring further validation against porous-rock experiments. Furthermore, since real underground roadways are 3D, and 2D models fail to reproduce out-of-plane stress and lateral constraints, the obtained results cannot be directly applied to quantitative assessment of in situ roadway stability. The main conclusions are summarized as follows.
With the shift in cavity geometries from smooth circular arcs to arched, rectangular, and trapezoidal forms, uniaxial compressive strength and elastic modulus decrease progressively. This degradation mainly stems from the stress concentration at geometric discontinuities. For complex geometries such as trapezoids, mechanical deterioration results from combined sharp-corner and geometric-asymmetry effects. While circular–elliptical comparisons isolate curvature influences, asymmetry effects in angular models couple with corner effects in this work. The cavity geometry exerts a limited influence on Poisson’s ratio, which rises slightly with more corner sharpness and structural asymmetry. Under continuous axial loading, the surrounding rock radial deformation develops steadily for all cavity types; cavities with prominent angular features and asymmetric outlines produce larger radial displacement. A clear intrinsic correlation is revealed: larger circumferential radial deformation around the cavity corresponds to the weaker bearing capacity and lower elastic stiffness of rock specimens.
The cavity geometry controls the local stress concentration and microcrack initiation locations. Sharp corners and high geometric asymmetry accelerate microcrack nucleation and extension to exacerbate local rock damage, while macroscopic stress fields determine the formation of penetrating shear fracture bands. Angular cavities expand shear failure regions and significantly weaken the rock bearing capacity. Consistent with the classical opening-effect stress redistribution, tensile stress concentrates at the top and bottom of cavities and compressive stress accumulates on both sides, generating incipient X-type conjugate shear bands in the maximum shear stress field. Sharp geometric corners intensify coupled tensile–compressive–shear stress concentration, induce mixed tension–shear failure, and dominate microcrack distribution and shear band evolution.

Author Contributions

Conceptualization, C.F. and H.W.; methodology, C.F.; software, H.W.; validation, H.W., G.W. and S.L.; formal analysis, H.W.; investigation, H.W.; resources, C.F.; data curation, H.W.; writing—original draft preparation, H.W.; writing—review and editing, C.F., G.W., S.L. and Z.Z.; visualization, H.W.; supervision, C.F.; project administration, C.F.; funding acquisition, C.F. All authors have read and agreed to the published version of the manuscript.

Funding

This research was funded by the National Natural Science Foundation of China (Grant No. 52508377) and the Scientific Research Fund of the Hunan Provincial Education Department (Nos. 24B0441 and 25B0449).

Data Availability Statement

The original contributions presented in this study are included in the article. The data that support the findings of this study are available from the corresponding author upon reasonable request.

Conflicts of Interest

The authors declare no conflicts of interest.

References

  1. Jiang, N.; Lv, K.; Gao, Z.; Jia, C.; Ye, L.; Meng, S.; Su, Q. Experimental study on mechanical properties of single fracture-hole red sandstone. Front. Earth Sci. 2023, 10, 1083689. [Google Scholar] [CrossRef] [Scilit]
  2. Zhang, C.; Hu, Y.; Ma, B.; Zhu, D.; Zhou, H.; Cao, W. Improved damage constitutive modeling of post-peak random failure behavior in quasi-brittle rocks. Eng. Fract. Mech. 2026, 332, 111750. [Google Scholar] [CrossRef] [Scilit]
  3. Zeng, W.; Yang, S.; Tian, W.-L. Experimental and numerical investigation of brittle sandstone specimens containing different shapes of holes under uniaxial compression. Eng. Fract. Mech. 2018, 200, 430–450. [Google Scholar] [CrossRef] [Scilit]
  4. Huang, Y.; Yang, S.; Tian, W.-L.; Wu, S.-Y. Experimental and DEM study on failure behavior and stress distribution of flawed sandstone specimens under uniaxial compression. Theor. Appl. Fract. Mech. 2022, 118, 103266. [Google Scholar] [CrossRef] [Scilit]
  5. Liu, J.-P.; Li, Y.-H.; Xu, S.-D.; Xu, S.; Jin, C.-Y.; Liu, Z.-S. Moment tensor analysis of acoustic emission for cracking mechanisms in rock with a pre-cut circular hole under uniaxial compression. Eng. Fract. Mech. 2015, 135, 206–218. [Google Scholar] [CrossRef] [Scilit]
  6. He, Z.; Gong, F.; Wu, W.; Wang, W. Experimental investigation of the mechanical behaviors and energy evolution characteristics of red sandstone specimens with holes under uniaxial compression. B. Eng. Geol. Environ. 2021, 80, 5845–5865. [Google Scholar] [CrossRef] [Scilit]
  7. Song, G.; Zhang, D.; Chen, L.; Liu, C.; Xiong, D. Study on the macro-micro mechanical behavior of freeze-thaw fissured sandstone under uniaxial compression. Theor. Appl. Fract. Mech. 2026, 141, 105252. [Google Scholar] [CrossRef] [Scilit]
  8. Tian, X.-Y.; Zhao, F.-J.; Wang, W.-J.; Chen, B.; Ma, Y.-J.; Fan, B.-J. Study on energy evolution and fractal characteristics of sandstone with different fracture dip angles under uniaxial compression. Sci. Rep. 2024, 14, 10464. [Google Scholar] [CrossRef] [Scilit] [PubMed]
  9. Cao, P.; Liu, T.; Pu, C.; Lin, H. Crack propagation and coalescence of brittle rock-like specimens with pre-existing cracks in compression. Eng. Geol. 2015, 187, 113–121. [Google Scholar] [CrossRef] [Scilit]
  10. Haeri, H.; Shahriar, K.; Marji, M.; Moarefvand, P. Experimental and numerical study of crack propagation and coalescence in pre-cracked rock-like disks. Int. J. Rock Mech. Min. 2014, 67, 20–28. [Google Scholar] [CrossRef] [Scilit]
  11. Yang, M.; Guo, M.; Mu, L.; Zhang, N. Mechanical properties and energy dissipation mechanism of sandstone with cross-cutting joints under uniaxial loading. Sci. Rep. 2025, 16, 2354. [Google Scholar] [CrossRef] [Scilit] [PubMed]
  12. Han, G.; Jing, H.; Jiang, Y.; Liu, R.; Su, H.; Wu, J. The Effect of Joint Dip Angle on the Mechanical Behavior of Infilled Jointed Rock Masses under Uniaxial and Biaxial Compressions. Processes 2018, 6, 49. [Google Scholar] [CrossRef] [Scilit]
  13. Liu, Y.; Dai, F.; Fan, P.; Xu, N.; Dong, L. Experimental Investigation of the Influence of Joint Geometric Configurations on the Mechanical Properties of Intermittent Jointed Rock Models Under Cyclic Uniaxial Compression. Rock Mech. Rock Eng. 2017, 50, 1453–1471. [Google Scholar] [CrossRef] [Scilit]
  14. Vaziri, M.R.; Tavakoli, H.; Bahaaddini, M. Statistical analysis on the mechanical behaviour of non-persistent jointed rock masses using combined DEM and DFN. B. Eng. Geol. Environ. 2022, 81, 177. [Google Scholar] [CrossRef] [Scilit]
  15. Wang, L.; Zhou, S.; Huang, J.; Lei, M.; Han, Y.; Zhang, J.; Jia, C. A DFN–DEM approach to determine equivalent mechanical parameters of rock mass with different joint densities. B. Eng. Geol. Environ. 2025, 85, 56. [Google Scholar] [CrossRef] [Scilit]
  16. Mayer, J.M.; Stead, D. Exploration into the causes of uncertainty in UDEC Grain Boundary Models. Comput. Geotech. 2017, 82, 110–123. [Google Scholar] [CrossRef] [Scilit]
  17. Zhao, X.-D.; Zhang, H.-X.; Zhu, W.-C. Fracture evolution around pre-existing cylindrical cavities in brittle rocks under uniaxial compression. Trans. Nonferrous Met. Soc. 2014, 24, 806–815. [Google Scholar] [CrossRef] [Scilit]
  18. Fang, C.; Mei, G.; Yu, W.; Wang, W.; Hu, W.; Wu, G. DEM for investigating the mechanical properties of porous rock-like materials under uniaxial compression. Comput. Geotech. 2024, 170, 106307. [Google Scholar] [CrossRef] [Scilit]
  19. Lin, P.; Wong, R.; Tang, C. Experimental study of coalescence mechanisms and failure under uniaxial compression of granite containing multiple holes. Int. J. Rock Mech. Min. 2015, 77, 313–327. [Google Scholar] [CrossRef] [Scilit]
  20. Fang, C.; Zhao, T.; Yu, W.; Wang, P.; Zhang, Z.; An, B.; Wu, G.; Liu, S. Effect of pore shape on uniaxial compressive behaviour of porous rock-like materials: DEM simulation. Case Stud. Constr. Mater. 2025, 23, e04938. [Google Scholar] [CrossRef] [Scilit]
  21. Wong, R.; Lin, P.; Tang, C. Experimental and numerical study on splitting failure of brittle solids containing single pore under uniaxial compression. Mech. Mater. 2006, 38, 142–159. [Google Scholar] [CrossRef] [Scilit]
  22. Fang, C.; Mei, G.; Yu, W.; Ma, B.; Hu, W.; Zhang, Z.; Liu, S. The effect of roundness on single particle crushing under multi-contact loading via the DEM. Comput. Geotech. 2026, 195, 108118. [Google Scholar] [CrossRef] [Scilit]
  23. Hofmann, H.; Babadagli, T.; Yoon, J.; Zang, A.; Zimmermann, G. A grain based modeling study of mineralogical factors affecting strength, elastic behavior and micro fracture development during compression tests in granites. Eng. Fract. Mech. 2015, 147, 261–275. [Google Scholar] [CrossRef] [Scilit]
  24. Nie, Z.; Huang, C.; Zhao, P.; Fang, C. Influence of the interparticle friction coefficient on the mechanical behaviour of breakable granular materials with realistic shape. Adv. Powder Technol. 2023, 34, 104223. [Google Scholar] [CrossRef] [Scilit]
  25. Lisjak, A.; Grasselli, G. A review of discrete modeling techniques for fracturing processes in discontinuous rock masses. J. Rock Mech. Geotech. 2014, 6, 301–314. [Google Scholar] [CrossRef] [Scilit]
  26. Gao, F.; Stead, D. The application of a modified Voronoi logic to brittle fracture modelling at the laboratory and field scale. Int. J. Rock Mech. Min. 2014, 68, 1–14. [Google Scholar] [CrossRef] [Scilit]
  27. Liu, Z.; Ngai, L.; Wong, Y. On the GPGPU-accelerated thermomechanical coupling finite-difference method/hybrid finite-discrete element method (FDM/FDEM) model for geomaterials. Eng. Geol. 2025, 358, 108383. [Google Scholar] [CrossRef] [Scilit]
  28. Fang, C.; Gong, J.; Jia, M.; Nie, Z.; Hu, W.; Li, B. Effect of the intermediate principal stress on the mechanical behaviour of breakable granular materials using realistic particle models. Acta Geotech. 2022, 17, 4887–4904. [Google Scholar] [CrossRef] [Scilit]
  29. Guo, Y.; Zhao, C.; Markine, V.; Jing, G.; Zhai, W. Calibration for discrete element modelling of railway ballast: A review. Transp. Geotech. 2020, 23, 100341. [Google Scholar] [CrossRef] [Scilit]
  30. Cai, X.; Yuan, J.; Zhou, Z.; Pi, Z.; Tan, L.; Wang, P.; Wang, S.; Wang, S. Effects of hole shape on mechanical behavior and fracturing mechanism of rock: Implications for instability of underground openings. Tunn. Undergr. Space Technol. 2023, 141, 105361. [Google Scholar] [CrossRef] [Scilit]
  31. Zhou, J.; Zhang, L.; Peng, X.; Liu, H.; Jiang, R.; Zhang, L.; Wang, S. Numerical study of voids geometry effects on sandstone’s mesoscopic fracture Mechanism: Insights from acoustic emission and moment tensor inversion. Theor. Appl. Fract. Mech. 2024, 133, 104588. [Google Scholar] [CrossRef] [Scilit]
  32. Lin, Q.; Zhang, S.; Deng, H.; Shao, Z.; Liu, H.; Lan, M. Experimental and numerical studies of rock-like specimens with different hole shapes under compressive-shear loading. Comput. Part. Mech. 2025, 12, 889–905. [Google Scholar] [CrossRef] [Scilit]
  33. Xia, Z.; Jiang, N.; Yang, H.; Han, L.; Pan, H.; Zhao, Z.; Feng, Q.; Zhu, C. Effect of Multiple Hole Distribution and Shape Based on Particle Flow on Rocklike Failure Characteristics and Mechanical Behavior. Adv. Civ. Eng. 2020, 2020, 8822225. [Google Scholar] [CrossRef] [Scilit]
  34. Wu, H.; Fan, A.; Ma, D.; Spearing, A.; Zheng, Z. Fracturing process and initiation mechanism of hard rock tunnels with different shapes: Particle flow modeling and analytical study. Comput. Part. Mech. 2023, 10, 1859–1875. [Google Scholar] [CrossRef] [Scilit]
  35. Zhu, Q.; Li, D. Experimental Investigation on Crack Behavior and Stress Thresholds of Sandstone Containing a Square Inclusion under Uniaxial Compression. Appl. Sci. 2020, 10, 7621. [Google Scholar] [CrossRef] [Scilit]
Figure 1. Cavities with different geometries.
Processes 14 02927 g001
Figure 2. Model establishment and parameter calibration. (a) Procedure for establishing numerical models with cavities, (b) Micro-parameter calibration.
Processes 14 02927 g002
Figure 3. Relationship between uniaxial compressive strength and cavity geometry.
Processes 14 02927 g003
Figure 4. The evolution of elastic modulus for sandstone specimens embedded with cavities of various geometries.
Processes 14 02927 g004
Figure 5. Relationship between cavity geometry and Poisson’s ratio.
Processes 14 02927 g005
Figure 6. The evolution of cavity displacement with axial strain under various cavity geometries.
Processes 14 02927 g006
Figure 7. Early-stage microcrack distribution under different cavity geometries at axial strain ε1 = 2 × 10⁻³. Red represents shear cracks, and purple denotes tensile cracks.
Processes 14 02927 g007
Figure 8. The overall microcrack distribution patterns of sandstone specimens after complete failure.
Processes 14 02927 g008
Figure 9. The maximum principal stress contours for various cavity geometries at an axial strain of 1 × 10⁻³.
Processes 14 02927 g009
Figure 10. The maximum shear stress contours corresponding to different cavity geometries when the axial strain reaches 1 × 10⁻³.
Processes 14 02927 g010
Table 1. Microscale parameters used in the DEM simulation.
Microscale ParametersValue
Particle density (kg/m3)2700
Local damp factor0.7
Effective modulus (Pa)5.0 × 10⁹
Normal-to-shear stiffness ratio2.0
Parallel friction angle48.2°
Tensile strength (Pa)12 × 106
Cohesive strength (Pa)10 × 106
Table 2. Macro-mechanical properties of rock specimens with different cavity geometries.
Cavity IDCavity TypeUniaxial Compressive Strength
(MPa)
Elastic Modulus, E
(GPa)
Poisson’s Ratio
ν
1-1#Circular49.5919.500.4381
1-2#Elliptical55.4019.800.4188
1-3#Horseshoe51.9019.620.4214
2-1#Semi-circular arch48.6619.470.4319
2-2#Three-centered arch51.7619.610.4180
2-3#Circular-arc arch49.5819.440.4316
3-1#Rectangular48.2319.340.4242
3-2#Inclined-roof rectangle44.5219.270.4231
3-3#Inclined-floor rectangle46.9219.290.4279
3-4#Inclined-roof-and-floor rectangle44.7019.280.4350
4-1#Trapezoidal46.7819.250.4341
4-2#Inclined-roof trapezoid40.4519.220.4445
Disclaimer/Publisher’s Note: The statements, opinions and data contained in all publications are solely those of the individual author(s) and contributor(s) and not of MDPI and/or the editor(s). MDPI and/or the editor(s) disclaim responsibility for any injury to people or property resulting from any ideas, methods, instructions or products referred to in the content.