Article

Enzymatic Bioconversion for Ginsenoside Rd Enrichment in Red Ginseng Extract: Process Optimization and Biological Evaluation

1
Department of Engineering Chemistry, Chungbuk National University, 1 Chungdae-ro, Seowon-gu, Cheongju 28644, Chungbuk, Republic of Korea
2
ECOS Bio Lab Co., 1 Chungdae-ro, Seowon-gu, Cheongju 28644, Chungbuk, Republic of Korea
*
Author to whom correspondence should be addressed.
Processes 2026, 14(18), 2928; https://doi.org/10.3390/pr14182928
Submission received: 22 August 2026 / Revised: 11 September 2026 / Accepted: 12 September 2026 / Published: 15 September 2026

Abstract

Ginsenoside Rd is a protopanaxadiol-type ginsenoside with potential as a value-added ginseng-derived compound. This study developed an enzymatic process for selective enrichment of Rd from major precursor ginsenosides in red ginseng extract (RGE). Five commercial enzyme preparations were screened, and Frontia® Fiber Wash was selected based on its ability to promote Rd formation while limiting further deglycosylation. Transformation of Rb1, Rb2, and Rc toward Rd was confirmed using individual substrates. Six reaction variables were screened using a factorial design, identifying reaction temperature, RGE concentration, and reaction time as the major factors. These variables were optimized using a Box–Behnken design and response surface methodology. Numerical optimization predicted optimum conditions of 0.882% (w/v) RGE, 52.4 °C, and 14.3 h, with a relative Rd content of 95.77%; experimental validation yielded 95.54%. The optimized bioconverted RGE increased collagen synthesis in human dermal fibroblasts to 121.59% of the untreated control and inhibited LPS-induced nitric oxide production in RAW264.7 macrophages by 81.23% at 100 μg/mL. These findings demonstrate that commercial enzyme screening combined with statistical process optimization enables selective Rd enrichment from a complex red ginseng matrix and suggest that enzymatic bioconversion may also modulate the biological properties of RGE.

1. Introduction

Ginseng (Panax ginseng C.A. Meyer) has long been used as a traditional medicinal plant and functional food owing to its diverse bioactive constituents. Ginsenosides, which represent major characteristic components of ginseng, are dammarane-type triterpenoid saponins that are structurally differentiated according to their aglycone moieties and the number and position of attached sugar residues. Among them, protopanaxadiol (PPD)-type ginsenosides, including Rb1, Rb2, Rc, and Rd, constitute an important group of ginsenosides present in ginseng and red ginseng [1,2]. Ginsenoside Rd is a PPD-type ginsenoside that has attracted increasing attention as a value-added ginseng constituent. However, its abundance in natural red ginseng is generally lower than that of the major PPD-type ginsenosides Rb1, Rb2, and Rc, making its direct recovery from natural materials relatively inefficient [2,3]. Structurally, Rb1, Rb2, and Rc share the same PPD backbone with Rd but differ in their terminal sugar moieties. Selective hydrolysis of these terminal glycosidic residues can therefore provide enzymatic routes for the formation of Rd [4,5,6]. In addition to its value as a bioconversion product, Rd has received considerable attention because of its diverse biological activities. Recent studies have described anti-inflammatory, antioxidant, neuroprotective, cardioprotective, and immunomodulatory properties of Rd and have highlighted multiple molecular pathways potentially involved in these effects [2,3]. Of particular relevance, Rd has been reported to suppress nitric oxide (NO) production in lipopolysaccharide (LPS)-stimulated RAW264.7 macrophages, accompanied by reduced inducible nitric oxide synthase (iNOS) expression and NF-κB activation [7]. These observations suggest that enrichment of Rd and the accompanying alteration of the ginsenoside profile may influence the biological properties of red ginseng-derived materials.
Various physicochemical and biological approaches have been investigated for structural transformation of ginsenosides. Chemical or thermal treatments can promote rapid conversion but may cause nonselective hydrolysis and formation of multiple products. In contrast, enzymatic bioconversion enables selective cleavage of specific glycosidic linkages under relatively mild conditions and has therefore been widely investigated for production of minor or value-added ginsenosides [8,9]. Enzymatic bioconversion is particularly attractive for Rd production because several major PPD-type ginsenosides can serve as naturally occurring precursors, whereas further deglycosylation of the generated Rd may lead to downstream products such as F2 and compound K [2,3]. Recent studies have further highlighted the potential of enzymatic and microbial biotransformation for the selective production of rare ginsenosides and their application to value-added ginseng products [10,11,12].
Previous studies have largely focused on purified enzymes, recombinant glycosidases, microbial transformation systems, or individual purified ginsenosides. Although these approaches are useful for elucidating substrate specificity and bioconversion pathways, their direct industrial application may be limited by enzyme production, purification, and the use of purified precursor substrates. In contrast, commercial enzyme preparations can be directly applied to complex natural materials and may contain multiple complementary carbohydrate-hydrolyzing activities. Commercial enzyme treatments have previously been shown to substantially alter ginsenoside profiles in ginseng extracts [13,14].
From a process perspective, simultaneous utilization of several major precursor ginsenosides naturally present in red ginseng extract (RGE) could provide a practical strategy for selective enrichment of Rd without prior isolation of individual ginsenosides. In particular, a commercial enzyme preparation capable of acting on Rb1, Rb2, and Rc would enable multiple PPD-type precursor ginsenosides to converge toward Rd within a single reaction system.
The efficiency of enzymatic ginsenoside transformation is affected by multiple processing variables, including substrate concentration, enzyme concentration, temperature, pH, reaction time, and agitation. Conventional one-factor-at-a-time approaches do not adequately describe the combined and nonlinear effects of these variables. Response surface methodology (RSM), following preliminary variable screening, provides a useful statistical strategy for identifying influential process factors and predicting optimal reaction conditions [15,16].
Therefore, the objectives of the present study were to screen commercial enzyme preparations for their ability to enrich ginsenoside Rd from RGE, characterize the time-dependent transformation of the major precursor ginsenosides Rb1, Rb2, and Rc, identify influential processing variables using factorial screening, and optimize the selected variables using a Box–Behnken design (BBD) and RSM. Relative ginsenoside Rd content, defined as the proportion of the HPLC peak area of Rd relative to the combined peak areas of Rb1, Rb2, Rc, and Rd, was used as the principal response variable. In addition, the biological properties of the optimized bioconverted RGE were evaluated by examining collagen synthesis in human dermal fibroblasts and NO production in LPS-stimulated RAW264.7 macrophages, in comparison with untreated RGE and authentic ginsenoside Rd.

2. Materials and Methods

2.1. Materials

Six-year-old dried red ginseng (Panax ginseng C.A. Meyer) was purchased from KT&G (Daejeon, Republic of Korea). Authentic standards of ginsenosides Rb1, Rb2, Rc, Rd, Rg3, and F2 were purchased from Sigma-Aldrich (St. Louis, MO, USA). Other chemicals and reagents used in this study were obtained from Sigma-Aldrich, unless otherwise specified. Five commercial enzyme preparations (E1–E5), all obtained from Novonesis (Hoersholm, Denmark), were screened for their ability to convert major ginsenosides in RGE. The commercial enzyme preparations and their labeled major enzyme activities are summarized in Table 1. Frontia® Fiber Wash (E1) is a commercial enzyme preparation containing xylanase and arabinofuranosidase activities and was used as supplied without further purification. Detailed information on specific enzyme activity (U/g or U/mL), protein content, and the intrinsic optimum pH and temperature was not available from the manufacturer and was not independently determined in the present study.

2.2. Preparation of RGE

Dried red ginseng was coarsely ground to a particle size of 40–80 mesh immediately before extraction. The ground material was extracted with 10 volumes (w/v) of 70% (v/v) ethanol using an extraction apparatus equipped with a reflux condenser at 80–85 °C for 12 h. The extraction procedure was repeated three times. The resulting extracts were combined and filtered under reduced pressure using Whatman No. 2 filter paper. The filtrate was concentrated under reduced pressure at 50–60 °C using a rotary vacuum evaporator until the soluble solid content reached 60–65 °Brix. The concentrated extract was pre-frozen at −80 °C for 24 h and subsequently freeze-dried below −50 °C under a vacuum of less than 10 mTorr for 72 h. The freeze-dried material was ground and passed through a 100-mesh sieve to obtain a homogeneous RGE powder. The powder was sealed to prevent moisture absorption and stored at −20 °C until use.

2.3. Screening Commercial Enzyme Preparations

RGE was dispersed in 50 mM sodium acetate buffer (pH 5.0) to prepare a 2% (w/v) solution. The reaction mixture consisted of 950 μL of the RGE solution and 50 μL of each commercial enzyme preparation, resulting in a total reaction volume of 1.0 mL and a final enzyme loading of 5% (v/v). Enzymatic reactions were performed at 50 °C with agitation at 300 rpm. Aliquots (100 μL) were collected at 0, 12, and 24 h, and each reaction was terminated by the addition of 400 μL of ethanol. Samples were centrifuged at 13,000 rpm for 1 min using a CF-10 centrifuge (Daihan Scientific Co., Ltd., Wonju-si, Republic of Korea), and the resulting supernatants were analyzed using thin-layer chromatography (TLC). Ginsenosides Rb1, Rb2, Rc, Rd, Rg3, and F2 were used as the reference standards. This initial enzyme screening was conducted as a preliminary qualitative assessment to identify a suitable commercial enzyme preparation for subsequent investigation. The TLC profiles were evaluated based on the disappearance of major precursor ginsenosides, accumulation of the Rd-associated band, and formation of further deglycosylated products. Based on the overall TLC conversion pattern, a candidate enzyme preparation showing Rd accumulation with comparatively limited further deglycosylation was selected for subsequent time-course analysis and quantitative process optimization.

2.4. Time-Course Bioconversion of Individual Ginsenosides

Ginsenosides Rb1, Rb2, and Rc were individually dissolved in 50 mM sodium acetate buffer (pH 5.0) to prepare a 0.5% (w/v) substrate solution. Each reaction mixture consisted of 900 μL substrate solution and 100 μL of the selected enzyme preparation. The reactions were performed at 50 °C and 300 rpm using a thermomixer. Aliquots were collected at 0, 1, 2, 3, 6, 12, and 24 h. Each aliquot (100 μL) was immediately mixed with 400 μL of ethanol to terminate the enzymatic reaction, followed by centrifugation at 13,000 rpm for 1 min. The resulting supernatants were analyzed using TLC. Ginsenosides Rb1, Rb2, Rc, and Rd were used as authentic reference standards.

2.5. Preliminary Factorial Screening of Reaction Variables

Following the selection of E1 (Frontia® Fiber Wash), the effects of six reaction variables were evaluated using a factorial screening design: RGE concentration (A), enzyme concentration (B), reaction temperature (C), pH (D), reaction time (E), and agitation speed (F). The enzyme concentration was defined as the volume percentage of the original commercial enzyme preparation in the final reaction mixture. The highest enzyme concentration was set at 2.5% (v/v), and lower enzyme concentrations were prepared by appropriate dilution with 50 mM sodium acetate buffer adjusted to the corresponding experimental pH, while maintaining the same final reaction volume. The low and high levels were 0.5 and 2.5% (w/v) for RGE concentration, 0.5 and 2.5% (v/v) for enzyme concentration, 30 and 70 °C for reaction temperature, pH 4.0 and 6.0, 4 and 12 h for reaction time, and 300 and 900 rpm for agitation speed, respectively. The center-point conditions were 1.5% RGE, 1.5% enzyme, 50 °C, pH 5.0, 8 h, and 600 rpm. The relative ginsenoside Rd content (%) determined using HPLC was used as the response variable. The main effects were evaluated using analysis of variance (ANOVA) and visualized using a Pareto chart based on the absolute t-values of the estimated effects. Based on the factorial screening results, RGE concentration, reaction temperature, and reaction time were selected for subsequent response surface optimization.

2.6. BBD and Response Surface Optimization

The RGE concentration (X1), reaction temperature (X2), and reaction time (X3) were optimized using a three-factor, three-level BBD. Although a broader RGE concentration range of 0.5–2.5% (w/v) was evaluated during factorial screening, the BBD was focused on a narrower range of 0.5–1.5% (w/v) to characterize the response surface and locate the optimum within the region selected from the preceding screening stage. The BBD was therefore designed to optimize relative Rd enrichment within this defined experimental region rather than to determine the maximum feasible RGE loading for industrial processing. The factor levels were 0.5, 1.0, and 1.5% (w/v) for RGE concentration; 30, 50, and 70 °C for reaction temperature; and 6, 12, and 18 h for reaction time. The enzyme concentration, pH, and agitation speed were fixed at 1.5% (v/v), pH 5.0, and 600 rpm, respectively. A total of 17 experimental runs, including five replicates at the center point, were performed. The experimental data were fitted to the following second-order polynomial model:
Y = β0 + β1 X1 + β2 X2 + β3 X3 + β12 X1X2 + β13 X1X3 + β23 X2X3 + β11 X12 + β22 X22 + β33 X32
where Y represents the predicted relative ginsenoside Rd content (%), and X1, X2, and X3 represent the coded values of the RGE concentration, reaction temperature, and reaction time, respectively.

2.7. TLC Analysis

TLC analysis was performed using silica gel 60 F254 plates (Merck KGaA, Darmstadt, Germany). Ginsenoside standards were dissolved in 50% ethanol, and the reaction supernatants were directly used as analytical samples. The plates were developed using chloroform–methanol–water (90:40:10, v/v/v), sprayed with a 10% sulfuric acid solution, and heated at 110 °C for 15 min for visualization.

2.8. HPLC Analysis

Ginsenosides were analyzed using a Waters 2695 Separations Module equipped with a Waters 486 Tunable Absorbance Detector (Waters Corporation, Milford, MA, USA). Separation was performed using a Mightysil RP-18GP column (5 μm, 4.6 × 250 mm; Kanto Chemical, Tokyo, Japan) maintained at 30 °C. The detection wavelength was 210 nm, the flow rate was 1.0 mL/min, and the injection volume was 10 μL. Acetonitrile (A) and deionized water (B) were used as the mobile phases. The gradient program was as follows: 0–10 min, 30% A; 10–20 min, 30–50% A; 20–30 min, 50–70% A; 30–40 min, 70–90% A; 40–45 min, 90–95% A; 45–50 min, 95–30% A; and 50–55 min, 30% A. Ginsenosides Rb1, Rb2, Rc, and Rd were identified by comparing their retention times with those of authentic standards.

2.9. Determination of Relative Ginsenoside Rd Content

Chromatographic peaks were integrated using Empower 3 software (Waters Corporation, Milford, MA, USA). Consistent integration parameters and baseline settings were applied to the authentic standards and samples. All chromatograms were visually inspected to verify appropriate peak integration and baseline assignment. Manual adjustment was performed only when automated integration resulted in inappropriate peak boundary or baseline assignment, and the same integration criteria were consistently applied across standards and samples.
The relative ginsenoside Rd content was calculated from the HPLC peak areas of the four major PPD-type ginsenosides, Rb1, Rb2, Rc, and Rd, using Equation (1):
R e l a t i v e   g i n s e n o s i d e   R d   c o n t e n t % = A R d A R b 1 + A R b 2 + A R c + A R d × 100
where ARb1, ARb2, ARc, and ARd represent the respective HPLC peak areas of ginsenosides Rb1, Rb2, Rc, and Rd. Thus, the response variable represents the proportion of the Rd peak area relative to the combined peak areas of these four major PPD-type ginsenosides and not the proportion of Rd relative to the total area of all detected saponin peaks. This peak-area-based relative Rd content was used as the response variable for the factorial screening and response surface optimization. This parameter denotes the relative proportion of Rd among the four measured ginsenosides and does not represent the absolute Rd purity, mass yield, or molar conversion. For absolute quantification, calibration curves were constructed using authentic standards of ginsenosides Rb1, Rb2, Rc, and Rd. The contents of the individual ginsenosides in untreated and optimized bioconverted RGE were calculated from the corresponding calibration curves and expressed as mg/g of RGE. This absolute quantification was limited to the four major PPD-type ginsenosides analyzed in the present study and therefore does not represent total ginsenoside content or a comprehensive mass balance of the RGE matrix.

2.10. Cell Viability and Collagen Synthesis Assay

Human dermal fibroblast Hs68 cells were obtained from the American Type Culture Collection (ATCC, Manassas, VA, USA). Cells were cultured in Dulbecco’s modified Eagle’s medium (DMEM; Gibco, Waltham, MA, USA) supplemented with 10% fetal bovine serum (FBS; Gibco, USA) and 1% antibiotic–antimycotic solution (Gibco, USA) at 37 °C in a humidified atmosphere containing 5% CO2. Human dermal fibroblasts were used to evaluate the effects of untreated RGE, optimized bioconverted RGE obtained under the numerically optimized conditions (95.54% relative ginsenoside Rd content), and authentic ginsenoside Rd on cell viability and collagen synthesis. Cells were seeded in 24-well plates at a density of 1 × 10⁵ cells/well and incubated for 24 h. The culture medium was then replaced with serum-free medium, and the cells were treated with the test samples at the indicated concentrations. Stock solutions of the samples were prepared in dimethyl sulfoxide (DMSO) and appropriately diluted with culture medium prior to treatment. After 24 h of treatment, the culture supernatants were collected, and procollagen type I production was quantitatively determined using a Procollagen Type I C-Peptide (PIP) EIA Kit (Takara Bio, Shiga, Japan) according to the manufacturer’s instructions. Procollagen type I production was expressed as a percentage relative to that of the untreated control, which was defined as 100%. Cell viability was evaluated using the MTT assay. Following collection of the culture supernatants, MTT solution (5 mg/mL) was added to the remaining cells, and the cells were incubated to allow formazan formation. The resulting formazan crystals were dissolved in DMSO, and absorbance was measured using a microplate reader. Cell viability was expressed as a percentage relative to that of the untreated control, which was defined as 100%. Each treatment was evaluated in triplicate.

2.11. Cell Culture, Cell Viability, and Nitric Oxide Production Assays

The murine macrophage RAW264.7 cell line was obtained from the Korean Cell Line Bank (KCLB 40071, Seoul, Republic of Korea). Cells were cultured in Dulbecco’s modified Eagle’s medium (DMEM; HyClone, Logan, UT, USA) supplemented with 10% fetal bovine serum (FBS; HyClone), 100 U/mL penicillin, and 100 μg/mL streptomycin in a humidified incubator containing 5% CO2. Cells were routinely subcultured when they reached approximately 80–90% confluence. Cell viability was evaluated using the MTT assay. RAW264.7 cells were seeded in 96-well plates at a density of 1 × 10⁵ cells/well and treated with untreated RGE, optimized bioconverted RGE, or authentic ginsenoside Rd at the indicated concentrations for 24 h. After treatment, the culture medium was removed, and the cells were washed and incubated with 50 μL of MTT solution for 3 h in the dark. The resulting formazan crystals were dissolved in 100 μL of DMSO, and absorbance was measured at 550 nm using a microplate reader. Cell viability was expressed as a percentage relative to that of the untreated control, which was defined as 100%.
For the determination of nitric oxide (NO) production, RAW264.7 cells were seeded in 96-well plates at a density of 1 × 10⁵ cells/well and pre-incubated before treatment. The cells were subsequently treated with lipopolysaccharide (LPS; 500 ng/mL) in the presence of untreated RGE, optimized bioconverted RGE, or authentic ginsenoside Rd at the indicated concentrations and incubated for 24 h. Following incubation, 100 μL of the culture supernatant was mixed with an equal volume of Griess reagent and incubated for 10 min. Nordihydroguaiaretic acid (NDGA) was used as a positive control. Absorbance was measured at 540 nm using a microplate reader (Bio-Rad, Hercules, CA, USA), and nitrite concentrations were quantitatively determined using a sodium nitrite standard curve. NO production was expressed relative to that of the LPS-treated control, which was defined as 100%, and NO inhibition (%) was calculated accordingly.

2.12. Statistical Analysis

The experimental design and statistical analyses were performed using Design-Expert 12 (Stat-Ease Inc., Minneapolis, MN, USA). Statistical significance was evaluated using ANOVA, with p < 0.05 considered significant. Model adequacy was assessed based on model significance and the lack of fit test. Pareto, response surface, and contour plots were generated using the corresponding statistical models. For the cell-based assays, data are presented as the mean ± standard deviation (SD). Statistical differences among multiple treatment groups were evaluated using one-way analysis of variance (ANOVA), followed by Dunnett’s multiple-comparison test.

3. Results and Discussion

3.1. Screening of Commercial Enzyme Preparations for Ginsenoside Rd Production

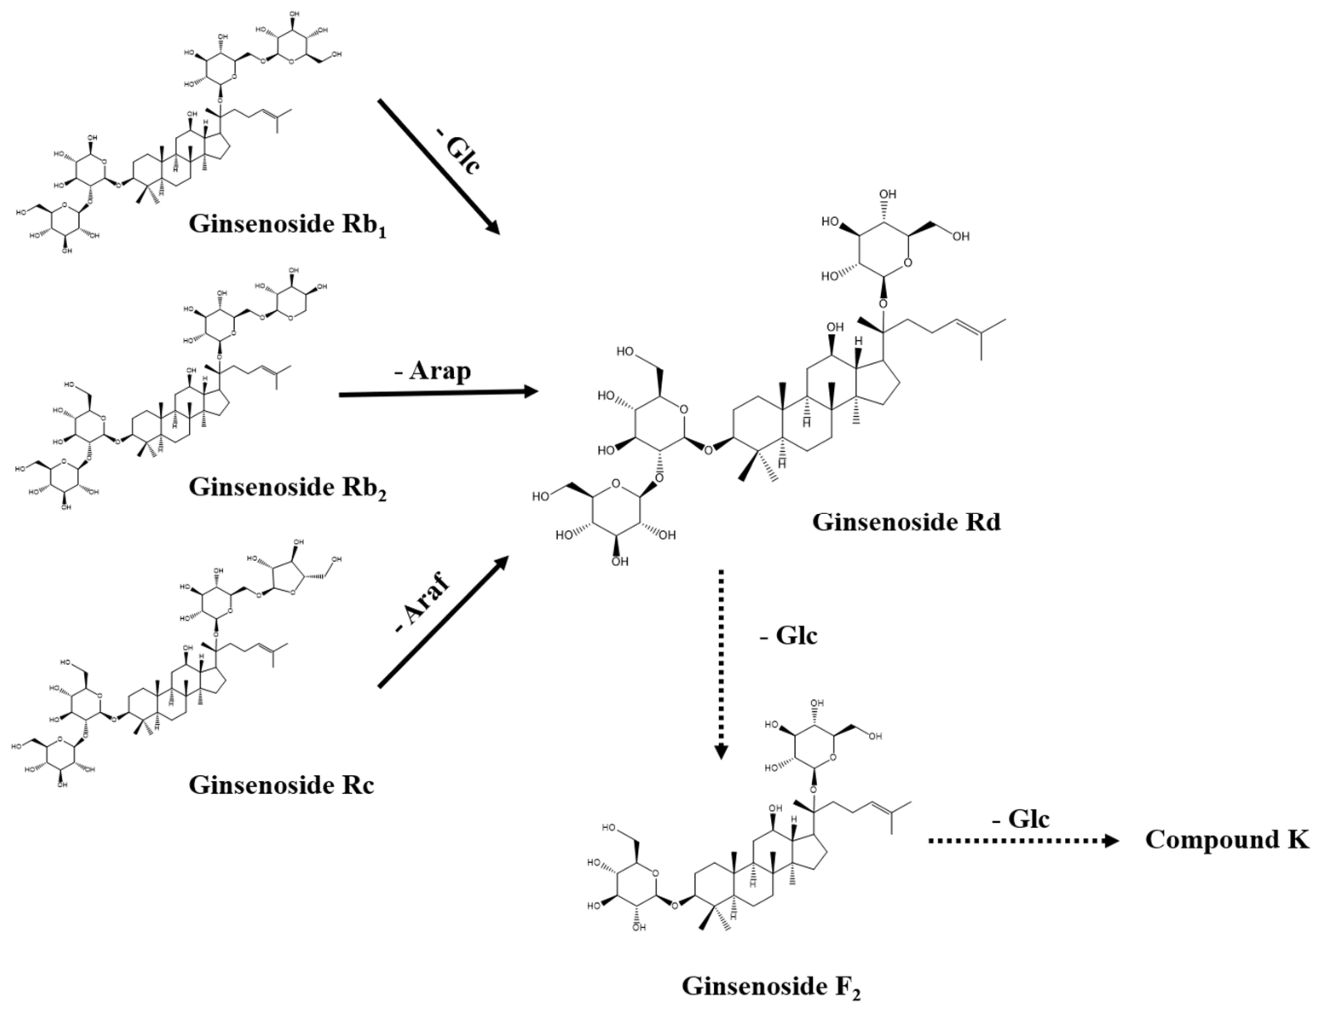
The major PPD-type ginsenosides in red ginseng, including Rb1, Rb2, and Rc, possess closely related dammarane structures but differ in the terminal sugar residues attached to their glycosidic moieties. As illustrated in Figure 1, these major ginsenosides can serve as precursors of ginsenoside Rd through the selective hydrolysis of the corresponding terminal sugar residues. Therefore, enzyme preparations capable of hydrolyzing these glycosidic linkages may enable the conversion of multiple major ginsenosides present in RGE to Rd. Efficient enrichment of Rd requires the conversion of precursor ginsenosides to Rd and suppression of further deglycosylation of Rd to downstream products, such as F2. Thus, enzyme selectivity, rather than overall glycoside-hydrolyzing activity, is critical for achieving Rd accumulation.
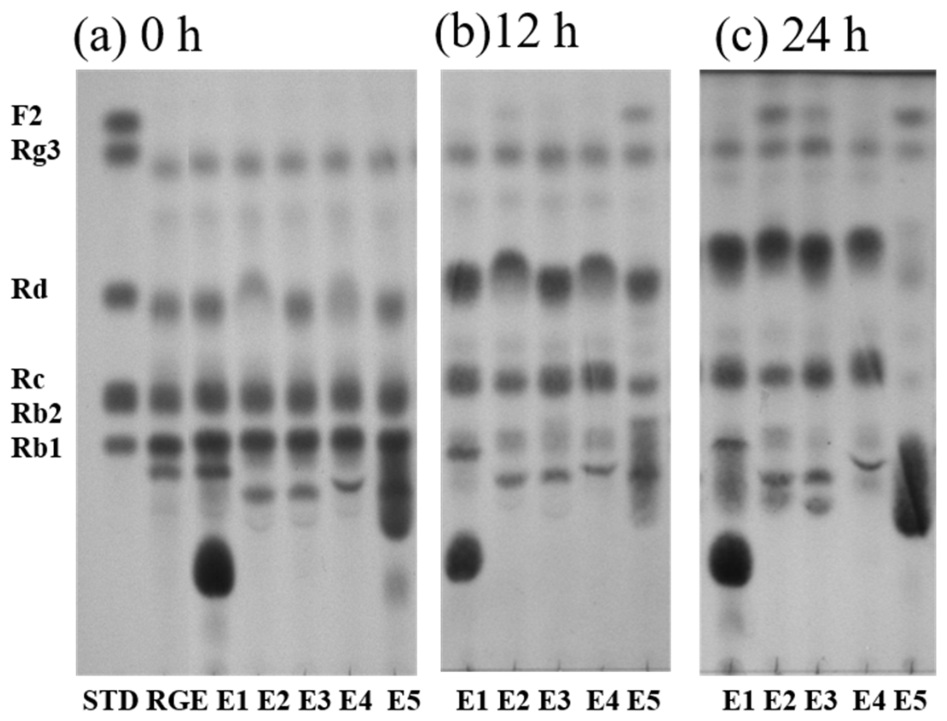
Five commercial enzyme preparations with different glycosidase-related activities were screened using RGE (Table 1). As commercial preparations contain complex combinations of carbohydrate-hydrolyzing activities, their actual ginsenoside conversion characteristics were evaluated experimentally rather than inferred solely from their reported activities. The initial TLC screening was used as a preliminary qualitative assessment of the ginsenoside conversion patterns rather than as a quantitative comparison of enzyme performance. TLC profiles showed differences in the conversion patterns among the preparations (Figure 2). E1 showed a decrease in bands corresponding to the major precursor ginsenosides together with accumulation of the Rd-associated band. In contrast, E2 and E5 showed additional bands with chromatographic mobility corresponding to F2, indicating further deglycosylation beyond Rd under the screening conditions. These conversions are undesirable for selective Rd enrichment because Rd formed from the precursor ginsenosides may subsequently be consumed through additional hydrolysis. Accordingly, the preliminary screening was used to identify a candidate preparation showing Rd accumulation with comparatively limited further conversion to downstream ginsenosides. Previous studies have demonstrated substantial differences in ginsenoside transformation depending on the enzyme preparation used [8,13].
Based on this preliminary qualitative screening, E1 was selected as a candidate enzyme preparation for subsequent investigation because its TLC profile showed Rd accumulation with comparatively limited formation of downstream products under the screening conditions. Although arabinofuranosidase and xylanase are reported as the major activities of E1 (Frontia® Fiber Wash), E1 is a commercial multi-enzyme preparation rather than a purified single enzyme. Rb1, Rb2, and Rc share the same protopanaxadiol aglycone but differ in their terminal sugar moieties, and their conversion to Rd therefore involves the hydrolysis of different glycosidic moieties. The observed transformation of all three precursors toward Rd suggests that E1 possesses a sufficiently broad spectrum of carbohydrate-hydrolyzing activities to act on these structurally related ginsenosides. The use of complementary glycoside-hydrolyzing enzyme activities for the biotransformation of multiple PPD-type ginsenosides in complex ginseng extracts has also been demonstrated in previous studies [17]. However, because E1 was not fractionated and its individual enzymatic activities were not characterized in the present study, the specific enzyme component(s) responsible for each conversion pathway cannot be conclusively assigned. Accordingly, the pH and temperature investigated in the present study should be interpreted as process conditions affecting Rd enrichment in the RGE matrix rather than as the intrinsic biochemical optima of the individual enzyme components in E1. Because the initial screening did not include replicate densitometric or HPLC-based quantitative comparisons among all five enzyme preparations, the screening results should not be interpreted as demonstrating the quantitative superiority of E1 over E2–E5. Rather, the suitability of E1 for subsequent process development was further evaluated through time-course conversion experiments with the individual precursor ginsenosides (Figure 3) and quantitative HPLC-based process optimization.

3.2. Bioconversion of Individual Major PPD-Type Ginsenosides

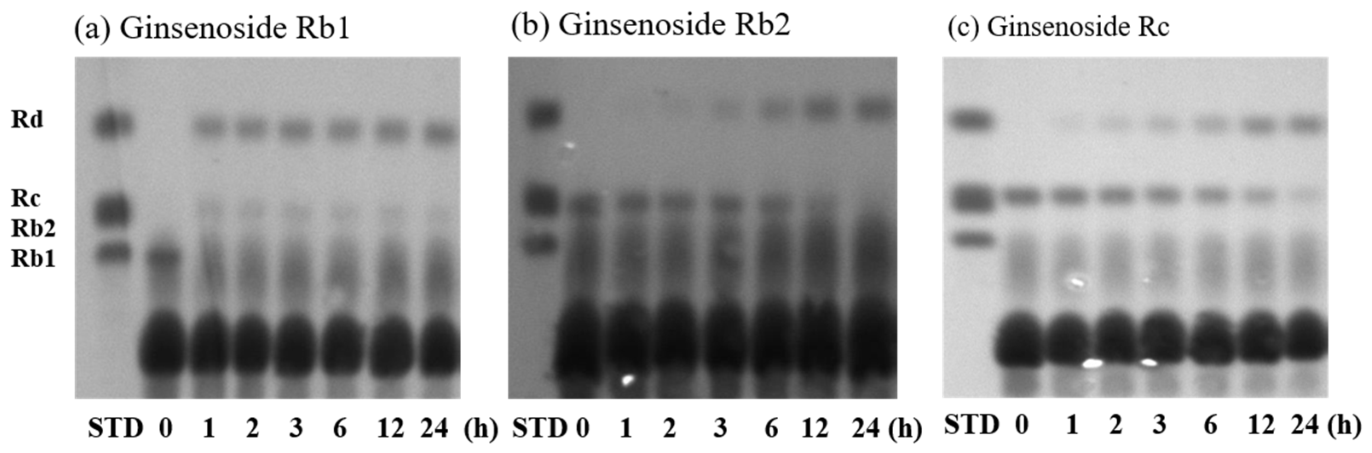
The ability of E1 to act on individual precursor ginsenosides was examined using Rb1, Rb2, and Rc (Figure 3). Each substrate underwent time-dependent changes, accompanied by the appearance of a band at the position corresponding to Rd. These results support the ability of the selected preparation to act on multiple major PPD-type ginsenosides. Enzymatic pathways leading from structurally related Rb1, Rb2, and Rc toward Rd through selective terminal sugar hydrolysis have previously been demonstrated using various glycosidases [4,5,6,18]. More recently, simultaneous biotransformation of Rb1, Rb2, and Rc toward Rd has also been demonstrated using microbial fermentation systems, further supporting the feasibility of converging multiple naturally coexisting PPD-type precursors toward Rd [12].
The ability to utilize multiple naturally coexisting precursors is advantageous for the direct treatment of RGE because prior isolation of individual ginsenoside substrates is unnecessary. TLC was used for the qualitative assessment of transformation patterns, whereas quantitative Rd enrichment was evaluated using HPLC. After establishing E1 as a preparation capable of promoting the conversion of multiple major PPD-type ginsenosides to Rd, we determined the reaction conditions for efficient and selective Rd enrichment in RGE. As enzymatic bioconversion in a complex substrate matrix can be influenced by several process parameters, the effects of substrate concentration, enzyme concentration, reaction temperature, pH, reaction time, and agitation speed were systematically evaluated to identify the key variables for subsequent process optimization.

3.3. Factorial Screening of Reaction Variables

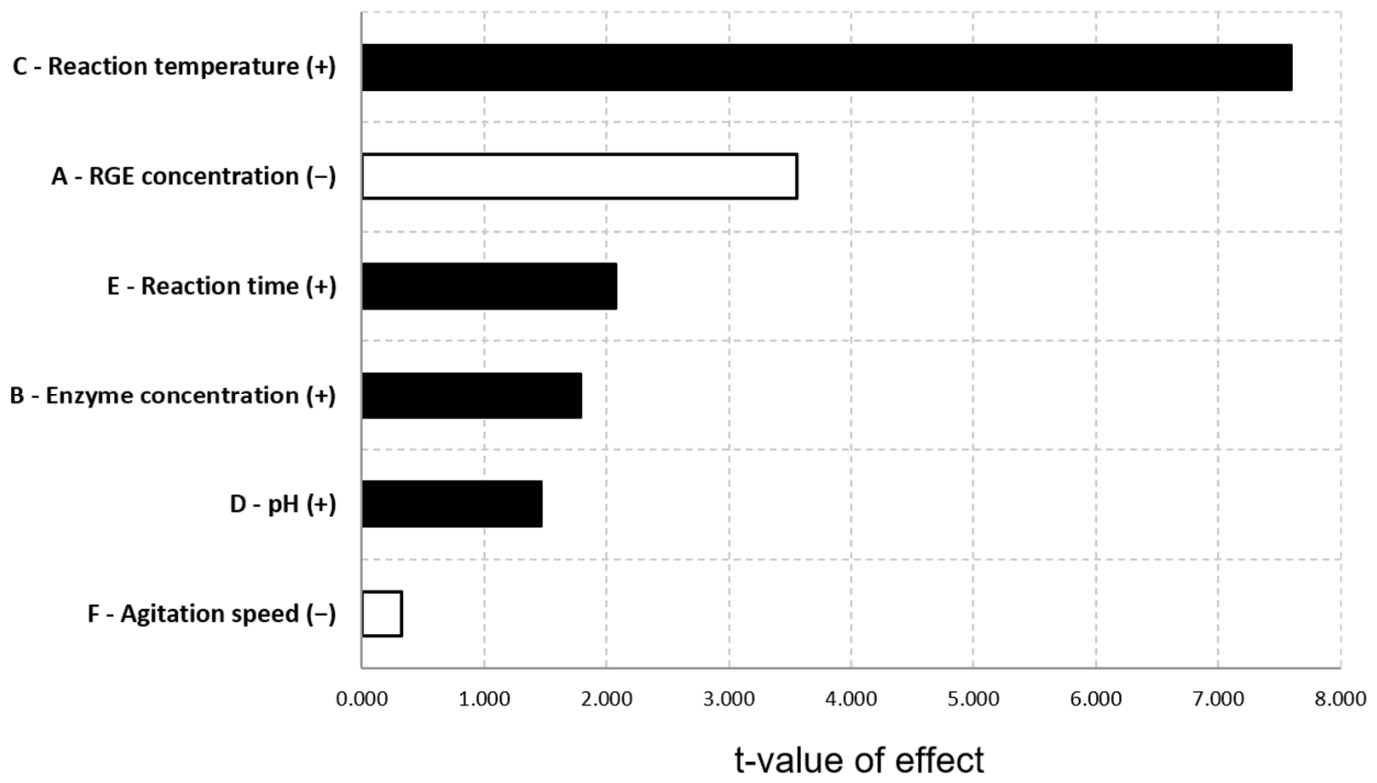
Accordingly, six reaction variables were evaluated using a factorial screening design: RGE concentration, enzyme concentration, reaction temperature, pH, reaction time, and agitation speed (Table 2). The relative ginsenoside Rd content was used as the response to assess the influence of each variable on selective Rd enrichment. The ANOVA results demonstrated that the main-effects model was significant (F = 13.34, p = 0.0002), whereas the lack of fit was not significant (p = 0.5774) (Table 3). The reaction temperature had the strongest effect (F = 57.64, p < 0.0001), followed by RGE concentration (F = 12.65, p = 0.0045). Reaction time showed a relatively large but non-significant effect (F = 4.30, p = 0.0624), whereas enzyme concentration, pH, and agitation speed showed weaker effects within the investigated ranges. The Pareto chart further demonstrates the relative importance of the six variables (Figure 4). The absolute t-values were 7.592 for reaction temperature, 3.557 for RGE concentration, 2.074 for reaction time, 1.786 for enzyme concentration, 1.463 for pH, and 0.326 for agitation speed. Therefore, the reaction temperature was the predominant process variable. Although the main effect of reaction time did not reach the conventional statistical significance threshold (p = 0.0624), its effect magnitude was the third largest among the six variables evaluated (|t| = 2.074), following reaction temperature and RGE concentration. Because reaction time is also mechanistically relevant to the progression of enzymatic hydrolysis and showed a comparatively large effect despite its marginal p value, it was retained as a process variable for subsequent response surface optimization. Its inclusion in the BBD allowed potential nonlinear effects of reaction time, which cannot be adequately assessed by the factorial main-effects model alone, to be evaluated. Based on the combined statistical effects and their relevance to the enzymatic bioconversion process, RGE concentration, reaction temperature, and reaction time were selected as the key variables for subsequent optimization. Importantly, the curvature term was highly significant (p < 0.0001; Table 3), indicating that the response exhibited significant nonlinearity within the investigated experimental region. Thus, a linear main-effects model alone was insufficient to adequately describe the relationship between the process variables and relative ginsenoside Rd content. This finding provided a statistical rationale for the subsequent application of BBD-based RSM, which enables estimation of quadratic effects and identification of an optimum within the experimental region. Although the factorial screening evaluated a broad RGE concentration range of 0.5–2.5% (w/v), the subsequent BBD was focused on 0.5–1.5% (w/v) to more precisely characterize the response surface within a defined region after RGE concentration had been identified as a significant process variable. Accordingly, the BBD was intended to optimize relative Rd enrichment within this selected experimental region rather than to determine the maximum feasible substrate loading for industrial processing.

3.4. Response Surface Optimization of Enzymatic Bioconversion

The three selected variables were investigated using BBD (Table 4). The relative ginsenoside Rd content varied from 33.96% to 94.87%, demonstrating the substantial dependence of the response on the reaction conditions. The quadratic regression model was highly significant (F = 45.18, p < 0.0001), whereas the lack of fit was not significant (F = 5.80, p = 0.0613), supporting the adequacy of the model in describing the experimental response (Table 5).
The fitted regression equation in terms of coded factors is expressed as in Equation (2):
Y = 92.04 − 5.57X1 + 7.78X2 + 10.71X3 − 2.27X1X2 − 2.43X1X3 + 3.54X2X3 − 12.91X12 − 25.83X22 − 13.49X32
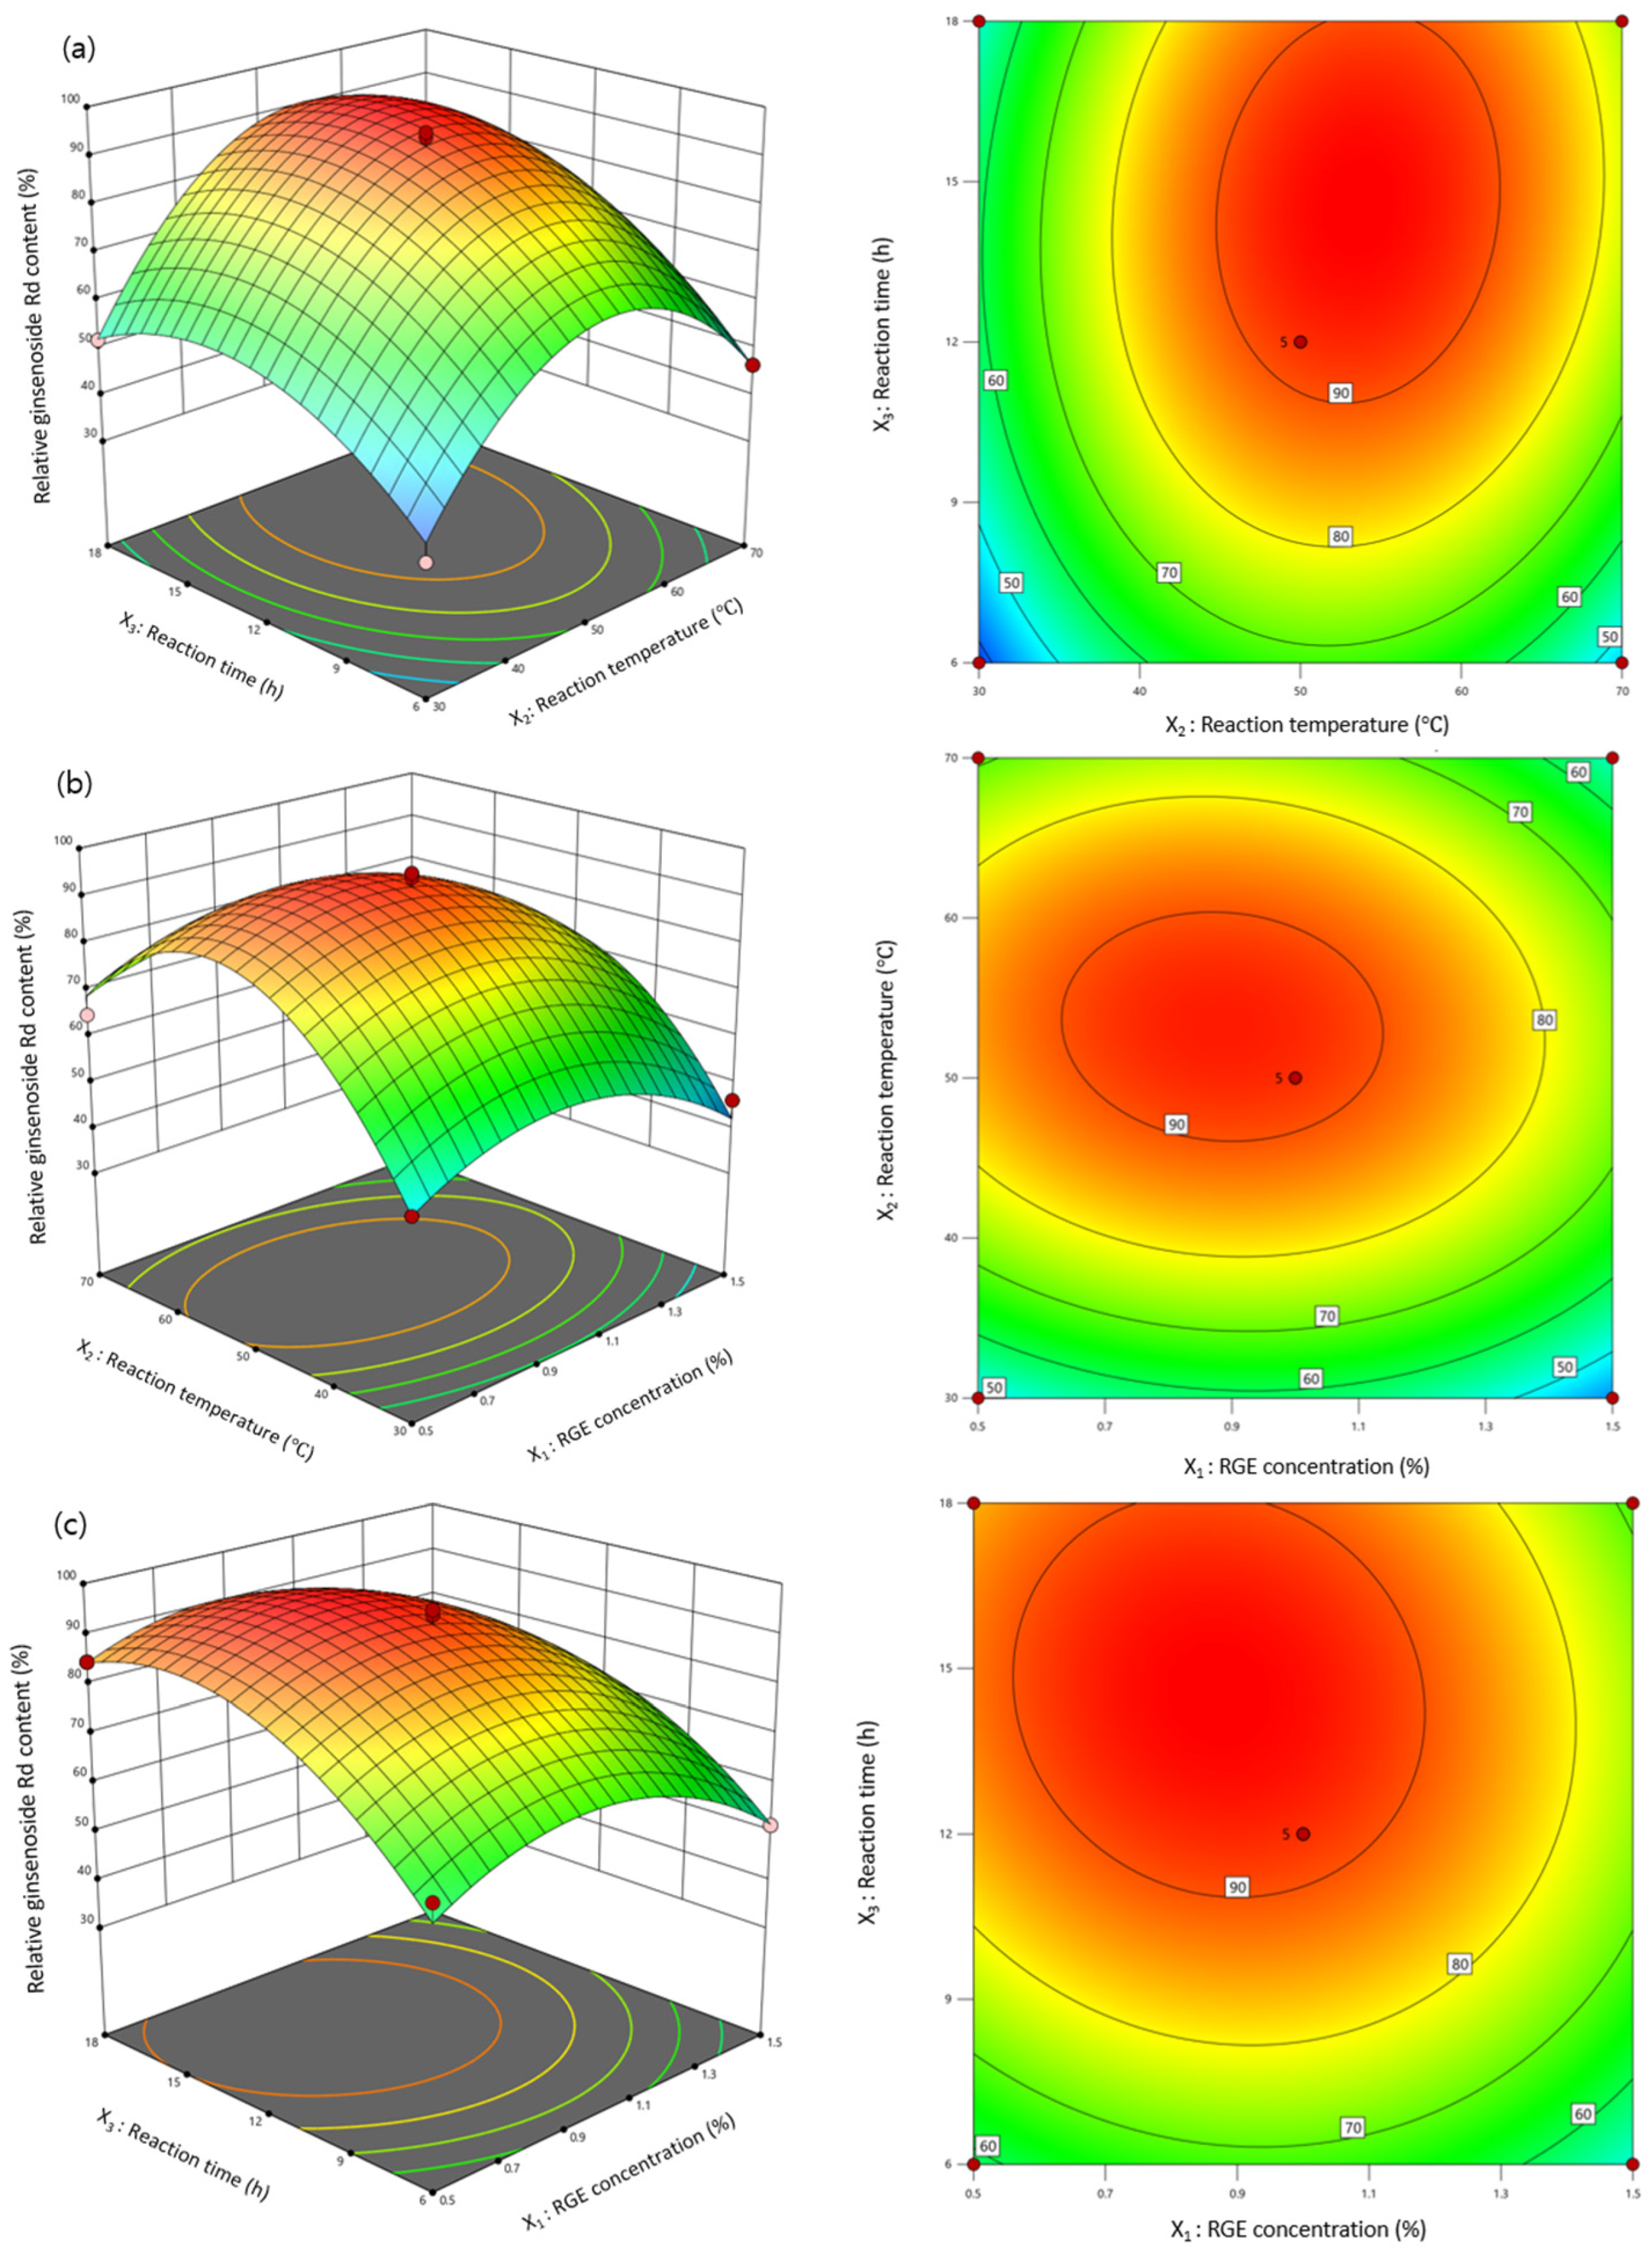
where Y represents the predicted relative ginsenoside Rd content (%), and X1, X2, and X3 represent the coded values of RGE concentration, reaction temperature, and reaction time, respectively. All three linear terms (RGE concentration [X1], reaction temperature [X2], and reaction time [X3]) significantly affected the response: X1 (p = 0.0055), X2 (p = 0.0009), and X3 (p = 0.0001). The negative coefficient of X1 indicates that increasing the RGE concentration decreased the relative Rd content within the experimental region, whereas the positive coefficients of X2 and X3 indicate the favorable effects of increasing the reaction temperature and time. This result indicates that, within the BBD range investigated, increasing the substrate concentration did not favor the response variable used for optimization, namely the relative Rd content. All quadratic terms were highly significant: X12 (p = 0.0003), X22 (p < 0.0001), and X32 (p = 0.0002). Their negative coefficients indicate a pronounced downward curvature and, consequently, the presence of intermediate optima rather than continuous increases toward the upper experimental limits. The X22 term exhibited the largest coefficient magnitude and highest F-value, demonstrating a strong nonlinear effect of the reaction temperature. This finding was consistent with the factorial screening experiment, in which the reaction temperature exhibited the largest main effect. In contrast, the interaction terms X1X2, X1X3, and X2X3 were not significant, indicating that the response within the investigated region was predominantly governed by individual linear and quadratic contributions rather than strong pairwise interactions. The response surface and contour plots illustrate these nonlinear relationships (Figure 5). The maximum relative ginsenoside Rd content was predicted within an intermediate region of the experimental domain rather than at the boundaries, confirming that balanced reaction conditions were required for selective Rd enrichment.

3.5. Numerical Optimization and Experimental Validation

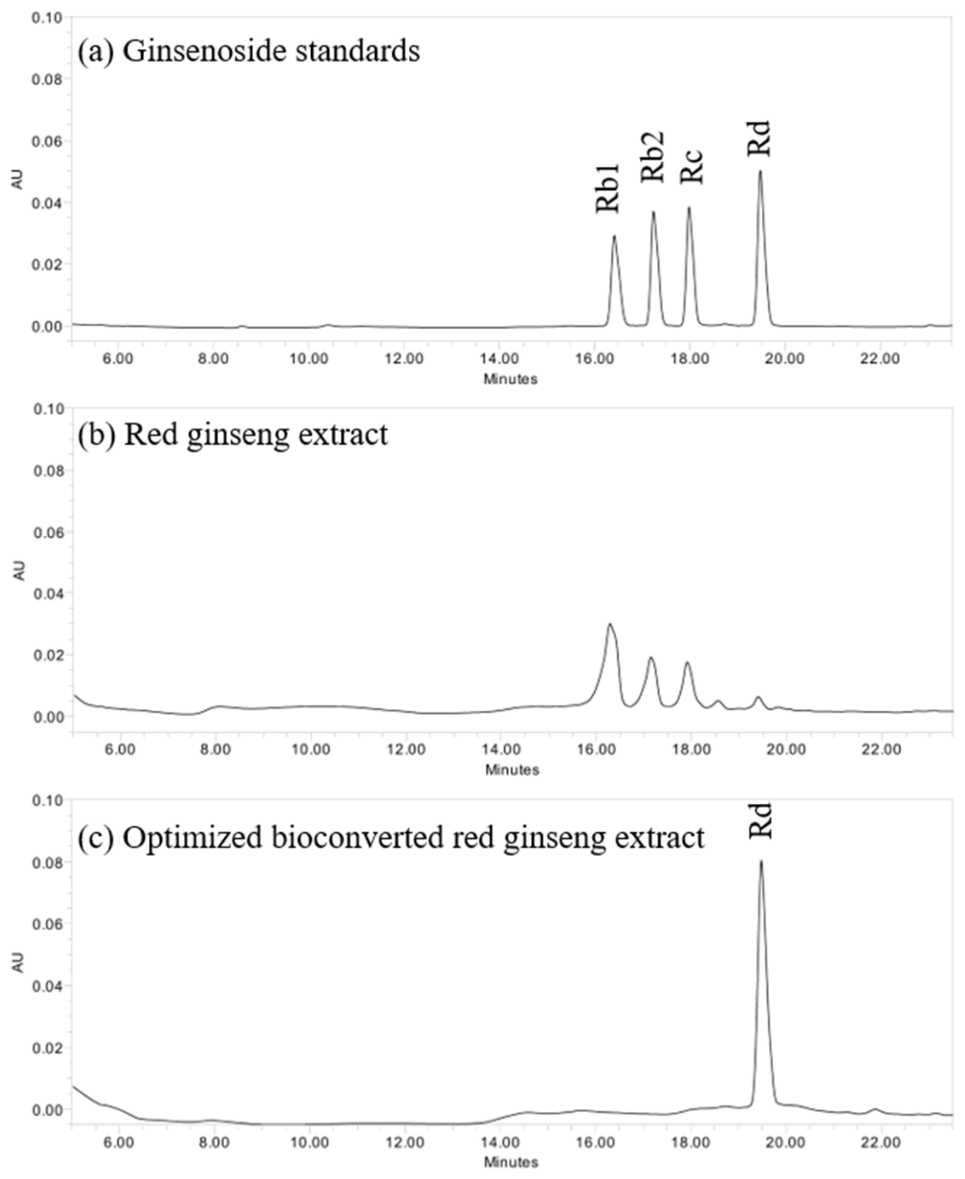
Numerical optimization of the quadratic regression model was conducted to maximize the relative ginsenoside Rd content. The predicted optimum conditions were an RGE concentration of 0.882% (w/v), reaction temperature of 52.4 °C, and reaction time of 14.3 h. Under these conditions, the predicted relative ginsenoside Rd content was 95.77%. The optimized reaction temperature was within a range previously reported to favor the enzymatic production of Rd, although direct comparisons should be made cautiously because the enzyme systems and substrate matrices differed [14]. Experimental validation was performed under the predicted optimum conditions. HPLC analysis revealed marked decreases in the peaks corresponding to Rb1, Rb2, and Rc and a predominant accumulation of Rd relative to untreated RGE (Figure 6). The experimentally determined relative ginsenoside Rd content was 95.54%, which closely agreed with the model-predicted value of 95.77%. The difference between the predicted and experimental values was approximately 0.23 percentage points. The purpose of this validation experiment was to assess the predictive accuracy of the quadratic model rather than to demonstrate a statistically significant improvement over the highest response observed among the BBD runs. Therefore, the small difference between the validated value (95.54%) and the maximum value obtained in the BBD experiments (94.87%) was not interpreted as evidence of superiority.
The close agreement between the model prediction and experimental validation supports the predictive accuracy of the quadratic regression model. Absolute quantification using calibration curves constructed with authentic standards further confirmed the enrichment of Rd following enzymatic bioconversion (Table 6). The Rd content increased from 0.120 mg/g in untreated RGE to 4.750 mg/g in the optimized bioconverted RGE, corresponding to an approximately 39.6-fold increase. In parallel, Rb1 and Rb2 were not detected after bioconversion, while Rc decreased from 1.072 to 0.040 mg/g. These results quantitatively confirm that the increase in relative Rd content was accompanied by a substantial increase in absolute Rd content. Nevertheless, the relative Rd content of 95.54% represents the proportion of Rd only among the four quantified major PPD-type ginsenosides (Rb1, Rb2, Rc, and Rd) and should not be interpreted as the purity or overall yield of Rd in the bioconverted RGE. Furthermore, because other ginsenosides and non-ginsenoside constituents of the RGE matrix were not comprehensively quantified, a complete ginsenoside or overall mass balance could not be established in the present study. Overall, the sequential strategy of commercial enzyme screening, factorial variable selection, and response surface optimization effectively established the reaction conditions for the selective enrichment of Rd directly from a complex red ginseng matrix. Some limitations of the present study should be noted. Because E1 is a commercial enzyme preparation containing multiple carbohydrate-hydrolyzing activities, the specific enzyme component(s) responsible for the observed ginsenoside conversion were not identified. Although the absolute contents of the four major PPD-type ginsenosides were determined, comprehensive profiling of other ginsenosides, overall mass balance, detailed conversion kinetics, process recovery, maximum feasible substrate loading, and scale-up performance were not evaluated. In particular, the BBD optimization was conducted within an RGE concentration range of 0.5–1.5% (w/v) and therefore does not establish optimal conditions at higher substrate concentrations that may be more relevant to industrial productivity. Further studies extending the optimization to higher RGE loadings, together with evaluation of process recovery and scale-up performance, will be required to assess the applicability of the proposed bioconversion process to larger-scale production.

3.6. Effect of Optimized Bioconverted RGE on Collagen Synthesis

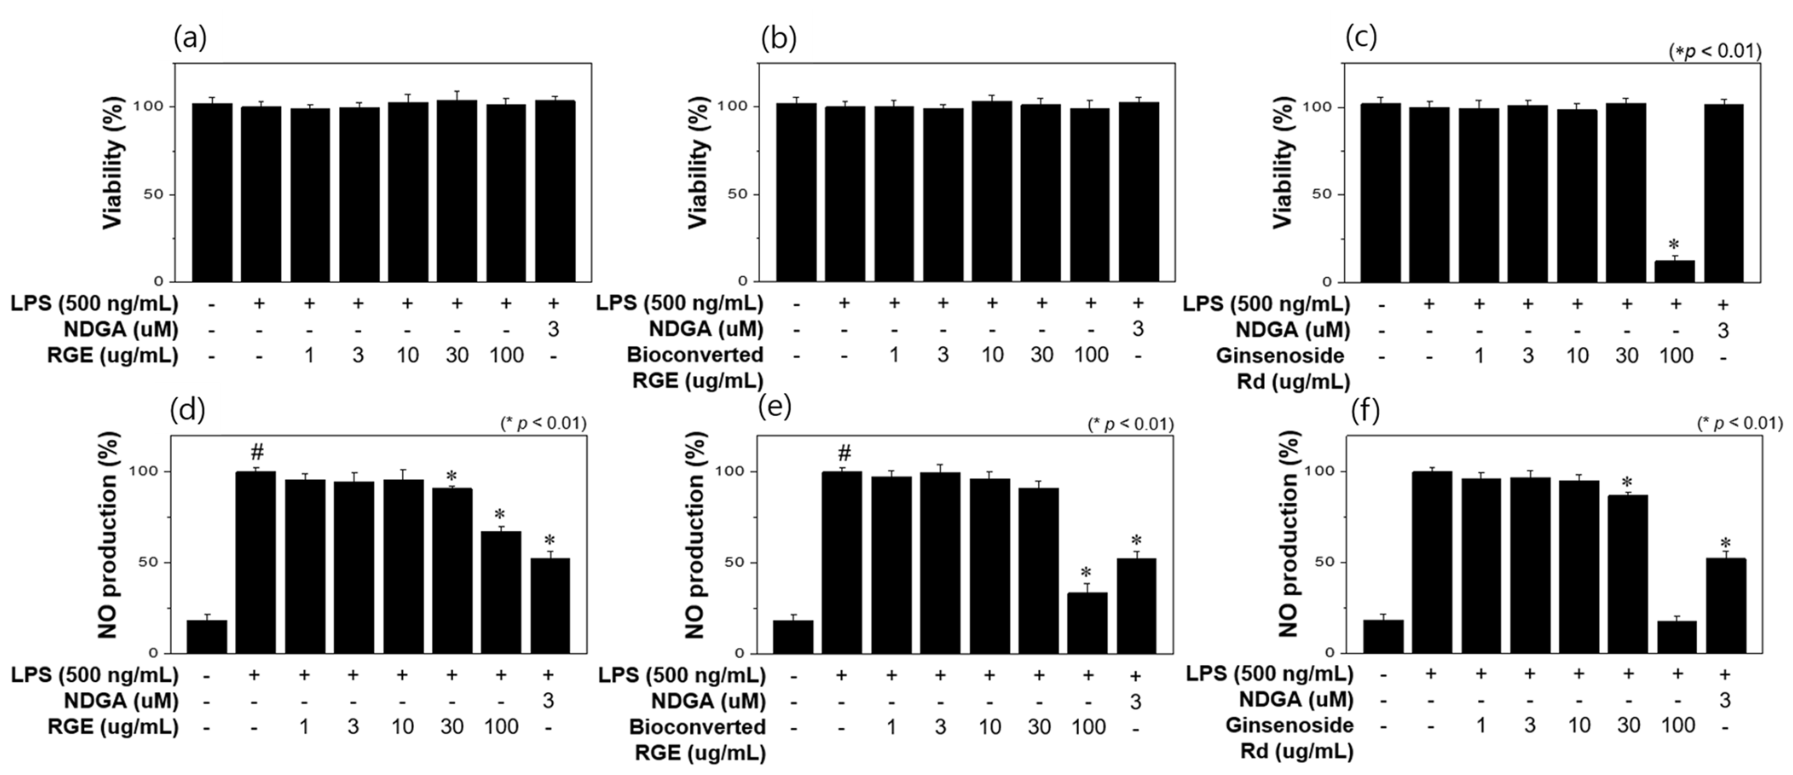
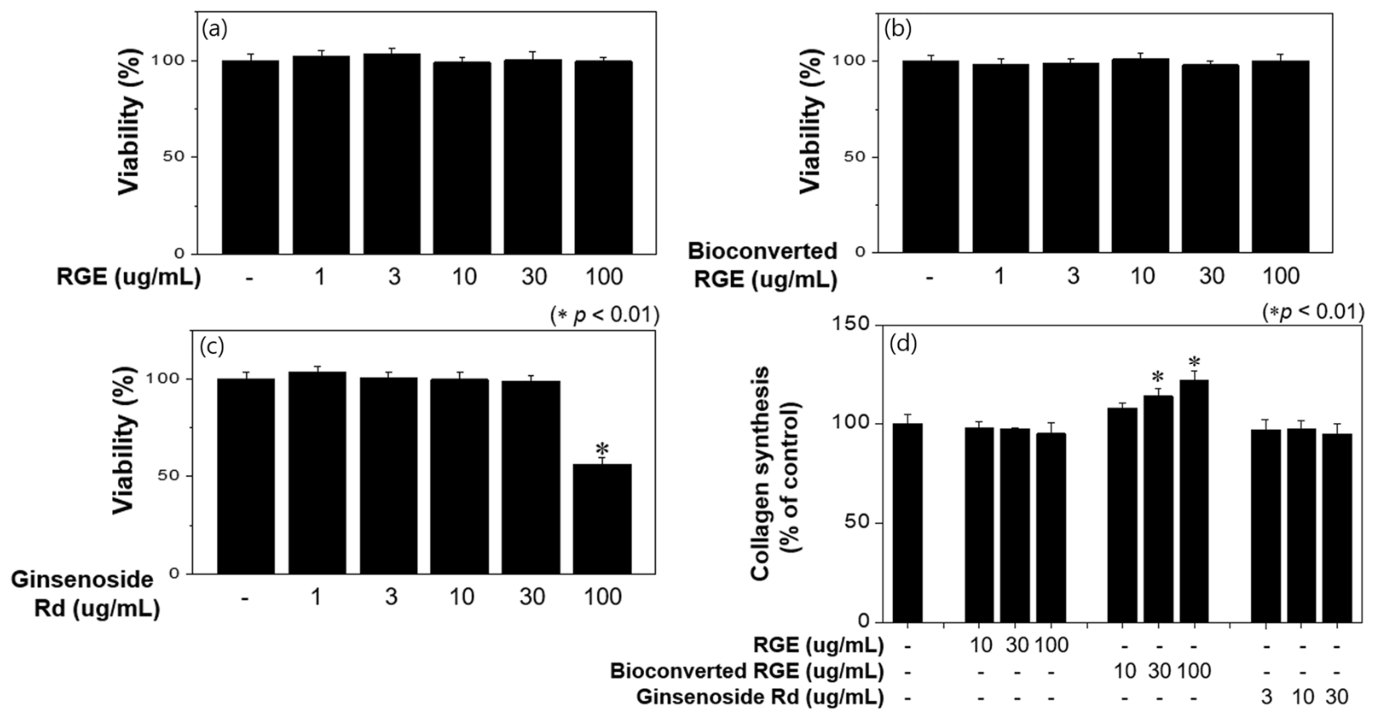
To investigate whether the compositional changes induced by enzymatic bioconversion were accompanied by changes in the biological properties of RGE, the effects of untreated RGE, optimized bioconverted RGE, and authentic ginsenoside Rd on collagen synthesis were evaluated in human dermal fibroblasts (Figure 7). Cell viability was initially examined to establish non-cytotoxic concentrations for subsequent evaluation (Figure 7a–c). Untreated RGE and optimized bioconverted RGE showed no substantial cytotoxicity at concentrations up to 100 μg/mL, whereas authentic Rd exhibited reduced cell viability at 100 μg/mL. Accordingly, collagen synthesis was evaluated within the respective non-cytotoxic concentration ranges.
The optimized bioconverted RGE increased collagen levels to 113.79% and 121.59% at 30 and 100 μg/mL, respectively (Figure 7d). Untreated RGE and authentic Rd did not show a significant collagen-promoting effect at the concentrations tested within their respective non-cytotoxic ranges. These results indicate that enzymatic bioconversion was accompanied not only by a marked alteration in the ginsenoside profile but also by changes in the biological properties of the resulting RGE.
Previous studies support the relationship between ginseng constituents and collagen homeostasis. Panax ginseng extract has been reported to stimulate proliferation and collagen synthesis in human dermal fibroblasts [19]. Ginsenoside Rd has also been reported to promote the proliferation and migration of human dermal fibroblasts and to induce type I collagen expression while reducing MMP-1 expression [20]. In addition, compound K, a downstream deglycosylated PPD-type ginsenoside, has been reported to modulate type I collagen and MMP-1 expression under UVB-induced conditions, further indicating that structural transformation of ginsenosides can influence collagen-related biological responses [21]. In the present study, however, direct comparison of the magnitude of the collagen-promoting effects of optimized bioconverted RGE and authentic Rd is limited by the different concentration ranges used. Authentic Rd was evaluated only up to 30 μg/mL because reduced cell viability was observed at 100 μg/mL, whereas the RGE samples were evaluated up to 100 μg/mL. Moreover, the samples were not compared at equivalent Rd concentrations. Therefore, the authentic Rd treatment should be regarded as a reference comparison within its non-cytotoxic concentration range rather than as evidence for distinguishing the specific contribution of Rd from that of other constituents in the bioconverted RGE. Enzymatic bioconversion markedly altered the major PPD-type ginsenoside profile, including substantial Rd enrichment, and may also have resulted in broader compositional changes in the RGE matrix. Previous studies have similarly shown that biotransformation of major ginsenosides toward Rd can be accompanied by changes in the biological properties of ginsenoside extracts [12]. However, the relative contributions of Rd enrichment and other compositional changes to the collagen-promoting activity cannot be determined from the present experimental design. Further studies using equivalent Rd exposures or composition-matched samples, together with detailed compositional and mechanistic analyses, are required to clarify the constituents responsible for the observed activity.

3.7. Effect of Optimized Bioconverted RGE on LPS-Induced Nitric Oxide Production

The anti-inflammatory activity of the optimized bioconverted RGE was further evaluated by measuring LPS-induced NO production in RAW264.7 macrophages (Figure 8). Cell viability was first examined following treatment with untreated RGE, optimized bioconverted RGE, and authentic Rd to establish non-cytotoxic treatment conditions (Figure 8a–c). Untreated RGE and optimized bioconverted RGE showed no substantial cytotoxicity at concentrations up to 100 μg/mL, whereas authentic Rd reduced cell viability at 100 μg/mL.
LPS stimulation markedly increased NO production in RAW264.7 cells. Treatment with the optimized bioconverted RGE resulted in a concentration-dependent inhibition of NO production, reaching 81.23% inhibition at 100 μg/mL (Figure 8e). In comparison, untreated RGE showed 11.22% and 40.00% inhibition at 30 and 100 μg/mL, respectively (Figure 8d), whereas authentic Rd showed 16.03% inhibition at 30 μg/mL within its non-cytotoxic concentration range (Figure 8f). At the same extract concentrations, the optimized bioconverted RGE exhibited a more pronounced inhibitory effect on LPS-induced NO production than untreated RGE under the experimental conditions.
These findings are consistent with the reported anti-inflammatory properties of ginsenoside Rd [2,3]. In particular, Rd has previously been reported to decrease NO production in LPS-stimulated RAW264.7 macrophages, accompanied by downregulation of iNOS expression and suppression of NF-κB activity [7]. Anti-inflammatory activity has also been reported for a biotransformed ginseng fraction enriched in compound K, which suppressed NO production in LPS-stimulated RAW264.7 macrophages [22]. However, direct comparison of the magnitude of the NO-inhibitory effects of optimized bioconverted RGE and authentic Rd is limited by the different concentration ranges used. Authentic Rd was evaluated only up to 30 μg/mL within its non-cytotoxic concentration range, whereas the RGE samples were evaluated up to 100 μg/mL. Moreover, the samples were not compared at equivalent Rd concentrations. Therefore, the authentic Rd treatment should be interpreted as a reference comparison rather than as evidence for determining the specific contribution of Rd enrichment to the NO-inhibitory activity of the bioconverted RGE. Enzymatic bioconversion markedly altered the ginsenoside composition of RGE and may also have resulted in broader compositional changes; however, the relative contributions of Rd enrichment and other compositional changes to the observed NO-inhibitory activity cannot be distinguished from the present experimental design. Further studies using equivalent Rd exposures or composition-matched samples, together with detailed compositional profiling and investigation of inflammatory signaling pathways, will be required to clarify the molecular basis of this activity.

4. Conclusions

A systematic enzymatic process was developed for the selective enrichment of ginsenoside Rd from RGE. Preliminary qualitative screening of commercial enzyme preparations identified Frontia® Fiber Wash as a suitable candidate for subsequent process development based on its TLC conversion pattern, and subsequent experiments demonstrated the transformation of major PPD-type precursor ginsenosides toward Rd. Factorial screening identified the reaction temperature as the predominant processing variable, whereas the RGE concentration and reaction time were selected for subsequent optimization. Response surface methodology using a Box–Behnken design successfully described the nonlinear effects of the three variables. Under the optimized conditions, the relative Rd content reached 95.54%, while absolute quantification showed an Rd content of 4.750 mg/g in the bioconverted RGE. In addition to the compositional changes achieved through enzymatic bioconversion, the optimized bioconverted RGE increased collagen synthesis in human dermal fibroblasts and markedly inhibited LPS-induced NO production in RAW264.7 macrophages compared with untreated RGE. However, because authentic Rd and the RGE samples were evaluated within their respective non-cytotoxic concentration ranges rather than at equivalent Rd concentrations, the specific contribution of Rd enrichment to these biological responses could not be determined from the present experimental design. Further studies using equivalent Rd exposures or composition-matched samples are required to clarify the relationship between Rd enrichment, broader compositional changes, and the observed biological activities. These results demonstrate that commercial enzyme-assisted bioconversion combined with statistical process optimization provides an effective approach for preparing Rd-enriched red ginseng materials from a complex natural substrate and provides a basis for further investigation of the biological properties associated with enzymatic modification of red ginseng materials.

Author Contributions

Conceptualization and supervision, J.P.; methodology and data curation, T.W.P.; formal analysis, S.L. All authors have read and agreed to the published version of the manuscript.

Funding

This study was supported by funding for the academic research program of Chungbuk National University in 2025 and by a grant of the Korea Health Technology R&D Project through the Korea Health Industry Development Institute (KHIDI), funded by the Ministry of Health & Welfare, Republic of Korea (grant number: RS-2025-02263266).

Data Availability Statement

The original contributions presented in this study are included in the article. Further inquiries can be directed to the corresponding author.

Conflicts of Interest

Author Junseong Park was employed by the company ECOS Bio Lab Co. The remaining authors declare that the research was conducted in the absence of any commercial or financial relationships that could be construed as a potential conflict of interest.

References

  1. Lee, S.M.; Bae, B.S.; Park, H.W.; Ahn, N.G.; Cho, B.G.; Cho, Y.L.; Kwak, Y.S. Characterization of Korean Red Ginseng (Panax ginseng Meyer): History, preparation method, and chemical composition. J. Ginseng Res. 2015, 39, 384–391. [Google Scholar] [CrossRef] [Scilit] [PubMed]
  2. Song, X.; Wang, L.; Fan, D. Insights into recent studies on biotransformation and pharmacological activities of ginsenoside Rd. Biomolecules 2022, 12, 512. [Google Scholar] [CrossRef] [Scilit] [PubMed]
  3. Li, J.; Huang, Q.; Yao, Y.; Ji, P.; E., M.; Chen, J.; Zhang, Z.; Qi, H.; Liu, J.; Chen, Z.; et al. Biotransformation, pharmacokinetics, and pharmacological activities of ginsenoside Rd against multiple diseases. Front. Pharmacol. 2022, 13, 909363. [Google Scholar] [CrossRef] [Scilit] [PubMed]
  4. An, D.S.; Cui, C.H.; Sung, B.H.; Yang, H.C.; Kim, S.C.; Lee, S.T.; Im, W.T.; Kim, S.G. Characterization of a novel ginsenoside-hydrolyzing α-L-arabinofuranosidase, AbfA, from Rhodanobacter ginsenosidimutans Gsoil 3054T. Appl. Microbiol. Biotechnol. 2012, 94, 673–682. [Google Scholar] [CrossRef] [Scilit] [PubMed]
  5. Hong, H.; Cui, C.H.; Kim, J.K.; Jin, F.X.; Kim, S.C.; Im, W.T. Enzymatic biotransformation of ginsenoside Rb1 and gypenoside XVII into ginsenosides Rd and F2 by recombinant β-glucosidase from Flavobacterium johnsoniae. J. Ginseng Res. 2012, 36, 418–424. [Google Scholar] [CrossRef] [Scilit] [PubMed]
  6. Liu, Q.M.; Jung, H.M.; Cui, C.H.; Sung, B.H.; Kim, J.K.; Kim, S.G.; Lee, S.T.; Kim, S.C.; Im, W.T. Bioconversion of ginsenoside Rc into Rd by a novel α-L-arabinofuranosidase, Abf22-3 from Leuconostoc sp. 22-3: Cloning, expression, and enzyme characterization. Antonie Van Leeuwenhoek 2013, 103, 747–758. [Google Scholar] [CrossRef] [Scilit] [PubMed]
  7. Kim, D.H.; Chung, J.H.; Yoon, J.S.; Ha, Y.M.; Bae, S.; Lee, E.K.; Jung, K.J.; Kim, M.S.; Kim, Y.J.; Kim, M.K.; et al. Ginsenoside Rd inhibits the expressions of iNOS and COX-2 by suppressing NF-κB in LPS-stimulated RAW264.7 cells and mouse liver. J. Ginseng Res. 2013, 37, 54–63. [Google Scholar] [CrossRef] [Scilit] [PubMed]
  8. Ko, S.R.; Suzuki, Y.; Suzuki, K.; Choi, K.J.; Cho, B.G. Marked production of ginsenosides Rd, F2, Rg3, and compound K by enzymatic method. Chem. Pharm. Bull. 2007, 55, 1522–1527. [Google Scholar] [CrossRef] [Scilit] [PubMed]
  9. Wang, L.; Liu, Q.M.; Sung, B.H.; An, D.S.; Lee, H.G.; Kim, S.G.; Kim, S.C.; Lee, S.T.; Im, W.T. Bioconversion of ginsenosides Rb1, Rb2, Rc and Rd by novel β-glucosidase hydrolyzing outer 3-O-glycoside from Sphingomonas sp. 2F2: Cloning, expression, and enzyme characterization. J. Biotechnol. 2011, 156, 125–133. [Google Scholar] [CrossRef] [Scilit] [PubMed]
  10. Hu, Y.; Li, Y.; Cao, Y.; Shen, Y.; Zou, X.; Liu, J.; Zhao, J. Advancements in enzymatic biotransformation and bioactivities of rare ginsenosides: A review. J. Biotechnol. 2024, 392, 78–89. [Google Scholar] [CrossRef] [Scilit] [PubMed]
  11. Gao, Y.; Feng, Y.; Chang, Y.; Zhu, Z.; Zhao, H.; Xu, W.; Zhao, M.; Xiao, Y.; Tian, L.; Xiu, Y. Biotransformation of ginsenoside Rb1 to ginsenoside Rd and 7 rare ginsenosides using Irpex lacteus with HPLC-HRMS/MS identification. ACS Omega 2024, 9, 22744–22753. [Google Scholar] [CrossRef] [Scilit] [PubMed]
  12. Tang, X.; Liu, C.; Wang, B.; Zhang, M.; Mao, B.; Zhang, Q.; Zhao, J.; Cui, S. Enhancing the anti-fatigue effect of ginsenoside extract by Bifidobacterium animalis subsp. lactis CCFM1274 fermentation through biotransformation of Rb1, Rb2 and Rc to Rd. Food Biosci. 2024, 62, 105251. [Google Scholar] [CrossRef] [Scilit]
  13. Shin, B.K.; Park, H.Y.; Han, J. Enzymatic biotransformation of red ginseng and the compositional change of ginsenosides. J. Korean Soc. Appl. Biol. Chem. 2010, 53, 553–558. [Google Scholar] [CrossRef] [Scilit]
  14. Fang, H.; Wei, Y.; Li, Y.; Zhou, G. One-pot process for the production of ginsenoside Rd by coupling enzyme-assisted extraction with selective enzymolysis. Biol. Pharm. Bull. 2020, 43, 1443–1447. [Google Scholar] [CrossRef] [Scilit] [PubMed]
  15. Chang, K.H.; Jee, H.S.; Lee, N.K.; Park, S.H.; Lee, N.W.; Paik, H.D. Optimization of the enzymatic production of 20(S)-ginsenoside Rg3 from white ginseng extract using response surface methodology. New Biotechnol. 2009, 26, 181–186. [Google Scholar] [CrossRef] [Scilit] [PubMed]
  16. Kim, E.H.; Lim, S.; Kim, S.O.; Ahn, S.H.; Choi, Y.J. Optimization of enzymatic treatment for compound K production from white ginseng extract by response surface methodology. Biosci. Biotechnol. Biochem. 2013, 77, 1138–1140. [Google Scholar] [CrossRef] [Scilit] [PubMed]
  17. Kim, T.H.; Yang, E.J.; Shin, K.C.; Hwang, K.H.; Park, J.S.; Oh, D.K. Enhanced Production of β-D-glycosidase and α-L-arabinofuranosidase in Recombinant Escherichia coli in Fed-batch Culture for the Biotransformation of Ginseng Leaf Extract to Ginsenoside Compound K. Biotechnol. Bioprocess Eng. 2018, 23, 183–193. [Google Scholar] [CrossRef] [Scilit]
  18. Quan, L.H.; Wang, C.; Jin, Y.; Wang, T.R.; Kim, Y.J.; Yang, D.C. Isolation and characterization of novel ginsenoside-hydrolyzing glycosidase from Microbacterium esteraromaticum that transforms ginsenoside Rb2 to rare ginsenoside 20(S)-Rg3. Antonie Van Leeuwenhoek 2013, 104, 129–137. [Google Scholar] [CrossRef] [Scilit] [PubMed]
  19. Lee, G.Y.; Park, K.G.; Namgoong, S.; Han, S.K.; Jeong, S.H.; Dhong, E.S.; Kim, W.K. Effects of Panax ginseng extract on human dermal fibroblast proliferation and collagen synthesis. Int. Wound J. 2016, 13, 42–46. [Google Scholar] [CrossRef] [Scilit] [PubMed]
  20. Kim, W.K.; Song, S.Y.; Oh, W.K.; Kaewsuwan, S.; Tran, T.L.; Kim, W.S.; Sung, J.H. Wound-healing effect of ginsenoside Rd from leaves of Panax ginseng via cyclic AMP-dependent protein kinase pathway. Eur. J. Pharmacol. 2013, 702, 285–293. [Google Scholar] [CrossRef] [Scilit] [PubMed]
  21. Kim, E.; Kim, D.; Yoo, S.; Hong, Y.H.; Han, S.Y.; Jeong, S.; Jeong, D.; Kim, J.H.; Cho, J.Y.; Park, J. The skin protective effects of compound K, a metabolite of ginsenoside Rb1 from Panax ginseng. J. Ginseng Res. 2018, 42, 218–224. [Google Scholar] [CrossRef] [Scilit] [PubMed]
  22. Kim, E.; Yi, Y.S.; Son, Y.J.; Han, S.Y.; Kim, D.H.; Nam, G.; Hossain, M.A.; Kim, J.H.; Cho, J.Y.; Park, J. BIOGF1K, a compound K-rich fraction of ginseng, plays an antiinflammatory role by targeting an activator protein-1 signaling pathway in RAW264.7 macrophage-like cells. J. Ginseng Res. 2018, 42, 233–237. [Google Scholar] [CrossRef] [Scilit] [PubMed]
Figure 1. Enzymatic bioconversion pathways of major PPD-type ginsenosides. Proposed pathways for enzymatic conversion of the major protopanaxadiol-type ginsenosides Rb1, Rb2, and Rc to ginsenoside Rd through selective hydrolysis of terminal sugar residues, followed by further deglycosylation of Rd to downstream products such as F2 and compound K. Glc, glucose; Arap, arabinopyranose; Araf, arabinofuranose.
Processes 14 02928 g001
Figure 2. TLC profiles of RGE treated with commercial enzyme preparations. Red ginseng extract (RGE) was treated with five commercial enzyme preparations (E1–E5), and changes in ginsenoside profiles were monitored at 0, 12, and 24 h using thin-layer chromatography (TLC). E1, Frontia® Fiber Wash; E2, Pectinex® Ultra Pulp; E3, Viscoflow® MG; E4, Viscozyme® Wheat FG; E5, Viscozyme® L.
Processes 14 02928 g002
Figure 3. Time-dependent bioconversion of major PPD-type ginsenosides by E1. Thin-layer chromatography (TLC) profiles of (a) ginsenoside Rb1, (b) ginsenoside Rb2, and (c) ginsenoside Rc during enzymatic treatment with E1. Samples were collected at 0, 1, 2, 3, 6, 12, and 24 h. E1, Frontia® Fiber Wash.
Processes 14 02928 g003
Figure 4. Pareto chart of the effects of reaction variables on relative Rd content. The absolute t-values represent the relative magnitudes of the effects of red ginseng extract (RGE) concentration, enzyme concentration, reaction temperature, pH, reaction time, and agitation speed. The signs (+/−) in parentheses indicate the direction of estimated effects.
Processes 14 02928 g004
Figure 5. Response surface and contour plots for relative Rd content. Three-dimensional response surface plots and corresponding two-dimensional contour plots showing the effects of (a) reaction temperature and reaction time, (b) red ginseng extract (RGE) concentration and reaction temperature, and (c) RGE concentration and reaction time on relative ginsenoside Rd content. For each plot, the remaining variables are maintained at their center levels. The response surfaces show pronounced nonlinear effects of the three variables and indicate an optimum region at intermediate reaction conditions.
Processes 14 02928 g005
Figure 6. HPLC profiles of RGE before and after optimized enzymatic bioconversion. High-performance liquid chromatography (HPLC) chromatograms of (a) authentic ginsenoside standards (Rb1, Rb2, Rc, and Rd), (b) untreated red ginseng extract (RGE), and (c) bioconverted RGE obtained under the optimized conditions (RGE concentration, 0.882% [w/v]; reaction temperature, 52.4 °C; and reaction time, 14.3 h).
Processes 14 02928 g006
Figure 7. Effects of RGE bioconversion on fibroblast viability and procollagen type I production. Cell viability was evaluated following treatment with (a) untreated red ginseng extract (RGE), (b) optimized bioconverted RGE with a relative ginsenoside Rd content of 95.54%, and (c) authentic ginsenoside Rd at the indicated concentrations. (d) Procollagen type I production was quantitatively evaluated using a Procollagen Type I C-Peptide (PIP) EIA kit following treatment with untreated RGE, optimized bioconverted RGE, and authentic ginsenoside Rd. Procollagen type I production is expressed as a percentage relative to the untreated control. Data are presented as the mean ± SD. Statistical significance was evaluated by one-way analysis of variance (ANOVA) followed by Dunnett’s multiple-comparison test. p < 0.01 versus the untreated control.
Processes 14 02928 g007
Figure 8. Effects of RGE bioconversion on macrophage viability and NO production. Cell viability was evaluated following treatment with (a) untreated red ginseng extract (RGE), (b) optimized bioconverted RGE with a relative ginsenoside Rd content of 95.54%, and (c) authentic ginsenoside Rd at the indicated concentrations. Nitric oxide (NO) production was evaluated in RAW264.7 macrophages following treatment with (d) untreated RGE, (e) optimized bioconverted RGE, and (f) authentic ginsenoside Rd. NO production was determined using the Griess assay and expressed relative to the LPS-treated control. NDGA, nordihydroguaiaretic acid, was used as a positive control. Data are presented as the mean ± SD. Statistical significance was evaluated by one-way analysis of variance (ANOVA) followed by Dunnett’s multiple-comparison test. For cell viability (ac), * p < 0.01 versus the untreated control. For NO production (df), # p < 0.01 versus the untreated control and * p < 0.01 versus the LPS-treated control.
Processes 14 02928 g008
Table 1. Commercial enzyme preparations evaluated for the bioconversion of major protopanaxadiol-type ginsenosides in red ginseng extract.
Enzyme CodeCommercial ProductMajor Enzymatic ActivitiesManufacturer
E1Frontia® Fiber WashArabinofuranosidase, xylanaseNovonesis
(Denmark)
E2Pectinex® Ultra PulpPectin lyase, polygalacturonaseNovonesis
(Denmark)
E3Viscoflow® MGβ-glucanase, cellulase, xylanase, α-amylaseNovonesis
(Denmark)
E4Viscozyme® Wheat FGCellulase, β-glucanase, xylanaseNovonesis
(Denmark)
E5Viscozyme® LXylanase, cellulase, hemicellulaseNovonesis
(Denmark)
Table 2. Experimental design and relative ginsenoside Rd content obtained from a factorial screening design.
RunRGE
Concentration (%, w/v)
Enzyme
Concentration
(%, v/v)
Reaction
Temperature (°C)
pHReaction
Time (h)
Agitation
Speed
(rpm)
Relative Ginsenoside Rd
Content (%)
10.52.53041290029.89
20.50.5304430010.24
32.50.5704490034.66
41.51.5505860049.72
51.51.5505860052.75
60.50.5306490016.83
72.52.530449002.48
82.52.530643002.69
90.52.5704430044.97
100.52.53061230040.53
110.50.57041290036.00
122.50.53061290010.13
130.50.57061230047.26
142.50.5706430036.97
152.52.57041230038.25
160.52.5706490047.87
171.51.5505860062.51
182.52.57061290042.72
192.50.5304123008.56
Table 3. Analysis of variance for the factorial screening model of relative ginsenoside Rd content.
SourceSum of SquaresdfMean SquareF-Valuep-Value *
Model3730.436621.7413.340.0002
A-RGE concentration589.641589.6412.650.0045
B-Enzyme concentration148.541148.543.190.1018
C-Reaction temperature2687.1312687.1357.64<0.0001
D-pH99.75199.752.140.1715
E-Reaction time200.431200.434.300.0624
F-Agitation speed4.9414.940.10600.7509
Curvature1823.3411823.3439.11<0.0001
Residual512.831146.62
Lack of Fit423.49947.051.050.5774
Pure Error89.34244.67
* p-value < 0.05 was considered statistically significant.
Table 4. Box–Behnken design matrix and experimental relative ginsenoside Rd content for optimization of enzymatic bioconversion.
RunX1: RGE Concentration (%, w/v)X2: Reaction Temperature (°C)X3: Reaction Time (h)Relative Ginsenoside Rd Content (%)
11.030633.96
21.0301851.85
31.550651.56
41.0501293.85
51.0501290.45
61.5701253.21
71.5301246.25
81.0701878.56
91.0501289.45
100.5301248.86
110.5501884.58
120.5701264.89
130.550661.85
141.0501294.87
151.5501864.58
161.0501291.56
171.070646.51
Table 5. Analysis of variance and regression coefficients for the quadratic model fitted to the relative ginsenoside Rd content.
(A) Analysis of Variance
SourceSum of SquaresdfMean SquareF-Valuep-Value
Model6448.849716.5445.18<0.0001
X1: RGE concentration248.421248.4215.660.0055
X2: Reaction temperature484.381484.3830.540.0009
X3: Reaction time917.851917.8557.880.0001
X1X220.57120.571.300.2923
X1X323.57123.571.490.2623
X2X350.13150.133.160.1187
X12701.271701.2744.220.0003
X222808.7812808.78177.11<0.0001
X32766.001766.0048.300.0002
Residual111.01715.86
Lack of Fit90.26330.095.800.0613
Pure Error20.7545.19
Cor Total6559.8516
(B) Regression coefficients for the quadratic model
TermCoefficient EstimateStandard Error95% CI
Intercept92.041.7887.82–96.25
X1−5.571.41−8.90 to −2.24
X27.781.414.45–11.11
X310.711.417.38–14.04
X1X2−2.271.99−6.98–2.44
X1X3−2.431.99−7.14–2.28
X2X33.541.99−1.17–8.25
X12−12.911.94−17.49 to −8.32
X22−25.831.94−30.42 to −21.24
X32−13.491.94−18.08 to −8.90
Table 6. Absolute contents of major PPD-type ginsenosides in untreated and optimized bioconverted RGE.
SampleRb1Rb2Rc (mg/g)Rd (mg/g)Total Quantified Ginsenosides
Untreated RGE (mg/g)2.9661.3411.0720.1205.499
Optimized bioconverted RGE (mg/g)N.D.N.D.0.0404.7504.790
Ginsenoside contents were determined using calibration curves constructed with authentic standards and are expressed as mg/g of RGE. N.D., not detected; RGE, red ginseng extract.
Disclaimer/Publisher’s Note: The statements, opinions and data contained in all publications are solely those of the individual author(s) and contributor(s) and not of MDPI and/or the editor(s). MDPI and/or the editor(s) disclaim responsibility for any injury to people or property resulting from any ideas, methods, instructions or products referred to in the content.