Article

Rapid Fault Restoration Strategy of Power System Based on Mobile Operation and Maintenance Base

1
Guangdong Power Grid Limited Liability Company Jiangmen Power Supply Bureau, Jiangmen 529030, China
2
School of Electrical Engineering and Automation, Shandong University of Science and Technology, Qingdao 266590, China
*
Author to whom correspondence should be addressed.
Processes 2026, 14(17), 2840; https://doi.org/10.3390/pr14172840
Submission received: 12 June 2026 / Revised: 27 July 2026 / Accepted: 8 August 2026 / Published: 4 September 2026

Abstract

In recent years, power grids have grown increasingly complicated, and the rising penetration of new energy sources poses prominent risks to the secure and stable operation of power systems. As a critical technology for improving grid resilience and power supply reliability, mobile operation and maintenance bases are investigated in this paper, which proposes an optimal configuration method tailored to multi-scenario emergency power guarantee requirements of power systems. Monte Carlo sampling is adopted to simulate various fault scenarios, and a multi-index resilience evaluation system consisting of load loss rate, power shortage ratio and recovery indicators is established. On this basis, a pre-positioning optimization model is formulated to minimize the space–time scheduling cost of mobile operation and maintenance bases. To tackle the model complexity, nonlinear convergence factors and dynamic adaptive weight strategies are embedded into the conventional whale optimization algorithm, which improves the global search capability and convergence stability of the algorithm. Simulation results show that the proposed method outperforms the baseline case without mobile operation maintenance bases: system load curtailment drops from 1.27 MWh to 0.65 MWh, and the overall resilience index reaches 0.831, greatly boosting distribution network power recovery performance. In addition, the improved algorithm converges within 126 iterations. Compared with standard algorithms, it improves solving efficiency by 29.2% and cuts total scheduling cost by 15.8%, achieving a good trade-off between calculation precision and convergence speed.

1. Introduction

Large-scale integration of novel sources and loads including distributed photovoltaic generation and fast charging facilities for electric vehicles has led to conspicuous peak load characteristics and localized supply–demand imbalance in distribution networks [1]. Deployed dispersedly on the user side, distributed energy storage features fast response and serves as a vital solution to enhance emergency power support and new energy accommodation capacity of distribution systems [2]. Nevertheless, conventional fixed operation and maintenance bases are confined to fixed topological connection points and lack flexible relocation capability, failing to accommodate the spatio-temporally diverse power consumption demands of multi-type users. In contrast, mobile operation and maintenance bases support flexible spatio-temporal grid connection and real-time power regulation, showing distinctive superiority in flexible dispatching and economic performance for peak shaving [3] and emergency power restoration [4,5]. Therefore, research on spatio-temporal access scheduling and optimal configuration of mobile operation and maintenance bases for multi-scenario emergency power guarantee is of great significance for boosting distribution network resilience and power supply reliability [6].
Currently, the high penetration of renewable energy and frequent extreme weather have considerably raised the failure probability of power systems. Research on cascading failure defense based on physical operational characteristics focuses on practical system operating conditions [7], which blocks cascading failures by regulating generation and load resources to modify power flow distribution. To improve the operational reliability and fault restoration capability of distribution networks, dispatchers incorporate renewable energy sources, demand response on the load side, and flexible energy storage resources into the scheduling framework [8,9]. This realizes coordinated scheduling of generation, network, load and storage, and significantly enhances the resilience of the power system. Reference [10] establishes a cascading failure mitigation control model incorporating line outage probability to cut down failure risks at each stage while ensuring economical mitigation cost, yet the evolutionary path of failures may alter accordingly. On this account, Reference [11] explores the interaction between cascading failure propagation paths and mitigation controls to guide failures to evolve along predicted cascading routes, and Reference [12] selects the optimal mitigation stage from the perspective of load loss risk according to predicted failure evolution trajectories.
Compared with the aforementioned physical defense methods, mobile operation and maintenance bases can accurately satisfy the dynamic post-disaster load restoration demands relying on flexible spatio-temporal scheduling capability [13]. Nevertheless, it remains a critical urgent problem to rapidly and efficiently schedule such bases for targeted critical load restoration against multi-source uncertainties under severe post-disaster distribution network conditions [14]. Reference [15] concentrates on the economic optimal scheduling involving mobile operation and maintenance bases, yet gaps exist in the relevant research on distribution network resilience improvement and coordinated emergency rescue mechanisms. Accordingly, Reference [16] summarizes the existing research on the coordinated control of mobile operation and maintenance bases and analyzes the feasibility of cooperative control between multi-agent-based mobile energy storage clusters and multiple power stakeholders. Reference [17] constructs a mixed-integer programming model to address the coupling issues among the deployment and scheduling of mobile bases, transportation networks and power grids across various time scales, and enhances distribution network restoration capacity via dynamic optimal dispatching of flexible resources. Under interconnected multi-microgrid scenarios, Reference [18] develops a multi-stage optimal scheduling strategy for mobile bases to minimize load shedding costs. To improve post-disaster user satisfaction, Reference [19] proposes a balanced dynamic islanding restoration scheme integrated with the dispatching strategy of emergency mobile power vehicles. Though Reference [20] conducts research from the perspective of boosting distribution network resilience, none of the above literature takes the routing planning of mobile operation and maintenance bases into account during scheduling.
To address the route planning problem in the scheduling of operation and maintenance bases, Reference [21] puts forward an optimization approach for electric vehicles integrated into island microgrid clusters with demand response considered, establishes an optimization model targeting maximum economic and environmental benefits of island microgrid clusters, and verifies its effectiveness using a practical island group in Zhejiang as the test case. Reference [22] constructs a spatio-temporal transition matrix describing the transfer routes of mobile operation and maintenance bases across multiple distribution areas and proposes a two-stage day-ahead scheduling strategy for such mobile bases, whereas the impact of extreme weather is ignored. Deep reinforcement learning (DRL) is commonly adopted to tackle the coordinated scheduling between mobile bases and distribution networks under extreme weather conditions. Reference [23] develops a novel modeling framework based on Markov decision process (MDP) and the corresponding DRL algorithm to resolve the service restoration problem of mobile bases. Reference [24] designs a multi-agent DRL-based control scheme for load restoration under uncertain environments. Furthermore, with the deployment of mobile operation and maintenance bases, Reference [25] proposes an improved coordinated energy scheduling scheme oriented to typical highway power demand scenarios as a substitute for conventional centralized power dispatching. The MOMB investigated in this paper refers to a physical station that can be flexibly transported and deployed rather than a virtual unit that only exists in scheduling logic. This facility integrates hardware equipment, including energy storage power supplies, emergency maintenance tools, and line detection devices. Supported by transport vehicles, MOMBs can be pre-positioned before disasters and transported across regions to faulted island nodes after disasters. Its core function lies in emergency power supply for distribution networks under extreme disasters. By discharging stored energy, critical loads within islands can be rapidly restored to reduce load loss of the power system and improve the overall resilience of the grid. Meanwhile, basic communication terminals are equipped to guarantee information interaction between on-site maintenance crews and the master dispatch station. Communication serves merely as an auxiliary supporting function. The entire facility is designed and scheduling optimized centered on the core objective of restoring electric loads after disasters.
Although extensive research has been conducted by numerous scholars and promising results have been achieved, several challenges still remain:
  • Single-dimensional fault modeling for extreme meteorological disasters: Most existing studies either focus solely on the prevention and control of cascading fault evolution or separately consider the output uncertainties of wind power and photovoltaic generation. Few methods are available for generating distribution network fault scenarios that simultaneously couple dual disaster-inducing factors, namely mechanical loads caused by heavy rain and strong winds as well as waterlogging inundation. Accordingly, differentiated fault probabilities of power lines and transformer areas under compound heavy rain and waterlogging disasters cannot be accurately quantified.
  • Incomplete dimensionality of current distribution network resilience evaluation frameworks: The existing research mostly adopts load loss volume as the sole evaluation metric, without establishing a full-cycle multi-indicator resilience evaluation framework covering disaster resistance during hazard occurrence and post-disaster recovery. Quantitative multi-dimensional evaluation metrics including load loss ratio, power shortage ratio, recovery speed and recovery duration are lacking, making it difficult to objectively assess the comprehensive recovery performance of emergency resource scheduling schemes.
To address the above problems, this paper proposes a collaborative optimization strategy for rapid distribution network fault recovery targeting heavy rain and waterlogging disasters, which takes into account the spatio-temporal path scheduling of mobile operation and maintenance bases. The main contributions of this work are summarized as follows:
  • A stochastic fault scenario generation model for distribution networks under compound heavy rain disasters is constructed, alongside a full-cycle multi-indicator distribution network resilience evaluation framework. The entire disaster response process is divided into two phases: in-disaster resistance and post-disaster recovery. A four-dimensional resilience indicator system consisting of load loss ratio, power shortage ratio, recovery speed and recovery duration is established. The entropy weight method is adopted to assign weights to each indicator and calculate the comprehensive resilience index, enabling quantitative comparative evaluation of the recovery performance of emergency scheduling schemes across multiple scenarios. Simulation results verify that the proposed strategy achieves superior power recovery capacity for distribution networks relative to the baseline scheme without MOMBs, lowering load curtailment from 1.27 MWh to 0.65 MWh and lifting the overall resilience index to 0.831.
  • A collaborative optimization model incorporating spatio-temporal transportation constraints of mobile operation and maintenance bases is established, and an IWOA embedded with a nonlinear convergence factor and adaptive weights is proposed to solve the model. Cosine-based nonlinear convergence factors and dynamically adaptive weights are introduced into the conventional whale optimization algorithm to strengthen global search capability in the early iteration stage and improve local exploitation accuracy in the later stage. This overcomes the drawbacks of the original algorithm, such as premature convergence and slow convergence speed, and efficiently solves high-dimensional, multi-constraint complex mixed-integer optimization models.
The organizational structure of this paper is outlined as follows. First, Section 2 elaborates the complete research methodology system. Specifically, Section 2.1 constructs a distribution network fault scenario generation model under heavy rain disasters; Section 2.2 establishes an optimization model for grid fault recovery with mobile operation and maintenance bases, covering resilience evaluation indices, objective functions and various operational constraints; Section 2.3 proposes an improved whale optimization algorithm embedded with nonlinear factors and adaptive weights to solve the above model. Next, Section 3 conducts simulation case analyses based on the modified IEEE 33-node test system to verify the effectiveness and practical advantages of the proposed method. Finally, Section 4 summarizes the research findings of this paper and prospects potential directions for follow-up extended research. The improved WOA only takes 126 iterations to converge; compared with the traditional WOA, it increases solving efficiency by 29.2% and reduces total scheduling cost by 15.8%, balancing computational accuracy and convergence speed well.

2. Methodology

2.1. Construction of Distribution Network Disaster Scenarios Under Rainstorm Disasters

The power system fault scenarios investigated in this paper are mainly triggered by rainstorm disasters, during which power facilities are predominantly threatened by strong winds and accumulated rainwater. Modeling these two hazard sources constitutes the prerequisite for establishing disaster scenarios. Strong winds occur frequently under rainstorm conditions, and their adverse impacts on power transmission lines need quantitative evaluation. Wind pressure imposes loads on overhead conductors, insulators and transmission towers of power lines, and the corresponding wind load is expressed as follows [7]:
w x = a μ z μ s c d l h z v 2 sin 2 φ
w s = β μ z μ s c A z v 2
w z = n μ z A p z v 2
where the three variables w x , w s , w z denote the wind loads imposed on conductors, transmission towers and insulators respectively; non-uniform wind pressure coefficient of conductor, wind pressure height variation coefficient and conductor shape coefficient are defined by a , μ z and μ s c correspondingly; d represents the outer diameter of the conductor; l h represents the horizontal span of the conductor; v is the designed wind speed at the reference height; φ is the included angle between the conductor and wind direction; z is a constant; A stands for the horizontal projected area of the wind-bearing part on the tower, wind vibration coefficient; n is the quantity of insulators and the windward area of a single insulator.
Accordingly, the bending moment M x acting on the transmission tower can be obtained as [9]:
M x = ( w x h 1 + 2 w x h 2 + w s h 3 ) ( 1 + m x )
h 3 = ( 2 D 0 + D x ) h 1 3 D 0 + D x
where h 1 is the height of the transmission tower, h 2 is the height of the cross-arm, h 3 is the equivalent height of the wind load action point, D 0 is the tip diameter of the pole, D x is the root diameter of the pole cross-section and m x is the additional bending moment coefficient. The failure probability P f of transmission towers under strong wind is expressed as
P f = 0 M x 1 2 π δ e 0.5 ( M μ g δ ) d M
where M denotes the maximum allowable bending moment of the tower, μ g is the average flexural strength and δ is the standard deviation of flexural strength.
Under rainstorm conditions, intense short-duration rainfall may fail to drain in a timely manner and cause adverse impacts on distribution equipment. Once ponding exceeds the designed flood protection elevation of equipment, equipment damage is highly probable and endangers the security of regional power grids. The Chicago rainfall pattern [10] is adopted to simulate heavy rainfall and acquire real-time regional rainfall distribution, which is given by Equations (7) and (8).
i a = a [ ( 1 c ) t a / r + b ] ( t a / r + b ) 1 + c
i b = a [ ( 1 c ) t b / ( 1 r ) + b ] [ t b / ( 1 r ) + b ] 1 + c
where i a is rainfall intensity before the rain peak and i b represents rainfall intensity after the rain peak; a, b, c are constant coefficients, r is the peak ratio, and the two remaining variables t a and t b stand for the rainfall duration before and after the rain peak respectively. The rainfall volume in different periods can be calculated by integrating Equations (7) and (8), as shown below:
E = t b t a i d t
Meanwhile, the surface runoff Q under specific rainfall intensity can be calculated via Equation (10), namely:
Q = [ E 0.2 ( 25400 / μ 254 ) ] E + 0.8 ( 25400 / μ 254 )
where E is the rainfall amount and the other parameter represents the regional runoff curve number.
Based on the above calculation, the ponding depth h of the area can be solved as follows:
h = Q n p q p t p A
where n p is the number of drainage outlets in the calculated area, q p refers to the flow capacity of each outlet, and t p denotes the drainage duration.
Since the damage probability of distribution equipment rises sharply with the increase in ponding depth, an exponential function is employed to calculate the equipment failure probability P j , as follows:
P j = 1 exp [ ς exp ( γ h h b h r e ) ]
where h r e denotes the designed flood prevention height, h b is the ground clearance of the equipment, γ represents the damping coefficient and ς is the attenuation coefficient.
The total failure rate of transmission lines under rainstorm disasters can be derived from the failure rates induced by strong wind and waterlogging, namely:
P z = 1 ( 1 P f ) ( 1 P j )
The distribution network model is divided into grids with fixed unit areas to calculate the fault probabilities of transmission lines and nodes affected by extreme weather in different regions and time periods. The Monte Carlo simulation is utilized to generate numerous rainstorm scenarios with varied wind speeds and precipitation across zones, and a threshold of failure rate is preset; a fault is confirmed once the calculated value exceeds the threshold. On this basis, the disaster environment of distribution networks under rainstorm disasters is established.

2.2. Rapid Fault Restoration Strategy of Power System Considering MOMBs

The practical deployment of MOMBs faces multi-dimensional actual costs and stringent operational constraints. In terms of deployment, one-time and periodic comprehensive costs cover equipment procurement, pre-disaster pre-positioning, cross-regional road transportation, on-site operation and maintenance staffing, and other expenditures. The configured quantity of bases and the energy storage capacity of each unit directly raise the overall investment cost. For operational aspects, MOMBs are subject to inherent equipment constraints including self-charging/discharging power, state of charge, and continuous power supply duration. They are also restricted by power grid constraints such as the maximum access capacity of distribution network nodes, radial topology of post-disaster islands, and branch power flow limits. Meanwhile, road waterlogging and traffic blockages triggered by rainstorm waterlogging disasters prolong transportation time, hinder the timeliness of MOMBs arriving at fault zones, and thereby delay the restoration of critical loads. In practical engineering, it is necessary to comprehensively balance the resilience gains from improved emergency power supply against full-cycle scheduling and procurement costs, so as to select a configuration scheme that balances economic efficiency and disaster prevention performance.

2.2.1. Evaluation Indicators for Power Grid Resilience Restoration

To comprehensively quantify the impacts of mobile operation and maintenance base dispatching and distribution network reconfiguration on power restoration performance under inland flooding disasters, this paper proposes a distribution network resilience assessment method covering in-disaster and post-disaster periods. For the in-disaster resistance phase, index I 1 (load loss rate) is defined to characterize the distribution network’s pre-event defense capability against extreme disasters. For the post-disaster restoration phase, index I 2 (unserved energy rate) is introduced to reflect emergency power supply capacity; meanwhile, restoration speed I 3 and restoration duration I 4 are formulated to quantify the synergistic performance of emergency restoration measures. Finally, the entropy weight method is adopted to assign weight coefficients to individual indicators and obtain the comprehensive resilience index I s Z of the distribution network under scenario s. The specific calculation formulas are given as follows [17]:
I 1 = i = 1 n t T 1 P i , t L C P i , t L × 100 %
I 2 = 1 t T 2 L t L T t × 100 %
L t = i = 1 n w Ω w w i , w L P i , w , t L
I 3 = i = 1 n t T 2 P i , t L T P i , t L C T 2 × 100 %
I 4 = T 2
I s Z = j = 1 4 w j , s X j , s
where T1 denotes the in-disaster resistance duration, T2 represents the time required for the distribution network to restore normal operation after disasters; P i , t L is the active power demand at node i at time t; P i , t L C represents the deficient active power (unsupplied load) at node i at time t; L T t is the equivalent system load under normal operating condition at time t; n is the total number of network nodes; L t denotes the weighted load at time t; ΩW is the set of load categories; w i , w L is the weight of load type w at node i, determined by the criticality of the corresponding load; P i , w , t L is the power magnitude of load w at node i at time t; P i , t L T is the total load demand of node i at time t; w j , s refers to the weight of the j-th indicator under scenario s; and X j , s is the normalized value of the j-th indicator under scenario s.

2.2.2. Objective Function

The objective functions for each disaster period are specified as follows [23]:
F 1 = min t T 0 ( i = 1 n w = 1 z c L w i , w L ( P i , w , t L P i , w , t L C ) + i = 1 n c M E a i , 0 M E )
F 2 = min t T 1 ( i = 1 n w = 1 z c L w i , w L ( P i , w , t L P i , w , t L C ) )
F 3 = min t T 2 ( i = 1 n w = 1 z c L w i , w L ( P i , w , t L P i , w , t L C ) ) + i j Ω L c L S ( R i j I i j , t 2 )
where F 1 , F 2 , F 3 correspond to the objective functions of pre-disaster, in-disaster and post-disaster stages respectively; T0 is the duration of the pre-disaster prevention period; z denotes the total number of load types; c L is the penalty cost per unit of curtailed active load; c M E represents the unit deployment cost of MOMBs; c L S is the unit cost of line power loss; a i , 0 M E is a binary 0–1 variable indicating whether a MOMB is installed at node i before disaster; ΩL stands for the set of distribution branches; R i j is the resistance of the branch between node i and node j; I i j , t 2 is the squared magnitude of branch current between node i and node j at time t.

2.2.3. Operational Constraints

(1)
Power Balance Constraints
Regulation of distributed generations facilitates post-disaster power supply restoration of distribution networks. Micro gas turbines can provide flexible regulation capability during grid operation. Moreover, islanded operation enabled by distributed generations has become a vital measure for fault disposal of distribution networks after disasters.
i = 1 n u = 1 x P i , u , t R + i = 1 n ( P i , t M E , D P i , t M E , C ) + P t B U Y + i = 1 n v = 1 y P i , v , t G = i = 1 n w = 1 z ( P i , w , t L P i , w , t L C )
where P i , u , t R is the active power output of the u-th distributed renewable generation at node i at time t; P i , v , t G denotes the active power output of the v-th micro gas turbine at node i at time t; P i , t M E , C and P i , t M E , D represent the charging and discharging active power of MOMBs installed at node i at time t, respectively; P t B U Y is the purchased active power of the distribution network at time t; x is the total quantity of distributed renewable generations; and y is the total number of micro gas turbines.
(2)
Constraints on Generation Unit Operation
It is assumed that the forecast errors of distributed renewable generations follow a zero-mean normal distribution. Meanwhile, fast power regulation technology of distributed generations is adopted to restrict the output uncertainty of renewable sources. Accordingly, the output power constraints for distributed renewable generations are expressed as:
Δ P i , u , t R P i , u , t R P i , u , t R f Δ P i , u , t R +
Q i , u , t R P i , u , t R tan ( cos 1 φ i )
where Δ P i , u , t R + and Δ P i , u , t R are the positive and negative forecast deviations of active power output for the u-th distributed renewable generation at node i at time t, respectively; P i , u , t R f and P i , u , t R denote the predicted and actual active power output of the u-th distributed renewable generation at node i at time t; Q i , u , t R is the reactive power output of the u-th distributed renewable generation at node i at time t; φ i represents the power factor of loads at node i.
(3)
Constraints on MOMB Operation
With flexible scheduling capability, MOMBs can improve the redundancy of distribution networks in post-disaster periods and facilitate fault restoration. After receiving scheduling orders, MOMBs select the optimal traveling route with the minimum transit time considering the travel speed limitation caused by urban waterlogging. Once connected to the grid, the MOMBs perform charging and discharging operations subject to the following constraints:
k Ω 0 a i , k , t M E = a i , 0 M E
i Ω s a i , k , t M E 1 k Ω 0
μ i , t M E , C + μ i , t M E , D i Ω s a i , k , t M E a i , k , t + 1 M E k Ω 0
a i , k , t M E Z a i , k , t M E a i , k , t M E Z a i , k , t + 1 M E a i , k , t M E Z a i , k , t M E + a i , k , t + 1 M E 1 μ i , t M E , C + μ i , t M E , D i Ω s a i , k , t M E k Ω 0
where a i , k , t M E and a i , k , t + 1 M E are binary 0–1 variables indicating whether the k-th MOMB is connected to node i at time t and t + 1, respectively; a i , k , t M E Z denotes an intermediate binary 0–1 variable for the connection status of the k-th MOMB at node i from t to t + 1; μ i , t M E , C and μ i , t M E , D represent the charging and discharging coefficients of MPMBs at node i at time t; Ω 0 is the set of MOMBs. The travel time variable for MOMBs to reach fault nodes is incorporated into the proposed model to indirectly characterize the uncertainty of road traffic under extreme rainstorm disasters. The travel time for MOMBs to arrive at each load node can be dynamically adjusted according to the waterlogging depth and road passability, which equivalently reflects the stochastic transportation impacts brought by road congestion and travel delays.
(4)
Distribution Network Power Flow Constraints
The DistFlow model is adopted in this paper to formulate the power flow of distribution networks. The detailed constraints concerning power balance, nodal voltage and branch power flow of the distribution network are given as follows [15]:
( P j , t L P j , t L C ) P j , t R P j , t G ( P j , t M E , D P j , t M E , C ) + j k Ω L P j k , t = i j Ω L P i j , t i j Ω L ( R i j I i j , t 2 )
j k Ω L ( Q j k , t + ( Q j , t L Q j , t L C ) Q j , t R Q j , t G Q j , t B S ) = i j Ω L Q i j , t i j Ω L ( X i j I i j , t 2 )
U i , t 2 U j , t 2 = 2 ( R i j P i j , t + X i j Q i j , t ) ( R i j 2 + X i j 2 ) I i j , t 2
P i j , t 2 + Q i j , t 2 = I i j , t 2 U i , t 2
0 I i j , t 2 I i j , max 2
U i , min 2 U i , t 2 U i , max 2
where P i j , t , Q i j , t , P j k , t , Q j k , t denote the active and reactive power flowing from node i to j and from node j to k at time t, respectively; P i j , t 2 and Q i j , t 2 are the squares of active and reactive power transmitted from node i to j at time t; X i j , R i j 2 , X i j 2 represent the reactance of the branch between node i and node j, together with the squared resistance and squared reactance of the branch; I i j , max 2 is the upper limit of squared current magnitude for the branch connecting node i and node j; U i , max 2 and U i , min 2 are the upper and lower bounds of squared voltage magnitude at node i.
(5)
Islanding Operation Constraints of Distribution Network
For islands formed after distribution network reconfiguration, the virtual generation concept is introduced to constrain the radial topology of each island and restrict the total number of islands generated via network reconfiguration.
i j Ω L a i j , t = N B i Ω s S i , t V S
k γ i F k i , t j δ i F i j , t = 1 F i , t V S
where a i j , t denotes the switch status of the branch between node i and node j at time t; S i , t V S is an introduced intermediate variable; F i j , t and F k i , t represent the virtual power on the branches between node i-j and node k-i at time t, respectively; F i , t V S stands for the virtual power at node i at time t; γ i and δ i are the sets of parent nodes and child nodes of node i, respectively. At the load level, it is assumed that the power of all types of loads remains constant during fault periods. Critical loads are assigned a priority for restoration, and the inherent voltage dynamic regulation characteristics of loads are not considered temporarily. At the distribution network operation level, a simplified power flow model for single-phase radial distribution networks is adopted. Three-phase unbalance and harmonic losses on branches are neglected. The voltage at each node and power flow on each branch strictly comply with the safety operation limits of distribution networks, and real-time power balance is maintained within each island after island partitioning.
For the operation assumptions of the MOMB itself: Fixed upper and lower limits are imposed on the charging and discharging power of the base energy storage system. The continuous single power supply duration is constrained by the residual energy storage capacity. No capacity degradation or loss of energy storage is considered, and no electric energy stored is consumed during transportation.

2.3. Solution Method Based on Improved Whale Optimization Algorithm

The whale optimization algorithm (WOA) is an intelligent optimization algorithm inspired by the predatory behavior of humpback whales using bubble-net feeding. With few adjustable parameters, this algorithm achieves high computational efficiency while guaranteeing the quality of optimal solutions. The optimization search for the optimal solution in WOA consists of three core searching strategies: shrinking encircling mechanism, spiral update hunting and random global search, and its detailed implementation procedure can be referred to the relevant literatures. Despite the merits of simple framework and independence from derivative information, the conventional WOA is prone to trapping into local optima in the middle iteration stage when tackling complicated nonlinear and multi-constrained optimization problems; additionally, it suffers from inadequate precision in local exploitation at the late optimization phase. To remedy the above drawbacks, this paper improves the original WOA and proposes an improved whale optimization algorithm (IWOA) embedded with nonlinear control parameters and an adaptive weight mechanism. The mathematical expression of the adopted nonlinear parameter is given as follows:
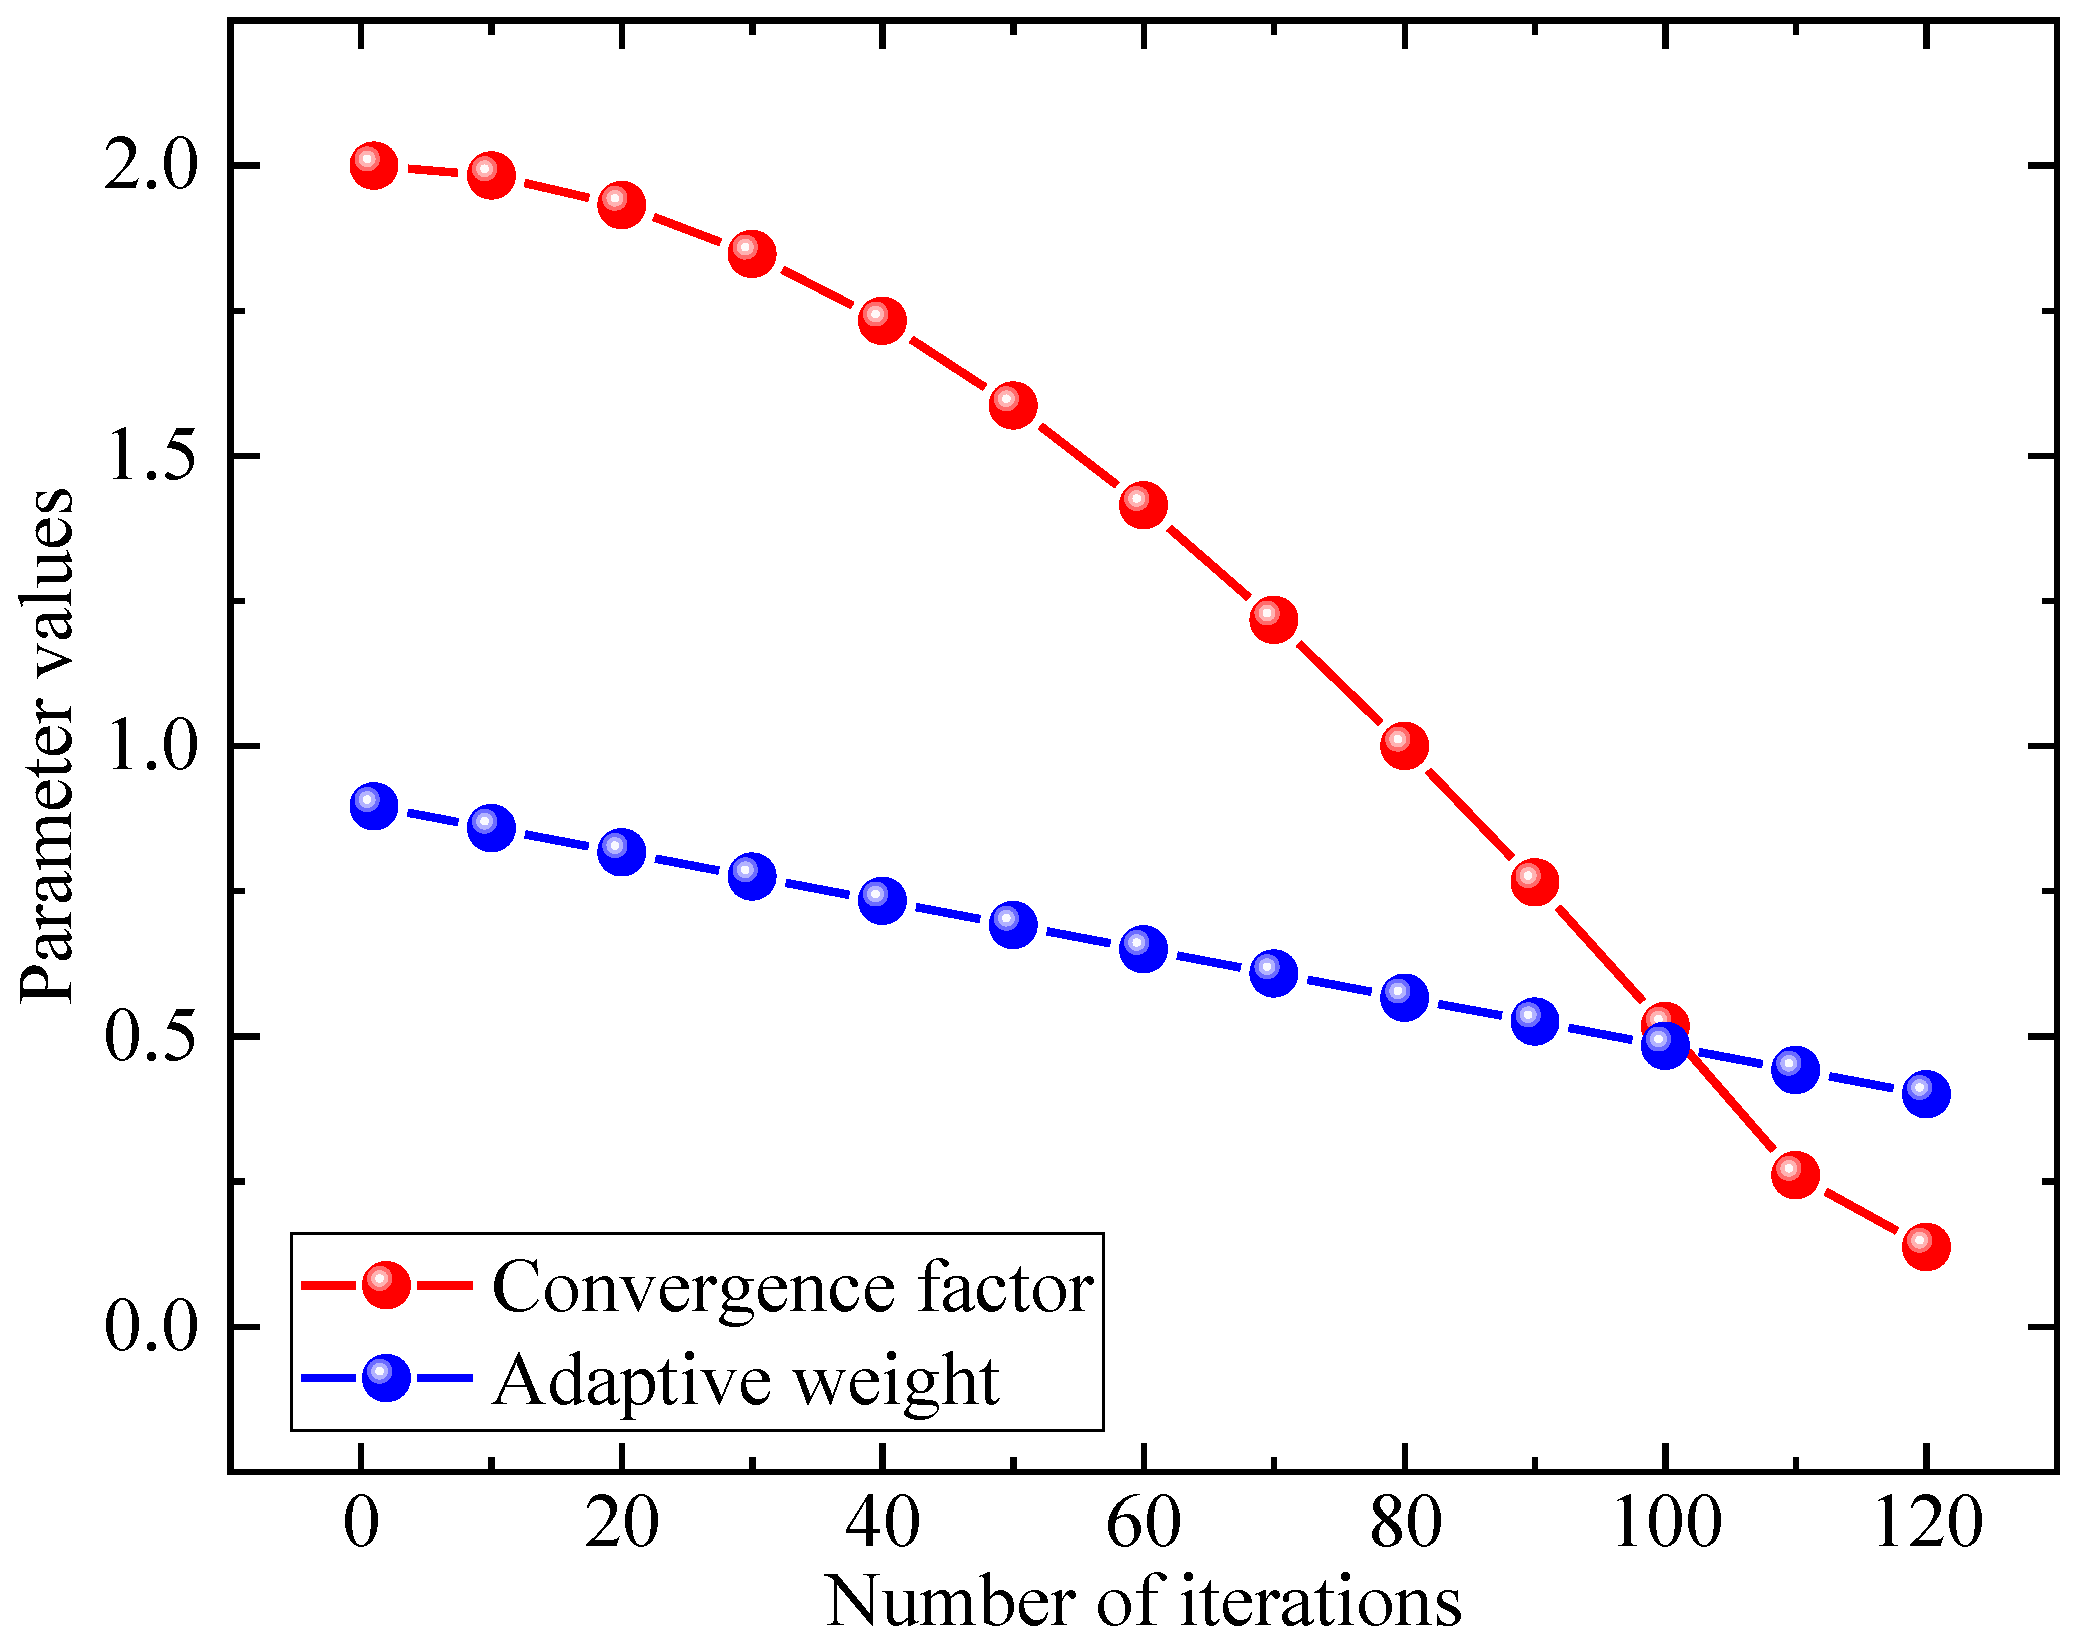
a = 1 + cos ( π t T max )
where a denotes the nonlinear convergence factor; t is the current iteration number; T max represents the maximum number of iterations. Compared with linear functions, the cosine function features a nonlinear descending trend with a slow drop in the early stage and a rapid decline in the middle and later periods.
The gentle descent at the initial phase strengthens the global jumping capability and preserves the wide exploration capacity of the algorithm; the fast decay during mid-to-late convergence improves the precision of local exploitation and accelerates convergence toward the optimal solution. To further enhance the search flexibility and jump performance of the algorithm, a dynamic adaptive weight w is introduced into the position update formulas for shrink encircling and spiral hunting in this work.
w = 2 cos ( π t 2 T max ) sin [ ( 1 π 4 ) t T max ]
X ( t + 1 ) = X * ( t ) w A D , ρ < 0.5 D e b l cos ( 2 π l ) + w X * ( t ) , ρ 0.5
where X ( t + 1 ) denotes the position vector of whale individuals after updating at iteration t + 1; X * ( t ) is the position vector of the optimal solution in the t-th iteration; A represents the coefficient vector; D stands for the distance vector between the whale individual and prey; b is the spiral shaping coefficient; l is a random number uniformly distributed over [−1, 1]; ρ denotes a random number within the range [0, 1].
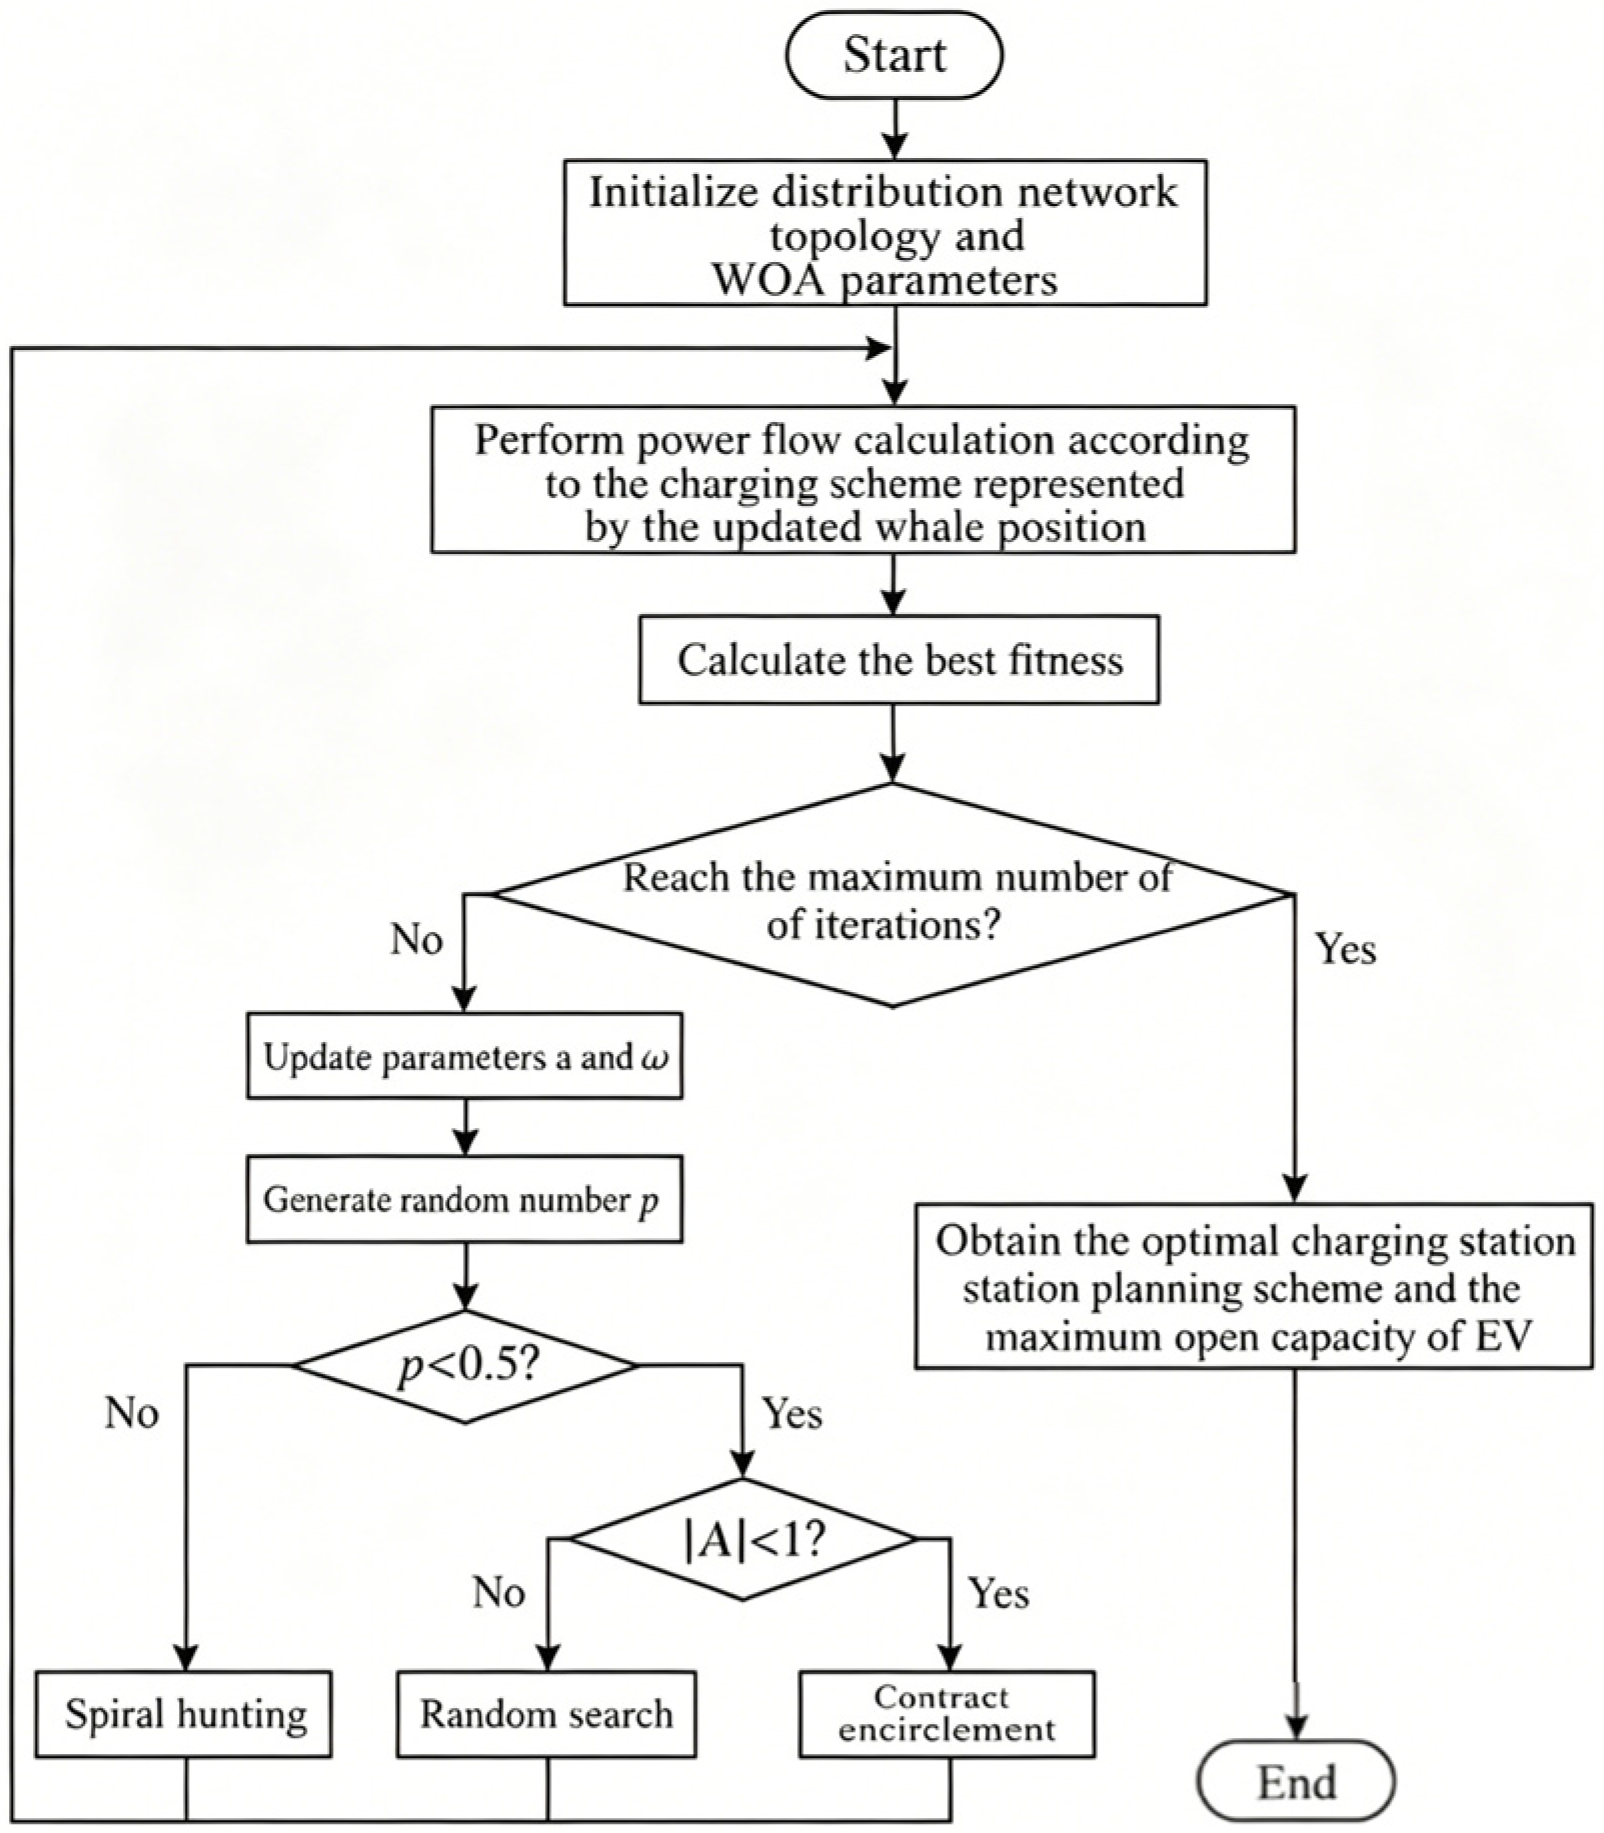
For better illustration, the solution flowchart is presented in Figure 1. When the IWOA adopted in this paper is applied to solve the model, the population size is uniformly set to 30, the maximum number of iterations is taken as 150, the spiral shape coefficient b is fixed at 1. The nonlinear convergence factor in the algorithm decreases nonlinearly from 1 to 0 with the number of iterations based on the cosine function. The dynamic adaptive weights are updated adaptively synchronously with the iteration process. The probability threshold p is set to 0.5 to distinguish global random search from local encircling and spiral hunting behaviors.

3. Case Study

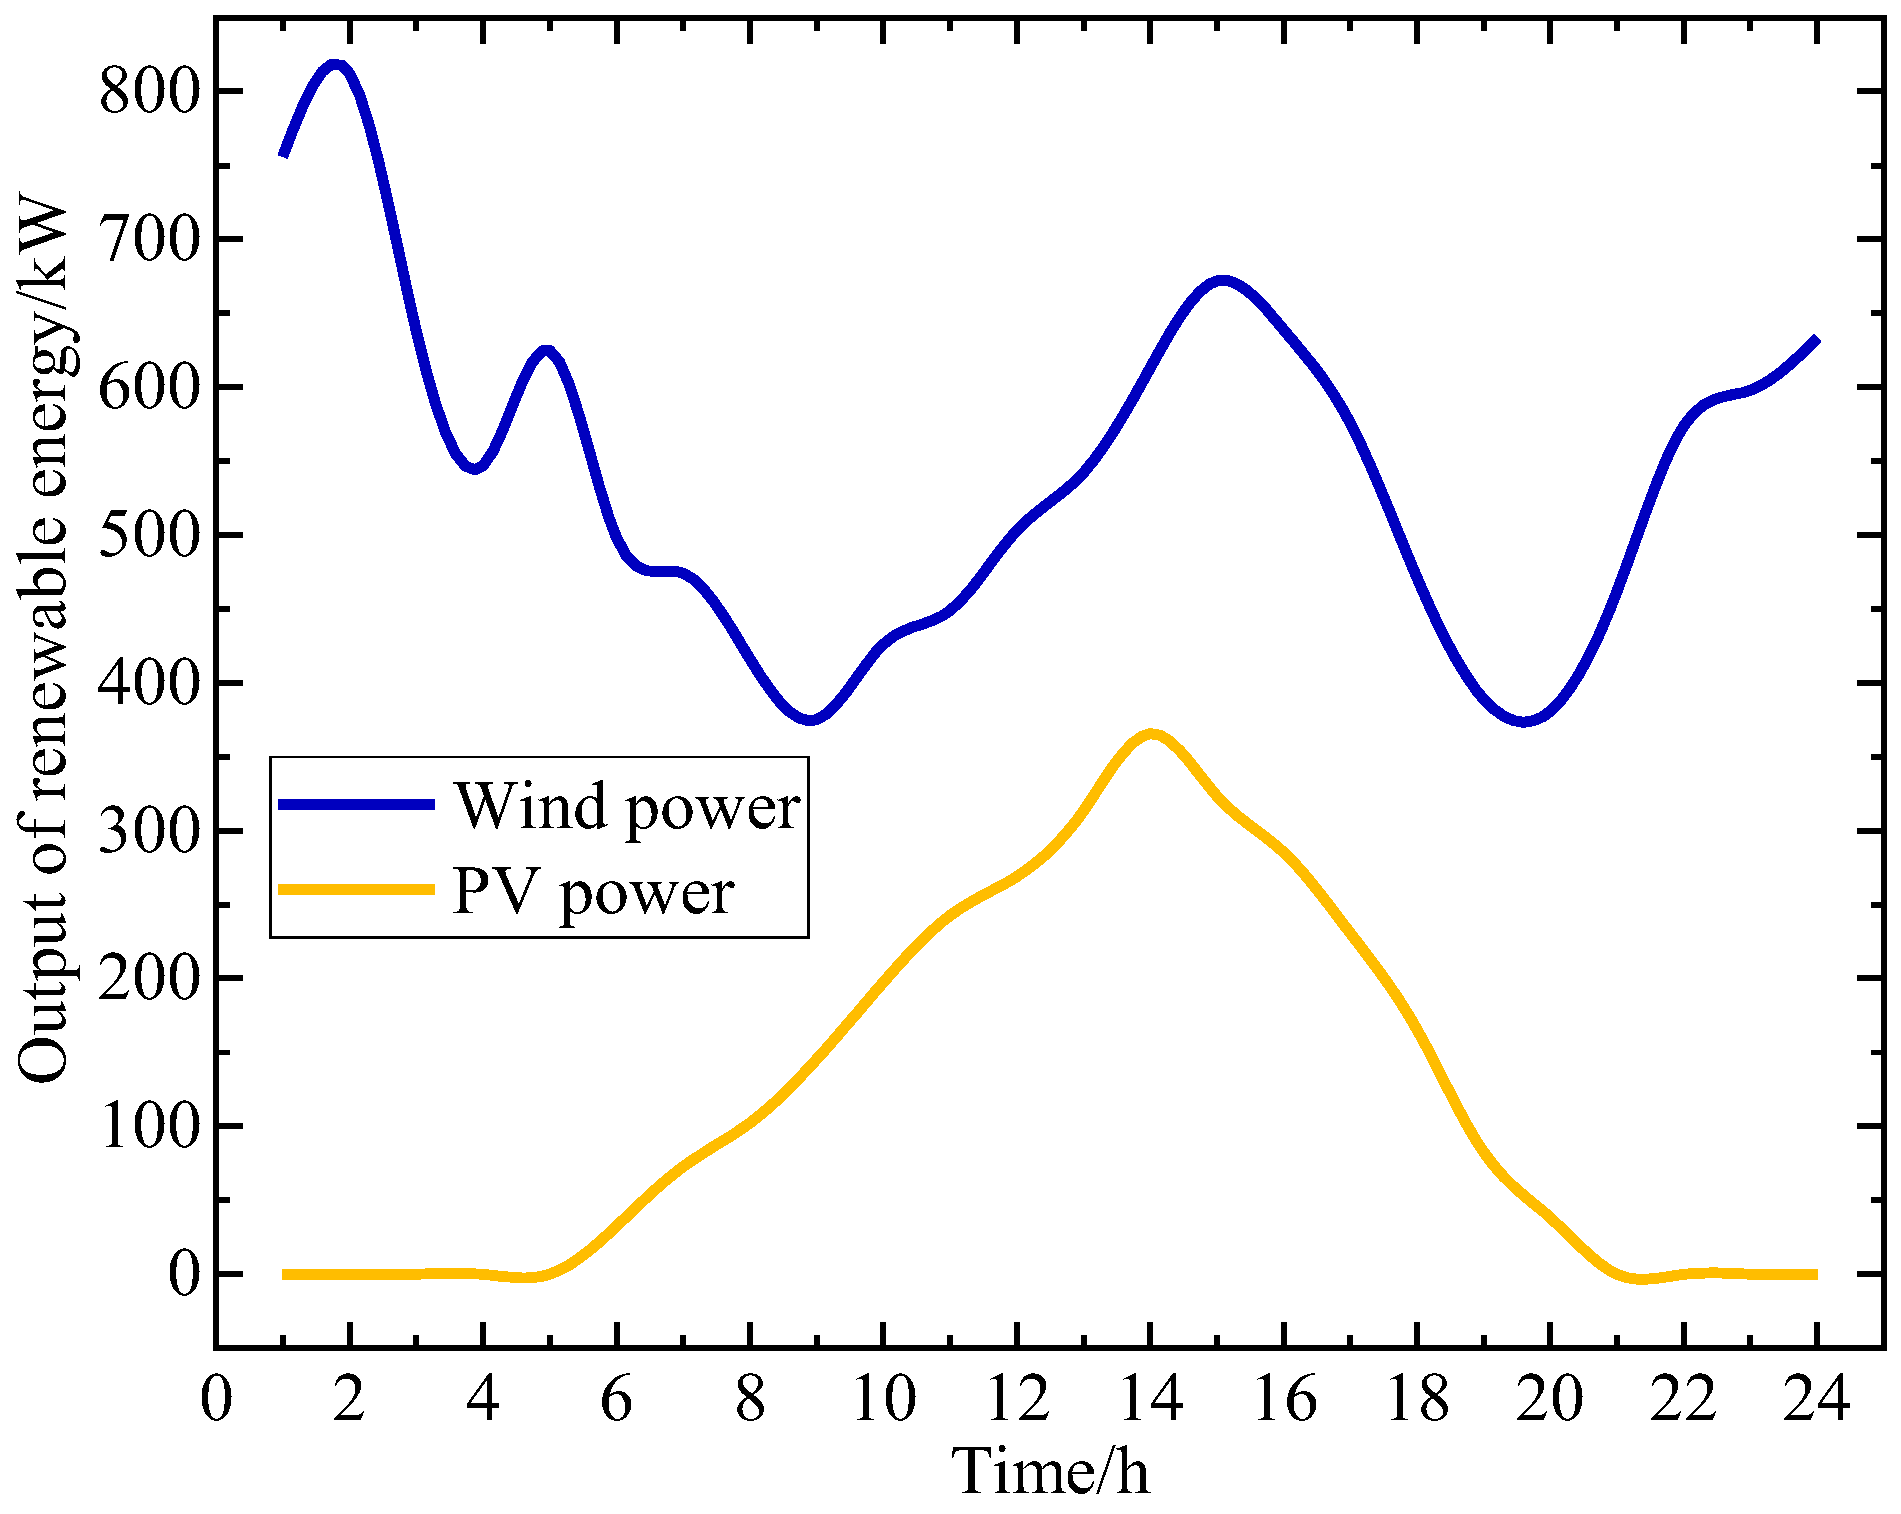
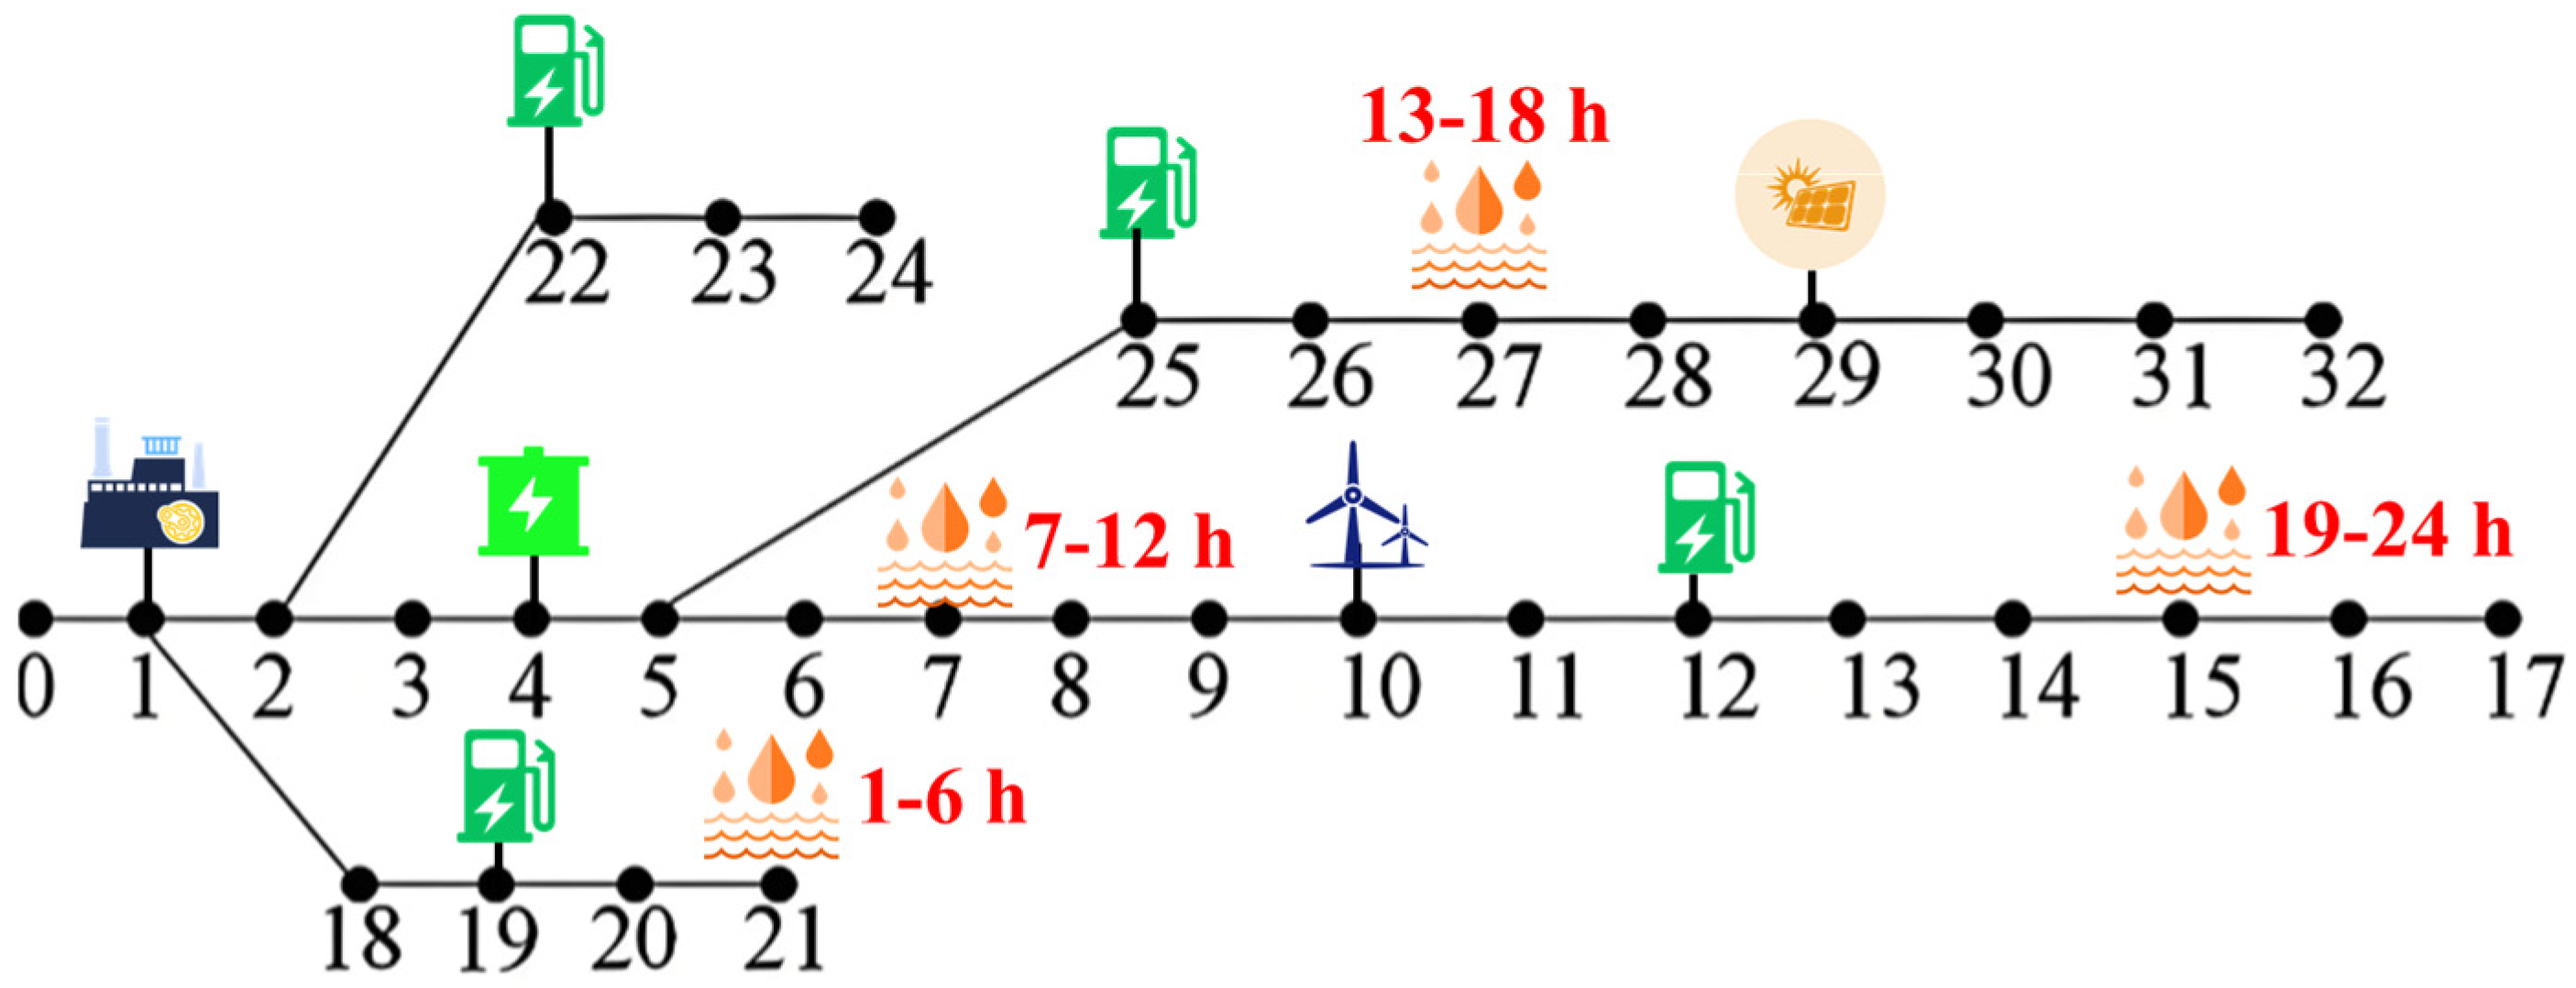
To verify the effectiveness and feasibility of the proposed method in this paper, a modified IEEE 33-bus test system is employed [26], whose topological structure is depicted in Figure 2. Three access points for mobile operation and maintenance bases are configured at Bus 12, Bus 22 and Bus 25. The IEEE 33-node test system is a standard three-phase balanced radial medium-voltage distribution network with a rated voltage of 12.66 kV. It adopts a single-source tree topology, consisting of 33 electrical nodes and 37 branches. Among these branches, 32 are equipped with normally closed sectionalizing switches, and 5 tie branches are fitted with normally open tie switches. Closing all tie switches enables the formation of five independent meshed networks, making the system suitable for simulation and verification of scenarios such as network reconfiguration and fault restoration. Node 1 serves as the slack node on the substation side with a reference voltage of 1.0 p.u., while the remaining 32 nodes are all PQ load nodes. The total active load of the entire network is 3715 kW, and the total reactive load is 2300 kvar. For distributed generation configuration, a distributed wind turbine unit is connected to Node 10 with a maximum rated active power output of 1.2 MW, and the output prediction deviation range is set to ±12% of the rated power. A distributed photovoltaic unit is installed at Node 29 with a rated peak output of 0.9 MW, and its adjustable power factor ranges from 0.9 lagging to 0.9 leading. A micro gas turbine is equipped at Node 1 as the backup emergency power supply, with an active power regulation range of 0–1.5 MW and a reactive power output regulation range of −0.6–0.6 Mvar. The Chicago rainfall pattern model is used to simulate rainfall, with the peak ratio r = 0.45. The rainfall intensity constants a, b and c are assigned values of 22, 10 and 0.03 respectively, and the regional runoff curve number is set to 68. The uniform flood prevention reference height of all equipment is 0.3 m, the damping coefficient of water depth is 0.12, and the attenuation coefficient is 0.85. The mean flexural strength of line towers is 320 kN·m with a standard deviation of 42 kN·m, used to calculate the line fault probability under the coupling effect of strong wind and waterlogging. The Monte Carlo sampling fault threshold is set to 0.3. Regarding the operation parameters of mobile operation and maintenance bases, the maximum charging and discharging power of a single device is 0.5 MW, and the charging and discharging efficiency ranges from 0.92 to 0.96. The transit delay of equipment cross-regional transportation is constrained by the vehicle speed on waterlogged urban roads, with an allowable driving speed range of 5–20 km/h. For the cost parameters of the optimization objective, the penalty price for load shedding is set to 1200 $/MW, the unit deployment cost of mobile operation and maintenance bases is 850 $ per unit, and the unit loss cost of line power network loss is 0.45 $/kWh. The output power curves of distributed wind and photovoltaic generation are illustrated in Figure 3 [27]. The urban waterlogging rainfall process is divided into four periods with each period lasting six hours, and the buses affected by rainfall in each stage are Bus 21, Bus 7, Bus 27 and Bus 15 in sequence. All flow calculations, Monte Carlo fault scenario simulations, and iterative solving operations of the improved algorithm in this work are implemented via MATLAB R2024b.
The IEEE 33-node distribution network system is selected as the simulation case in this paper for the following reasons. This benchmark system features a moderate network scale and a distinct radial topological structure. Distributed photovoltaics, wind turbines, micro gas turbines, and multiple grid connection nodes for mobile operation and maintenance bases can be flexibly integrated into the system. Furthermore, multi-period and multi-region waterlogging-affected zones under heavy rain disasters can be divided to conform to the research background of emergency power supply under diverse scenarios.
By contrast, small-scale node test systems contain too few nodes and possess overly simplistic network structures. Such systems fail to simulate complex spatio-temporal coupling operating conditions, including time-phased waterlogging faults across multiple regions under heavy rain disasters, cross-regional transportation and scheduling of mobile operation and maintenance bases, and coordinated power output of various distributed power sources. They cannot fully reflect the resilience improvement brought by dynamic site selection of mobile operation and maintenance bases and distribution network island reconfiguration. For the above reasons, small-scale standard test systems are not adopted for verification in this work.
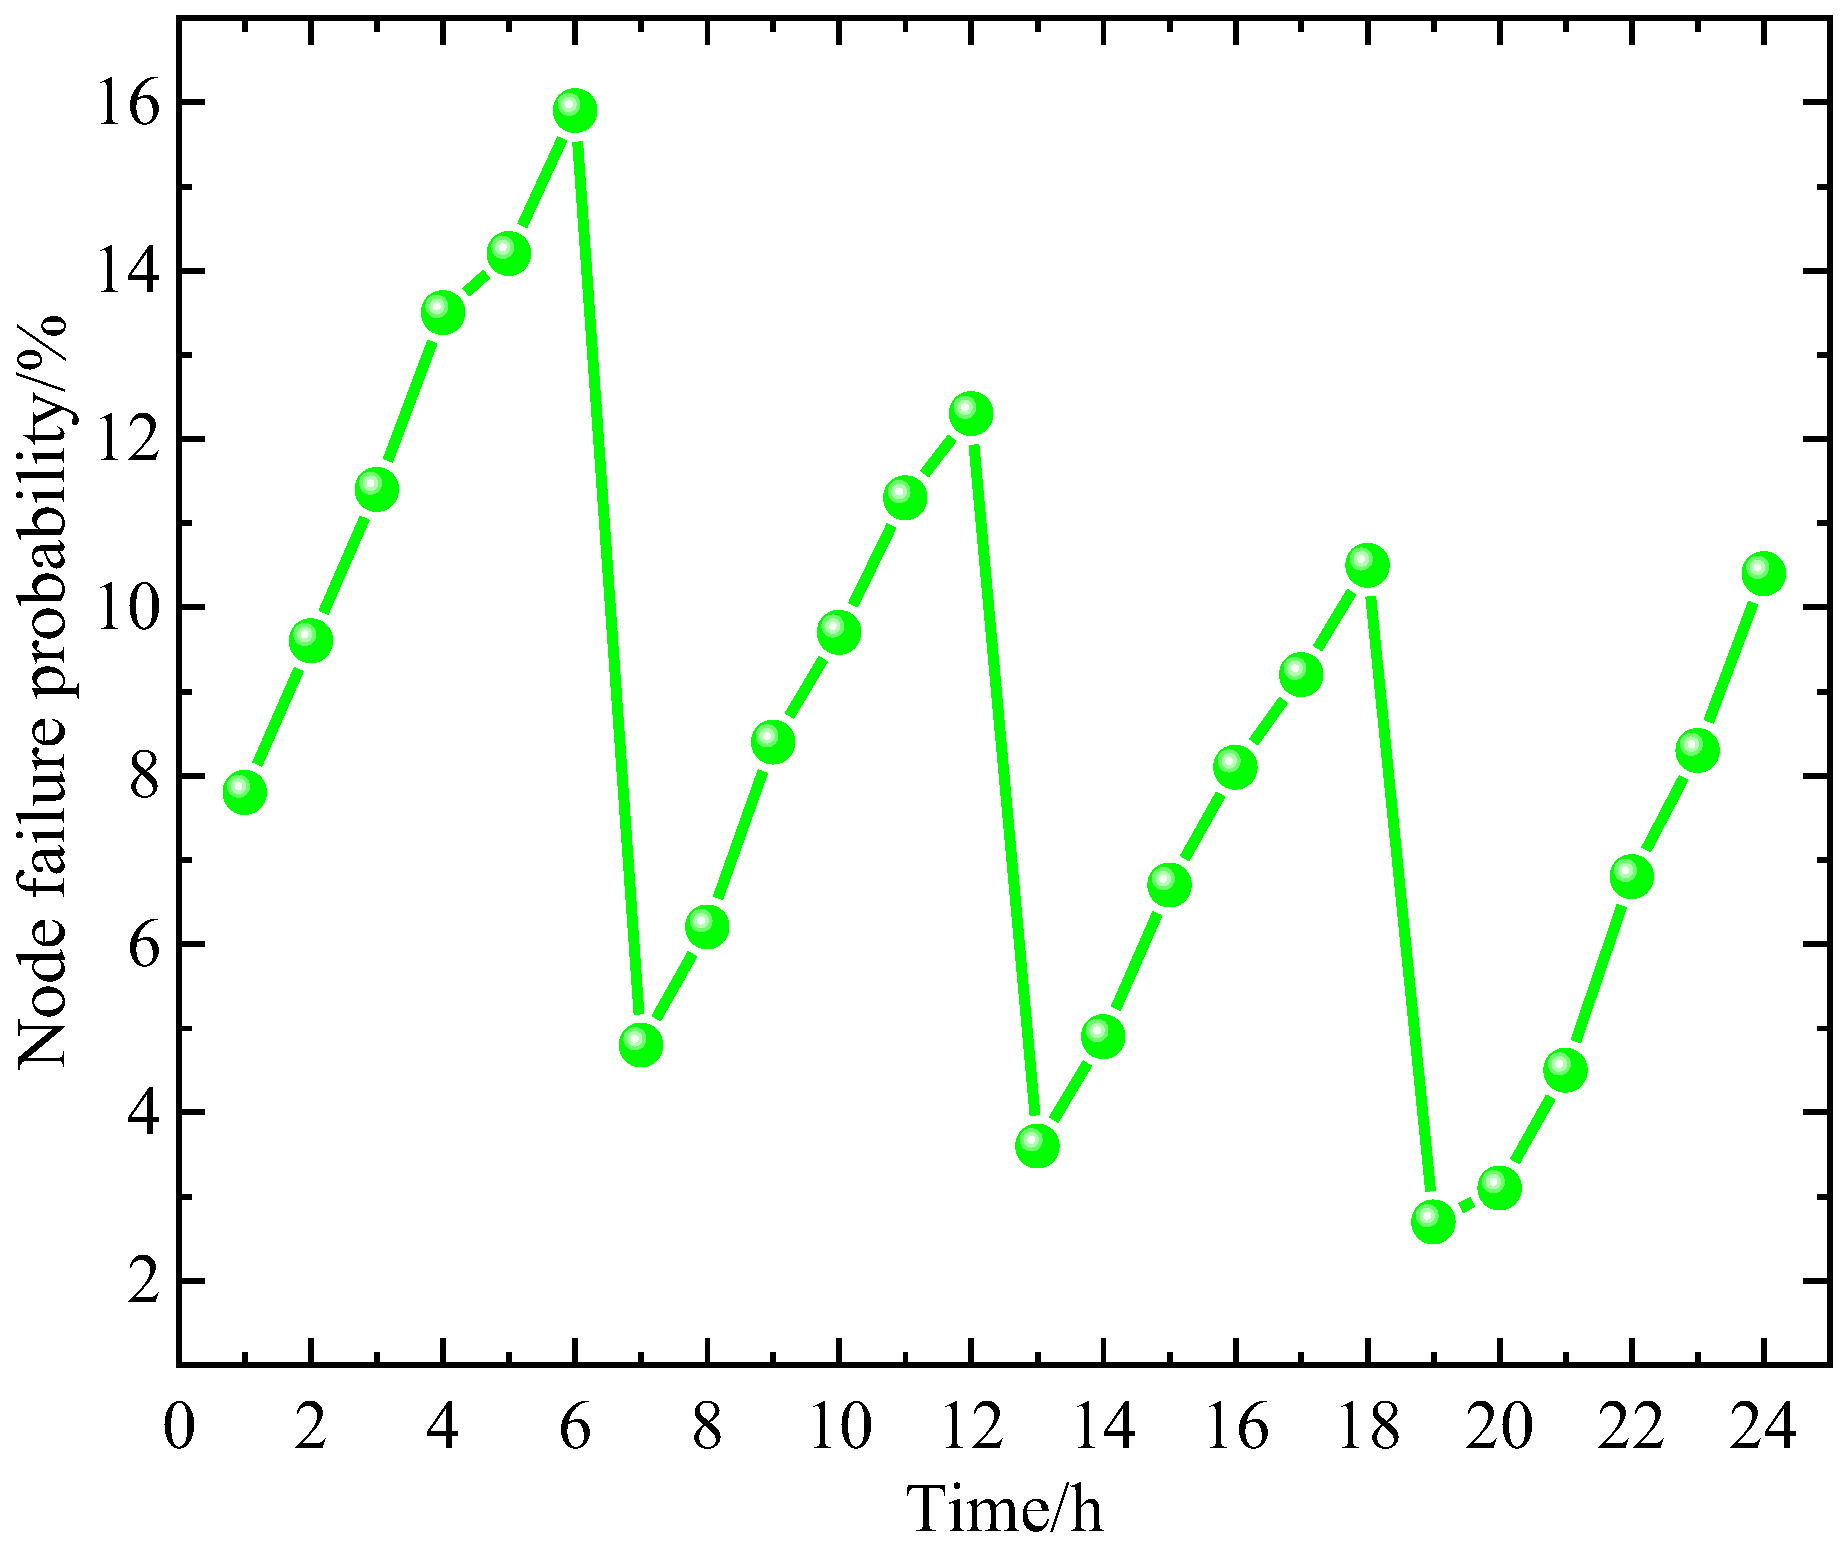
Figure 4 plots the variation curve of bus failure rate during the disaster. It can be observed that the failure probability of buses within the waterlogging-affected zone rises progressively throughout the disaster. During the urban waterlogging event, heavy rainfall triggers strong wind conditions on the one hand; wind loads acting on transmission towers, conductors and insulators easily lead to excessive mechanical stress on power components and raise the risk of mechanical damage to distribution lines. On the other hand, continuous ponding exceeds the predefined flood prevention and ground clearance height of distribution equipment, and the rising water depth exponentially increases the risk of electrical damage caused by submergence. The superposition of these two hazard factors impacts the regional distribution grid, synchronously increasing the outage likelihood of lines and power facilities in inundated areas and eventually leading to a notable growth in the overall failure probability of distribution network buses across the disaster-impacted region.
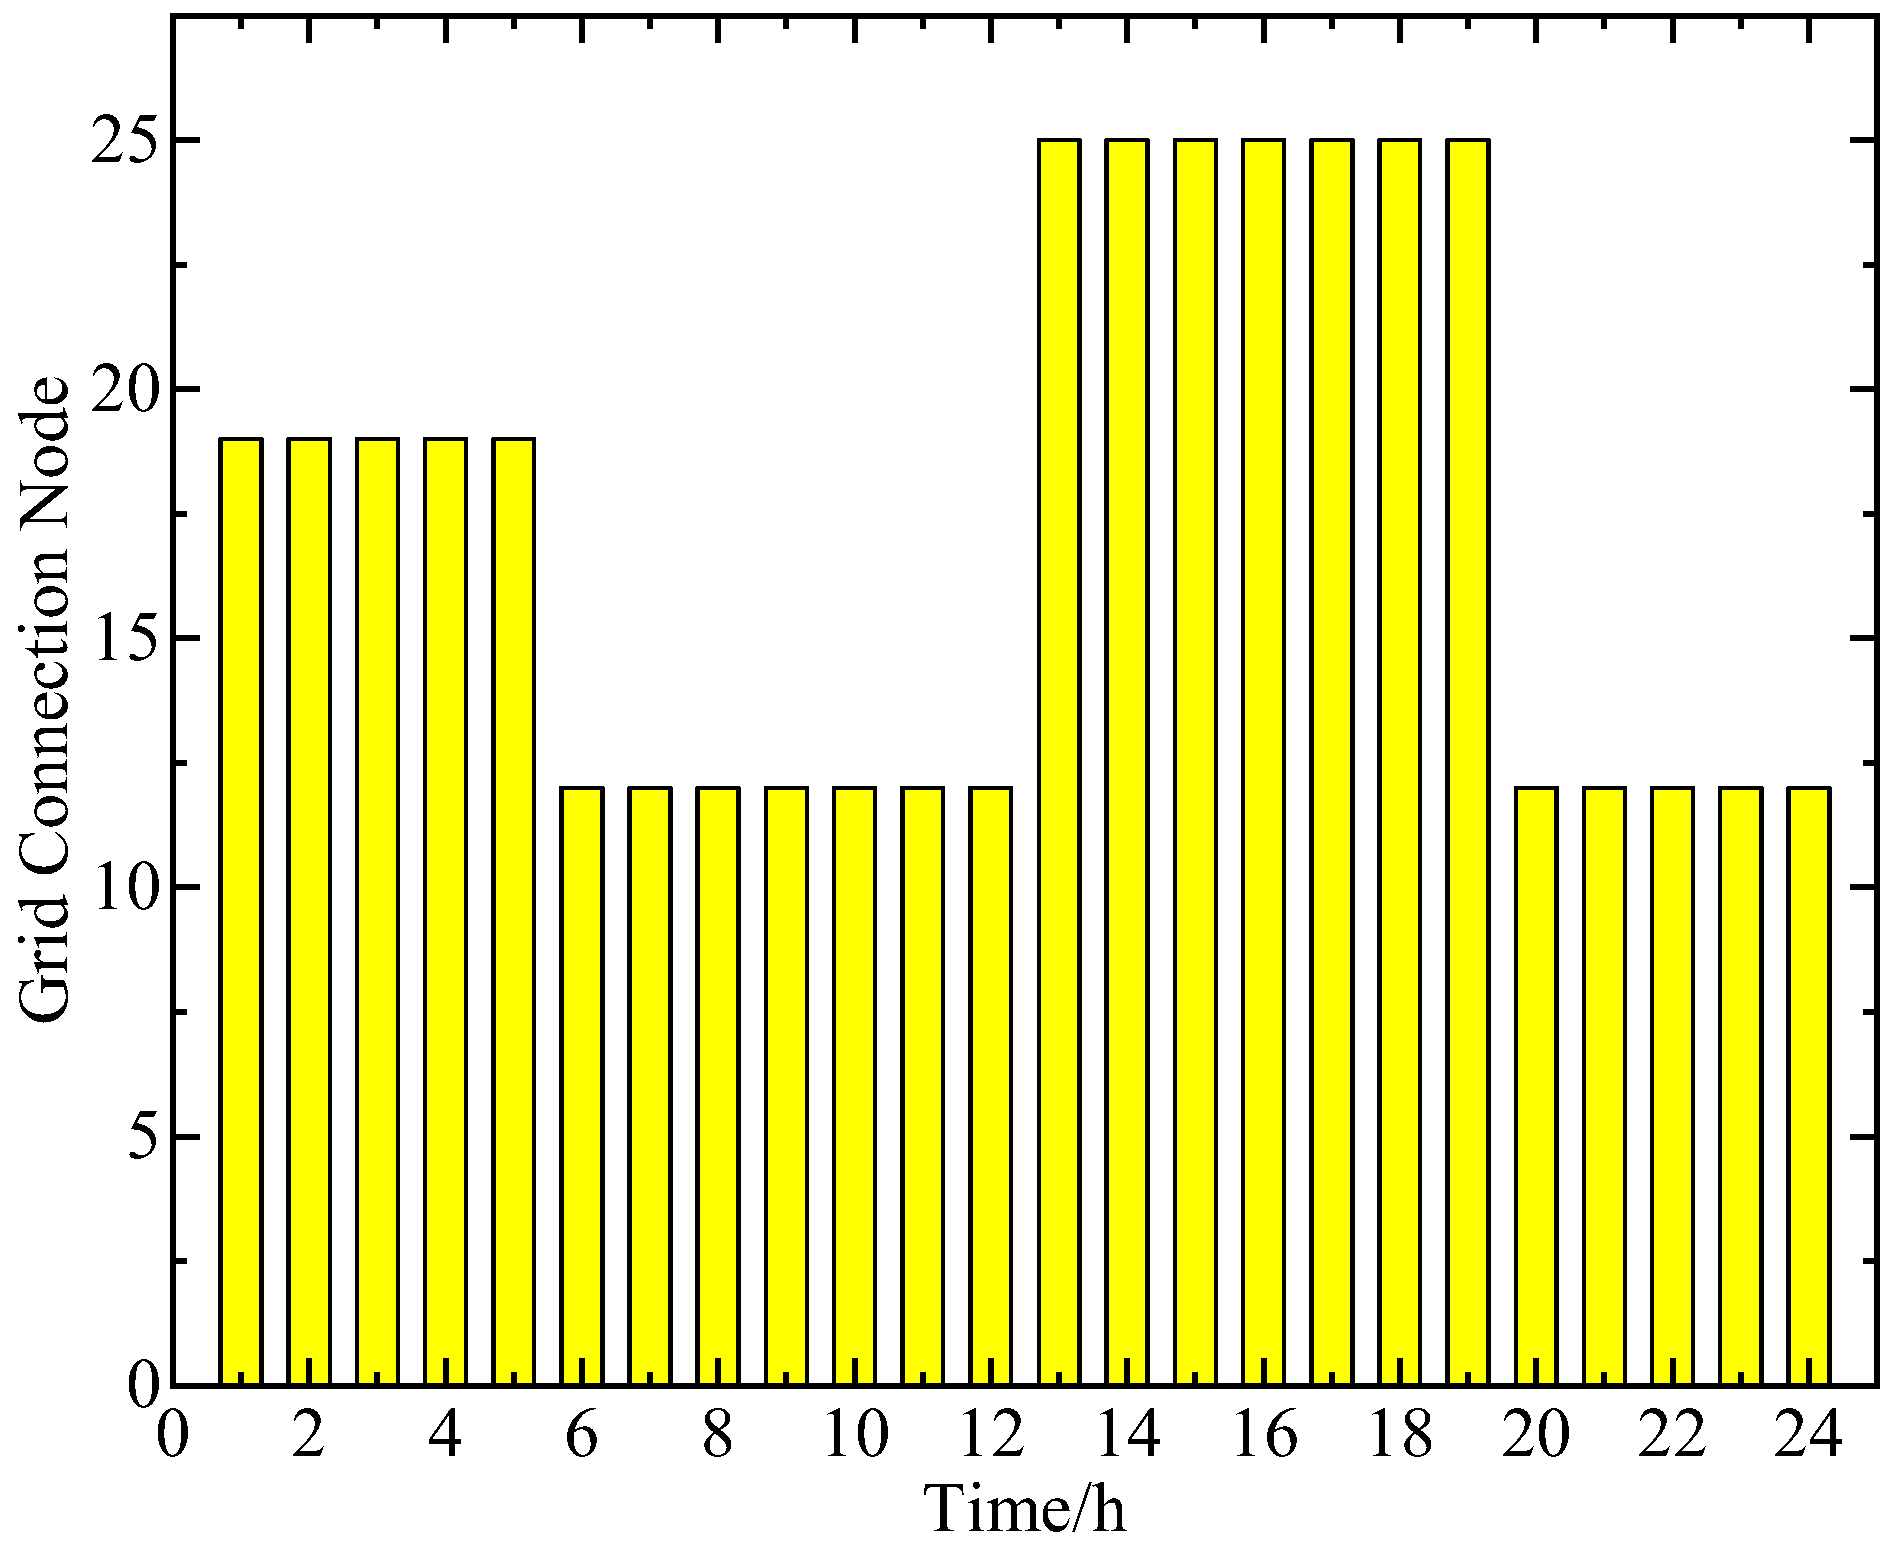
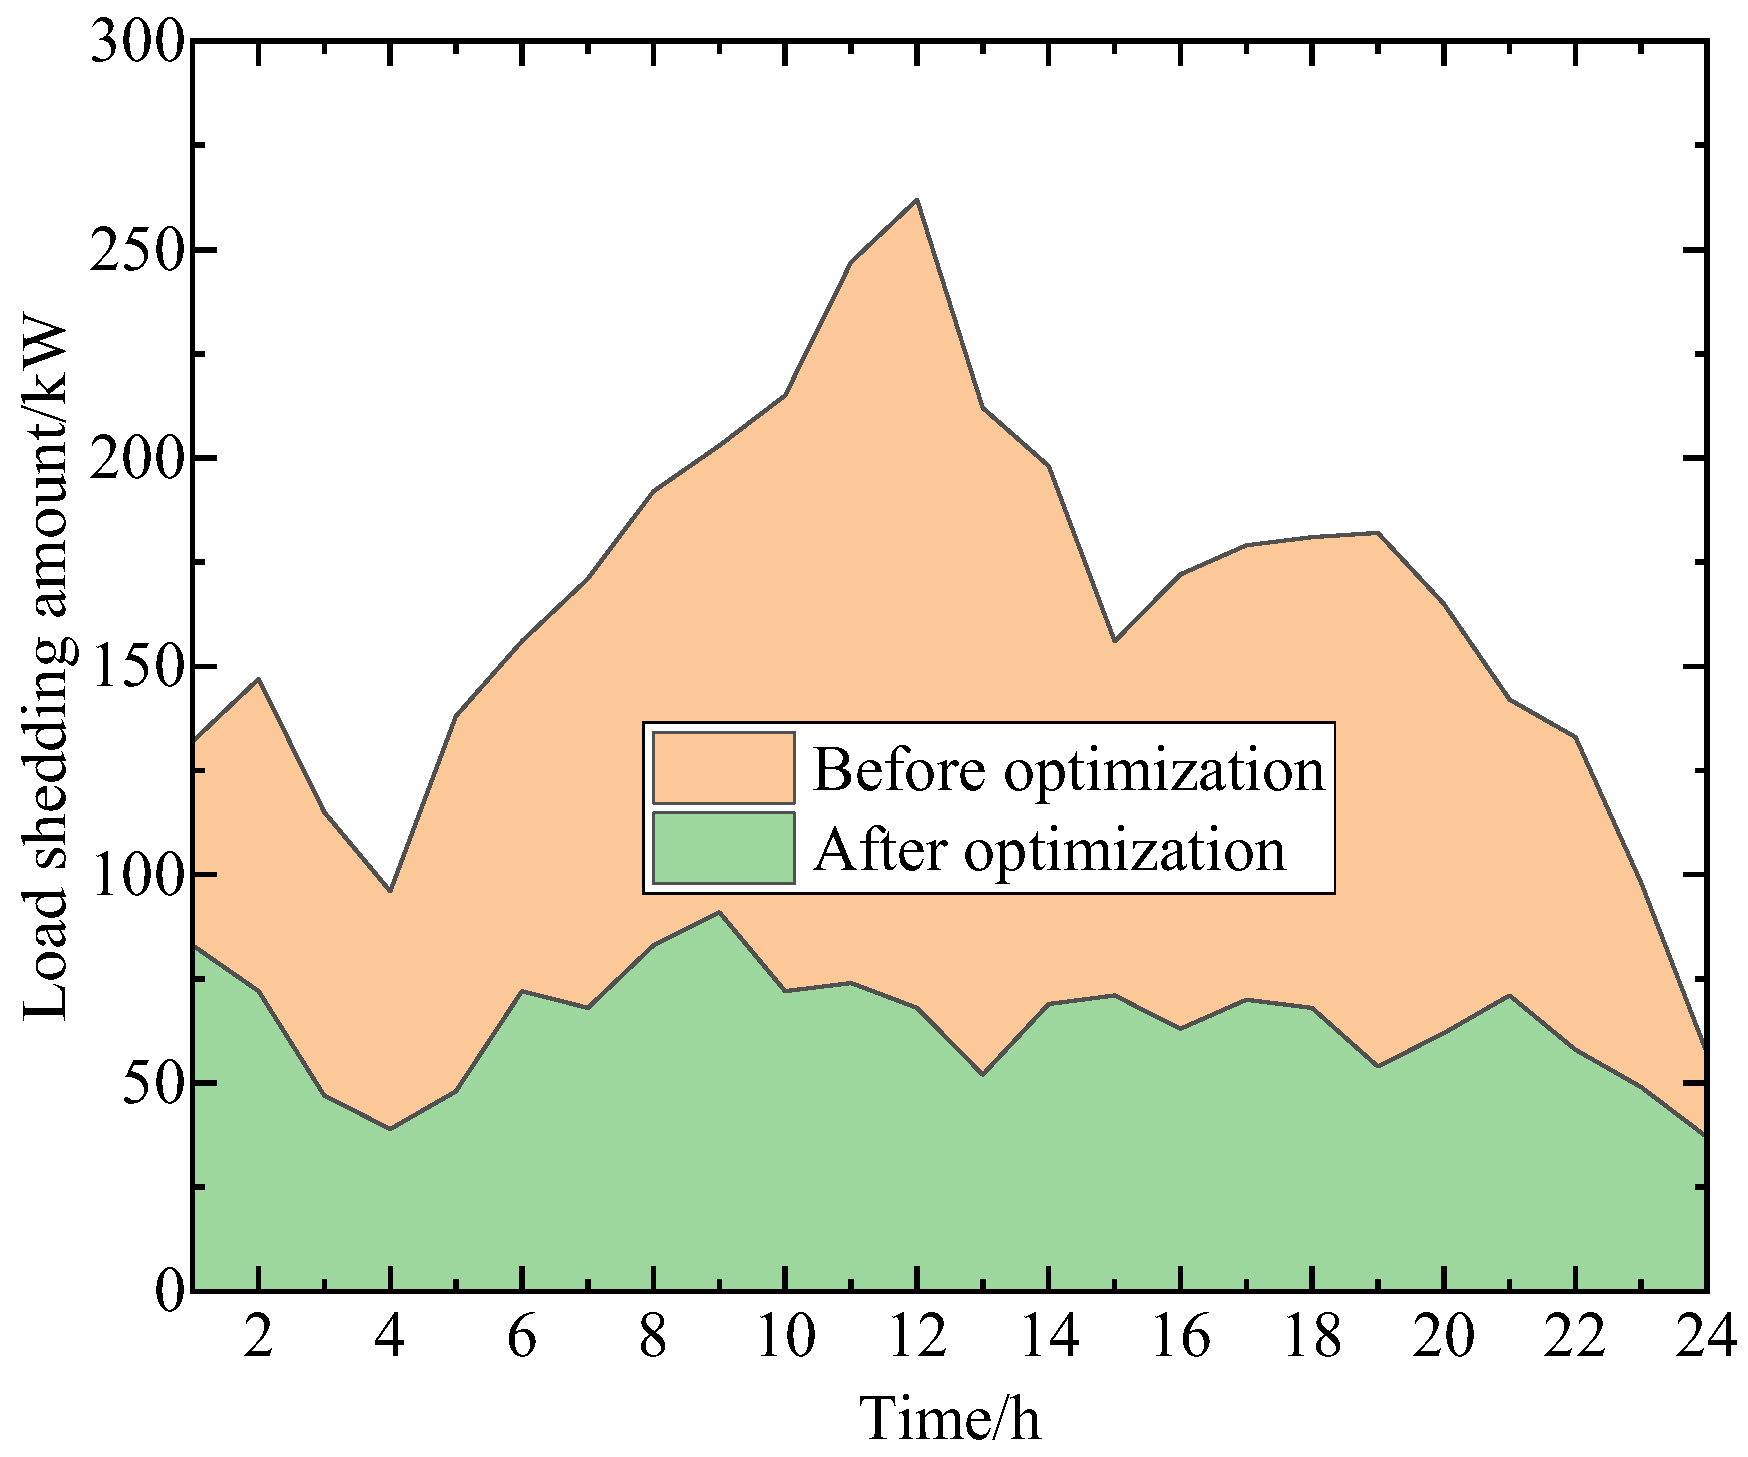
Figure 5 presents the dynamic grid-connected buses of MOMBs. Unlike fixed maintenance infrastructures, MOMBs possess cross-regional mobility via roadway transportation. In accordance with differentiated waterlogging fault scenarios obtained from Monte Carlo simulation, they can adaptively change grid connection positions matching the spatial distribution of damaged buses caused by ponding and gale winds in different time intervals. MOMBs can be pre-allocated to high-risk distribution buses for emergency standby before disasters, and their access locations can be dynamically modified during and post disasters according to actual regional power deficiency and load shedding conditions. Cooperating with distributed generations, MOMBs implement coordinated charge–discharge power regulation; meanwhile, their travel paths are optimized to cut down transit time toward fault-affected areas. With flexible spatio-temporal schedulability, MOMBs take part in distribution network island reconfiguration and power flow optimization. The outstanding scheduling flexibility reflected in access site selection, startup scheduling and power regulation enables the proposed scheme to accommodate complicated operating conditions under urban waterlogging, including randomly scattered network faults and time-varying load restoration requirements. Figure 6 presents comparative curves of the system’s total load loss over the entire time horizon before and after optimization, which intuitively demonstrates the reduction effect of the proposed spatio-temporal collaborative scheduling strategy for mobile operation and maintenance bases on post-disaster power supply shortages. Without multi-resource collaborative optimization, power supply solely relies on stationary distributed wind/photovoltaic units and micro gas turbines. Affected by line faults and equipment immersion failures induced by heavy rain and waterlogging, the total load loss remains at a high level at all time intervals. Obvious peak values of load loss appear during periods with frequent waterlogging faults (1–6 h, 7–12 h, 13–18 h, 19–24 h). The core reason is that stationary power sources cannot provide cross-regional support to disaster-affected isolated islands. Local power deficits can only be balanced via load shedding, resulting in an insufficient power supply guarantee for critical livelihood and industrial loads.
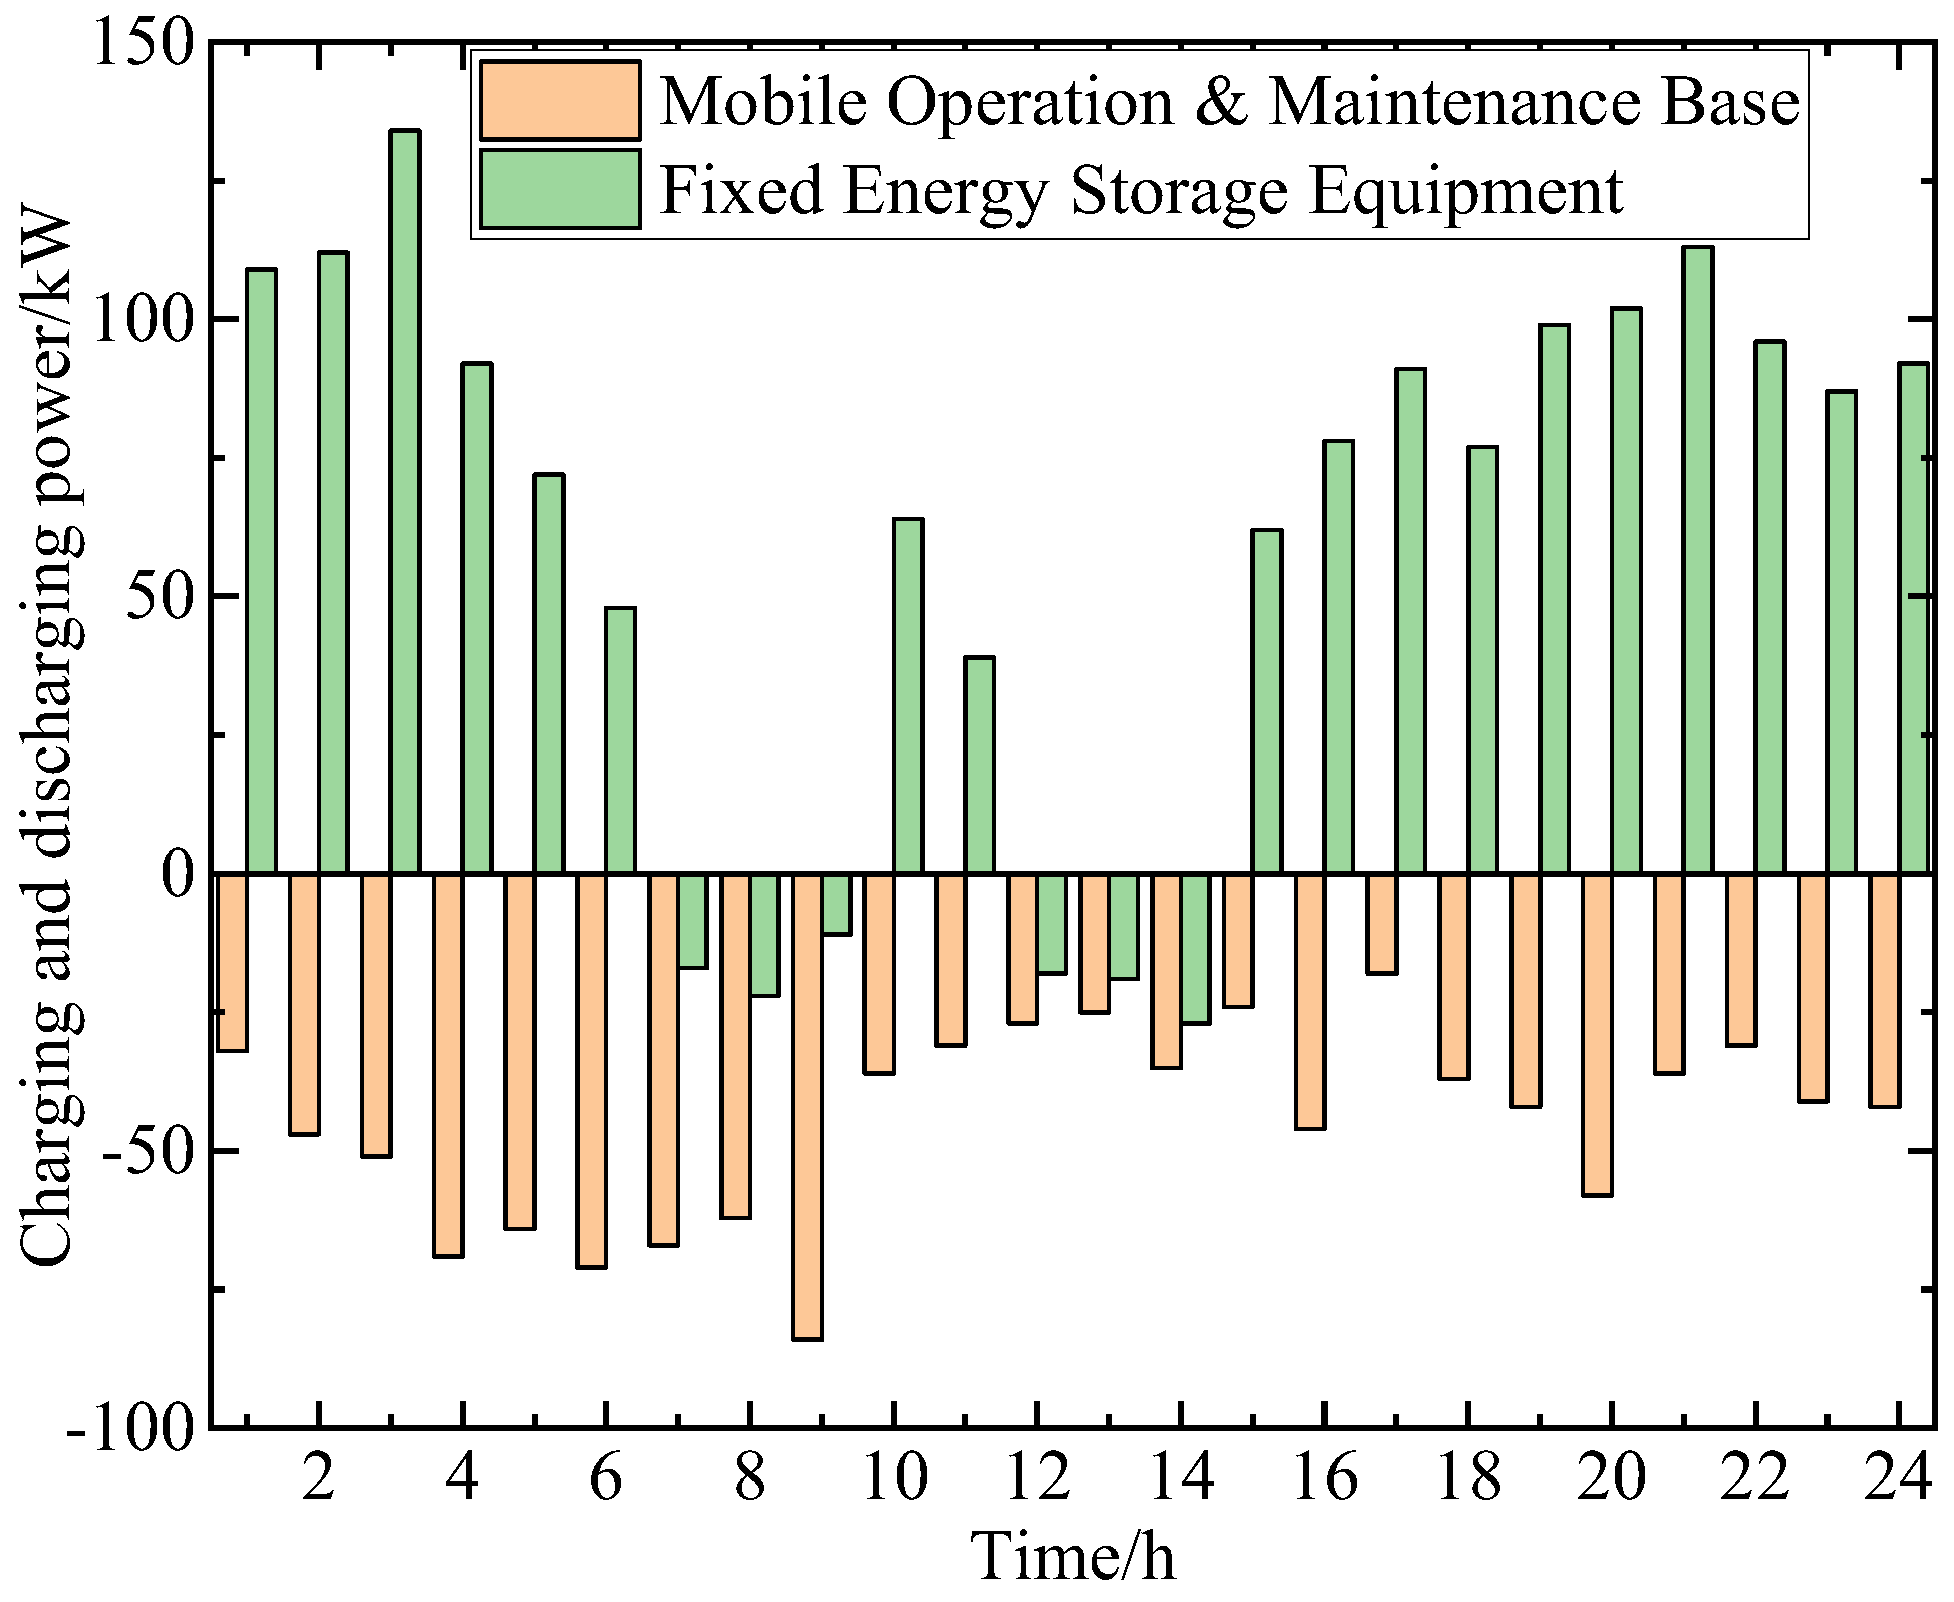
It can be observed from the above figures that the proposed optimization model takes advantage of the flexible cross-regional deployment and grid connection of MOMBs. Coordinated with the joint power output of distributed photovoltaic, wind power and micro gas turbines, the improved whale optimization algorithm is applied to realize multi-objective optimal scheduling. Under rainstorm-induced fault scenarios generated via Monte Carlo simulation, mobile energy storage vehicles are rationally dispatched to fault-affected buses to supplement power shortage through coordinated charging and discharging. Combined with distribution network island reconfiguration to optimize branch power flow distribution, the model fully taps the on-site power supply potential of distributed generations to compensate for disaster-caused power deficiency and drastically reduce load shedding for power balance. Furthermore, critical loads are prioritized for power supply subject to comprehensive resilience index constraints, resulting in an obvious reduction in total system load shedding. Figure 7 depicts the time-series power response characteristics of four types of flexible resources throughout the entire heavy rain disaster cycle: distributed photovoltaics, wind turbines, micro gas turbines and mobile operation and maintenance bases, clearly reflecting the regulation logic of complementary coordination among multiple resources. In the early rainfall stage (1–6 h), waterlogging faults first occur in local transformer areas. Distributed wind and photovoltaic power feature zero fuel consumption and fast response, so they operate at full output to support basic local loads. Nevertheless, daytime photovoltaic output fluctuates with illumination, and nighttime wind power output exhibits stochastic uncertainty, leading to insufficient power supply stability if relying on a single distributed power source. At this time, mobile operation and maintenance bases pre-deployed at high-risk nodes activate the discharge mode to smooth fluctuations in renewable energy output and compensate power shortages caused by the intermittency of wind and photovoltaic generation.
Fixed energy storage systems are restricted by pre-installed locations and cannot switch grid connection points, so their charging and discharging operations are only implemented locally at fixed buses and dominated by regional power supply–demand balance as well as network power flow. In contrast, MOMBs are transportable via road traffic and capable of switching access buses following the spatio-temporal distribution of faults induced by rainstorm waterlogging, enabling flexible off-site charge and discharge to remedy local power deficits in disaster-stricken areas. Such distinctions lead to remarkably different power regulation characteristics between the two facilities. When deployed collaboratively, fixed energy storage stabilizes routine output fluctuations of distributed generators and undertakes regular power regulation tasks, while MOMBs serve as mobile emergency resources to travel to faulty buses and make up power shortages after disasters strike. Based on the complementary mechanism between stationary and mobile resources, the proposed configuration leverages the low-cost long-term operation merit of fixed energy storage to reduce daily operational losses of the system, and exploits the flexible geographic deployment of MOMBs to alleviate localized power shortage under severe urban waterlogging, jointly improving the fault restoration efficiency and overall power supply resilience of the distribution network.
Among various heuristic evolutionary optimization algorithms, this paper selects the IWOA as the fundamental solving tool. The IWOA features a concise algorithm framework and few tunable parameters; it does not require derivative information of the objective function, making it suitable for the high-dimensional mixed-integer nonlinear optimization model established in this paper. The proposed model incorporates power flow constraints, island topology constraints, and spatio-temporal transportation constraints of mobile operation and maintenance bases, and the IWOA reduces the difficulty of model construction and programming implementation.
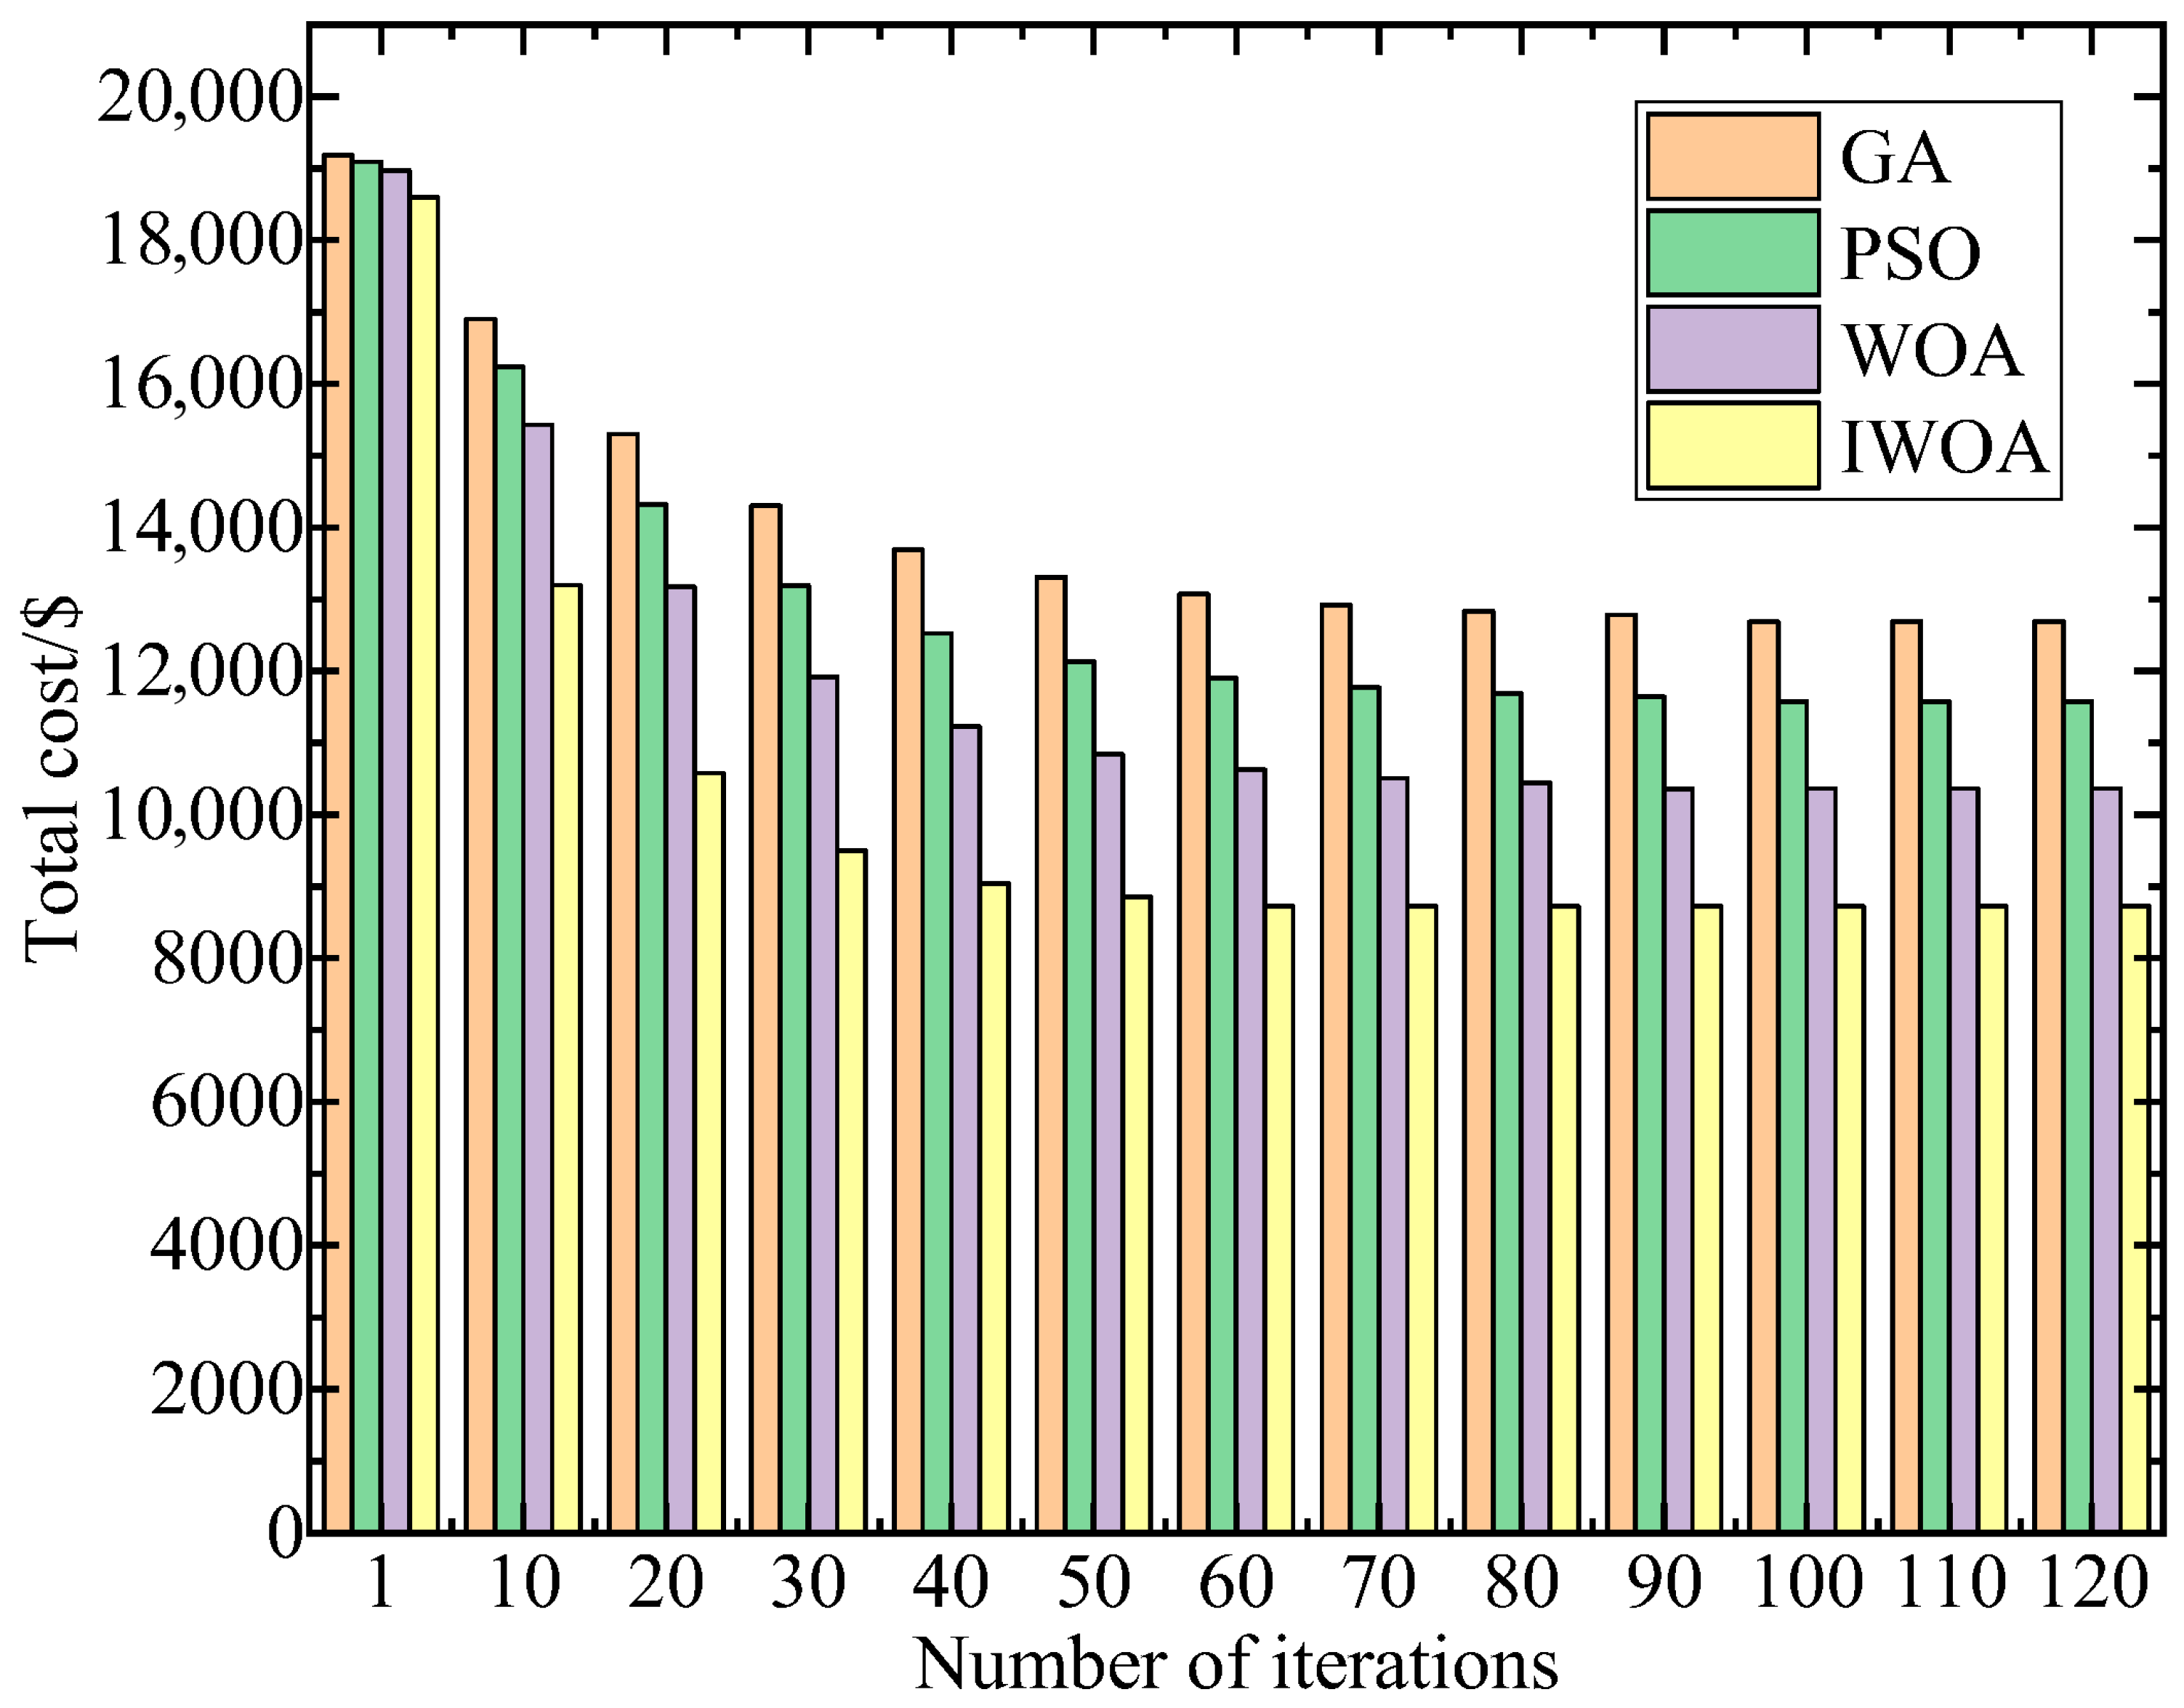
In addition, the original WOA inherently integrates dual mechanisms: global random search and local encircling exploitation. This characteristic matches the two-layer solution requirement of the proposed model, which first conducts large-range searching to obtain pre-deployment schemes for high-risk nodes, then performs refined optimization on scheduling time sequences. Figure 8 and Figure 9 illustrate the algorithm’s convergence performance and the variation trend of parameters, respectively.
GA exhibits the slowest overall convergence speed. The cost drops by 25.4% within the first 30 iterations, and the decline rate slows markedly after 60 iterations. It finally achieves stable convergence at the 100th iteration, with an optimal objective function value of 12,689.2 $. Relying on random selection, crossover and mutation mechanisms, GA features strong dispersion in global search yet weak capability for precise local exploitation. When tackling the multi-constrained mixed-integer optimization model of distribution networks, GA is prone to iterative stagnation, yielding the lowest optimization efficiency among the four algorithms. PSO delivers better convergence performance than GA. The cost decreases by 30.9% in the first 30 iterations, and the decline rate gradually narrows in the middle iterations. PSO converges at the 95th iteration with an optimal value of 11,574.6 $. PSO tracks individual and global optimal solutions via particle velocities, leading to high optimization efficiency in the early stage. Nevertheless, it easily falls into local optima in the later stage due to insufficient fine-tuning capacity, resulting in moderate overall optimization accuracy and convergence speed. The conventional WOA achieves remarkably better convergence performance than the previous two algorithms. The cost declines by 37.2% in the first 30 iterations, benefiting from the fast descent rate brought by the encircling search mechanism in early iterations. It converges stably at the 90th iteration with an optimal value of 10,361.8 $. However, the traditional WOA adopts a linear convergence factor, which causes excessively rapid attenuation of global search capacity in the middle and late iterations. The algorithm thus tends to trap in local optima and suffers from premature convergence. The proposed IWOA achieves optimal convergence speed and optimization accuracy. Its cost reduces by 48.9% within the first 30 iterations, far exceeding the decline ranges of the other three algorithms. Full convergence is realized at the 60th iteration, representing a 33.3% improvement in convergence speed compared with conventional WOA and a 40% improvement compared with GA. The final optimal objective function value is 8725.3 $. Optimization accuracy is improved by 15.8% relative to traditional WOA and by 31.2% relative to GA.
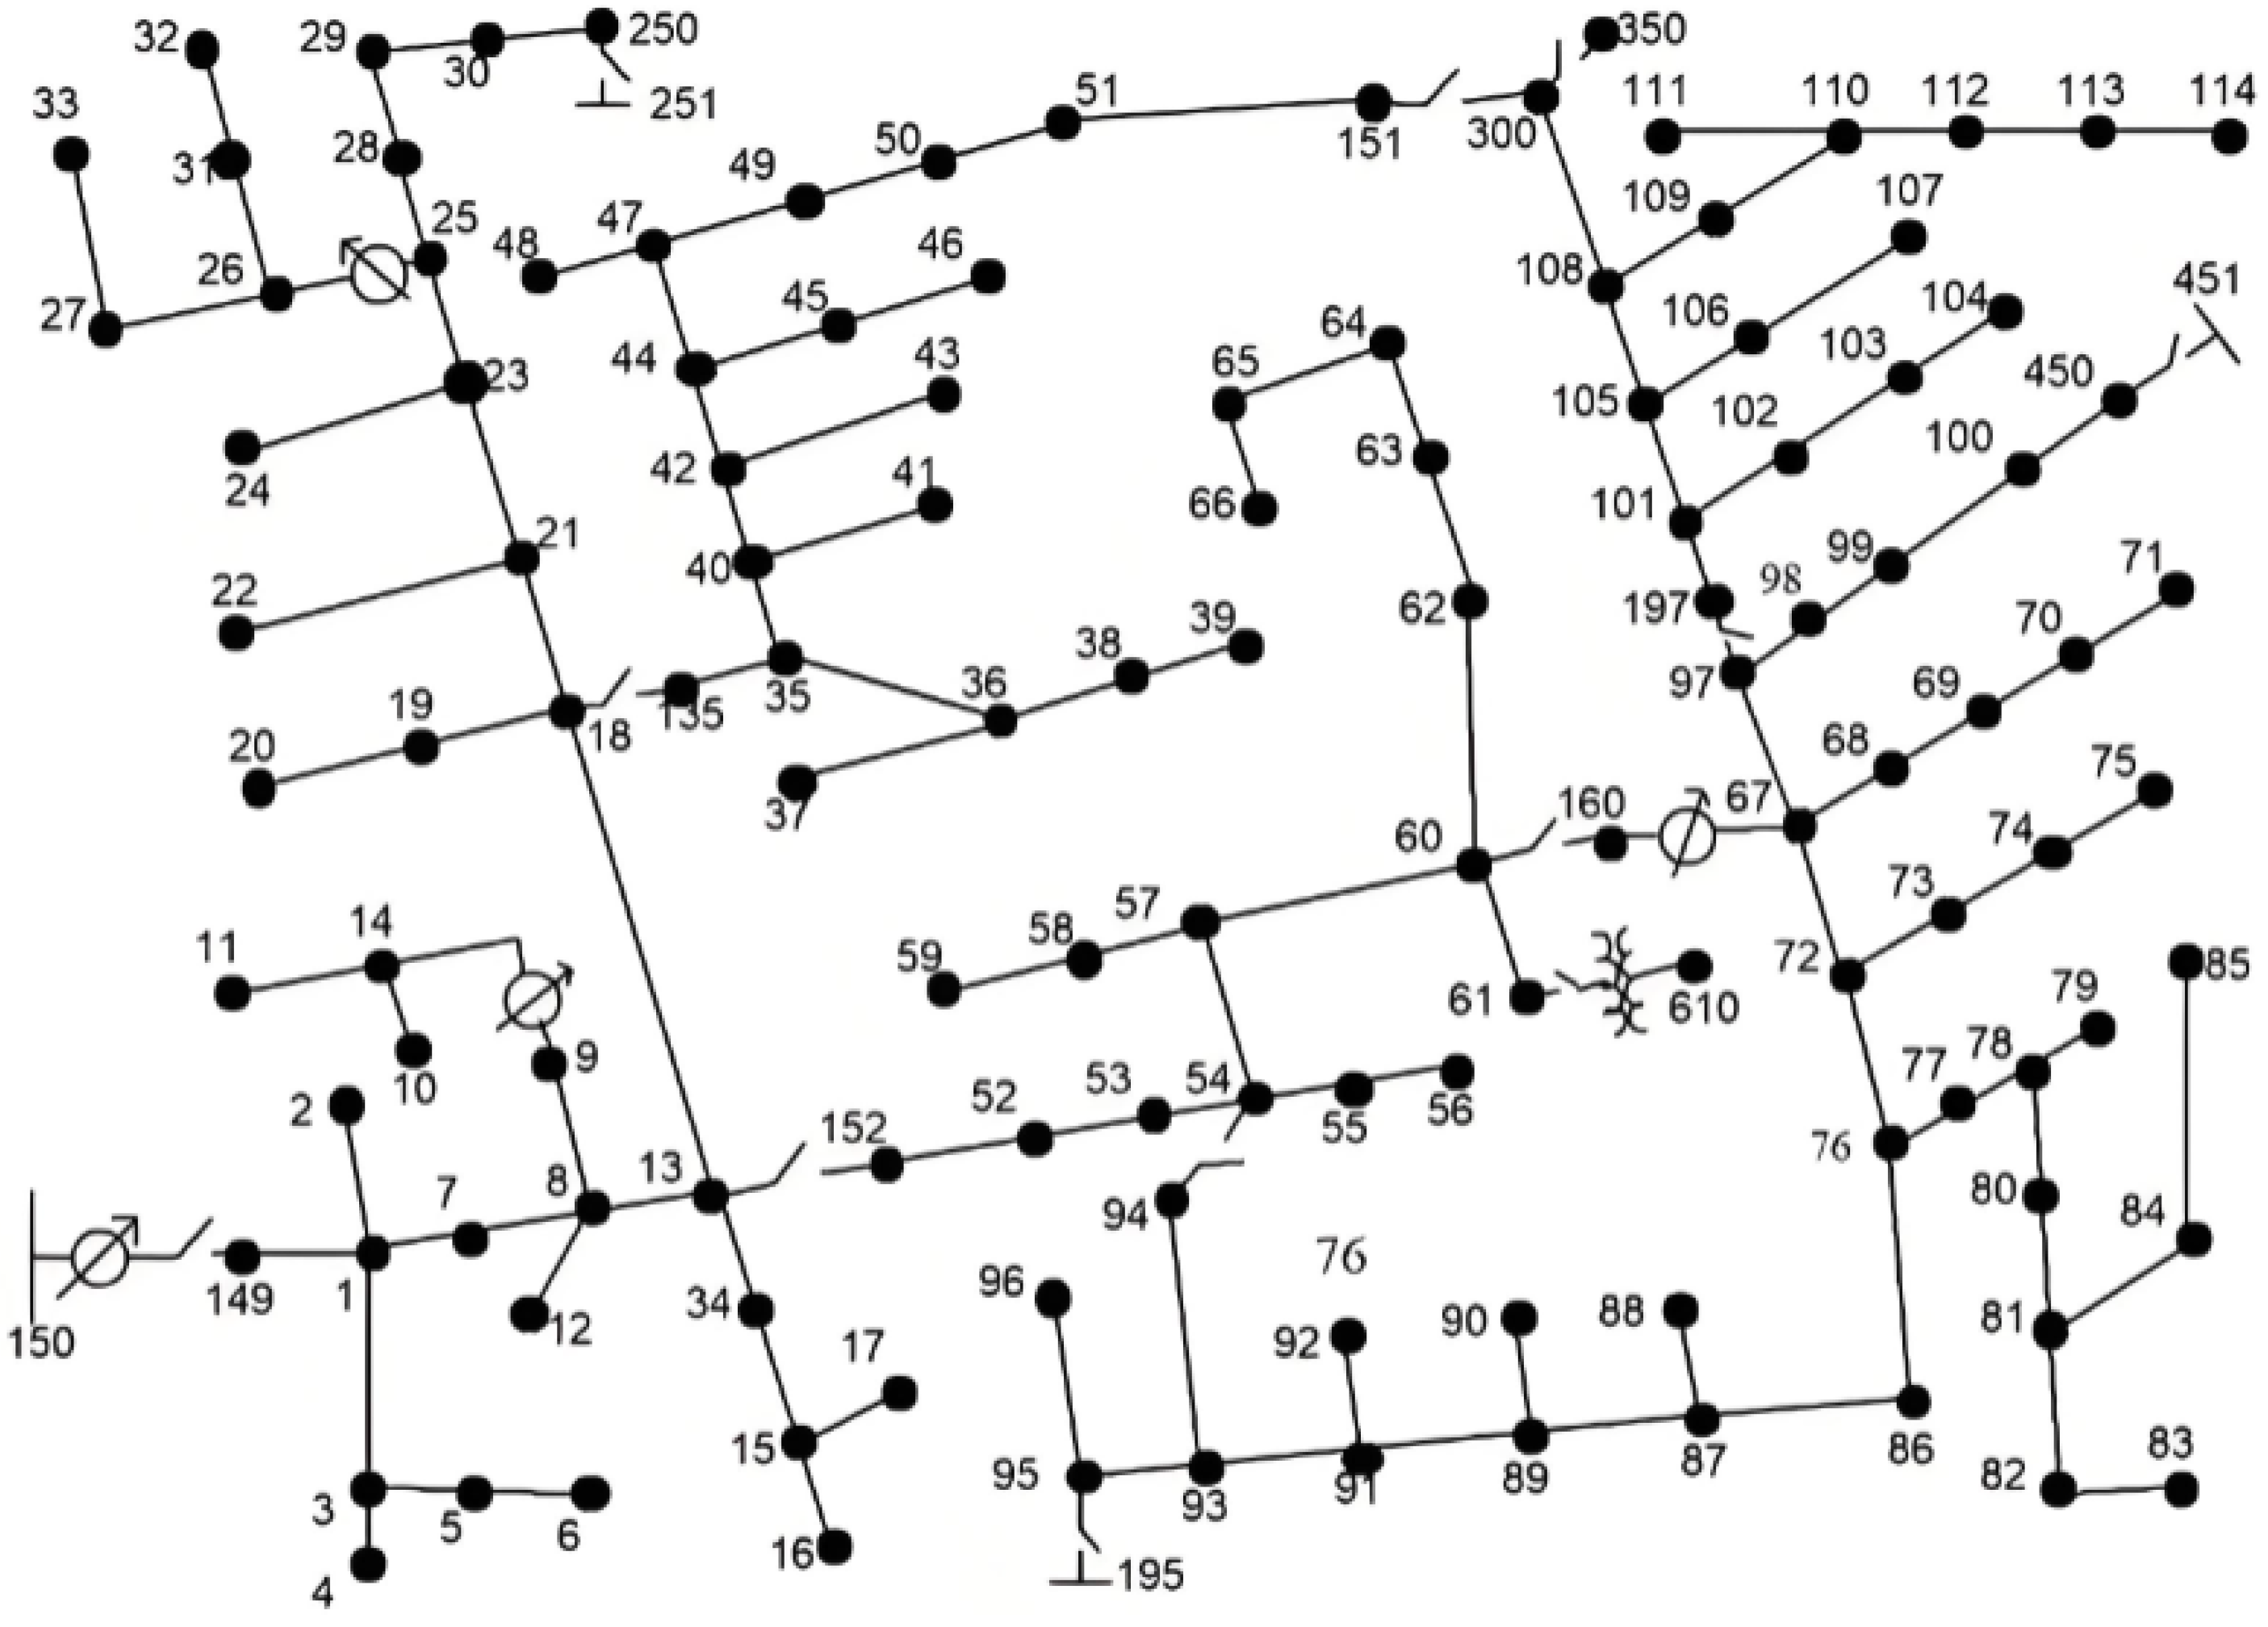
To further verify the effectiveness of the method proposed in this paper, a larger IEEE 123-node test system is adopted for validation. The network topology of this test system is illustrated in Figure 10 below. The relevant evaluation results are presented in Table 1.
Compared with the IEEE 33-node system, the IEEE 123-node system contains more nodes and branch lines with a wider distribution range of loads. When simultaneous waterlogging faults occur in multiple regions under heavy rain disasters, a larger scale of loads will be affected. As a result, the overall load loss level is higher than that of small-scale test systems. In addition, the variable dimensions and the number of constraints for optimization solving increase significantly, which leads to a synchronous rise in algorithm solving time and convergence iterations. MOMB can supply emergency power to fault-isolated islands through cross-regional dynamic transportation and grid connection. Therefore, compared with the benchmark scheme without MOMB, the two schemes integrated with MOMB can significantly reduce load loss and improve the comprehensive resilience of the system.
The IWOA proposed in this paper embeds nonlinear convergence factors and dynamic adaptive weights. It delivers stronger global exploration capacity in the early iterations to rapidly locate high-quality solution intervals, while achieving higher local optimization accuracy in the later iterations. Accordingly, compared with the traditional WOA scheme, the proposed algorithm requires fewer convergence iterations and boasts higher solving efficiency. Meanwhile, it can search for a superior spatio-temporal scheduling strategy for MOMB, further cutting down the cumulative load loss under fault scenarios and raising the comprehensive resilience index of the system. The above results verify the applicability and superiority of the proposed method in medium- and large-scale distribution network scenarios.
Table 2 and Table 3 present the relevant sensitivity analysis results that illustrate how the quantity and capacity of MOMBs affect the overall system operation performance.
From the perspective of quantity, as the configured number of MOMBs rises, the covered power supply range of faulted islands expands gradually, enabling simultaneous emergency power support for more scattered disaster-affected nodes. Consequently, the cumulative load loss declines continuously while the system comprehensive resilience index rises steadily. Nevertheless, the improvement of resilience presents an obvious law of diminishing marginal returns: when the number of MOMBs increases from 1 to 3, the reduction rate of load loss reaches 61.1% and the growth rate of comprehensive resilience hits 25.6%, yielding the most prominent power supply guarantee benefit. After the configuration quantity exceeds 3, however, restricted by the spatial distribution of distribution network fault points and road transportation accessibility under disasters, the power supply coverage of newly added MOMBs overlaps and becomes redundant. The effect of additional MOMBs on cutting load loss weakens significantly. Meanwhile, the full-cycle total scheduling cost rises linearly with the number of MOMBs, leading to the continuous deterioration of engineering techno-economic performance.
From the perspective of capacity, with a fixed quantity of MOMBs, increasing the rated capacity of a single base strengthens its load-carrying capability and continuous power supply duration, supporting long-term restoration of more critical loads. Therefore, the load loss decreases and resilience improves gradually as capacity increases, and the characteristic of diminishing marginal returns also applies here. During the stage where capacity rises from 0.2 MW to 0.6 MW, the load loss reduction rate reaches 55.6%, delivering a remarkable resilience improvement effect. Once the single-base capacity exceeds 0.6 MW, constraints on the single-node access capacity of the distribution network and the total load scale of local faulted regions form an upper limit. The surplus capacity of large-capacity MOMBs cannot be fully utilized. At the same time, the procurement, construction and operation and maintenance costs of large-capacity mobile energy storage grow nonlinearly with capacity, resulting in a substantial drop in economic efficiency. Balancing power supply resilience benefits and scheduling costs, the configuration scheme of 3 MOMBs each with a rated capacity of 0.4 MW achieves optimal cost-effectiveness for this test system, striking a favorable balance between power supply guarantee capability under extreme rainstorm disasters and practical engineering economic viability.

4. Conclusions

This paper investigates the optimal allocation of mobile operation and maintenance bases against natural disasters under high-proportion new energy penetration. By adopting Monte Carlo sampling to reproduce diversified random fault scenarios of distribution networks, a multi-dimensional resilience evaluation system covering load loss rate, power shortage ratio and recovery indicators is constructed to quantitatively characterize disaster damage severity and system recovery performance. Aiming at minimizing the full spatio-temporal dispatch cost of mobile operation and maintenance bases, the established optimization model comprehensively considers the flexible cross-regional access characteristic of mobile maintenance resources, coordinated power regulation of distributed wind, photovoltaic and gas turbines, as well as islanding operation constraints of distribution networks. To overcome the drawbacks of slow convergence and easy premature convergence in the original whale optimization algorithm, nonlinear convergence factor and dynamic adaptive weight are introduced to enhance the algorithm’s global exploration and local exploitation performance for a high-quality model solution.
Case data demonstrate that, compared with the benchmark scheme without mobile operation and maintenance bases, the proposed strategy reduces the system load loss from 1.27 MWh to 0.65 MWh and raises the comprehensive resilience index to 0.831, which significantly strengthens the power supply restoration capability of distribution networks. Meanwhile, the improved method only requires 126 convergence iterations, delivering a 29.2% higher solution efficiency and a 15.8% reduction in total scheduling cost relative to the conventional method, thereby balancing solution accuracy and computational speed.
Follow-up research will refine stochastic distribution models for road damage probabilities and segmental travel speeds, establish a collaborative bi-level optimization framework for power and transportation systems, and fully quantify the profound impacts of road outages and large-scale traffic congestion on MOMB scheduling, the temporal sequence of load restoration, and distribution network resilience. Further, an emergency restoration model considering the coupling of multiple uncertain factors under extreme disasters will be comprehensively improved.

Author Contributions

Conceptualization, Z.P., G.C., J.Z., J.L. and N.C.; methodology, Z.P., G.C., J.Z., J.L. and N.C.; validation, Z.P., G.C., J.Z., J.L. and N.C.; software, Z.P., G.C., J.Z., J.L. and N.C.; writing—original draft preparation, Z.P., G.C., J.Z., J.L. and N.C. All authors have read and agreed to the published version of the manuscript.

Funding

This work was supported by technology projects of China Southern Power Grid Corporation and Guangdong Power Grid Co., Ltd. (No. GDKJXM20230784).

Data Availability Statement

The original contributions presented in this study are included in the article. Further inquiries can be directed to the corresponding author.

Conflicts of Interest

Authors Junjie Zhang, Ziping Peng, Gang Chen, Junting Liu are affiliated with Guangdong power grid limited liability company Jiangmen power supply bureau. The remaining authors declare that the research was conducted in the absence of any commercial or financial relationships that could be construed as a potential conflict of interest.

Nomenclature

VariablesMeaning
w x ,
w s ,
w z
The wind loads imposed on conductors, transmission towers and insulators
a
μ z and μ s c
Non-uniform wind pressure coefficient of conductor, wind pressure height variation coefficient and conductor shape coefficient
dThe outer diameter of conductor
l h The horizontal span of conductor
vThe designed wind speed at reference height
φ The included angle between conductor and wind direction
zConstant
AThe horizontal projected area of wind-bearing part on tower
nThe quantity of insulators and the windward area of a single insulator
h 1 The height of the transmission tower
h 2 The height of cross-arm
h 3 The equivalent height of wind load action point
D 0 The tip diameter of pole
D x The root diameter of pole cross-section
m x The additional bending moment coefficient
P f The failure probability of transmission towers under strong wind
MThe maximum allowable bending moment of the tower
μ g The average flexural strength
δ Standard deviation of flexural strength
i a Rainfall intensity before the rain peak
i b Rainfall intensity after the rain peak
a, b, cConstant coefficients
rThe peak ratio
t a and t b The rainfall duration before and after the rain peak
ERainfall amount
n p The number of drainage outlets in the calculated area
q p The flow capacity of each outlet
t p The drainage duration
h r e The designed flood prevention height
h b The ground clearance of equipment
γ Damping coefficient
ς Attenuation coefficient.
T1The in-disaster resistance duration
T2The time required for the distribution network to restore normal operation after disasters
P i , t L The active power demand at node i at time t
P i , t L C The deficient active power (unsupplied load) at node i at time t
L T t The equivalent system load under normal operating conditions at time t
L t Weighted load at time t
ΩWThe set of load categories
w i , w L The weight of load type w at node i,
P i , w , t L The power magnitude of load w at node i at time t
P i , t L T The total load demand of node i at time t
w j , s The weight of the j-th indicator under scenario s
X j , s The normalized value of the j-th indicator under scenario s
F 1 ,
F 2 ,
F 3
The objective functions of pre-disaster, in-disaster and post-disaster stages
T0The duration of the pre-disaster prevention period
c L The penalty cost per unit of curtailed active load
c M E The unit deployment cost of MOMBs
c L S The unit cost of line power loss
a i , 0 M E A binary 0–1 variable indicating whether a MOMB is installed at node i before disaster
ΩLThe set of distribution branches
R i j The resistance of the branch between node i and node j
I i j , t 2 The squared magnitude of branch current between node i and j at time t
P i , u , t R The active power output of the u-th distributed renewable generation at node i at time t
P i , v , t G The active power output of the v-th micro gas turbine at node i at time t
P i , t M E , C ,
P i , t M E , D
The charging and discharging active power of MOMBs installed at node i at time t
P t B U Y The purchased active power of the distribution network at time t
xThe total quantity of distributed renewable generations
yThe total number of micro gas turbines
Δ P i , u , t R + ,
Δ P i , u , t R
The positive and negative forecast deviations of active power output for the u-th distributed renewable generation at node i at time t
P i , u , t R f and P i , u , t R The predicted and actual active power output of the u-th distributed renewable generation at node i at time t
Q i , u , t R The reactive power output of the u-th distributed renewable generation at node i at time t
φ i The power factor of loads at node i
a i , k , t M E ,
a i , k , t + 1 M E
Binary 0–1 variables indicating whether the k-th MOMB is connected to node i at time t and t + 1
a i , k , t M E Z Binary 0–1 variable for the connection status of the k-th MOMB at node i from t to t + 1
μ i , t M E , C ,
μ i , t M E , D
The charging and discharging coefficients of MPMBs at node i at time t
Ω 0 The set of MOMBs
P i j , t ,
Q i j , t ,
P j k , t ,
Q j k , t
The active and reactive power flowing from node i to j and from node j to k at time t
P i j , t 2 and Q i j , t 2 Squares of active and reactive power transmitted from node i to j at time t
X i j ,
R i j 2 ,
X i j 2
The reactance of the branch between node i and node j, together with the squared resistance and squared reactance of the branch
I i j , max 2 The upper limit of squared current magnitude for the branch connecting node i and node j
U i , max 2 ,
U i , min 2
The upper and lower bounds of squared voltage magnitude at node i
a i j , t The switch status of the branch between node i and node j at time t
S i , t V S Intermediate variable
F i j , t and F k i , t The virtual power on the branches between node i-j and node k-i at time t
F i , t V S The virtual power at node i at time t
γ i and δ i The sets of parent nodes and child nodes of node i
a The nonlinear convergence factor
tCurrent iteration number
T max The maximum number of iterations
X ( t + 1 ) The position vector of whale individuals after updating at iteration t + 1
X * ( t ) The position vector of the optimal solution in the t-th iteration
DThe distance vector between the whale individual and prey
lA random number uniformly distributed over [−1, 1]
ρ A random number within the range [0, 1]

References

  1. Wang, Q.; Yang, S.; Chen, F.; Cheng, M.; Chen, M.; Buja, G. Energy Management Strategy for Photovoltaic-Energy Storage Mobile Charging Station. IEEE Trans. Sustain. Energy 2026, 17, 1364–1376. [Google Scholar] [CrossRef] [Scilit]
  2. Wang, Q.; Zhang, X.; Xu, Y.; Yi, Z.; Xu, D. Planning of Stationary-Mobile Integrated Battery Energy Storage Systems Under Severe Convective Weather. IEEE Trans. Sustain. Energy 2025, 16, 1253–1268. [Google Scholar] [CrossRef] [Scilit]
  3. Lai, S.; Dong, Z.Y.; Mao, R.; Tao, Y.; Zheng, Z.; Qiu, J.; Sun, X.; Zhao, J. Resilience Enhancement for Electricity and Cellular Wireless Networks Using Mobile Energy Storage Systems. IEEE Trans. Consum. Electron. 2025, 71, 7622–7635. [Google Scholar] [CrossRef] [Scilit]
  4. Zhang, Y.; Liu, X.-K.; Li, Y.; Wang, Y.-W.; Siano, P. Nash Equilibrium Among Mobile Energy Storage Systems Game for Load Restoration of Faulted Microgrids. IEEE Trans. Ind. Inform. 2026, 22, 1016–1027. [Google Scholar] [CrossRef] [Scilit]
  5. Qin, P.; Fu, Y.; Tang, G.; Zhao, X.; Gong, G.; Lu, J. Online Power Scheduling for Energy Harvesting RTU in 5G-Enabled Cyber-Physical Power System. IEEE Trans. Green Commun. Netw. 2025, 9, 1923–1935. [Google Scholar] [CrossRef] [Scilit]
  6. Lin, X.; Huang, H.; Xu, X. Battery Degradation Oriented Active Control Strategy by Using a Reinforcement Learning Algorithm in Hybrid Energy Storage System. IEEE Trans. Ind. Electron. 2025, 72, 4922–4932. [Google Scholar] [CrossRef] [Scilit]
  7. Li, M.J.; Tse, C.K. Quantification of Cascading Failure Propagation in Power Systems. IEEE Trans. Circuits Syst. I Regul. Pap. 2024, 71, 3717–3725. [Google Scholar] [CrossRef] [Scilit]
  8. He, S.; Zhou, Y.; Yang, Y.; Liu, T.; Zhou, Y.; Li, J.; Wu, T.; Guan, X. Cascading Failure in Cyber–Physical Systems: A Review on Failure Modeling and Vulnerability Analysis. IEEE Trans. Cybern. 2024, 54, 7936–7954. [Google Scholar] [CrossRef] [Scilit] [PubMed]
  9. Li, B.; Liu, D.; Fang, J.; Zhang, X.; Tse, C.K. Failure Propagation Graphs for Studying Cascading Failure Propagation in Power Networks. IEEE Syst. J. 2025, 19, 258–269. [Google Scholar] [CrossRef] [Scilit]
  10. Li, M.J.; Tse, C.K.; Yi, M. Steady-State Cascading Failure Model with Voltage Instability Event Detection. IEEE Trans. Circuits Syst. I Regul. Pap. 2024, 71, 463–472. [Google Scholar] [CrossRef] [Scilit]
  11. Liu, D.; Tse, C.K.; Yang, J.; Zhang, X. Revealing Cascading Failure Vulnerability in Evolving Power Grids with Increasing Penetration of Inverter-Based Resources. IEEE Trans. Circuits Syst. I Regul. Pap. 2025, 72, 5192–5204. [Google Scholar] [CrossRef] [Scilit]
  12. Jun, L.; Xiaolong, L.; Pengfei, L. Capacity Allocation Strategy Against Cascading Failure of Complex Network. J. Syst. Eng. Electron. 2024, 35, 1507–1515. [Google Scholar] [CrossRef] [Scilit]
  13. Li, M.; Wang, S.; Fan, L.; Han, Z. Quantum Assisted Combinatorial Benders’ Algorithm for the Synergy of Hydrogen and Power Distribution Systems with Mobile Storage. IEEE Trans. Power Syst. 2025, 40, 3967–3978. [Google Scholar] [CrossRef] [Scilit]
  14. Wang, Z.; Wu, G.; Zhang, Y.; Gao, T.; Fang, S.; Chen, J.; Zhu, Y.; Li, Z.; Mou, X.; Yangdong, J.; et al. Dynamic Programming-Based Mass Block Stacking Method of Gravity Energy Storage System for Minimum Energy Consumption. IEEE Trans. Ind. Appl. 2025, 61, 9628–9639. [Google Scholar] [CrossRef] [Scilit]
  15. Mi, Y.; Lu, C.; Li, C.; Qiao, J.; Shen, J.; Wang, P. Data-Driven Volt-VAR Coordinated Scheduling with Mobile Energy Storage System for Active Distribution Network. IEEE Trans. Sustain. Energy 2025, 16, 242–256. [Google Scholar] [CrossRef] [Scilit]
  16. Yang, X.; Liu, X.; Zhao, T.; Yin, Z.; Xiao, G.; Fan, B.; Wang, P. A Two-Stage Robust Approach for Resilient Unit Commitment with Rail-Based Mobile Energy Storage Under Diffusional Uncertainties. IEEE Trans. Sustain. Energy 2025, 16, 1531–1544. [Google Scholar] [CrossRef] [Scilit]
  17. Cui, K.; Chi, M.; Zhao, Y.; Liu, Z.-W. Bilevel Optimization Framework for Multiregional Integrated Energy Systems Considering 6G Network Slicing and Battery Energy Storage Capacity Sharing. IEEE Open J. Ind. Electron. Soc. 2025, 6, 396–414. [Google Scholar] [CrossRef] [Scilit]
  18. Guo, H.; Wu, S.; Shi, T.; Wang, F.; Gong, D. Coordinated Operation of Active Distribution Network and Mobile Energy Storage Using Stackelberg Game. IEEE Trans. Ind. Inform. 2025, 21, 4423–4434. [Google Scholar] [CrossRef] [Scilit]
  19. Tao, L.; Wang, Y.; Li, C.; Chen, Z.; Lin, D.; Xia, S.; Wang, P.; Jing, J.; Wang, R. A Two-Stage Optimal Operation Strategy of Distribution Networks Considering Mobile Energy Storage Flexibility. IEEE Trans. Ind. Appl. 2025, 61, 8650–8660. [Google Scholar] [CrossRef] [Scilit]
  20. El-Sayed, W.; Awad, A.; Azzouz, M.; Shaaban, M.; El-Saadany, E. Mobile Energy Storage for Inverter-Dominated Isolated Microgrids Resiliency Enhancement Through Maximizing Loadability and Seamless Reconfiguration. Prot. Control Mod. Power Syst. 2025, 10, 89–102. [Google Scholar] [CrossRef] [Scilit]
  21. Wan, Y.; Hu, Y.; Liu, X.; Zhou, Q.; Wang, N.; Wang, Y.; Chen, Z. Routing and Scheduling of Smart Mobile Power Banks for Mobile Charging and Vehicle-to-Grid Services. IEEE Trans. Transp. Electrif. 2025, 11, 8054–8064. [Google Scholar] [CrossRef] [Scilit]
  22. Ma, X.; Mu, Y.; Jia, H.; Yu, X.; Jin, X.; Jiang, X. Day-ahead collaborative regulation method for 5G base stations and power grids considering a sleep strategy and energy storage regulation capacity. CSEE J. Power Energy Syst. [CrossRef]
  23. Hu, B.; Wang, B.; Yang, R. Research on Big Data Database System in Intelligent Dispatching of Mobile Energy Storage Equipment. In Proceedings of the 2025 5th Asia-Pacific Conference on Communications Technology and Computer Science (ACCTCS), Shenyang, China, 23–25 April 2025; pp. 1025–1030. [Google Scholar] [CrossRef] [Scilit]
  24. Gui, X.; Zhao, H.; Liu, G.; Cheng, Y.; Wang, Q.; Sun, Y.; Zhao, J. Deep Reinforcement Learning-Based Mobile Battery Energy Storage System Control with Partial Observability and Data Imputation. IEEE Trans. Ind. Inform. 2026, 22, 6301–6312. [Google Scholar] [CrossRef] [Scilit]
  25. Yu, H.; Yin, S.; Wang, Y.; Sun, L.; Xiao, F. An Impulse Resistance Current Control Method Suitable for Mobile Energy Storage System. In Proceedings of the 2025 International Conference on Electrical Automation and Artificial Intelligence (ICEAAI), Guangzhou, China, 10–12 January 2025; pp. 852–856. [Google Scholar] [CrossRef] [Scilit]
  26. Xue, L.; Niu, T.; Ge, H.; Zhang, J.; Xue, Y.; Fang, S.; Chen, G.; Wang, Z. A Joint Distributed Optimization Framework for Voltage Control and Emergency Energy Storage Vehicle Scheduling in Community Distribution Networks. IEEE Trans. Ind. Appl. 2024, 60, 5317–5330. [Google Scholar] [CrossRef] [Scilit]
  27. Xue, L.; Niu, T.; Fang, S.; Li, Z. Parameter Optimization for Var Planning of Systems with High Penetration of Wind Power: An Adaptive Equivalent Reduction Method. IEEE Trans. Sustain. Energy 2023, 14, 1950–1963. [Google Scholar] [CrossRef] [Scilit]
Figure 1. Flowchart of the proposed algorithm.
Processes 14 02840 g001
Figure 2. Test system topology diagram.
Processes 14 02840 g002
Figure 3. Output curves of renewable distributed energy resources.
Processes 14 02840 g003
Figure 4. The variation curve of bus failure rate.
Processes 14 02840 g004
Figure 5. Dynamic grid-connected buses of MOMBs.
Processes 14 02840 g005
Figure 6. System load shedding volumes before and after optimization.
Processes 14 02840 g006
Figure 7. Power response of flexible resources.
Processes 14 02840 g007
Figure 8. Convergence performance analysis of different algorithms.
Processes 14 02840 g008
Figure 9. Dynamic variation process of parameters.
Processes 14 02840 g009
Figure 10. The network topology of IEEE 123-node test system.
Processes 14 02840 g010
Table 1. Comparison of results under different schemes.
SchemeLoad Loss/MWhComprehensive Resilience IndexAverage Solution Time/sNumber of Convergence Iterations
Benchmark Scheme without MOMB1.270.582--
Conventional WOA-based Scheme with MOMB 0.890.715142.6178
The Proposed Method0.650.83197.3126
Table 2. Sensitivity analysis of the configuration quantity of MOMBs.
MOMB Configuration QuantityCumulative Load Loss/MWhComprehensive Resilience IndexTotal Full-Cycle Scheduling Cost (10,000 $)
10.720.6941.28
20.410.8071.95
30.280.8722.63
40.220.8983.37
50.190.9104.12
Table 3. Sensitivity analysis of the rated power of MOMBs.
Rated Power of Single MOMB/MWCumulative Load Loss/MWhComprehensive Resilience IndexTotal Full-Cycle Scheduling Cost (10,000 $)
0.20.450.7892.01
0.40.280.8722.63
0.60.200.9053.27
0.80.170.9173.94
1.00.160.9214.68
Disclaimer/Publisher’s Note: The statements, opinions and data contained in all publications are solely those of the individual author(s) and contributor(s) and not of MDPI and/or the editor(s). MDPI and/or the editor(s) disclaim responsibility for any injury to people or property resulting from any ideas, methods, instructions or products referred to in the content.