1. Introduction
Harnessing the energy in water currents has gained increasing interest in recent years as a renewable alternative for electricity generation. Unlike solar or wind power, hydrokinetic energy directly taps into the kinetic energy of rivers, channels, or artificial waterways without requiring large hydraulic infrastructure or reservoirs [
1]. This conversion process reduces environmental impact and is easily applied at small and medium scales. In this context, vertical-axis hydrokinetic turbines represent a promising option due to their ability to operate in bidirectional flows, ease of maintenance, and adaptability to low-speed environments [
2].
In 2023, electrical energy distribution in Colombia remained heavily dominated by hydroelectric and thermoelectric generation, which together account for most total production. Specifically, hydroelectricity contributes approximately 66.8%, while thermoelectric plants provide around 30.5%. Renewable sources such as biomass, solar, and wind currently hold a minimal share: biomass accounts for 1.1%, solar for 1.48%, and wind for roughly 0.1%. Consequently, the overall contribution of non-conventional renewable energy remains small—around 0.6%—highlighting its emerging role in Colombia’s energy matrix [
3]. Under national policy, water is considered a renewable natural resource; therefore, energy generated from its use has a low carbon foot print, resulting in fewer environmental impacts. Given the numerous rural communities with access to rivers, hydropower is considered the best source for local electricity production [
4].
Two primary approaches exist for obtaining electrical energy from water: hydrostatic and hydrokinetic. Hydrostatic systems obtain potential energy by storing water in reservoirs to create a pressure head, whereas hydrokinetic systems utilize the energy within flowing water streams. The latter has gained attention as an attractive solution for supplying electricity to off-grid areas via rivers or channels [
5]. Kinetic energy from water streams offers high power density (roughly 1000 times than of air due to fluid density) and predictability without requiring reservoirs. This energy is captured using fully submerged turbines that operate similarly to wind rotors [
6,
7]. Unlike hydrostatic sources—often criticized for environmental and social impacts—hydrokinetic energy is considered truly renewable due to its minimal footprint and lack of resettlement or deforestation issues. Despite technical challenges such as limited capacity, seasonal variability, and potential navigation blockages, the benefits driving its adoption are significant. The primary advantages include the following [
8]:
Hydrokinetic energy offers a greater potential for power extraction than wind energy, even at low river velocities compared to typical wind speeds.
Hydrokinetic energy makes electrification possible in regions close to rivers, where dam construction is unfeasible due to irregularities in the topography and geology.
Uninterrupted power generation is possible if the stream flows continuously (avoiding energy storage systems).
Relatively low initial installation costs (compared to conventional hydropower technologies) and short implementation time stand out as benefits.
The natural ecosystems and the environmental footprint are not either significantly disrupted or affected in the locations where hydrokinetic systems are installed.
Harvesting hydraulic energy from rivers and channels using vertical-axis hydrokinetic turbines (VAHTs) offers a sustainable alternative for off-grid power generation. However, this technology typically exhibits a low power coefficient (
), which is highly dependent on design characteristics and local hydrodynamic conditions [
9,
10]. The performance of VAHTs can be enhanced by determining best operating conditions—specifically dimensionless values such as the Tip Speed Ratio (TSR), Reynolds number, and Froude number—and by modifying geometric rotor parameters like the radius ratio (RR) and aspect ratio (AR).
Consequently, our current study investigates how specific rotor parameters, such as the radius ratio and attachment angle, influence the performance of a hybrid Darrieus–Savonius hydrokinetic turbine. This work stems from the need to rigorously understand and estimate the performance of a hybrid rotor VAHT under specific operating conditions. While technical research has reported significant advances in Darrieus, Savonius, and hybrid turbine configurations, most research has been conducted in controlled environments or with specific geometries.
For instance, Kamal and Saini found that the maximum
of a hybrid hydrokinetic turbine (HKT) increases with the radius ratio, peaking at an RR of 0.4. The maximum average
for this configuration was reported as 0.22, which is significantly higher than the values of 0.15, 0.21, and 0.17 observed for radius ratios of 0.2, 0.6, and 0.8, respectively. This indicated that an RR of 0.4 is more efficient than the other configurations by 46.2%, 27.6%, and 5.2% at a TSR of 0.9 and a water velocity of 0.5 m/s. Furthermore, the highest
was observed at an attachment angle (AA) of 90°, outperforming configurations with AAs of 30° and 150° by 4.3% and 4.8%, respectively [
11].
In the numerical analysis, the primary parameters investigated were the radius ratio (m), defined as the ratio of the Savonius turbine radius to the Darrieus turbine radius, and the attachment angle (
θa), which represents the relative angular position of the Savonius turbine within the hybrid configuration. These geometrical parameters were varied across a range of 0.2 to 0.8 for the radius ratio (with configurations C1–C4) and 30° to 150° for the attachment angle (with configurations C5–C6). At the same time, the Darrieus turbine diameter was fixed at 0.2 m. Operating conditions were also investigated, including varying the turbine’s angular velocity (RPM) and water flow speed, which together determined the TSR (ranging from 0.3 to 1.5) and Reynolds number (from 1.12 × 10
5 to 4.49 × 10
5). The numerical results indicated that the optimal configuration (C2) had a radius ratio of 0.4 and an attachment angle of 90°, yielding the maximum average torque coefficient at a TSR of 0.6 and a Reynolds number of 1.12 × 10
5 [
12].
The comparative investigation of hybrid and single Darrieus hydrokinetic turbines revealed that the hybrid rotor significantly outperforms its single Darrieus counterpart in terms of efficiency and operational stability. The hybrid rotor achieved a maximum
of 0.08 at a TSR of 0.81, which is approximately 9.9% higher than the maximum
of 0.0728 observed for the single Darrieus rotor. Additionally, the average torque for the hybrid rotor was measured at 0.13 N m, compared to 0.11 N m for the single Darrieus rotor, and the hybrid design exhibited lower torque fluctuations. This stability in torque generation is crucial for maintaining consistent performance in varying flow conditions [
13].
Md Mustafa Kamal et al. conducted a computational analysis to determine the performance characteristics of a hybrid cross-flow hydrokinetic turbine (HHKT) with a helical Savonius blade angle of 135°. The study focused on design parameters including the radius ratio (RR) and the attachment angle (AA), alongside varying water flow speeds from 0.5 m/s to 2.0 m/s. Twelve distinct HHKT models were developed, considering four RRs (0.2, 0.4, 0.6, and 0.8) and three AAs (60°, 90°, and 120°). The numerical results showed that the HHKT model performed optimally at a combination of parameters with an AA of 60°, a water flow velocity of 0.5 m/s, an RR of 0.4, and a TSR value of 0.9. This optimal configuration yielded a maximal power coefficient of 0.21. Furthermore, this specific hybrid HKT model was found to be 40%, 1.46%, and 20.49% more effective compared to models with an RR of 0.2, 0.6, and 0.8, respectively, under the same flow conditions. It was also observed that performance generally reduced as water flow velocity increased [
14].
On their part, Kamal and Saini conducted a numerical investigation on five hybrid cross-flow HKT configurations, varying Savonius blade helicity (0°, 45°, 90°, 135°, 180°) and in-stream water velocities (0.5–2.0 m/s), while keeping a 0.6 radius ratio and 90° attachment angle. Numerical results showed that a 45° helicity achieved a maximum power coefficient of 0.208, a 4.5% improvement, and a 180° helicity reduced torque pulsation by 31.54%. Additionally, 135° and 180° helicities entirely nullified negative instantaneous torque, enhancing self-starting capability [
15].
G. Saini and R. Saini conducted a numerical analysis of a hybrid hydrokinetic turbine using ANSYS FLUENT and the Realizable k-ε turbulence model. They investigated the effects of radius ratios (0.2, 0.25, 0.333) and attachment angles (0°, 30°, 60°, 90°) on rotor performance. A maximum power coefficient of 0.34 was found at a radius ratio of 0.2 with 30° or 60° attachment angles, and the hydrokinetic turbine outperformed a similar wind turbine by 20% [
16]. Another study conducted by these authors numerically investigated the clearance and blockage effects on the hydrodynamic performance of a hybrid hydrokinetic turbine using CFD methodology, varying channel dimensions, flow velocity, and TSR. Numerically, the rotor yielded its maximum hydrodynamic performance (
of 0.122) at a clearance ratio of 0.55, due to the rotor being placed in a fully developed velocity profile. Increased blockage, specifically 26.32%, significantly enhanced the
by restricting flow passage and imparting acceleration to the fluid. This peak performance occurred at a flow velocity of 0.5 m/s and a TSR of 0.98 [
17]. Additionally, a computational investigation carried out by Saini and Saini analyzed the performance of a hybrid hydrokinetic turbine, combining Savonius and Darrieus rotors, by varying geometrical parameters such as RR (0.2–0.8) and AA (60°, 90°, 120°) across water flow velocities of 0.5 m/s to 2.0 m/s. Using CFD with the Unsteady Reynolds-Averaged Navier–Stokes (URANS) equations and the RNG k-ε turbulence model, numerical results showed a
of 0.109 and a
of 0.1276 at an RR of 0.6 and a 90° AA. This hybrid design significantly improved performance, with
and
increasing by 37.97% and 35.88%, respectively, compared to a single Darrieus rotor [
18].
Kamal et al. developed a correlation for the power coefficient of a hybrid hydrokinetic turbine rotor, featuring straight-bladed Darrieus and helical-bladed Savonius rotors, with the Savonius rotor placed inside the Darrieus. This was achieved through an extensive numerical investigation using ANSYS CFX, varying system parameters like Savonius helical blade angle (0–180°), radius ratio (0.2–0.8), attachment angle (30–150°), and flow parameters such as water velocity (0.5–2.0 m/s) and tip speed ratio (0.3–1.5). Numerical results showed optimal performance at a TSR of 0.9, a Savonius helical blade angle of 45°, an RR of 0.4, and an AA of 90°. The developed correlation demonstrated good agreement with numerical values, with 95% of data points within ±14%, a regression coefficient (R
2) of 0.97, and a mean absolute deviation of 6.2% [
19].
Arrieta-Gomez et al. optimized a hybrid Savonius–Darrieus hydrokinetic turbine using CFD-based Design of Experiments (36 cases) and regression modeling. The study analyzed the impact of coupling angle (
θ), radius ratio (RR), and tip speed ratio (TSR) on turbine performance. ANOVA identified the RR as the most significant factor, notably influencing torque generation. Five regression models were developed, with model mt5 selected for its best fit in predicting efficiency. The optimal configuration was determined to be RR = 0.2,
θ = 50°, and TSR = 2.2, achieving an efficiency of 55.19%. This framework provides a data-driven approach for designing efficient hybrid turbines for remote energy systems [
20].
Nasef et al. experimentally studied a hydrokinetic integrated Darrieus–Savonius rotor in an open water channel to optimize its performance. They varied radius ratios (0.8, 0.6, 0.4) and add-on angles (0°, 30°, 45°, 60°, 90°), using Darrieus with NACA 020 airfoils and semi-circular Savonius blades (single/double stage). The study found that the maximum power factor (0.339) was achieved with a radius ratio of 0.4 and an add-on angle of 45° at a TSR of 1.8, significantly improving self-starting. Water speed (Reynolds number) had a minor inverse effect, while water height had a negligible effect. The use of a double-stage Savonius improved performance [
21].
Kashani et al. improved hybrid vertical-axis wind turbines using a novel J-shaped Darrieus blade configuration. They employed 2D CFD simulations with the SST k−ω turbulence model on a 1 m rotor, analyzing various opening ratios. The 30% opening ratio was identified as optimal, producing the highest power output across a broad TSR range. This design enhanced power output by 50% at TSR = 1.5 and 14.4% at TSR = 2.5 compared to the baseline model. Self-starting capabilities significantly improved, with the 90% opening ratio offering up to 19% more torque at low TSRs (0.5). Aerodynamic analysis revealed more positive drag force and favorable lift characteristics, leading to higher net torque. The study concluded that J-shaped blades effectively enhance both low-speed startup and overall efficiency [
22].
Previous experimental and CFD analyses on hybrid turbines with an S-rotor tucked inside an H-rotor have revealed varied results. Gavalda et al. achieved a
of 0.40 for a modified Darrieus–Fletner design, with conventional hybrids reaching 0.35. Wakui et al. observed flow interference despite improved startup time, while Sahim et al. reported a
of 0.15 for a hydrokinetic turbine, which was inferior to a single H-rotor. Bhuyan and Biswas recorded a
of 0.34 and noted that the self-starting torque coefficient increased with the overlap ratio up to a certain value. These findings highlight both the performance potential and the challenges, such as flow interference, in this configuration [
23].
Although hybrid Darrieus–Savonius hydrokinetic turbines have been studied numerically, most existing studies focus either on purely numerical simulations or on isolated experimental tests evaluating only global power and torque coefficients under ideal conditions. The primary objective of this research was to comprehensively design and preliminarily evaluate a hybrid Darrieus–Savonius vertical-axis hydrokinetic turbine (VAHT) using computational fluid dynamics (CFD) simulations, and to validate these findings with initial experimental measurements. The first stage involved a design process to define the turbine’s geometric and flow parameters, followed by measurements of available velocities in an experimental water channel test section. A detailed CFD methodology employing a sliding-mesh technique was then implemented. This CFD methodology was combined with a Design of Experiments (DoE) consisting of 27 simulations to systematically analyze the influence of independent variables—such as rotor radius ratio (RR), attachment angle (AA), and water velocity (U)—on the power coefficient (). For the best configuration identified, the research further explored the turbine’s hydrodynamic behavior across various tip speed ratios (TSRs), determining key performance indicators such as , torque coefficient (), mechanical moments, and the associated pressure and velocity fields. Finally, a physical structure and rotor were constructed and tested in the experimental channel, allowing for the measurement of preliminary variables such as angular velocity, torque, and water velocity, which were then used to validate the numerical results through direct comparison.
This paper is organized into four main sections.
Section 2 describes the design methodology of the vertical-axis hydrokinetic turbine (VAHT), including the definition of the main geometric parameters and operating flow conditions. It also presents the numerical framework adopted for the computational fluid dynamics (CFD) analysis, covering the computational domain, mesh generation, governing equations, turbulence modeling, and boundary conditions.
Section 3 presents and discusses the numerical results and the experimental design varying the considered factors and levels, focusing on the hydrodynamic forces acting on the rotor, the temporal evolution of torque, the mechanical power output, and the corresponding power coefficient.
Section 4 compares numerical predictions with experimental measurements to evaluate the accuracy and reliability of the proposed CFD methodology. Finally,
Section 5 summarizes this study’s main conclusions, highlighting the influence of the geometric parameters considered in the design of experiments on the performance of the hybrid Darrieus–Savonius turbine. This section also outlines a comprehensive CFD methodology approach that integrates the evaluation of flow characteristics, moment coefficient, power coefficient, hydrodynamic torque, and rotor support forces to inform the development and enhancement of vertical-axis hydrokinetic turbines.
2. Methodology for Numerical Simulations
During the methodological phase, the design, simulation, and analysis of the hybrid Darrieus–Savonius VAHT are conducted using CAD/CAE tools and computational fluid dynamics (CFD) techniques. The process begins in Solidworks version 2024, where precise design data—such as rotor diameter and blade profiles—are recorded to establish a foundational geometry [
24].
To systematically investigate the influence of the radius ratio (RR), attachment angle (AA), and water velocity on the turbine’s power coefficient , a Design of Experiments (DoE) framework is implemented. Because evaluating this extensive parametric space using three-dimensional (3D) meshes would be computationally prohibitive, two-dimensional (2D) CFD simulations are strategically utilized as a low-cost, efficient preliminary screening tool.
While 2D simulations significantly reduce computational time, they inherently neglect 3D flow structures, tip losses, and end effects associated with the turbine’s finite height. To acknowledge and mitigate this limitation, the 2D DoE phase is used exclusively to identify performance trends and isolate the optimal geometric design. Subsequently, a high-fidelity 3D simulation is performed on this single best-performing configuration to accurately capture 3D hydrodynamic effects and quantify absolute performance.
The CAD models are exported to the ANSYS Meshing tool for grid generation. A local sizing method is applied to refine the grid around the hydrofoils, optimizing node density to capture boundary layer behavior accurately without unnecessary computational overhead [
7,
10,
25]. Within the CAE software ANSYS Fluent 2023 R1, the boundary conditions are established using empirical data obtained directly from the physical hydraulic channel, ensuring the numerical framework strictly mirrors the experimental conditions.
To resolve the complex transient flow behavior, the SST turbulence model is selected for its high accuracy in predicting flow separation and adverse pressure gradients. Simulating a vertical-axis hydrokinetic turbine (VAHT) requires modeling the rotational motion of the rotor relative to the stationary fluid domain. While techniques like overset meshing are viable, the sliding mesh technique is implemented for these 2D simulations due to its versatility, conservative interface formulations, and robust handling of transient fluid–structure interactions.
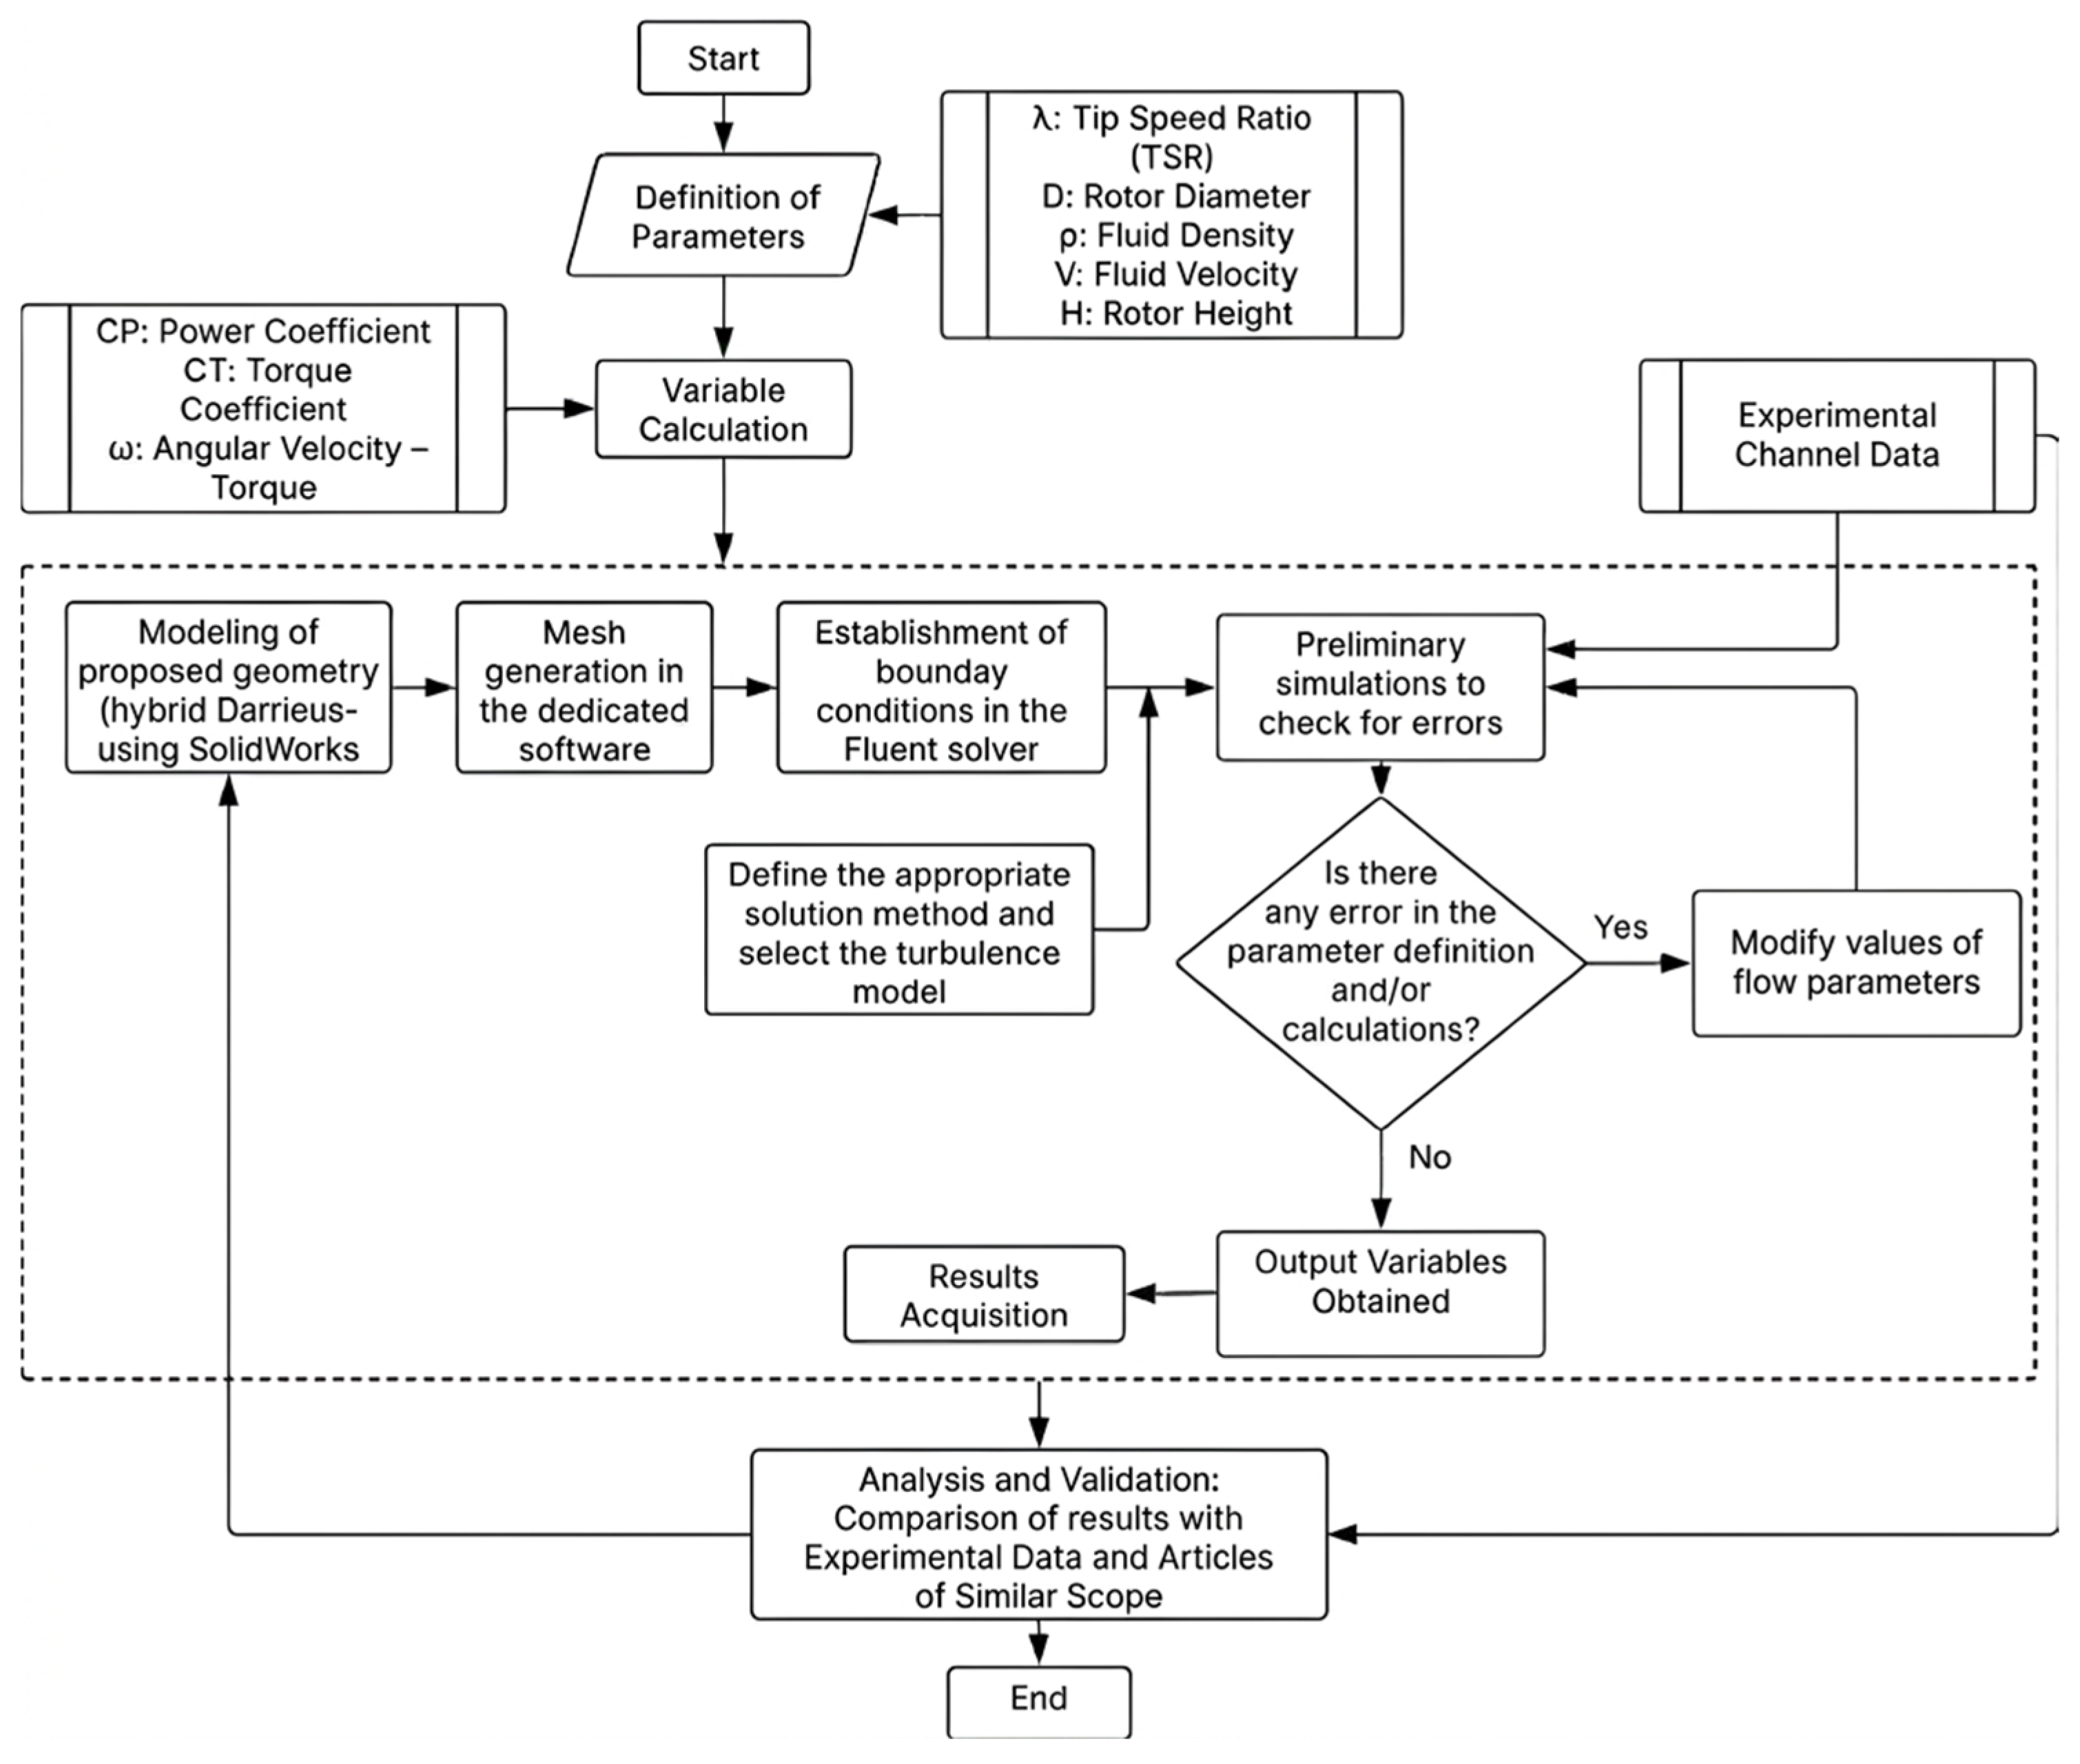
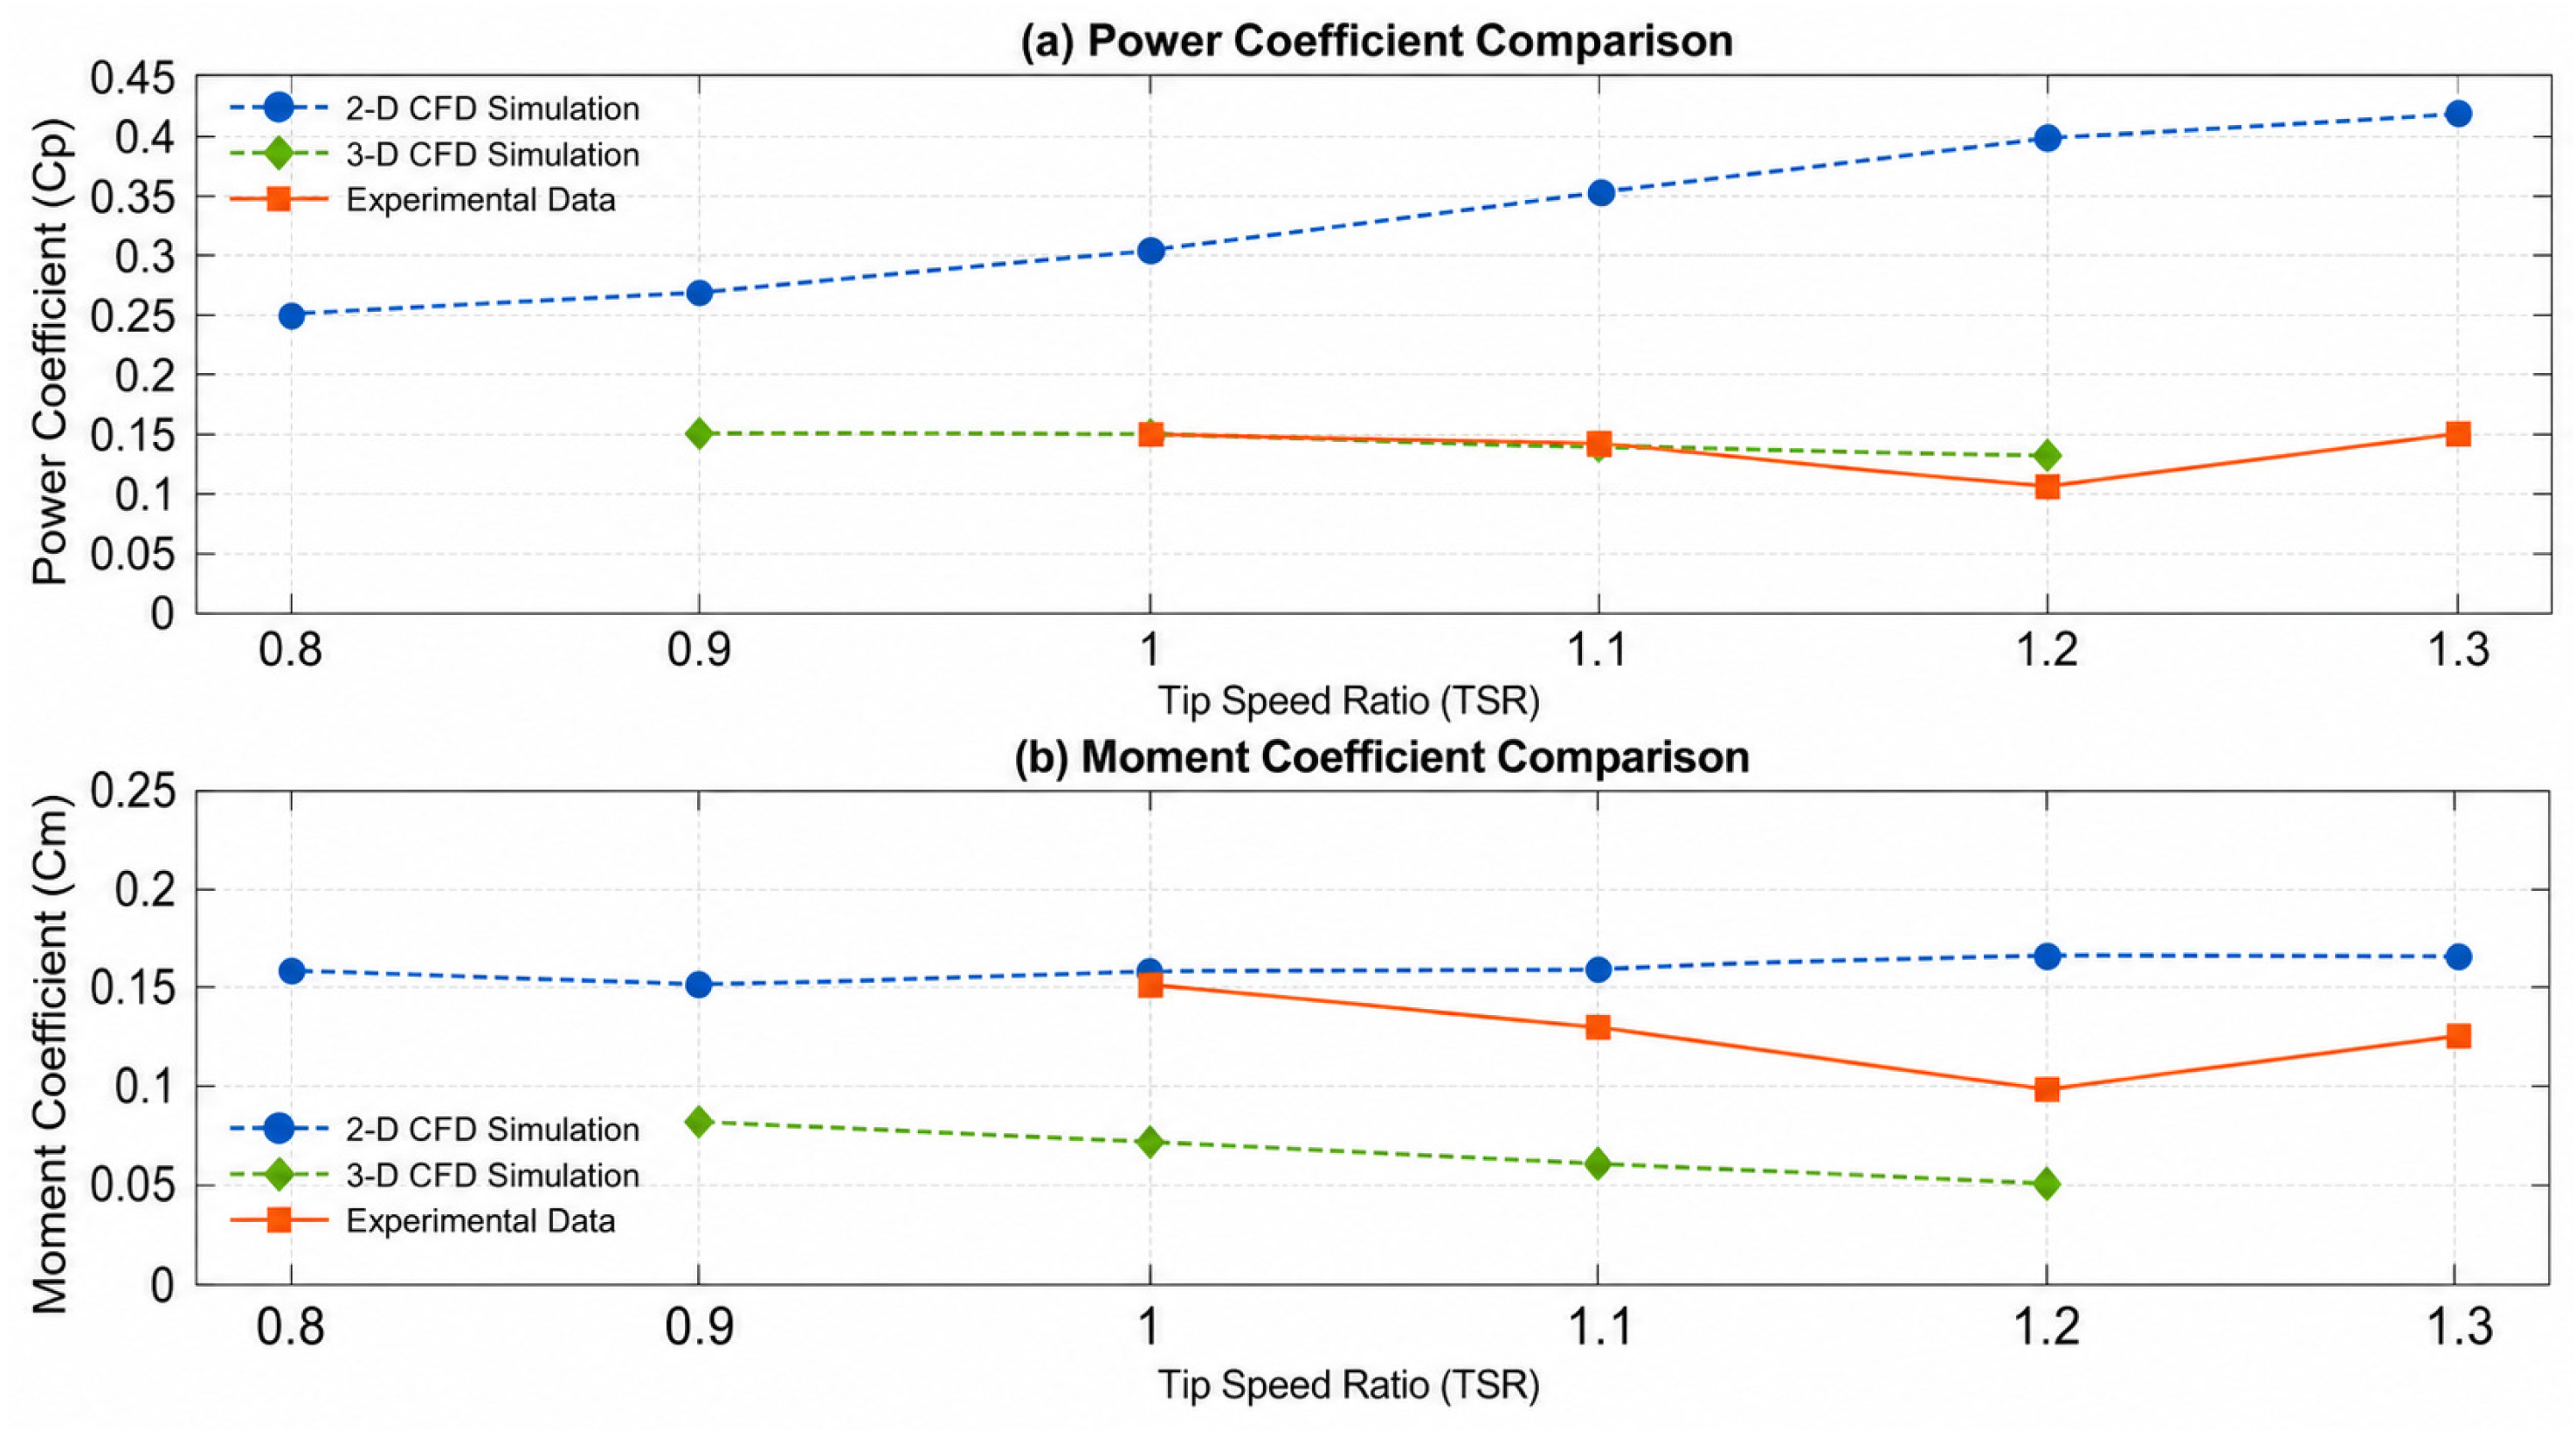
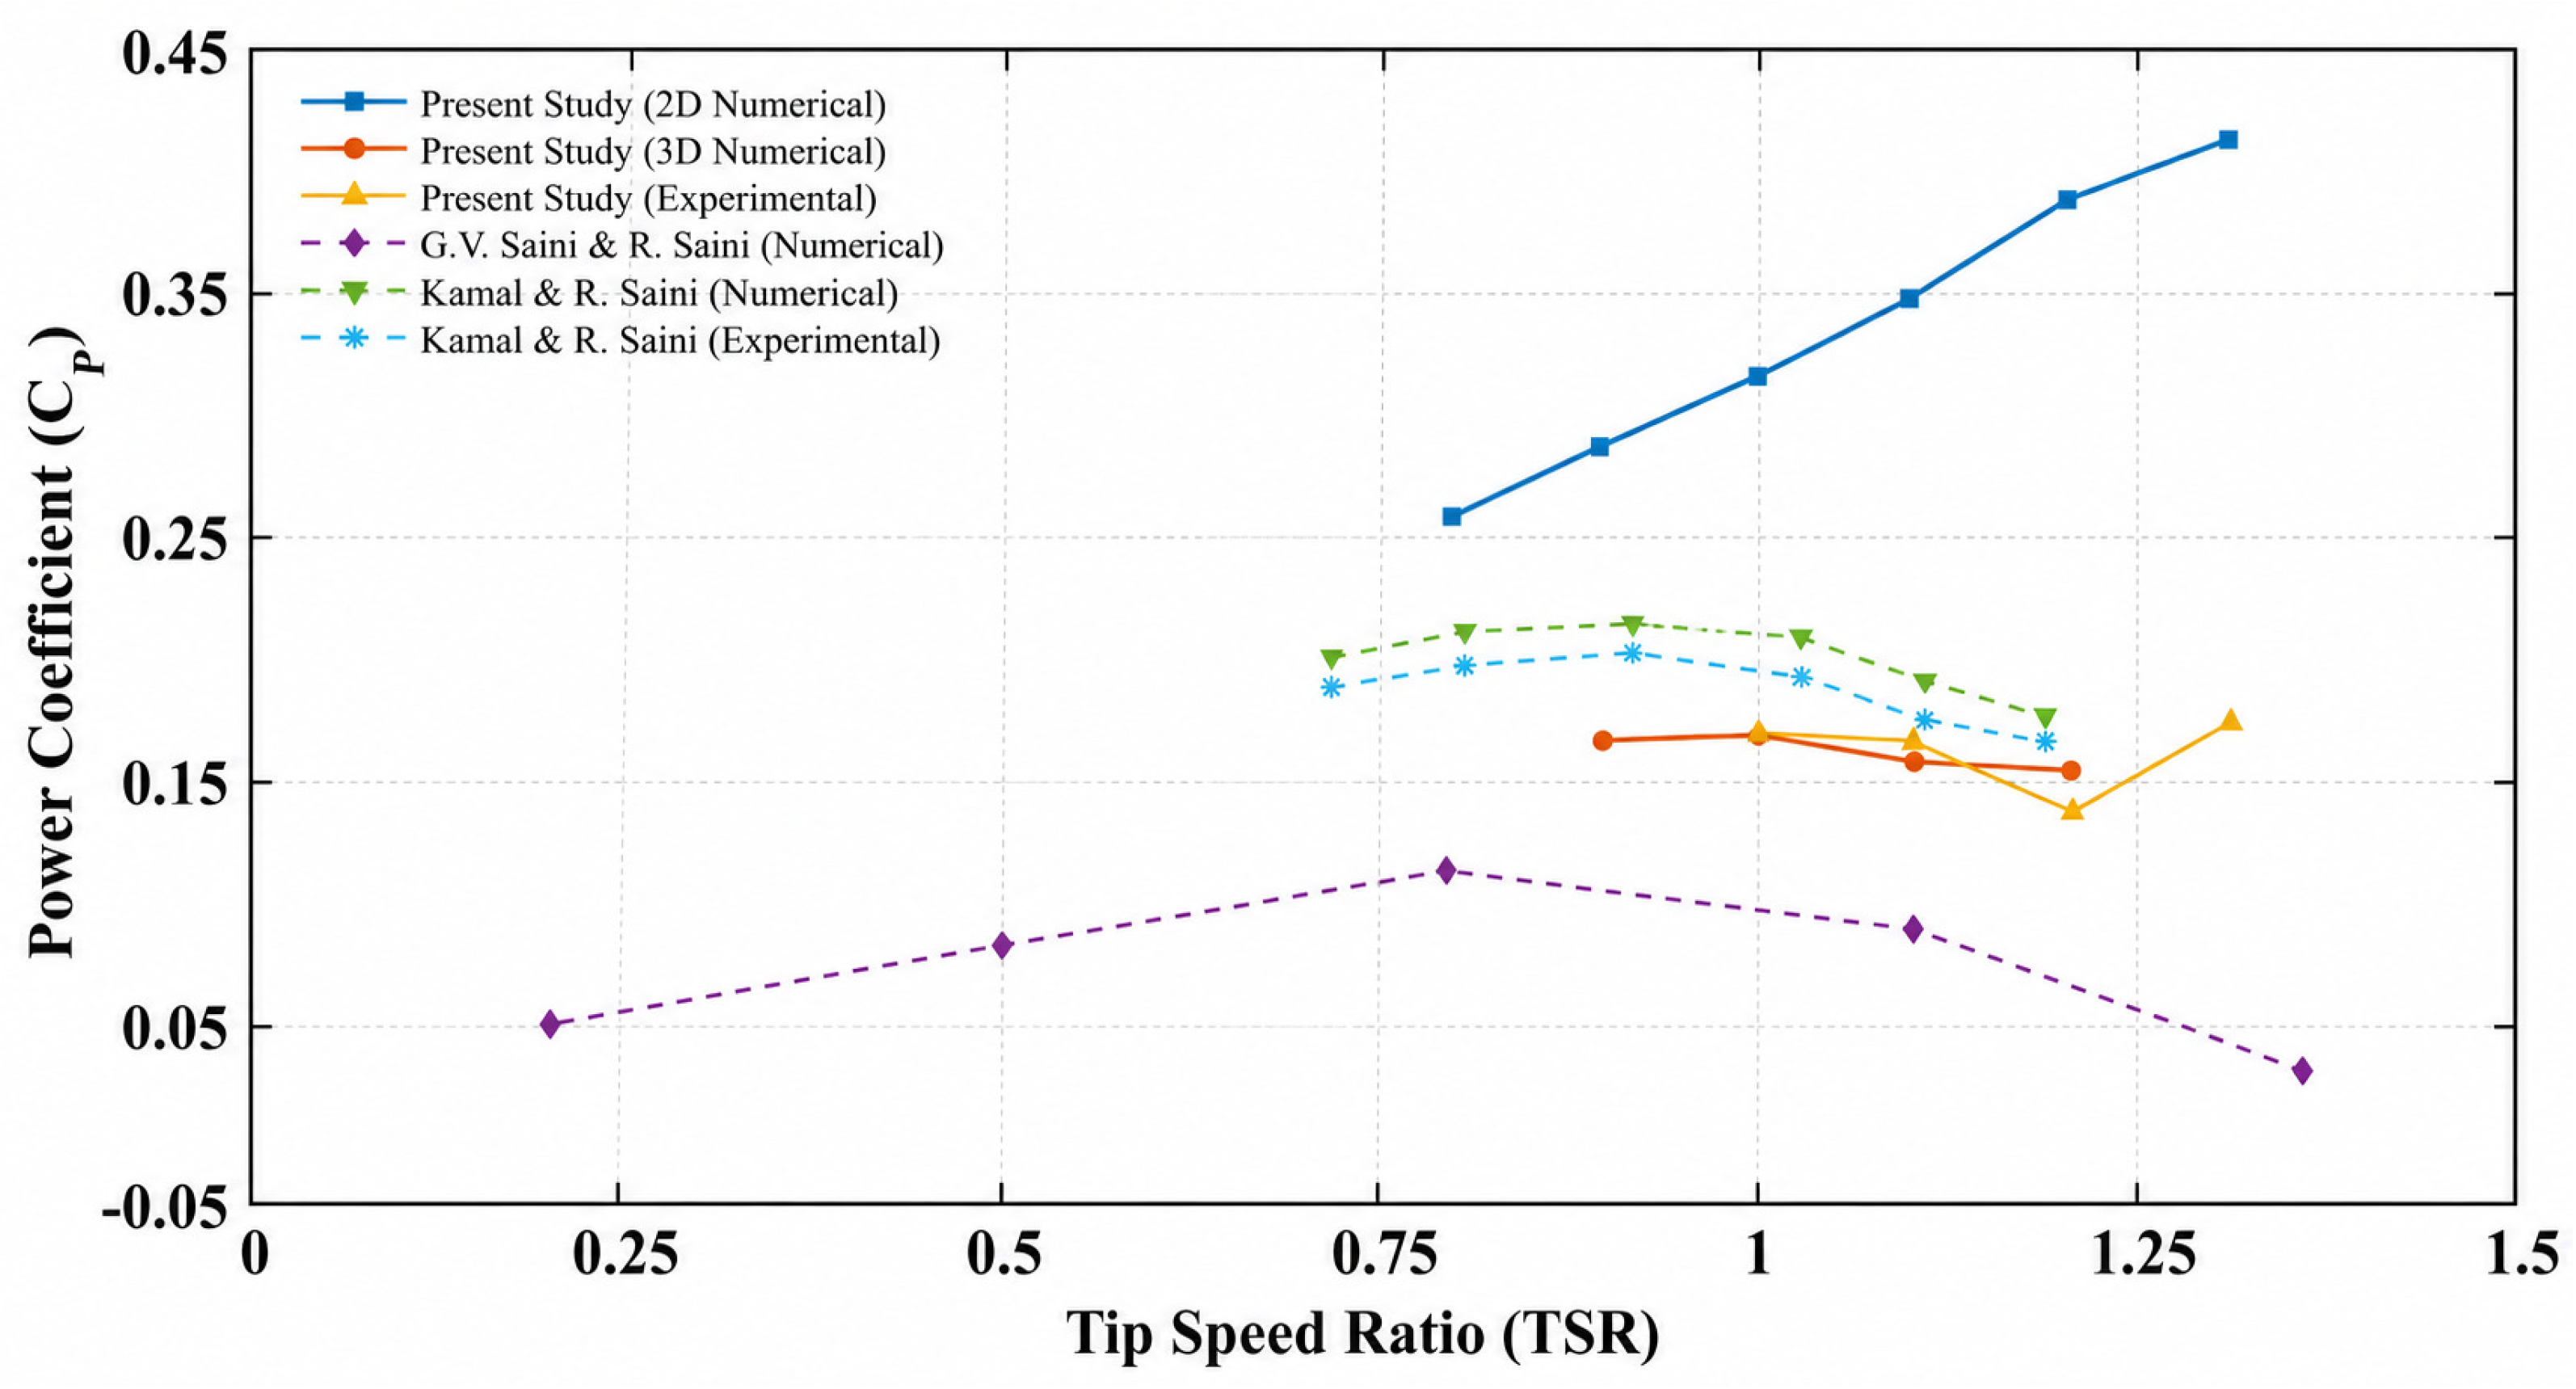
Once the simulations are completed, the results will be analyzed, with a primary focus on the functional relationship between the power coefficient () and the tip speed ratio (TSR) of the hydrokinetic turbine. These results will be compared with similar curves reported in the literature to evaluate the accuracy and validity of the obtained data. This analysis corresponds to the final stages of the diagram, where the output variables are interpreted and benchmarked against previous studies to ensure the consistency and validity of the simulations.
The following flowchart shown in
Figure 1 illustrates the process:
Transient simulations are executed across multiple rotor revolutions to achieve numerical stabilization. This process begins at a lower rotational speed, which is gradually increased to monitor the evolution of the torque and power coefficients while isolating potential calculation errors.
Once numerical convergence is achieved, the functional relationship between the power coefficient and the tip speed ratio (TSR) is extracted. Finally, these numerical curves are benchmarked against similar data reported in the literature to validate the accuracy, consistency, and predictive capability of the computational model.
2.1. Design and Investigated Parameters
The process will begin with researching and collecting relevant information to define the critical parameters for the hydrokinetic turbine design, such as the tip speed ratio (TSR), rotor diameter, fluid density, and the operating conditions of the hydraulic channel. This phase aligns with the first block of the diagram, which defines the essential parameters for calculating the design variables [
14,
15,
16,
17].
The hydraulic channel design utilizes the energy equation, which allows for the determination of the mechanical load on the pumps, the required drive power of the electric motors, and the operating points of the pumping systems based on the manufacturer’s performance curves.
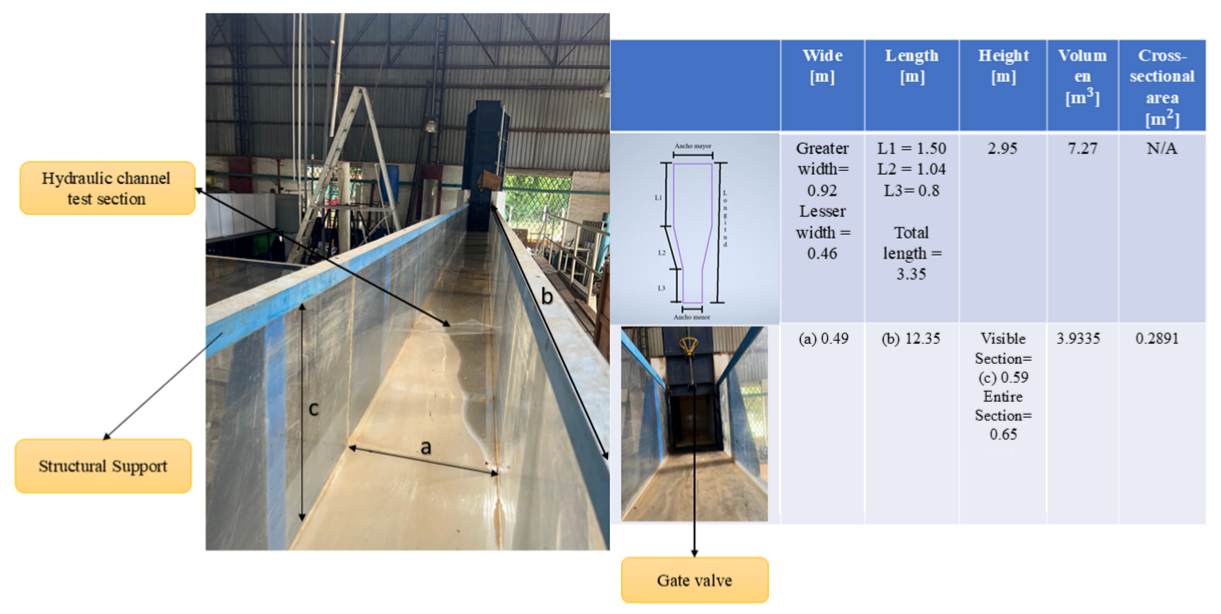
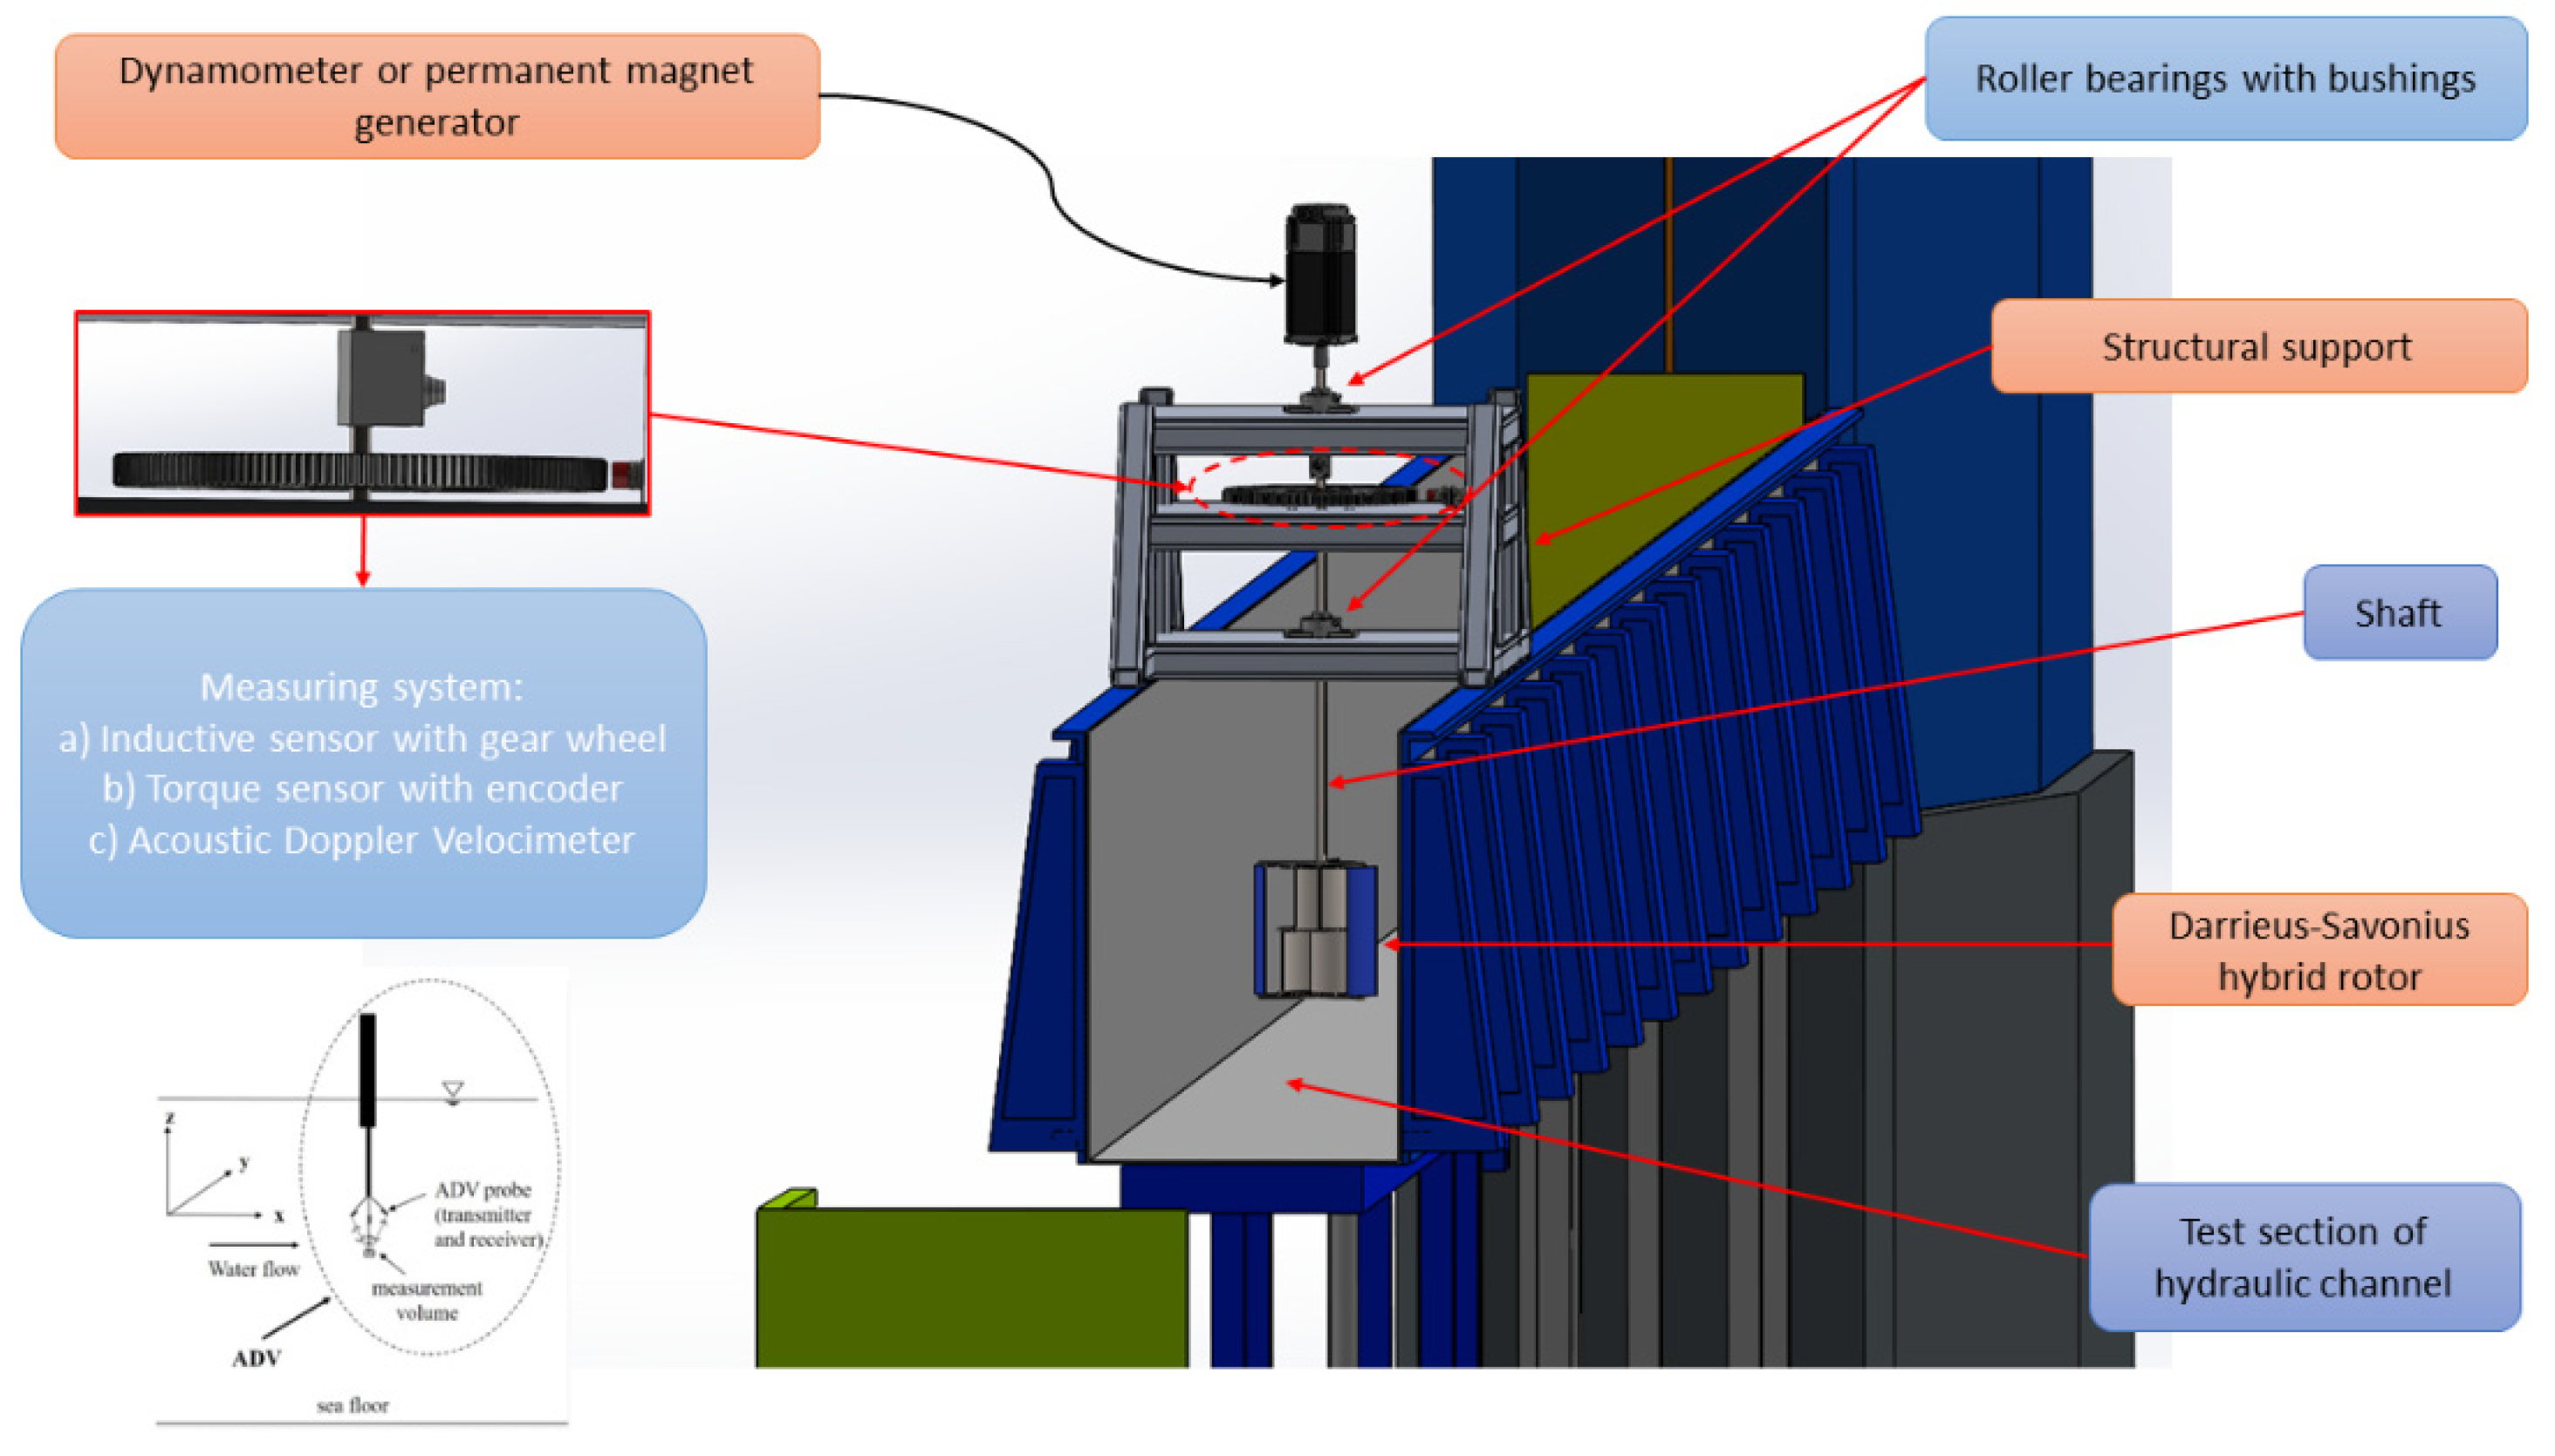
The flow velocity and dynamic torque measurement experiments will be conducted in an open channel equipped with a closed-loop pumping system. The installation has a rectangular cross-section 0.49 m wide and 0.60 m deep, with a total length of 12 m. The walls and bottom of the channel are made of 15 mm thick smooth acrylics. Water circulation is achieved by a centrifugal pump, whose rotational speed is regulated by an ABB frequency converter to control the flow. During the experiments, the flow velocity will be maintained at uniform speeds between 0.2 and 0.8 m/s, with depths ranging between 0.30 and 0.60 m. The construction characteristics of the experimental channel are shown in
Figure 2.
The blockage ratio is defined as the ratio between the turbine swept area and the cross-sectional area of the hydraulic channel:
The cross-sectional area of the channel is (
). The swept area of the turbine (
) determines the volume of water intercepted by the rotor and, consequently, the amount of kinetic energy available for conversion. By setting a blockage ratio
[
17], an effective conversion area
is obtained, a value that represents a suitable compromise between mechanical loads on the blades and energy capture capacity. This value was selected as a compromise between obtaining sufficient hydraulic loading for torque measurement and avoiding excessive confinement of the rotor by the channel walls and free surface. However, a blockage ratio of 20% is not negligible and may influence the measured hydrodynamic performance. The presence of the rotor reduces the available flow passage, causing local flow acceleration around the blades, increasing the pressure difference across the rotor, and modifying the wake development and bypass flow.
The influence of blockage has been reported for hybrid hydrokinetic turbines. G. Saini and R. P. Saini [
17] found numerically that increasing the blockage ratio enhanced the power coefficient because the restricted flow passage accelerated the fluid through the rotor; their maximum reported performance occurred at a blockage ratio of approximately 26.32%, a clearance ratio of 0.55, and a TSR of approximately 0.98. Although this acceleration can increase the apparent power extraction in a laboratory channel, it does not necessarily represent the performance of the same rotor in an unconfined river or channel. This issue is also recognized in international guidance for water-current energy converters: IEC TS 62600-202 [
26] defines blockage as the ratio of the projected converter area to the test-section area and warns that confinement can exaggerate performance, particularly when the ratio becomes greater than approximately 5%.
The selection of was adopted as a practical compromise between obtaining measurable torque at the low flow velocities available in the laboratory channel and limiting the structural and hydraulic loads on the rotor. Nevertheless, this value represents a moderate-to-high confinement condition, and the resulting performance coefficients should be considered specific to the tested channel geometry.
Based on the available area and considering a rotor aspect ratio of AR = 1, the maximum dimensions that satisfy this requirement are a rotor diameter of and a height of .
Average flow velocity measurements in the hydraulic channel test section were performed using an acoustic Doppler velocity (ADV) meter, ADV-SY 49772, with an operating range of 0.001 to 4 m s
−1 (0.0001 m s
−1 resolution), and an acoustic frequency of 10 MHz.
Table 1 presents the values recorded during the experimental stage of the current study.
In the present investigation, the preliminary design of the hybrid vertical-axis hydrokinetic turbine (VAHT) rotor to be tested in the experimental water channel considers an estimated flow rate of 1500 gal/min, corresponding to an available hydraulic power in the test section ranging from 1 W to 15 W.
For the Darrieus component, the outer rotor diameter was determined to be 200 mm, with three blades and a chord length of approximately 80 mm. The hydrofoil profile plays a critical role in the hydrodynamic performance of the turbine. Therefore, based on previous numerical and experimental studies, several hydrofoil profiles were considered, including NACA 0018, NACA 4418, and S-1046. Among these candidates, the NACA 4418 hydrofoil was selected due to its demonstrated high hydrodynamic efficiency in similar applications [
27,
28].
The rotor height for the Darrieus component was set to 200 mm, resulting in a compact configuration suitable for its operation in the experimental water channel.
For the Savonius component, a two-bladed configuration is adopted, with an overlap ratio of 25% of the semicircular internal diameter of the blade. This configuration was selected due to its favorable compromise between starting torque and hydrodynamic performance reported in previous studies [
29].
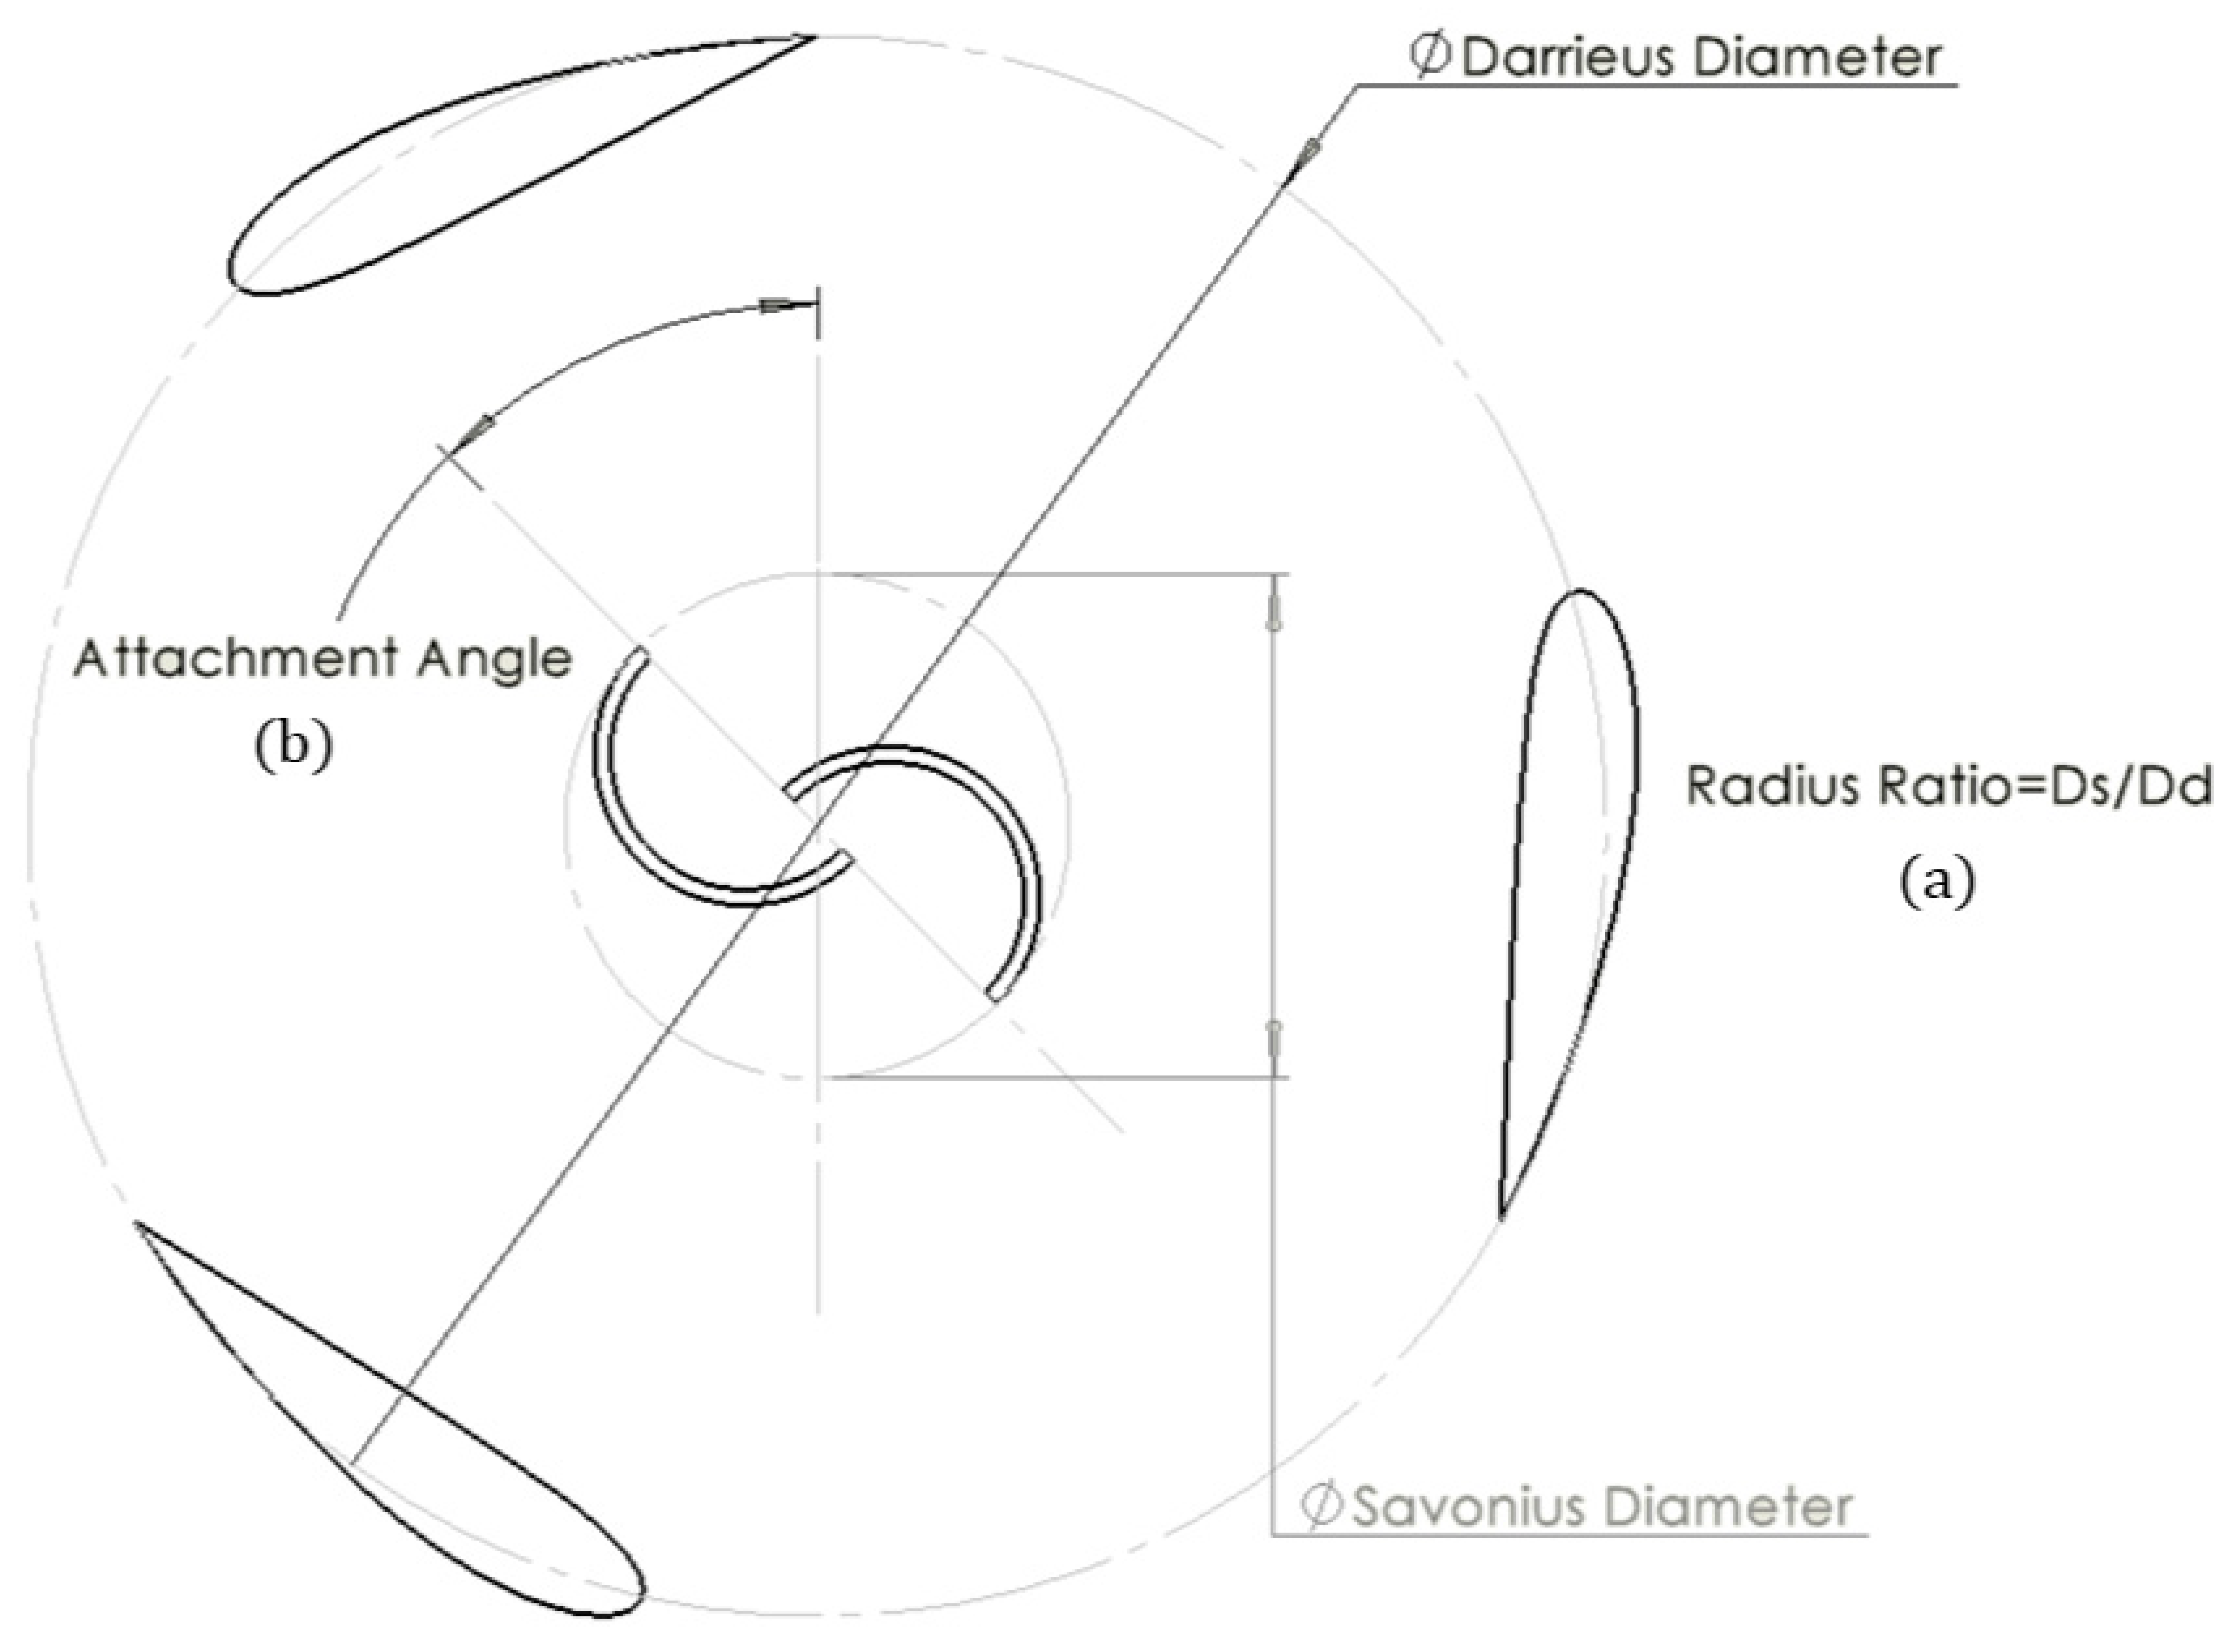
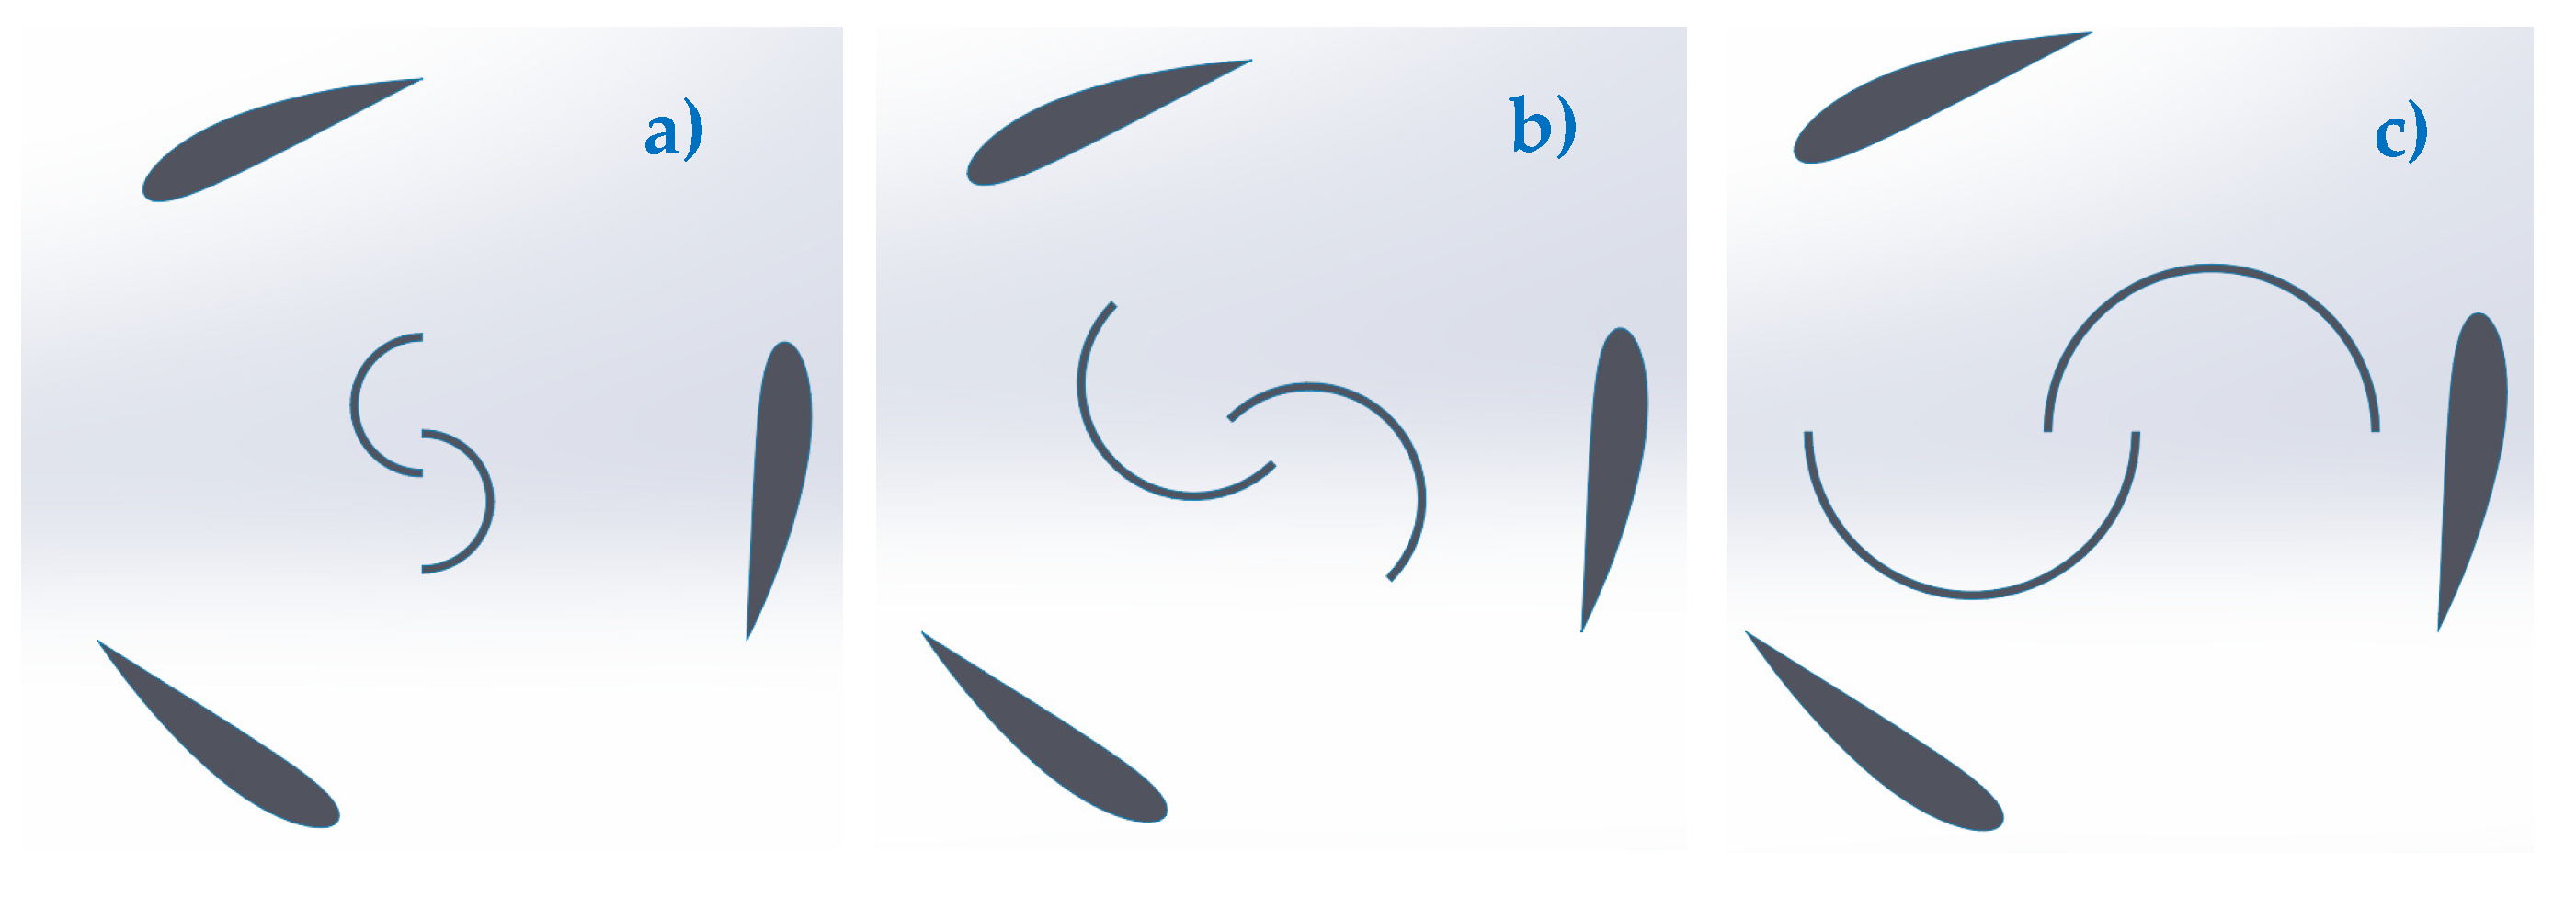
In the hybrid turbine configuration, two main geometric parameters are considered to analyze the interaction between the Savonius and Darrieus rotors. The first parameter is the radius ratio (RR), defined as the ratio between the Savonius and the Darrieus rotor diameter. In this study, the radius ratio is varied at 0.3, 0.5, and 0.7.
The second parameter is the attachment angle (AA), which defines the relative angular position of the Savonius rotor with respect to the Darrieus rotor. Three attachment angles are considered in the analysis: 0°, 45°, and 90°.
These levels were selected to represent low, intermediate, and high Savonius-to-Darrieus size ratios while satisfying the dimensional, manufacturing, blockage, and test-section constraints of the experimental rotor. Similarly,
,
, and
were selected to represent aligned, intermediate, and orthogonal relative positions of the two rotors (in our study, the measurement of the AA is from the vertical axis as shown in
Figure 3). This selection enabled a balanced 27-case full-factorial design while maintaining feasible computational requirements.
The geometrical value
, which has been reported as an optimum value in previous studies, was not included in the present investigation. This omission was related to the selected physical diameter levels and the scope of the preliminary design study. Furthermore, the optimum value reported in the literature was obtained for different geometrical and operating conditions, including an S-1046 Darrieus profile, helical Savonius blades, a different overlap ratio, a shorter rotor height, and different attachment angle and Reynolds number ranges. The key design parameters used in the hybrid rotor, are shown in
Table 2.
2.2. Turbine Modeling and Computational Domain
Once the design parameters of the Darrieus–Savonius hybrid turbine were defined, it was modeled in two dimensions using SolidWorks as the primary tool, given its ability to accurately handle imported curves, a particularly relevant aspect in the construction of Darrieus-type blades. The Savonius rotor was designed in the same environment, integrating both components into a single assembly that incorporated a shared rotational domain, a fundamental requirement for accurately representing the hydrodynamic interaction between the two rotors. After the geometric design was completed, the model was exported to ANSYS-Design Modeler, where the stationary and rotational domains necessary for subsequent numerical analysis were developed [
15,
16,
17,
18]. The fluid environment was represented by an enclosure that enabled Boolean operations to ensure adequate separation between the fluid domains and the moving components, and to ensure correct interaction between them.
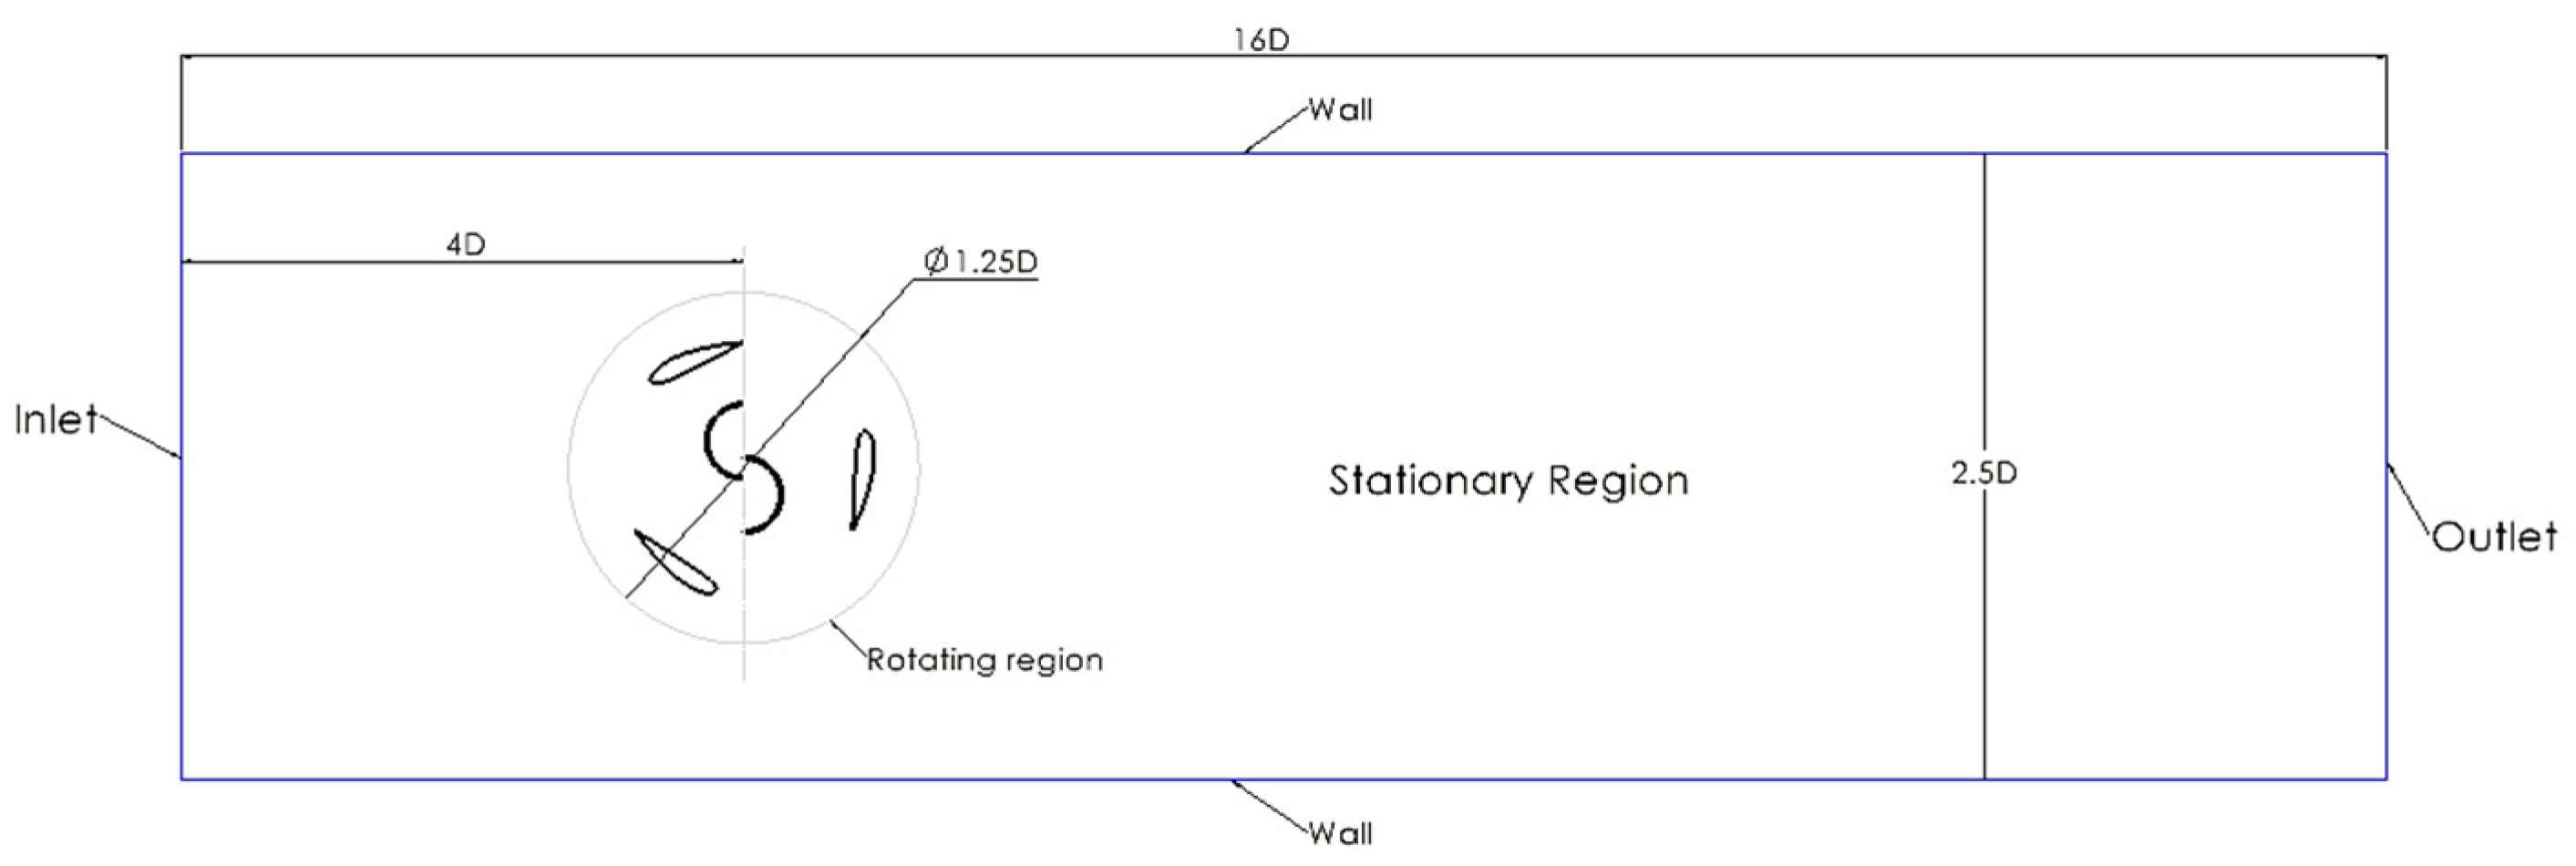
The computational domain dimensions are shown in
Figure 3 and were established based on criteria validated in the literature and best practices for numerical modeling, considering the following:
▪ Lateral width: five times the maximum radius of the Darrieus blades (2.5D).
▪ Inlet: an inlet distance equivalent to eight times the radius (4D) measured from the center of the turbine.
▪ Outlet: an outlet distance equivalent to twenty-four times the radius (12D).
These proportions ensure adequate domain extension to avoid boundary effects and to correctly represent the flow field around the hybrid rotor. To determine the performance characteristics of the hybrid Darrieus–Savonius rotor, a 2D computational domain will be created and divided into two regions: a stationary zone and a rotating zone. The stationary zone, with a rectangular geometry (3200 mm × 500 mm), represents the water flow within the channel and includes the inlet, outlet, and walls. The dimensions and external boundary conditions of the computational domain are like those reported in [
17,
18,
20,
23].
The rotating zone, on the other hand, will enclose the entire turbine and will rotate at the same angular velocity as the hybrid hydrokinetic turbine. This rotating region will have a cylindrical shape, and based on preliminary research findings, the diameter of the rotating enclosure is recommended to fall within the range of 1.25–2 times the diameter of the turbine. This configuration is significant in both CFD simulations and experimental investigations [
10,
11]. The computational domain and the upper view of the hybrid rotor are shown in
Figure 4.
2.3. Discretization of the Computational Domain
The 2D computational domain is divided into a stationary region and a rotating region, coupled via the sliding mesh technique. The governing Unsteady Reynolds-Averaged Navier–Stokes (URANS) equations, closed with the
SST turbulence model, are solved across this discretized domain to approximate the flow variables [
30]. The established boundary conditions consist of the following:
- ▪
Inlet: Uniform velocity matching the mean velocity of the test section.
- ▪
Outlet: Pressure outlet set to atmospheric pressure.
- ▪
Walls and blades: No-slip conditions applied to the channel walls and turbine blade surfaces.
- ▪
Interface: Numerical interface matching the continuity at the zone connecting the rotating and stationary regions.
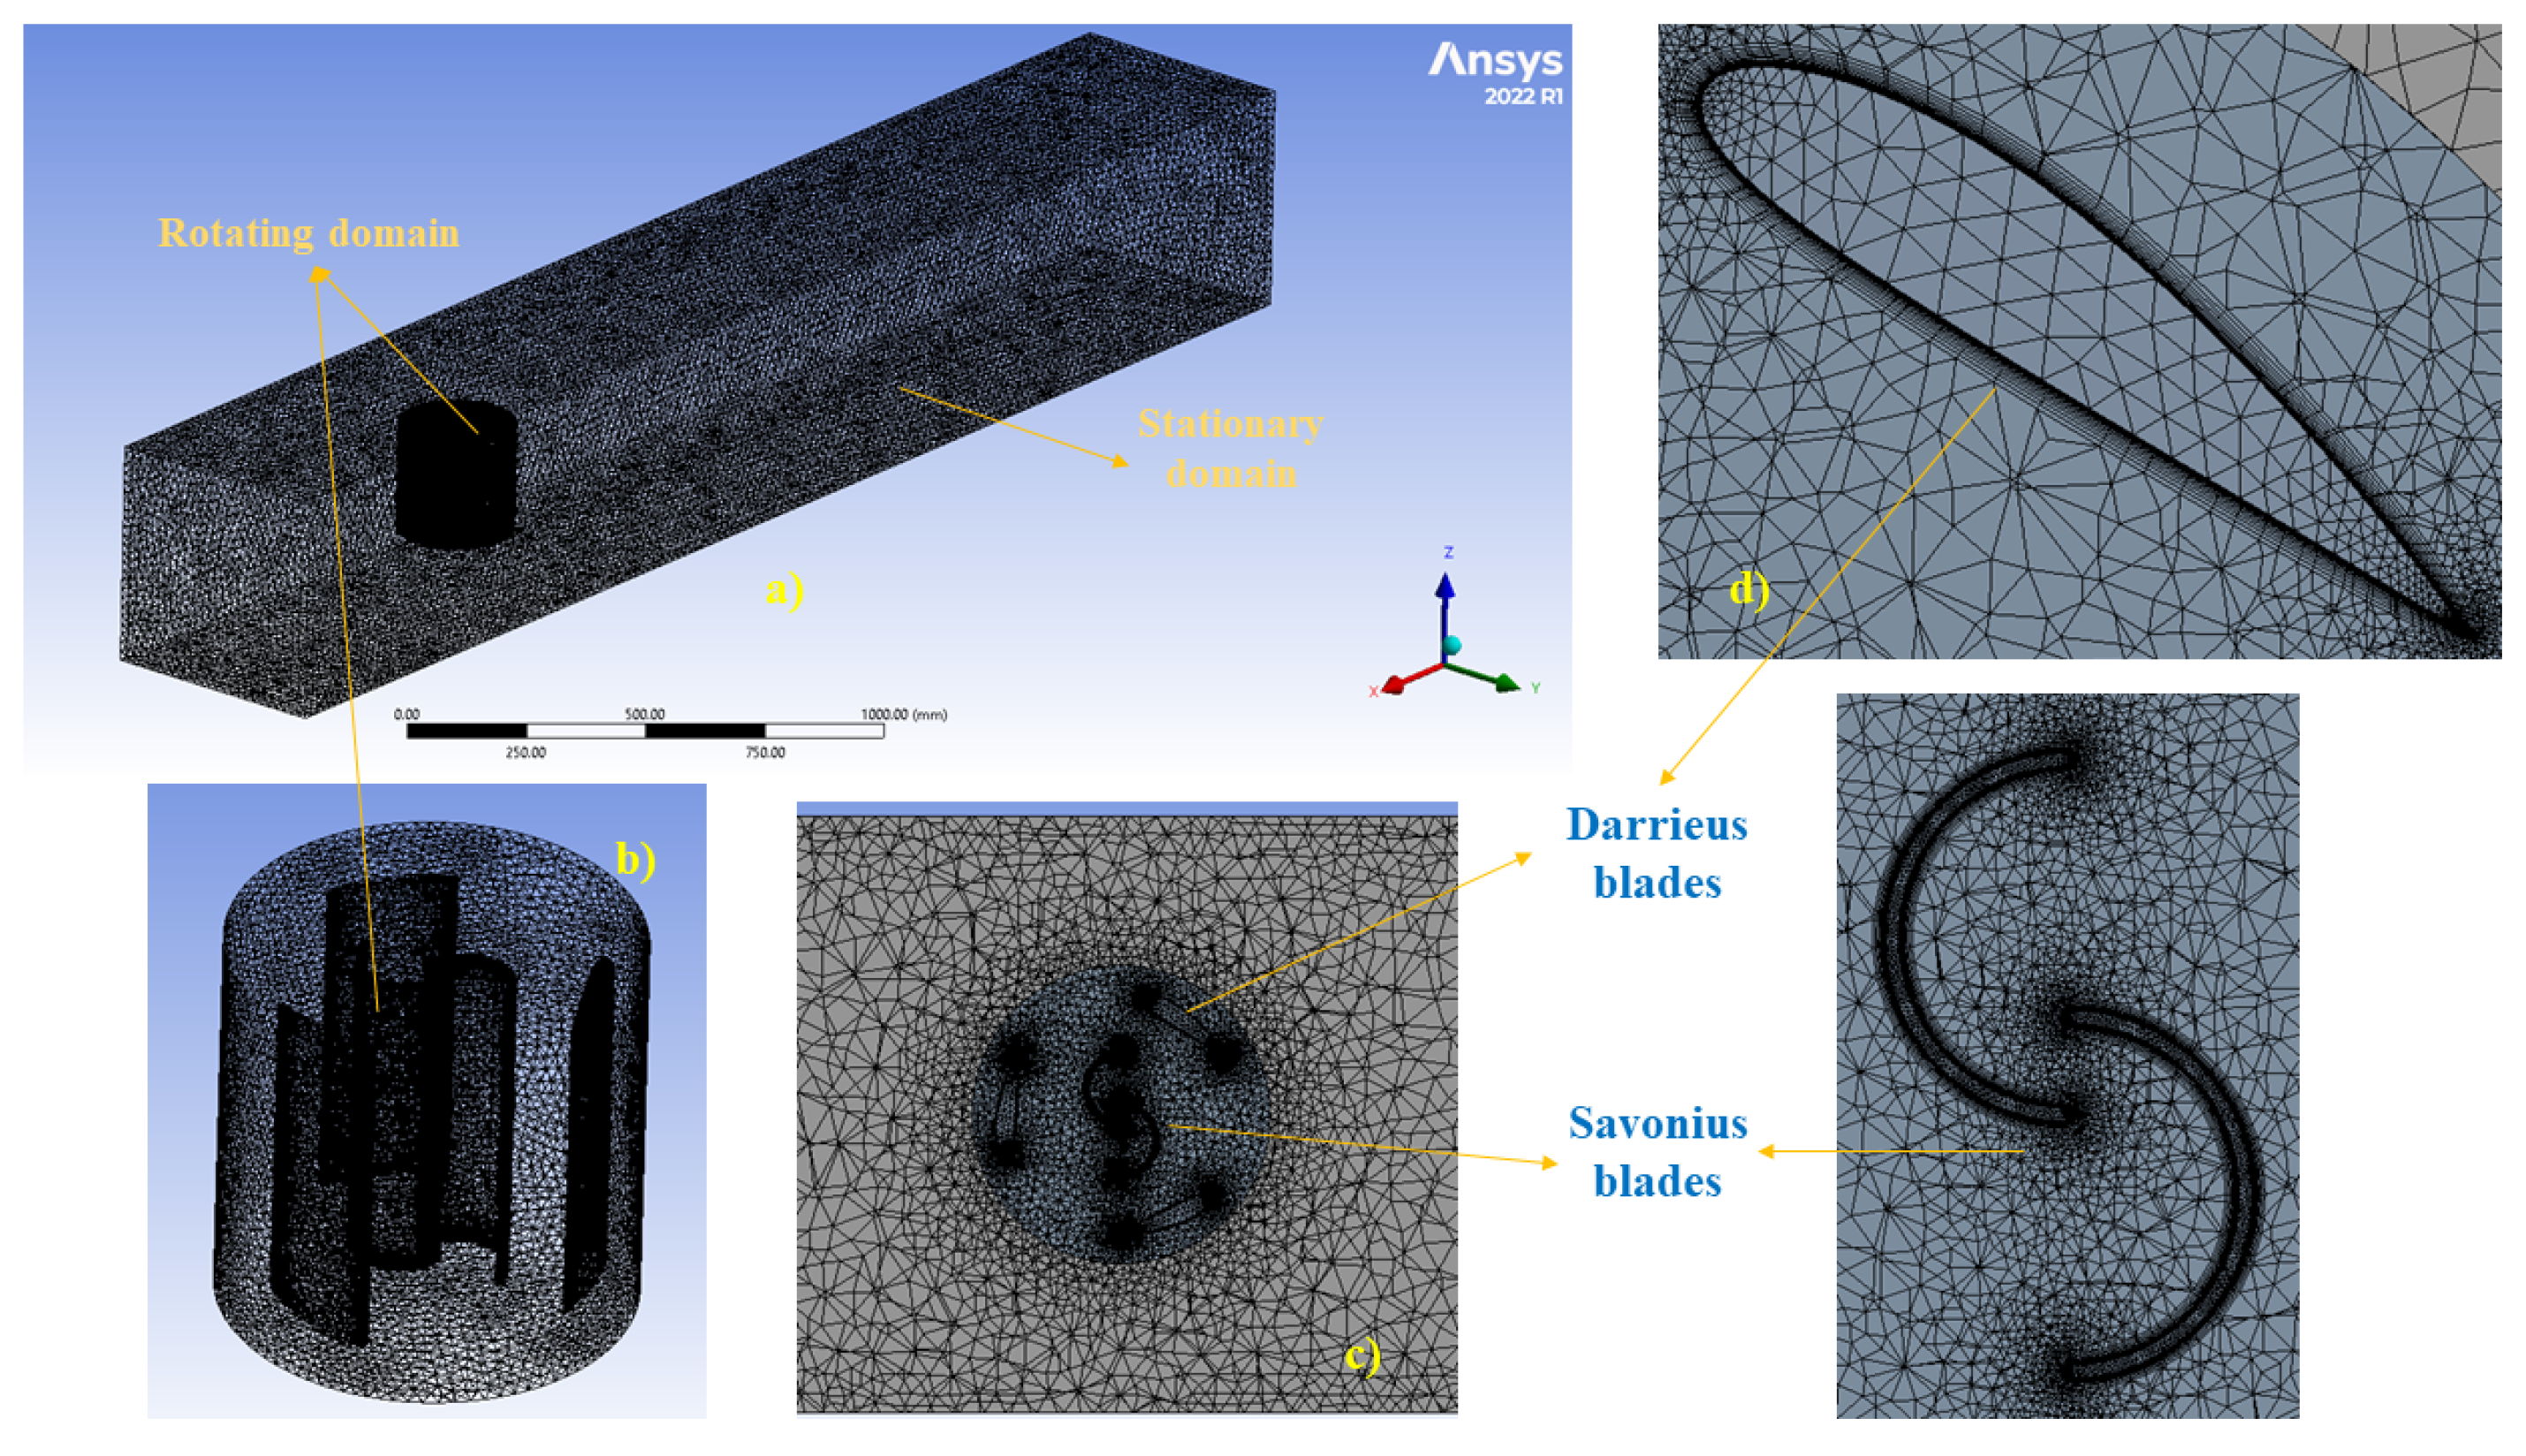
Grid generation was performed within the ANSYS Meshing module using an unstructured grid approach for its geometric flexibility and quality. To accommodate the 2D nature of the simulation, the All Triangles method was selected to precisely conform to the highly curved hydrofoils of the hybrid Darrieus–Savonius blades and maintain a homogeneous element distribution. To improve the grid topology, specific sizing controls were implemented:
- ▪
Body sizing: Applied to the rotational domain to maintain a high, uniform cell density where the complex behavior of the flow occurred through the hybrid rotor.
- ▪
Edge sizing: Configured with 5000 divisions on both the inner and outer faces of the sliding interface boundaries, ensuring fine control and smooth data transfer across the coupling zone.
To resolve the turbulent boundary layer over the surface of the blades, the size of the first element of the mesh in the normal direction to the blade surface should satisfy the restriction
. In the context of a VAHT simulation, this criterion must be satisfied regardless of the meshing technique used [
15,
16,
17,
18]. The
is a dimensionless parameter defined as follows:
where
y is the distance to the wall,
is the friction velocity, and
is the fluid’s kinematic viscosity [
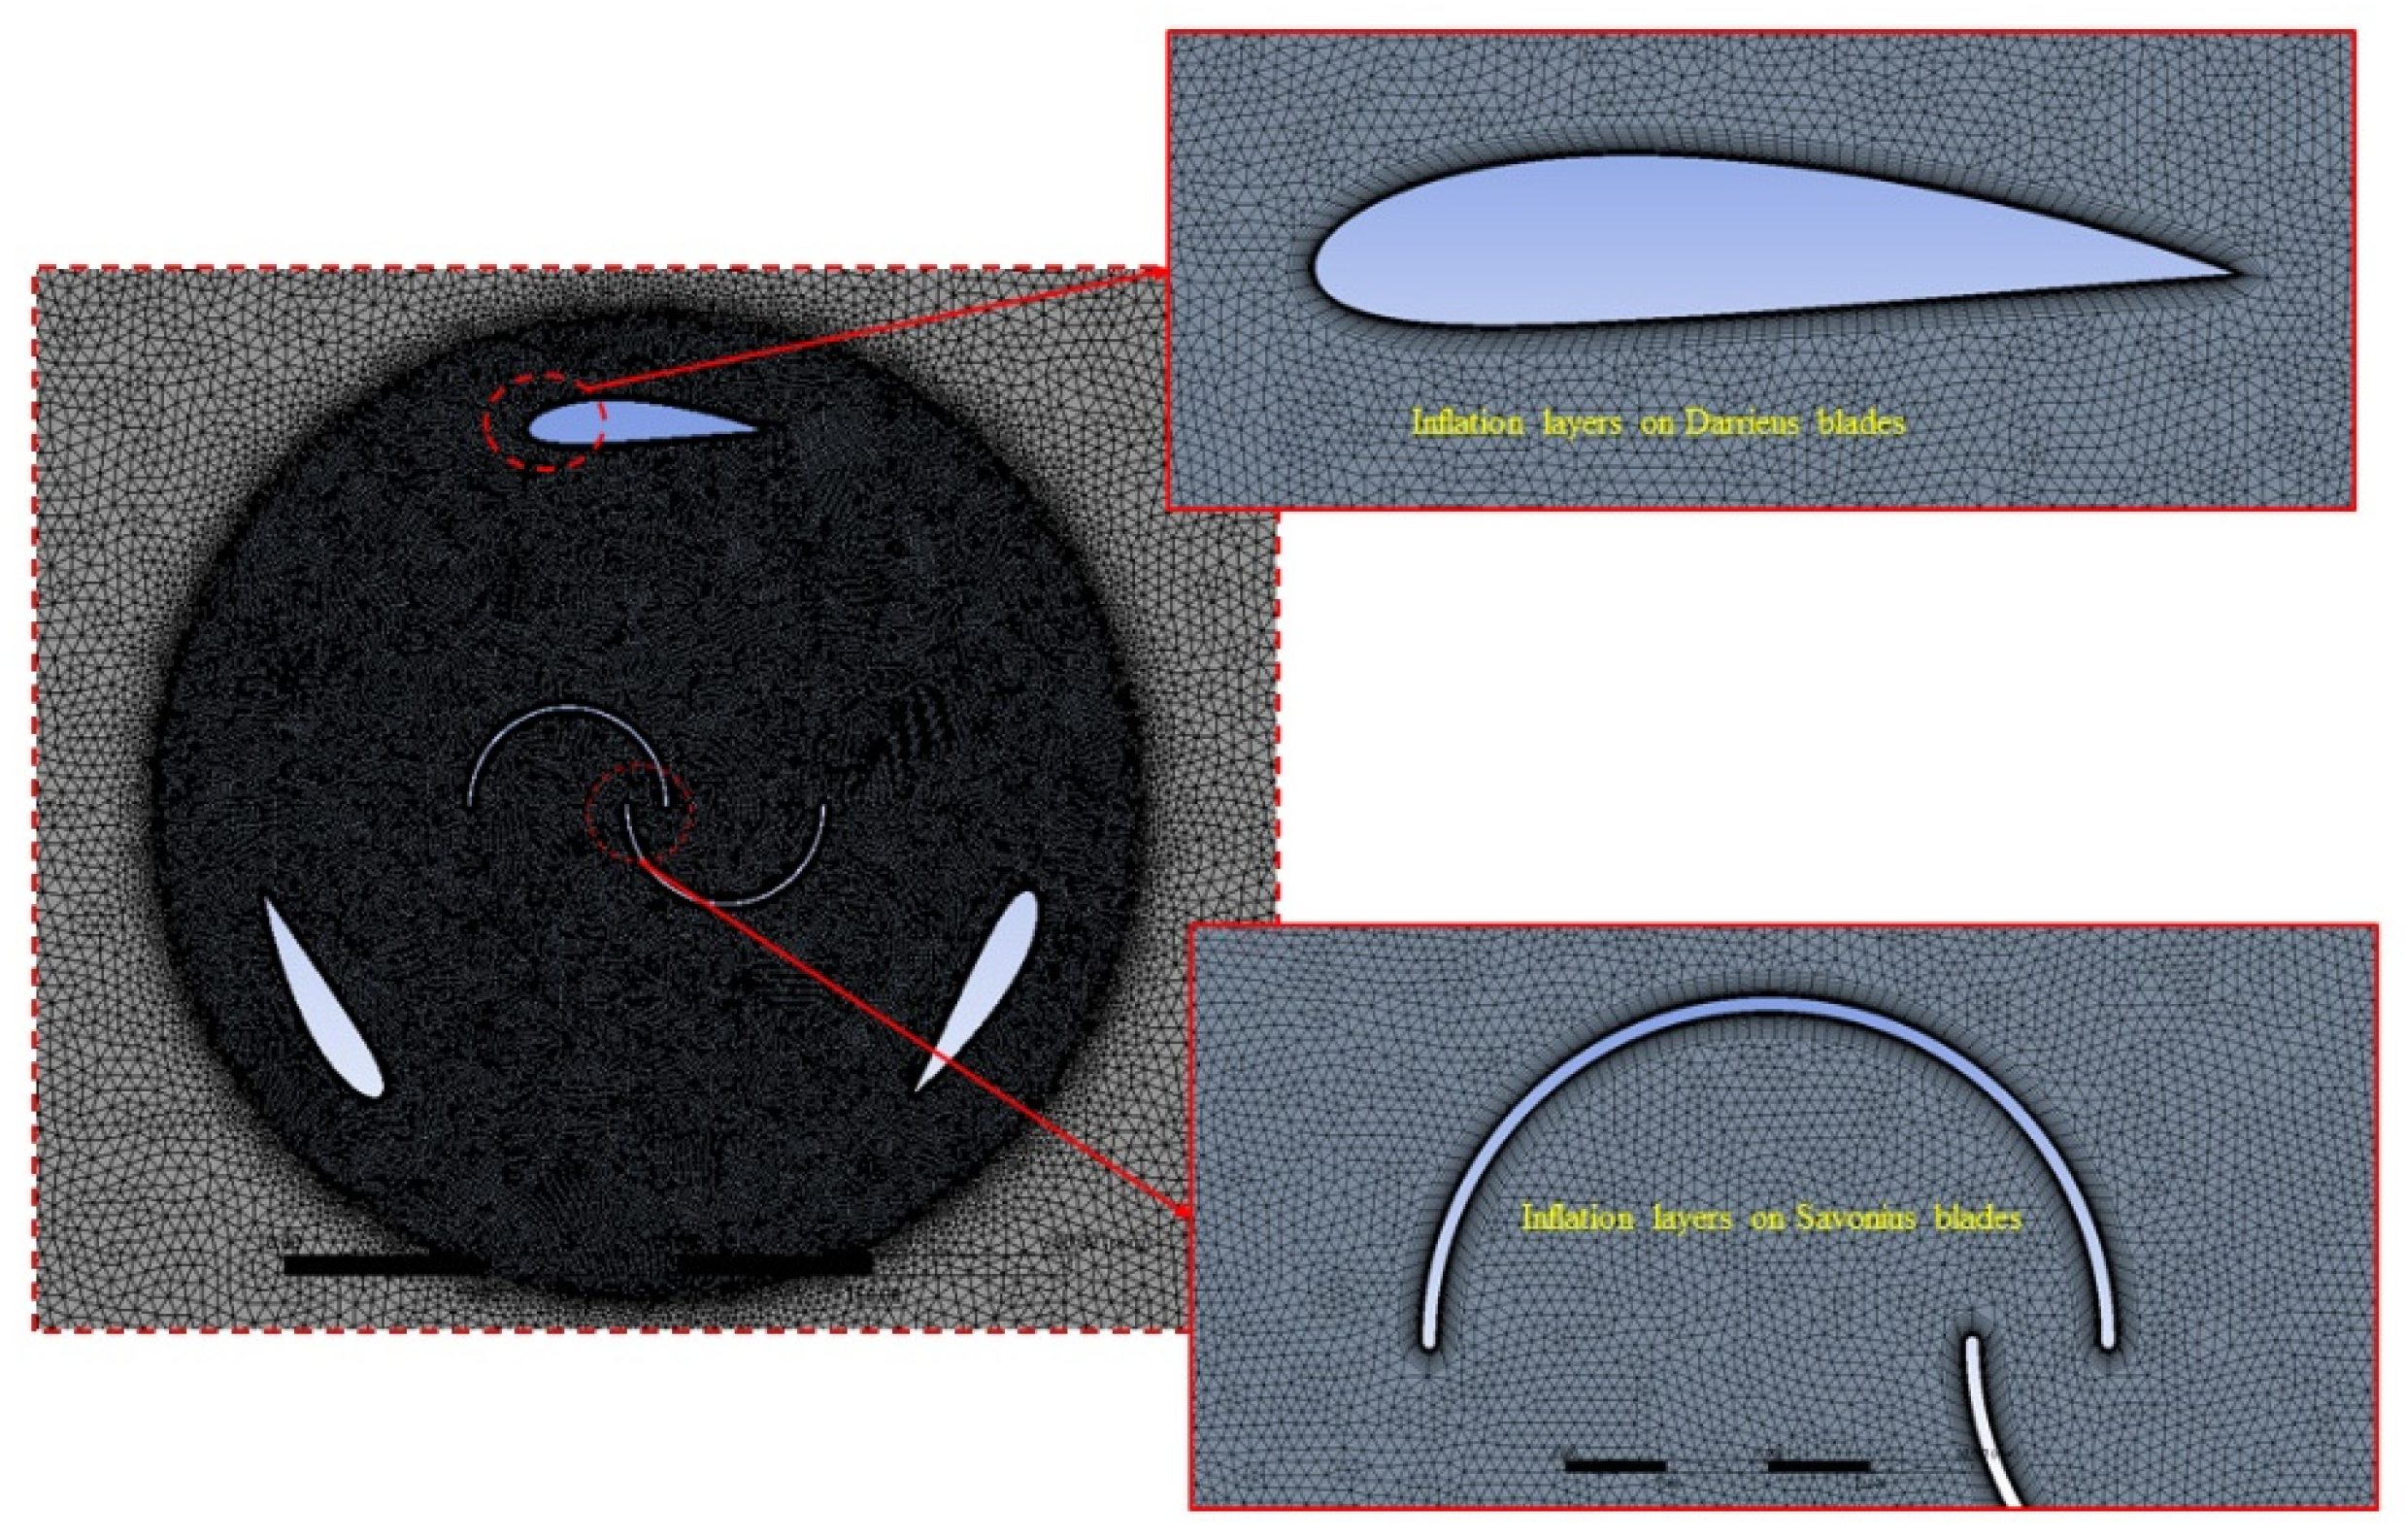
30]. Finally, the Darrieus and Savonius blades were meshed using the inflation tool, which adequately captured the effects near the wall, especially within the boundary layer. This technique is fundamental for accurately predicting the hydrodynamic behavior of the hybrid rotor. The construction of the 2D numerical simulation mesh is shown in
Figure 5.
A mesh independence study was conducted to evaluate the sensitivity of the numerical solution to grid density by varying the stationary domain’s element size from 3 mm to 7 mm. Throughout these simulations, the rotating mesh element size was kept constant at 1 mm, the inlet flow velocity was fixed at 0.634 m/s (corresponding to a Reynolds number of 43,000), and the rotor angular velocity was set to 5.072 rad/s.
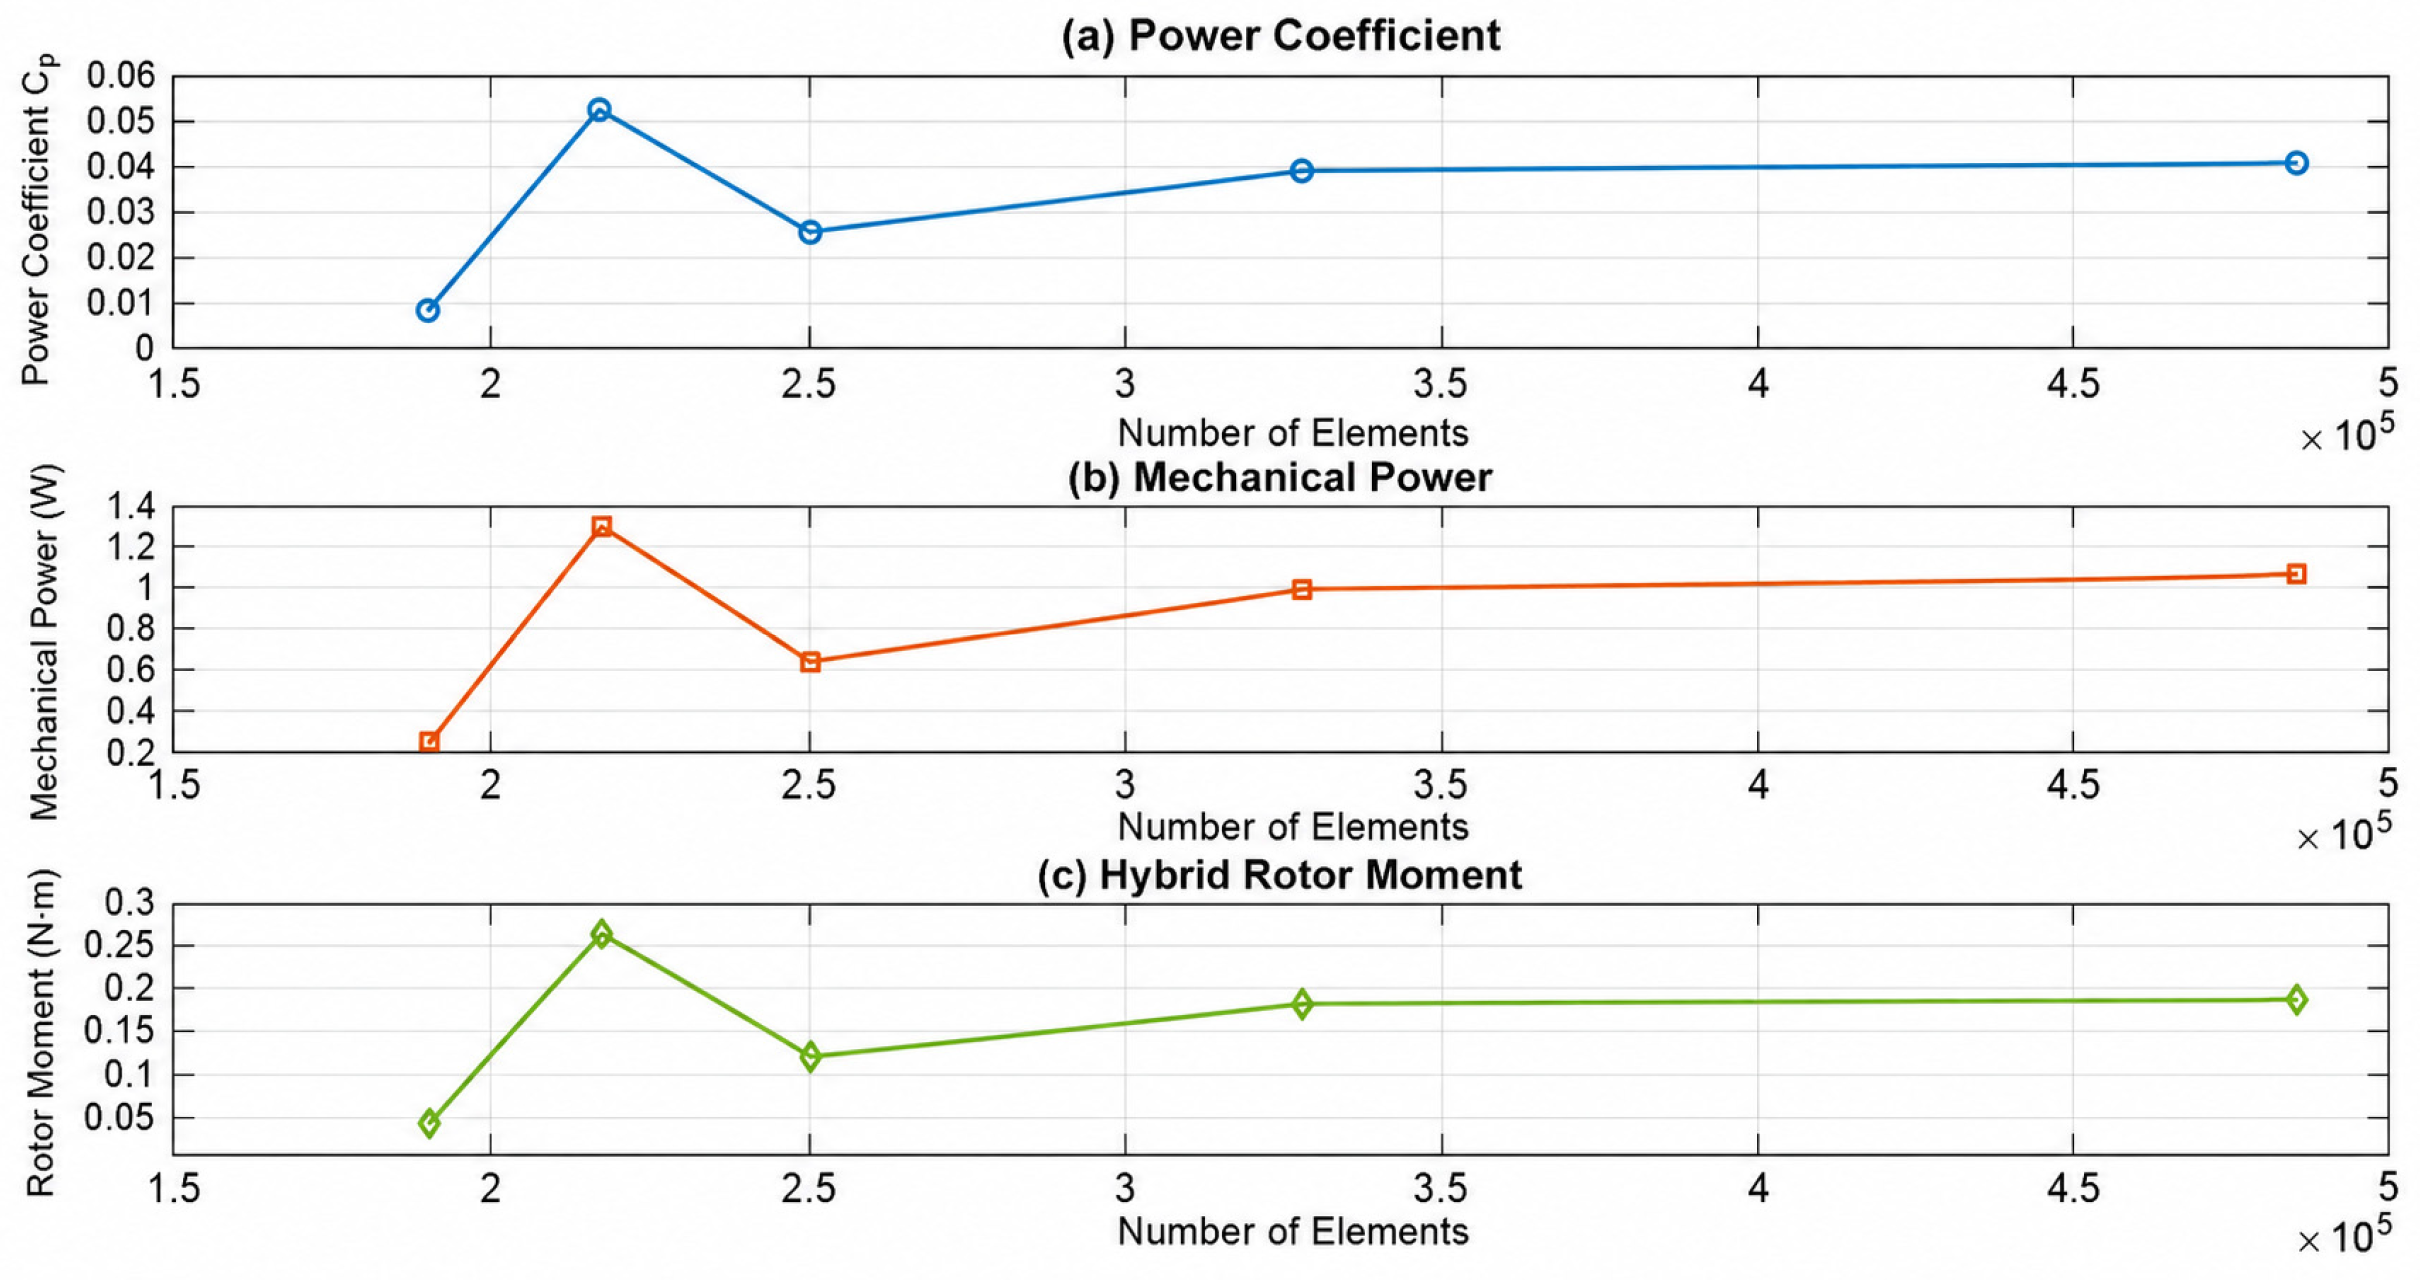
To determine an appropriate number of mesh elements, several simulations were performed, keeping the physical and configuration parameters constant and varying only the number of mesh elements. Mesh sizes with 189,664, 217,180, 249,657, 327,944, and 485,598 elements were evaluated, with analysis of variables including total torque on the hybrid rotor, mechanical power, and power coefficient.
Table 3 details the total element counts and the resulting aerodynamic performance metrics—including individual and hybrid rotor moments, mechanical power outputs, and power coefficients—while verifying that the target near-wall resolution restriction (
was maintained across all configurations.
Figure 6 and
Table 3 present the hybrid moment, mechanical power, and power coefficient as functions of the total number of mesh elements. For the coarsest meshes (5–7 mm element size; 189,664–249,657 elements), the results exhibit scattered and non-monotonic variations. In particular, the 7 mm mesh yields an abnormally low power coefficient (
) and a significantly reduced hybrid moment compared with the finer grids. This behavior is attributed to excessive numerical diffusion and insufficient resolution of velocity gradients in the rotating domain and near wake, which artificially dampens unsteady flow separation, dynamic stall, and blade–blade interaction effects that dominate torque generation in the hybrid rotor. The 5 mm and 6 mm meshes show intermediate behavior, with partial recovery of the torque and power levels but still notable sensitivity to further refinement, indicating that the flow field is not yet fully grid-independent.
For meshes with element sizes of 4 mm and finer (≥327,944 elements), the integral performance metrics become essentially insensitive to further refinement: the difference in hybrid moment and power coefficient between the 4 mm (327,944 elements) and 3 mm (485,598 elements) meshes is below 4%. This stabilization of the results indicates that the key flow features—boundary layer development, separation zones, and wake structures—are adequately captured, and that the solution can be considered grid-independent within the tested range. Consequently, the 4 mm mesh (327,944 elements) was selected as the baseline configuration for all subsequent 2D parametric simulations, as it provides a suitable compromise between accuracy and computational cost while maintaining the required near-wall resolution () on all blade surfaces.
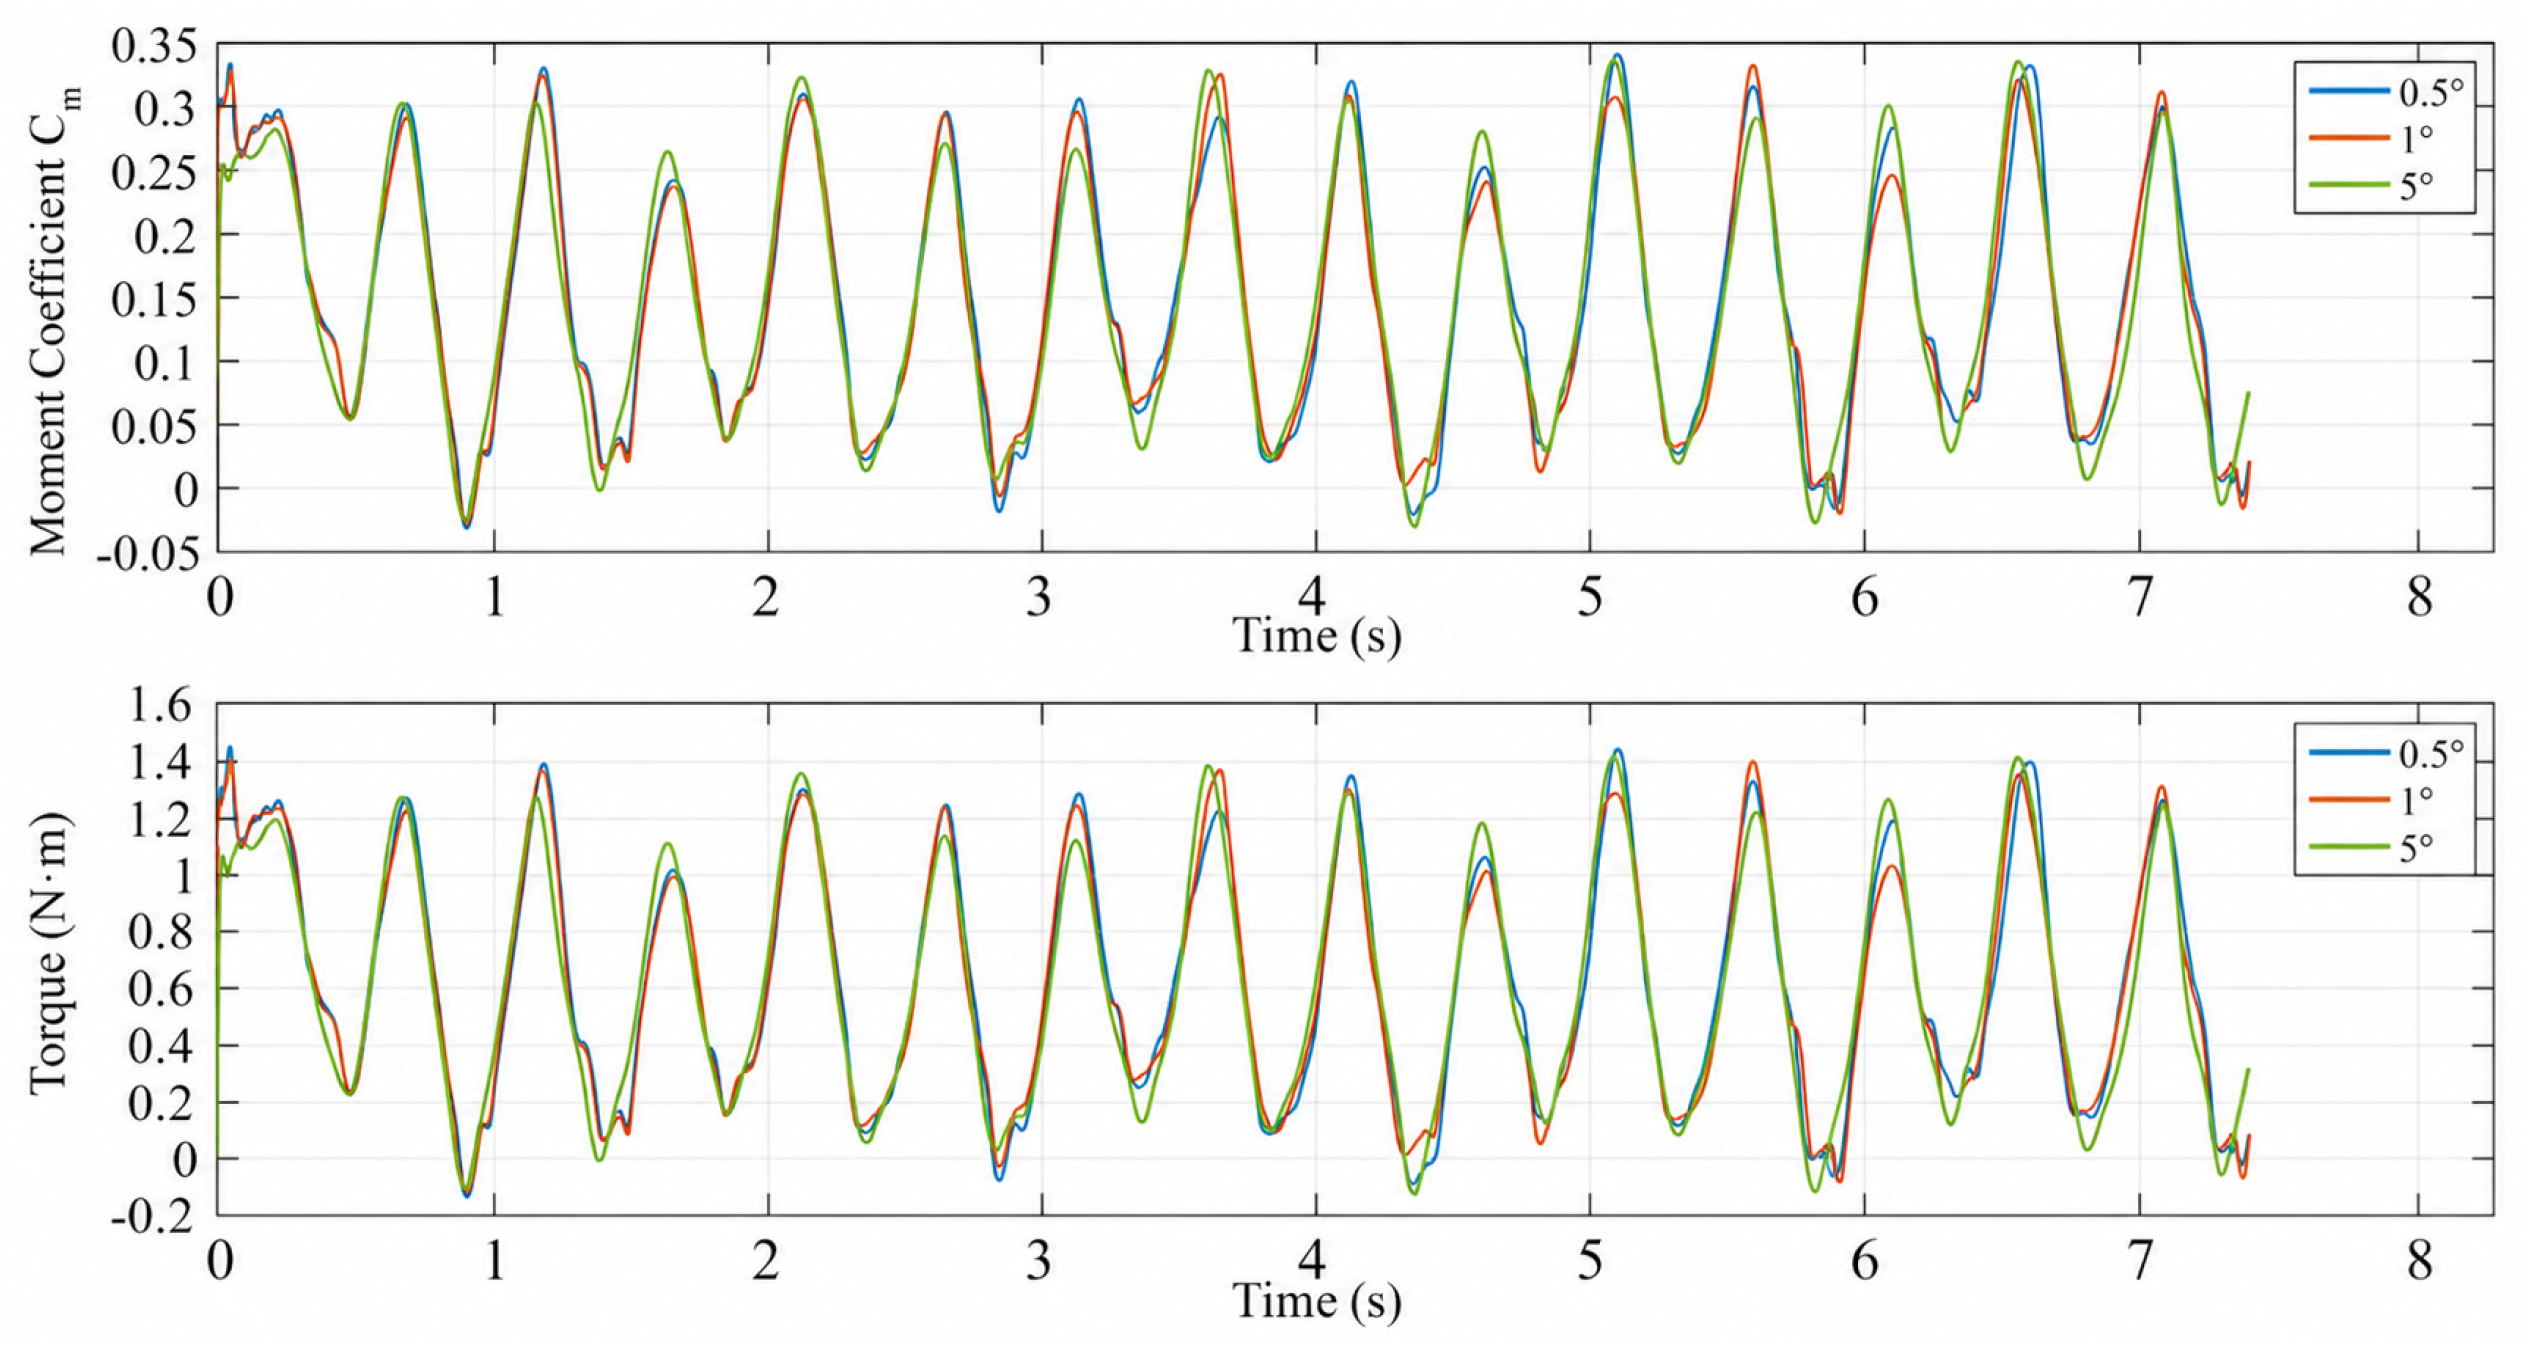
A temporal independence study was conducted for the hybrid Darrieus–Savonius rotor using a computational mesh with 224,000 nodes and 423,000 elements. The simulations were performed at a flow velocity of 0.459 m/s and a tip speed ratio of 0.9, considering three rotor rotation angular increments: 0.5°, 1°, and 5°. These angular positions were used to determine the corresponding time steps, and each case was evaluated over five rotor revolutions.
Figure 7 presents a comparison of the temporal responses obtained for the moment coefficient and torque, enabling assessment of the influence of the time step on the predicted unsteady behavior of the rotor.
The three curves for the moment coefficient and torque follow the same overall periodic trend, indicating that the solution is broadly stable with respect to time discretization. The 0.5° and 1° results are nearly superimposed for most of the cycle, with only minor differences around sharp extrema and transition zones. In contrast, the 5° curve shows larger deviations in peak amplitude and local oscillations, suggesting numerical smearing of the transient loads.
The 1 time step is the best compromise for this rotor case: it reproduces the 0.5° solution very closely in both moment coefficient and torque, while cutting the computational cost in half from 3600 to 1800 time steps. The 5° step is visibly less accurate, especially near peak and trough regions, so it is too coarse for reliable transient prediction.
The time step size was determined independently for each operating condition based on the rotor angular velocity and a prescribed angular increment 1°. This angular increment was selected as a compromise between the temporal accuracy required to resolve the unsteady blade-flow interaction and the computational cost of the simulations.
Therefore, the time step varied with the TSR and the corresponding rotor speed rather than remaining constant for all operating conditions. Each complete rotor revolution was resolved using 360 time steps, and five complete revolutions were simulated for every case (1800 time steps) to ensure that the monitored torque and moment coefficient responses reached a periodic and numerically stable condition. The calculated time step values for the investigated TSR and flow velocity conditions are presented in
Table 4.
For the three-dimensional computational domain, the boundary conditions were established to replicate the experimental channel environment. A uniform velocity profile was applied at the inlet, while the outlet was modeled as a pressure outlet set to atmospheric pressure [
30]. No-slip wall conditions were assigned to the channel’s vertical walls, the bottom floor, and the surfaces of both the Darrieus and Savonius blades. The top free surface was modeled with a free-slip condition, and a transient numerical interface was utilized to handle the moving mesh zone. A fully submerged VAHT is a turbine that operates entirely below the water surface, with no part of it exposed to the air.
Figure 8 illustrates the final generated 3D mesh, highlighting the inflation layers implemented to accurately resolve the boundary layer flow.
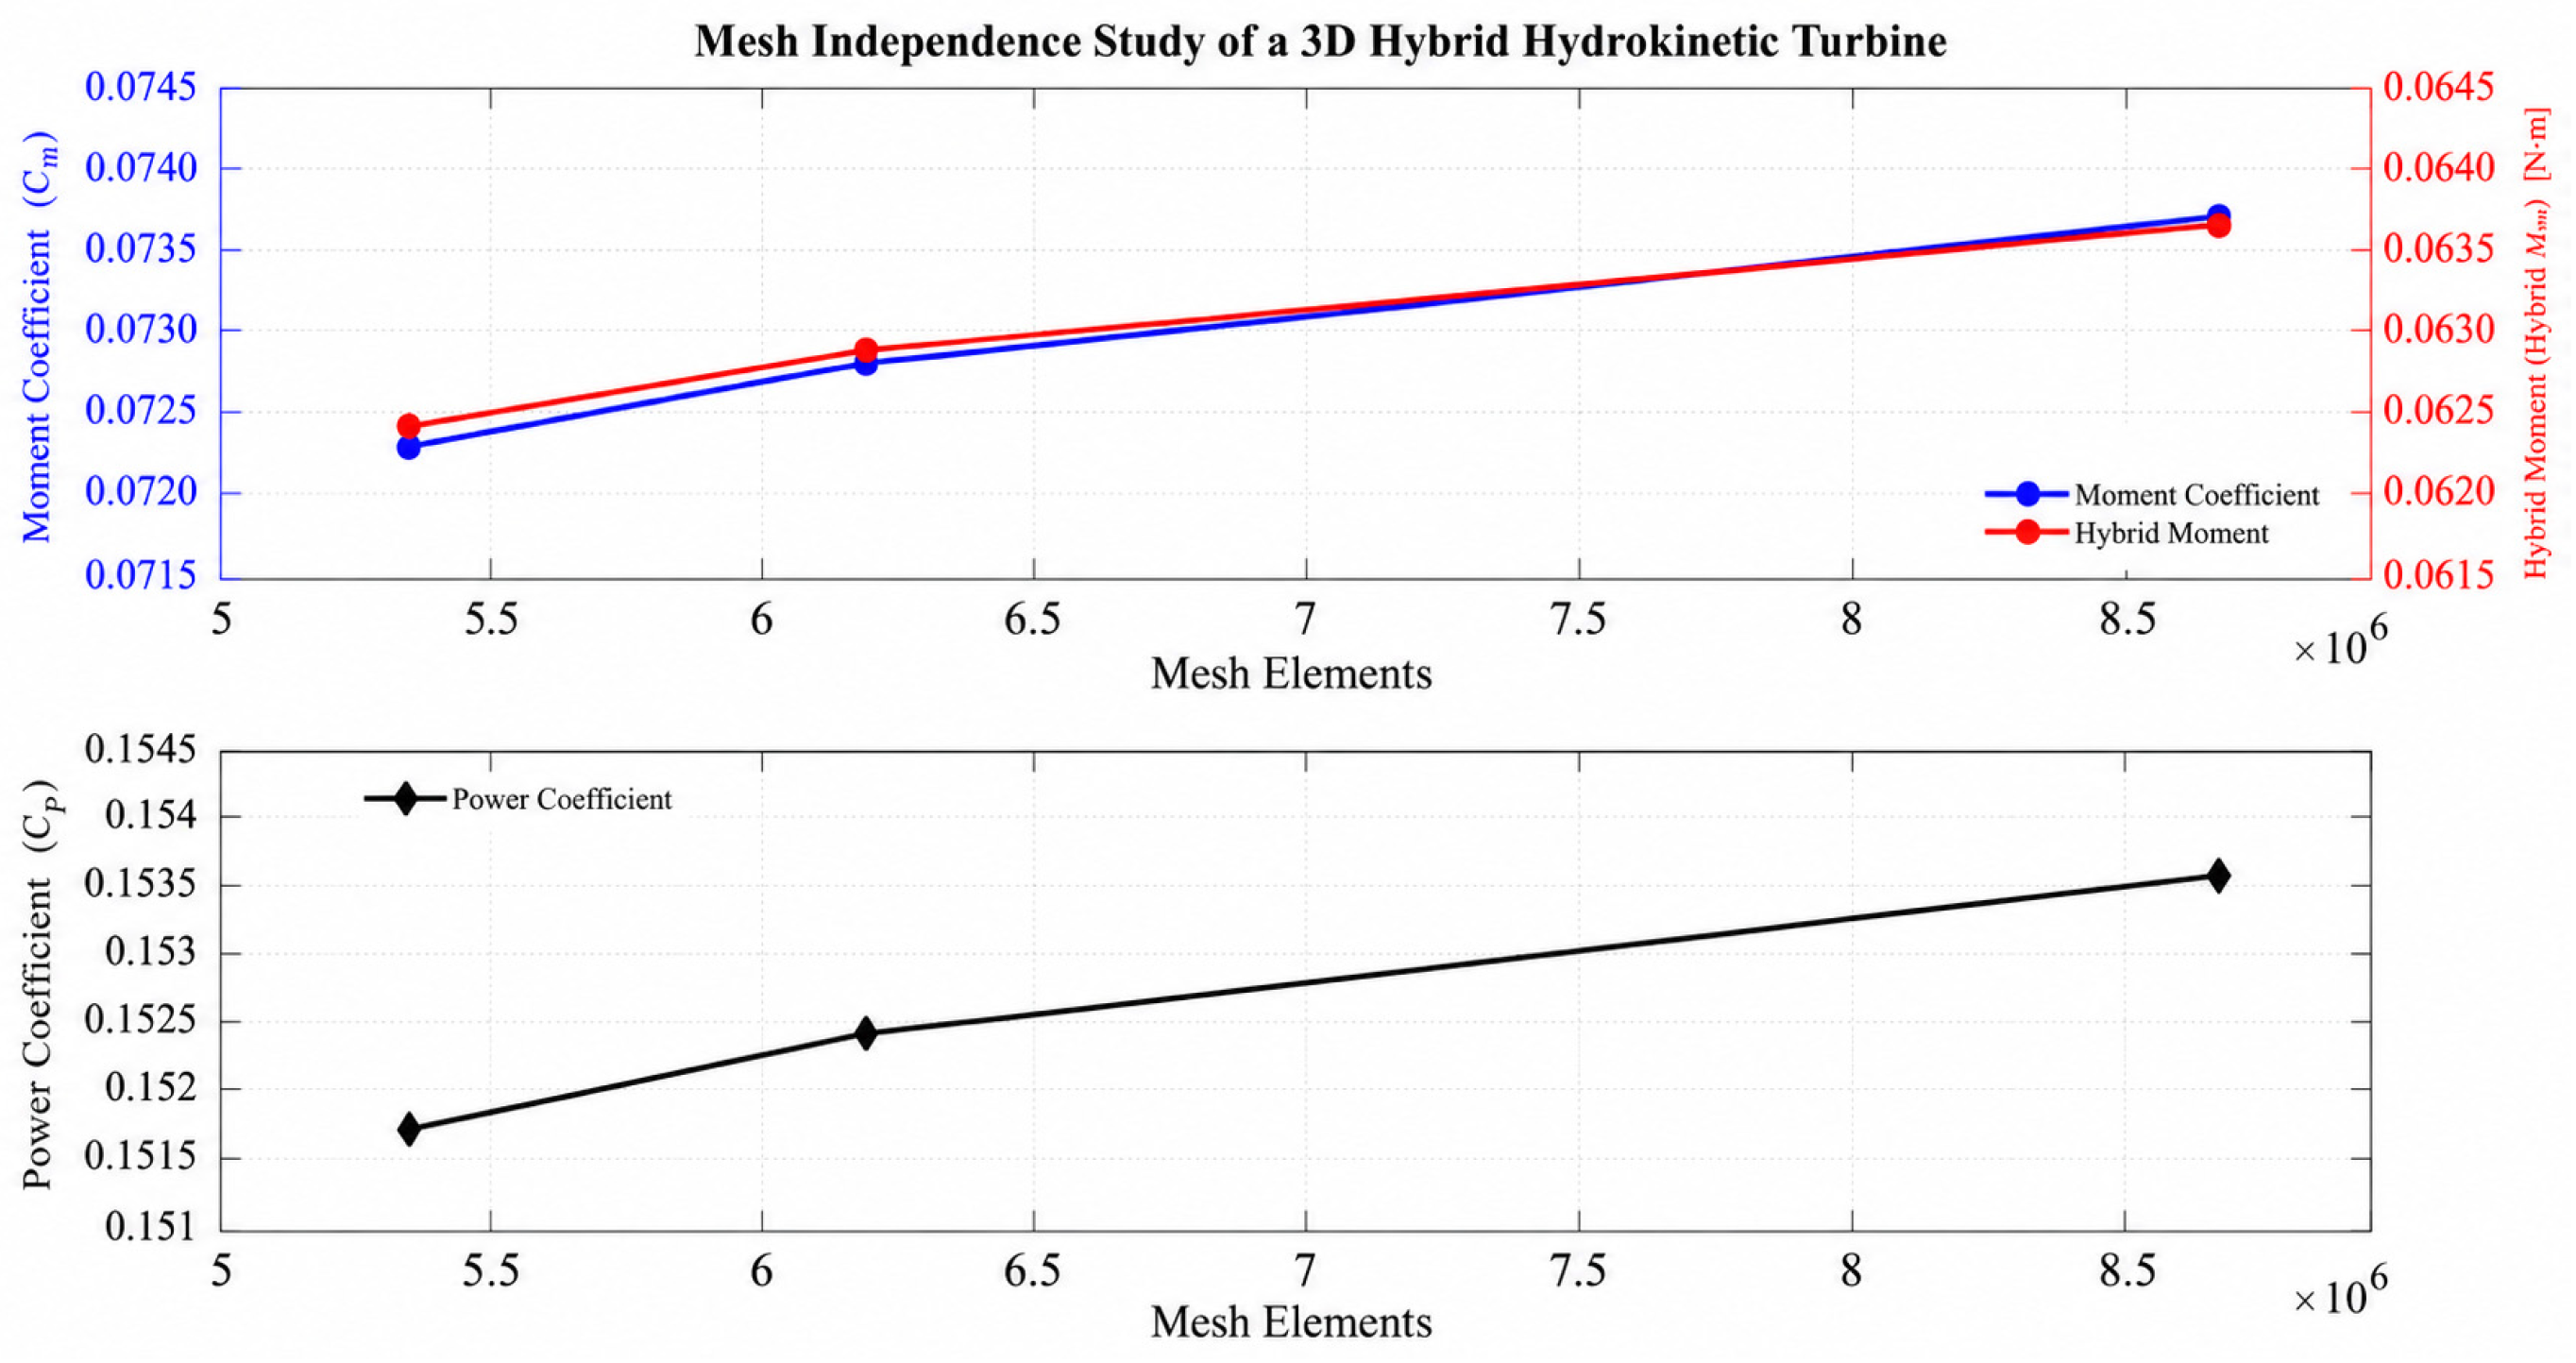
To ensure that the numerical solutions were independent of the grid resolution, a grid convergence exercise was performed at a flow velocity of 0.46 m/s and a tip speed ratio (TSR) of 1.0. The study evaluated three successive mesh refinements, with the total element count ranging from 5.2 million to 8.7 million cells. From the grid independence exercise we computed numerical uncertainties for the key performance indicators. The estimated uncertainty in the power coefficient is 1.1%, while the uncertainty in the moment coefficient is 1.4%, both values indicating that the solution is effectively independent of further mesh refinement within the tested range.
Figure 9 presents the results of the grid sensitivity study carried out for the three-dimensional domain. The analysis compares three mesh refinements with total element counts of approximately 5.2, 6.2 and 8.7 million, emphasizing the convergence behavior of the computed quantities as the mesh is refined. Results plotted in the figure show how the key performance metrics vary (or stabilize) across the three meshes, supporting the selection of an appropriate mesh resolution for the subsequent simulations.
To ensure the computational reliability and stability of the numerical simulations, rigorous mesh quality metrics were evaluated for the different grid resolutions. Skewness is a measure of the relative distortion of an element compared to its ideal shape and is scaled from 0 (Excellent) to 1 (Unacceptable). Values below 0.5 are considered excellent, while values above 0.9 can lead to calculation collapse. For the 5.2 million element mesh, the skewness was highly satisfactory, exhibiting a minimum of , a maximum of 0.8941, and an average of 0.3257. Similarly, the finest mesh of 8.7 million elements maintained a skewness profile with a minimum of , a maximum of 0.8989, and an average of 0.3219.
Furthermore, orthogonal quality—which evaluates the alignment of element faces relative to the vectors connecting contiguous cell centers—must ideally fall within the 0.2 to 1.0 range, with 1.0 being perfect alignment. Both evaluated meshes demonstrated strong orthogonal quality: the 5.2 million mesh showed a minimum of 0.0159, a maximum of 1, and an average of 0.6722, while the 8.7 million mesh recorded a minimum of 0.0159, a maximum of 0.9960, and an average of 0.6765. Because the average values for skewness are well below 0.5 and the average orthogonal qualities remain comfortably within the desired upper-tier range, the structural integrity of the generated meshes is confirmed as highly suitable for resolving complex fluid dynamics.
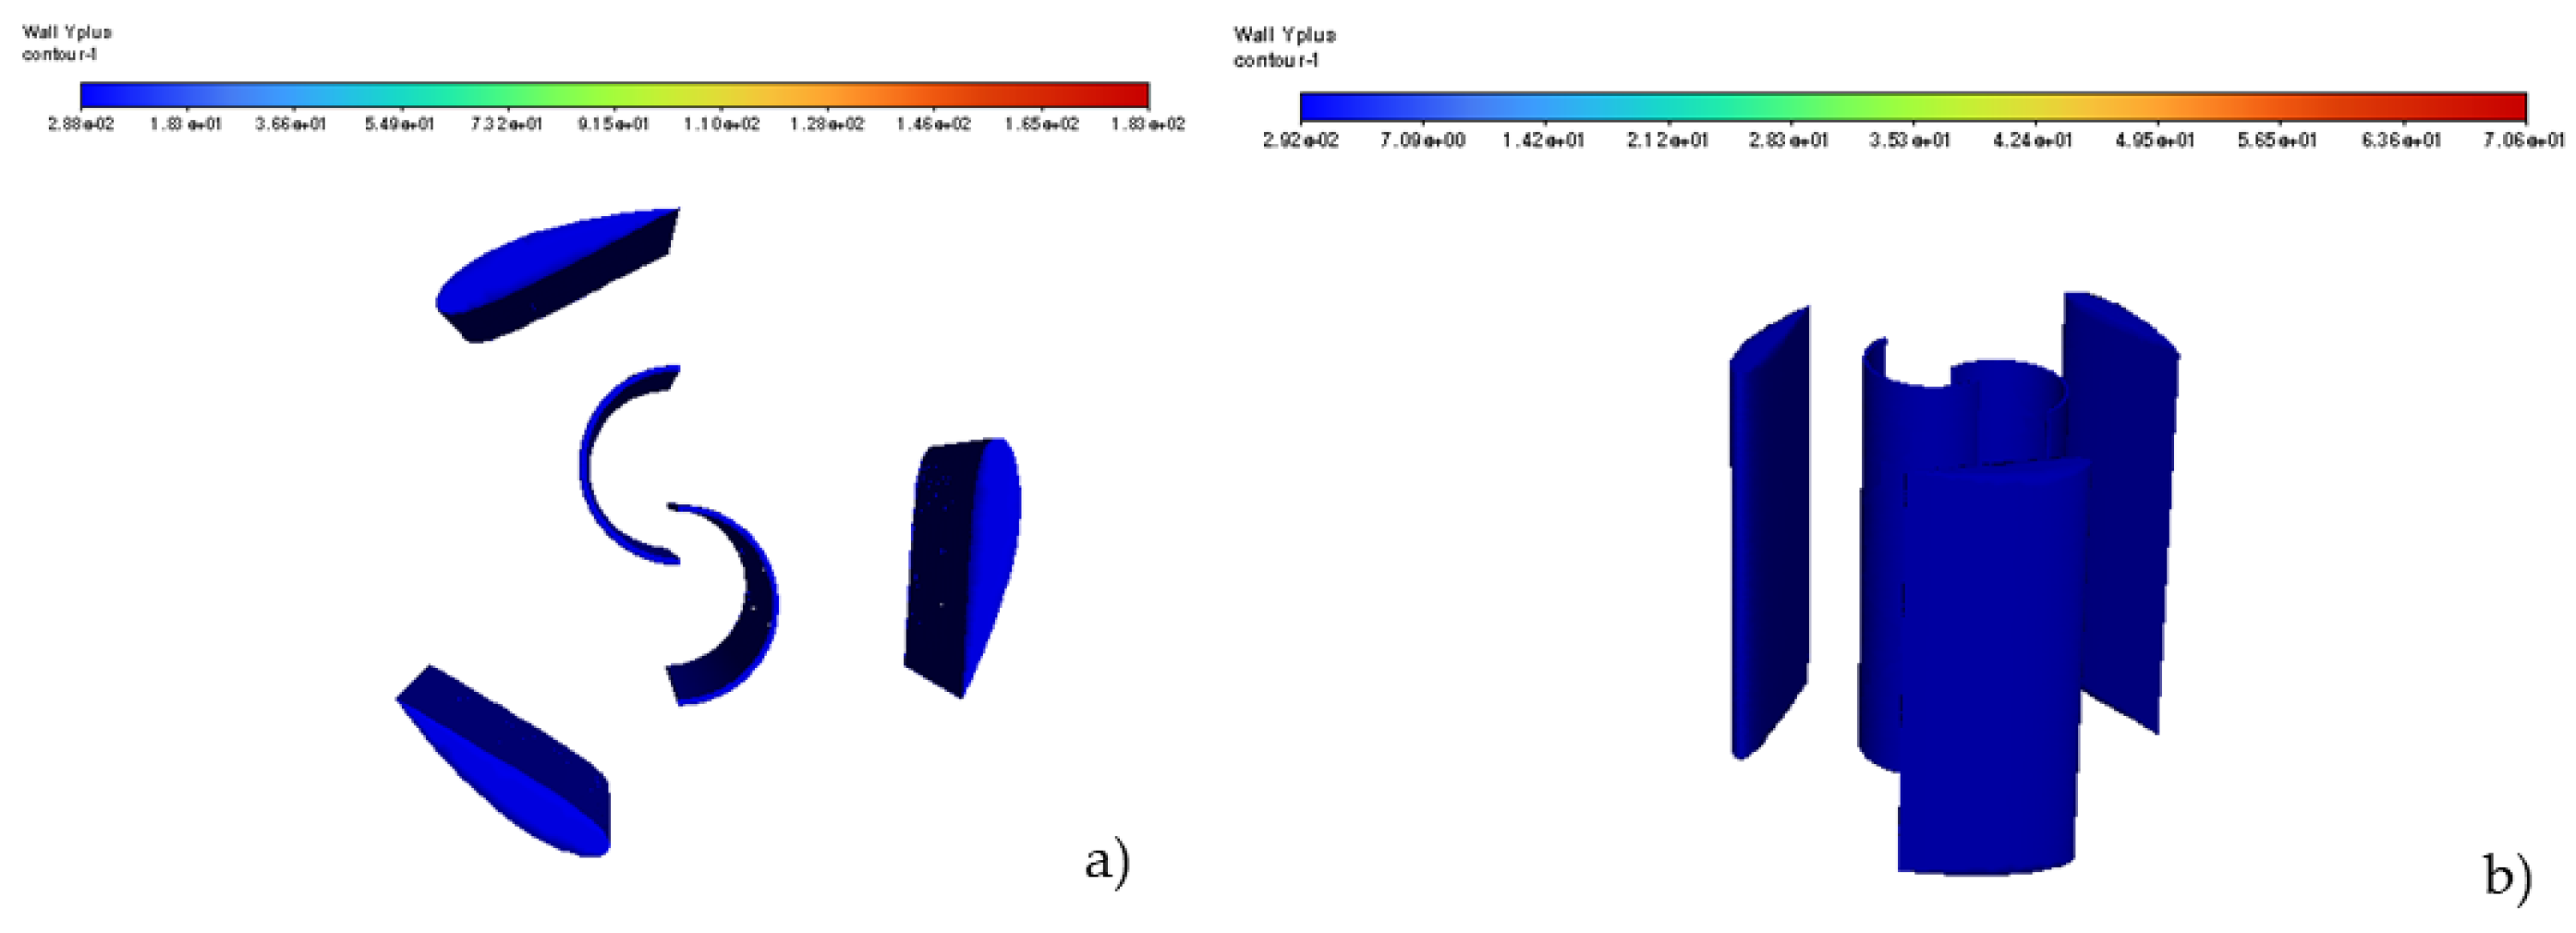
As observed in
Figure 10a (5.2 million elements), the global
contour scale ranges from approximately
to
However, the visual mapping clearly shows that the entirety of the Darrieus and Savonius blade surfaces is rendered in the lowest contour band (dark blue). This indicates that the functional aerodynamic surfaces maintain a local
tightly clustered around the minimum value (
). The maximum values shown in the legend are isolated to extreme geometric singularities (such as sharp blade tips or trailing edges) and do not represent the conditions over the primary boundary layers. The mesh refinement depicted in
Figure 10b (8.7 million elements) demonstrates a substantial improvement in resolving peak values. The global maximum
is drastically reduced to 70.6, while the minimum remains exceptionally low at
. More importantly, the turbine blade walls remain entirely mapped to the lowest dark blue segment of the scale.
2.4. Governing Equations and Turbulence Model
The flow in a VAHT is particularly complex due to the interaction of the water with the rotor blades along their length, where forces and moments are constantly changing, and with the angular position during a complete revolution. This generates significant variations in pressure and velocity along the blade profile, which, in turn, affect the efficiency of the turbine. Because the flow is three-dimensional and transient, it is necessary to solve the URANS equations numerically using computational fluid dynamics (CFD) methods [
15,
16,
17,
18].
To obtain numerical results, the governing equations, which are based on mass conservation and momentum conservation, must be solved using a CFD solver. Substituting the decomposed variables into the continuity and momentum equations and applying time averaging, we obtain the URANS equations:
The term is the Reynolds stress tensor, which accounts for momentum transport due to turbulent velocity fluctuations. These additional terms must be modeled to close the equations, leading to the use of turbulence models such as .
A turbulence model must be used with the governing equations to capture unsteady, chaotic flow behavior. The
turbulence model combines the benefits of the
and
models to capture the behavior of turbulent flows effectively, especially in boundary layer regions and free-stream flows.
The constants used in the model include , which are essential for calibrating the model to achieve accurate results in different flow conditions. Additionally, , , and are diffusion coefficients that control the spreading of and in the domain. A critical feature of the model, is the blending function . The F1 function facilitates a smooth transition between the model near walls and the model in free-stream regions. This unique combination enables the model to perform well in complex turbulent flow scenarios.
2.5. Boundary and Initial Conditions
Neumann and Dirichlet boundary conditions are commonly employed to define flow behavior at the boundaries of the computational domain. Dirichlet conditions prescribe a fixed value of a flow variable at the boundary, whereas Neumann conditions specify its normal gradient. In the present study, a uniform inlet velocity was imposed at the upstream boundary, while atmospheric pressure was prescribed at the outlet to reproduce the operating conditions of the experimental hydraulic channel. The channel sidewalls were modeled as no-slip boundaries, where the fluid velocity relative to the wall is zero due to viscous shear effects at the solid–fluid interface. Similarly, no-slip boundary conditions were applied to both the Darrieus and Savonius blades. Although a sliding mesh approach was adopted to represent rotor motion, the blade surfaces were treated as stationary relative to the rotating mesh region, resulting in the blades moving with the same angular velocity as the mesh. These boundary conditions accurately represent the physical behavior of the flow and ensure a realistic prediction of the hydrodynamic performance of the hybrid turbine within the computational domain [
15,
16,
17,
18].
Liquid water was selected as the working fluid from the ANSYS standard material library, retaining its default properties. In Cell Zone Conditions, both the main and the rotational domains were assigned the same material. For the rotational domain, the mesh motion option was activated, allowing for the definition of the angular velocity of the rotor, a fundamental parameter for the simulation because it represents the continuous motion of the rotor.
As mentioned earlier, the present numerical model simulates an open channel flow, requiring robust numerical schemes for both the two-dimensional and three-dimensional domains. For the 2D simulations, the pressure–velocity coupling was resolved using the Coupled scheme with a momentum-based Rhie–Chow flux type. Spatial discretization was strictly managed to ensure high-order accuracy; gradients were evaluated using the Least Squares Cell-Based method. A second-order scheme was applied for pressure, while Second Order Upwind schemes were consistently utilized for momentum, turbulent kinetic energy, and specific dissipation rate. The temporal discretization was handled by a Second Order Implicit transient formulation to maintain stability across the unsteady flow calculations. The 3D simulations maintained an identical high-resolution approach for spatial and temporal discretization, employing the same Coupled scheme, Least Squares Cell Based gradients, Second Order pressure, and Second Order Upwind schemes for momentum and turbulence parameters, as well as the Second Order Implicit transient formulation. The primary configuration difference in the 3D setup was the use of a distance-based Rhie–Chow flux type for the pressure–velocity coupling.
To ensure both numerical accuracy and physical stability in the transient unsteady simulations, a dual convergence standard combining scaled equation residuals and physical output monitoring was enforced. The residuals for momentum (x, y, and z), continuity, and turbulence parameters ( and ) were calculated as Root-Mean-Square (RMS) values. For the 2D domain, absolute convergence criteria were set to 10−4 across all equations. For the 3D domain, a stricter absolute threshold of 10−5 was maintained. During inner time step iterations, the actual RMS momentum residuals routinely reached between 10−7 and 10−9, while turbulent kinetic energy () and specific dissipation rate () dropped well below 10−5. In addition to residual targets, physical convergence was evaluated by tracking the moment coefficient () over 7.5 s of total flow time. The simulation was considered fully converged once initial startup transients dissipated (after approximately 3 s) and the moment coefficient exhibited stable, periodically repeating waveforms across multiple consecutive rotor revolutions.
In ANSYS Fluent, automatic reports were configured to monitor key variables during the transient simulation. These included the moments generated by the Darrieus and Savonius rotor blades, as well as their combined effect (hybrid-rotor moment), allowing for the analysis of the individual behavior of each component and the overall performance of the hybrid rotor. Additionally, the moment coefficient for the hybrid turbine reports provided a useful dimensionless measure for comparing results between different simulation configurations.
To evaluate the energy performance, the mechanical power and its associated power coefficient reports were enabled, which quantify the conversion of the flow kinetic energy into useful power. Finally, the forces in x and y for the hybrid rotor enabled the determination of the hydrodynamic loads acting on the rotor assembly, which represent a relevant source of information for future structural analyses and stability studies.
Table 5 summarizes all the configured parameters in Ansys Fluent.
3. Evaluation of the Hydrodynamic Behavior of the Hybrid Turbine Using Transient Simulation
A full 3
3 factorial experimental design was implemented to evaluate, using two-dimensional (2D) numerical simulations, the influence of three key factors on the performance of a Darrieus–Savonius hybrid hydrokinetic turbine. The factors considered were as follows: the rotor radius ratio (RR), the attachment angle (AA), and the incident flow velocity (U), each defined at three levels. The combination of these levels yielded 27 experimental runs, enabling the systematic exploration of the main effects of each factor and their interactions on response variables such as the moment coefficient and the power coefficient (
).
Table 6 presents all the combinations evaluated using the full 3
3 factorial experimental design, as well as the results obtained from the 2D numerical simulations of the Darrieus–Savonius hybrid hydrokinetic turbine.
Figure 11 illustrates the variation in the geometric parameters considered in the design of experiments, showing the three levels selected for the rotor radius ratio and attachment angle.
To rigorously evaluate the impact of geometric and operational parameters on the performance of the Darrieus–Savonius hybrid turbine, an Analysis of Variance (ANOVA) was structured using data from a full 3
3 factorial design. This methodological approach allows us to isolate system variability and assess the significance of main effects and two-way interactions at a strict 99% confidence level (
= 0.01), ensuring that the factors identified as critical truly govern the variability in the Power Coefficient
. The ANOVA results are detailed in
Table 7 below.
Based on the analysis of variance, the full factorial model explains all the variability in the power coefficient () (total SS = 0.06153), consistent with a design without replicates, where experimental error cannot be estimated independently. In this context, the decomposition of the sum of squares allows us to identify the relative contribution of each factor and its interactions. The linear effect accounts for most of the variability (SS = 0.037933, ~61.7%), with the radius ratio (RR) standing out as the most influential factor (SS = 0.029203, ~47.5% of the total), followed by the coupling angle (AA) (~12.4%) and, to a lesser extent, the flow velocity (U) (~1.8%). These results are consistent with numerical simulations, which show that configurations with lower RR values favor better hydrodynamic performance, while AA has a significant effect on rotor coupling.
Regarding second-order interactions, they account for approximately 27.4% of the total variability, with the RR × AA interaction (~15.8%) being particularly relevant. These interactions confirm that the effect of the coupling angle depends strongly on the relative geometry between the Darrieus and Savonius rotors. The RR × U (~7.6%) and AA × U (~3.9%) interactions have a lesser influence, although they demonstrate that the turbine response is not completely independent of operating conditions. The third-order interaction (RR × AA × U) accounts for approximately 10.9% of the variability, indicating global coupling among the three factors, a feature typical of complex hydrodynamic systems.
The ANOVA results indicate that the radius ratio was the dominant factor affecting the power coefficient, accounting for approximately 47.5% of the total variation and producing a statistically significant effect at (). The attachment angle, flow velocity, and the remaining interaction terms did not reach statistical significance at this strict confidence level. Nevertheless, the RR × AA interaction contributed approximately 15.8% of the total variation, indicating that the influence of the attachment angle depends on the relative size of the Savonius rotor.
This behavior is physically related to the changing interaction between the Savonius and Darrieus components: increasing or modifying the Savonius radius changes the blockage of the inner rotor, the local flow acceleration, the pressure field, and the mutual wake interference between both rotors. Consequently, an attachment angle that is favorable for one radius ratio may be less favorable for another. The interaction was not statistically significant at , however, because its effect was distributed across four degrees of freedom and was comparable with the residual variability associated with the unreplicated design.
Overall, the statistical analysis indicates that the combination RR = 0.5 and AA = 0° offers the best compromise between efficiency and performance stability across the different speeds analyzed. This configuration obtained differs from the configurations reported by Kamal and Saini and by G. Saini and R. P. Saini, who obtained enhanced conditions close to –0.6 and . This discrepancy can be explained by the differences between the investigated rotor geometries and operating conditions. Kamal and Saini analyzed a hybrid rotor comprising an S-1046 Darrieus turbine and a helical Savonius rotor with a helical angle, an 11% overlap ratio, a 150 mm blade height, and an endplate area ratio of 1.0. Their design space included , 0.4, 0.6, and 0.8, and attachment angles of , , and . Similarly, G. Saini and R. P. Saini considered an S-1046 straight-bladed Darrieus rotor, different attachment angle levels, and a broader radius ratio range. In contrast, the present study uses a NACA 4418 Darrieus rotor, straight Savonius blades, a 25% overlap ratio, a 200 mm blade height, and 0.3, 0.5, and 0.7 with , , and . These differences modify the blockage, pressure distribution, blade–wake interaction, and relative phase between the two rotors.
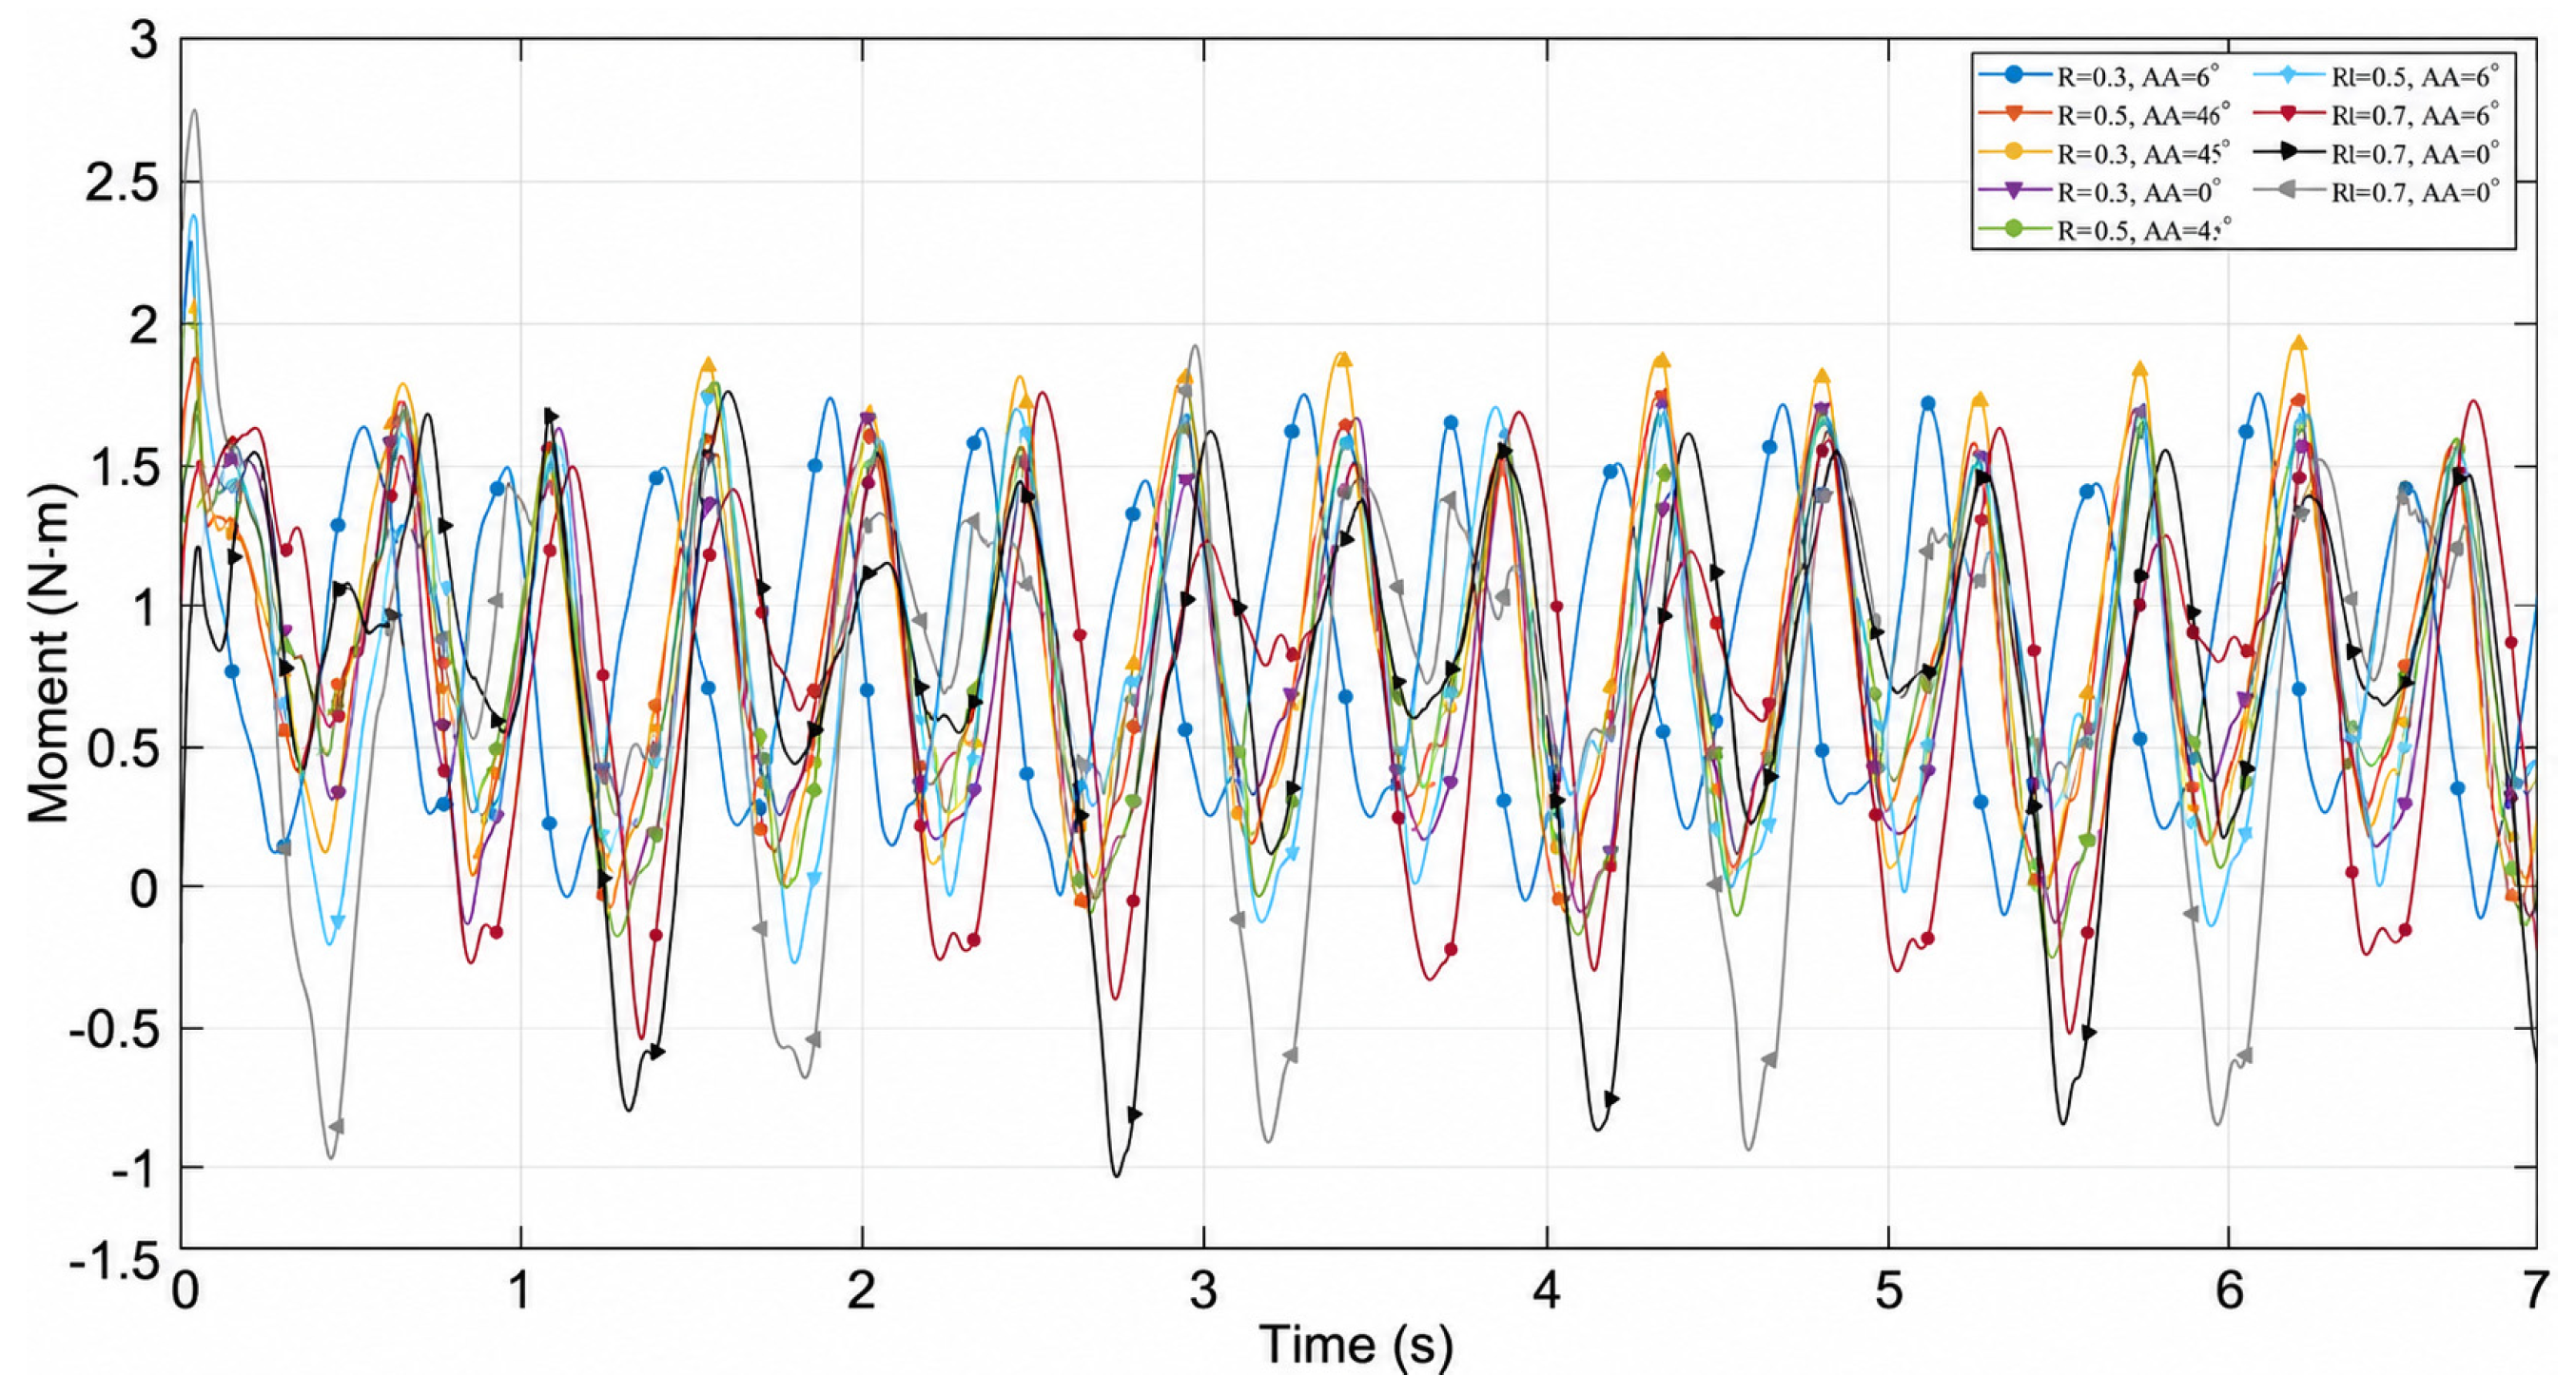
While a comprehensive multi-objective optimization was not explicitly performed in this study, the instantaneous torque histories reveal that the different hybrid configurations do not behave identically, as can be seen in
Figure 12. In general, the curves show a periodic response with alternating high-torque and low-torque regions associated with the rotor azimuthal position and the repeated interaction between the Darrieus and Savonius components. Configurations with
and
and
exhibit comparatively higher mean torque levels and smoother positive torque generation over the cycle, which is consistent with their higher average
; however, the instantaneous waveform still contains local oscillations and short negative or near-zero intervals, indicating that the rotor is not uniformly loaded throughout the revolution. By contrast, the
configurations display larger torque fluctuations, deeper negative excursions, and more pronounced asymmetry between successive peaks and troughs, which suggests stronger flow interference and less stable blade–wake interaction.
The cases generally show moderate torque amplitudes and more regular periodicity, but their peak torque levels are lower than those of the best-performing mid-radius configuration. These differences indicate that a configuration with high mean power coefficient is not necessarily the one with the smallest torque ripple or the most favorable load uniformity. According to the ANOVA results, the inlet flow velocity was one of the factors with the lowest influence on the average torque coefficient, contributing approximately 1.8% of the total variance. Therefore, to compare the instantaneous torque response of the different rotor configurations, the velocity was fixed at .
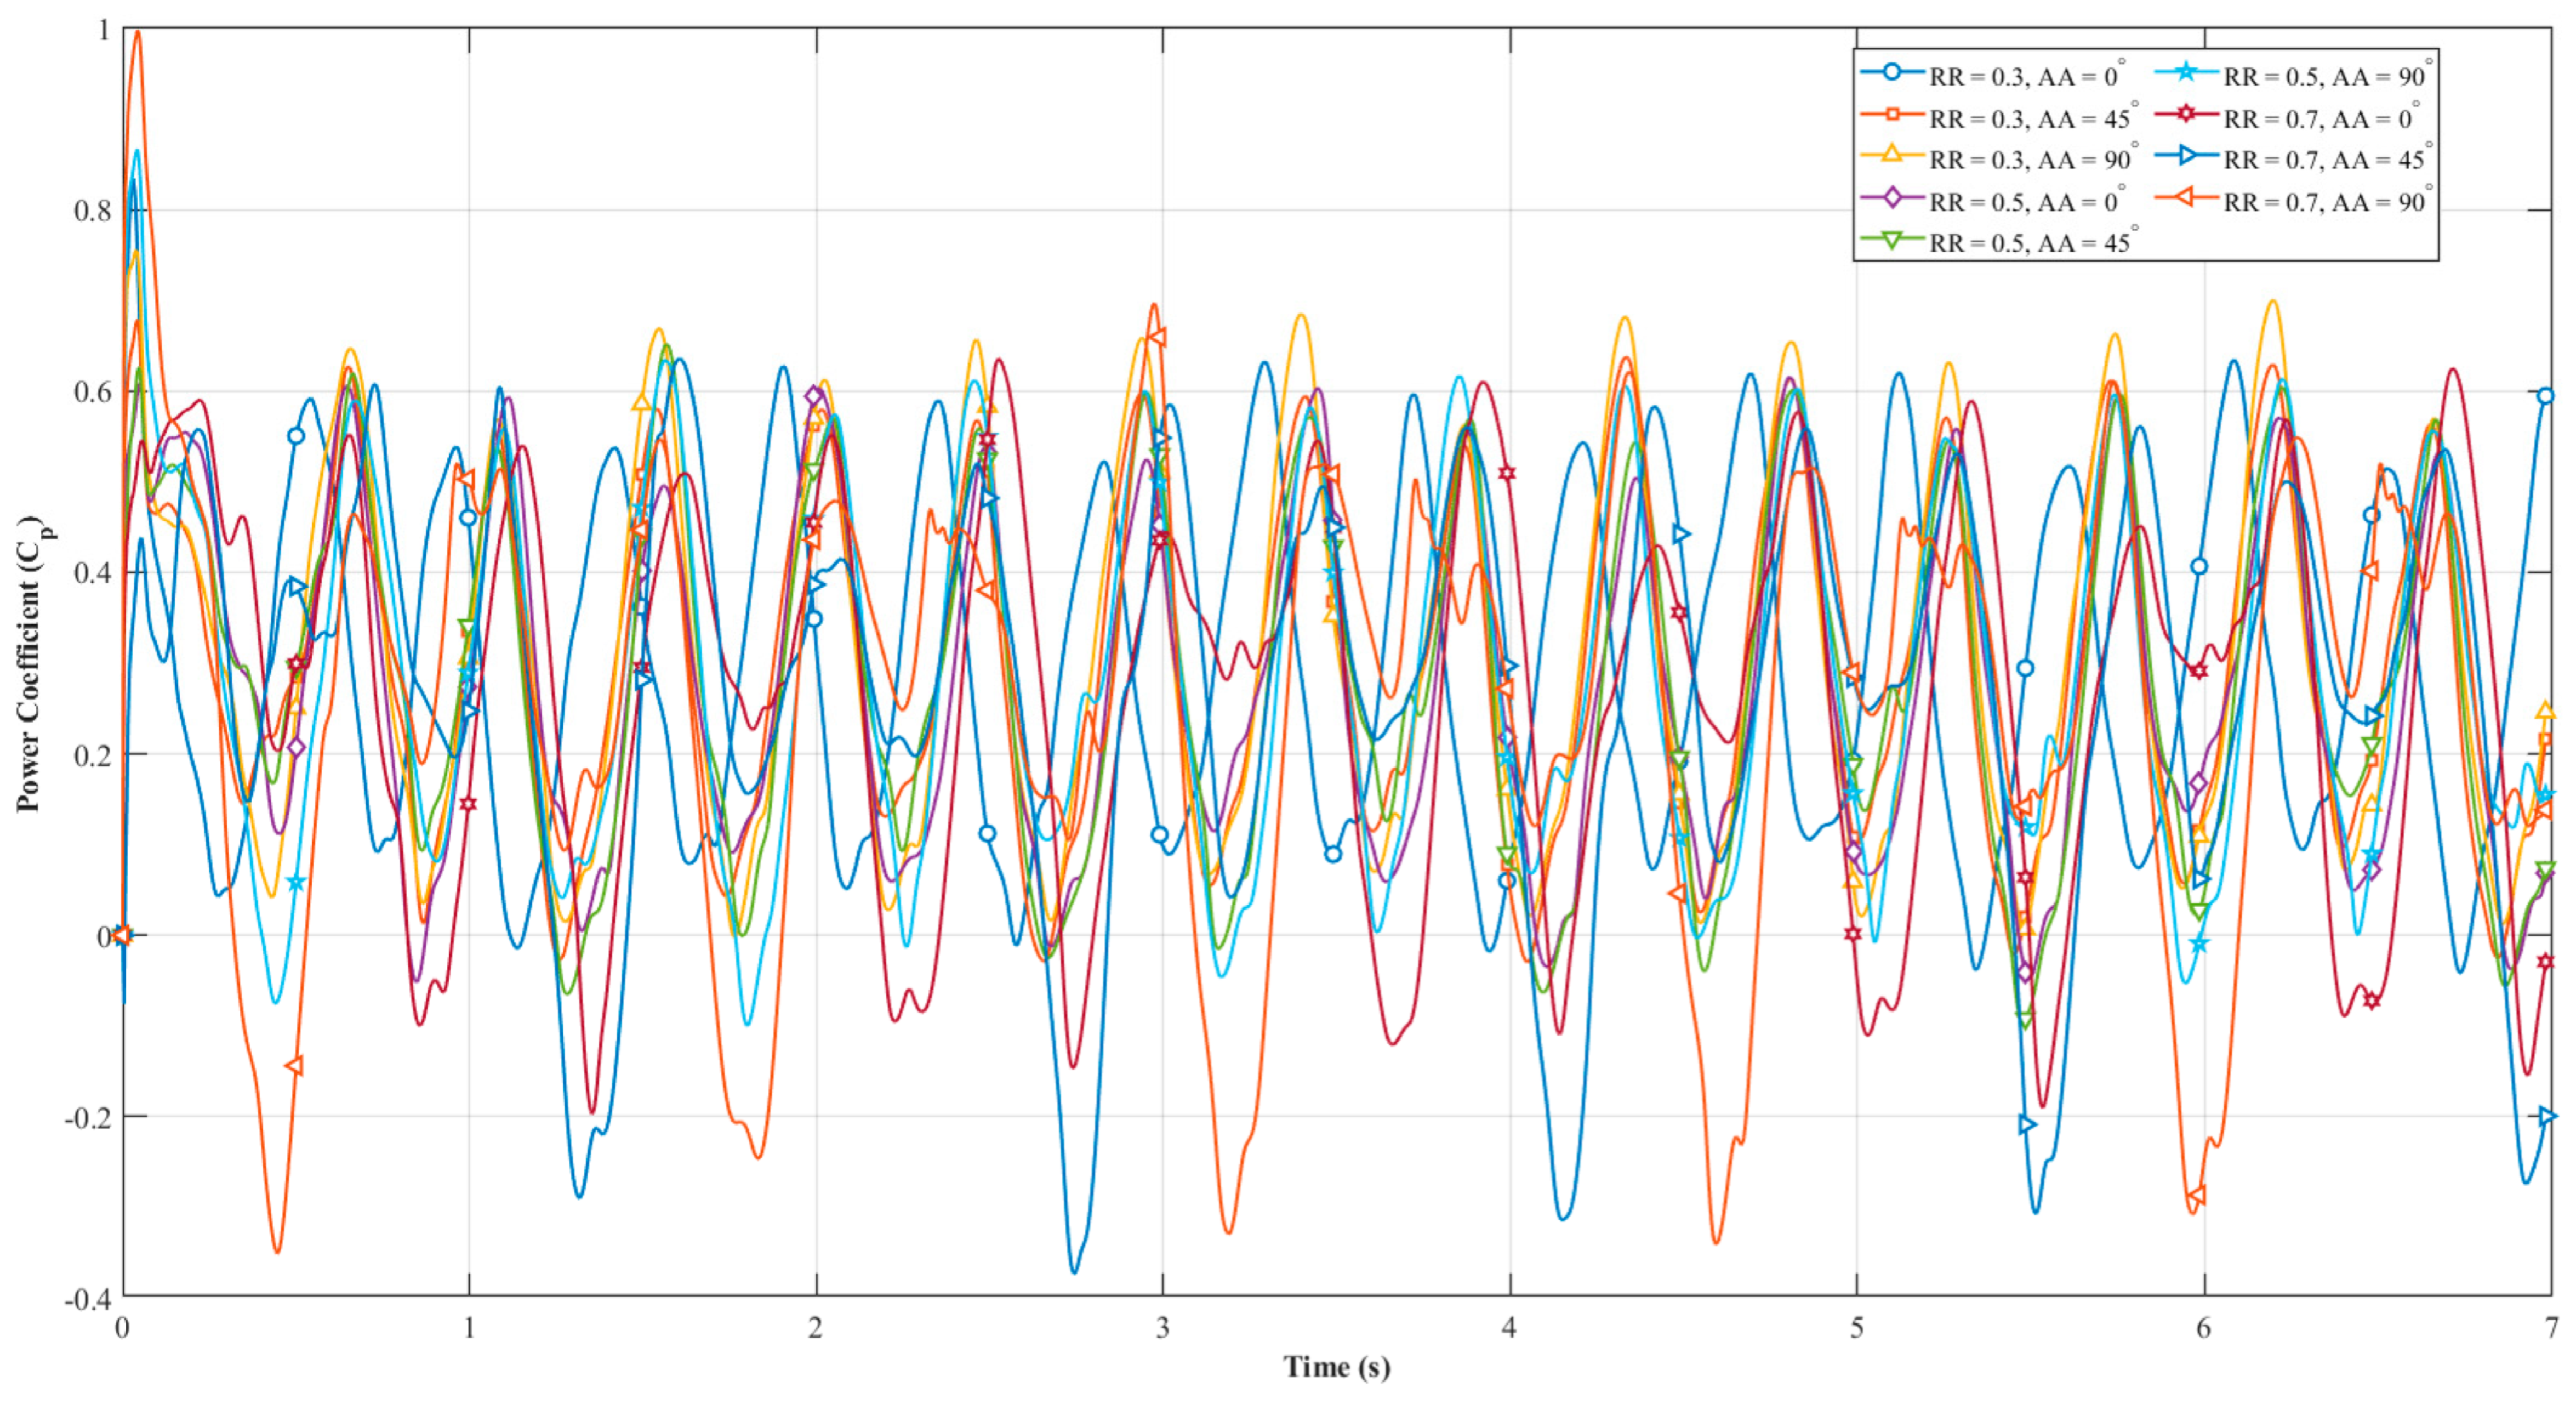
As shown in
Figure 13, the instantaneous power-coefficient response provides information that cannot be obtained from the time-averaged
alone. All configurations exhibit periodic oscillations associated with the azimuthal motion of the blades, the continuous variation in relative velocity and angle of attack, dynamic flow separation, and the unsteady interaction between the Darrieus and Savonius rotors.
The radius ratio strongly affects both the amplitude and the sign of these fluctuations. This behavior is associated with the greater blockage and stronger flow interference generated by the larger Savonius rotor, which modifies the local pressure field on the Darrieus blades. By contrast, the configurations show a narrower fluctuation range and predominantly positive instantaneous power coefficients, indicating more uniform energy extraction, although their peak power levels are generally lower. Changes in the attachment angle modify the phase, amplitude, and occurrence of the local maxima and minima by changing the relative azimuthal position of the two rotors. These results reveal a trade-off between peak or mean power extraction and the stability of the torque and power response.
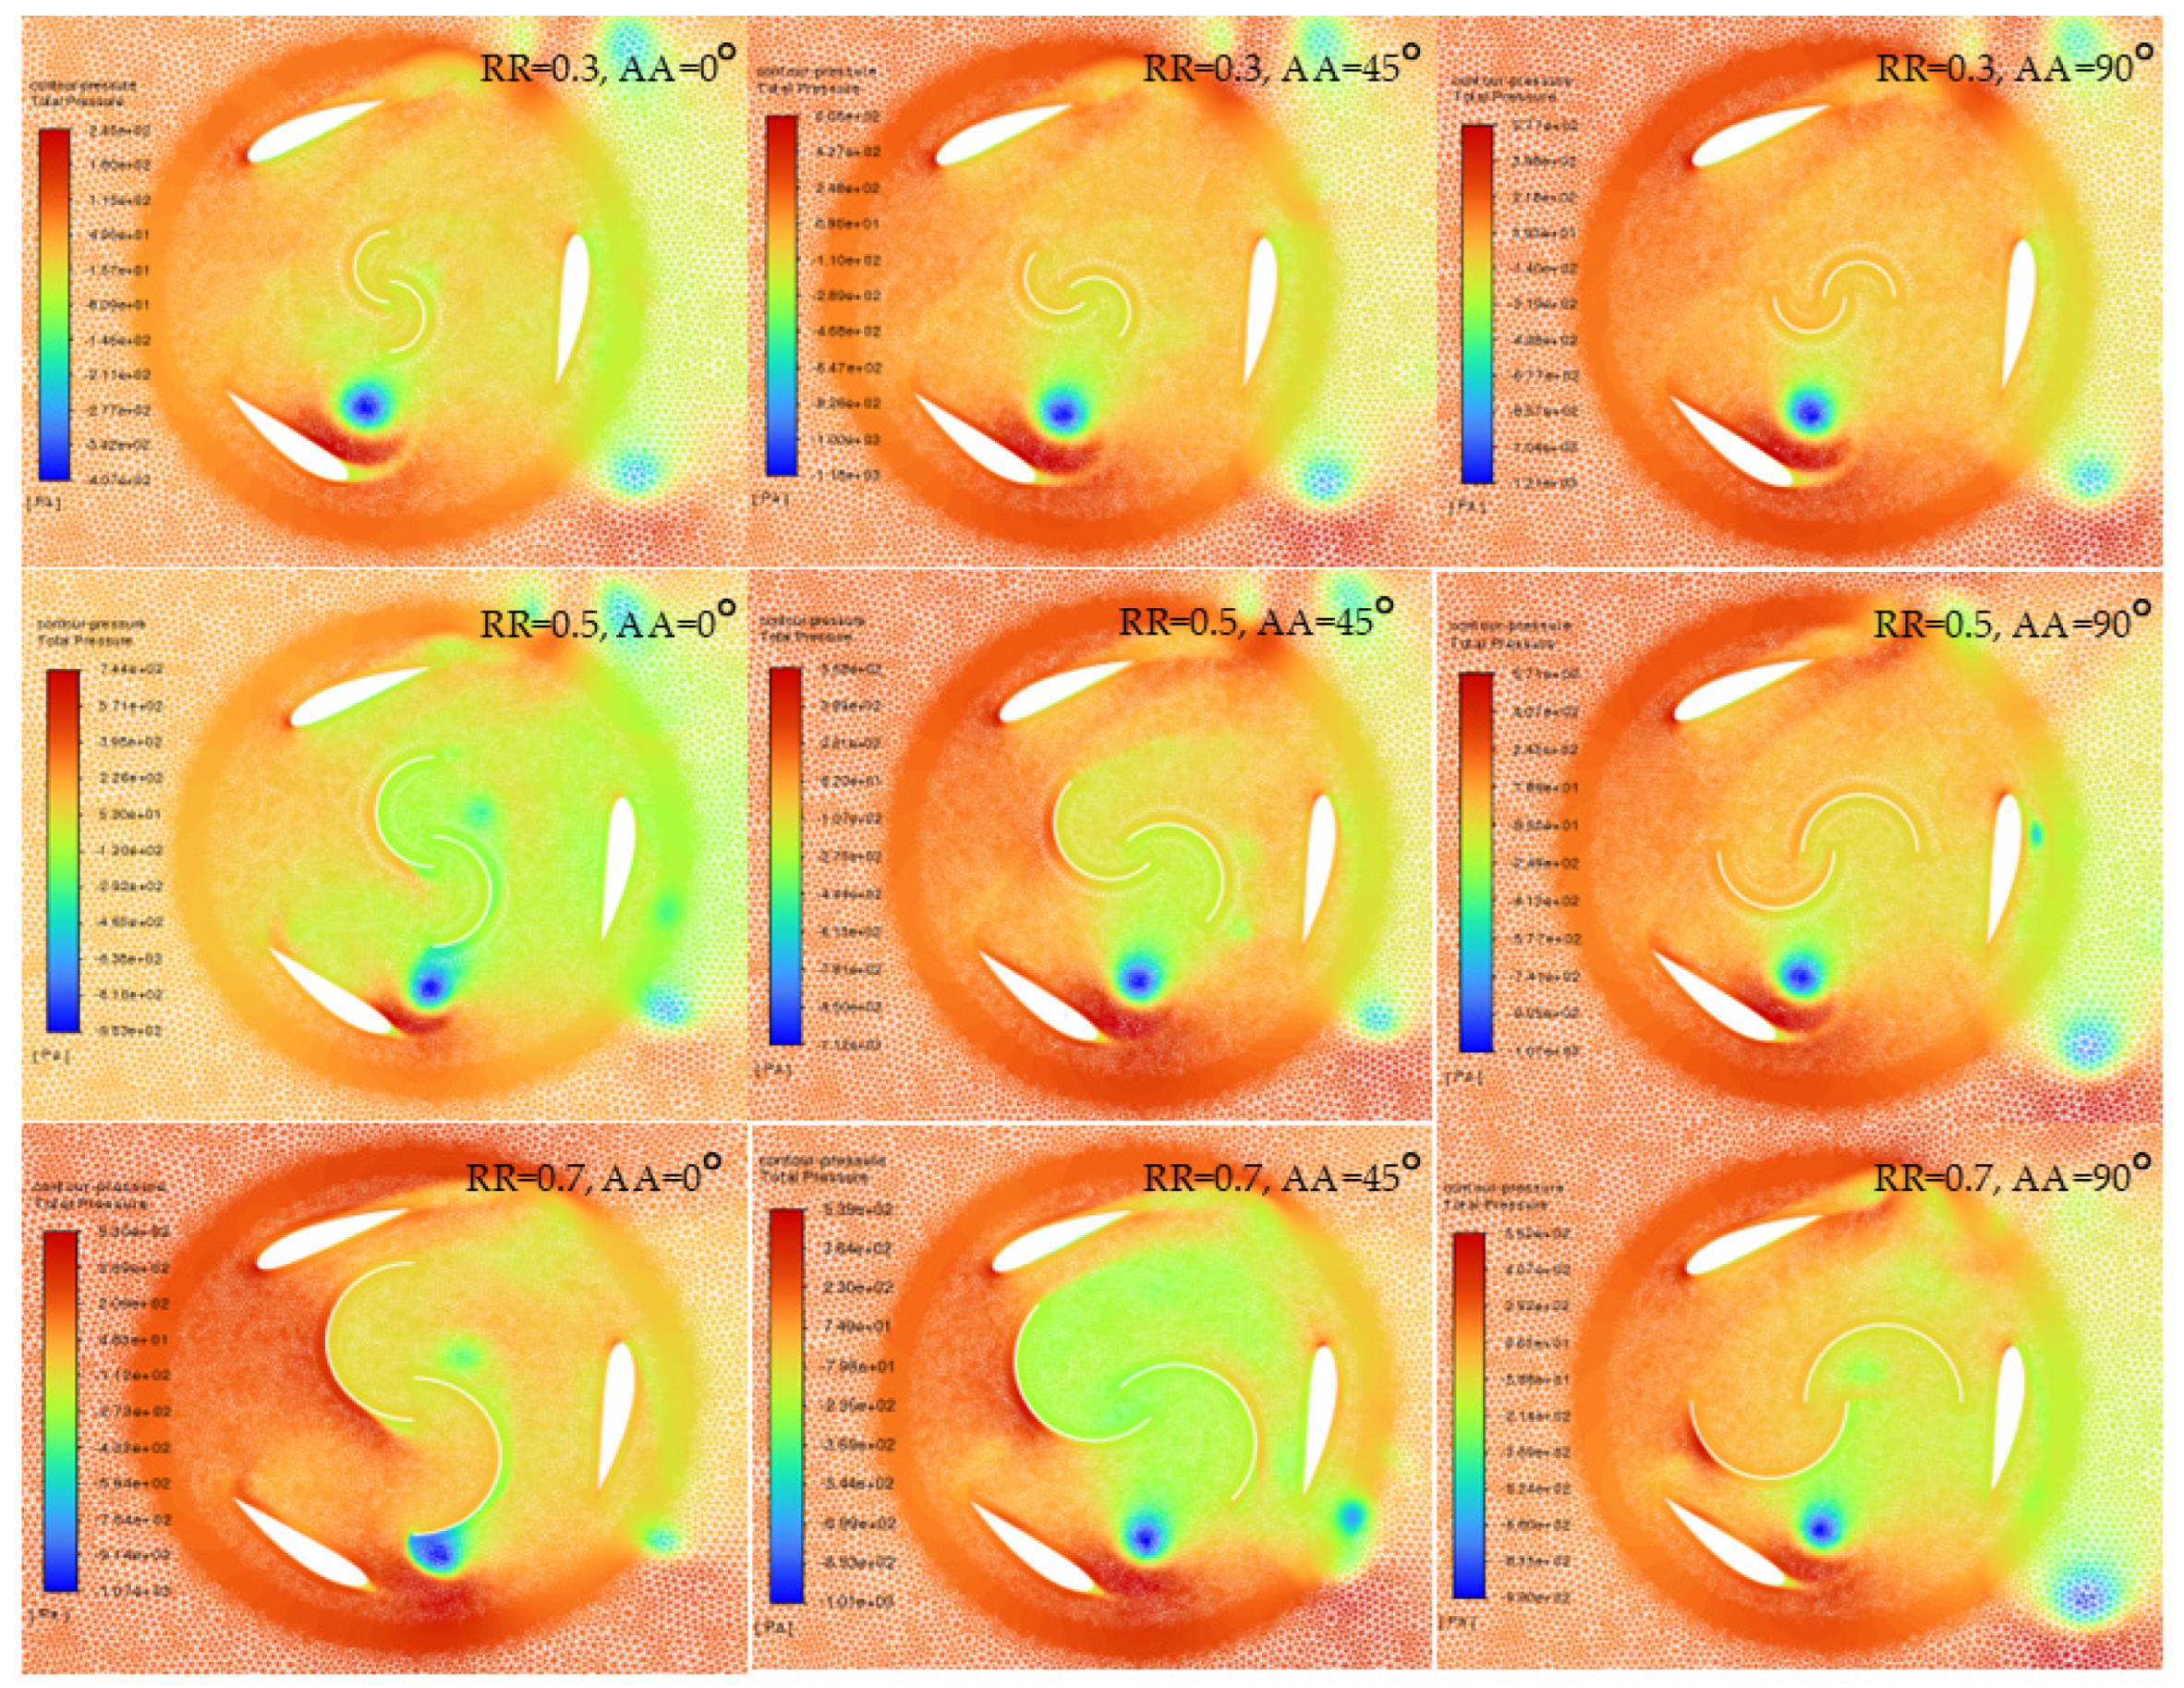
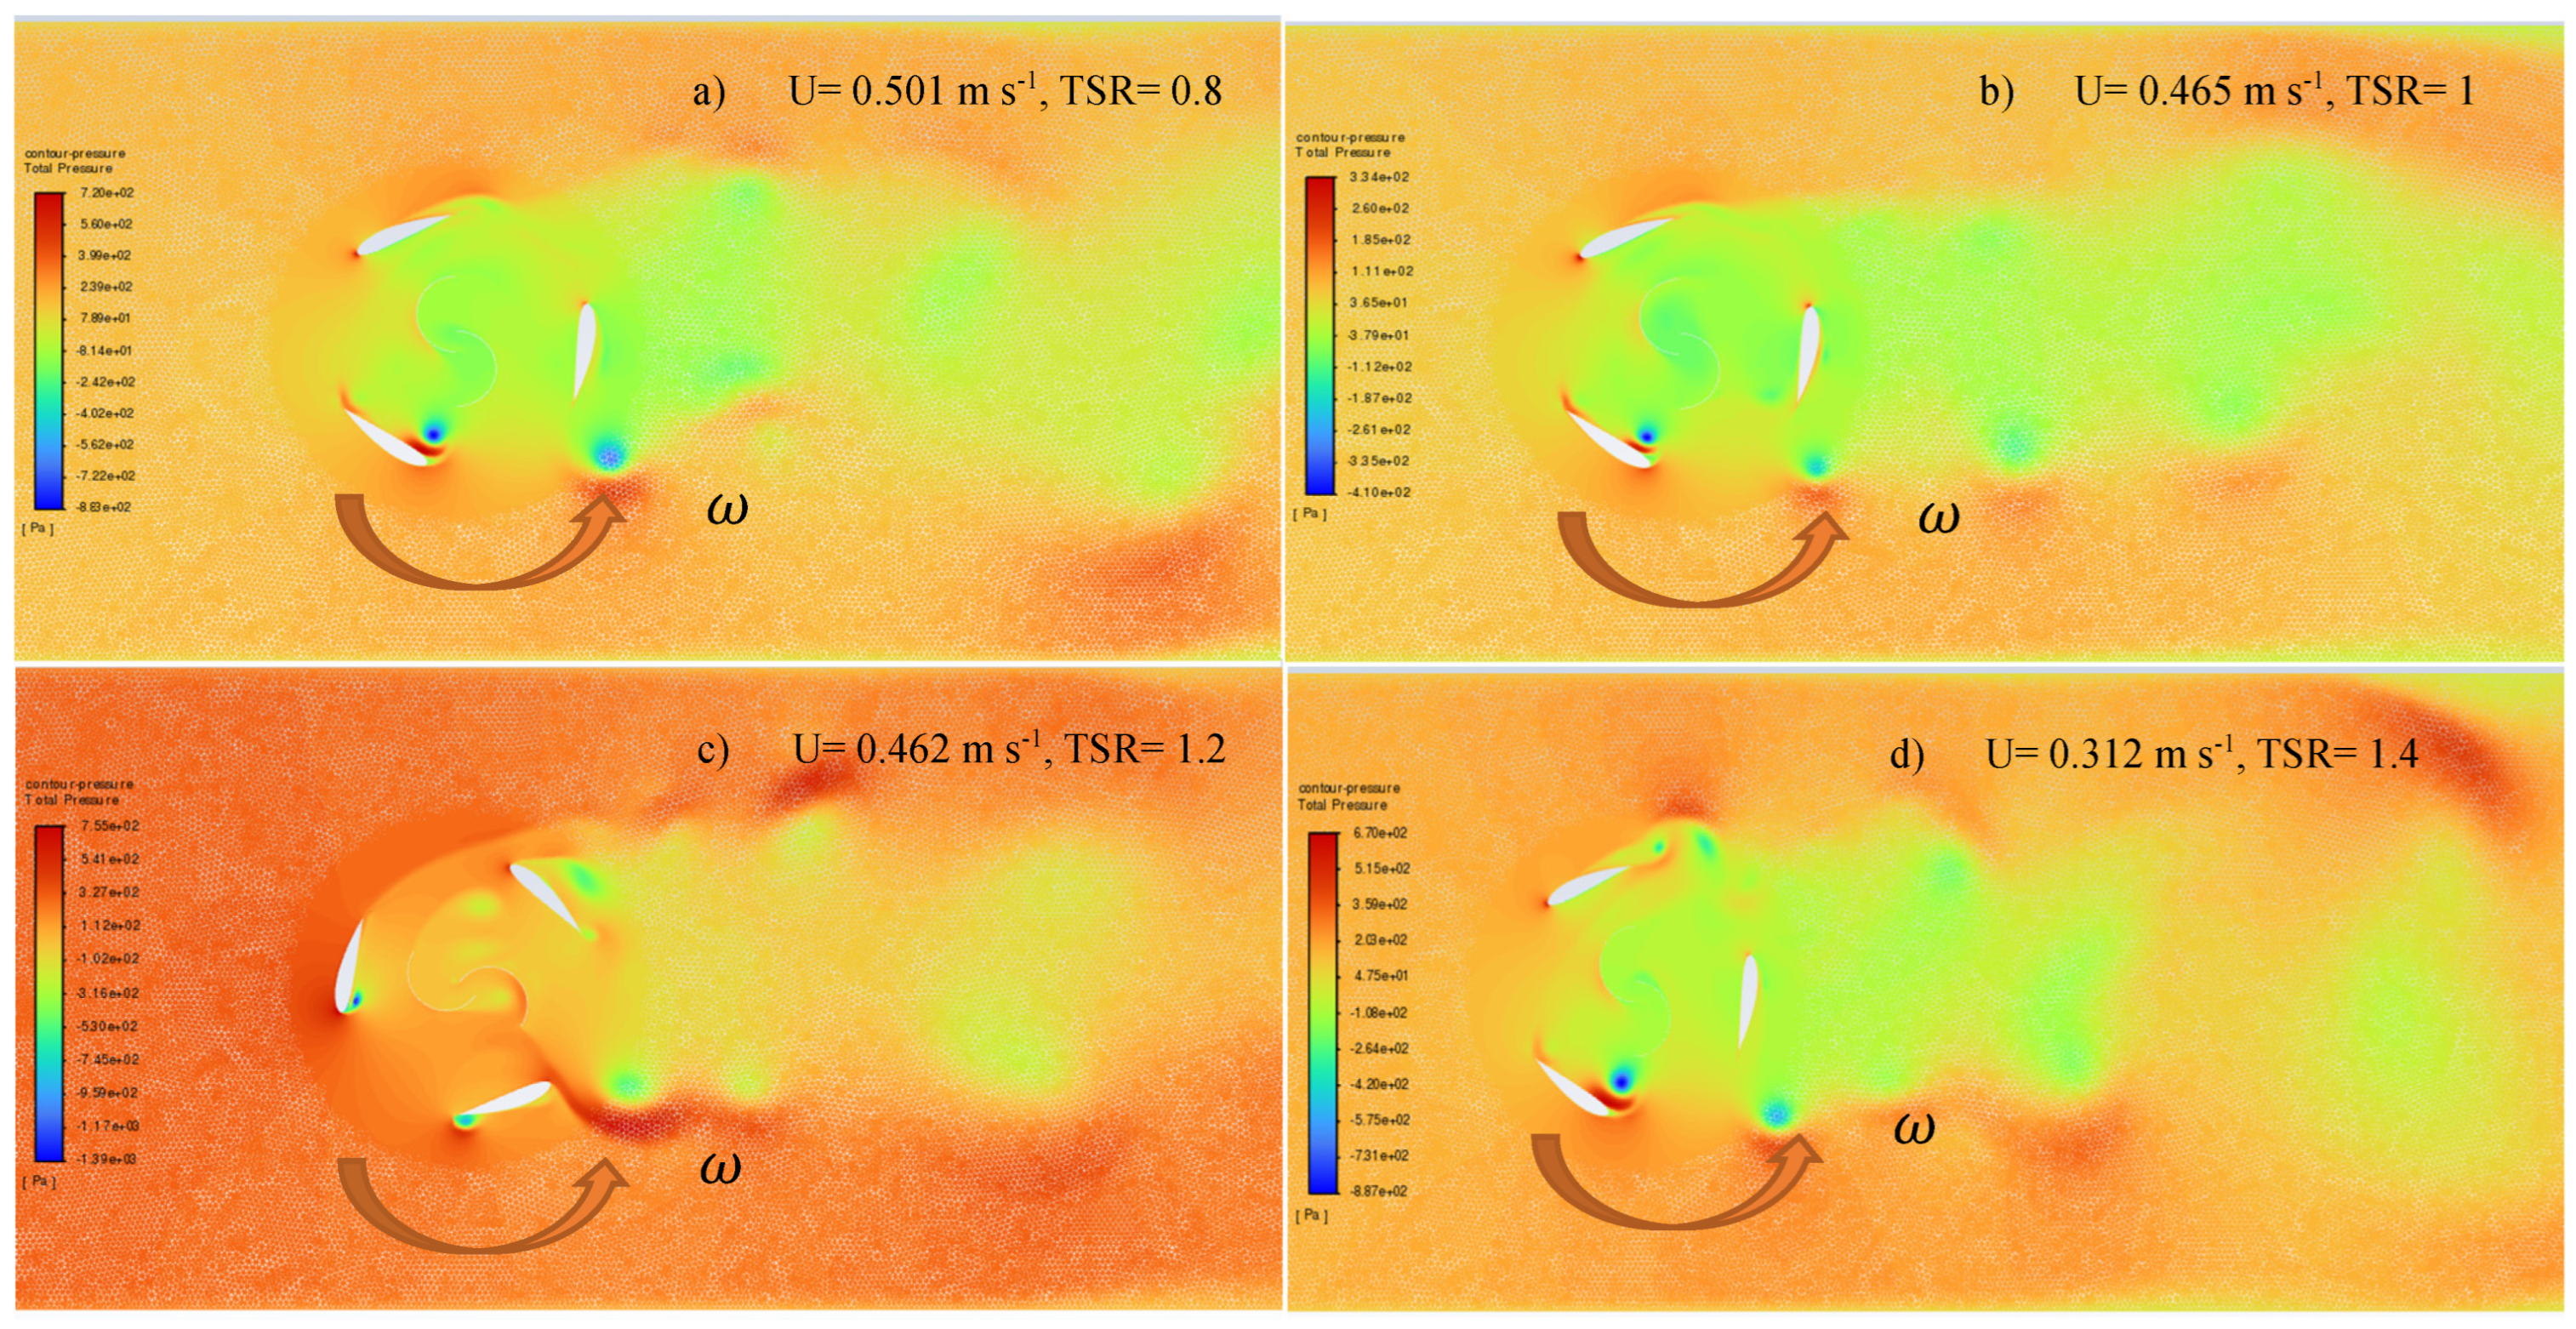
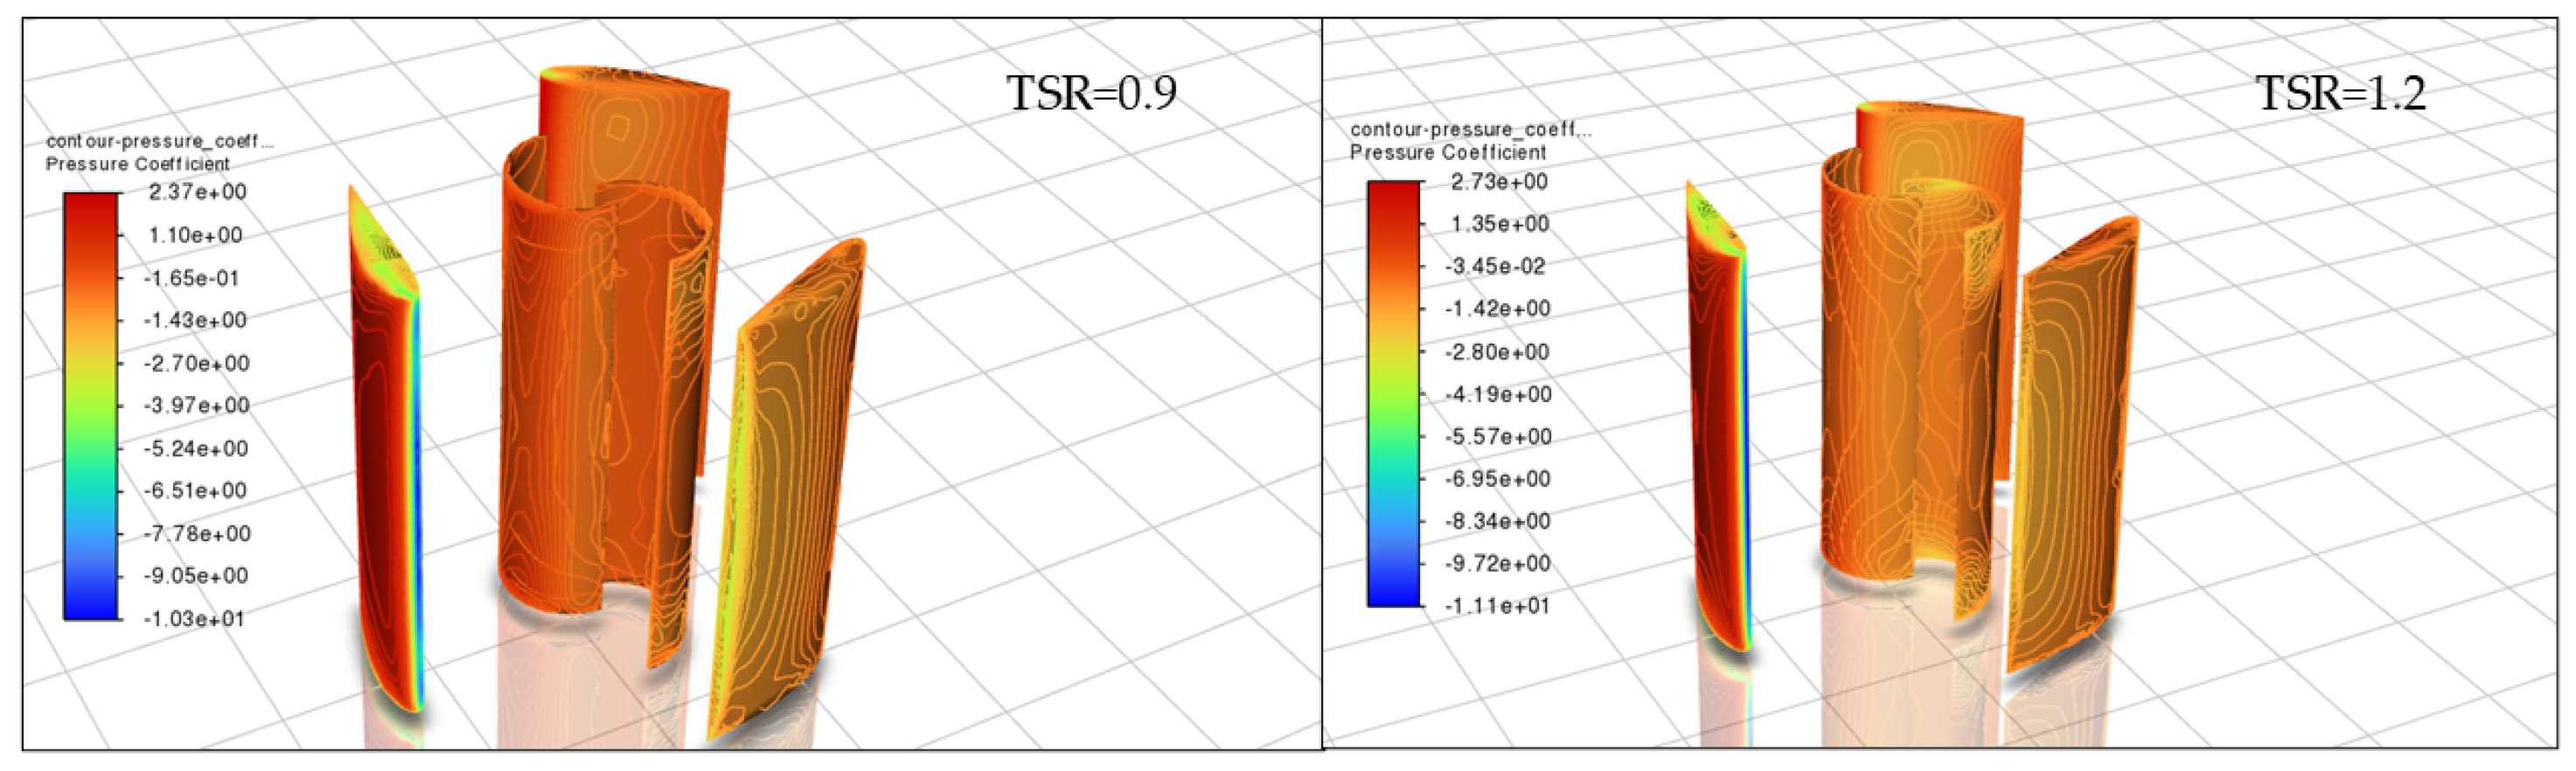
Figure 14 presents the total pressure distribution around the hybrid rotor and provides insight into the flow mechanisms responsible for the variations in torque and power coefficient. The contours show high-pressure regions upstream of the blade surfaces, particularly near the leading or windward portions of the advancing Darrieus blades, where the flow decelerates and transfers momentum to the rotor.
In contrast, the low-total-pressure regions downstream of the blades and within the inner rotor passage indicate separated flow, wake formation, and energy losses associated with vortex shedding. Increasing the radius ratio from to reduces the available passage between the Savonius and Darrieus rotors, intensifies local velocity gradients and pressure losses, and increases wake interference with the outer blades. This explains the larger torque and power fluctuations observed for the higher-radius-ratio configurations. For , the more open passage promotes smoother flow development and weaker rotor–rotor interference.
Changes in the attachment angle modify the relative alignment of the inner Savonius blades with the Darrieus blades, thereby shifting the regions of flow acceleration, stagnation, and wake impingement around the rotor. Consequently, the primarily influences the phase and spatial distribution of the hydrodynamic loading, whereas the controls the degree of blockage and the intensity of the pressure losses. Because the figure shows total pressure, these contours are interpreted mainly in terms of flow-energy redistribution and wake losses; the net blade torque is determined by the corresponding pressure difference between the pressure and suction surfaces.
To evaluate the dynamic performance of the proposed hybrid turbine, transient simulations were performed in ANSYS Fluent under different operating conditions. Each case was configured by varying the tip speed ratio (TSR) while keeping all other physical conditions constant, including the turbulence model, working fluid, boundary conditions, and meshing parameters. The simulations were designed to capture unsteady behavior through specific reports that enabled monitoring of key variables, including the torque applied to the Darrieus and Savonius rotors, the torque in the hybrid configuration, the mechanical power generated, the power coefficient, and the hydrodynamic forces in the longitudinal and transverse directions.
The operating conditions considered are summarized in the following
Table 8, which specifies the TSR values, the fluid velocity, and the angular velocity imposed on the rotational domain.
3.1. Forces in x for the Hybrid Rotor
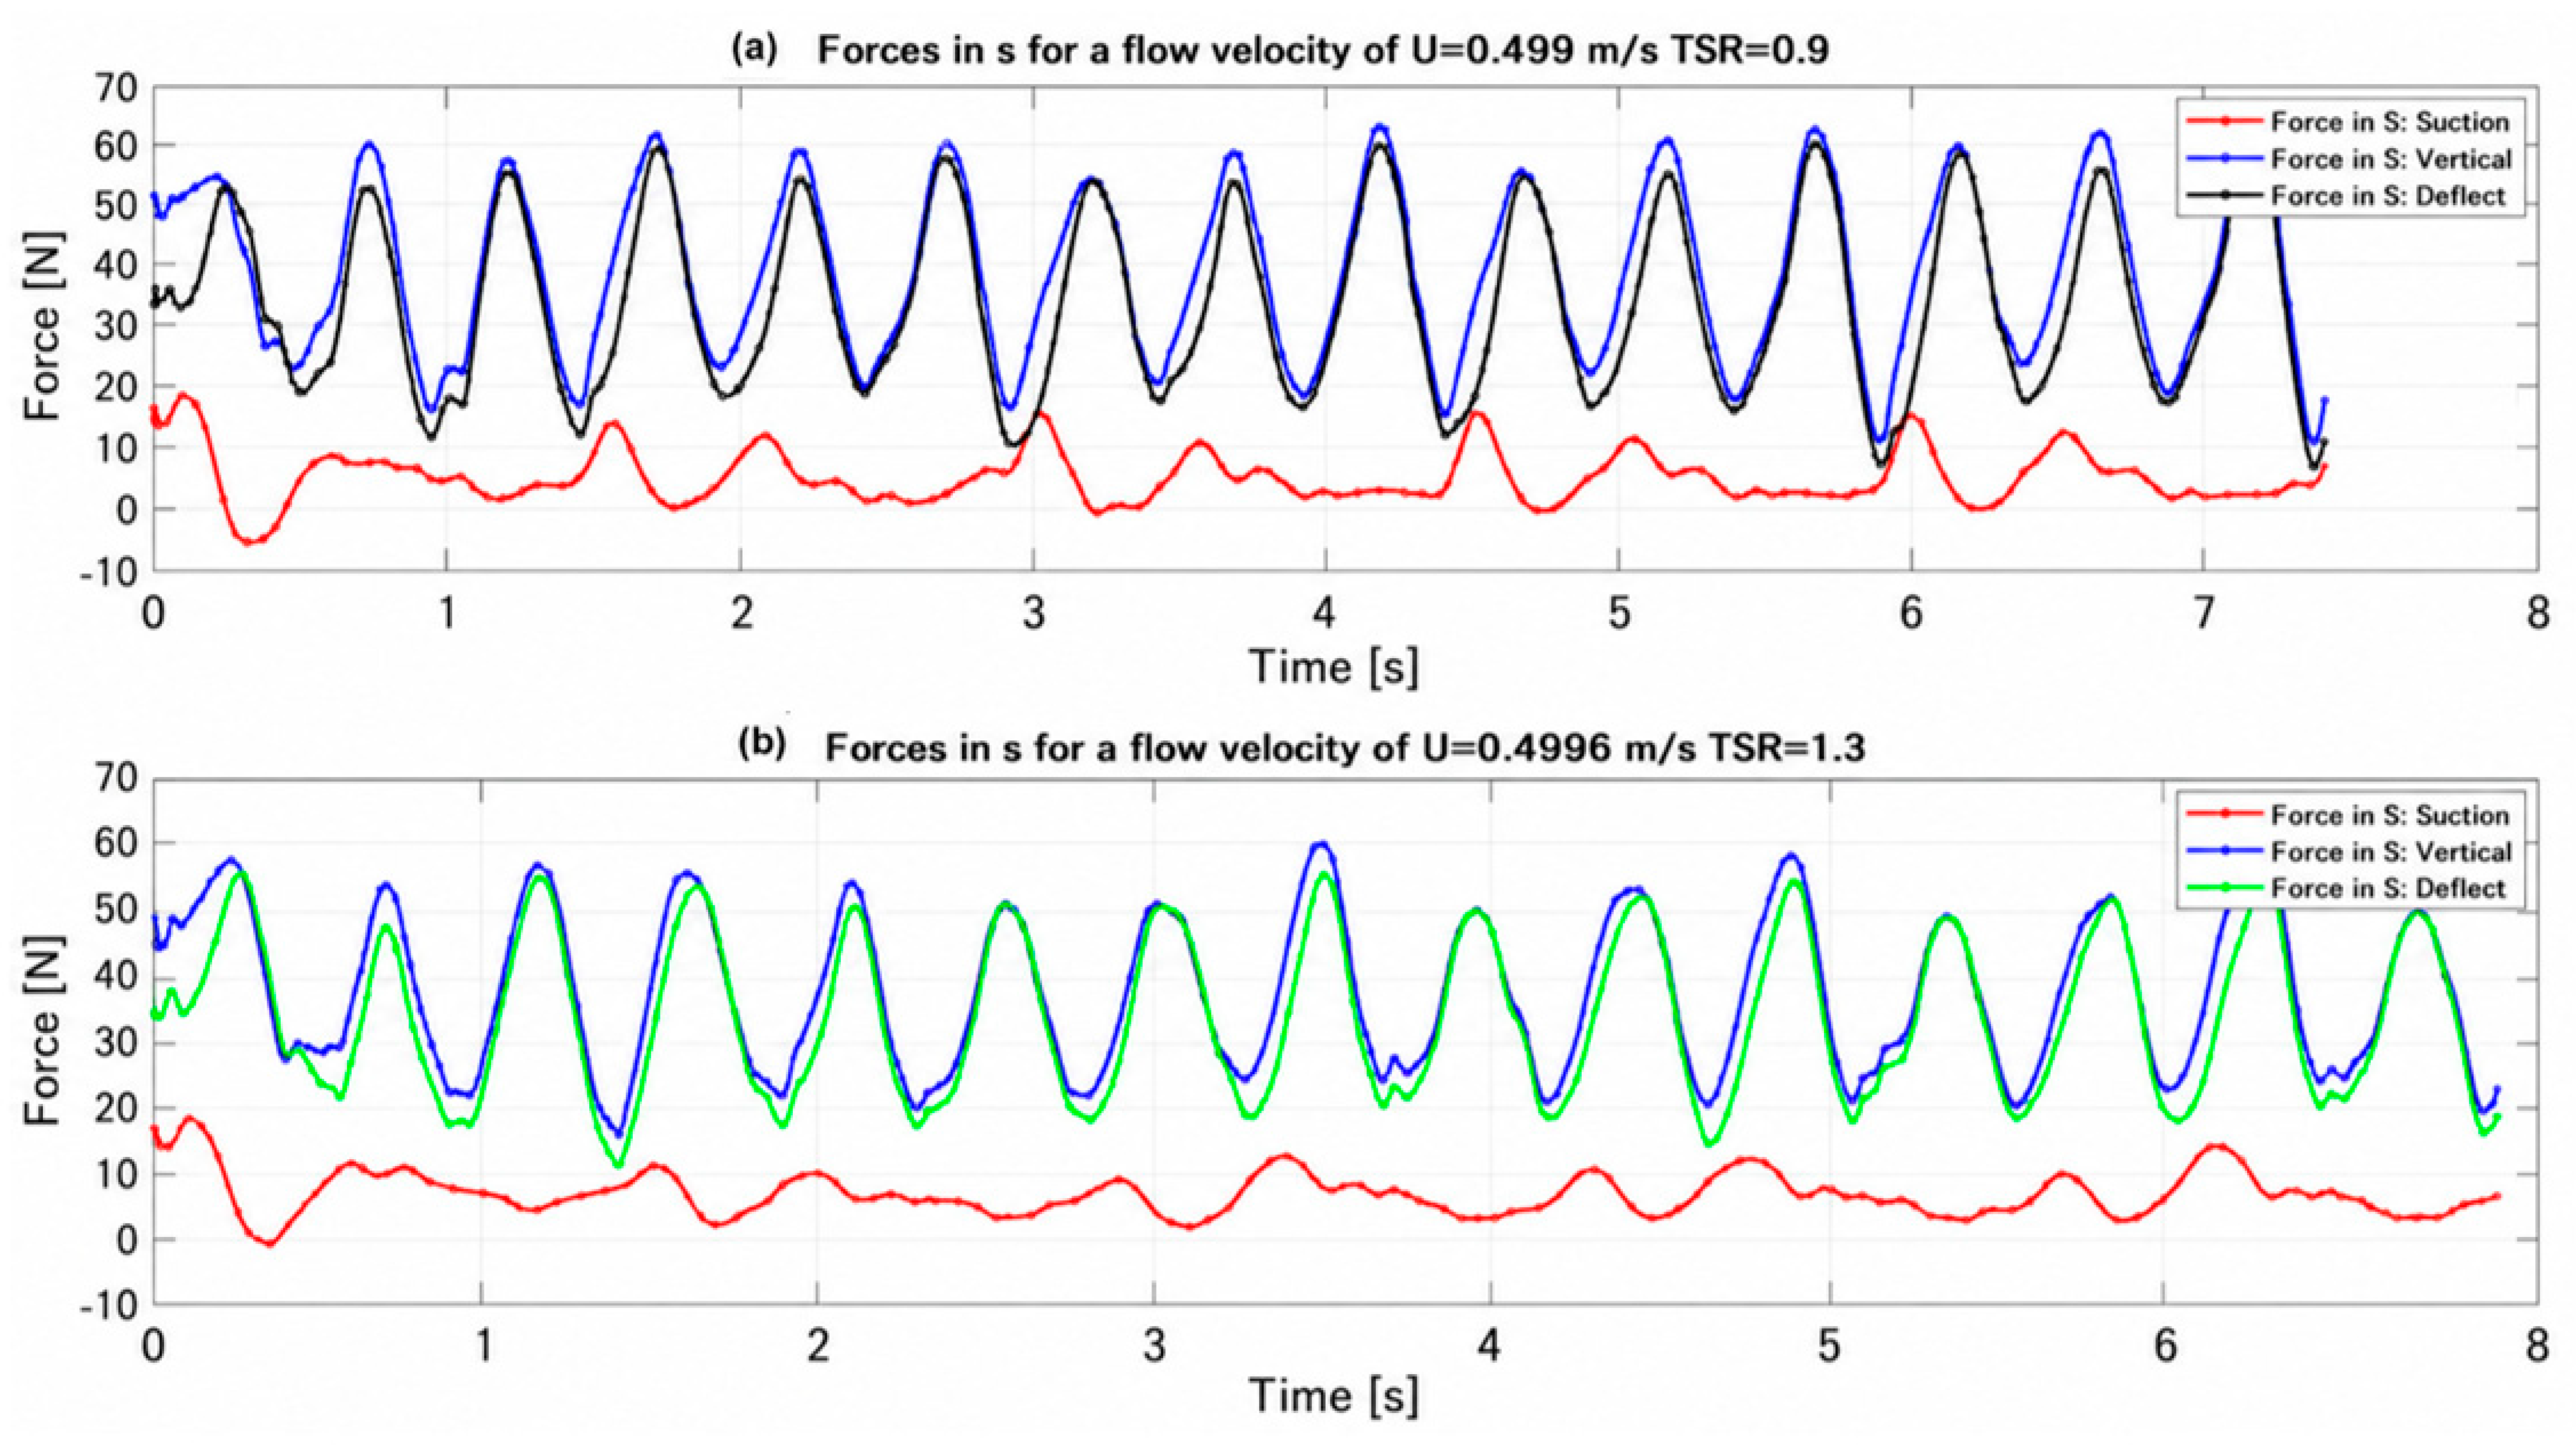
The behavior of the forces in the x-direction (parallel to the flow) for the three rotors (Savonius, Darrieus, and hybrid) under the conditions U = 0.459 m s
−1, TSR = 0.9 can be seen in
Figure 15, and ω = 4.24 rad/s shows typical characteristics of a hybrid system where drag and lift mechanisms coexist: First, the Darrieus rotor exhibits a clearly periodic and dominant signal, with amplitudes oscillating approximately between 20 N and 60 N. This sinusoidal variation is associated with changes in the angle of attack of the blades during rotation, generating variable yet highly coherent aerodynamic forces over time.
The Savonius rotor, on the other hand, exhibits a signal of lower magnitude, with values fluctuating approximately from −5 N to 15 N, as well as greater irregularity. This variability is associated with the inherently non-stationary nature of the drag mechanism, where direct interaction with the flow generates zones of recirculation, separation, and re-impact of the fluid.
The hybrid rotor shows a response that combines both effects, with amplitudes similar to or slightly higher than those of the Darrieus rotor (reaching values close to 65 N). The signal is also periodic, but with slight modulations that reflect the interaction between the two rotors.
For condition (b), the hybrid rotor exhibits a periodic signal like that of the Darrieus rotor, but with slightly higher amplitudes (reaching close to 50 N), demonstrating a positive coupling effect between both rotors. The signal shows less modulation than under lower TSR conditions, indicating a more stable and less interfering interaction. Furthermore, all three signals maintain the same oscillation frequency, consistent with the imposed angular velocity, although with slight phase shifts between the Savonius and Darrieus rotors.
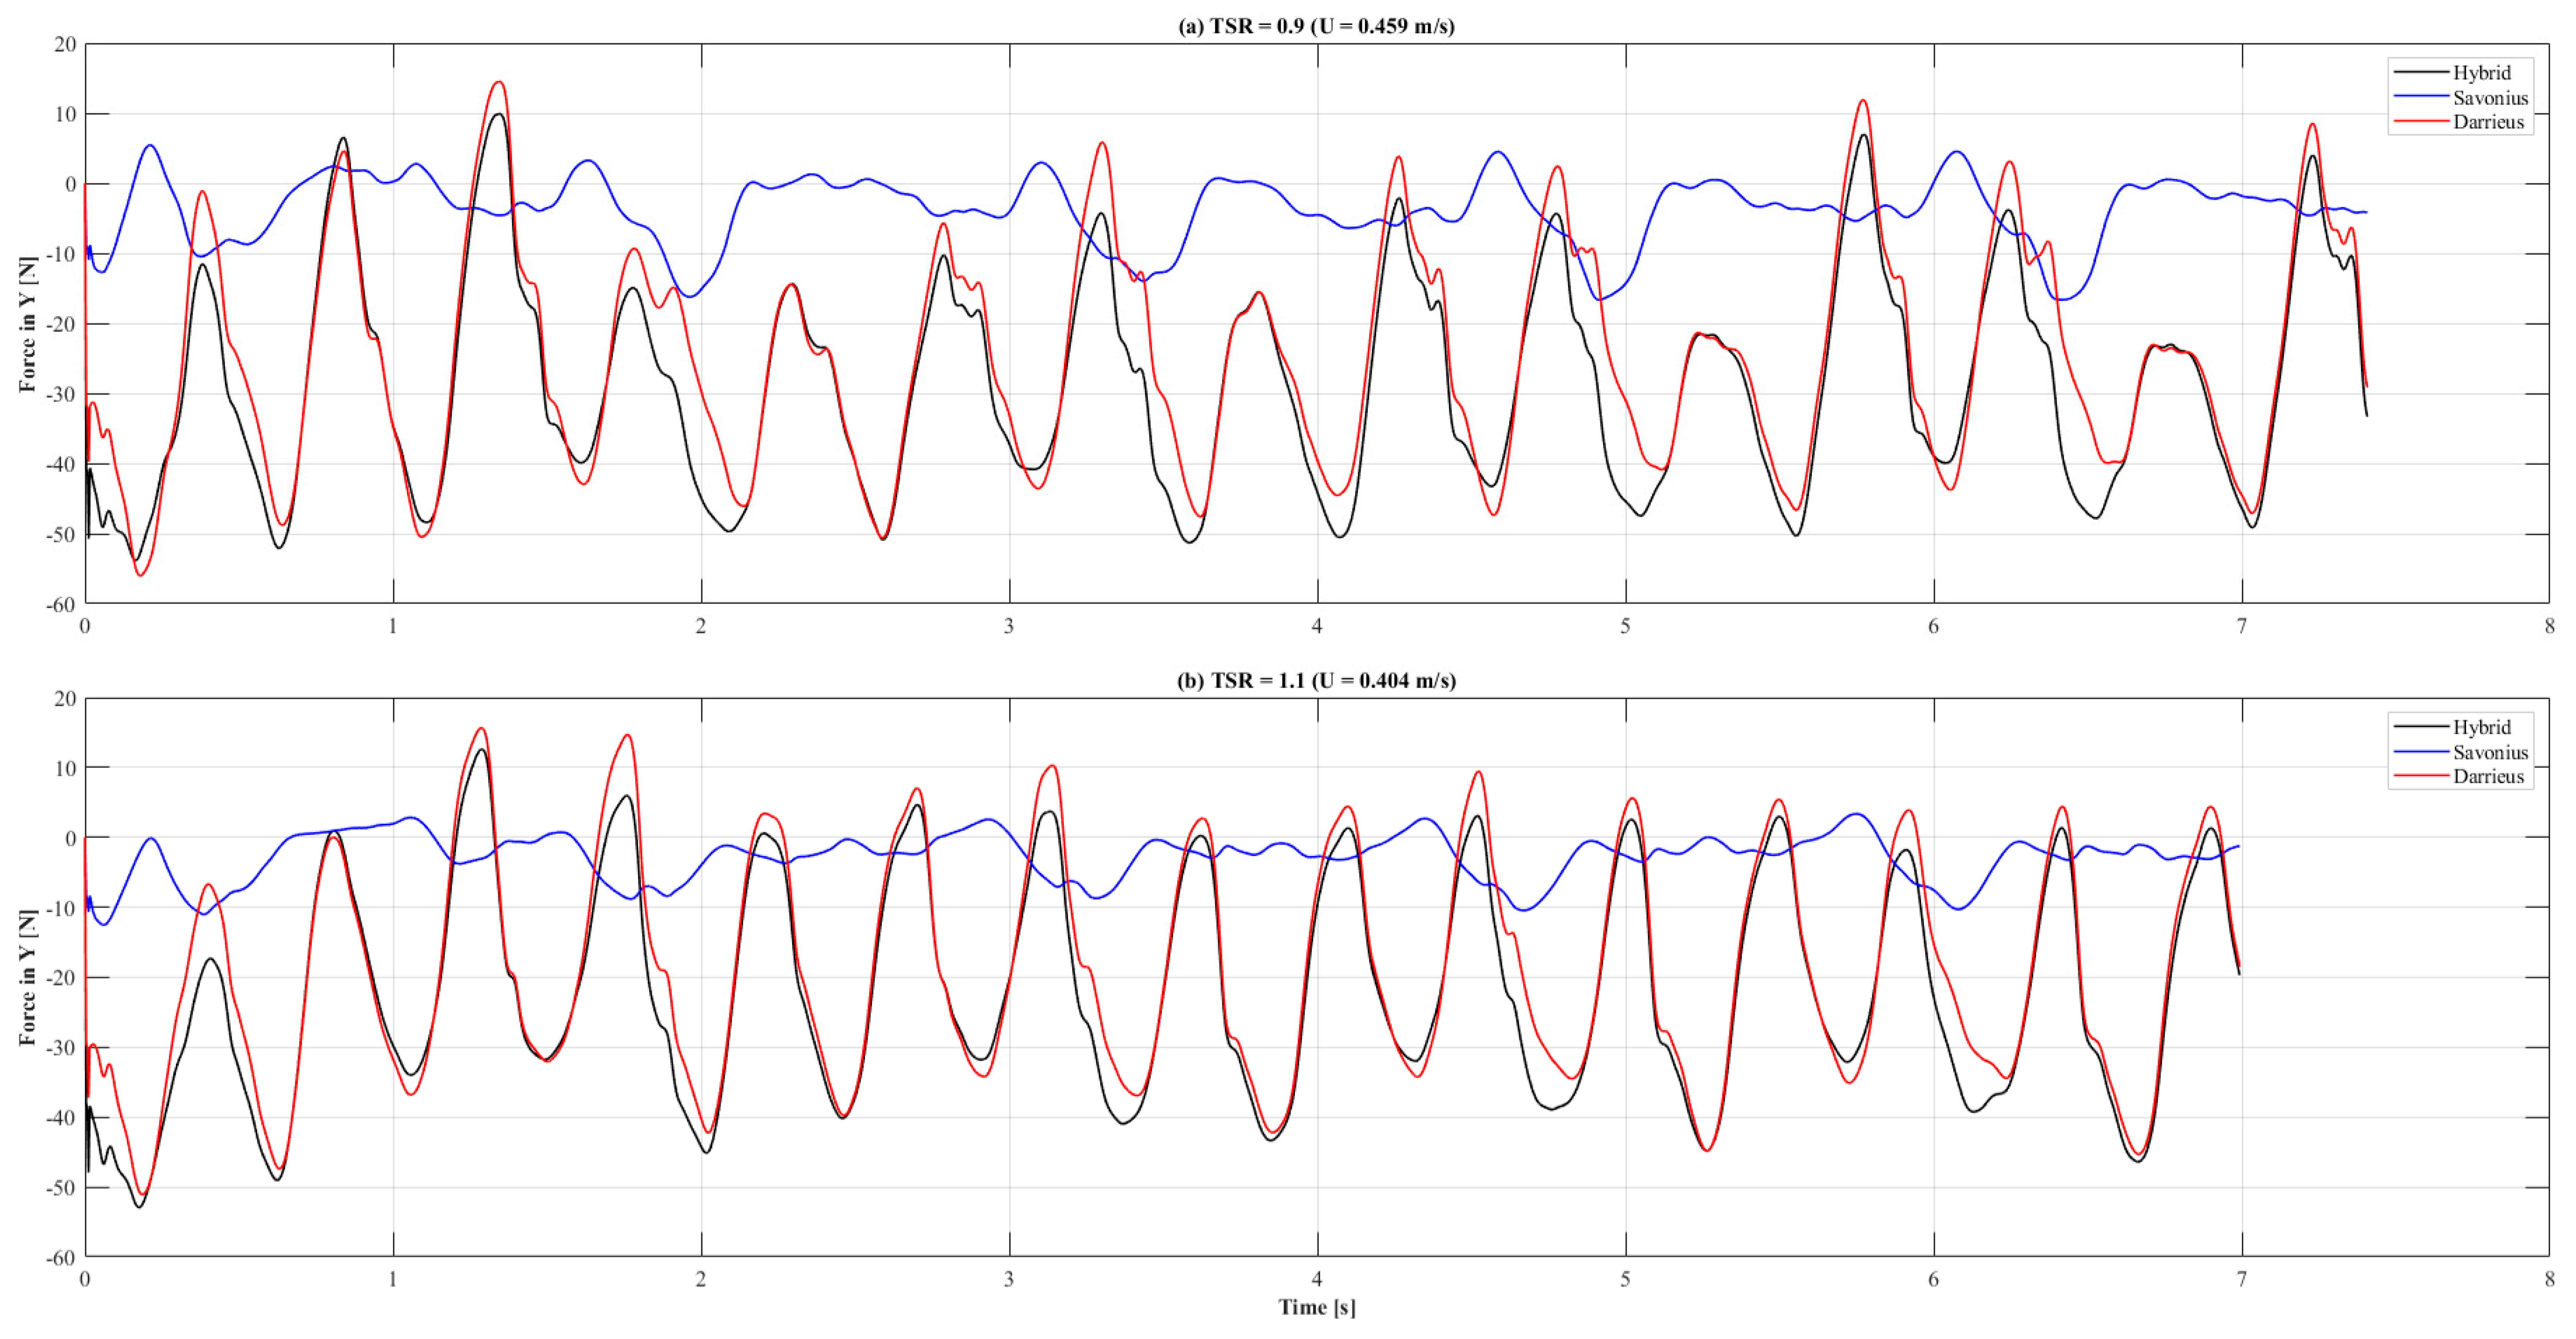
3.2. Forces in y for the Hybrid Rotor
The behavior of the forces in the y-direction (perpendicular to the flow) for condition (a) U = 0.459 m s
−1, TSR = 0.9, and ω = 4.24 s
−1 shows a highly oscillatory dynamic dominated by non-stationary aerodynamic effects, as can be seen in
Figure 16. The Darrieus rotor exhibits the largest amplitudes, with fluctuations reaching values close to −50 N and positive peaks on the order of 10–15 N. This asymmetry in the signal (predominantly negative) is associated with the cyclical variation in the angle of attack and dynamic separation phenomena, characteristic of lift rotors operating at a low TSR.
The Savonius rotor, in contrast, shows lower-magnitude forces (approximately −15 N to 5 N) and a more damped signal, though with irregularities associated with the formation and detachment of vortices in the wake. Its contribution in the transverse direction is less significant, but it introduces disturbances that affect the flow’s stability around the system. The hybrid rotor, for its part, exhibits a response very similar to that of the Darrieus rotor in terms of shape and frequency, but with slight variations in amplitude, which demonstrates the interaction between the two mechanisms.
In physical terms, these forces in the y-direction do not directly contribute to power generation, but they are critical from a structural point of view, as they represent cyclic transverse loads that can induce vibrations and fatigue in the shaft and supports.
For condition in
Figure 16b, the behavior of the forces in the y-direction shows a more stable oscillatory dynamic compared to regimes with lower TSR, although still dominated by the Darrieus rotor. The hybrid rotor, for its part, follows a trend very similar to that of the Darrieus rotor, both in frequency and signal shape, although with slight amplitude differences that reveal the interaction between the two rotors. This similarity confirms that the lateral behavior of the hybrid system is primarily governed by the Darrieus rotor.
3.3. Hybrid Rotor Moments
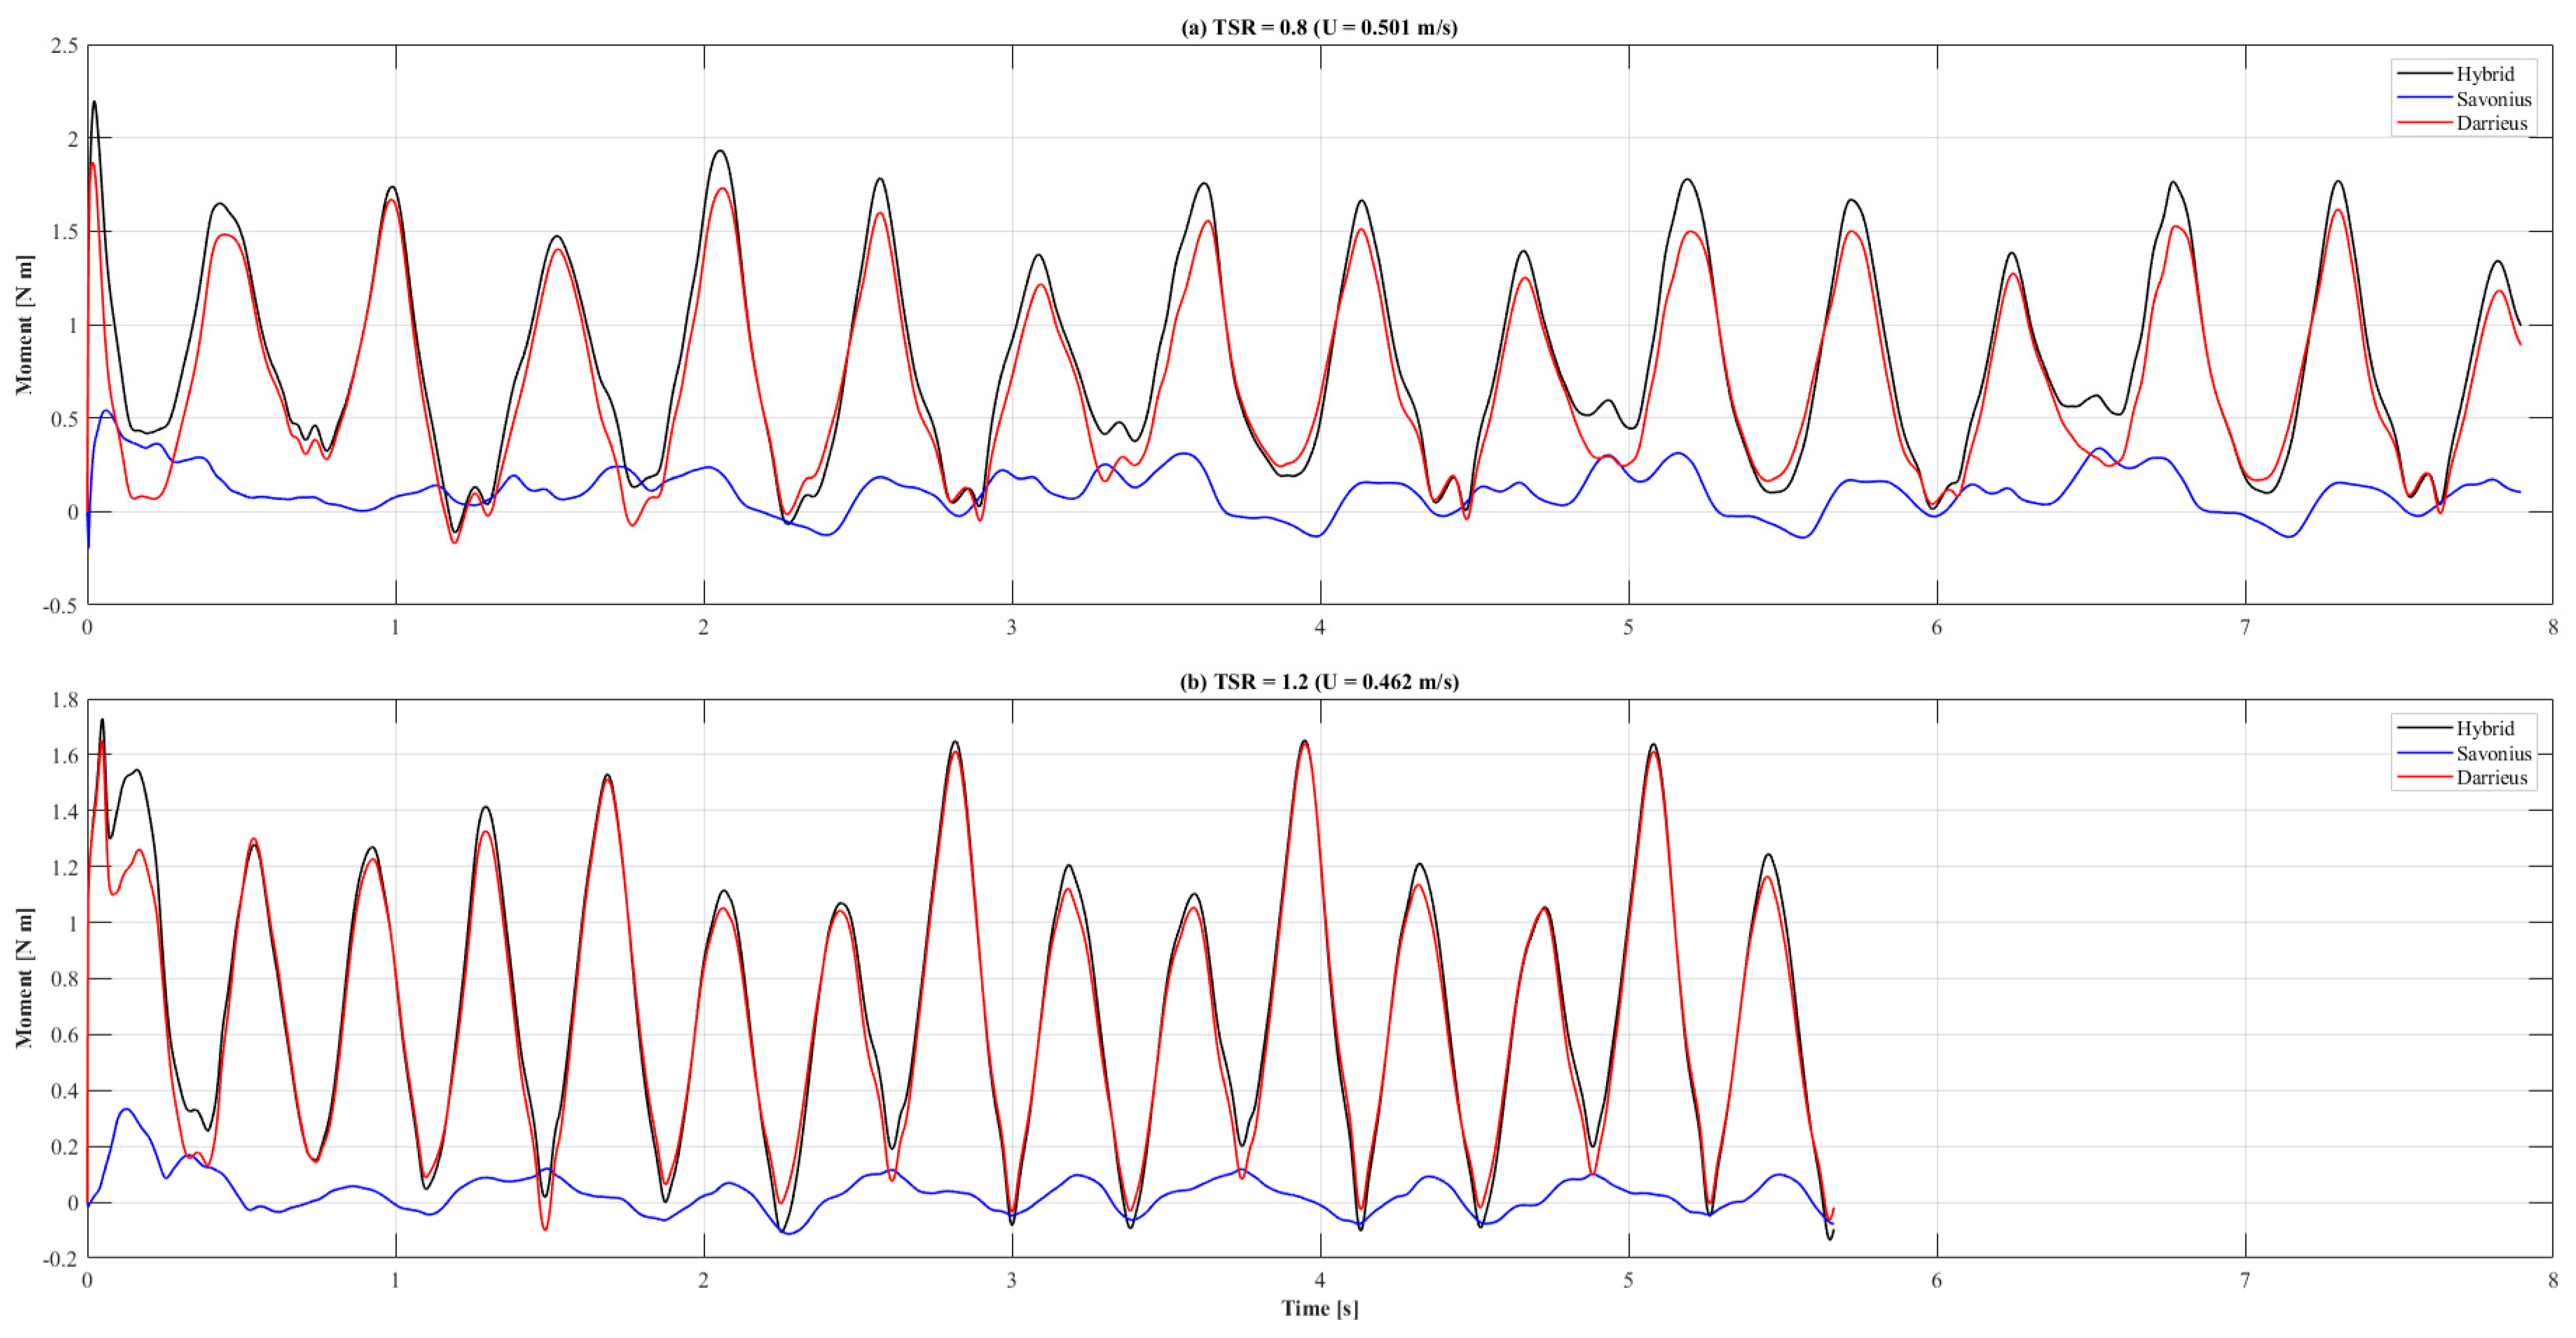
The torque behavior shows a regime strongly influenced by non-stationary effects and a clear difference in the contribution of each rotor, as can be seen in
Figure 17, for condition (a) U = 0.501 m s
−1, TSR = 0.8, and ω = 3.98 s
−1.
The Darrieus rotor exhibits a dominant periodic signal, with torque peaks ranging from approximately 1.5 to 1.8 Nm and minimum values close to zero or slightly negative. This pronounced oscillation is associated with the cyclical variation in angle of attack and dynamic stall, typical of lift rotors operating at a low TSR (≈0.8).
The Savonius rotor, on the other hand, shows a much smaller contribution, with torques in the approximate range of −0.15 to 0.35 Nm. The signal is more irregular and exhibits negative phases, indicating that during part of the cycle, the rotor acts as a drag. The hybrid rotor exhibits the highest momentum magnitude, with peaks near 1.8–2.0 Nm, slightly exceeding that of the individual Darrieus rotor. Its signal retains the Darrieus periodicity, with slight amplification and some modulations reflecting the interaction between the two rotors.
In
Figure 17b (U = 0.462 m s
−1, TSR = 1.2, w = 5.54 s
−1), the torque behavior fluctuates over time for the three rotors, where the hybrid rotor consistently exhibits the highest and most stable torques, fluctuating approximately between 0.4 Nm and 1.8 Nm, suggesting superior torque generation performance. The Darrieus rotor generates positive and significantly higher torques than the Savonius rotor, remaining in the range of 0.2 Nm to 1.0 Nm with moderate fluctuations. On the other hand, the Savonius rotor exhibits the lowest average torque, with large fluctuations and periods of negative or near-zero torque (−0.1 Nm to 0.6 Nm), indicating lower efficiency and greater instability.
The quantitative decomposition of the mean torque confirms that the hybrid performance is governed predominantly by the Darrieus rotor, while the Savonius rotor provides a secondary but relevant contribution that is mainly associated with torque stabilization and the compensation of unfavorable azimuthal positions.
Table 9 presents the results obtained from the quantitative decomposition of the mean torque for each rotor.
Table 9.
Quantitative decomposition of the respective torque contribution ratios of the Darrieus and Savonius rotors.
Table 9.
Quantitative decomposition of the respective torque contribution ratios of the Darrieus and Savonius rotors.
| TSR | Mean_M_Hybrid (Nm) | Mean_M_Savonius (Nm) | Mean_M_Darrieus (Nm) | Savonius Contribution (%) | Darrieus Contribution (%) |
|---|
| 0.8 | 0.5379 | 0.0265 | 0.3552 | 4.9 | 66.0 |
| 1 | 0.327 | 0.0287 | 0.2968 | 8.8 | 90.8 |
| 1.2 | 0.3974 | 0.0188 | 0.3895 | 4.7 | 98.0 |
| 1.4 | 0.1382 | 0.0026 | 0.134 | 1.9 | 97.0 |
At , the hybrid mean torque is , of which the Savonius rotor contributes and the Darrieus rotor , corresponding to relative contributions of 4.9% and 66.0%, respectively. At , the Savonius contribution increases to 8.8%, indicating that the inner rotor has a stronger effect near the design operating region, where it helps sustain positive torque during portions of the cycle in which the Darrieus blade experiences reduced loading. At , the Darrieus contribution reaches 98.0%, while the Savonius share decreases to 4.7%, showing that the outer rotor increasingly dominates the torque production as the rotational speed rises.
3.4. Mechanical Power
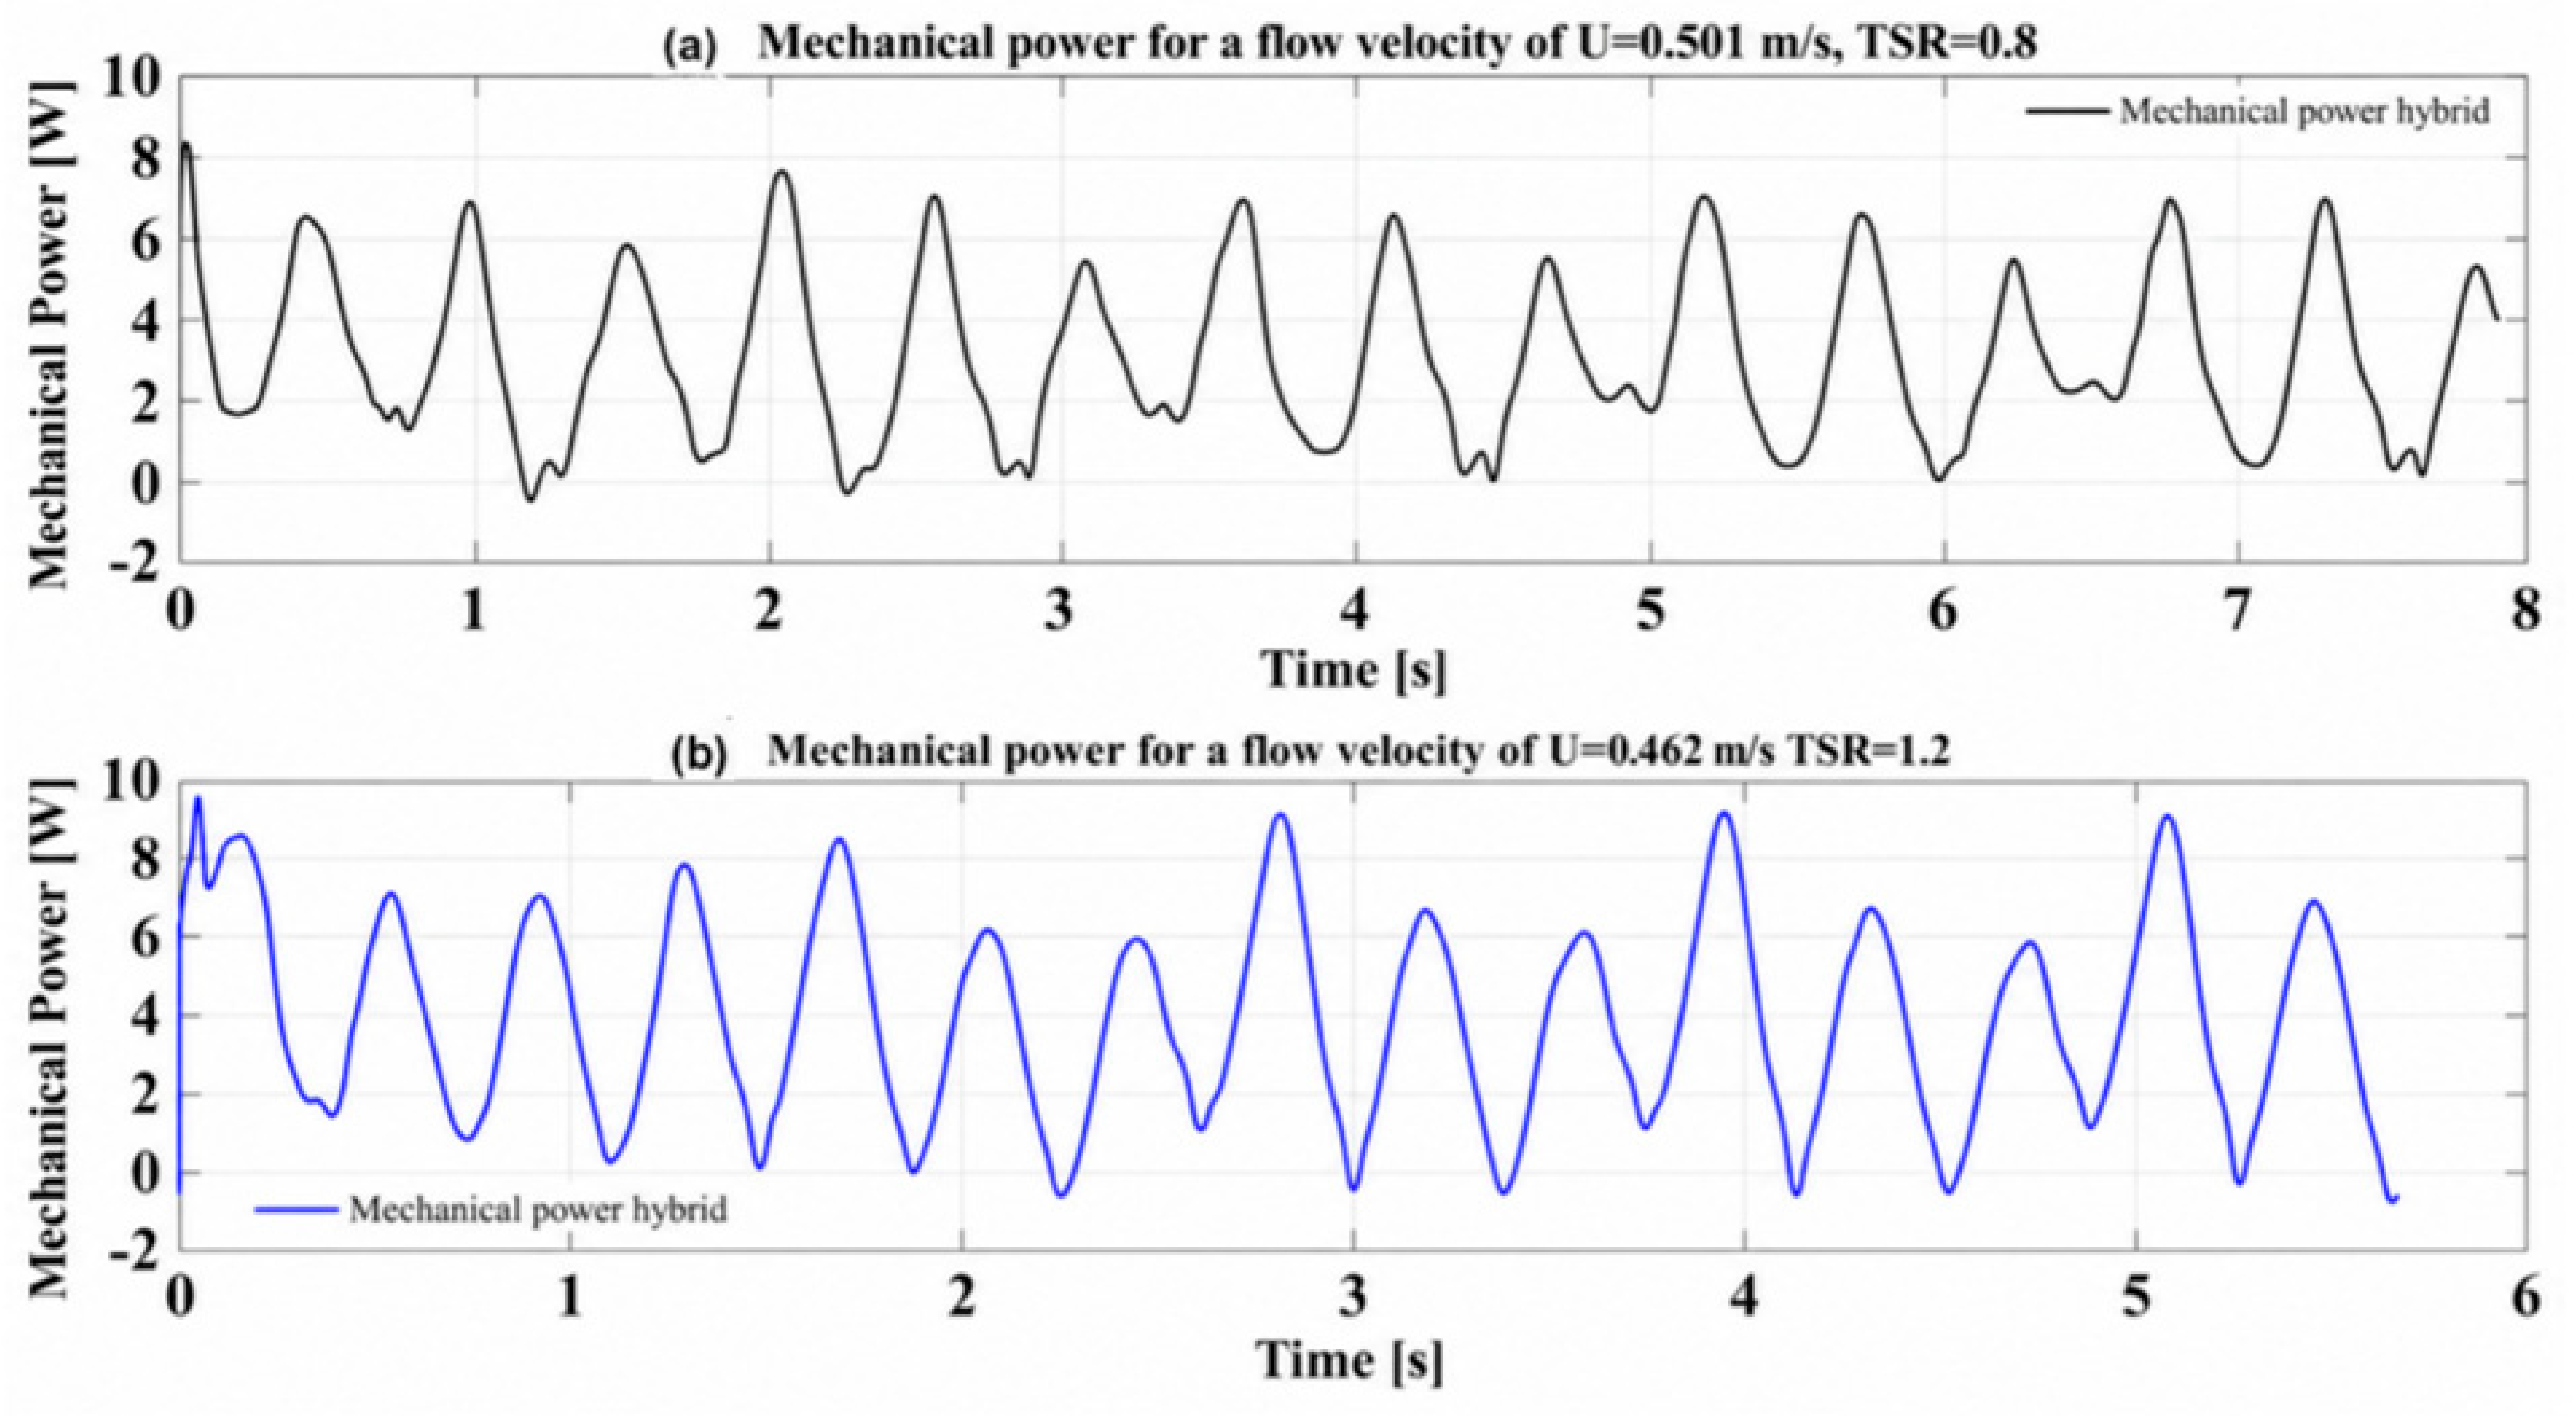
During the initial transient phase (0 to ~1.5 s), the power signal exhibits a high peak near 8.5 W followed by an abrupt drop, as shown in
Figure 18. This phenomenon corresponds to the flow initialization process, during which the velocity and pressure fields are still developing around the rotor, overcoming the system’s numerical inertia. At this stage, the results do not reflect the turbine’s actual performance, so it is appropriate to disregard them when calculating average values or performing energy analysis.
From approximately 2.0 s onward, a quasi-steady-state regime of a periodic nature is observed, evidenced by a clearly cyclical signal. This quasi-steady-state regime indicates that the simulation has reached aerodynamic convergence and that the flow around the rotor repeats under the imposed operating conditions (flow velocity and TSR). In this regime, the power output exhibits oscillatory behavior, with peaks between 5.0 and 7.5 W, corresponding to angular positions where energy extraction is at its maximum, and troughs near 0 W, where efficiency decreases considerably. Small intervals with negative values are even observed, indicating that, in certain azimuthal positions, resistive forces momentarily exceed the torque-generating forces.
This behavior clearly reflects the hybrid nature of the Darrieus–Savonius rotor. On the one hand, the lift-based Darrieus component is responsible for large power fluctuations due to continuous variation in the blade angle of attack, leading to sharp peaks and deep dips. On the other hand, the drag-based Savonius component partially smooths the response of the system, as evidenced by the appearance of small secondary peaks within the power troughs. These contributions from the Savonius are especially important in areas where the Darrieus is less efficient, helping to maintain rotor spin and improving the overall performance of the hybrid system.
For condition b (U = 0.462 m s−1, TSR = 1.2, ω = 4.49 s−1), the mechanical power behavior exhibits highly oscillatory dynamics dominated by the low rotational speed. After a brief initial transient period (~0–1.5 s), characterized by a peak near 10 W and rapid flow stabilization, the system enters a quasi-steady state with marked, asymmetric oscillations. In this state, main peaks reaching approximately 9 W are observed, interspersed with smaller secondary peaks (6–7 W), reflecting the interaction between the aerodynamic contributions of the Darrieus and Savonius rotors throughout the rotation. However, the most relevant feature is the recurring presence of valleys with negative power values (≈−0.5 to −0.6 W), indicating that, at certain azimuthal angles, the system experiences resistive torque. This phenomenon is explained by the low TSR, which induces high angles of attack on the Darrieus blades, thereby favoring dynamic stall and increasing drag. In this context, the Savonius rotor plays a fundamental role by providing positive torque in these unfavorable zones, enabling the rotor to maintain rotation and recover power, thereby confirming the functional synergy of the hybrid design under low-speed operating conditions.
3.5. Power Coefficient
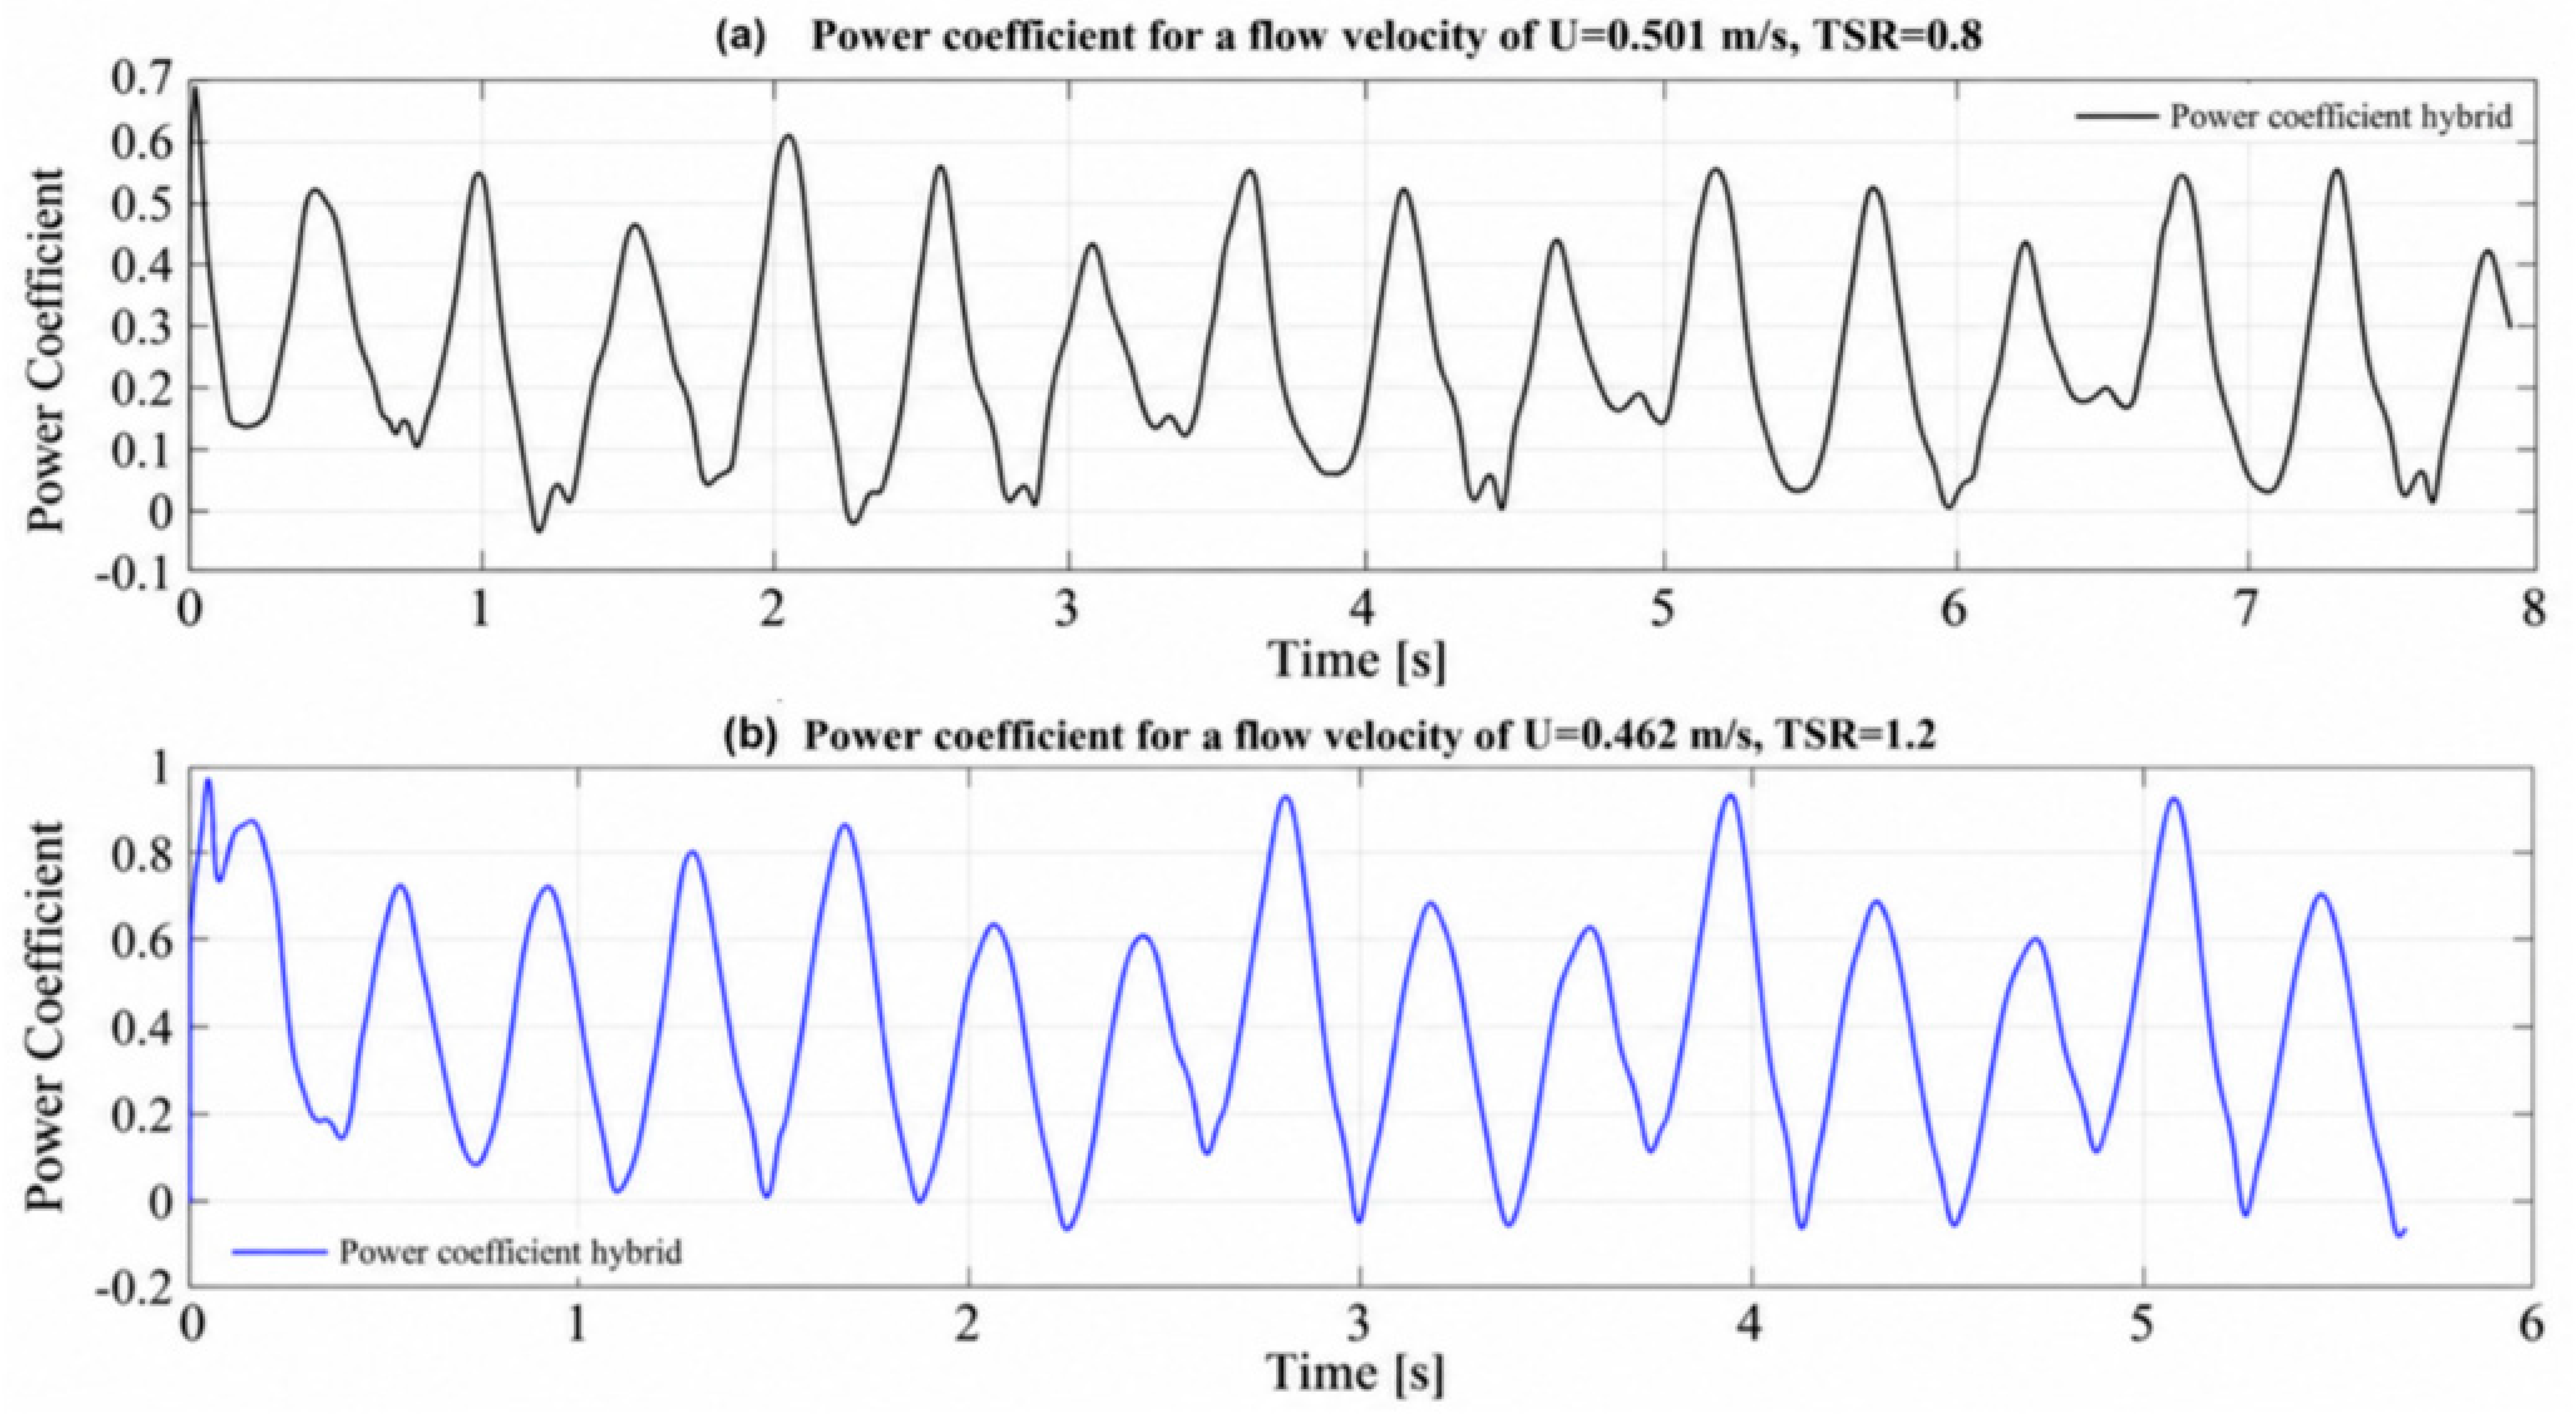
The power coefficient
curve as a function of time exhibits behavior consistent with the observed dynamics of mechanical power for the condition TSR = 0.8, U = 0.501 m s
−1, and
= 3.98 s
−1, as can be seen in
Figure 19. In the initial transient zone (0 to ~2.0 s), pronounced fluctuations associated with the establishment of the flow field are evident. From this interval onward, the signal evolves toward a periodic quasi-steady-state regime, characterized by a well-defined cyclic oscillation, reflecting the now-stabilized fluid–structure interaction. In this regime,
shows maximum peaks between 0.50 and 0.60, associated with angular positions where the combined contribution of the Savonius drag effect and the Darrieus lift is most efficient. On the other hand, the troughs decrease to values close to 0, without remaining negative for an extended period, suggesting that the system avoids net energy losses during steady-state operation.
Considering the envelope of the signal in the periodic regime (approximately between 4.0 and 8.0 s), an average can be estimated with a representative value close to
For the condition TSR = 1.2, U = 0.462 m s−1, and = 5.54 s−1, the curve shows behavior characteristic of a rotor operating at a higher relative speed to the flow. In the initial transient phase (0 to ~1.5–2.0 s), high peaks are observed. Subsequently, the system enters a periodic quasi-steady state, where exhibits marked but more structured oscillations than in the case of the lower TSR.
The signal retains a combined behavior of the Darrieus–Savonius system, as evidenced by secondary peaks within the valleys, indicating that the Savonius rotor continues to contribute torque in regions where the Darrieus loses efficiency. However, at this higher TSR, the Darrieus rotor’s contribution is more dominant, which explains both the higher peaks and the greater signal variability. Estimating the behavior in the stable periodic region (approximately between 3.0 and 8.0 s), the average power coefficient is found to be .
3.6. Velocity Contours in the Hybrid Rotor
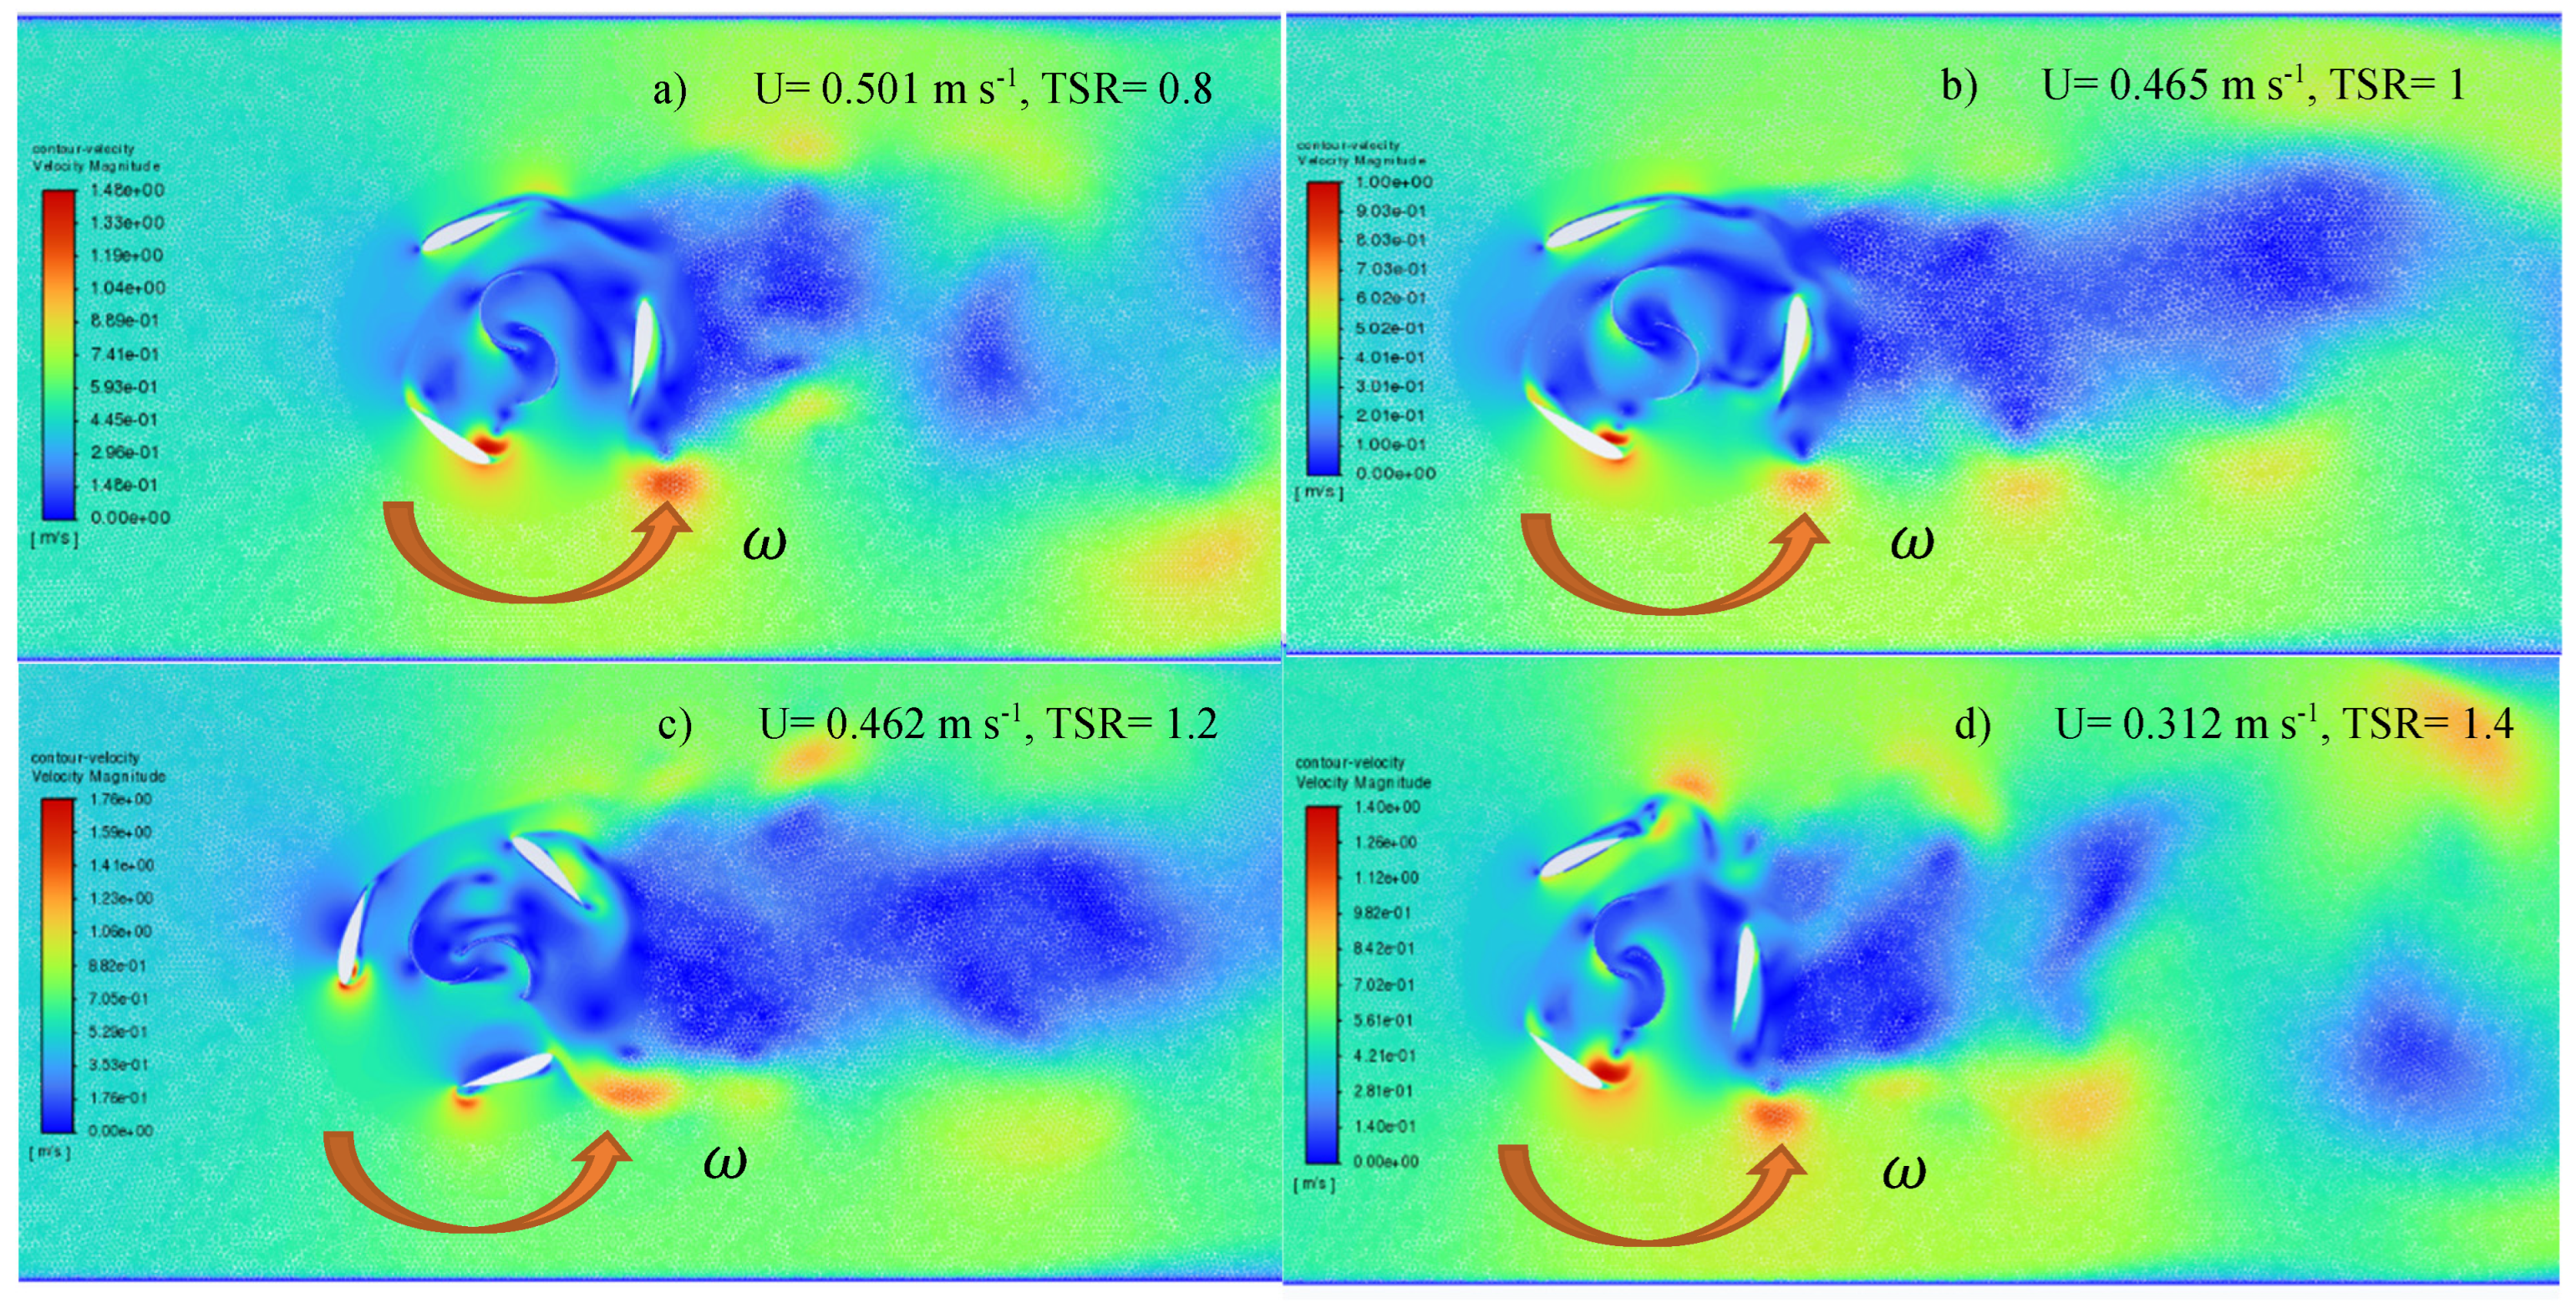
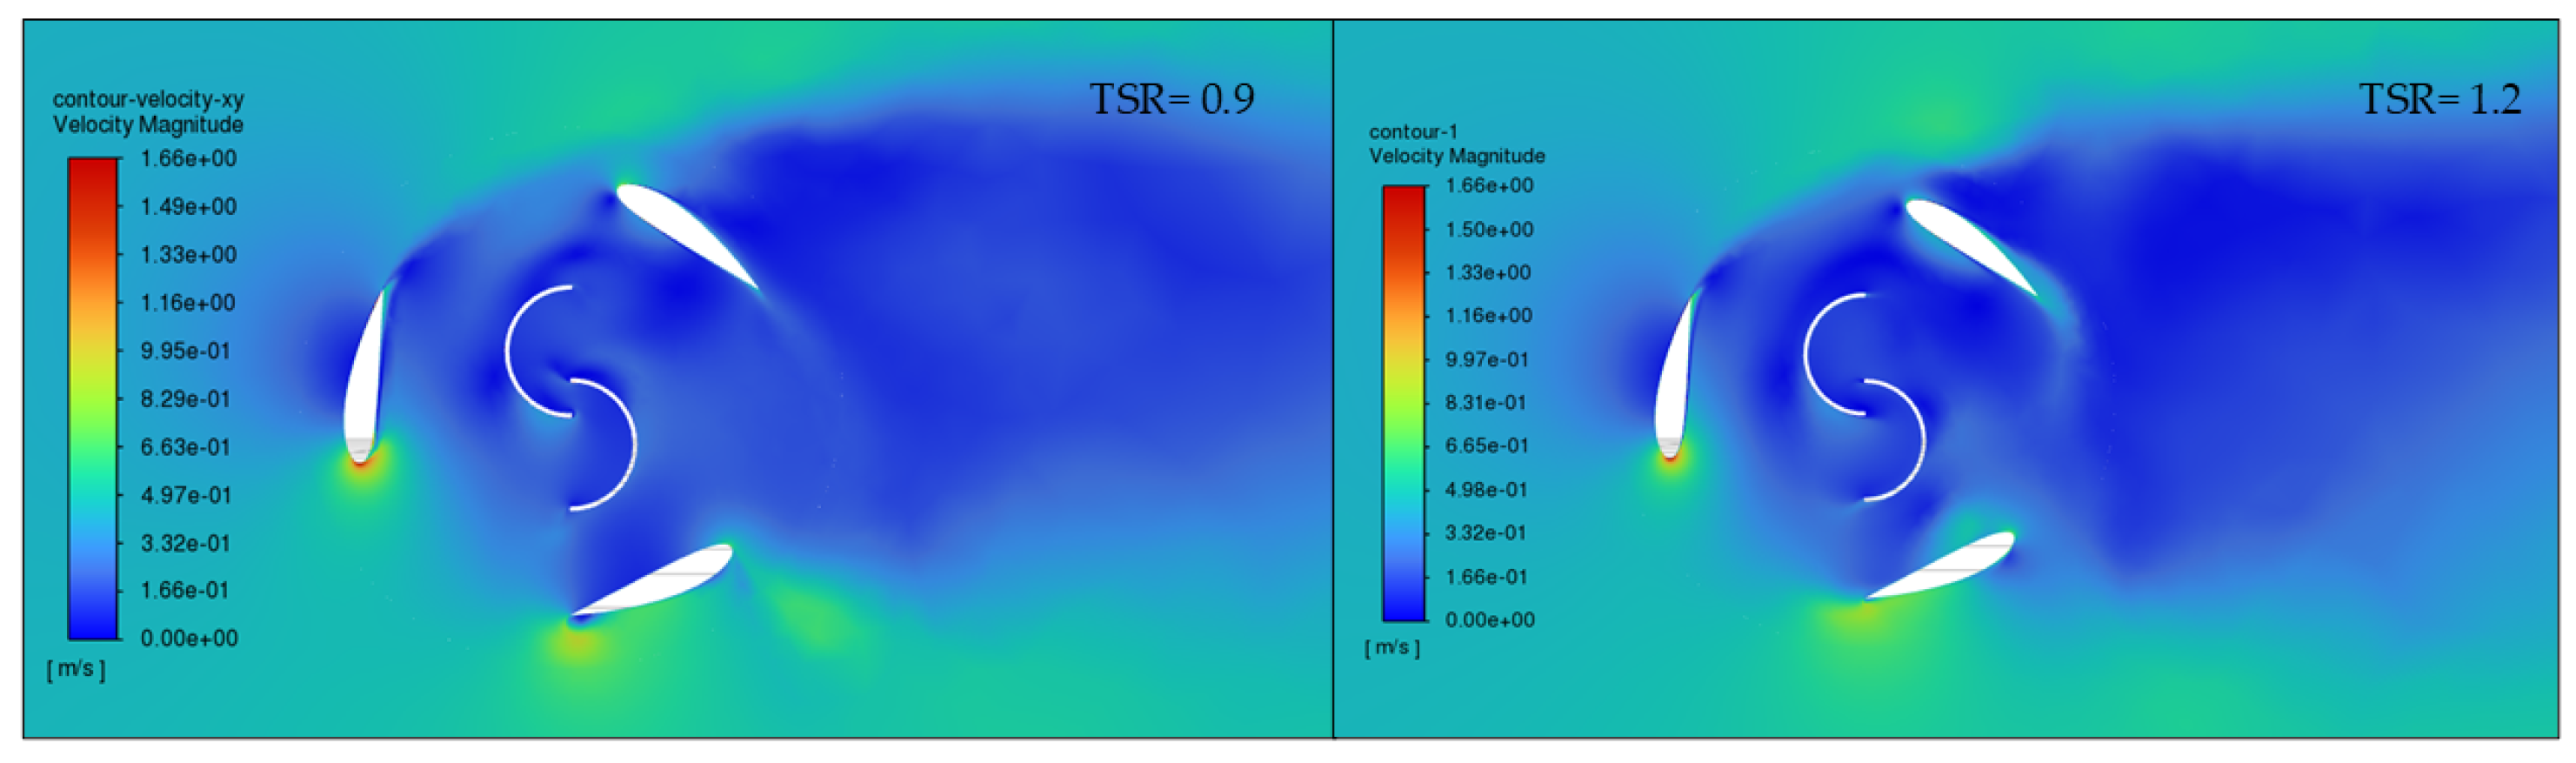
A comparative analysis of velocity contours clearly identifies the evolution of the flow field around the Darrieus–Savonius hybrid rotor as the TSR increases, this comparison is shown in
Figure 20, revealing changes in wake structure, vortex intensity, and energy extraction efficiency.
For
Figure 20a, with TSR = 0.8, U = 0.501 m/s, a wide, diffuse, and highly energetic wake is observed, with extensive low-velocity zones downstream. This condition (a) indicates significant momentum extraction from the flow, as well as a strong presence of separation and dynamic losses at the Darrieus blades. The interaction between the Savonius rotor and the flow generates intense recirculation within the rotor, which contributes to startup but also increases dissipation. The wake is poorly organized, with large, unstructured vortices, a typical feature of low-TSR regimes dominated by drag effects.
In
Figure 20b, with TSR = 1.0, U = 0.465 m s
−1, the flow begins to show greater organization in the wake, with more defined vortex structures and a slight reduction in the width of the low-speed region. Improved coupling between the Darrieus blades and the incident flow is observed, which favors lift generation. Although significant recirculation zones still exist, the interaction between both rotors becomes more efficient, partially reducing the losses observed in the previous case.
For
Figure 20c, with TSR = 1.2, U = 0.462 m s
−1, the flow field exhibits a narrower and more coherent wake, with more defined vortices and faster velocity recovery downstream. This condition (c) suggests better conversion of kinetic energy into mechanical energy, consistent with an increase in the power coefficient. However, localized low-speed zones are still identified near the rotor, associated with dynamic stall events in the Darrieus. The Savonius turbine’s contribution remains significant, especially in stabilizing the rotor’s internal flow.
Finally, in
Figure 20d, with TSR = 1.4 and U = 0.312 m s
−1, although the TSR is higher, the lower inlet velocity reduces the available energy in the flow. A less energetic but longer wake is observed, with lower vorticity intensity compared to the previous cases. The fluid–structure interaction is smoother, with less separation, but also with a lower energy extraction capacity. The flow around the rotor is cleaner, indicating more stable operation, though possibly less efficient in absolute power generation.
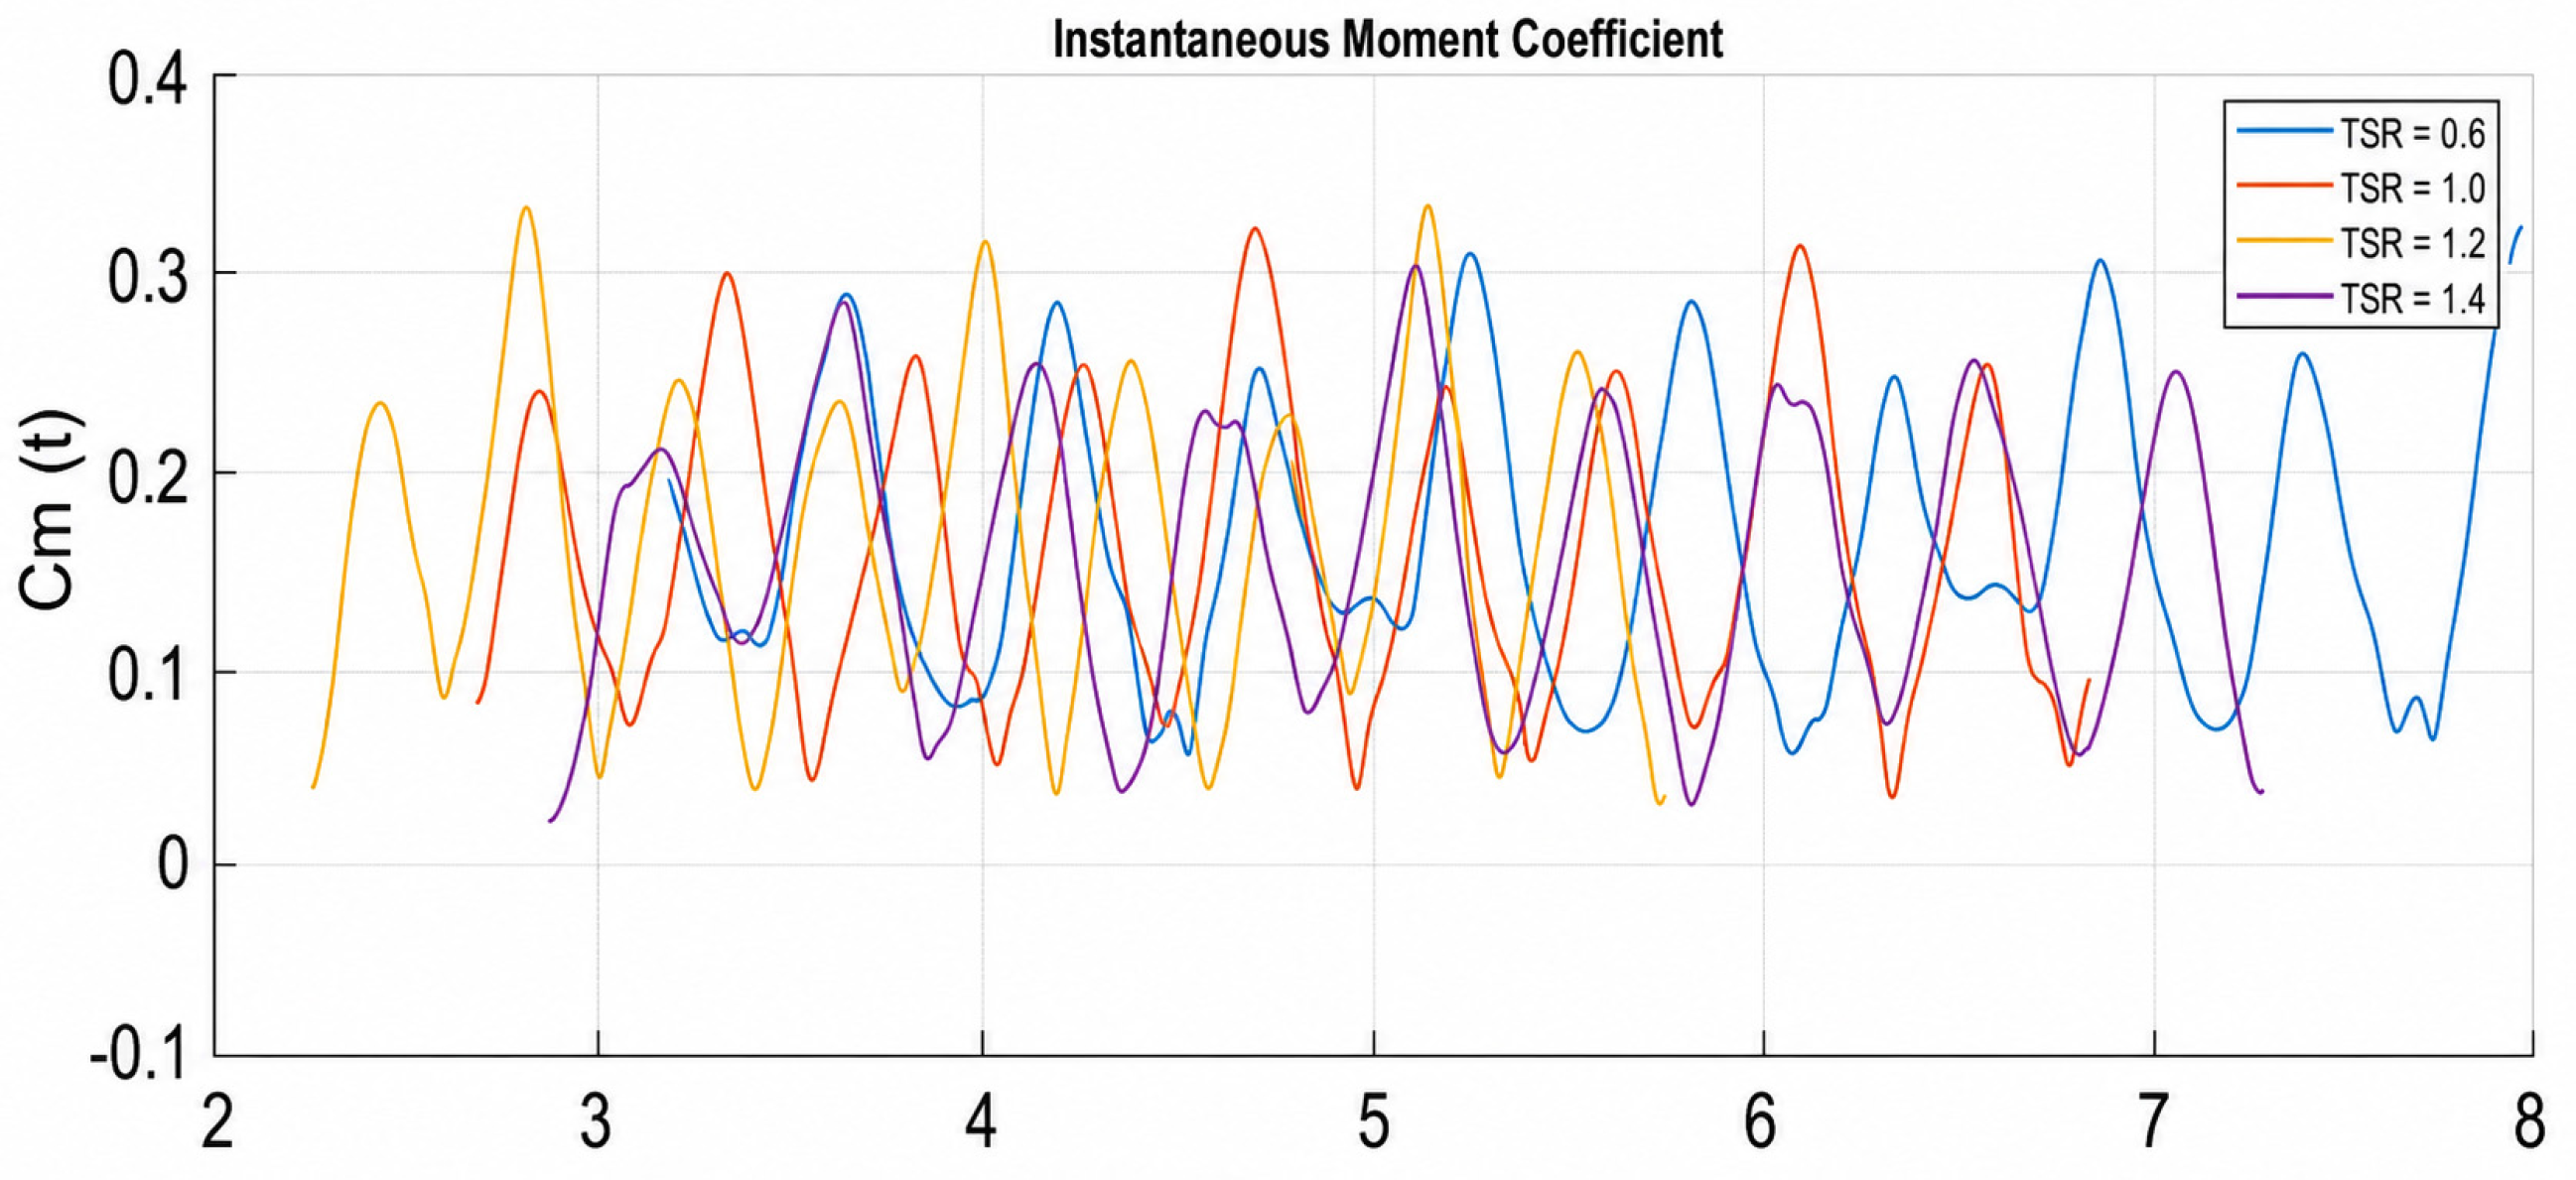
The time-history of the instantaneous moment coefficient (
) demonstrates the strong dependency of rotational frequency, peak torque amplitude, and cyclic fluctuations on the Tip Speed Ratio (
).
Figure 21 shows the moment coefficient curve behavior for different TSRs.
Figure 21.
Moment coefficient curves for different TSRs.
Figure 21.
Moment coefficient curves for different TSRs.
To quantitatively bridge the flow field features to turbine torque (
) and power (
) output, the area-integrated mean pressure difference coefficient (
) and flow separation intensity index (
) were evaluated across the operational range (
).
Table 10 shows the calculated values.
Table 10.
Separation intensity and mean pressure difference for each TSR.
Table 10.
Separation intensity and mean pressure difference for each TSR.
| TSR | Mean Cm | Power Coeff. (Cp) | Mean ΔCp | Separation Intensity (γsep) |
|---|
| 0.8 | 0.1536 | 0.1229 | 0.6144 | 0.5676 |
| 1 | 0.149 | 0.149 | 0.5961 | 0.5978 |
| 1.2 | 0.1595 | 0.1914 | 0.6379 | 0.5885 |
| 1.4 | 0.142 | 0.1988 | 0.568 | 0.5912 |
The separation intensity index indicates that all investigated TSR conditions involve a significant degree of reversed wall shear, since for every case. The index increases from 0.5676 at TSR = 0.8 to a maximum of 0.5978 at TSR = 1.0, indicating that the strongest integrated flow separation occurs near the nominal operating condition. It then decreases slightly to 0.5885 at TSR = 1.2 before increasing marginally to 0.5912 at TSR = 1.4. Thus, the separation intensity varies within a relatively narrow range of approximately 0.568–0.598, suggesting that the separated flow behavior remains significant throughout the investigated operating range rather than being confined to a single TSR.
3.7. Pressure Contours in the Hybrid Rotor
A comparative analysis of pressure contours allows us to understand how the distribution of hydrodynamic loads on the Darrieus–Savonius hybrid rotor varies with TSR and flow velocity, as shown in
Figure 22, revealing changes in pressure gradients, torque generation, and associated losses.
For
Figure 22a, with TSR = 0.8, U = 0.501 m s
−1, a highly asymmetric pressure distribution is observed, with marked high-pressure zones on the upwind face of the blades and extensive low-pressure regions on the downwind side. This pronounced difference indicates a strong contribution from drag (Savonius) and stall events in the Darrieus rotor. Furthermore, the wake exhibits slow pressure recovery, suggesting significant energy losses and intense interaction between the generated vortex structures.
In
Figure 22b, with TSR = 1.0, U = 0.465 m s
−1, the pressure gradients become more balanced and better distributed around the blades, especially on the Darrieus rotor. A reduction in the extremely low-pressure zones is evident, indicating a decrease in flow separation. The wake shows a smoother pressure transition, reflecting improved energy conversion and more efficient interaction between the flow and the rotor.
For
Figure 22c, with TSR = 1.2, U = 0.462 m s
−1, a more uniform and organized pressure distribution is identified, with well-defined but less abrupt pressure differences than at lower TSRs. This condition (c) favors lift generation on the Darrieus rotor and a more effective contribution to torque. The low-pressure zones are more localized and consistent, indicating less separation and a more stable wake. This behavior is consistent with an increase in the power coefficient and more efficient operation of the hybrid system.
Finally, in
Figure 22d, with TSR = 1.4, U = 0.312 m s
−1, the magnitude of the pressure variations decreases significantly due to the lower incident flow energy. A more homogeneous distribution is observed, but with weaker gradients, suggesting a lower torque-generating capacity. Although the flow exhibits less separation and a smoother wake, the reduced pressure differentials limit the rotor’s energy performance.
Overall, the results show that increasing the TSR from 0.8 to 1.2 optimizes the pressure distribution, reducing separation losses and improving torque generation, while higher values, such as TSR = 1.4, also improve torque generation. However, they stabilize the flow, reduce the available pressure gradients, and, therefore, the overall efficiency of the system.
4. Comparison of Numerical with Experimental Results
The experimental campaign was conducted in the Hydraulic Laboratory at the Universidad del Valle (Cali, Colombia), utilizing an acrylic-walled hydraulic channel with a test section measuring 0.49 m wide, 0.6 m deep, and 12 m long. Although the localized turbulent fluctuations were not explicitly mapped during the experimental campaign, the baseline turbulence intensity (
) within the channel’s test section was estimated to be within a low-to-moderate range of 3% to 5%. This approximation is based on well-established literature values for similar conditioned, acrylic-walled laboratory flumes operating under subcritical, steady-flow conditions without upstream grid-induced turbulence [
31]. As illustrated in
Figure 23, the hybrid Darrieus–Savonius rotor shaft was vertically aligned and constrained within the channel by a rigid structural framework utilizing low-friction upper and lower roller bearings to minimize parasitic mechanical losses.
To ensure high-fidelity hydrodynamic data collection, the instrumentation suite was calibrated and monitored for measurement uncertainties as follows:
- ▪
Flow Velocity (): The three-dimensional (X, Y, Z) upstream approach velocity was mapped using a high-precision 10.0 MHz SonTek/YSI FlowTracker2 Handheld Acoustic Doppler Velocimeter (ADV, Model ADV-SY 49772). Measurements were recorded at a sampling frequency of 50 Hz over a 60 s acquisition window to ensure statistically steady-state averages. The instrument features a velocity resolution of 0.0001 m/s and an intrinsic accuracy of of the measured velocity.
- ▪
Angular Velocity (): The rotational speed of the turbine rotor was recorded continuously using an Extech® non-contact digital optical tachometer (distributed by Omega Engineering, Norwalk, CT, USA) pointed at a reflective target tape fixed to the upper shaft. This instrument provided a measurement resolution of 0.1 RPM with an intrinsic manufacturer-specified accuracy of , ensuring highly stable and precise tracking of the rotor’s kinematics.
Mechanical torque generated by the rotor was quantified via a custom-engineered Prony brake system coupled directly to the upper shaft. The braking force mechanism featured a custom torque arm with an operational length of 165 mm, additively manufactured from Polyethylene Terephthalate Glycol (PETG) to ensure high structural rigidity and minimal deflection under load. One end of the PETG arm was rigidly clamped to the rotating turbine shaft, while the opposing free end made direct point-contact with a calibrated precision load cell. This configuration effectively isolated the tangential force at a precise radius of 0.165 m, converting the rotational dynamic torque into a static force measurement with a localized load cell uncertainty of
4.1. Sources of Errors in the Measurements
Primary hydrodynamic sources of error in the experimental setup arise from spatial velocity variations and baseline turbulent fluctuations within the flume. While steady-state averages were acquired using an Acoustic Doppler Velocimeter (ADV) at a 50 Hz sampling rate over a 60 s window, unmapped turbulent fluctuations contributed an estimated baseline turbulence intensity of 3% to 5%. This background turbulence, alongside variations in flow velocity across different water free surface heights ranging from 0.18 m to 0.54 m, introduces natural variability into the measured transverse and longitudinal velocity components ( and ).
Regarding kinematic and mechanical torque measurements, main error sources stem from residual mechanical friction, load cell accuracy, and structural compliance under dynamic loads. Parasitic mechanical friction persists along the vertical shaft, although low-friction upper and lower roller bearings were implemented to constrain the assembly. Additionally, dynamic torque measurements gathered through the custom Prony brake system are subject to localized load cell intrinsic uncertainty and potential minor mechanical deflection of the 165 mm PETG torque arm during direct point contact load transfer under operational forces. Finally, minor operational uncertainties exist in tracking rotor angular velocity via the non-contact optical tachometer due to target alignment with the reflective tape and the intrinsic instrument resolution limit of 0.1 RPM.
Table 11 shows the measured variables and the calculations realized. Analyzing the experimental data presented in this table reveals distinct trends among the operational parameters of the hybrid Darrieus–Savonius hydrokinetic turbine. The TSR in the experiments varied from a maximum of approximately 1.3 to a minimum of 1, generally showing a decreasing progression across the recorded points. Correspondingly, the mechanical power generated ranged from a high of 0.3864 W to a low of 0.1861 W. While not perfectly monotonic, the mechanical power generally tended to decrease as the TSR decreased, with the highest power output observed at one of the higher TSR values (1.2620).
A particularly significant trend emerges when examining the Power Coefficient and Moment Coefficient . The has a minimum of 0.1162 and a maximum value of 0.1722, and the has a minimum of 0.1 and a maximum of 0.17. Crucially, both and the exhibited an inverse relationship with TSR within the tested range. As the TSR progressively decreased from its higher values towards the lowest recorded, both and consistently increased, reaching their peak values (0.1722 and 0.17, respectively) at the lowest TSR of 1.0129. This indicates that, for the specific conditions and configuration tested in the experiment, the turbine achieved its highest efficiency in terms of power and torque extraction at relatively lower TSRs, closer to a TSR of 1.0.
4.2. Experimental Uncertainty Analysis
An uncertainty analysis was performed to quantify the combined uncertainty associated with the principal experimental performance indicators, namely the torque coefficient
and power coefficient
. The analysis follows the propagation-of-uncertainty method proposed by Kline and McClintock and previously applied to hydrokinetic turbines by Nasef et al. [
21] . The torque measured by the Prony brake was calculated as T = Fr, where F is the load cell force, and r is the torque arm length. Thus, the relative uncertainty in torque was estimated from the following:
When the uncertainty associated with the torque arm length is negligible compared with the load cell uncertainty,
can be approximated by
. The relative uncertainty of the torque coefficient was then calculated as follows:
where
is the mean upstream water velocity. Similarly, because the power coefficient is calculated from
, its relative uncertainty was estimated as follows:
The uncertainties associated with water velocity, angular velocity, and torque were obtained from the specifications and calibration of the ADV, optical tachometer, and load cell system, respectively. The uncertainty in flow velocity was particularly influential because appears to the second power in and to the third power in . Therefore, a relative velocity uncertainty of 1%, for example, contributes approximately 2% to the uncertainty of and 3% to the uncertainty of , before combining it with the torque and angular velocity uncertainties. The resulting uncertainty ranges were included as error bars in the experimental and results and were considered when comparing the experimental measurements with the numerical predictions.
The mechanical losses associated with the bearings, shaft, and support structure were not independently quantified during the present experimental campaign because a blank test without the turbine rotor was not performed. Accordingly, the torque obtained from the Prony-brake force measurement represents the brake torque transmitted through the rotating assembly and may differ from the total hydrodynamic torque generated by the rotor.
At steady rotational speed, the torque balance can be expressed as
where
is the hydrodynamic torque generated by the rotor,
is the torque inferred from the Prony-brake load cell force, and
represents bearing, shaft, and other parasitic mechanical losses. Since
was not independently measured, the reported
and
values may be slightly conservative if the measured brake torque excludes part of the torque dissipated in the mechanical support system.
4.3. Comparison of Experimental and Numerical Results for the Power Coefficient and Torque Coefficient
The hydrodynamic performance validation of the 3D hybrid hydrokinetic turbine reveals a distinct divergence between the predictive capabilities of 2D and 3D numerical models when benchmarked against experimental data. As illustrated in the power coefficient curves, the 2D CFD model consistently overpredicts turbine performance across the entire operational range and fails to capture the performance plateau observed physically. Notably, at TSR = 1, the 2D simulation yields a of 0.3118, artificially inflating the power output by approximately double compared to the experimental value of 0.1541.
Simulating the full 27-combination parametric space ( DoE) using high-fidelity transient 3D CFD was computationally unfeasible. Consequently, 2D CFD was utilized as a computationally efficient screening tool. We explicitly acknowledge the following limitations:
- ▪
Qualitative vs. Quantitative Scope: 2D CFD effectively captures relative performance trends and statistical sensitivities (ANOVA), successfully identifying the radius ratio (RR) as the primary driver.
- ▪
Overestimation: Because 2D planar models omit 3D flow physics—such as blade tip vortex shedding, spanwise flow relaxation, and volumetric wake interactions—they artificially overpredict peak performance ().
The pronounced overpredictions and geometric insensitivity of the 2D approach stem from fundamental fluid dynamics omissions inherent to planar modeling of cross-flow turbines. By assuming an infinite blade span, 2D simulations completely ignore critical three-dimensional flow structures such as spanwise stress relaxation, volumetric rotor-to-rotor wake interactions between the Savonius and Darrieus elements, and blade tip vortices. In the physical turbine, these tip vortices induce severe localized drag and a substantial reduction in lift (tip losses) that naturally curtails both torque and power extraction.
To elucidate the three-dimensional volumetric loss mechanisms and end effects associated with the turbine’s finite aspect ratio, iso-surfaces of the Q-criterion (
) colored by vorticity magnitude are presented for
and
. The visualization reveals prominent tip-vortex structures shedding continuously from the top and bottom free extremities of both the outer Darrieus straight blades and the inner Savonius buckets, as can be seen in
Figure 24.
At , operating under higher effective angles of attack, the rotor experiences extensive dynamic stall. This generates large, elongated vortex structures across the entire span that merge with massive end-vortex loops, dissipating substantial kinetic energy into the turbulent wake. Conversely, at , the attached flow along the mid-span remains tighter; however, the higher rotational frequency intensifies the concentrated tip vortices shedding from the inner Savonius rotor.
These high-vorticity inner structures spill radially outward into the path of the outer Darrieus blades, causing complex vortex–blade interactions. This 3D spanwise flow redistribution and kinetic energy dissipation via end-vortices directly explain why 2D CFD models overestimate both the power and moment coefficients.
The hydrodynamic interaction between the central Savonius rotor and the outer Darrieus blades is governed by two-way vortex shedding, flow blockage, and radial wake transport across the inner cavity. Fluid passing through the turbine sweep area undergoes a multi-stage energy extraction process: the upstream Darrieus blades generate a primary velocity deficit and trailing vortex sheets, which alter the effective inflow conditions for the central Savonius rotor. Subsequently, high-vorticity shear layers and 3D end-vortices shed from the Savonius buckets propagate downstream into the inner path of the trailing Darrieus blades.
The 2D velocity magnitude contours (
and
) illustrate in
Figure 25, a complex wake interaction mechanism across the hybrid turbine cross-section: flow acceleration around the upstream Darrieus blade, and wake shadowing across the central Savonius rotor.
As the flow passes the upstream Darrieus blade, it accelerates over the blade surface but produces a low-velocity wake that enters the central Savonius rotor. The Savonius rotor further reduces the local momentum and generates a persistent low-speed core, which subsequently impinges on the downstream Darrieus blades and limits their torque contribution. At TSR = 0.9, the lower rotational speed produces a broader and more diffuse wake with greater downstream velocity deficit, indicating stronger planar blockage and flow separation. At TSR = 1.2, the wake is more concentrated near the rotor axis, while the higher relative motion creates stronger shear layers through the gaps between the two rotor components.
The three-dimensional pressure-coefficient distributions at TSR = 0.9 and 1.2 are illustrated in
Figure 26, together with the different torque-generation mechanisms of the Darrieus and Savonius components. On the advancing Darrieus blades, the windward pressure side presents a strong stagnation region, with
values of approximately
to
, while the suction side exhibits a pronounced negative-pressure region associated with lift generation. As the TSR increases from 0.9 to 1.2, the minimum pressure coefficient becomes more negative, decreasing from approximately
to
, because the higher blade speed increases the relative velocity and intensifies the pressure gradient around the hydrofoil. The Savonius rotor exhibits a drag-dominated pressure distribution: the concave surface of the advancing bucket experiences high positive pressure, approximately
to
, whereas the convex returning bucket is exposed to considerably lower pressure. This pressure difference generates the positive driving torque of the inner rotor and contributes to compensating the negative torque produced by the Darrieus component at some azimuthal positions.
Figure 27 makes a comparison of experimental and numerical results. In contrast, the 3D CFD model demonstrates close agreement with experimental power performance, yielding relative errors of
,
, and
at
and
, respectively, with an overall mean absolute error of
for
. While the 3D model accurately captures the functional trend of decreasing moment coefficient (
) with increasing
, a systematically lower magnitude is observed relative to experimental
values.
A similar trend is mirrored in the torque-generating characteristics depicted in the moment coefficient curves. The 2D CFD model generates an unphysical, nearly flat profile fluctuating between 0.15 and 0.16, which fails to represent the rotational dynamics of the hybrid rotor at higher speeds.
Quantitatively, the relative error for the moment coefficient () between the 3D CFD predictions and experimental measurements is at , at , and at , yielding a mean absolute relative error of . While the 3D CFD model accurately captures the functional trend of decreasing with increasing , a systematically lower magnitude is observed relative to experimental values. This systematic shift is primarily driven by three-dimensional tip and end-wall losses captured in the CFD domain, unmodeled experimental shaft–turbulence interactions, and parasitic mechanical friction present in the physical test rig.
In
Figure 28, the 2D numerical simulations significantly overpredict the turbine’s performance, exhibiting a continuous upward trend to a maximum Cp of 0.4209 at a TSR of 1.3, which fails to capture the typical aerodynamic losses and stall characteristics at higher rotational speeds. Conversely, the 3D numerical results closely align with the present experimental data, successfully capturing the true performance curve and predicting a peak Cp of approximately 0.152 at a TSR of 1.0. When evaluated against the literature, the present 3D and experimental curves demonstrate strong qualitative agreement with the trends reported by Kamal & R. Saini, whose numerical and experimental data similarly peak near a TSR of 0.92 with Cp values of 0.200 and 0.189, respectively. In contrast, the numerical study by G. Saini & R. Saini reports a notably lower performance curve overall, peaking at just 0.090 at a TSR of 0.80. Overall, this comparison confirms that while 2D modeling drastically overestimates energy extraction, the 3D simulations provide a highly reliable and realistic representation of the physical turbine’s experimental performance.
To contextualize the performance of the present hybrid Darrieus–Savonius turbine,
Table 12 summarizes key geometric and operating parameters alongside the best reported power coefficients for representative studies in the literature. The table includes the numerical investigations by G. Saini and R. P. Saini and Kamal and R. P. Saini, which have extensively characterized the influence of radius ratio and attachment angle on hybrid rotor performance, as well as the current work, which combines a systematic 2D/3D CFD parametric study with experimental validation in a laboratory hydraulic channel. While differences in blade profiles, aspect ratios, and Reynolds numbers preclude a direct one-to-one comparison, the table highlights the relative position of the present results within the range of performance levels reported for similar hybrid configurations.
4.4. Future Work on VAHTs of Hybrid Rotor Darrieus–Savonius
Future research should focus on addressing existing design and performance gaps in vertical-axis hybrid turbines. This includes extensive computational fluid dynamics (CFD) and experimental investigations into novel hybrid configurations, such as combining a double-stage Savonius rotor with a straight-bladed Darrieus rotor (H-rotor), or exploring arrangements where the S-rotor is positioned above or below the H-rotor to mitigate flow interference and optimize overall performance. Specifically, research investigating a hybrid configuration of a Savonius rotor with a helical-bladed Darrieus turbine using CFD holds significant promise, as the helical Darrieus is known for its superior self-starting capability and lower torque fluctuation, which could effectively mitigate self-starting problems and improve initial torque in a hybrid system. Dedicated studies are also needed to determine optimal design parameters like the radius ratio (RR), attachment angle (AA), and the ideal number of blades for both S- and H-rotors, particularly investigating the effect of twisted S-rotor blades. The development of robust correlations based on dimensional analysis would also provide invaluable tools for predicting turbine performance across various operating conditions and fluid types, aiding in the overall optimization process.
5. Conclusions
The preliminary design of the hybrid Darrieus–Savonius hydrokinetic turbine, developed from a literature review and analytical sizing equations, yielded a geometry compatible with the hydraulic channel and the operating flow conditions considered in this study. This design featured a Darrieus rotor with a diameter of 200 mm, 3 NACA 4418 blades, and a blade height of 200 mm, combined with a two-blade Savonius rotor. Key geometrical parameters investigated included radius ratios of 0.3, 0.5, and 0.7, and attachment angles of 0°, 45°, and 90°. This stage provided a consistent basis for the subsequent numerical and experimental analyses, ensuring that the rotor dimensions, blockage ratio, and blade arrangement were physically feasible within the test environment.
The combination of a full factorial design with 2D CFD simulations proved to be an effective methodology for quantifying the influence of the radius ratio, attachment angle, and inlet flow velocity on turbine performance. The results demonstrated that the radius ratio was the most influential parameter on the power coefficient, followed by the attachment angle, and that the configuration RR = 0.5 and AA = 0° produced the most favorable performance within the investigated design space.
Overall, the results demonstrate that hybrid turbine performance is governed by the coupled effects of rotor geometry, operating condition, and three-dimensional flow structures. The radius ratio primarily controls blockage, pressure losses, wake interference, and fluctuation amplitude, whereas the attachment angle modifies the phase and distribution of blade loading. Although smaller Savonius rotors generally produce more uniform torque, the intermediate configuration provides a favorable compromise between average power extraction and cyclic stability. Increasing the TSR intensifies pressure gradients and modifies separation and wake development, while the Savonius rotor contributes positive torque during unfavorable Darrieus operating phases, particularly at a low TSR.
The torque decomposition indicates that the hybrid rotor is primarily driven by the Darrieus component, particularly as the TSR increases. At TSR = 0.8, the Savonius rotor contributes , corresponding to the reported 4.9%, and plays an important complementary role by supplying positive torque during azimuthal positions where the Darrieus rotor may experience resistive loading. At TSR = 1.2, the Darrieus contribution increases to , or approximately 98% according to the reported values, while the Savonius contribution decreases to . This confirms that the Savonius rotor is most useful during low-TSR operation, where it supports rotor rotation, improves torque continuity, and assists the starting process, whereas the Darrieus rotor becomes the dominant power-producing component at higher TSRs.
The simulations revealed that the mechanical power and power coefficient exhibit a highly oscillatory behavior, characteristic of Darrieus–Savonius hybrid rotors. After an initial transient phase, a periodic quasi-steady regime with pronounced peaks and valleys is reached. Under certain conditions, especially at low TSRs, intervals with negative power values were observed, indicating times when the rotor experiences resistive torque. However, the Savonius rotor plays a crucial role in providing positive torque in these unfavorable areas, helping to maintain rotation and recover power, confirming the functional synergy of the hybrid design.
The 3D CFD simulations demonstrate close agreement with experimental power performance, particularly at the nominal operating point of TSR = 1.0, where the relative error between the 3D CFD Cp of 0.1525 and the experimental Cp of 0.1541 was a remarkably low 1%. For the broader range of TSRs from 1.0 to 1.2, the 3D CFD model yielded relative errors of 0.65%, 8.00%, and 17.09% when compared to experimental results. This validates the 3D CFD approach as a high-fidelity tool for performance prediction, especially when compared to 2D CFD, which overpredicts performance by nearly double due to its inability to account for three-dimensional tip losses.




 ,
,