1. Introduction
Rockburst [
1,
2,
3], as one of the increasingly frequent and highly destructive disasters during deep metal mining operations, has become a core challenge constraining mine safety production. Rockbursts are intense dynamic hazards triggered by excavation, often accompanied by sudden energy release and the ejection of large quantities of rock fragments, posing significant threats to the safety of construction personnel and the integrity of engineering projects. These disasters typically occur in deep-buried, high-stress metal mines and other underground engineering projects. The presence of structural planes significantly increases the risk of rockbursts, with the severity of damage escalating sharply as the intensity level of the rockburst rises. Metal mines are predominantly formed by tectonic processes. Compounded by regional geological activity, rock masses commonly develop primary and secondary structural planes such as joints and fractures. Particularly in China’s southwest region, intense tectonic discontinuities significantly heighten the risk of rockburst disasters. Drilling and blasting remains the most widely applied construction method in metal mine excavation. The dynamic disturbance generated by this process readily triggers instability and failure along pre-existing structural planes within rock masses, serving as the core driver of rockburst hazards [
4,
5]. A strong coupling effect emerges between the significantly elevated in situ stress environment, the dynamic disturbance from drilling and blasting, and the inherent structural characteristics of the rock mass. Propagating stress waves from blasting expand the plastic deformation zone near structural planes, doubling the principal stress in rockburst areas compared to non-affected zones. Concurrently, the presence of structural planes reduces rock mass energy storage capacity to 68% of intact rock. This multi-factor interplay inevitably complicates rockburst initiation mechanisms, resulting in energy release exhibiting pronounced nonlinearity and suddenness [
6,
7,
8].
In recent years, research on rockbursts has become increasingly in-depth, leading to a clearer understanding of the factors influencing their occurrence. First, rockbursts predominantly occur in rock masses with moderate structural plane density, indicating a close correlation between rockburst occurrence and structural planes [
9]. The number of structural planes significantly influences the fracturing and ejection characteristics of tunnel rock masses. After excavation and unloading, rock panels containing multiple structural planes develop eccentric compression effects due to uneven shear stress distribution, triggering tensile plate fracture-type rockbursts that form “frying pan-shaped” or C-shaped blast craters. The Jinping II Hydropower Station rockburst case study further confirms that structural plane-type rockbursts can be categorized into slip-type, shear fracture-type, and tensile plate fracture-type. Among these, closed structural planes of Grade III or IV exert the most pronounced control over rockbursts [
10]. Second, rockbursts are associated with external disturbances. Dynamic disturbances generated during drill-and-blast construction can increase the probability of deep-seated rockbursts by up to 500% [
11,
12]. Blast stress waves undergo multiple reflections between structural planes, doubling the principal stress in rockburst zones compared to non-affected areas and significantly expanding the plastic failure zone. Furthermore, tunnel rock masses subjected to high stress environments frequently experience induced rockburst disasters triggered by dynamic disturbances from engineering blasting, mechanical drilling operations, roof collapses, adjacent tunnel rockbursts, and fault slip events. Minor dynamic disturbances can cause highly stressed rock masses to release energy far exceeding their stored potential. This energy amplification effect constitutes the key mechanism for external disturbance-induced rockbursts [
13,
14,
15].
At present, numerous researchers have conducted extensive exploratory studies on the occurrence mechanisms and impact patterns of rockburst disasters, relying on indoor rockburst testing methods. Regarding structural planes, Wang et al. [
16] performed true triaxial tests on sandstone specimens with circular holes to investigate the influence of discontinuities in rock masses on rockburst behavior. They combined acoustic emission techniques to analyze microcrack propagation during rock failure. Results indicate that structural planes induce asymmetric rockburst patterns on the hole sidewall, with large plate-like and fine-grained fragments constituting 68.1% and 13% of the volume in discontinuous specimens, respectively. Acoustic emission data reveal that specimens with structural planes exhibit earlier crack initiation, higher acoustic emission activity, and earlier rockburst occurrence. Failure exhibited a tensile–shear hybrid mode. Structural planes also delayed rockburst precursor responses, exhibiting lower precursor response coefficients (PRC). Feng et al. [
17] investigated the effects of structural plane parameters (dip angles 0°, 30°, 45°, 60°, 90°; penetration rates of 30%, 50%, and 80%) on the failure characteristics of joint-bearing red sandstone under true triaxial stress paths. Results indicate that when the joint dip angle is 45–60° with 80% penetration and under unloading stress paths, red sandstone tends to exhibit “joint-dominated shear failure”; when the structural plane dip angle is 0°/90° (σ
1 parallel to the structural plane) or the penetration rate ≤50%, the red sandstone primarily exhibits “tensile fracture of the rock mass”. DIC monitoring revealed a 30–40% reduction in strain concentration zones, confirming that the synergistic interaction between joint parameters (dip angle, continuity) and true triaxial stress paths significantly regulates red sandstone failure modes, failure thresholds, and energy evolution. Li et al. [
18] employed triaxial tests combined with acoustic emission (AE) systems and high-speed camera technology to investigate the effects of single-set joint strike (parallel/perpendicular to tunnel axis) and dip angle (0°, 30°, 45°, 60°, 90°) on rockburst failure processes in red sandstone containing circular tunnels. Results indicate that when joints were parallel to the tunnel axis with dip angles of 45–90°, the rock mass tended to exhibit “shear fracture-type rockburst”; when joints are parallel to the tunnel axis with dip angles of 0–30°, or when joints intersect the tunnel axis, “plate-fracture-shear composite failure” predominates. This confirms that the synergistic interaction between joint strike and dip angle significantly regulates rockburst failure modes and intensity. Su et al. [
19] investigated rockburst characteristics, acoustic emission (AE), and energy release properties in deep-tunnel settings using 200 mm × 200 mm × 30 mm granite specimens containing 50 mm diameter circular holes. They conducted biaxial compression tests to examine the effects of different structural plane conditions (presence/absence, exposure/non-exposure, dip angle) on rockburst characteristics, acoustic emission (AE), and energy release properties. The study particularly analyzed the influence of single structural planes with small-scale hard fillings on the rockburst process. Results indicate that structural planes significantly influence rockburst timing, severity, and energy release (by altering stress distribution and fracture pathways). Exposure state also plays a significant role—unexposed planes accumulate more energy due to confining pressure constraints, making them more prone to triggering rockbursts with greater energy release. Additionally, energy release from unexposed planes increases initially then decreases with increasing plane inclination, whereas exposed plane inclination has no significant effect on energy release.
Regarding dynamic disturbance combined with structural planes, Li et al. [
20] employed triaxial tests integrated with acoustic emission (AE) systems, micro-camera technology, and FLAC
3D numerical simulations to investigate the effects of exposed versus unexposed flat structural planes on rockburst failure processes and intensity levels in limestone arched tunnels with vertical walls. Results indicate that when the flat structural plane remained unexposed, the tunnel specimen exhibited “typical rockburst failure”, forming a deeper “V”-shaped failure zone with higher cumulative AE ring counts and absolute energy”. The rockburst intensity of the tunnel sidewall increased from Grade 1 to Grade 2. When the straight structural plane was exposed, the specimen primarily exhibited “rock mass plate-like fracture failure”, with lower AE parameters and a higher proportion of shear failure. This confirms that the exposure status of straight structural planes significantly regulates the rockburst failure mode, energy release, and intensity level in roadways. Wu et al. [
21] conducted true triaxial tests with dynamic-static coupled loading considering structural surfaces and periodic weak disturbances to investigate rockburst processes under dynamic disturbance. Under varying weak dynamic cyclic disturbance frequencies and amplitudes (2 Hz, 40 kN; 6 Hz, 30 kN; 10 Hz, 15 kN), comparative analyses were conducted on the failure processes, strength characteristics, acoustic emission features, fragment fractal properties, and damage morphologies of specimens with and without structural surfaces. Results indicate that both structural planes and perturbations weaken rock strength to varying degrees. Specimens with structural planes exhibit damage primarily on the side without the plane. Perturbation conditions affect structural planes differently: increased perturbation amplitude promotes failure within the rock mass, while increased perturbation frequency accelerates the propagation and coalescence of pre-existing micro-fractures. Wang et al. [
22] utilized PFC 5.0 software to simulate rockburst triggered by blasting stress waves, analyzing the influence of structural planes on rockburst mechanisms. The analysis centered on varying dip angles and locations, revealing changes in rock mass fracture formation, stress distribution, and kinetic energy under dynamic disturbance. Results indicate that the most severe rockburst damage occurs at dip angles of 30° and 150°, while damage decreases when the dip angle approaches 90°. Furthermore, rockburst damage intensifies when structural planes and blast points are located on opposite sides of the tunnel. This phenomenon is attributed to the weak interlayers of the structural plane absorbing a significant portion of the blast wave energy when the structural plane and blast point are aligned on the same side. Su et al. [
23] conducted true triaxial tests on drilled granite containing small, isolated structural planes under weak dynamic perturbations. Pre-drilled holes aligned with minor planes monitored rockburst damage and energy evolution via acoustic emission and high-speed video. Results indicate that weak disturbance reduces the local energy release rate (LERR) of unexposed structural planes while increasing the LERR of exposed planes. Under cyclic disturbance, fragment kinetic energy follows a “first increase, then decrease” pattern with frequency, with 0.6 Hz as the critical threshold.
Based on the aforementioned research findings, it is evident that studies on rockburst mechanisms have established a relatively comprehensive knowledge framework. However, there remains a significant gap in specialized research focused on actual deep mining conditions that integrates the coupled effects of rock mass properties (including structural planes), complex stress environments, and external disturbances into a unified analytical framework to deeply elucidate the triggering mechanisms of rockbursts. Furthermore, there are few reports on the relationship between the spatial orientation of vertical structural planes and voids and the characteristics of rockburst damage.
This research gap constrains the deep understanding of rockburst hazard induction mechanisms and severely impedes the effective prevention and control of rockbursts in deep mining. Driven by the engineering demands of deep mining in metal mines, this study investigates the rockburst characteristics of deep vertical-wall arched tunnels through triaxial rockburst tests. It focuses on the combined relationship among “fractured rock mass, dynamic disturbance, and in situ stress field”. During testing, the evolution patterns of acoustic emissions and the similarities and differences in failure characteristics between the surrounding rock of tunnels without structural planes and those with vertical structural planes were compared. This revealed the triggering mechanism of rockburst in deep vertical-walled arched tunnels under dynamic disturbance, providing an experimental foundation for the prevention and control of rockburst disasters and safe production in deep underground metal mines.
3. Test Results
3.1. Rockburst Propensity
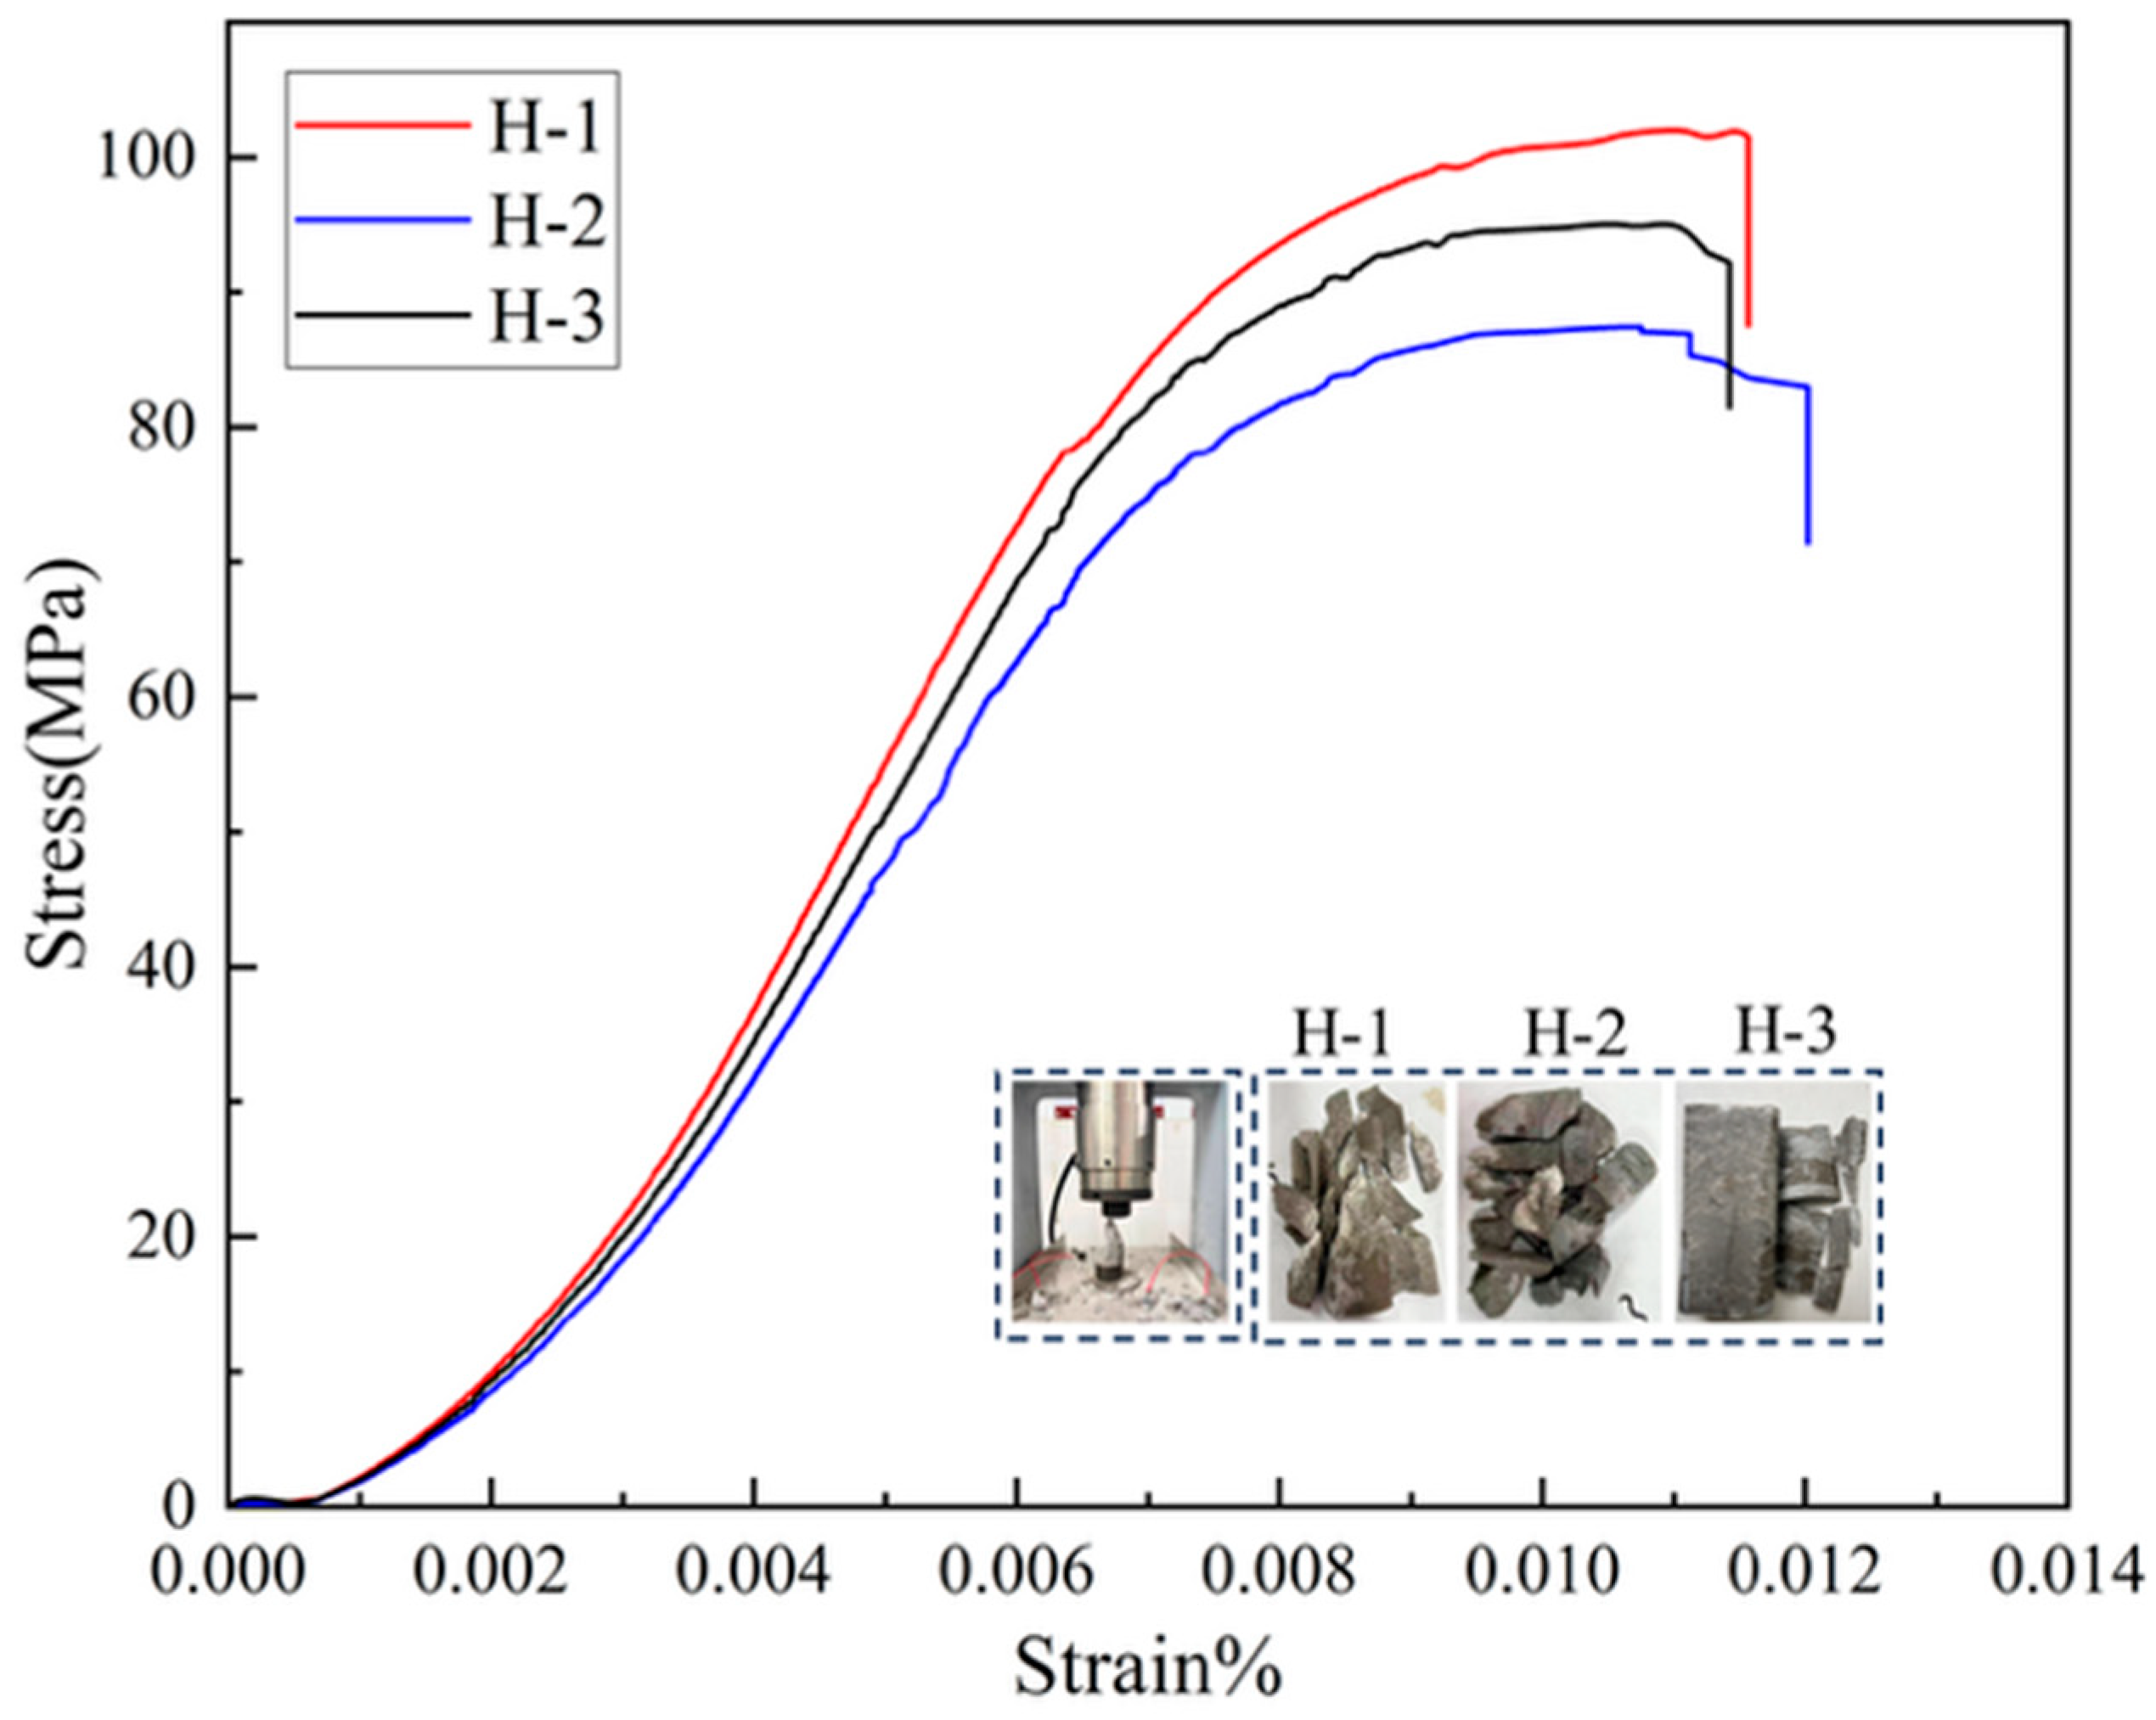
The stress–strain curves and ultimate failure modes of limestone were obtained through uniaxial compression testing.
Figure 4 displays the axial stress–axial strain curves obtained from uniaxial compression, along with the ultimate failure modes of the three test specimens. All three axial stress–axial strain curves exhibited similar characteristics, which can be divided into the compaction stage, elastic stage, plastic stage, and post-peak stage.
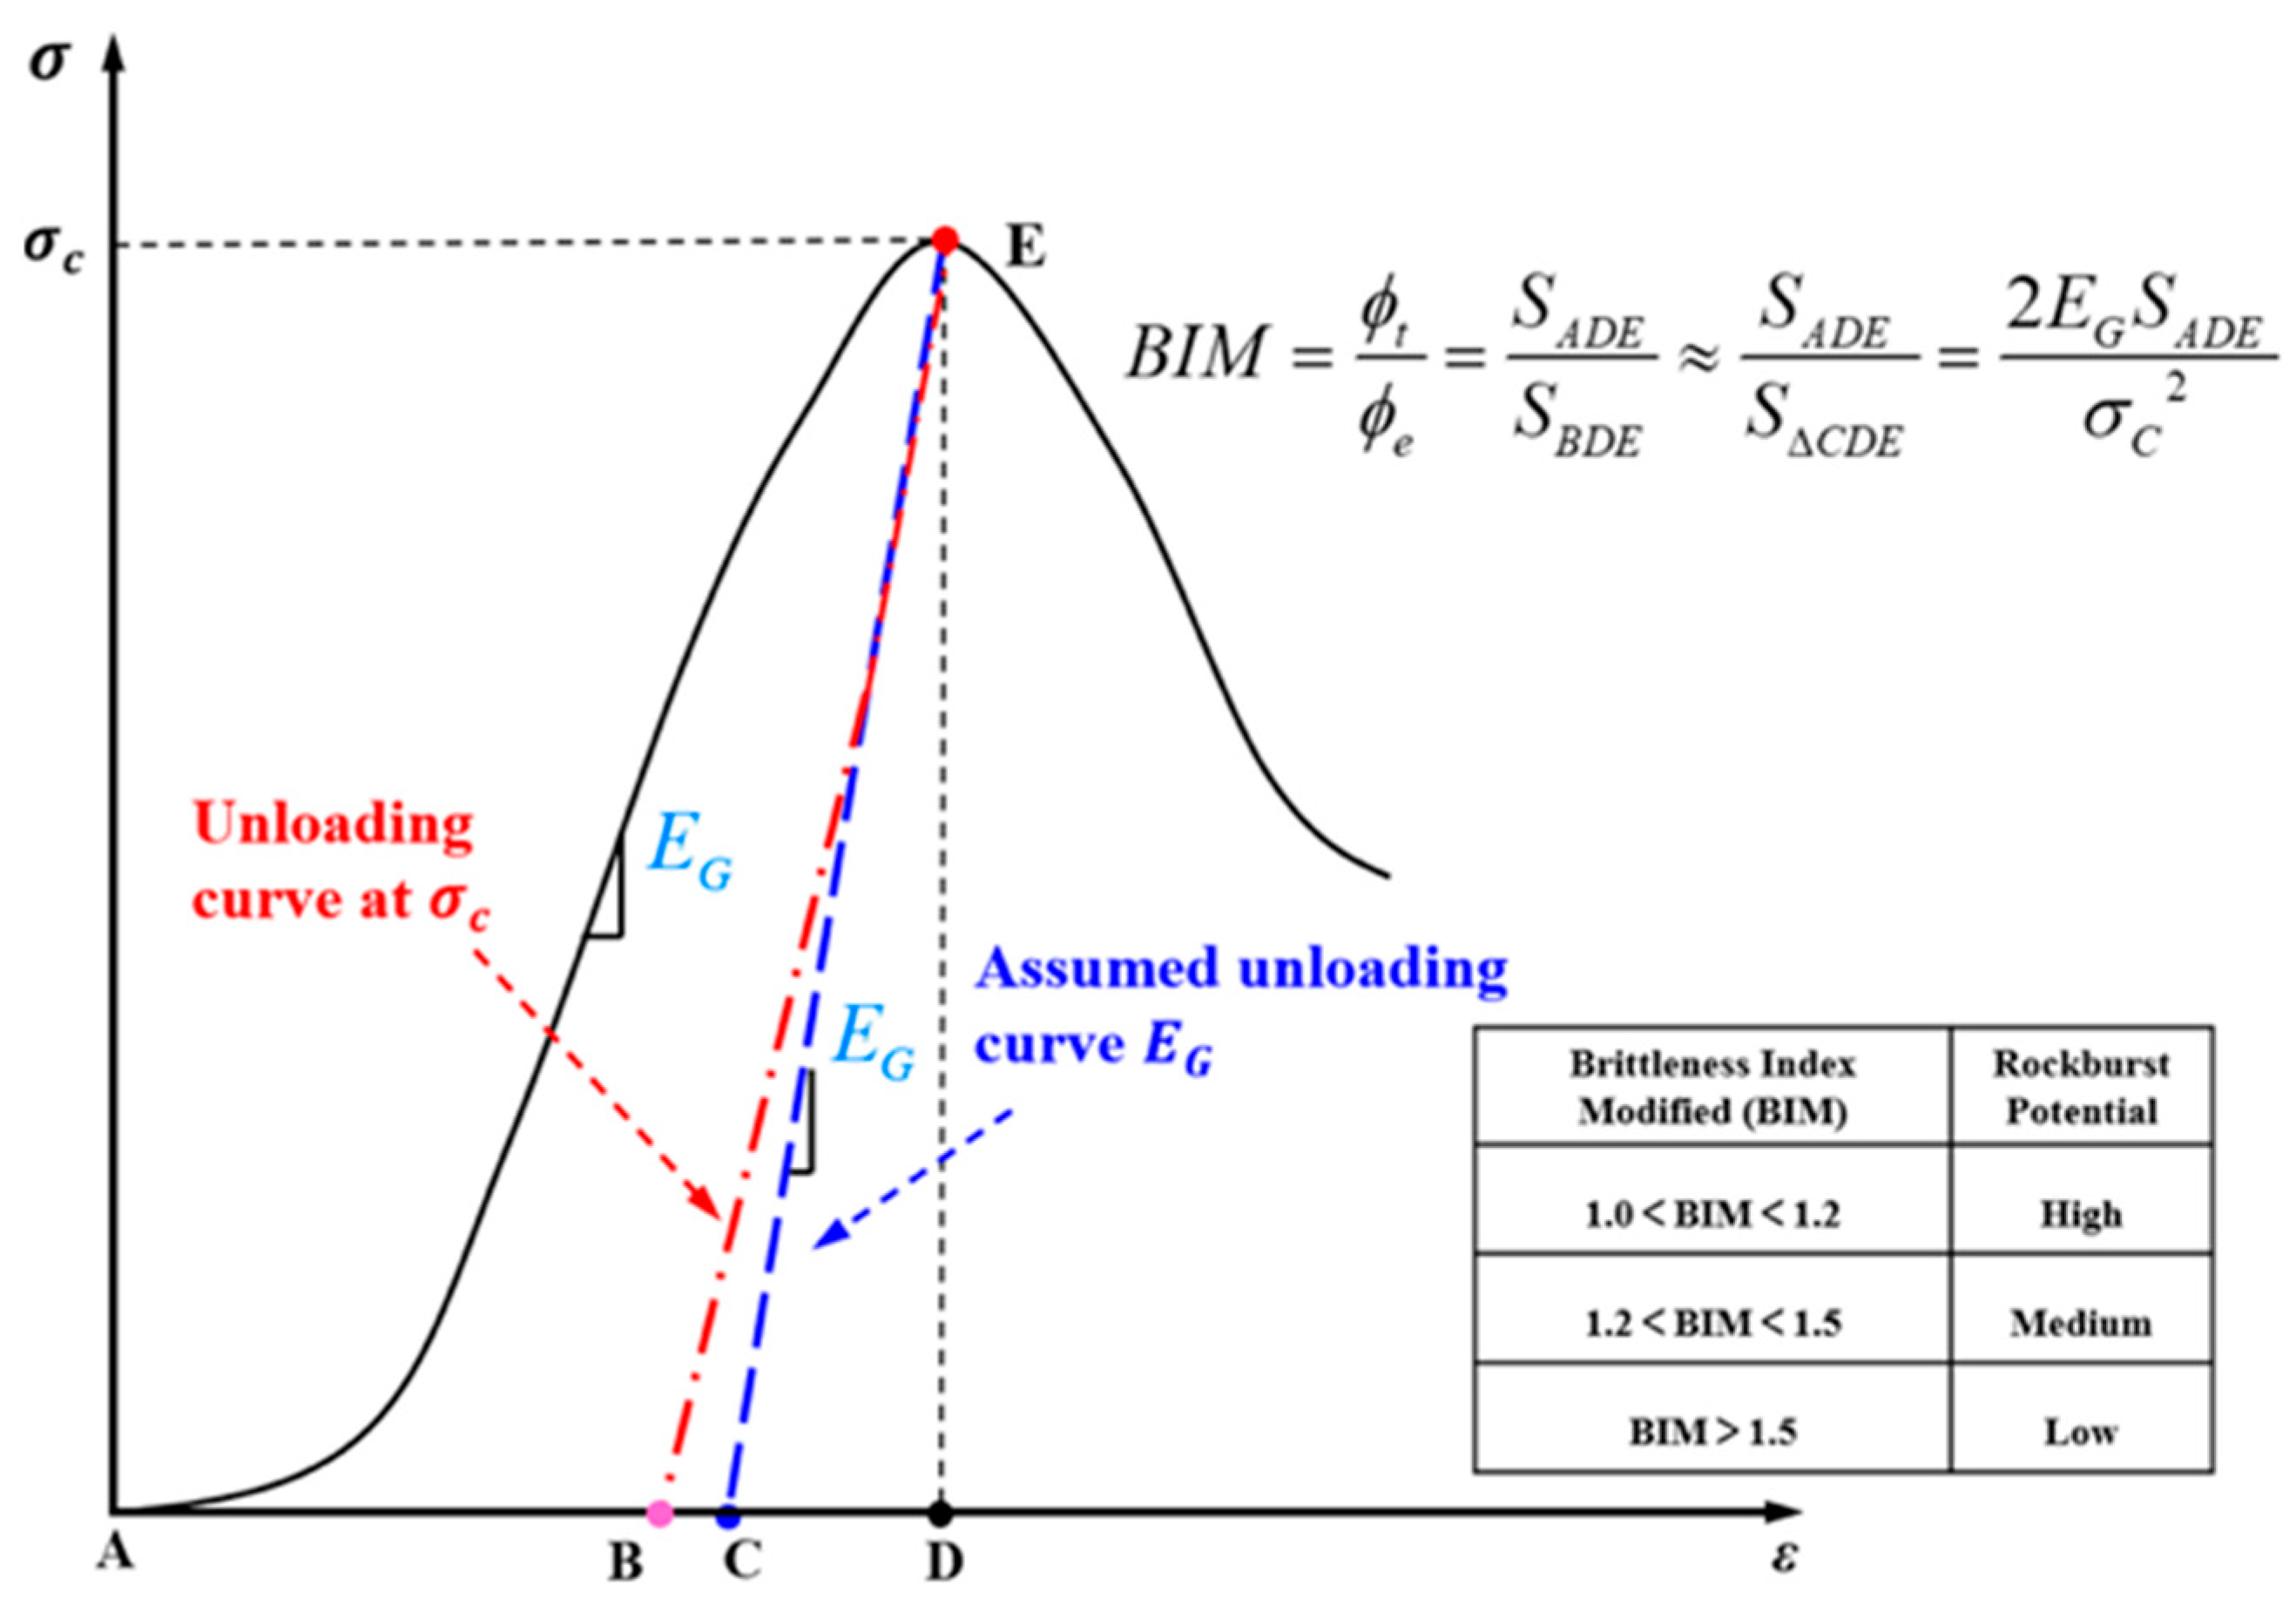
This study utilized UCS test data to calculate various indicators for assessing the rockburst susceptibility of limestone. Since the post-peak stress–strain curve cannot be fully obtained, only the pre-peak stress-strain curve can be considered for evaluating rockburst susceptibility. Here, BIM [
25] is defined as the ratio of the total input energy at peak intensity (S
ADE in
Figure 5) to the peak elastic strain energy (S
BDE as shown in
Figure 5), with a clearly defined rockburst susceptibility grading system [
4]. Therefore, BIM was adopted for assessing the rockburst susceptibility of limestone.
Table 1 presents the uniaxial compression test results and rockburst susceptibility. The BIM values for H-1, H-2, and H-3 were 1.302, 1.362, and 1.257, respectively. All values remained within the range of 1.2 to 1.5, indicating moderate rockburst susceptibility. Therefore, it is reasonable to use limestone for rockburst testing.
Based on the stress–strain curve obtained from the uniaxial compression tests, the BIM values for H-1, H-2, and H-3 can be calculated to assess their rockburst susceptibility. The results indicate that limestone exhibits moderate rockburst potential.
3.2. Rockburst Evolution Process
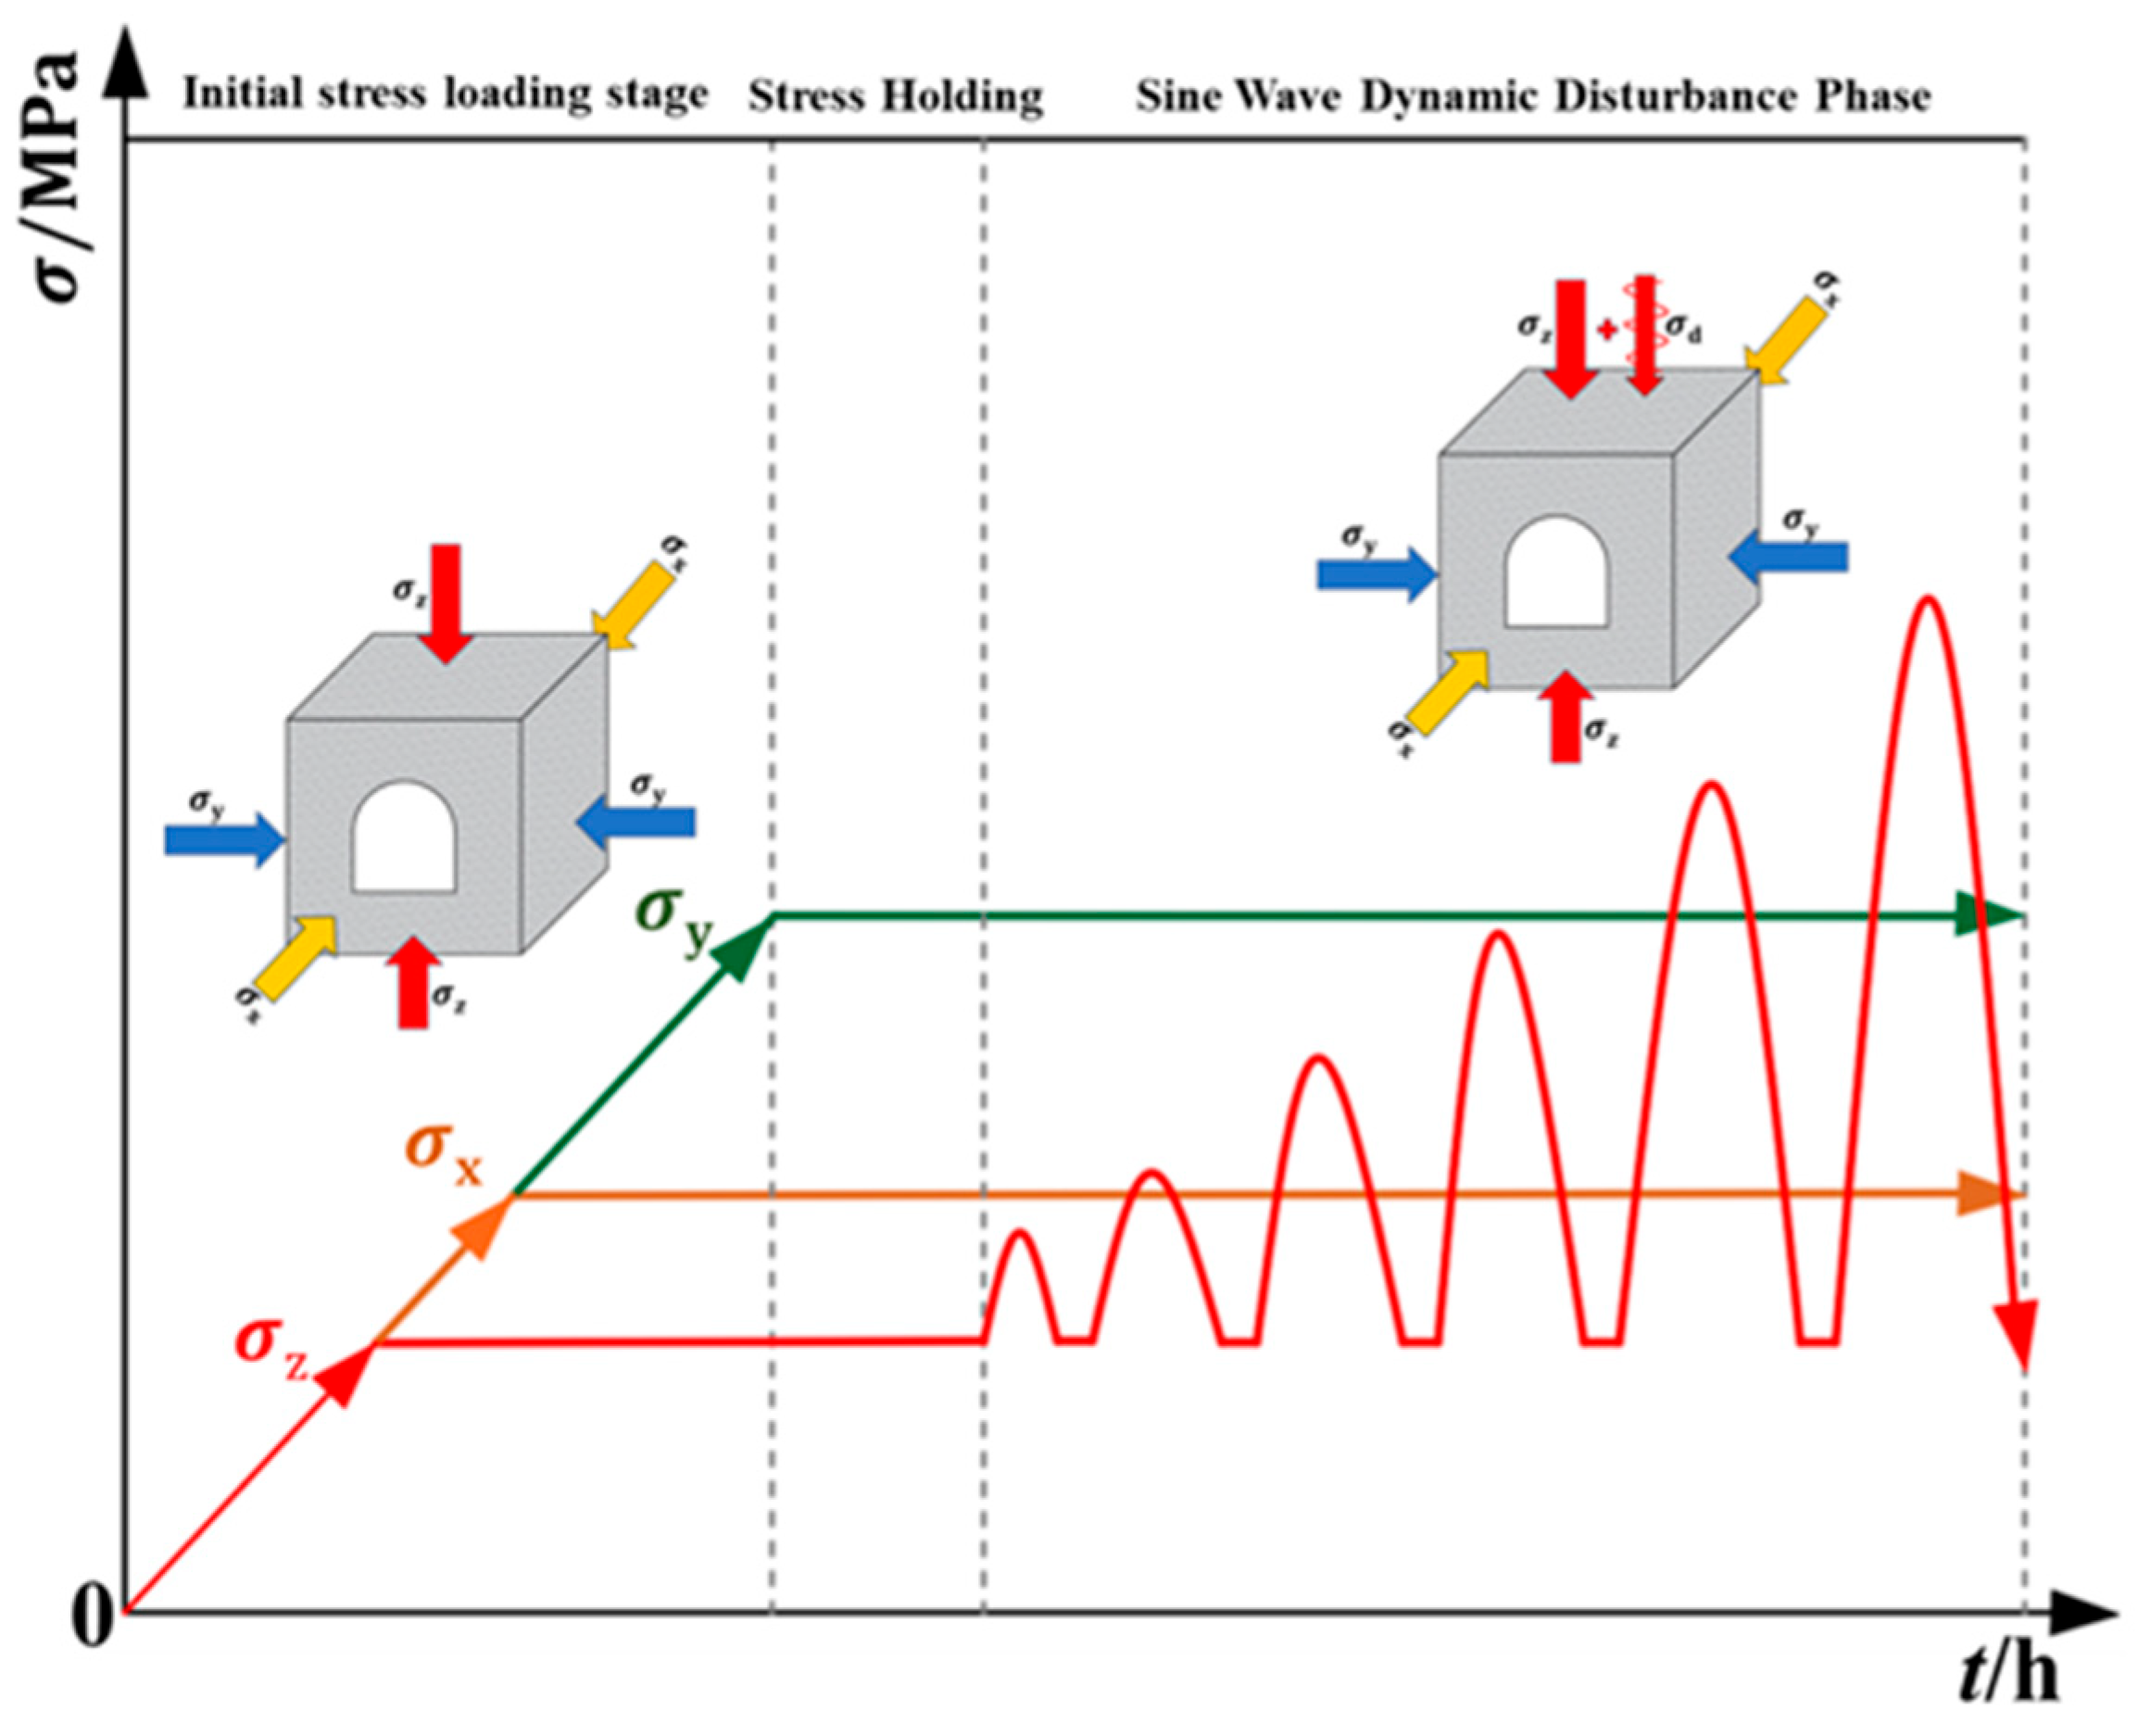
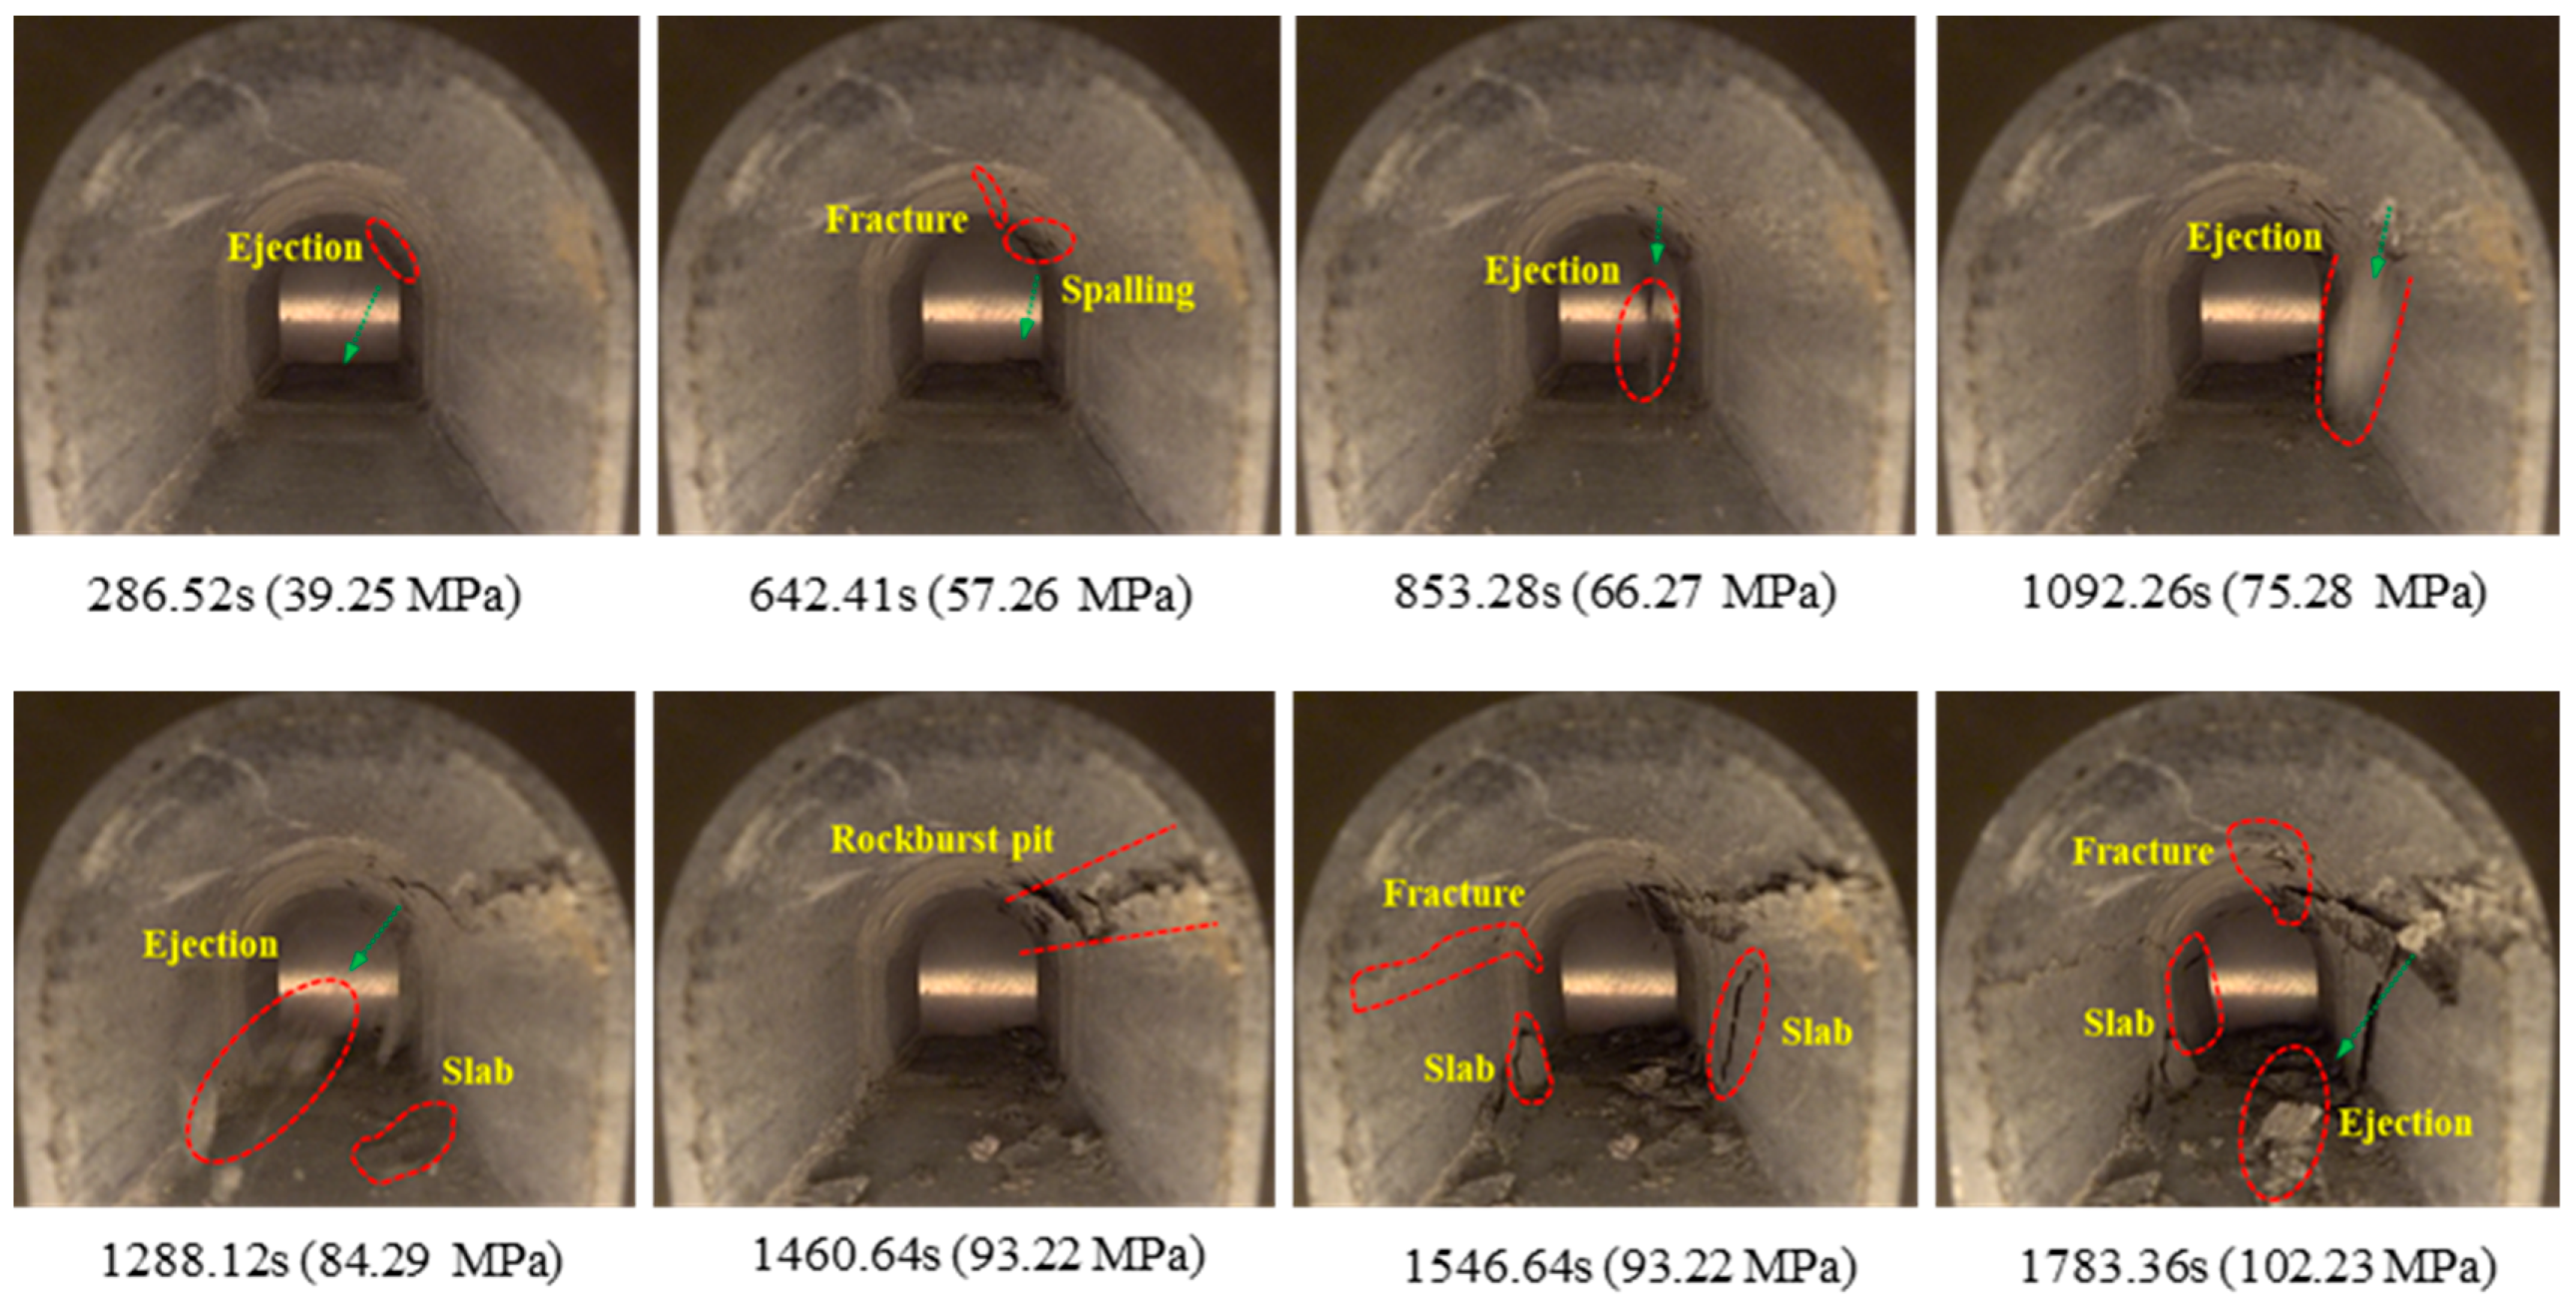
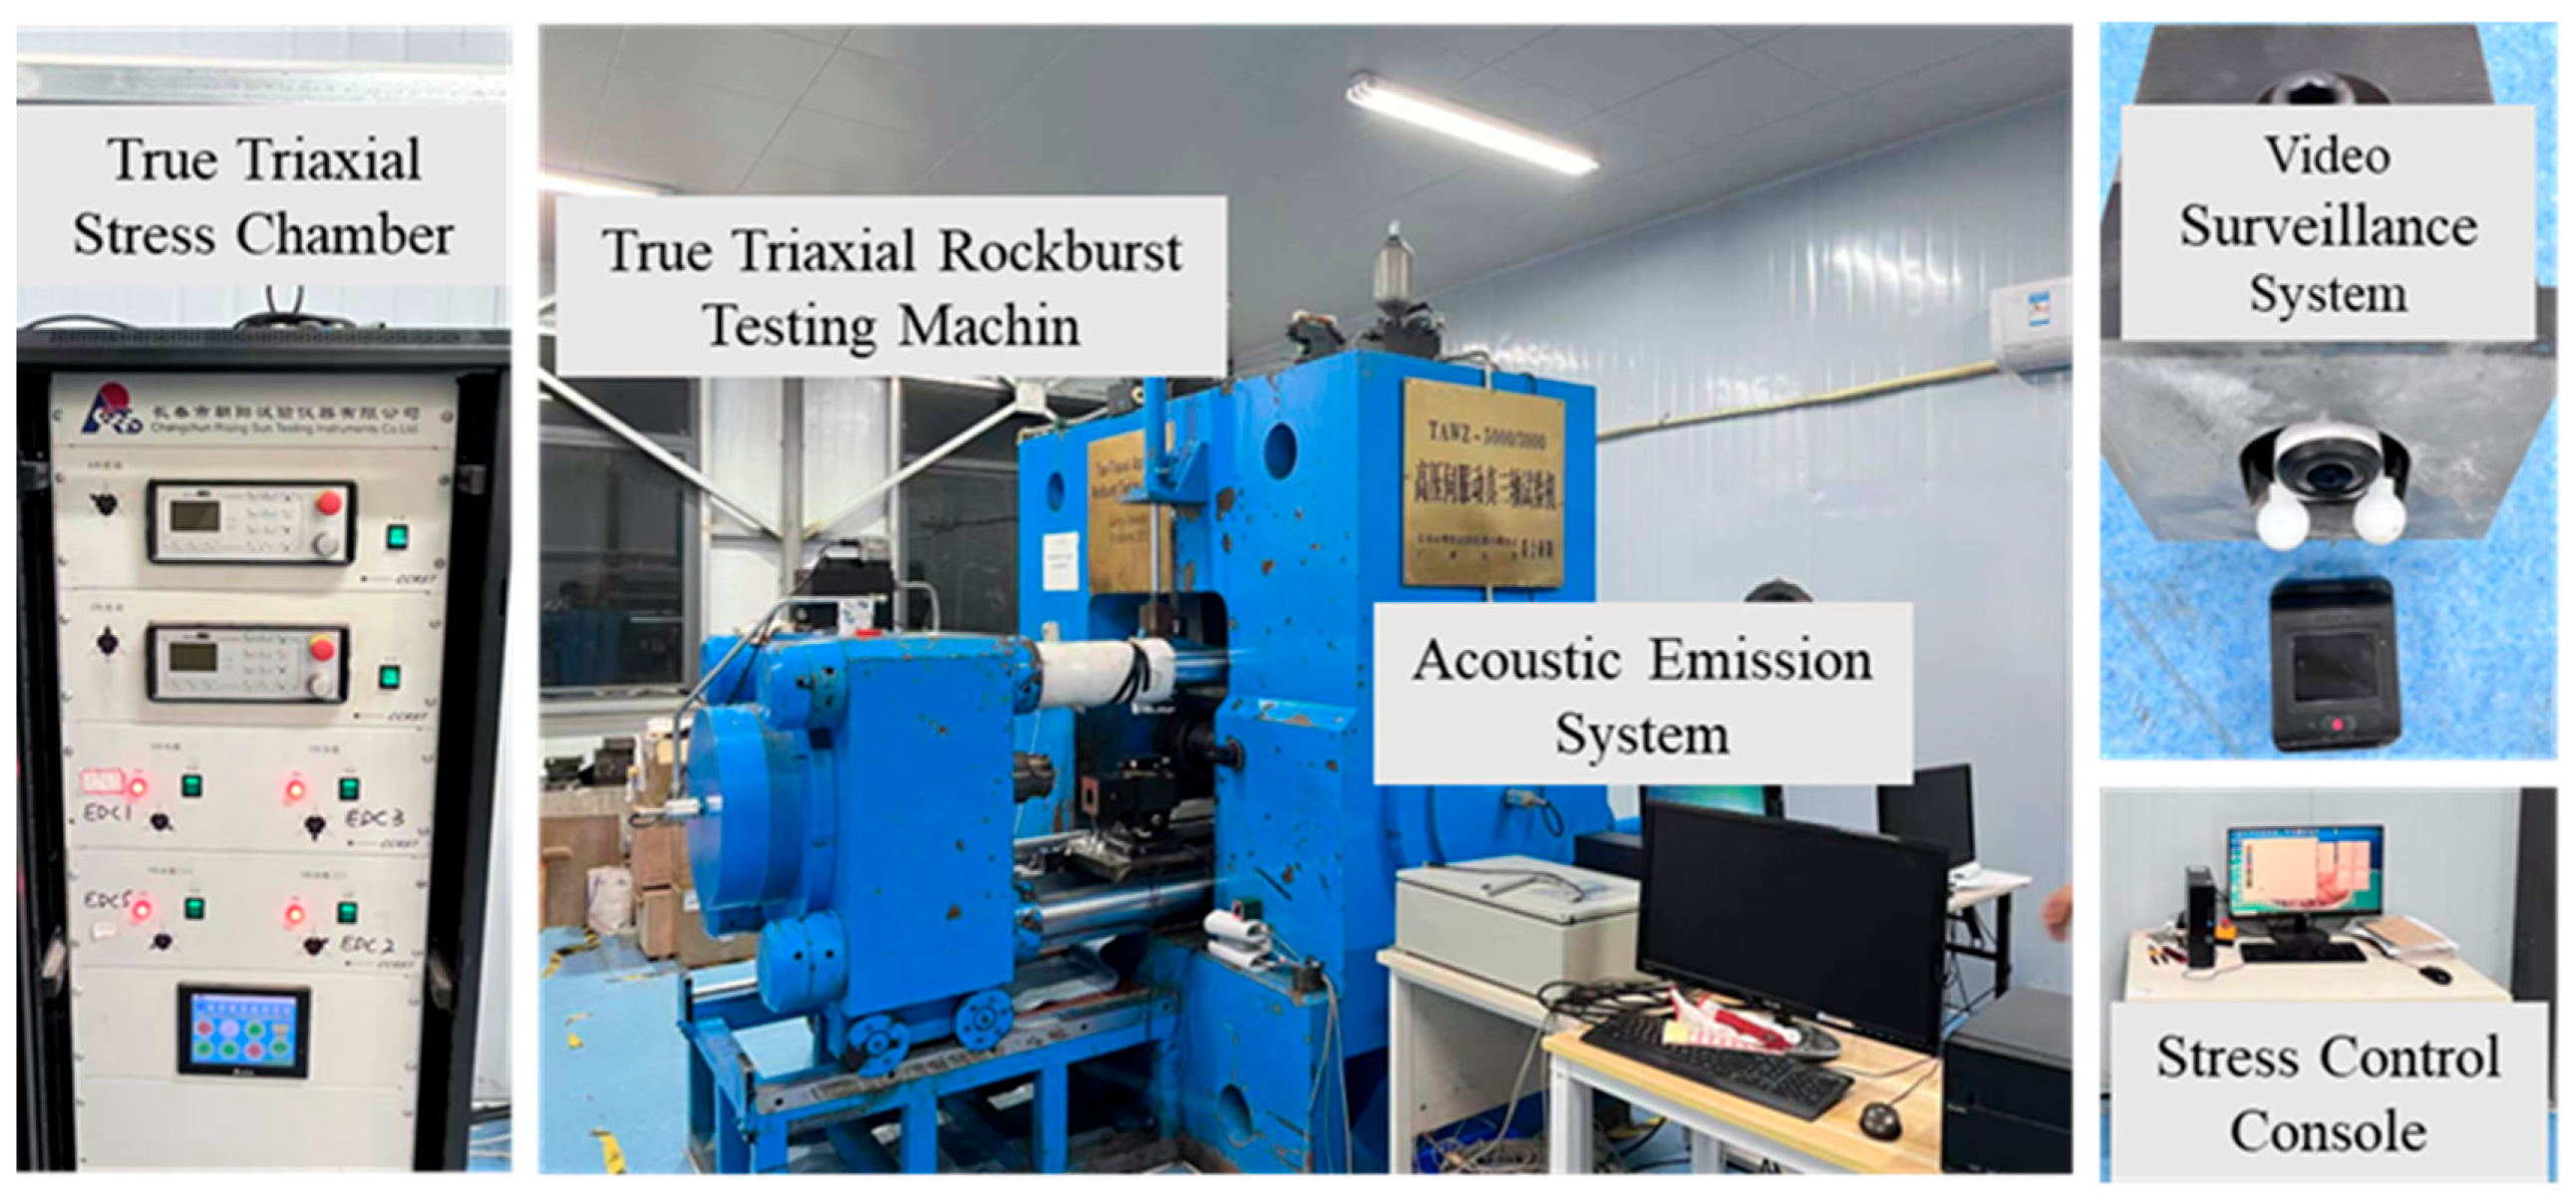
A high-speed camera system recorded the rockburst evolution process of unstructured and structured rock masses during loading in a straight-walled arched tunnel under true triaxial dynamic disturbance conditions. The rockburst evolution primarily involved key failure phenomena such as microcrack propagation, plate bending fracture, rock fragmentation, particle ejection, and flake detachment.
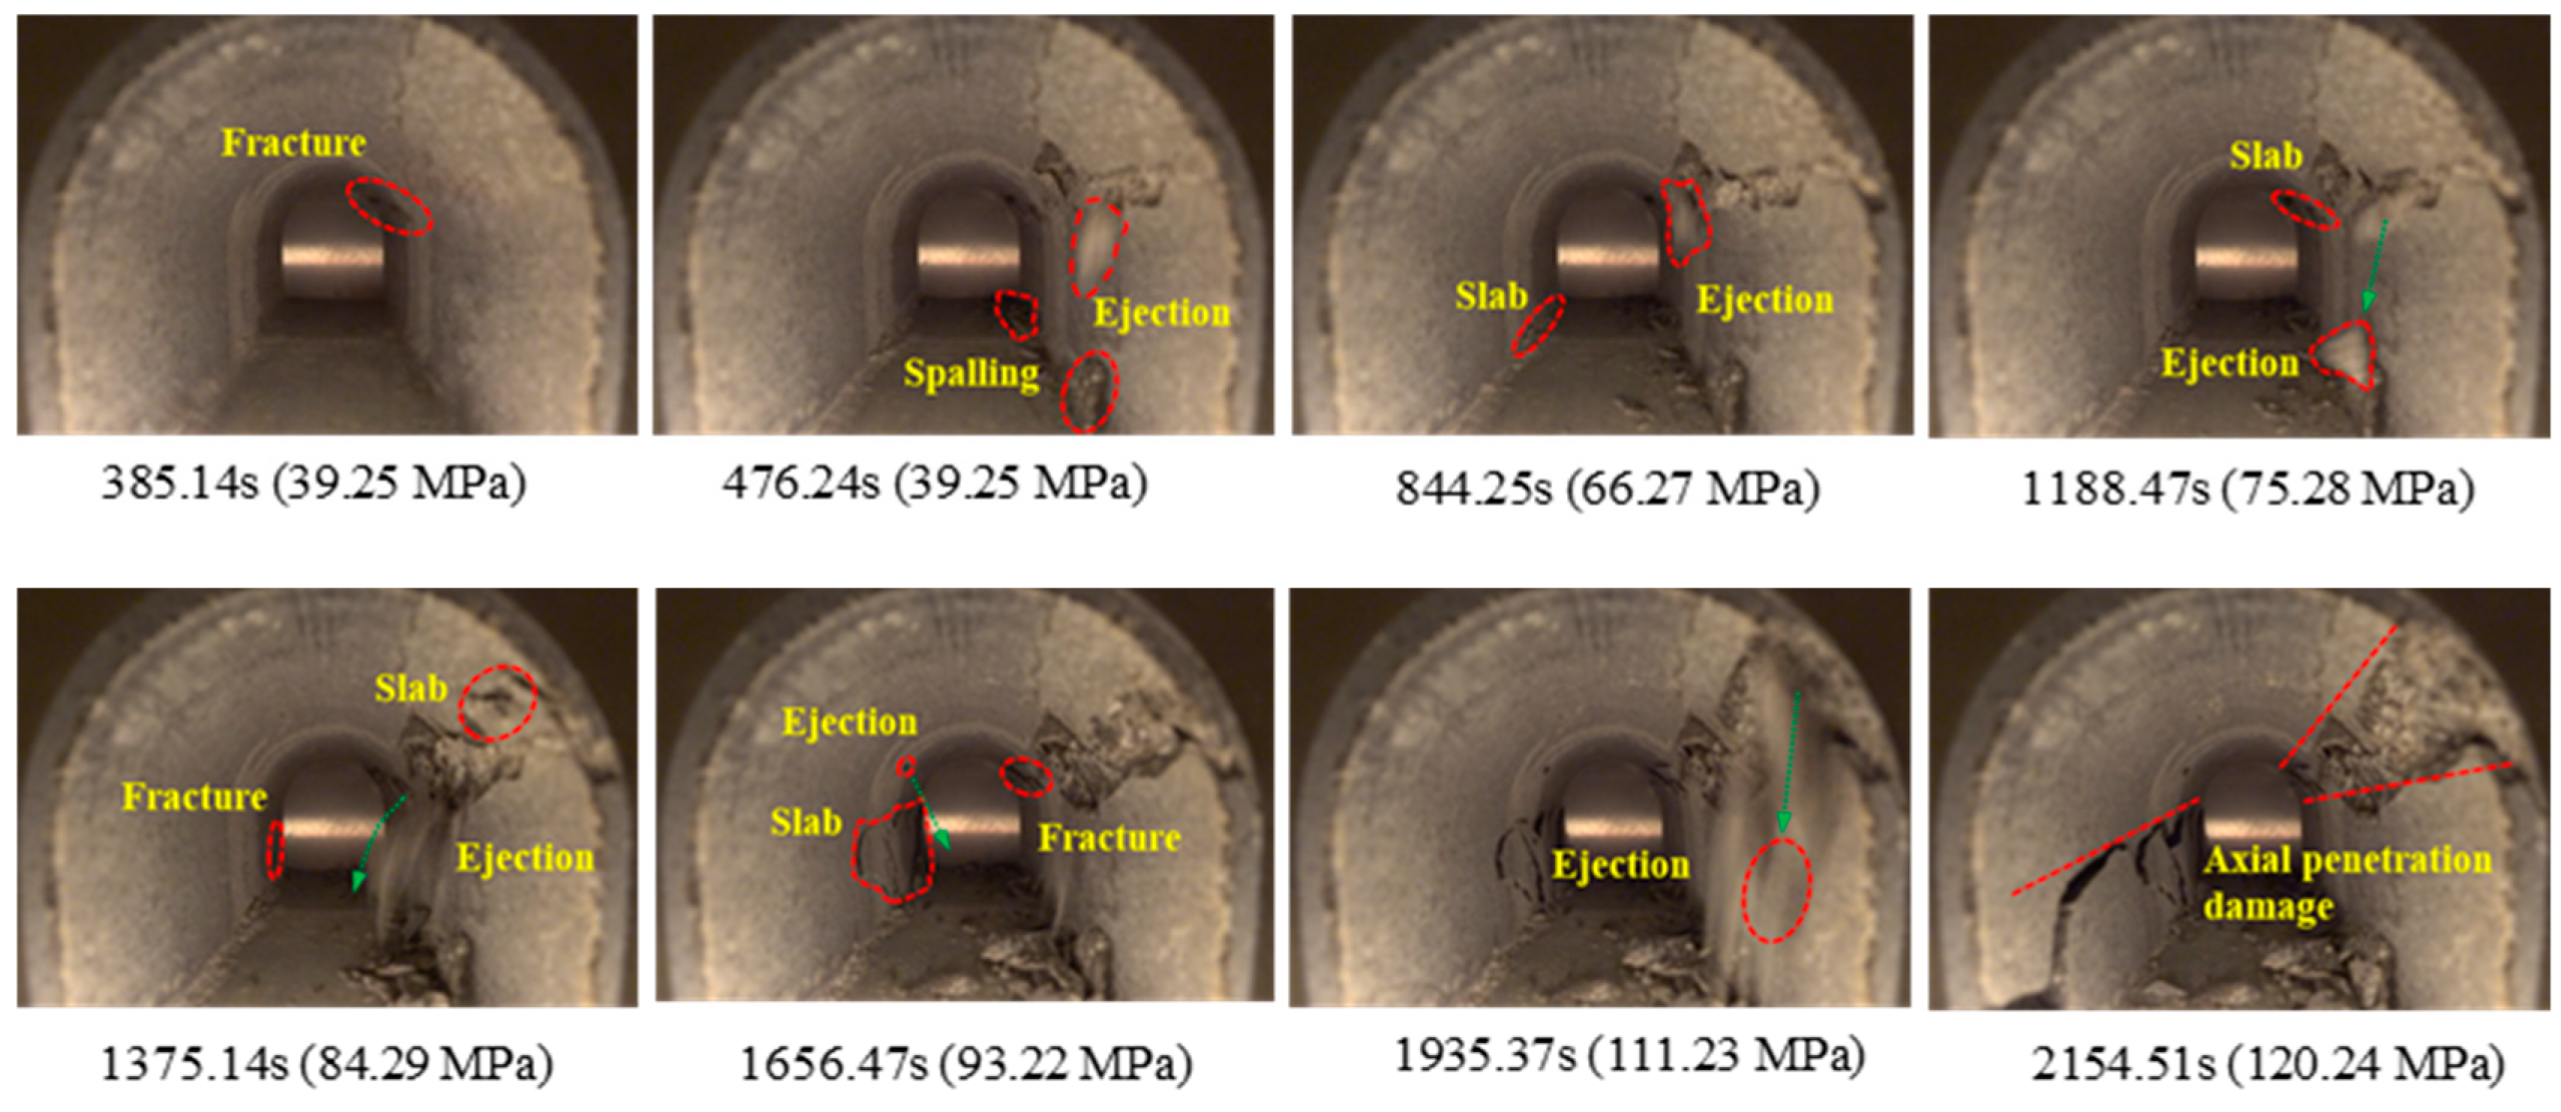
For Specimen A (
Figure 6), when the static-dynamic coupling reached 39.25 MPa, damage cracks appeared on the right arch shoulder accompanied by particle ejection. At 476 s, the cracks gradually propagated along the tunnel axis until they penetrated the right arch shoulder, with minor particle ejection occurring during this process. Between 464 s and 844 s, damage to the right arch shoulder primarily manifested as plate buckling failure. At a dynamic-static stress coupling of 66.27 MPa, initial damage appeared on the left wall, with plate cracks forming at the arch toe. When the coupling reached 75.28 MPa, rock fragments ejected from the damaged right side, followed by continuous flaking and damage propagation. At a dynamic-static stress coupling of 84.29 MPa, cracks propagated along the left vertical wall, while rock fragments were continuously ejected from the disturbed right shoulder area. Between 1384 s and 1656 s, cracks extended along the tunnel axis, causing continuous rock spalling that formed an explosion pit from which particles were persistently ejected. During the static-dynamic stress coupling of 93.22 MPa, plate-like fracturing occurred on the left vertical wall, and particles were ejected from the roof. At a dynamic-static stress coupling of 120.24 MPa, the right blast pit experienced intense ejection followed by axial damage penetration. Meanwhile, the left vertical wall primarily exhibited plate-like fracturing failure, with rock fragments undergoing opening, detachment, and ultimately toppling toward the open face.
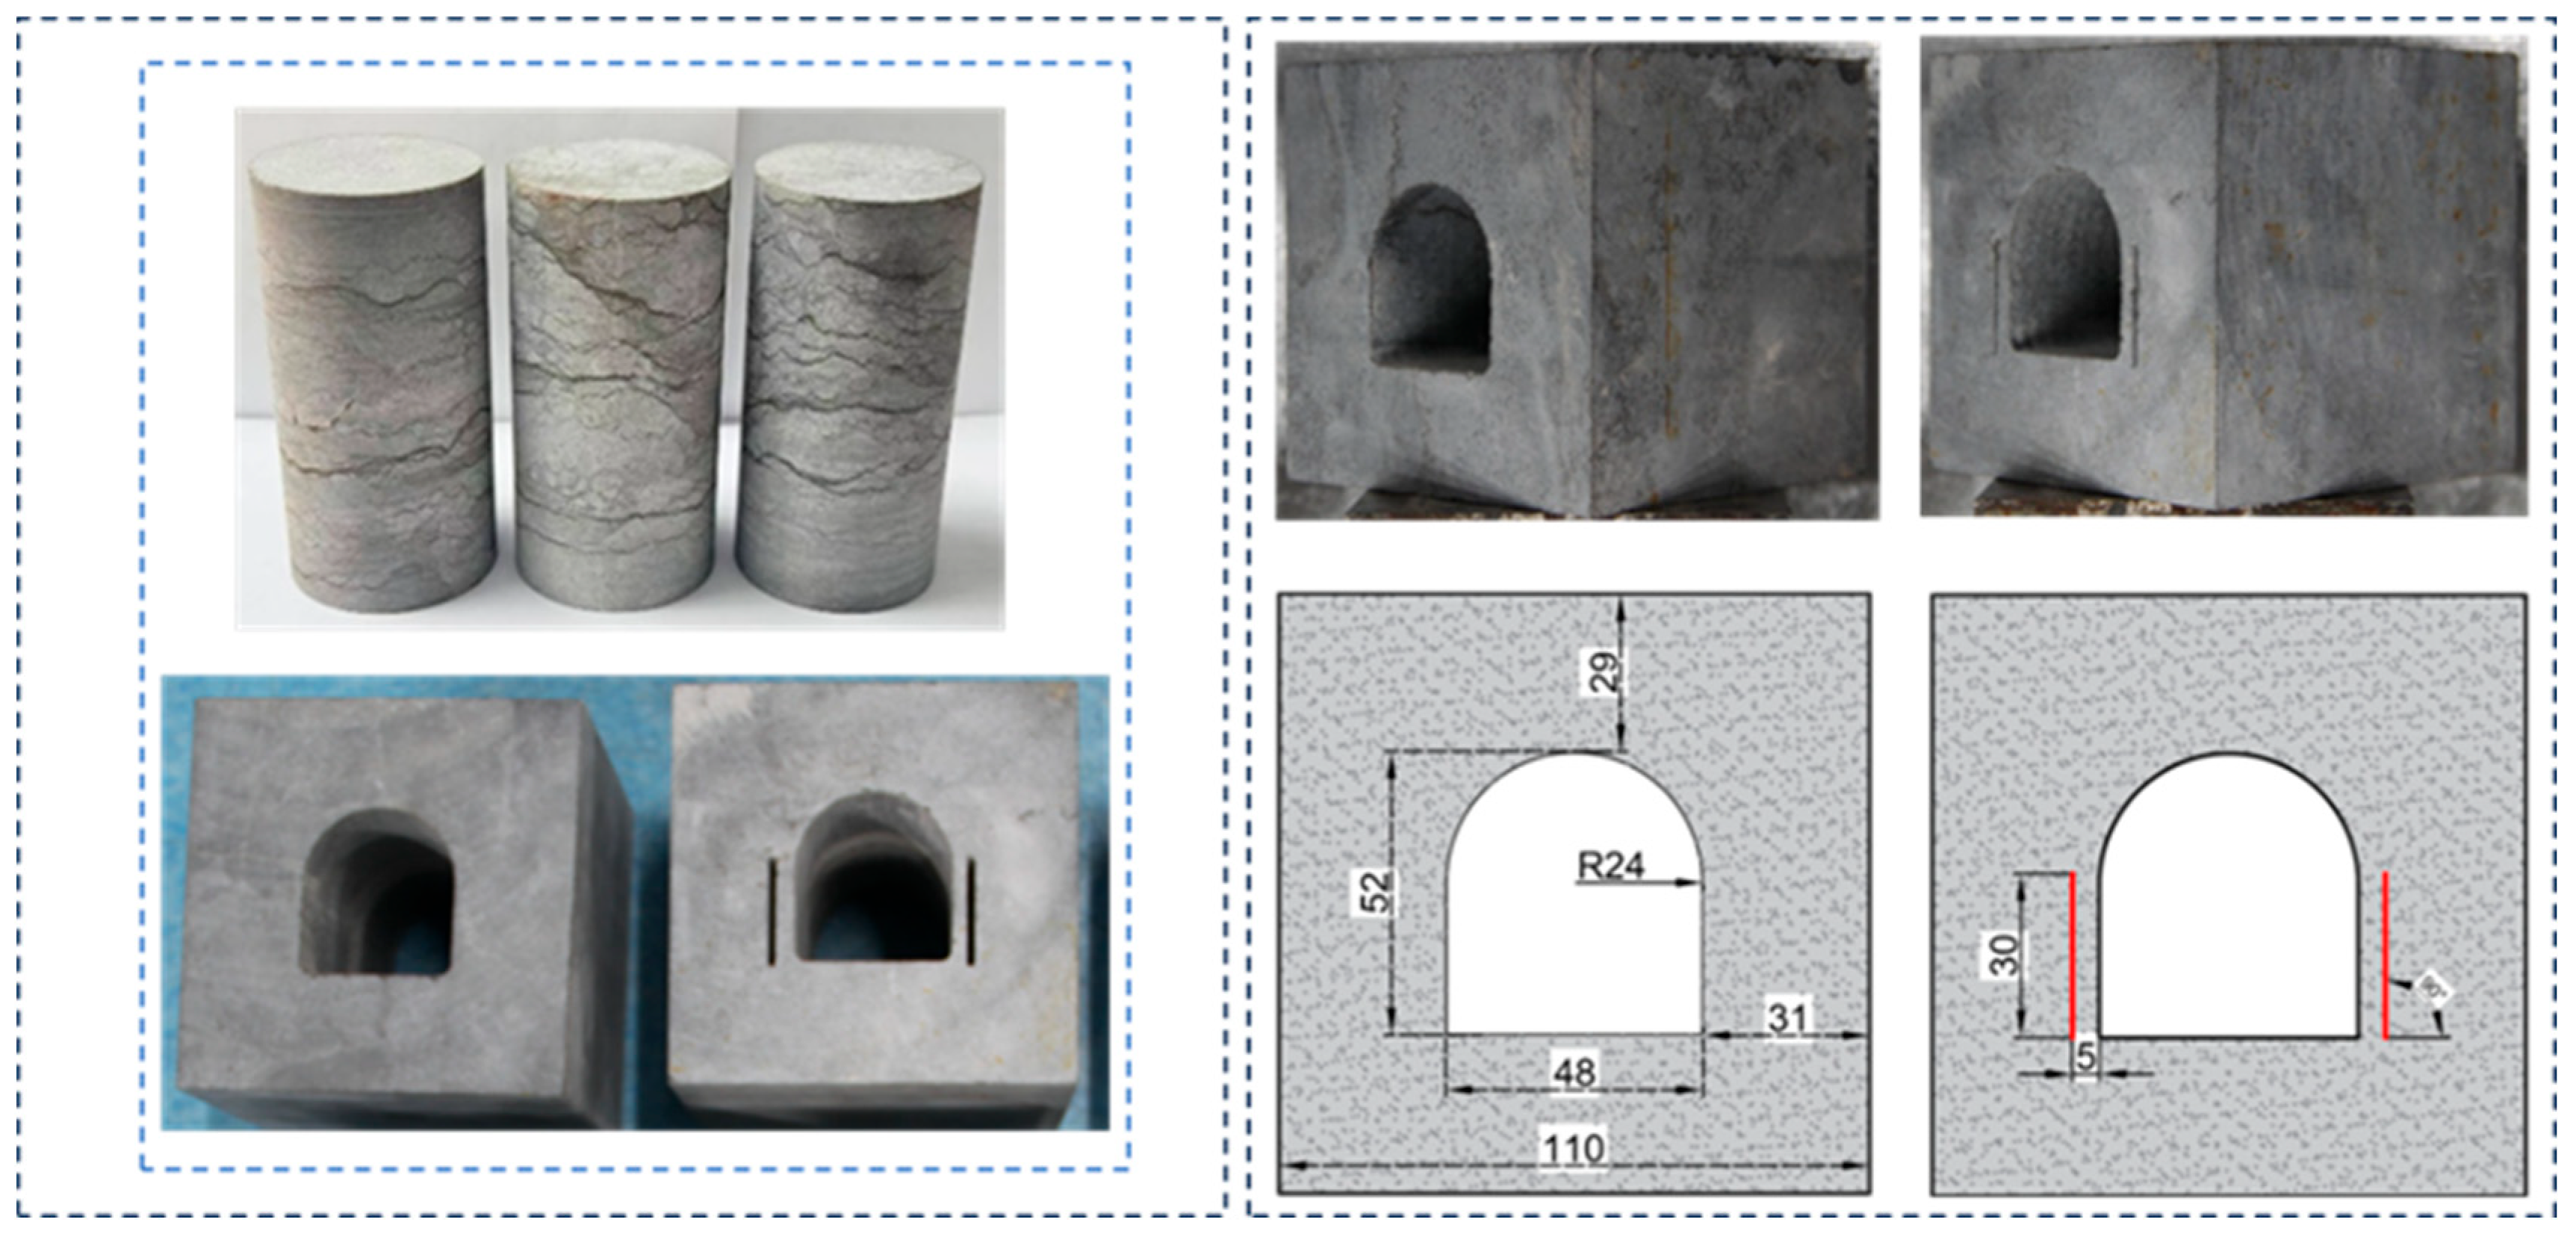
For specimen B with a precast vertical structural plane (
Figure 7), damage occurred at the right shoulder arch at 286 s when the static-dynamic coupling reached 39.25 MPa. During this process, cracks propagated rapidly, rock fragments detached, and minor particle ejection occurred. At a hydrostatic-dynamic coupling pressure of 57.26 MPa, plate cracking failure occurred, and transverse cracks appeared on the arch crown. When the coupling pressure reached 66.27 MPa at 853 s, a rockburst occurred on the right vertical wall, accompanied by rock dust ejection. At a dynamic-static coupling of 75.28 MPa, a sudden, intense rockburst occurred in the rock column between the right vertical wall and the structural plane at 1092 s seconds. Rock fragments were ejected from the surrounding rock at a certain initial velocity along with a large amount of rock dust. When the static-dynamic coupling reached 84.29 MPa, a second intense rockburst occurred at 1288 s on the right vertical wall. Rock fragments ejected from the rock column between the structural plane and the vertical wall rapidly traversed the axial borehole within 0.1 s. At 1460 s, the right rock column experienced extensive violent ejection. After the blast pit further expanded, fine particles were continuously ejected from the pit over the next 15 s. Between 1520 s and 1783 s, a through-crack developed in the left sidewall, followed by large-scale rock fragments toppling and sliding from the surrounding rock mass. Inside the right blast pit, rock blocks detached, and the plate-fractured structure visibly opened, resulting in a through-crack failure.
3.3. Failure Modes of Rock Specimens
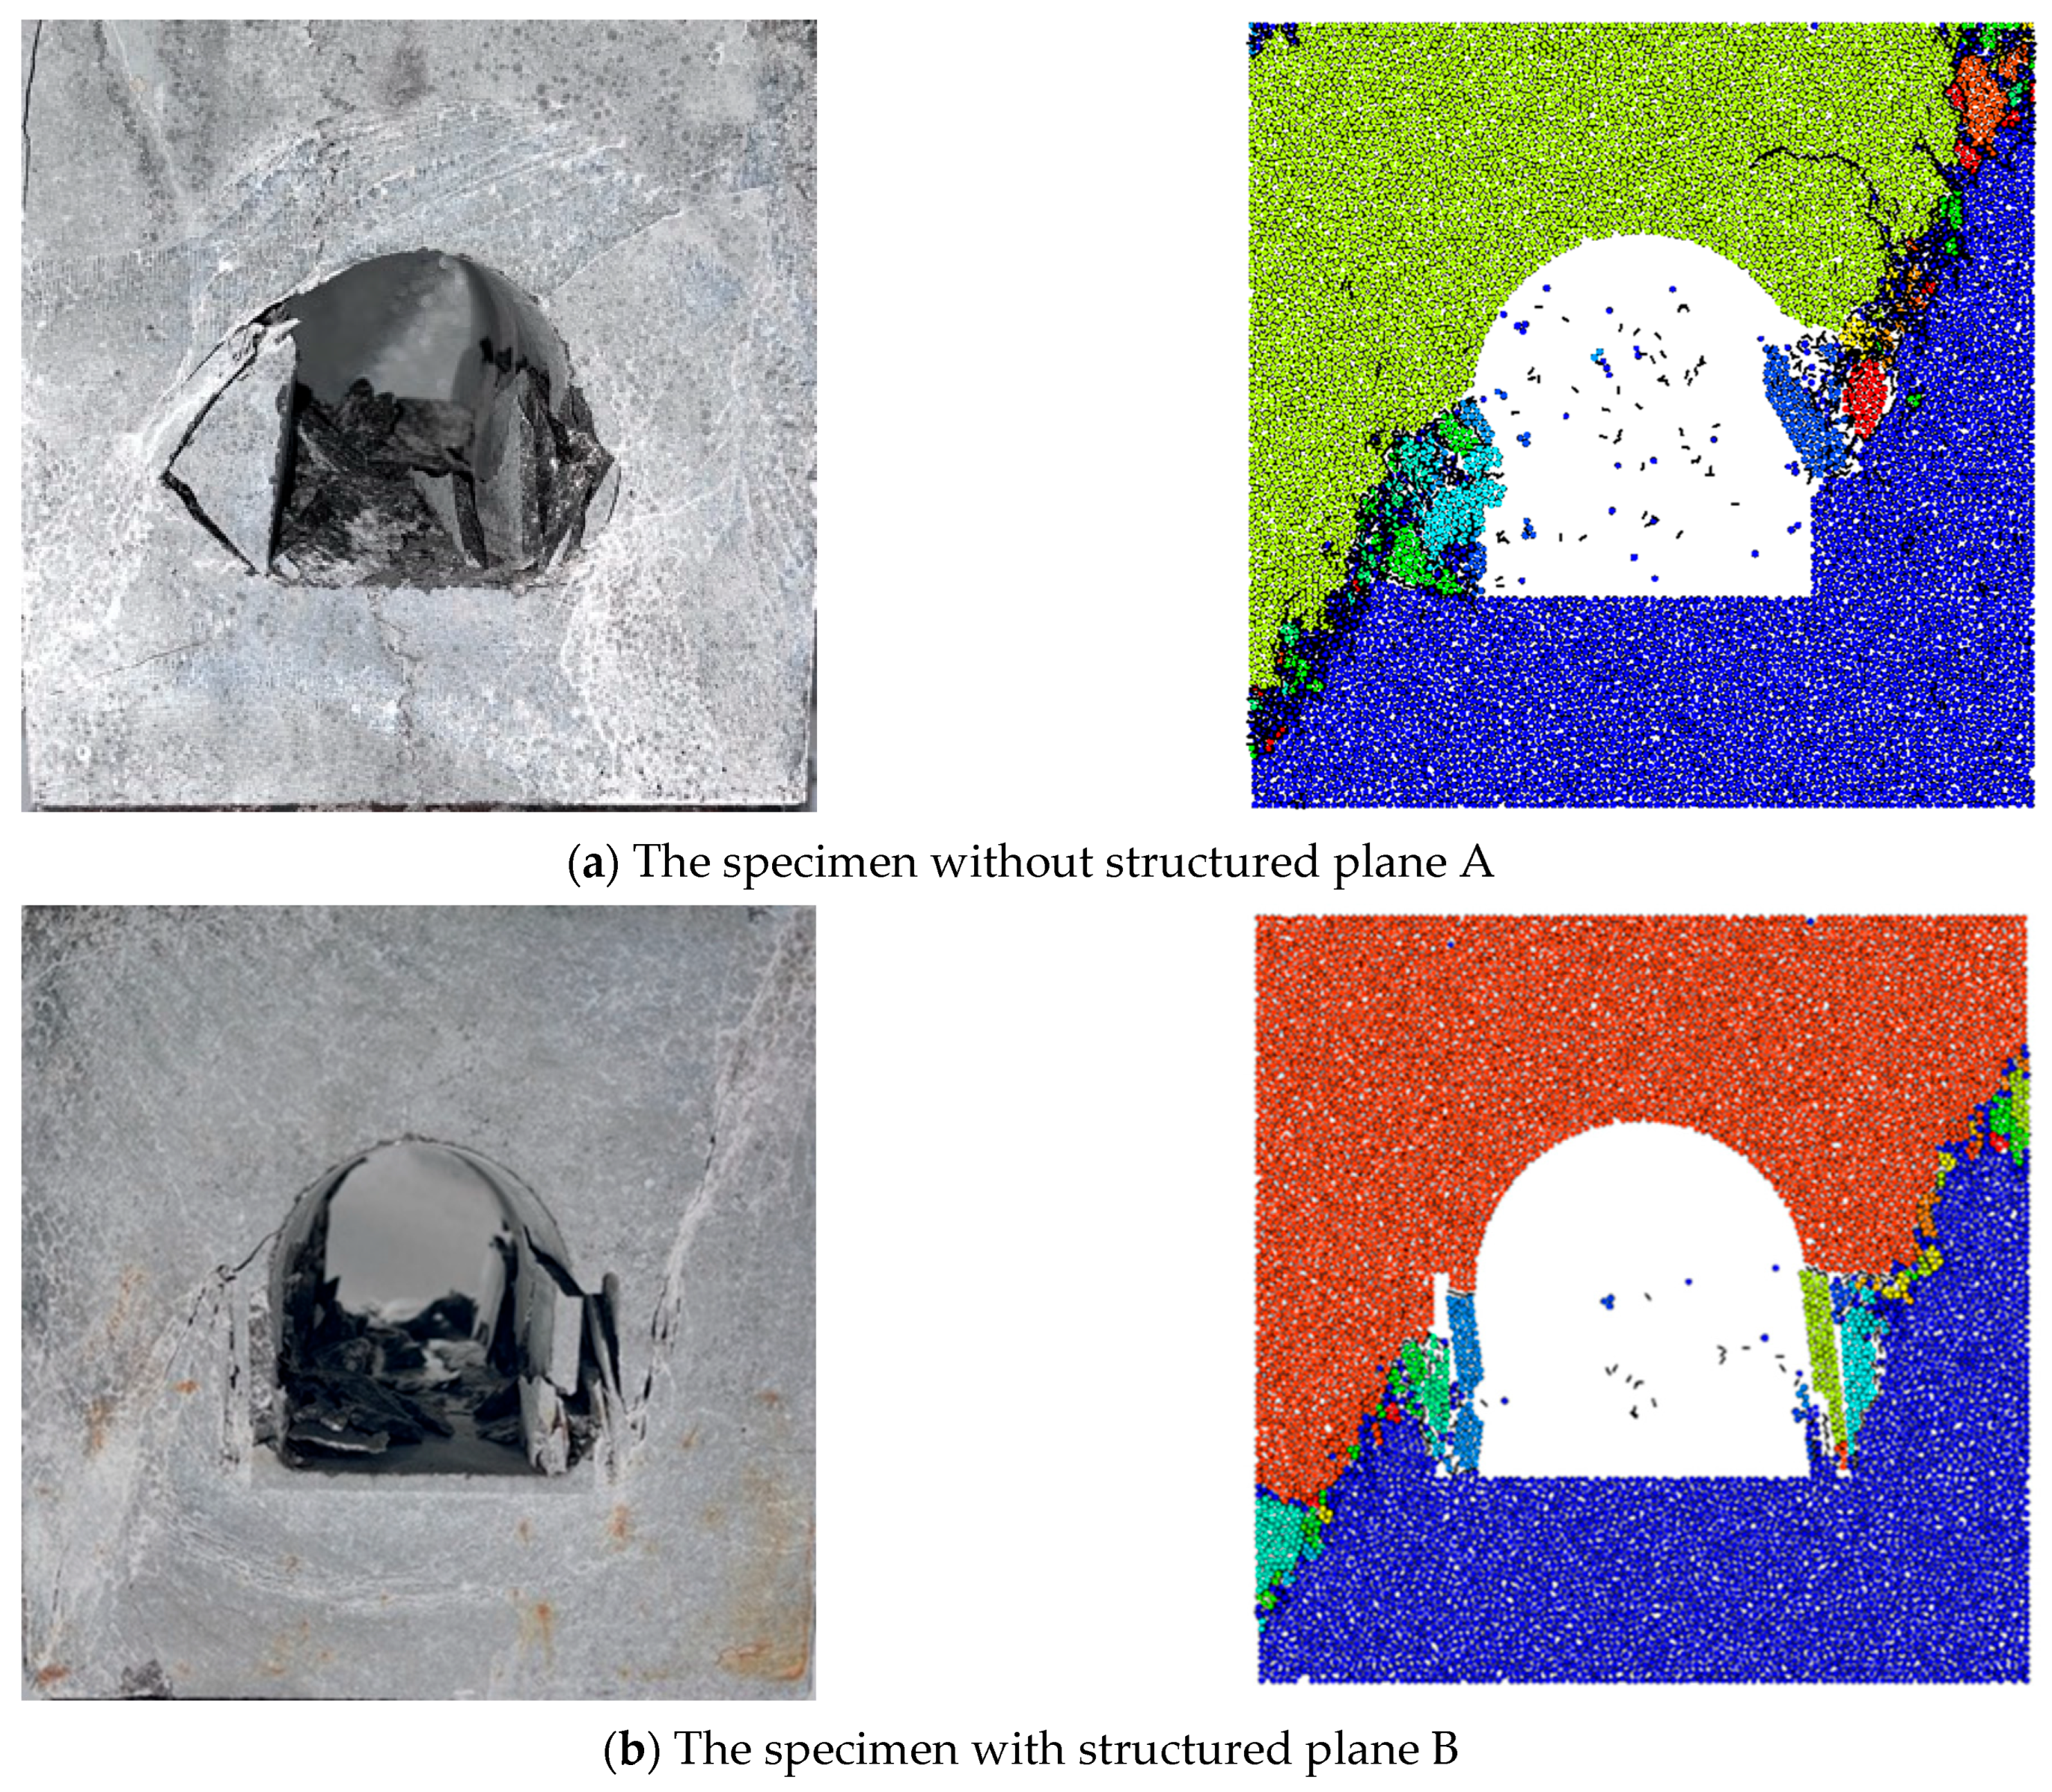
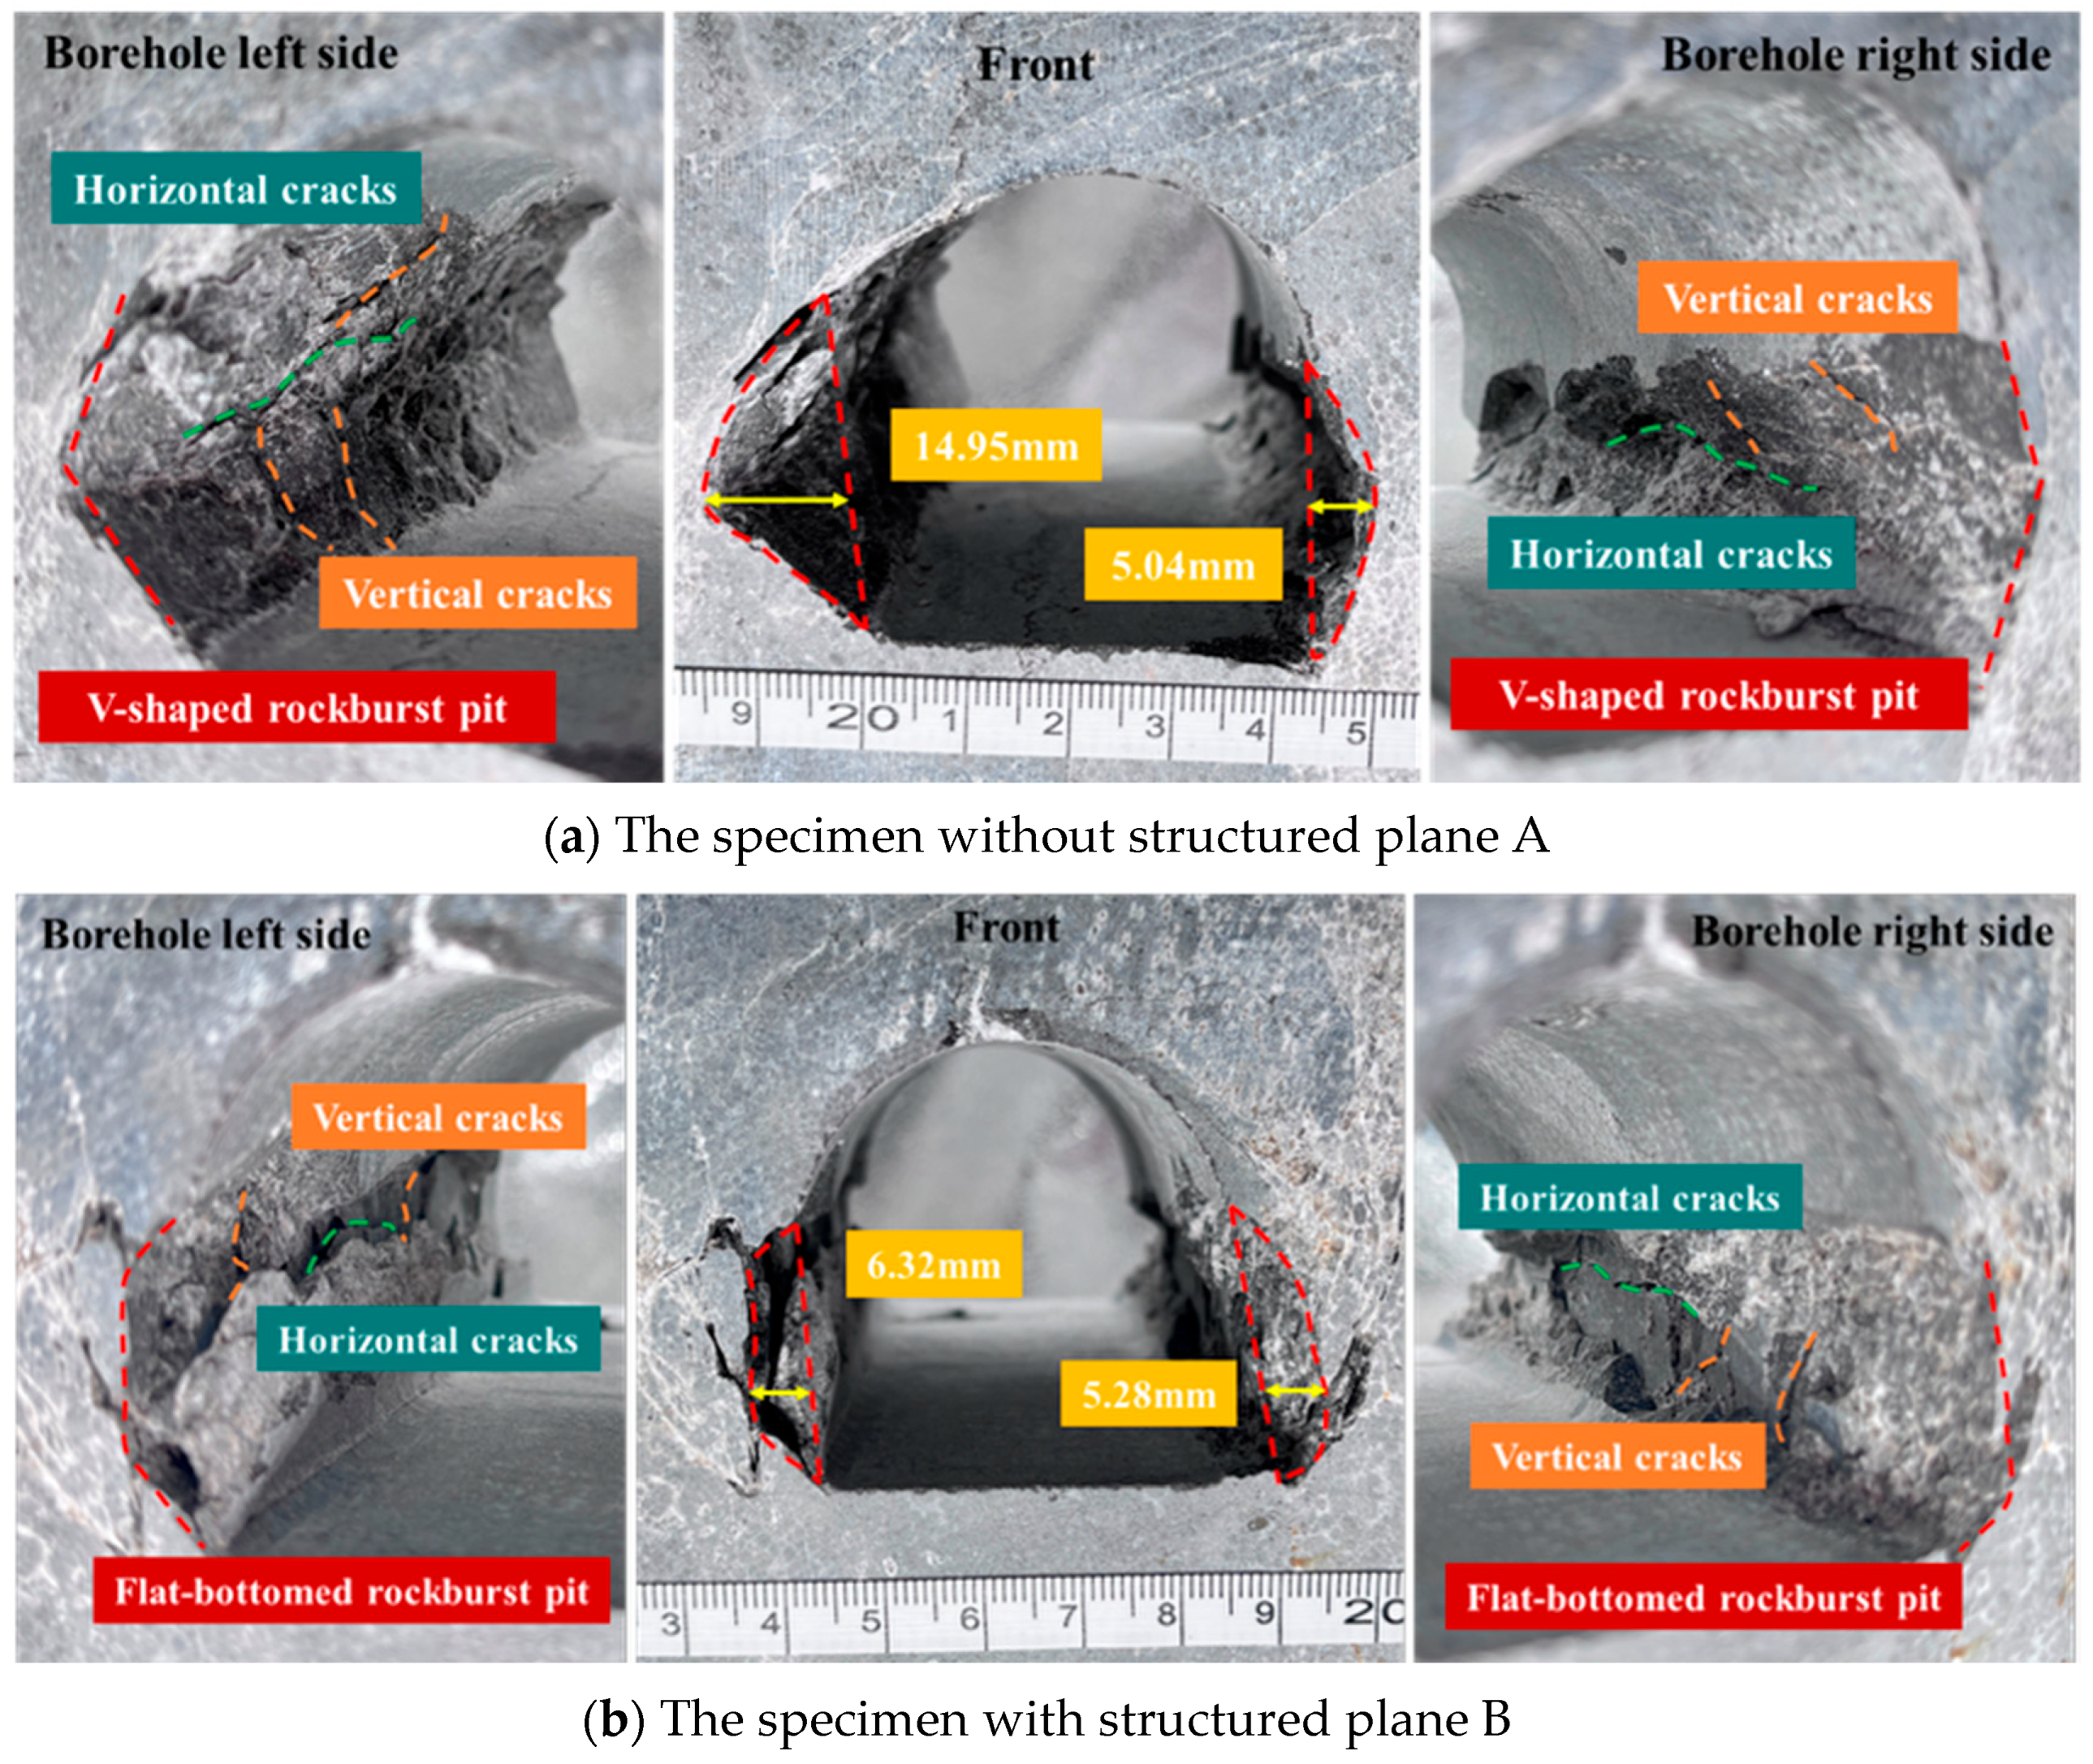
To further investigate the damage patterns of specimens following rockburst, accumulated rock fragments within the straight-wall arch were cleared after the test concluded. Subsequently, the blast crater conditions and crack patterns within the arch were analyzed. The rockburst damage patterns within the arches of unstructured Specimen A and structured Specimen B are shown in
Figure 8.
As shown in the figure, the specimen remained largely intact overall, with plate-like fractures primarily concentrated on the left and right sides of the straight-walled arched tunnel’s surrounding rock. The damage fracture zone within the straight-wall arch of the Specimen A exhibited distinct asymmetry, with a smaller damaged area on the right side and a larger one on the left. In contrast, the damaged areas on both sides of the Specimen B were nearly identical. This is primarily due to the control exerted by the pre-fabricated structural planes on both sides, resulting in damage that penetrated along the structural planes. Crack propagation in the unstructured Specimen A was mainly governed by the stress field. The left rockburst pit reached a maximum depth of 14.95 mm and formed later, indicating prolonged stress concentration and accumulated strain energy on the left side. The right rockburst pit was smaller but covered a larger damaged area, suggesting more frequent stress release on the right side, leading to rapid crack expansion. In Specimen B with structural surfaces, crack propagation was significantly influenced by the precast structural surfaces. The blast pits on both sides measured 6.32 mm and 5.28 mm respectively, exhibiting similar failure characteristics. Damage primarily propagated along the precast structural surfaces, forming axial through-pits. This indicates that the precast structural surfaces acted as weak planes for crack propagation, facilitating stress concentration and release, resulting in severe plate-crack/rockburst damage on both sides.
Vertical fissures extensively developed on the surface of rockburst craters, exhibiting a significant negative correlation between their scale and distance from the excavation boundary—i.e., the closer they were to the excavation boundary, the greater the extension length of the vertical fissures. As the distance from the excavation boundary increased, the stress concentration effect gradually diminished, and the development length of vertical fissures correspondingly shortened. Additionally, horizontal fissures were distributed on the surface and bottom of the rockburst pit. These fissures are key controlling factors inducing layer-wise failure of rock slabs, and their formation mechanism is closely related to the shear stress field experienced by the specimens in the horizontal dimension. In summary, the development of both vertical and horizontal cracks is not only regulated by stress concentration effects, but also exhibits a close coupling relationship with the evolution of the final rockburst pit morphology. Through complex interactions, these two factors jointly drive the formation process of rockburst pits.
3.4. Rockburst Fragment Characteristics
3.4.1. Mass Distribution of Fragments
Rock fragments generated during rockbursts provide direct information reflecting the progressive failure process of rock masses [
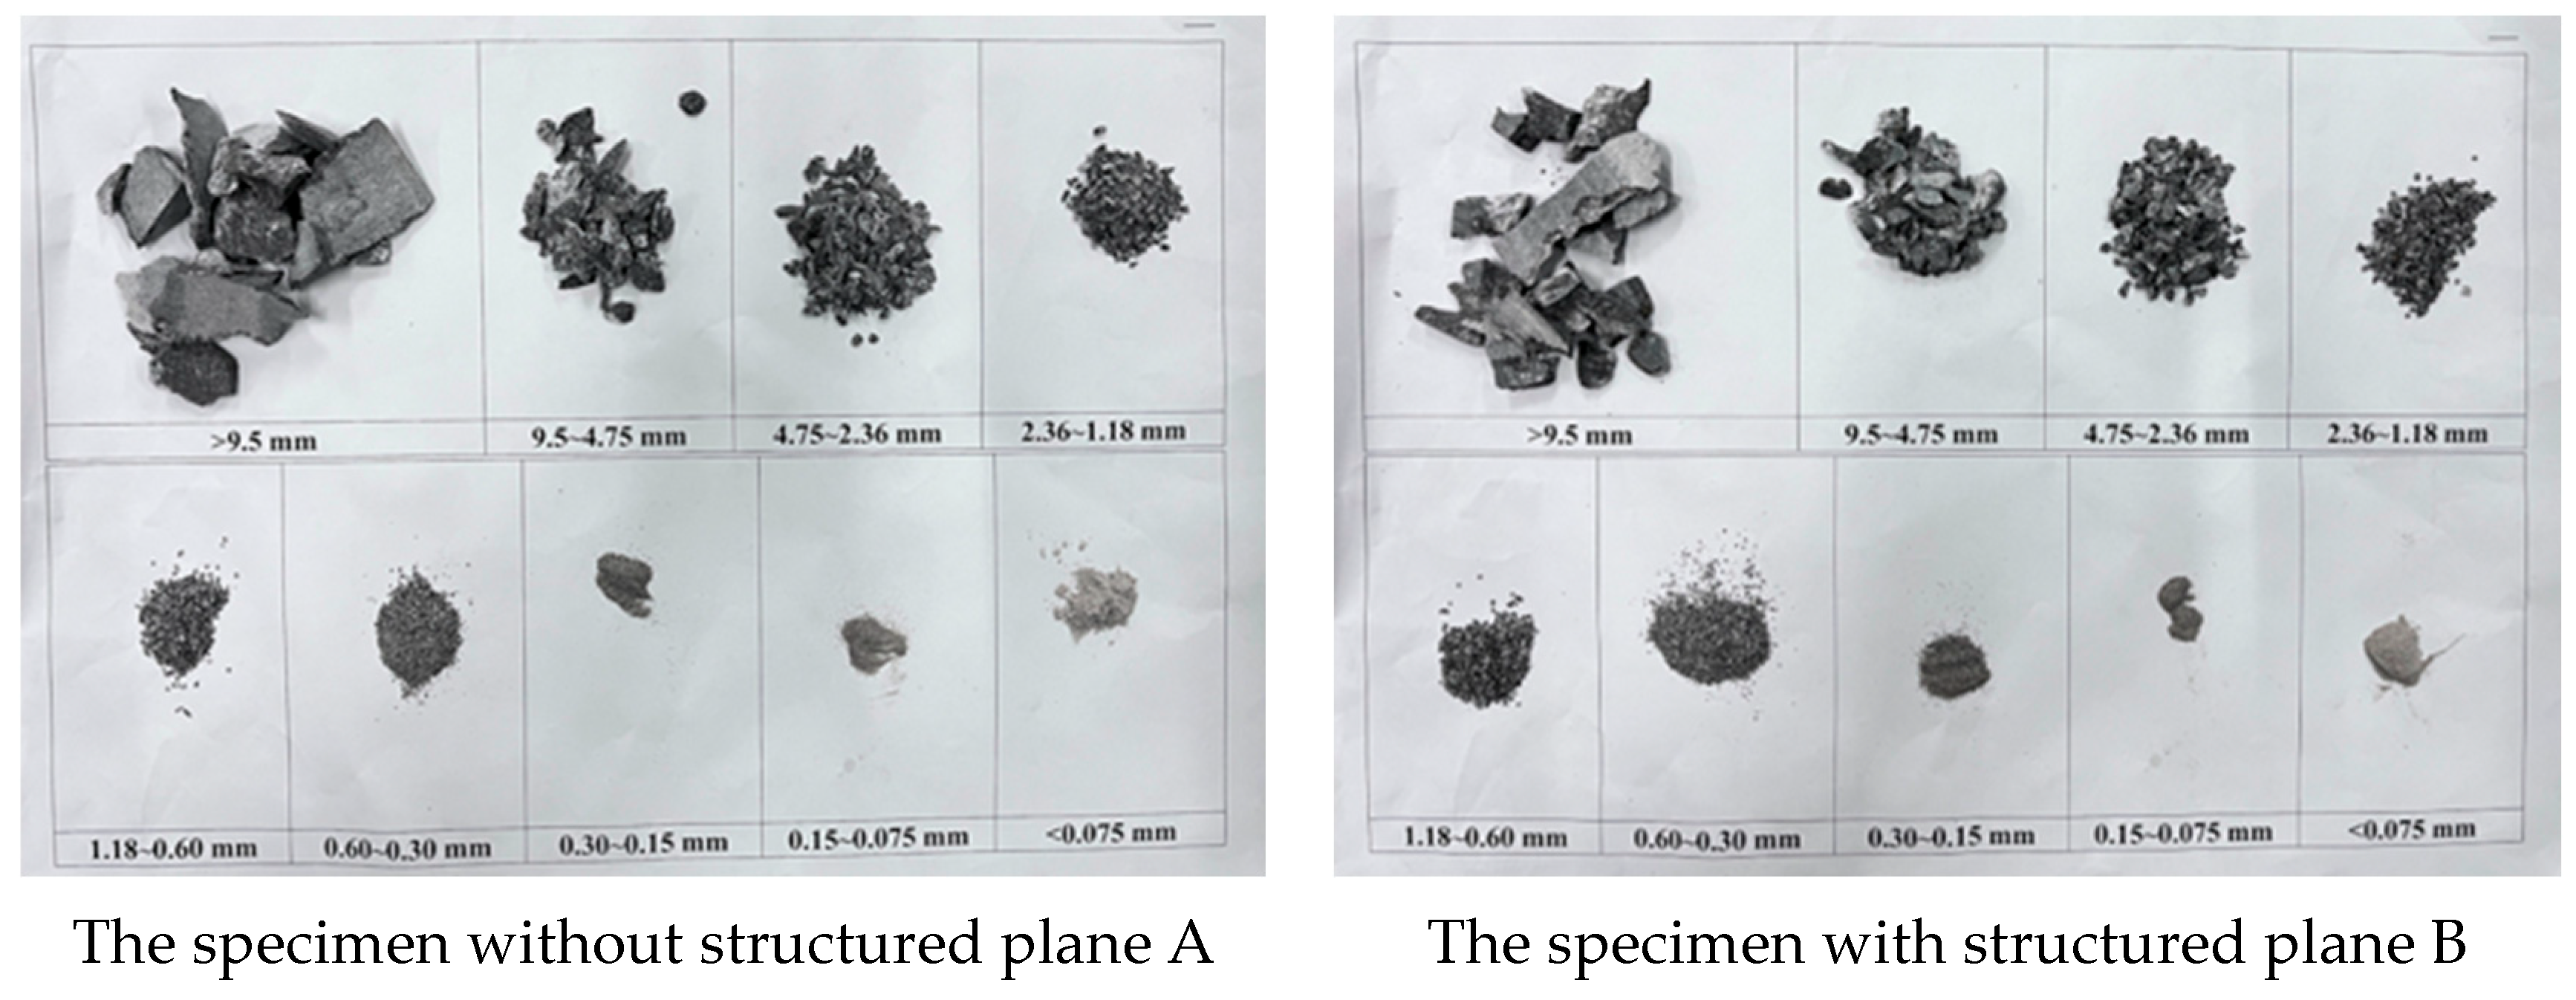
26]. Therefore, this subsection analyzes the mass and particle size distribution characteristics of rock fragments produced during rockbursts in the tunnel floor and surrounding rock near structural planes (as shown in
Figure 9). The collected fragments were graded using a sieve shaker with standard apertures of 0.075 mm, 0.15 mm, 0.3 mm, 0.6 mm, 1.18 mm, 2.36 mm, 4.75 mm, and 9.5 mm. The mass of fragments in each size interval was precisely measured using a high-precision electronic scale.
Table 2 presents the mass distribution of fragments across all groups for both test specimens. During rockburst events, accumulated elastic strain energy is instantaneously converted into kinetic energy. The ejected particle size and velocity reflect the magnitude of strain energy release, aiding the further analysis of rockburst energy dissipation mechanisms.
As can be seen from the table, the cumulative mass of rock fragments from Specimen B with structural planes was greater than that of Specimen A with structural planes, indicating that Specimen B underwent more intense damage during the rockburst process. Across all nine particle-size ranges, it can be clearly observed that for the same size range, the fragment mass of Specimen B was consistently higher than that of Specimen A. In particular, the proportion of fragments in the 9.5–0.075 mm size range for Specimen B was close to 50% of the total mass, which was much higher than that of Specimen A. This further suggests that the rockburst in Specimen B was more violent, releasing more energy during failure and resulting in more severe fragmentation damage.
3.4.2. Microscopic Morphology of Fragments
The surface morphology of cracks reveals intrinsic details of the deformation and associated energy dissipation mechanisms governing the fracturing process. Scanning electron microscopy (SEM), as a widely used microscopic observation technique, has also been extensively applied in rock testing [
27]. Therefore, to further elucidate the rockburst mechanism from a microscopic perspective, SEM was employed in this study to investigate the micromorphology of rockburst fragments from two limestone specimens. As shown in
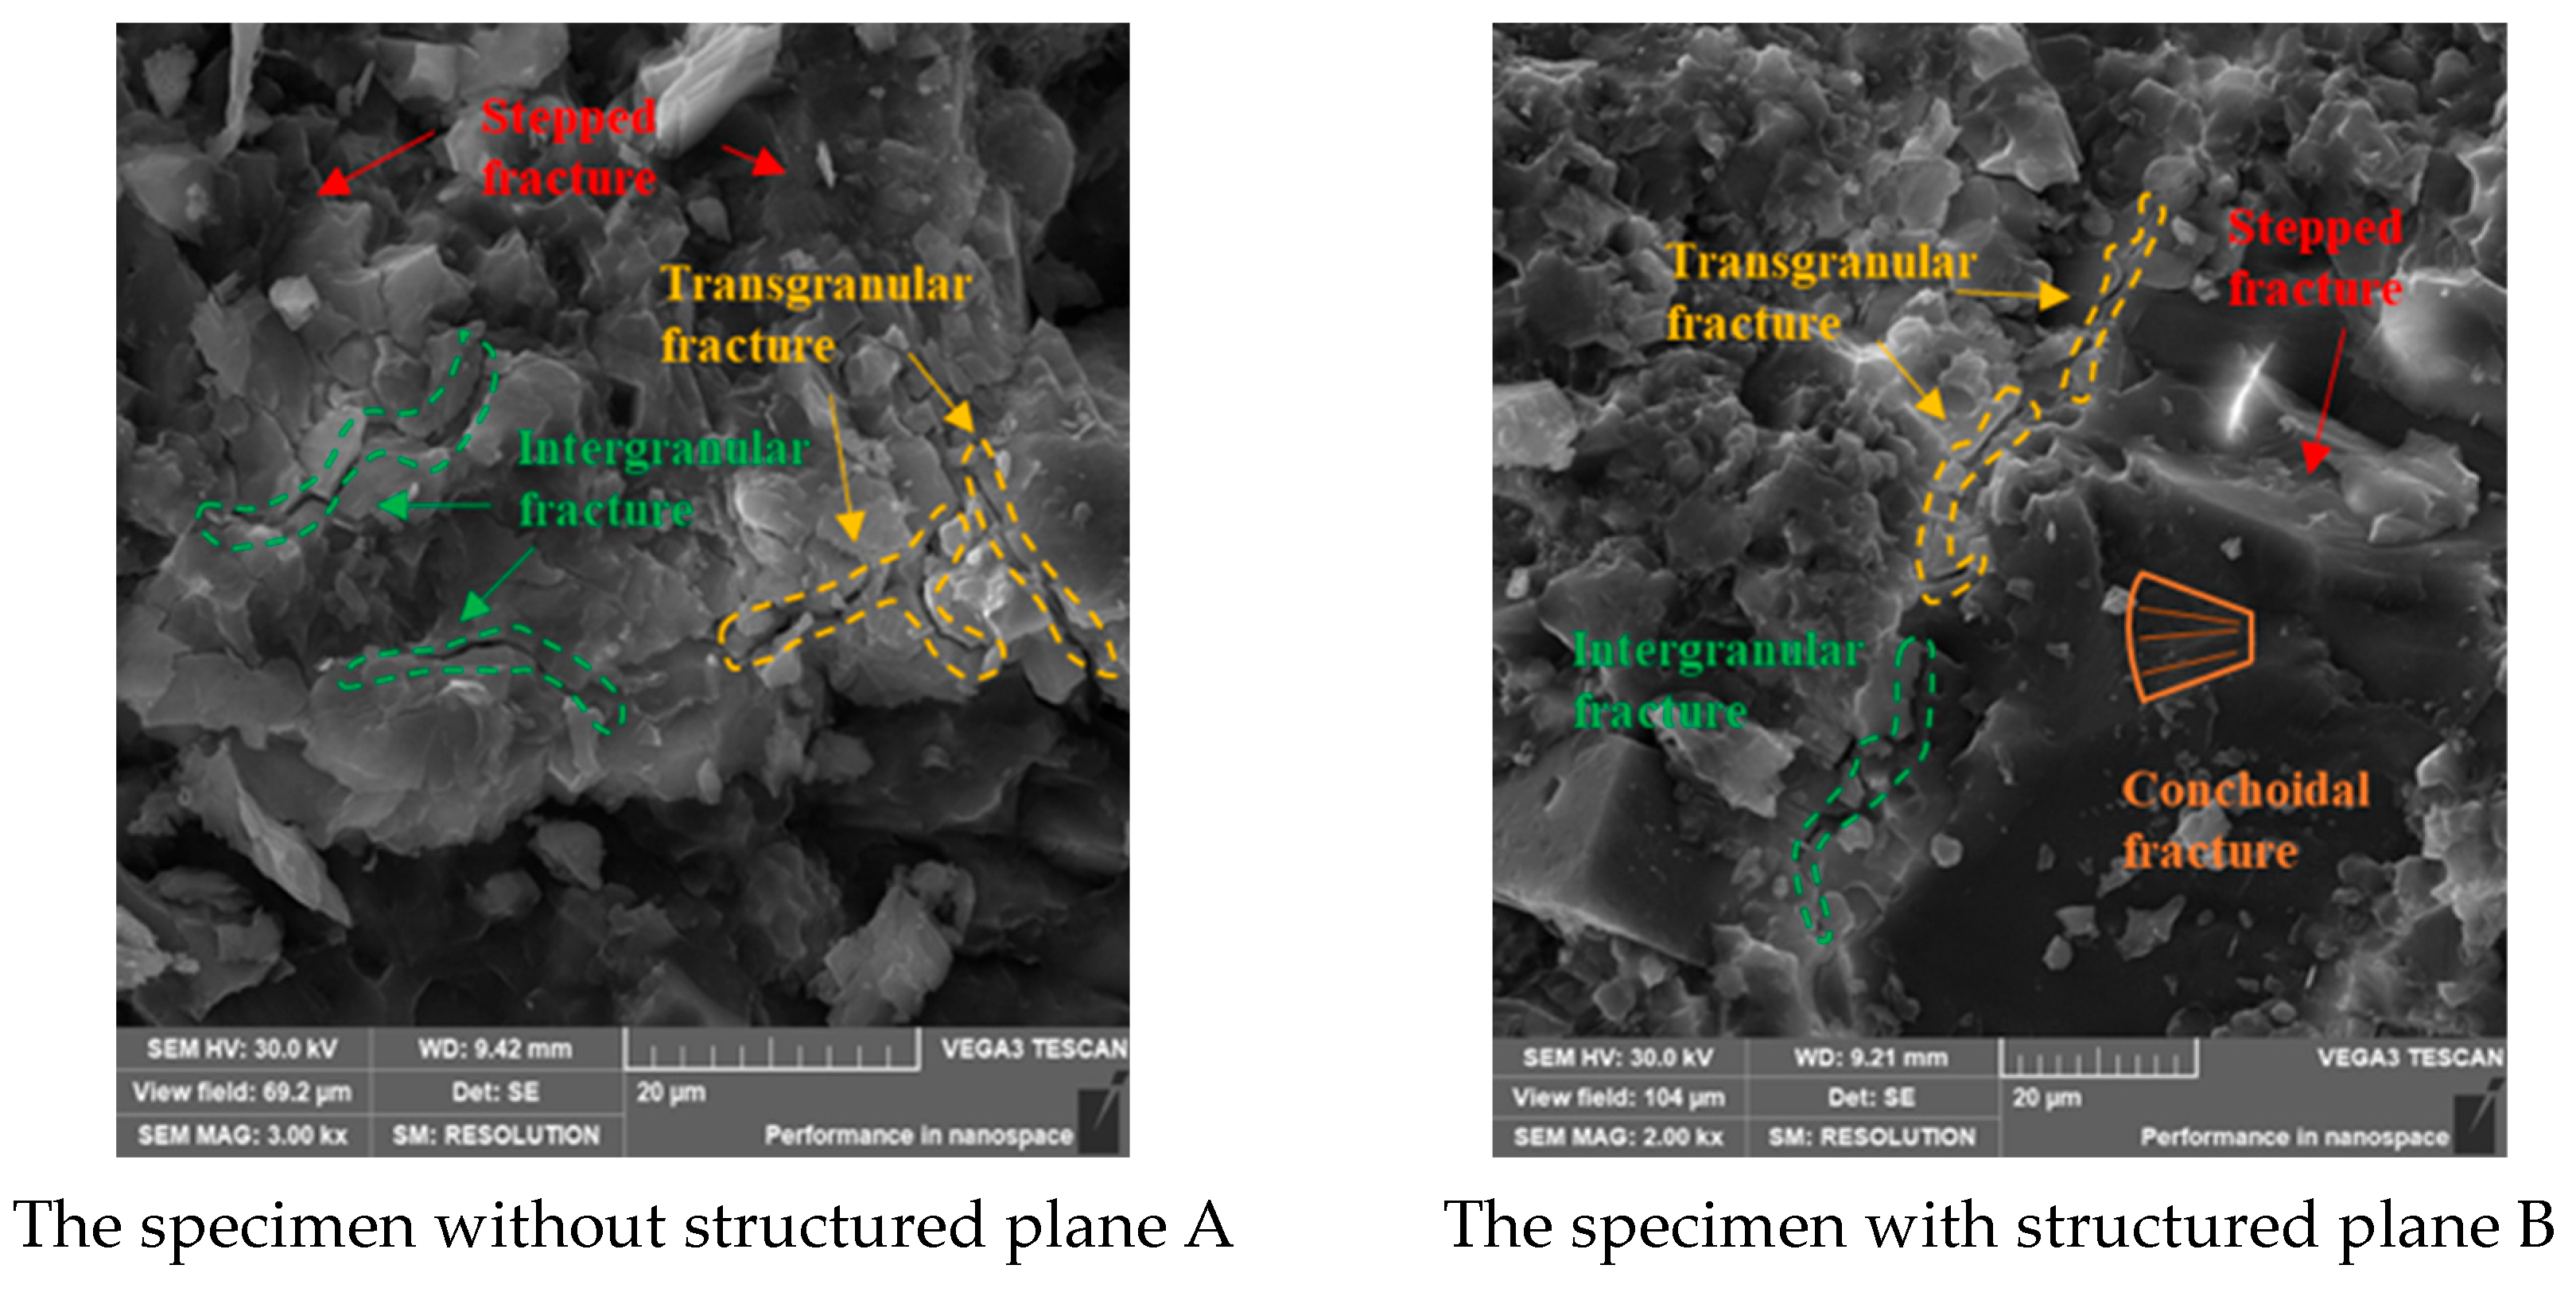
Figure 10, the fracture morphology of the specimens is highly complex, characterized by transgranular cracks, intergranular cracks, step-like cracks, and shell-like cracks. Fracture zones composed of multiple transgranular cracks can be observed in the figure, indicating that a series of tensile cracks induced severe damage and energy release during the rockburst process, which suggests that tensile failure may play an important role in rockburst. All four types of cracks were identified in Specimen B, indicating a more complex rockburst process and further suggesting that increasingly complex crack patterns may have a significant influence on the failure mechanism. On the other hand, regions with different brightness levels were observed in both specimens. Since density is positively correlated with regional brightness, mineral stiffness can be inferred from the density contrast. The presence of minerals with different stiffnesses reflects the local heterogeneity of the limestone. Such heterogeneity may lead to local stress redistribution, intensify stress concentration, and trigger localized fracturing. This localized strain-induced failure may, in turn, promote the occurrence of rockburst.
3.5. Comparison of Rockburst Test Characteristics with Actual Engineering Conditions
To further validate the feasibility of conducting true triaxial simulation tests on in situ structural plane rock masses, the rockburst patterns observed during the true triaxial compression test—including borehole wall failure mechanisms, rockburst pit characteristics, and debris ejection states—were compared with actual engineering scenarios.
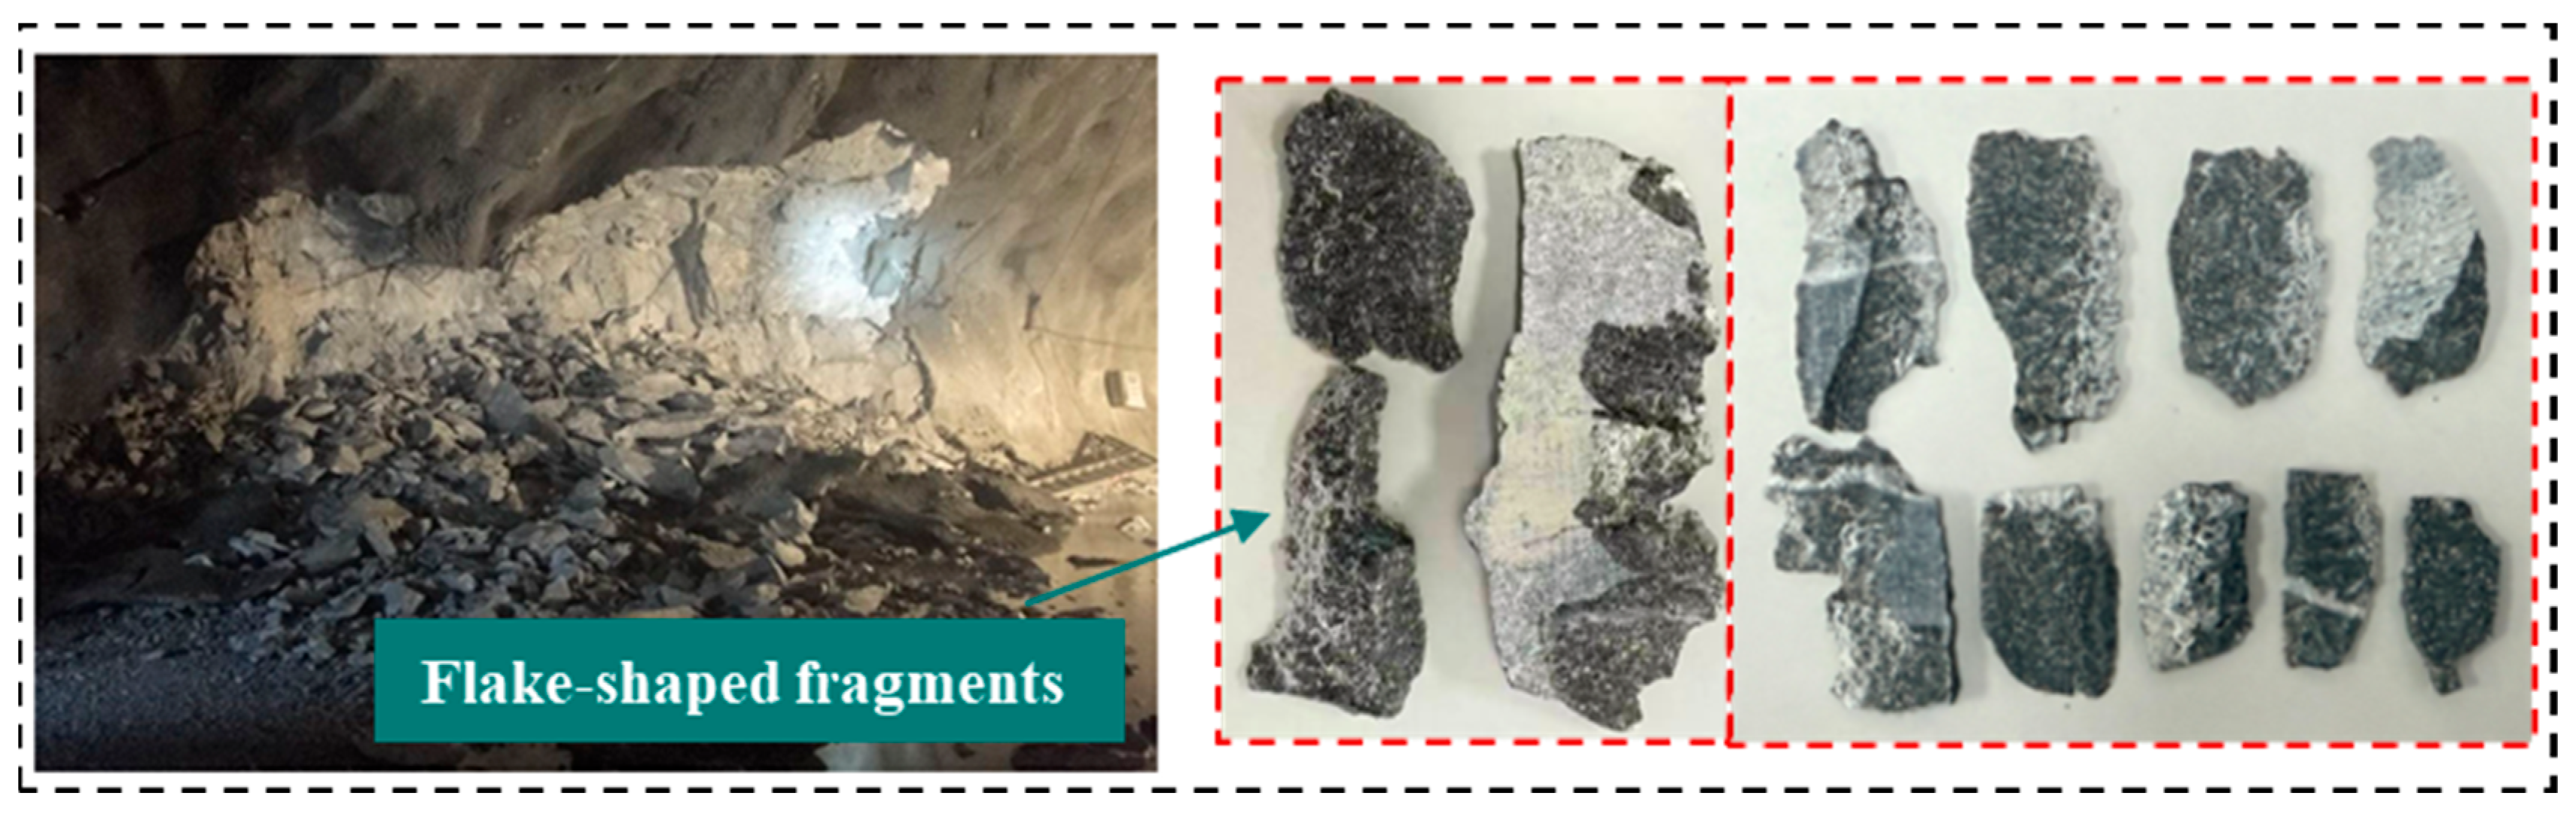
As shown in
Figure 11, a delayed moderate rockburst occurred on the north sidewall of the 1-1-E section between Piles K8 + 940 and K + 8 + 948 at Jinping on 1 December 2010 [
28]. The blast was accompanied by a loud explosion, with rock fragments ejected approximately 8 m from the sidewall toward the tunnel center. These fragments exhibited varying sizes and predominantly layered shapes. This pattern aligns closely with the characteristics of fragments formed during the test—thicker in the center and thinner at the sides—resulting from tensile and shear forces. Consequently, the rockburst fragments generated in this true triaxial rockburst test closely resemble those observed in actual engineering rockbursts.
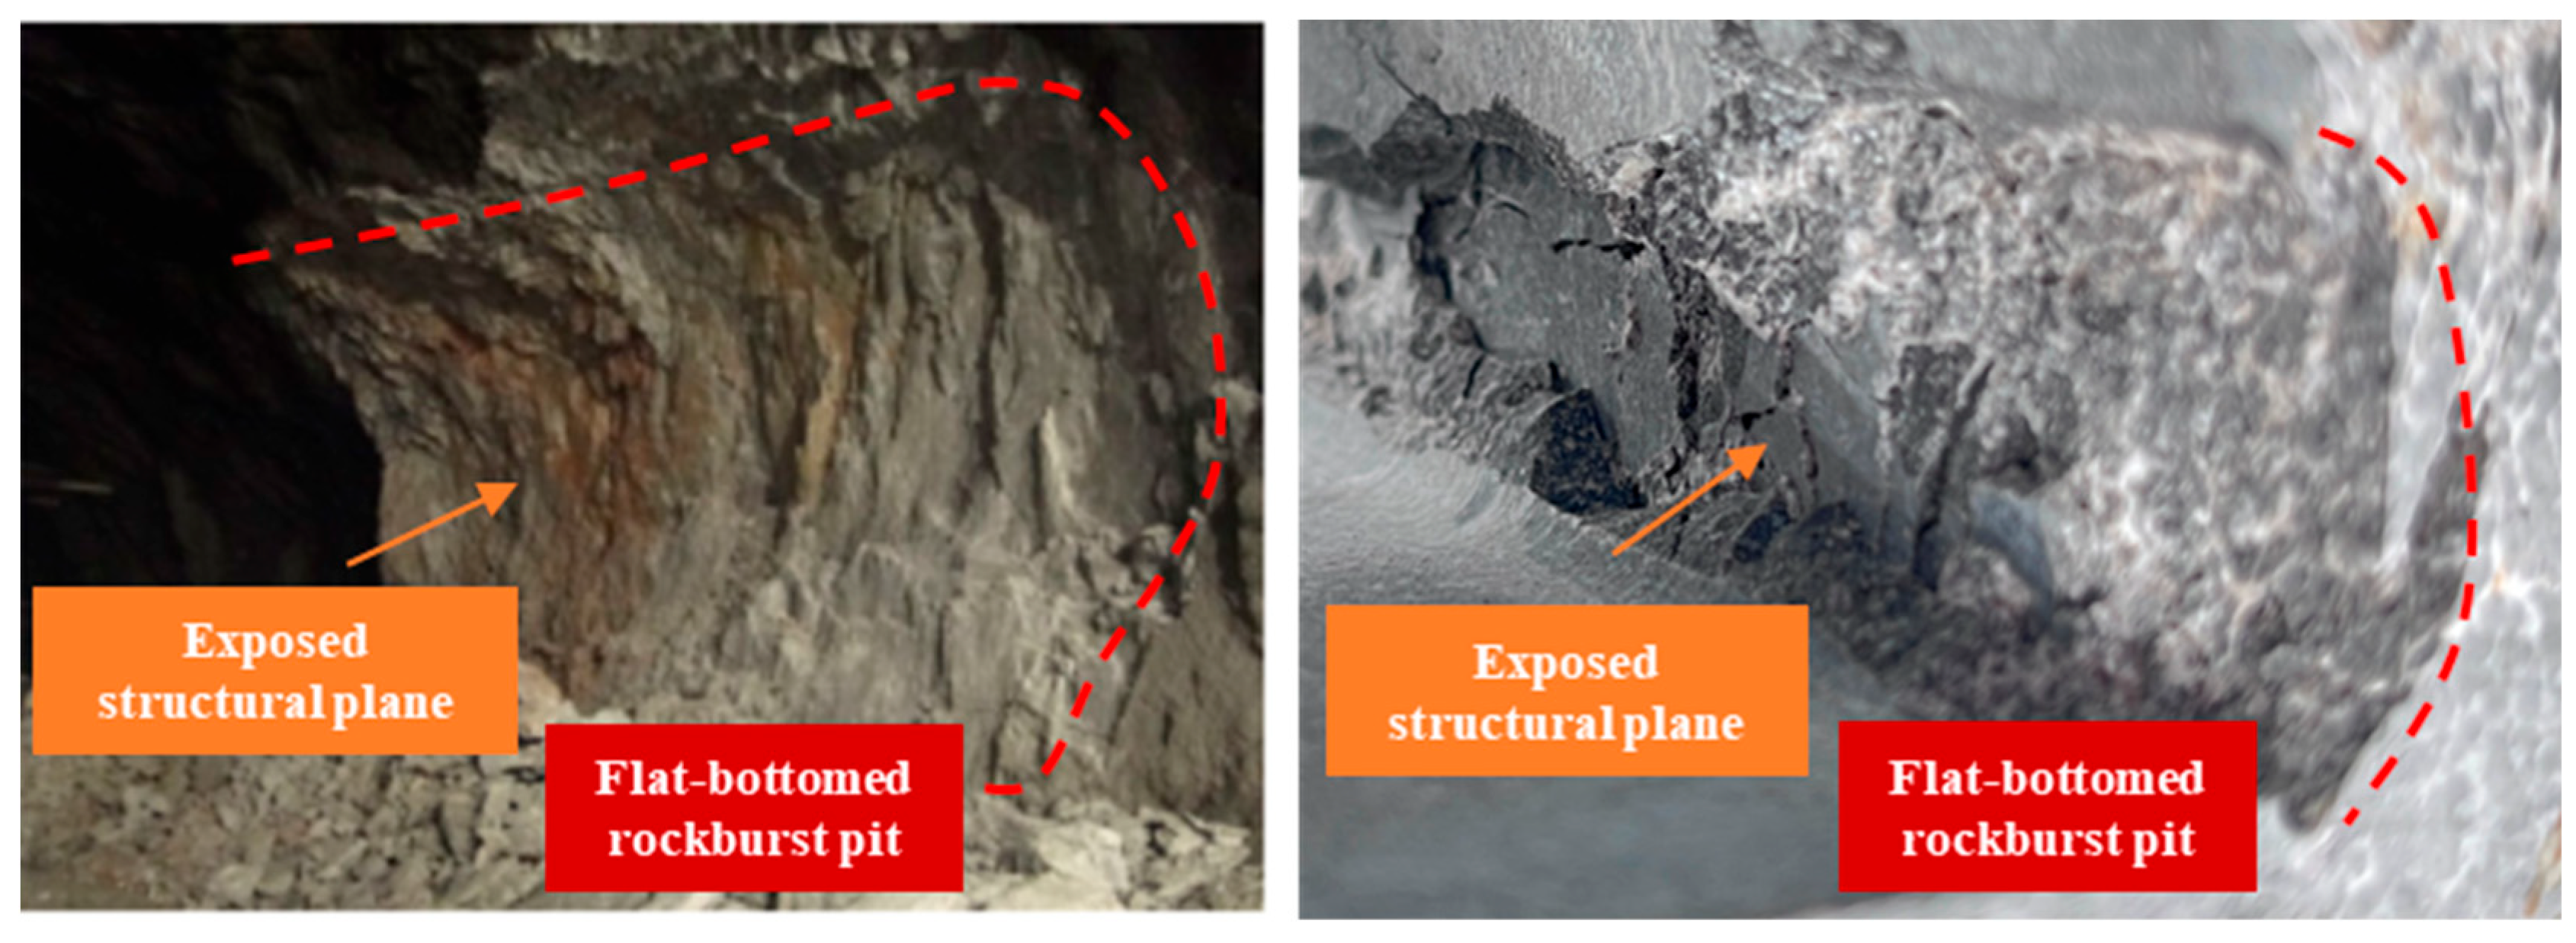
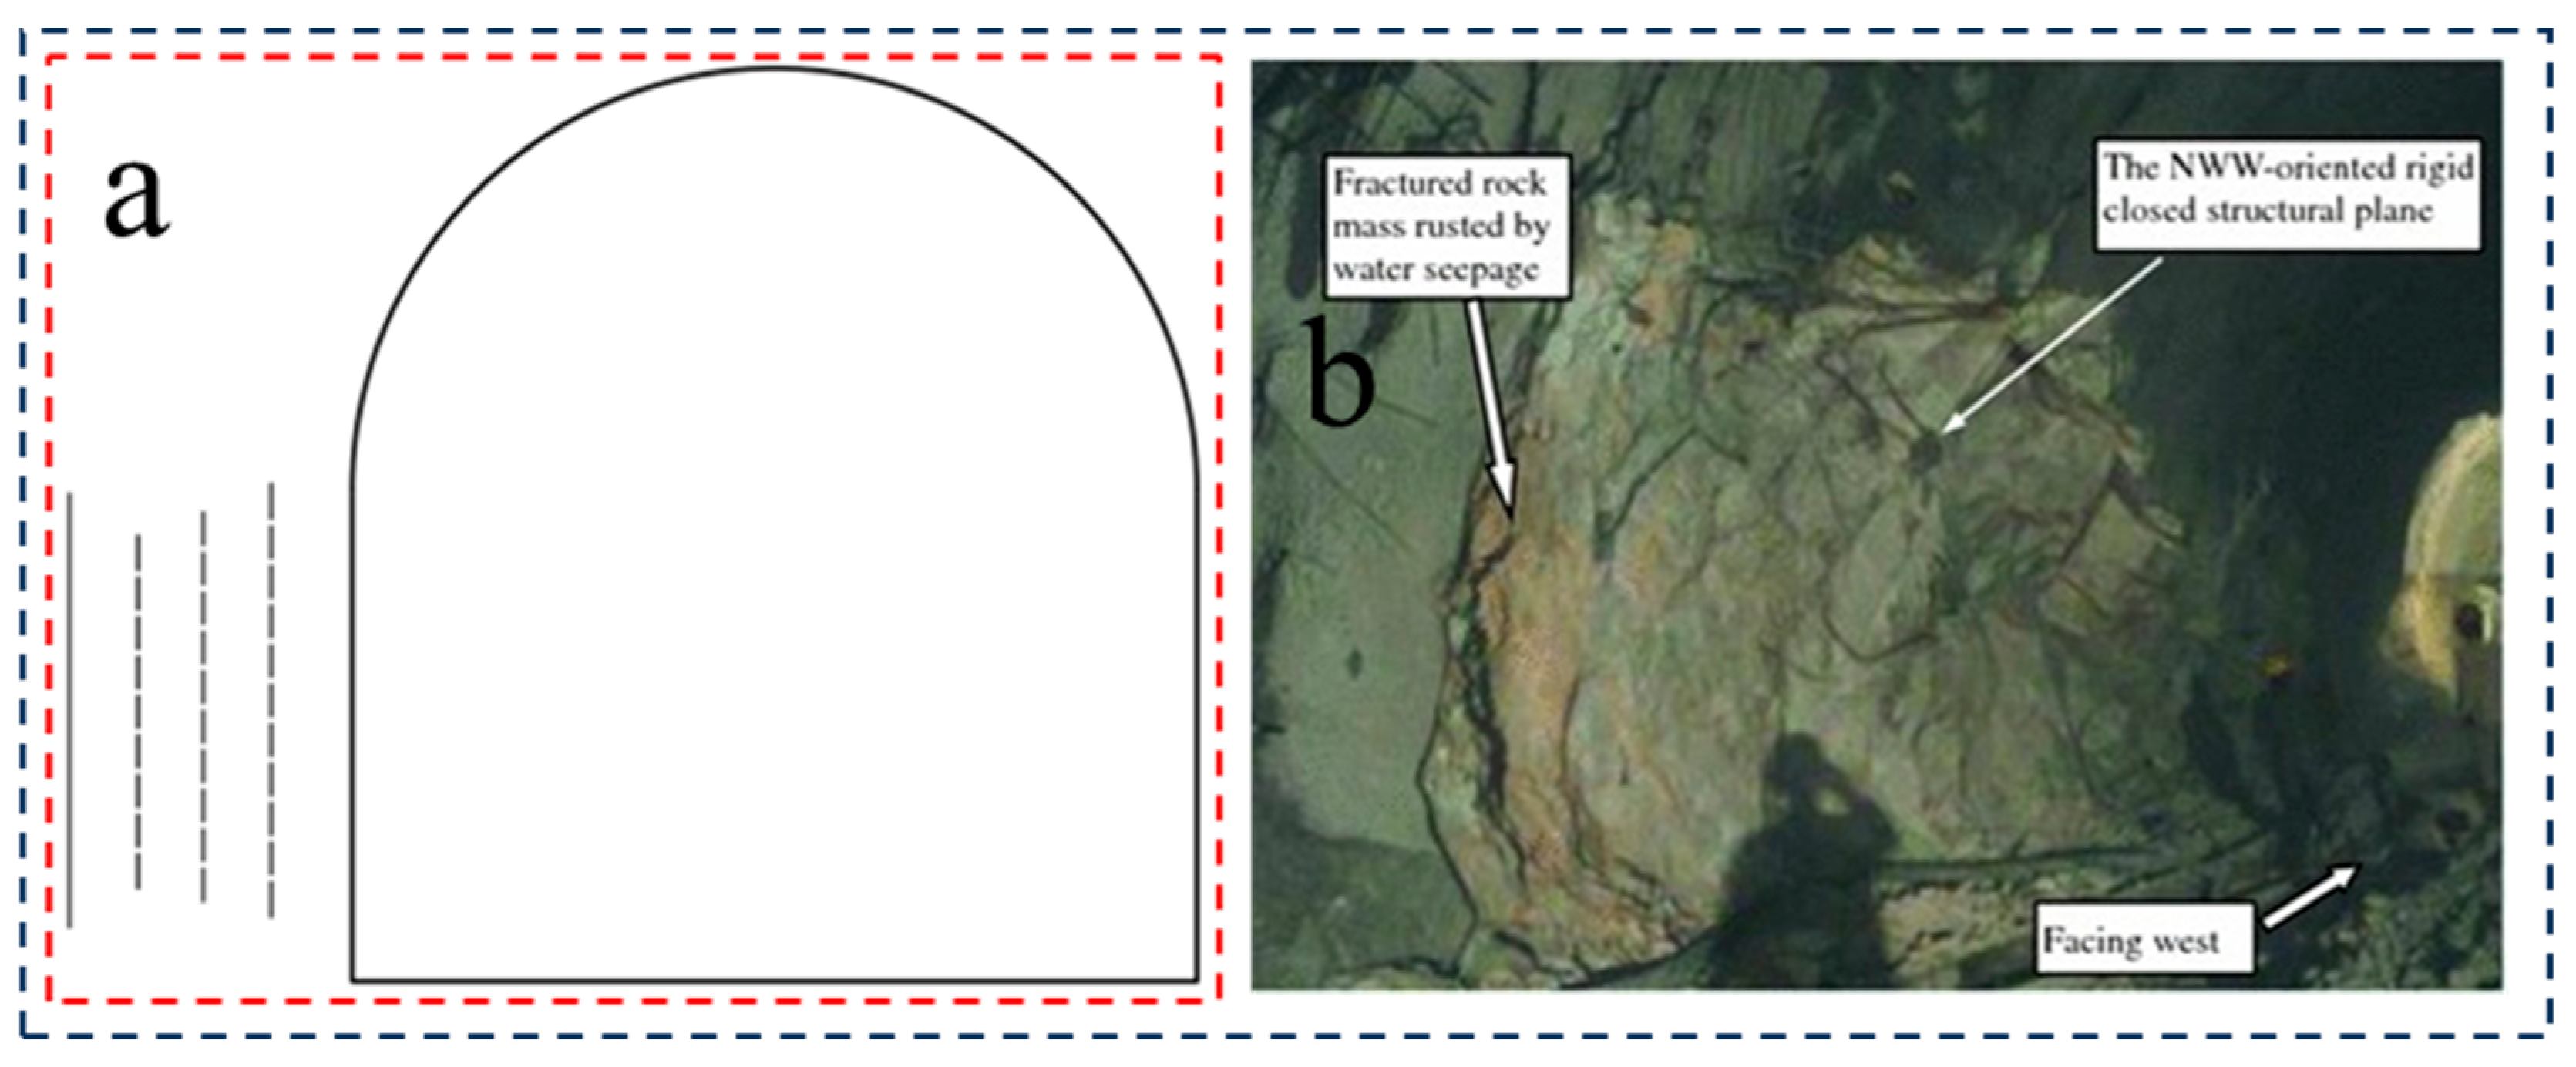
Figure 12 shows a rockburst that suddenly occurred at Stake K8+805–815 of the Jinping No. 2 diversion tunnel on 23 February 2011, triggered by blasting disturbance at the working face. The blast pit reached a depth of approximately 0.6 m and exhibited a pan-like shape. Distinct iron-manganese staining traces on structural planes were visible at the bottom of the pit [
4]. This closely resembles the “frying pan-shaped” blast pit formed after the failure of Test Piece B with exposed structural planes. Moreover, dense vertical cracks were observable on the exposed structural planes. This phenomenon arises from the presence of weak layers. When these weak layers fail and connect with the tunnel, the newly exposed surface undergoes a secondary stress adjustment before further failure. During the continuous tangential stress concentration and secondary stress adjustment process, vertical cracks continuously develop on the exposed structural plane. The test results are fundamentally consistent with the structural plane rockburst phenomena observed in actual operations.
3.6. Evolutionary Characteristics of Acoustic Emission
Acoustic emission signals are transient elastic waves generated by localized rapid energy release within rock. They contain rich physical mechanical properties and damage characteristics. Waveform time-domain analysis and frequency-domain spectral analysis are two crucial methods for processing acoustic emission signals. Time-domain feature analysis methods determine thresholds to extract characteristic parameters such as amplitude, rise time, energy, ringing, and duration from waveforms. Quantifying these parameters provides insights into rock fracture behavior and damage severity [
28]. Frequency-domain spectral analysis methods utilize FFT or its variants to transform signals from the time domain to the frequency domain. Analyzing the frequency-domain characteristics of signals enables a deeper understanding of rock failure mechanisms.
3.6.1. AE Hit Counts
To better investigate internal damage in rocks during true triaxial tests and accurately characterize their microfracture patterns, an acoustic emission (AE) monitoring system was employed to evaluate the entire testing process. The evolution characteristics of acoustic emission impacts associated with rockbursts in straight-wall arch tunnel rock masses, both with and without structural planes, were analyzed. This is crucial for understanding the formation and evolution mechanisms of rockbursts in rock masses with structural planes within straight-wall arch tunnels.
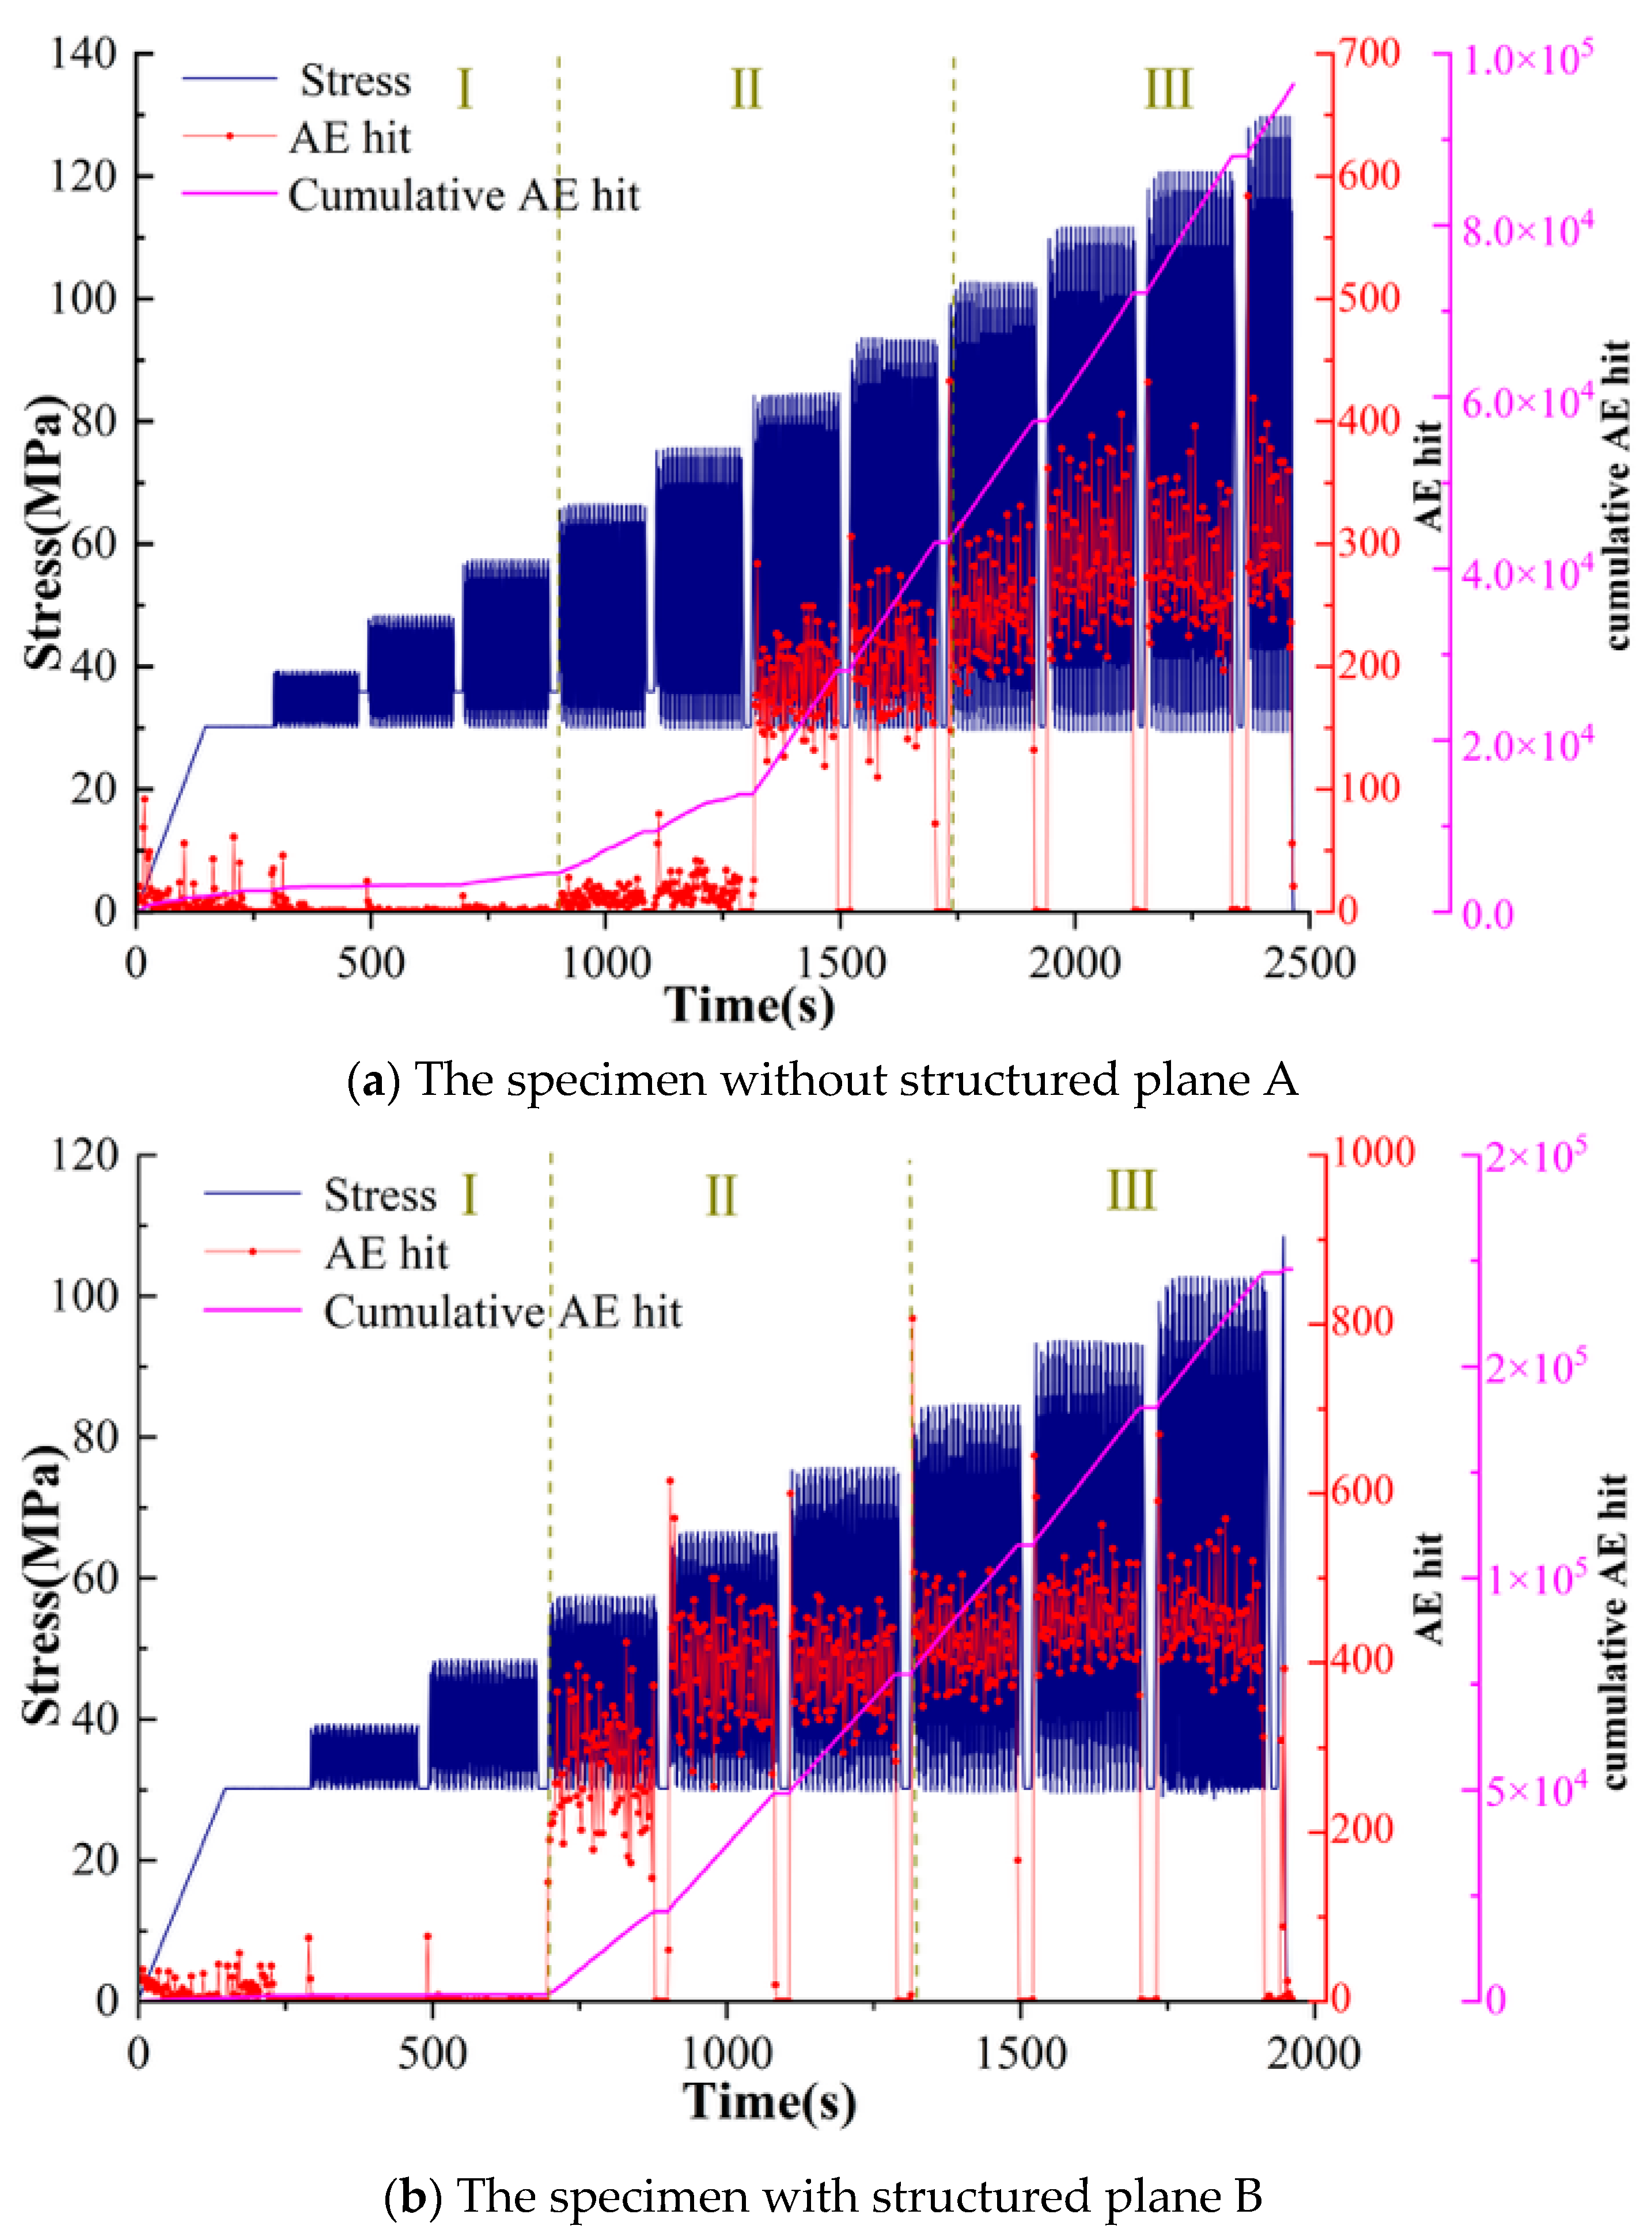
The number of acoustic emission impacts is directly proportional to the number of cracks, thus serving as an indicator of internal damage within rock. Based on data collected from true triaxial tests, the relationship between AE impact count, cumulative impact count, stress, and loading time for two specimen types is plotted in
Figure 13. According to the evolution pattern of AE, the entire process is divided into three distinct stages:
(1) Stage I: Microcrack Closure and Linear Elastic Stage. As the specimen enters the initial loading phase, internal defects and microcracks are compressed. Under external loading, the specimen enters the linear elastic stage. Due to the low disturbance gradient stress level during this stage, the AE impact count remains stable without significant increase.
(2) Stage II: Crack Initiation and Stable Propagation Stage. With the continuous application of disturbance gradients, microcracks within the specimen begin to form, propagate, and permeate, leading to the onset of plate crack buckling on the arch wall. Notably, starting from Stage II, the AE impact count shows a marked increase, and AE activity progressively intensifies.
(3) Stage III: Microcrack Unstable Development to Rockburst Occurrence. As the disturbance load progressively increases, microcracks continuously form and propagate within the specimen, leading to macroscopic failures such as rock spalling, plate cracking, and buckling failure. AE activity becomes exceptionally intense, peaking at the moment of rockburst occurrence.
Comparative analysis of the AE impact count evolution characteristics between Specimen A and Specimen B indicates that impact counts are closely correlated with the disturbance load gradient. The peak impact counts for both specimens occurred when the disturbance gradient began to rise, and overall, AE impact counts increased as the disturbance gradient increased. Specimen B exhibited crack initiation and stable propagation earlier than Specimen A. Furthermore, compared to Specimen B, the intact Specimen A without structural planes required a longer time to reach the maximum number of impacts and achieved a higher stress intensity. Consequently, it can be inferred that the presence of structural planes influenced the stress propagation pathways, causing disturbance loads to concentrate earlier at the structural planes. This resulted in reduced overall specimen strength and the earlier occurrence of rockburst.
3.6.2. Evolutionary Characteristics of Cumulative Absolute Energy in AE
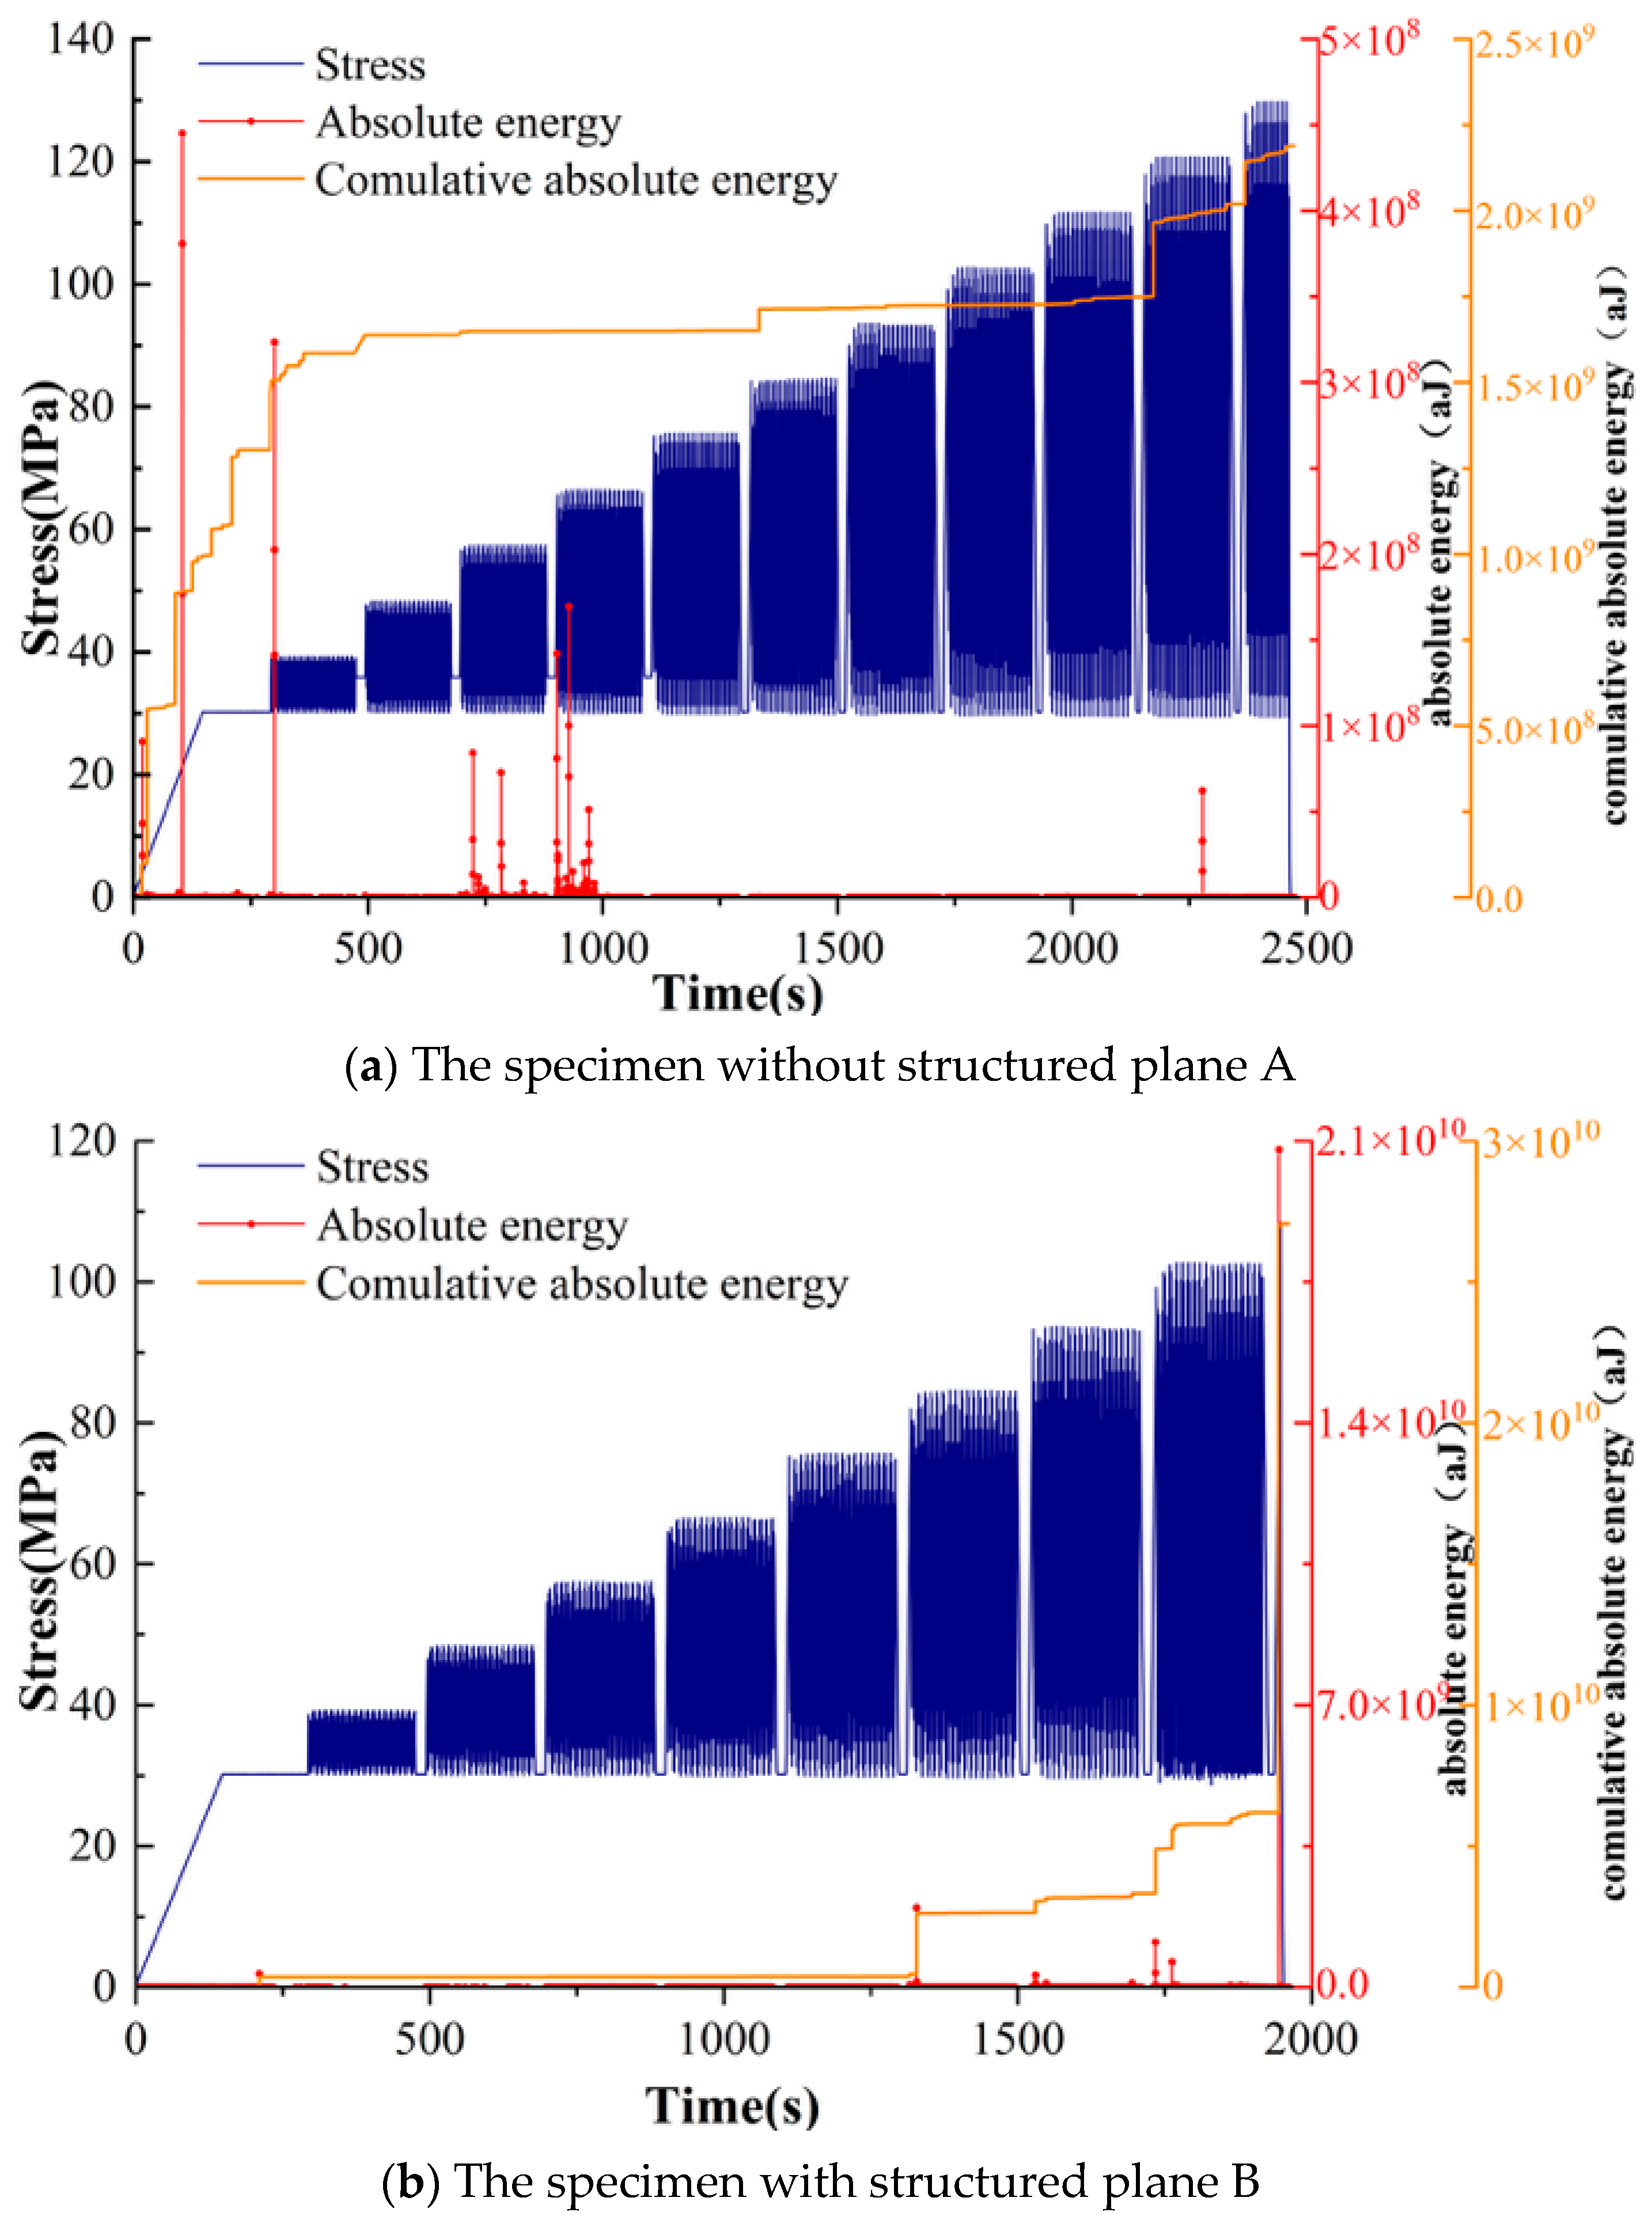
The absolute energy of acoustic emission can be used to determine the energy released during the formation, propagation, and penetration of microcracks in rock failure processes. As shown in
Figure 14, the relationships between the absolute energy, cumulative absolute energy, stress, and time for the two specimens are depicted. The cumulative absolute energy of both specimens exhibited distinct accumulation rates across different time periods in response to disturbance loads: Specimen A showed a minor early-stage jump in cumulative absolute energy, followed by significant stepwise increases in the middle and late stages, indicating a dispersed energy release process. Specimen B displayed very low early-stage cumulative absolute energy values, followed by a sharp late-stage surge characterized by a pronounced L-shaped jump, with the most significant instantaneous rockburst amplitude and a concentrated energy release process. Therefore, the magnitude of the jump in cumulative absolute energy during the mid-to-late stages better reflects the specimen’s rockburst intensity. Notably, each distinct jump in cumulative absolute energy occurred due to increased disturbance amplitude, causing rapid crack propagation. Regions with high AE absolute energy values corresponded to the moment when disturbance gradients began to rise, with cumulative AE absolute energy showing a sustained upward trend. Specimen energy was rapidly released, triggering rockbursts. Specimen A exhibited a cumulative absolute energy of 2.19 × 10
9 aJ, while Specimen B recorded 2.70 × 10
10 aJ, with Specimen B’s cumulative absolute energy significantly exceeding that of Specimen A. Consistent with the rockburst evolution processes of both specimens, both the evolution trajectory and cumulative absolute energy data indicate that Specimen B, containing a structural plane, experienced a more intense rockburst and released greater energy.
3.6.3. RA-AF Distribution Characteristics
In the field of rockburst research, delving into fracture patterns within rock masses is crucial for analyzing rock failure mechanisms. Under dynamic disturbance loads, primary rock failure modes include shear failure, tensile failure, and mixed modes. Shear cracks and tensile cracks exhibit distinct acoustic emission (AE) responses. Shear cracks typically exhibit longer rise times and lower frequencies, characterized by “high RA values and low AF values”. This phenomenon stems from the more gradual energy release process inherent in shear failure. Conversely, tensile cracks manifest shorter rise times and higher frequencies, presenting “low RA values and high AF values”. This is attributable to the instantaneous and violent energy release accompanying tensile failure.
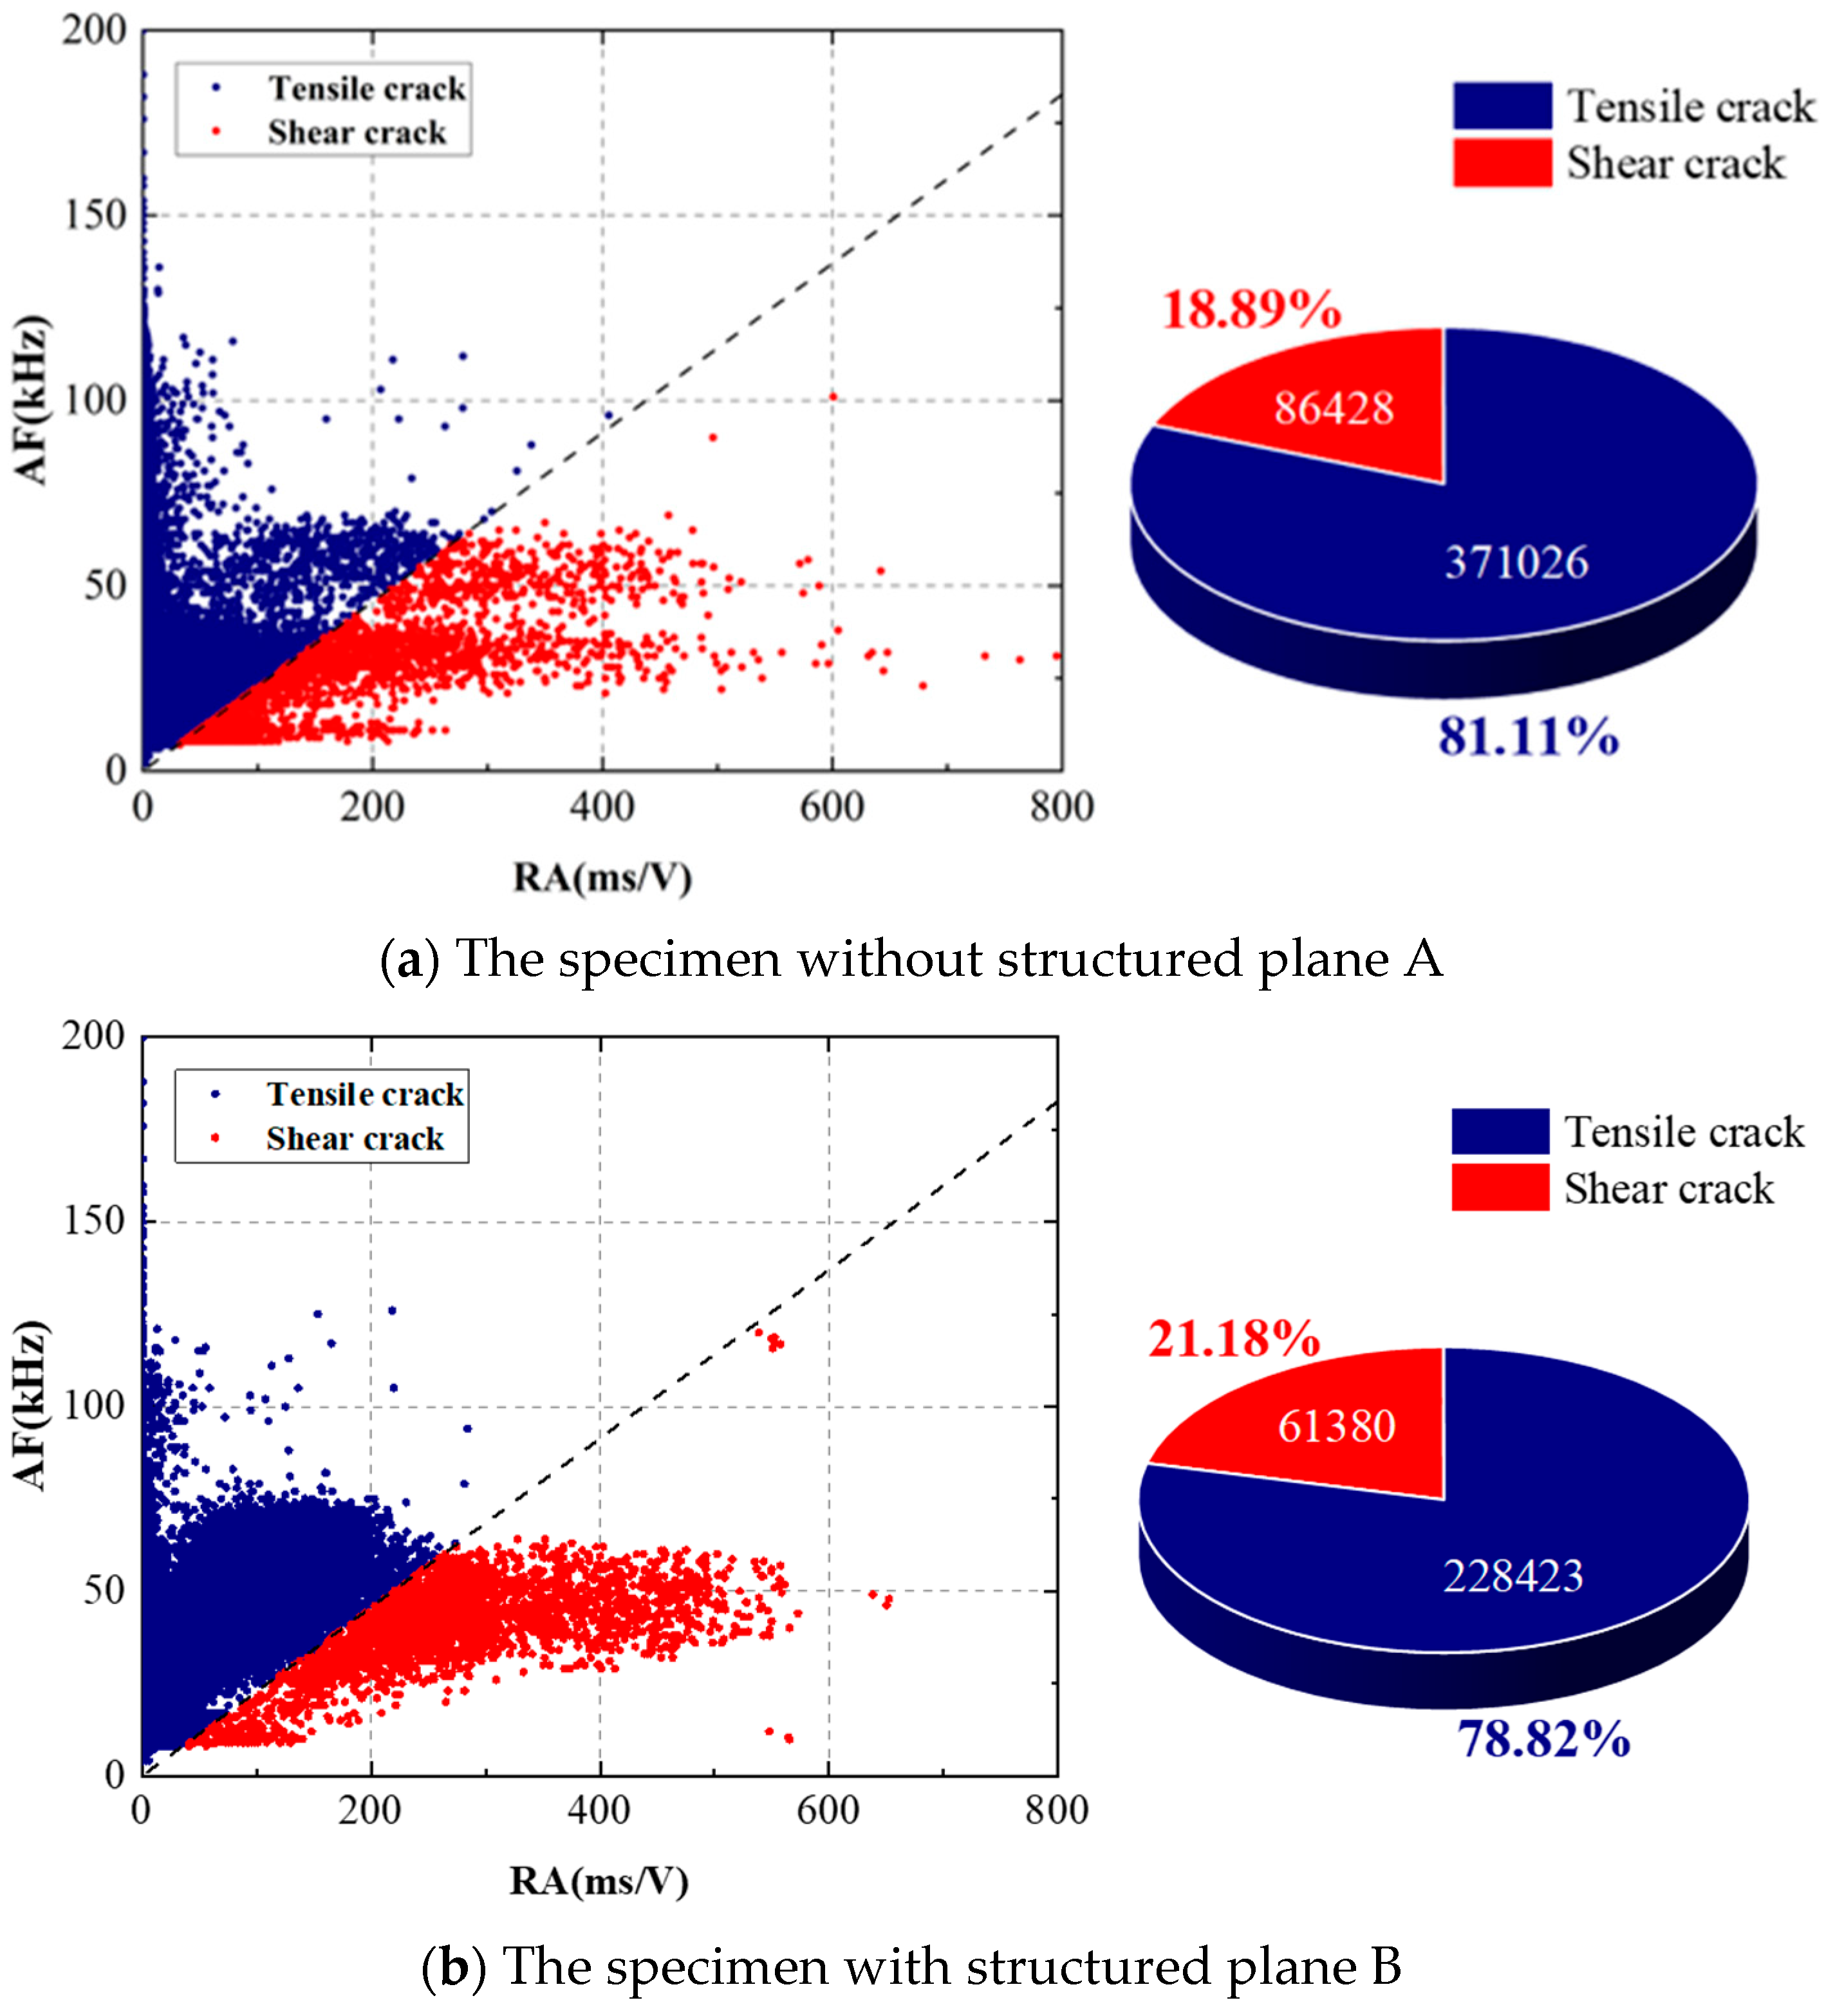
By obtaining the AF and RA values, we can define K as AF/RA, where K represents the slope of the boundary line used to classify crack types. The crack classification ratio was set to K = 4.38 [
20], with the region above the boundary line corresponding to the tensile cracking zone and the region below the boundary line associated with the shear cracking zone. As shown in
Figure 15, Specimen A without structural planes exhibited 371,026 tensile cracks (81.11%) and 86,428 shear cracks (18.89%). For Specimen B containing structural planes, the numbers of tensile and shear cracks were 228,423 (78.82%) and 61,380 (21.18%), respectively. In addition, the total number of cracks in Specimen B was significantly lower than that in Specimen A. This is mainly because the presence of structural planes reduced the bearing capacity of the rock mass to some extent; as the strength of the structural plane decreased, the frequency of crack propagation correspondingly declined. Meanwhile, the RA distribution range of Specimen A was larger than that of Specimen B, indicating that the presence of structural planes tends to localize crack generation and thereby alters the rockburst failure characteristics. Moreover, the proportion of shear cracks in Specimen A was 2.29% lower than that in Specimen B. This is because the presence of structural planes changes the original structure of the rock mass, thereby modifying the transmission path of disturbance stress, affecting the distribution of microscopic contact forces between particles, and ultimately influencing the fracture mode of the rock mass.
5. Conclusions
To investigate the mechanisms and influencing factors of rockburst occurrence in hard rock during deep underground engineering, true triaxial rockburst simulation tests were conducted on straight-wall arch limestone specimens with and without structural planes. The effects of structural planes on rockburst performance were monitored using high-speed cameras, acoustic emission systems, and SEM systems. A comparative analysis was conducted on the rockburst evolution process, damage mechanisms, and debris characteristics in straight-wall arch tunnel specimens with and without structural planes. PFC numerical simulations were employed to model rockburst evolution in tunnels with vertically oriented structural planes at varying spacings. The key conclusions are as follows:
(1) The evolution process of rockburst can be divided into four stages: the quiescent stage, the particle ejection stage, the crack initiation and propagation stage, and the overall damage stage. The presence of structural planes significantly alters the stress and energy transmission paths within the rock mass, leading to local stress concentration and thereby intensifying the impact severity of rockburst. The microscopic morphology of the ejected rock fragments also becomes more complex, exhibiting transgranular cracks, intergranular cracks, stepped cracks, and shell-like cracks, which reflect a complicated crack propagation pattern.
(2) Due to the weak layer between the structural plane and the tunnel, specimens containing structural planes exhibited greater rockburst intensity and larger overall crater size than intact specimens. The cumulative acoustic emission ringing counts and cumulative absolute energy of specimens with structural planes were also higher than those of intact specimens, indicating intense instantaneous high-amplitude acoustic emission activity. Meanwhile, the RA distribution range of intact specimens was significantly larger than that of specimens with structural planes, suggesting that the rock mass containing structural planes experienced more concentrated damage. In addition, throughout the entire loading process, the proportion of shear failure in specimens with structural planes was higher than that in intact specimens.
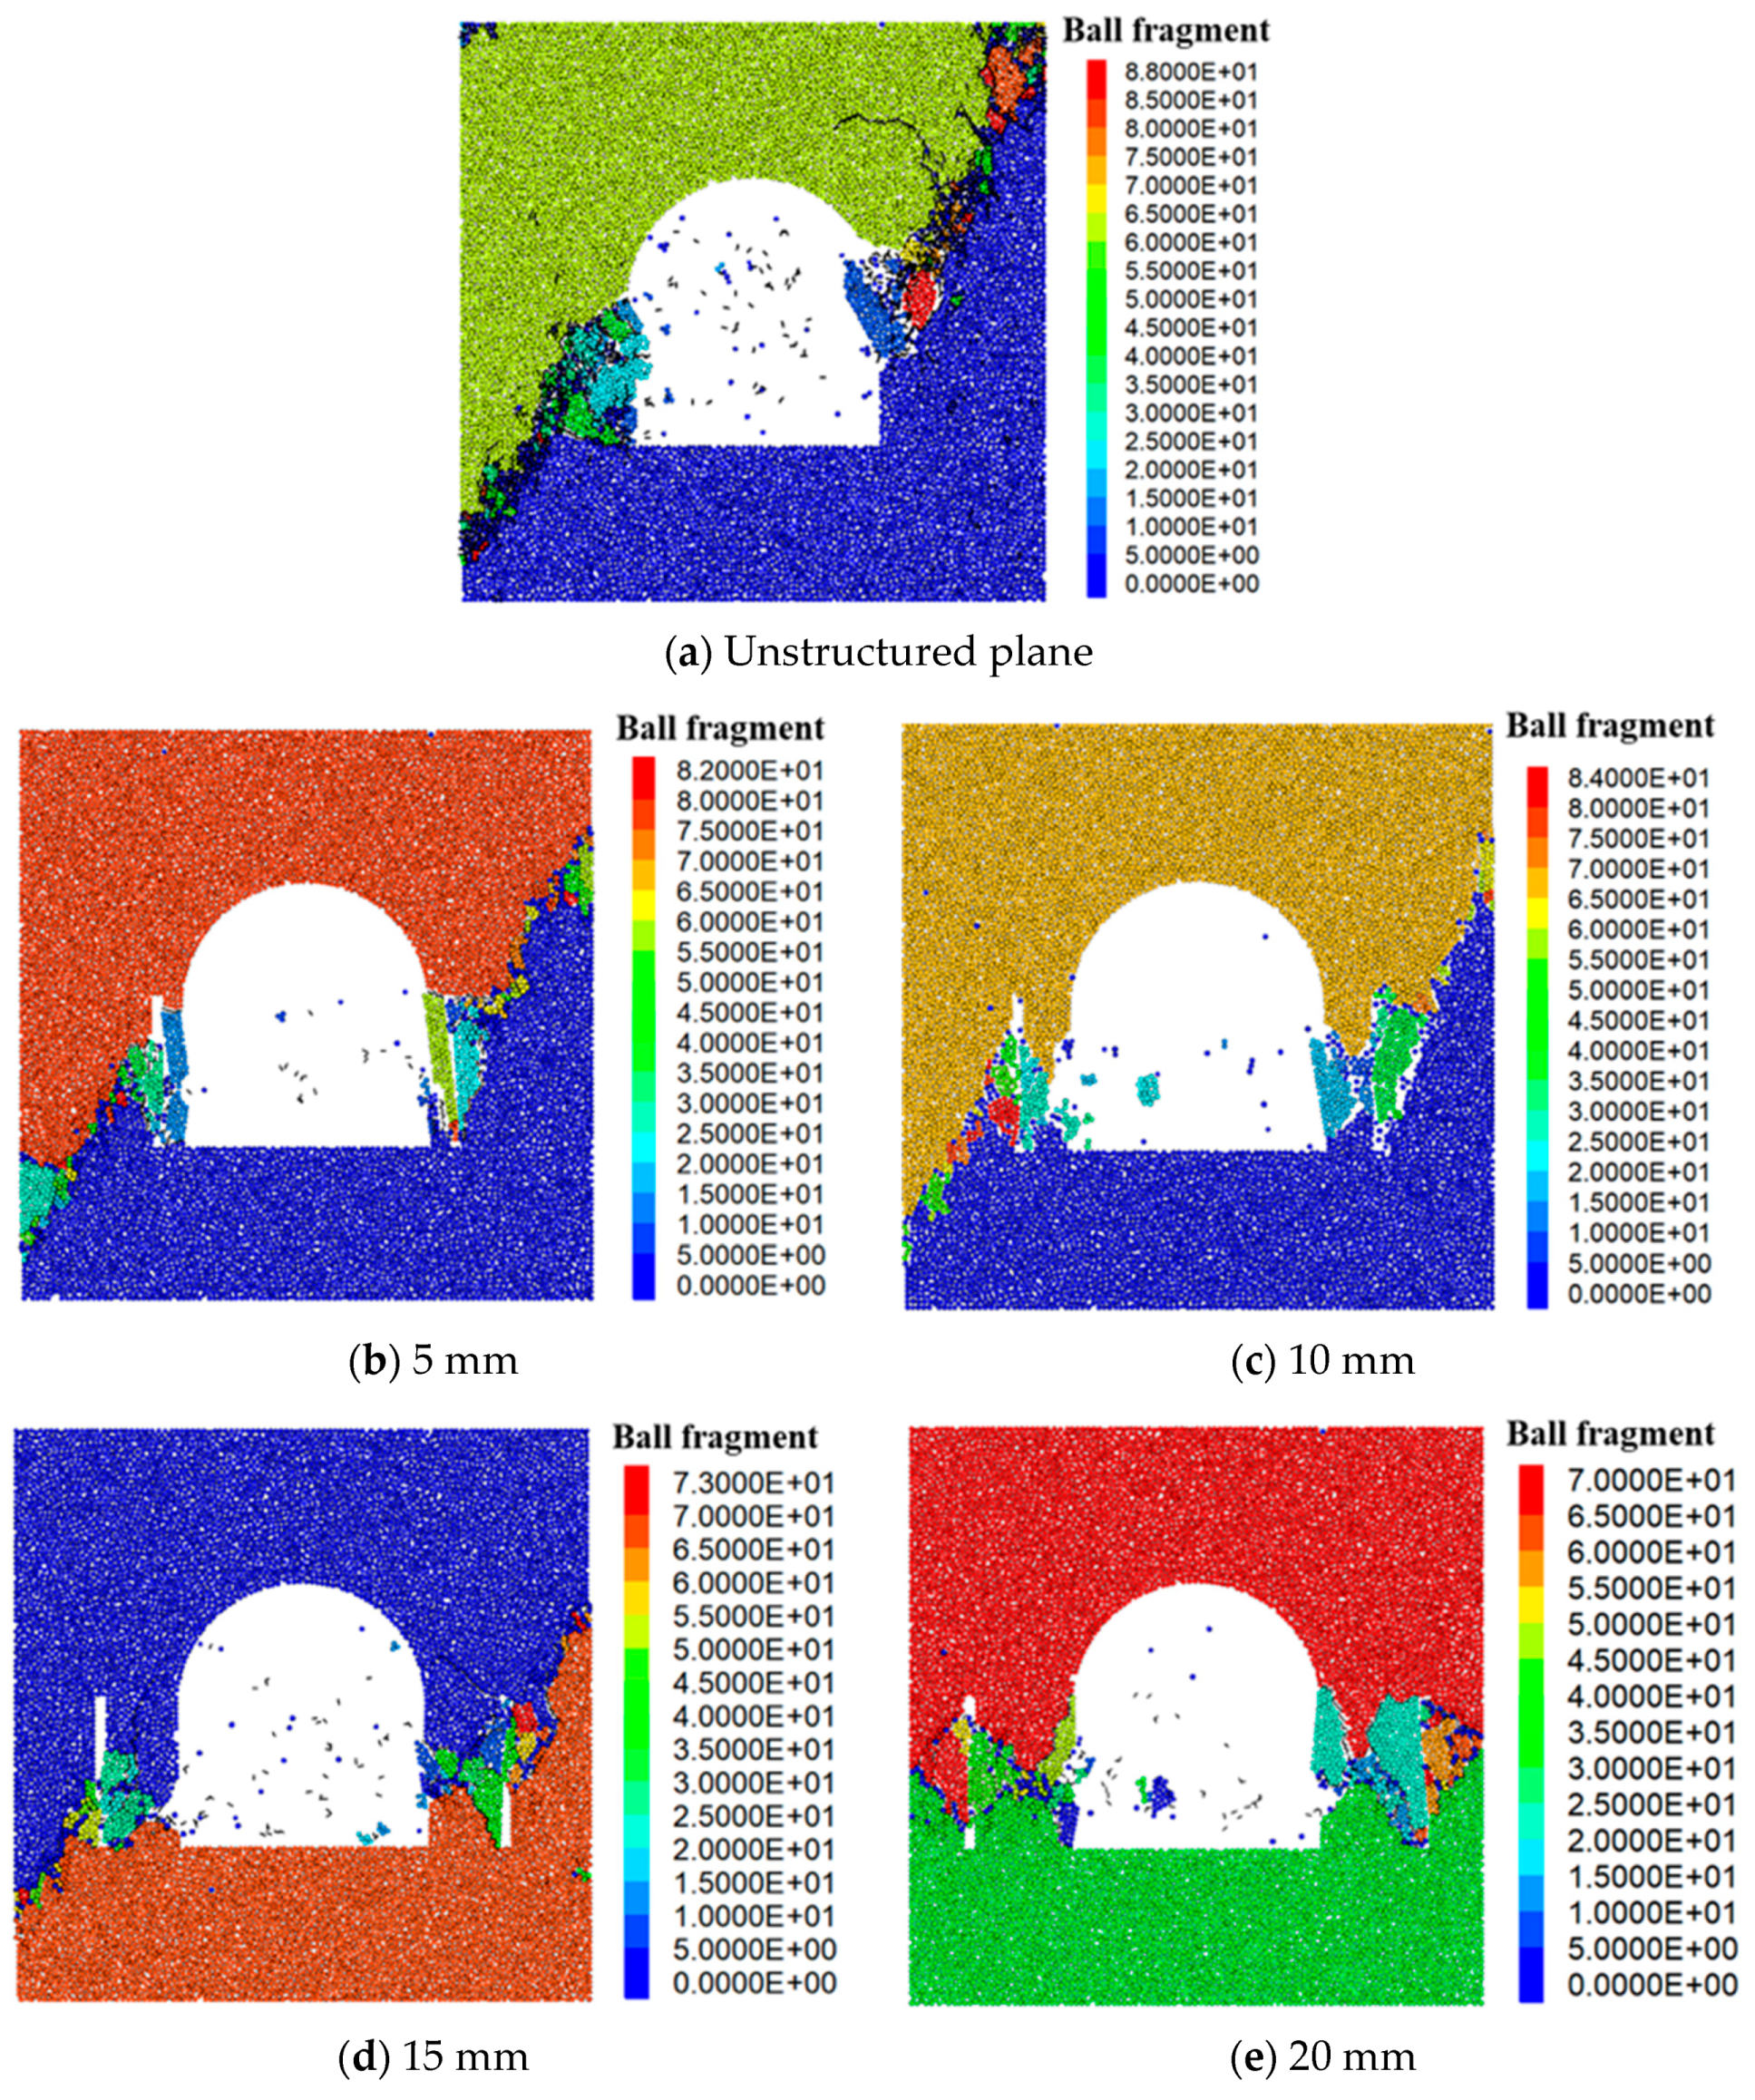
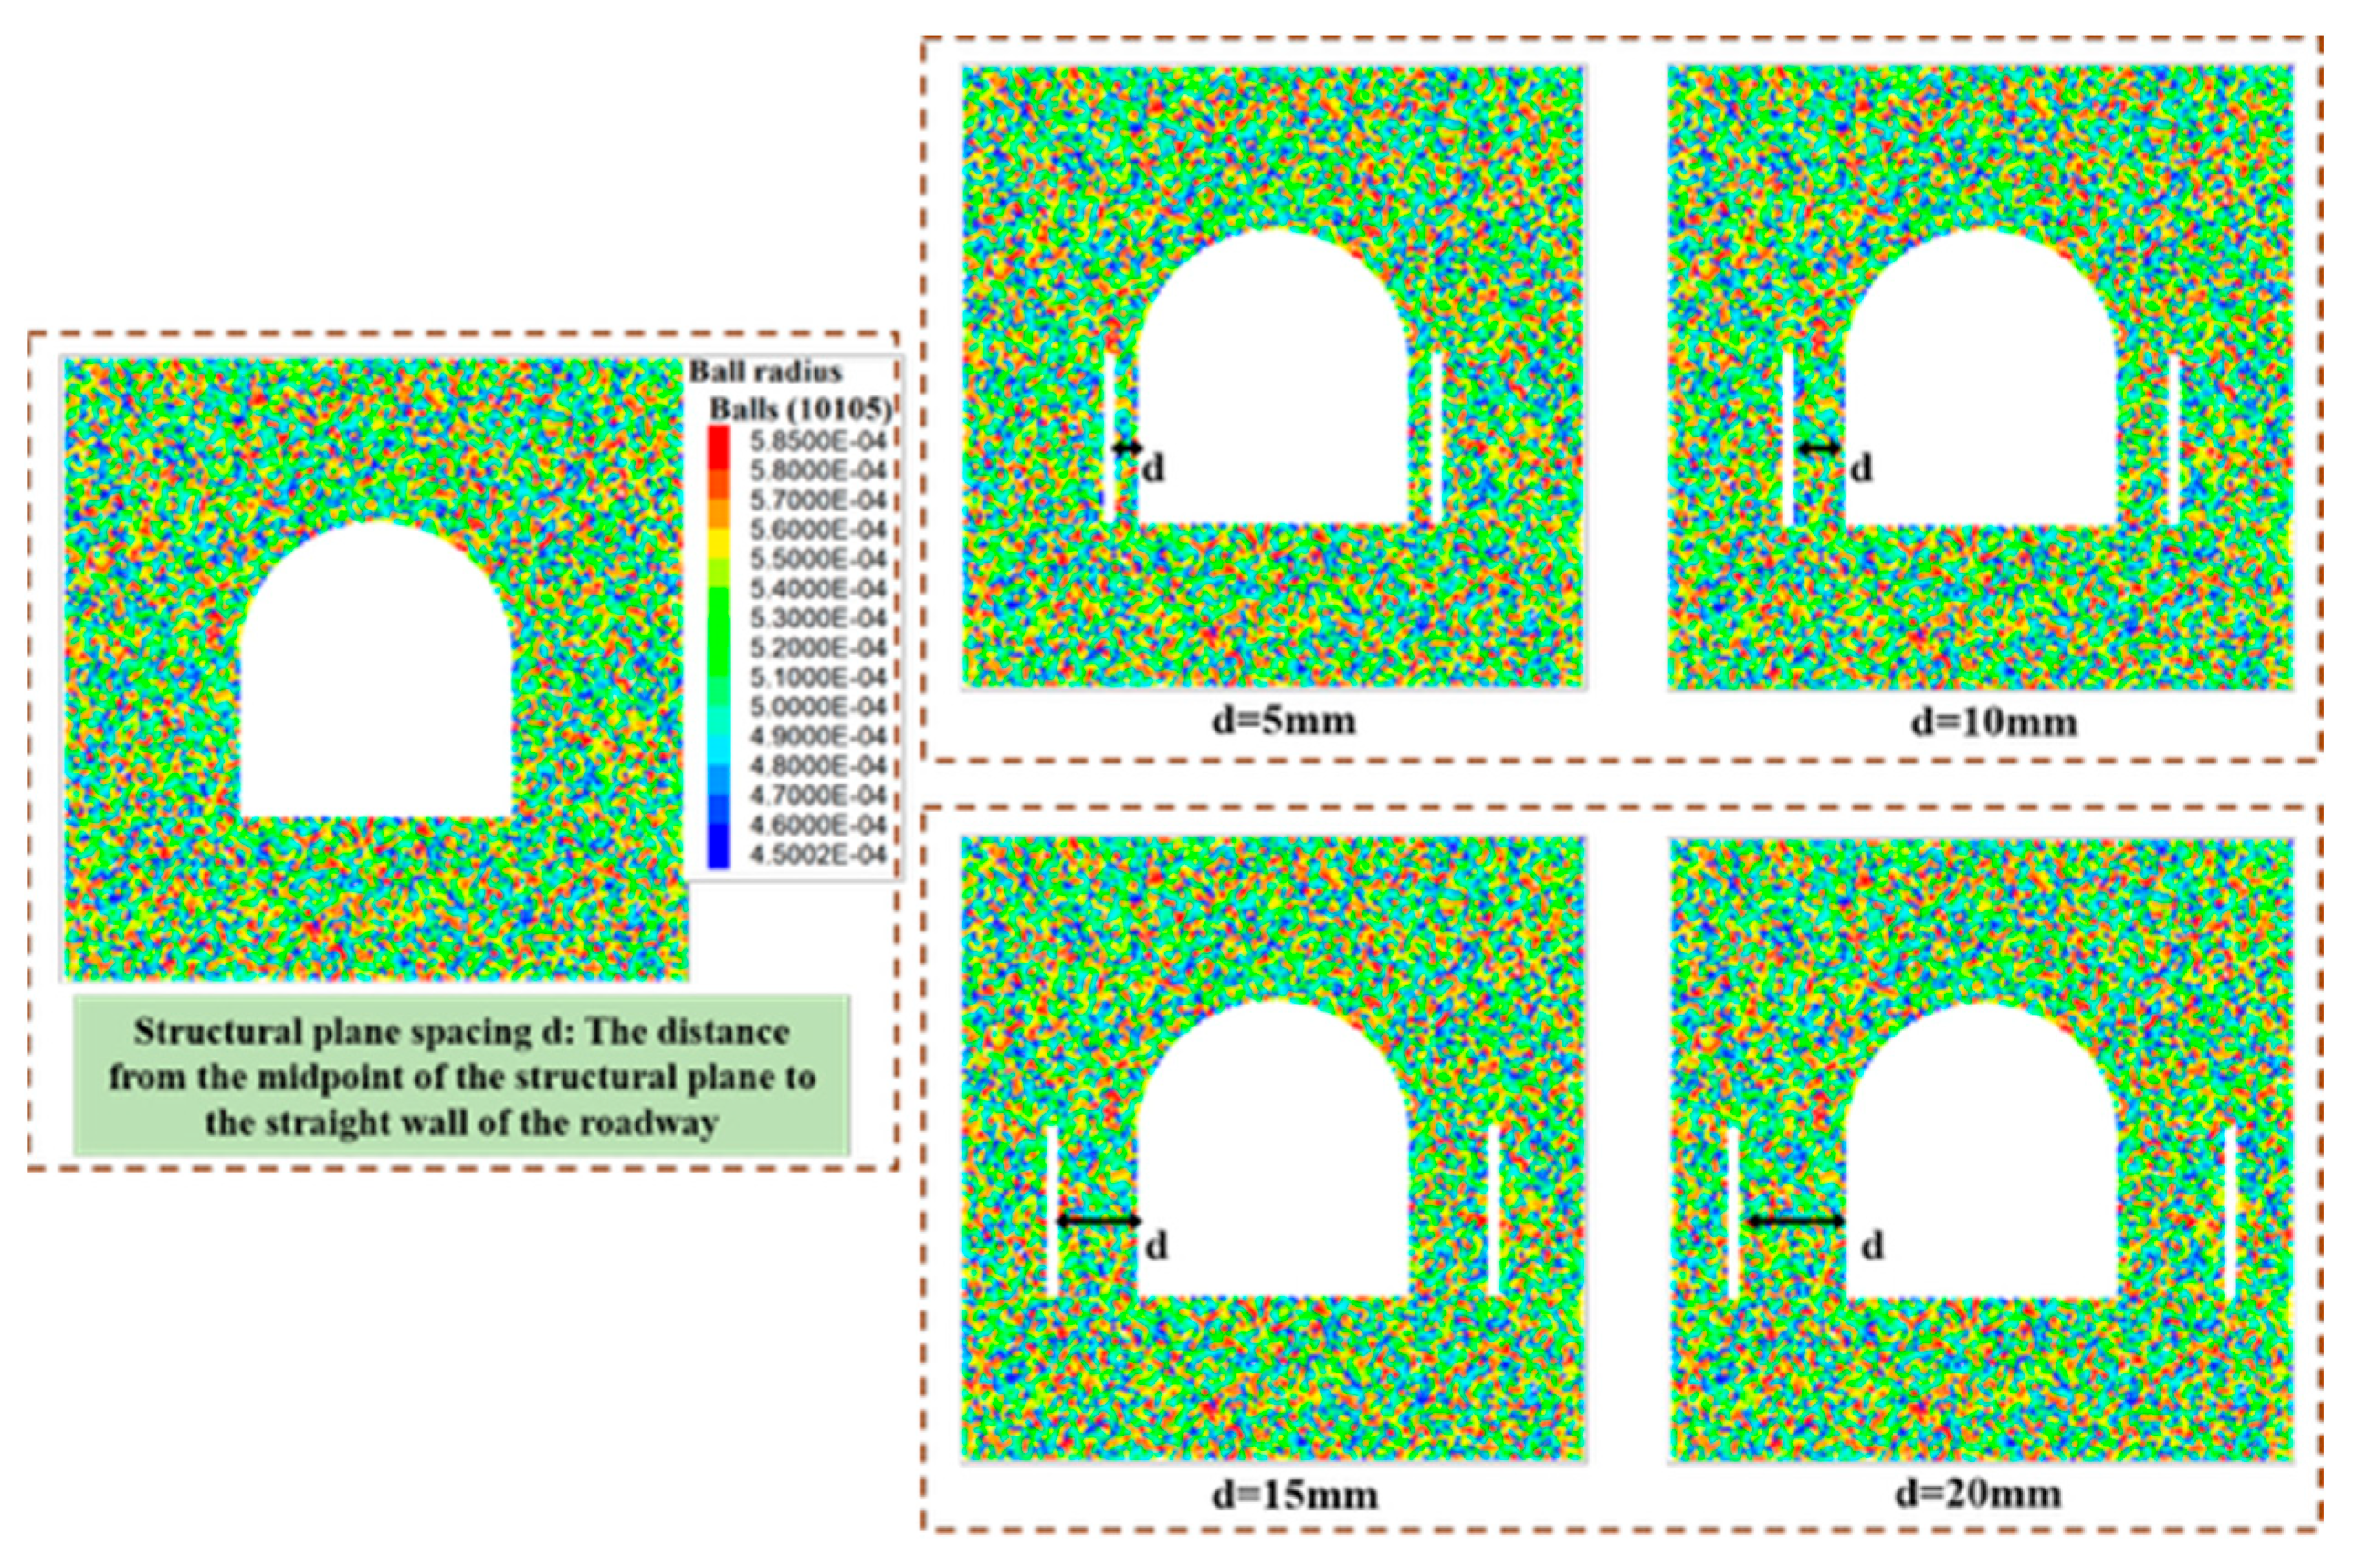
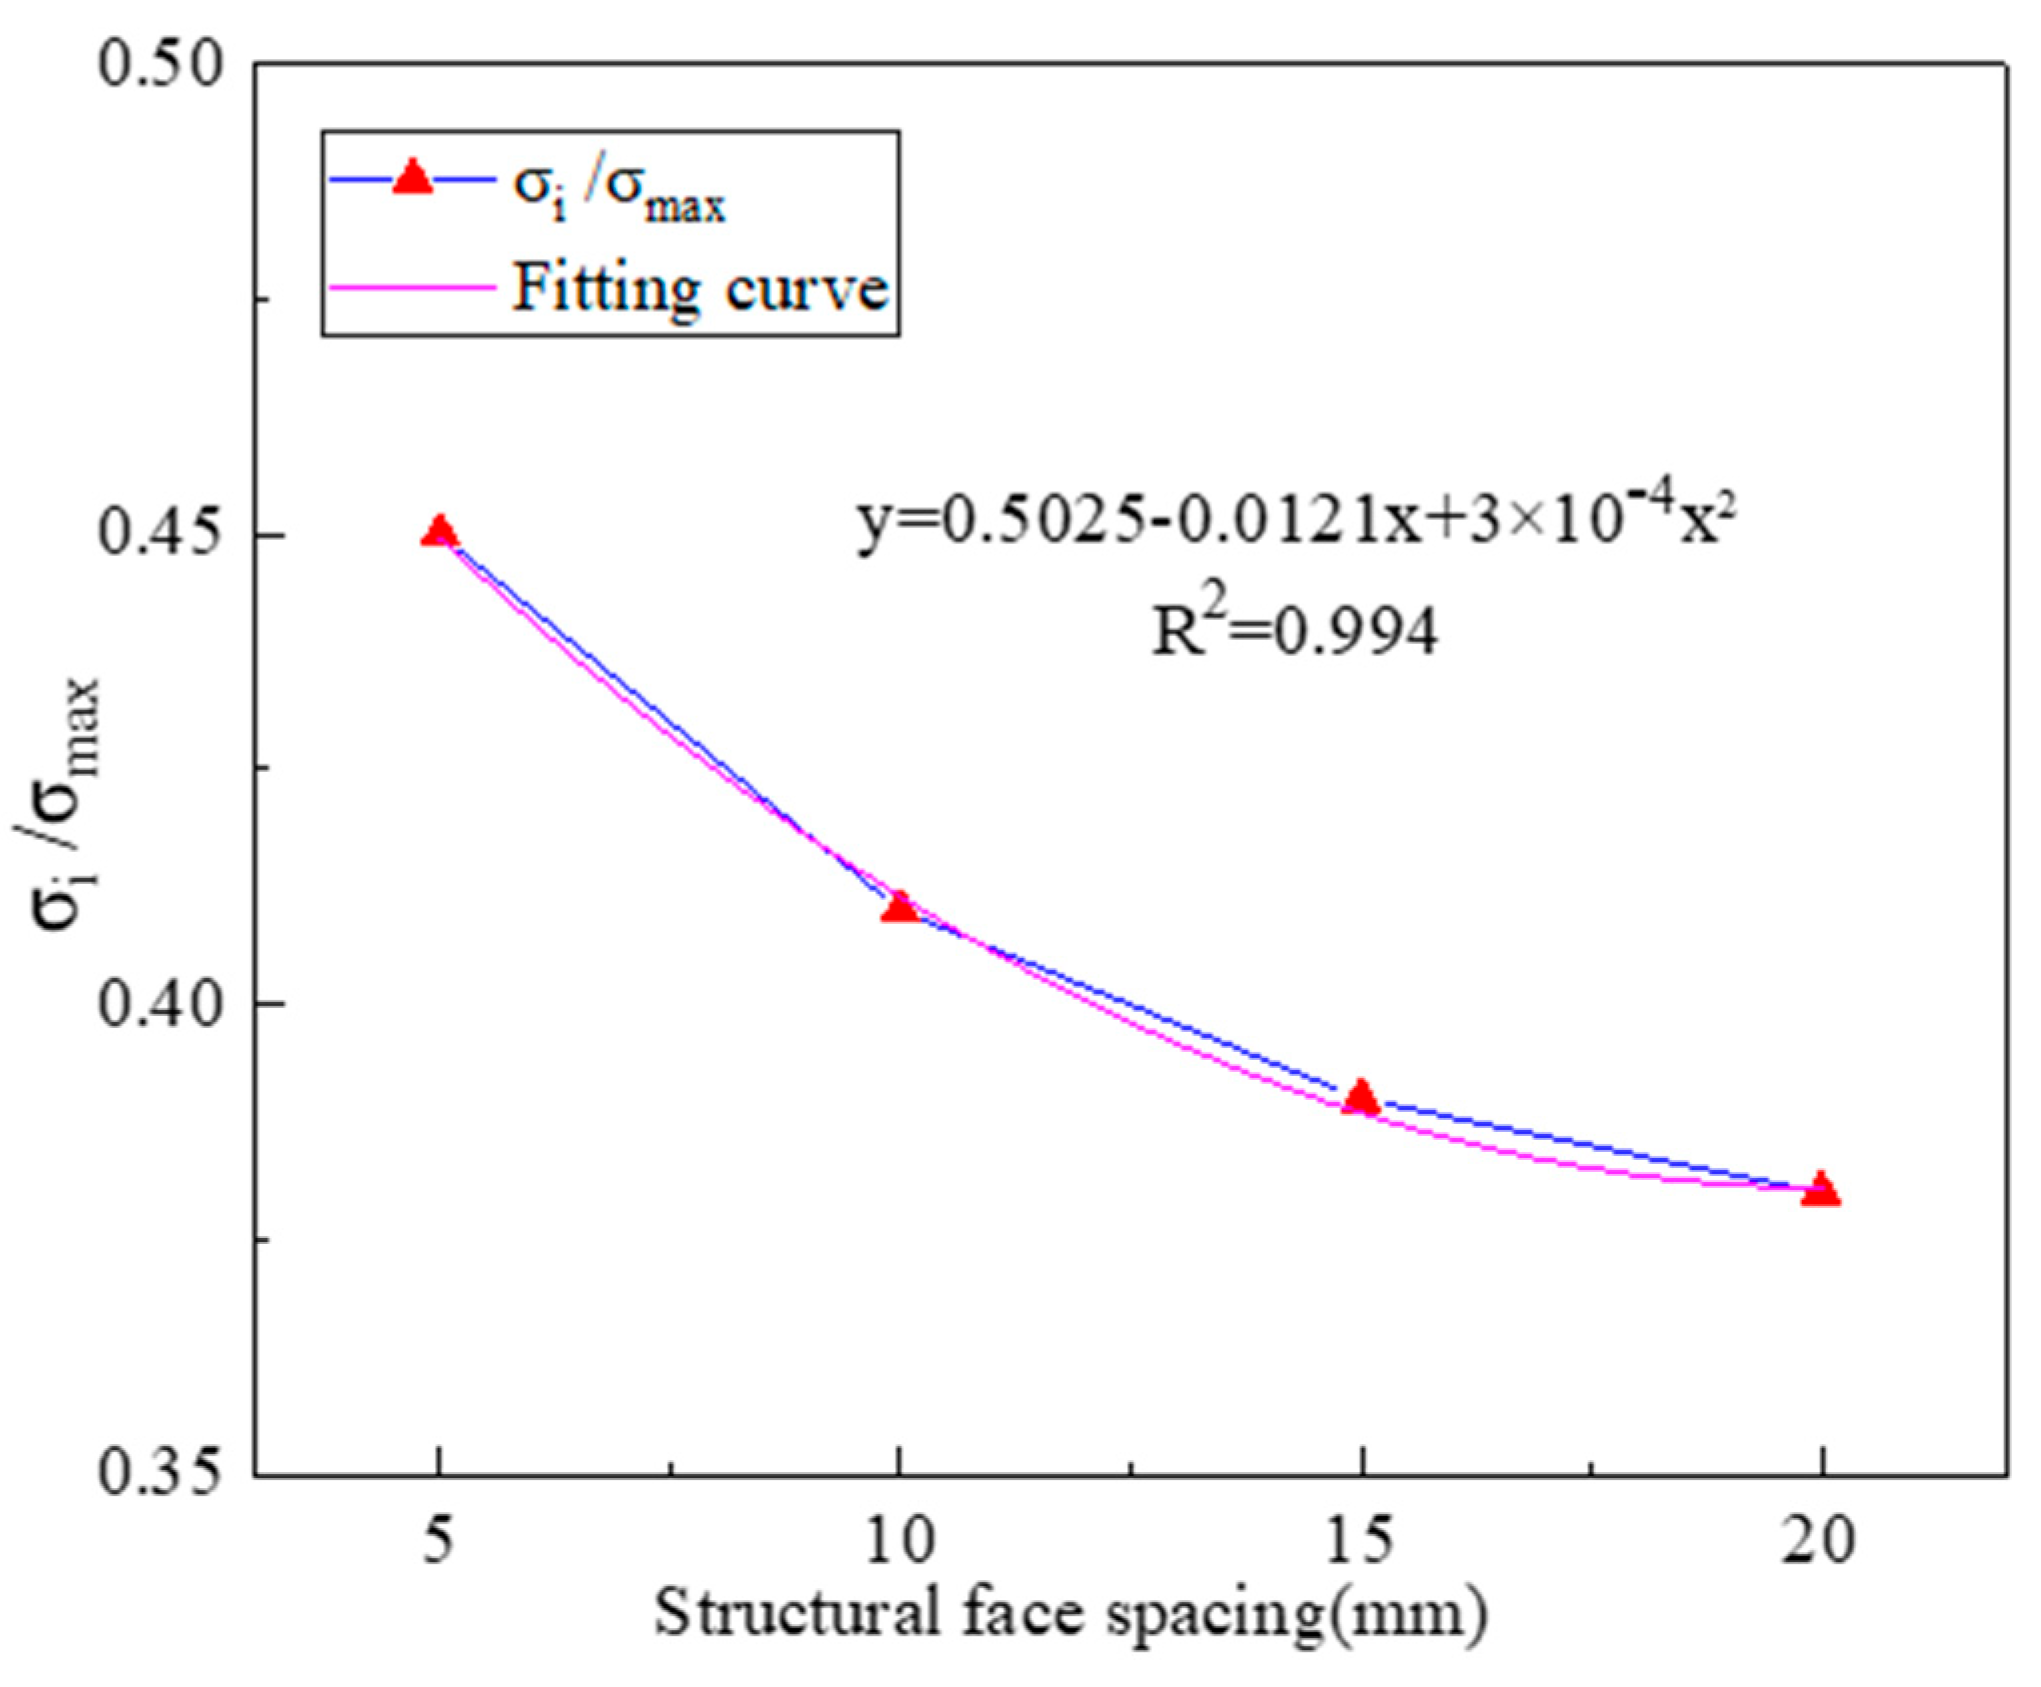
(3) Different spacings of structural planes produce distinct failure characteristics in the surrounding rock of a straight-wall arched tunnel. As the spacing increases, the crack propagation angle gradually decreases; in other words, the larger the spacing, the smaller the propagation angle of the wing cracks. Structural-plane spacing also affects rockburst proneness. With increasing spacing, the value of σi/σmax shows a decreasing trend. Based on curve fitting, the corresponding mathematical relationship is given by y = 0.5025 − 0.0121x + 3 × 10−4x2. These results can provide a useful reference for rock-mass disaster prevention and control in underground engineering, as well as for rockburst prediction.
This study aims to reveal the influence of different structural planes on rockburst. A series of laboratory and numerical simulation tests were conducted. Although the specimens were scaled according to the dimensions of engineering rock roadways, the conditions of the structural planes were simplified. While there are still some differences between laboratory tests and actual engineering sites, the study of structural planes helps reveal the characteristics and mechanisms of rockburst in the field. In practical engineering, the stress environment and internal structure of rock masses are highly complex and variable; therefore, further research is needed on a wider range of rock conditions and rockburst modes.