Article

Application of the Temporal Dominance of Sensations for the Identification of Adulterated Mexican Honey: Comparison and Validation Against Static Sensory Techniques Check All That Apply and Rate All That Apply


by
Adán Cabal-Prieto
1,*,
Emmanuel de Jesús Ramírez-Rivera
2,*,
Lorena Guadalupe Ramón-Canul
3,*,
Lucía Sánchez-Arellano
1,
Jesús Atenodoro-Alonso
1,
José Vian
1,
Jorge Armida-Lozano
2,
Humberto Marín-Vega
2,
Víctor Daniel Cuervo-Osorio
3 and
Erasmo Herman-Lara
4
1
Tecnológico Nacional de México, Instituto Tecnológico Superior de Huatusco, Av. 25 Poniente No. 100, Colonia Reserva Territorial, Huatusco 94106, Veracruz, Mexico
2
Tecnológico Nacional de México, Instituto Tecnológico Superior de Zongolica, Zongolica 95005, Veracruz, Mexico
3
Tecnológico Nacional de México, Instituto Tecnológico de Chiná, C. 11 S/N entre 22 y 28, Cementerio, San Francisco de Campeche 24520, Campeche, Mexico
4
Departamento de Ingeniería Química y Bioquímica, Tecnológico Nacional de México Campus Tuxtepec, Avenida Dr. Víctor Bravo Ahuja No. 561, Col. El Paraíso, Tuxtepec 68350, Oaxaca, Mexico
*
Authors to whom correspondence should be addressed.
Processes 2026, 14(15), 2511; https://doi.org/10.3390/pr14152511
Submission received: 19 June 2026 / Revised: 28 July 2026 / Accepted: 3 August 2026 / Published: 5 August 2026

Abstract

The objective of this study was to apply the Temporal Dominance of Sensations (TDS) technique to the analysis of adulterated honey and to validate it by comparing its results with those obtained using the static sensory techniques Check All That Apply (CATA) and Rate All That Apply (RATA). Honey samples adulterated with 20%, 40%, 60%, and 80% high-fructose corn syrup (HFCS) were evaluated and compared with the original honey sample by three consumer panels (n = 300) using TDS, CATA, and RATA. Discriminant analysis was performed to evaluate sample discrimination, classification accuracy, and correlations among sensory techniques. The TDS curves revealed that the dominant attributes were honey, sugar, syrup, and sweep. The original sample was characterized by the dominance of the honey flavor attribute, whereas the adulterated samples exhibited competition among the sugar, syrup, and sweet attributes as the level of adulteration increased. This finding was confirmed by the TDS parameters Vmax and Tmax, which showed that higher levels of adulteration facilitated consumer identification of these sensory attributes. According to the λ test, the TDS and CATA techniques showed significant differences in all attributes (100% discrimination effectiveness), whereas the RATA technique achieved only 62.5% discrimination. However, the confidence ellipses showed lower dispersion for the TDS data, indicating that all honey samples were differentiated, whereas the confidence ellipses generated using the CATA and RATA techniques indicated that at least one pair of samples was classified as similar. These results were confirmed by the percentages of correct classification, with the TDS technique achieving correct classification rates between 69.77% and 85.38%, whereas those obtained with CATA and RATA ranged from 39.18% to 69.09% and from 6.36% to 63.64%, respectively. The Rv coefficients indicated good agreement between TDS and the static sensory techniques (Rv TDS-CATA = 0.70 and Rv TDS-RATA = 0.82). The TDS technique, together with the Vmax and Tmax parameters, represents a viable approach for identifying adulterated honey and monitoring its dynamic sensory changes during real-time consumption.

1. Introduction

Honey is a food of great importance to many consumers worldwide due to its contribution to health and its economic and cultural value [1,2]. In 2024, approximately 2 million tons of honey were produced worldwide [3]. The leading producers are China, Mexico, Turkey, Russia, and the United States, which together account for 55% of global production [4]. Mexico ranks as the ninth largest honey producer globally, with a production exceeding 58,000 tons in 2023 [5].
Honey production has been adversely affected by factors such as climate change and the indiscriminate use of chemicals, which reduce bee populations and compromise both honey yield and quality, thereby increasing the risk of adulteration [6]. The most common adulteration practices involve the addition of beet, cane, corn, or sucrose syrups to increase product volume [7,8]. Such practices have several negative consequences, including: (1) reduced product quality and market value; (2) potential risk to consumer health; (3) unfair economic compensation; (4) unfair competition among beekeepers; and (5) the non-compliance with international and national standards (Hlavacek (1981) [9] and NOM-004-SAG/GAN-2018 [10]) that prohibit the use of additives in honey [2,6,11].
Honey adulteration is commonly detected using analytical techniques such as nuclear magnetic resonance spectroscopy [12], high-performance liquid chromatography [13], and gas chromatography [14]. Although these methods provide high analytical accuracy, they involve considerable operational costs and often generate results that are difficult to interpret, particularly for beekeepers [15]. Furthermore, instrumental analyses alone cannot fully explain perceived quality. Consequently, sensory evaluation is considered one of the most comprehensive approaches for assessing honey quality [16,17].
Several studies have employed static sensory techniques, which evaluate products independently of time, to investigate adulterated food products. Examples include the use of triangle tests and Quantitative Descriptive Analysis for adulterated dairy products [15,18], as well as the combined application of sensory approaches such as the Pivot Profile and Check-All-That-Apply (CATA) method, as proposed by Ramón-Canul et al. [7]. However, these techniques present certain limitations, including the substantial time required when trained panelists are involved and the generation of a large number of sensory descriptors that may complicate data interpretation [19].
According to Lawless and Heymann [20], static sensory techniques used to construct sensory profiles do not account for the temporal dimension of perception. This limitation is important because sensory perception is inherently dynamic, with attribute intensity changing during consumption as volatile and non-volatile compounds are released. Dynamic sensory techniques, such as Temporal Dominance of Sensations (TDS), overcome this limitation by monitoring sensory perceptions throughout the consumption process in real time [21]. This is due to the nature of the TDS technique, which is conducted over short evaluation periods (seconds), and whose results complement those obtained using static sensory techniques.
As a result, TDS has gained increasing attention for the sensory characterization of foods, including coffee, chocolate, cheese, and Italian honey [22,23,24,25]. To date, however, TDS has not been applied to the evaluation of adulterated foods. Therefore, this technique could represent a valuable tool for detecting honey adulteration through the dynamic sensory modifications induced by adulterants during consumption.
To support the application of TDS for this purpose, its performance should be compared with static sensory techniques such as CATA and Rate All That Apply (RATA). These sensory techniques offer several advantages: (1) they are easy to apply; (2) they can be applied with consumers; and (3) both techniques have been shown to generate reliable and similar sensory descriptions. However, one of the limitations of CATA is that it does not allow for direct measurement of the intensity of the sensory terms evaluated due to its binary response type [26]. RATA, on the other hand, remains a relatively unexplored variant, and its potential to improve sample discrimination has not yet been confirmed despite the methodology’s growing popularity [27]. It is important to note that both CATA and RATA have been used primarily for sensory descriptions but not in adulteration studies. In this sense, it is also important to consider the use of multivariate statistical tools for the validation of adulteration results because techniques such as principal component analysis (PCA) and discriminant analysis, together with sensory techniques, can provide a more complete understanding of the sensory changes associated with honey adulteration during real-time consumption [15,28]. Therefore, the objective of this study was to apply the Temporal Dominance of Sensations (TDS) technique to identify adulterated honey based on its sensory dynamics and to validate its performance using static sensory techniques.

2. Materials and Methods

2.1. Ethical Considerations

This research was conducted in accordance with ethical principles of the Declaration of Helsinki of the World Medical Association for research involving human participants. All participants provided informed consent prior to participation. As the study consisted solely of sensory evaluations and did not involve medical interventions or any foreseeable risk to participants, formal approval from an ethics committee was not required. However, the project was approved by the Postgraduate and Research Department of the Tecnologico Nacional de Mexico Campus Huatusco.
In this study, three consumer panels were formed (100 people per panel, 60% men and 40% women) with similar age ranges (20 to 45 years), and all participants used the same sensory vocabulary to evaluate the samples under standardized conditions. The statistical power of the test was 0.99 for k (number of groups = 3, moderate effect size = 0.80, significance level = 0.05, and n = 100 consumers per group) [29]. All participants were consumers from the Instituto Tecnológico Superior de Huatusco, Veracruz, Mexico.

2.2. Origin of the Samples and Honey Adulteration Process

The authentic honey samples used in this study were of the multifloral type (acquired from a beekeeper in Veracruz, Mexico), produced in the mountainous region of Huatusco, Veracruz, Mexico (geographic coordinates: 19°08′56″ N, 96°57′58″ W; average altitude: 1300 m above sea level).
This honey was chosen for this research due to its high commercial availability and consumption. The predominant floral sources were Coffea arabica, Inga vera, and Citrus spp. High fructose corn syrup (HFCS) (55% fructose and 45% glucose) was used as the adulterant (Productora de jugos y concentrados S.A. de C.V., México). This adulterant was selected because, according to the literature [30,31,32], it is one of the most commonly used agents for honey adulteration both globally and in the Mexican commercial market.
Four adulterated honey samples were prepared according to the methodology described by Islam et al. [33]. HFCS was mixed with pure honey at ratios of 1:4 (20% syrup w/w, coded as AS1), 1:1.5 (40% syrup w/w, coded as AS2), 1.5:1 (60% syrup w/w, coded as AS3), and 4:1 (80% syrup w/w, coded as AS4). The preparation consisted of mixing and heating the adulterated honey in a water bath at 36 °C for 30 min. This process was only performed to obtain adulterated samples, as the evaluation of all honey samples was carried out at room temperature (25 ± 5 °C). The concentrations were determined for the following reasons: (1) to determine the adulteration levels commonly used in the market; (2) previous experiments; and (3) the literature, including Islam et al. [33], Bodor et al. [34], Piana et al. [25], and Ramón-Canul et al. [7].
Adulteration was verified by determining sample viscosity using a rheometer (TA instruments, Discovery hibryd-2, New Castle, DE, USA) and soluble solids content (°Brix) using a refractometer (HANNA instruments, model HI96801, Ciudad de México, Mexico) (Table 1).

2.3. Sample Preparation for Sensory Analysis of Honey

Honey samples for sensory analysis were presented in 20 g portions in propylene containers with a capacity of 30 mL [35]. After evaluating a sample, each consumer drank water to remove any lingering flavors from the evaluated sample and prevent interference with the evaluation of the next sample [36]. Each sample was identified with a random three-digit code to ensure blind sensory evaluation.

2.4. Consumer Panel Formation: TDS, CATA and RATA

For this research, a total of three honey consumer panels were formed, as it has been demonstrated that the sensory perception of consumers is discriminative and comparable to that of trained judges [37,38]. Consumer selection followed the methodology described in ISO 8586-1 [39] and ISO 11035 [40]. Initially, interviews were conducted to verify honey consumption habits, the absence of honey aversion, and availability to participate in the study. Subsequently, discriminative sensory and flavor recognition test were performed according to ISO 5496 [41], ISO 4120 [42], and ISO 10399 [43]. By applying these international standards, potential honey consumers were selected for this research.
All participants were informed about the objective of the study and the ingredients of the products evaluated and provided written informed consent prior to participation.
The sensory attributes evaluated by all panels were sweet, honey, sugar, viscous, syrup, caramel, panela, and bittersweet. The sensory attributes were defined as follows: (1) the sensory attributes reported by Ramón-Canul et al. [7] were considered; (2) a trained panel evaluated authentic and adulterated honey samples and defined by consensus the sensory attributes perceived in these samples.

2.5. Procedure for the TDS

The TDS evaluation consisted of the following stages. First, participants attended five training sessions to become familiar with the SensoMaker software and understand the concept of a dominant attribute [21]. During the evaluation, consumer clicked on the “Start” button and placed a drop of honey in their mouth for 2 s (delay time). After this period, they were asked to identify the dominant sensory attribute for 30 s by selecting the corresponding descriptor using the computer mouse. Participants were allowed to select any attribute multiple times throughout the evaluation [21]. For the TDS evaluation of the samples, evaluation times of 180 and 90 s, used by Tripodi et al. [44] and Piana et al. [25] for the characterization of authentic Capparis spinosa L. and monofloral honeys, were considered. However, previous experiments established a maximum evaluation time of 30 s by consensus with the panel because no further changes in sensory dominance were found after this time. Honey samples were presented according to a sequential monadic design based on an optimized experimental design [45].

2.6. Static Sensory Techniques: Check-All-That-Apply and Rate-All-That-Apply

The CATA and RATA techniques were used to compare the results obtained from the TDS evaluations. The same sensory attributes used in the TDS test were assessed in both techniques. For the CATA technique, consumers were instructed to select all attributes that applied to describe each sample [26]. For the RATA technique, consumers were asked to evaluate the intensity of each perceived attribute using a 9-point scale ranging from low to high intensity (1 = not perceived to 9 = extremely strong). This scale was selected because it has been shown to improve product discrimination [46]. Honey samples were presented according to a sequential monadic design based on an optimized experimental design [45].

2.7. Statistical Processing of Sensory Data

The validation of the results and the effectiveness of the TDS technique was conducted in three stages: (1) visual inspection of the dynamic sensory behavior within and among adulterated honey samples; (2) quantitative and qualitative validation of TDS results against the static sensory techniques CATA and RATA; and (3) assessment of the correlation between dynamic (TDS) and static (CATA and RATA) sensory results.

2.7.1. Visual Inspection of Intra- and Inter-Honey Dynamic Behavior

TDS curves were constructed for each honey sample and consumer panel according to the methodology described by Pineau et al. [21]. Each curve included two reference lines: (1) the chance level, defined as the dominance rate expected by chance for each sensory attribute, and (2) the significance level, defined as the minimum dominance rate required for an attribute to be considered significantly dominant.
The significance level was calculated according to Pineau et al. [21] who used a binomial ratio based on a normal approximation:
P s = P o + 1.645 P o ( 1 P o ) n
where Ps is the minimum significant proportion value (α = 0.05) at any point of the TDS curve, Po = 1/p, where p is the number of sensory attributes, and n is the number of evaluations per sample.
For the present study, Po was set to 0.125 because eight sensory attributes were evaluated. Consequently, the minimum number of evaluations required was calculated as n = 5 / ( 0.125 × 1 0.12 ) = 45.87 ~ 46 evaluations.
The consumer panels generated 100 evaluations per honey sample, exceeding both the calculated minimum number of evaluations and the minimum recommendation of 30 evaluations for obtaining reliable TDS results [21].
Subsequently, the parameters Vmax (maximum dominance rate) and Tmax (time required to reach Vmax from the beginning of the evaluation) were determined. These parameters were analyzed using a one-way analysis of variance (ANOVA) considering a significance level of α = 0.05.

2.7.2. Quantitative and Qualitative Validation of TDS Versus Techniques CATA and RATA

To compare the results obtained from the different sensory techniques, both quantitative and qualitative validation procedures were applied. Quantitative validation was performed using stepwise Discriminant Analysis (DA) to determine the ability of the consumer panels to discriminate among honey samples [15]. The following DA indicators were evaluated: (1) probability values (p) and Wilk’s Lambda (λ) to identify the sensory attributes that significantly contributed to sample discrimination [47,48]; (2) the percentage of correct sample classification to assess the ability of the consumer panels to classify honeys according to their level of adulteration.
Qualitative validation was performed by evaluating sample discrimination within the sensory space using confidence ellipses at the 95% confidence level generated from 500 bootstrap resamples [49].

2.7.3. Correlation Between Dynamic and Static Results

For this stage, Multiple Factor Analysis (MFA) for multiple data tables was applied to analyze the relationships among the sensory techniques. In addition, partial clouds were generated to determine whether the sensory techniques evaluated each honey sample in the same way, and the Rv coefficient was calculated to determine the degree of correlation between TDS and CATA, and between TDS and RATA [50]. Only sensory attributes that significantly discriminated among honey samples (p < 0.05) according to Wilk’s λ test were included in the analysis.
TDS curves for individual honey samples and comparative TDS curves were generated using SensoMaker software version 1.91 [51]. One-way ANOVA, stepwise DA (Wilk’s Lamda test, percentage of correct classification, and confidence ellipses), MFA, and Rv coefficient analysis were performed using XLSTAT software version 2025 [52].

3. Results and Discussion

3.1. Visual Inspection of the Dynamic Behavior Within and Among Adulterated Honey Samples

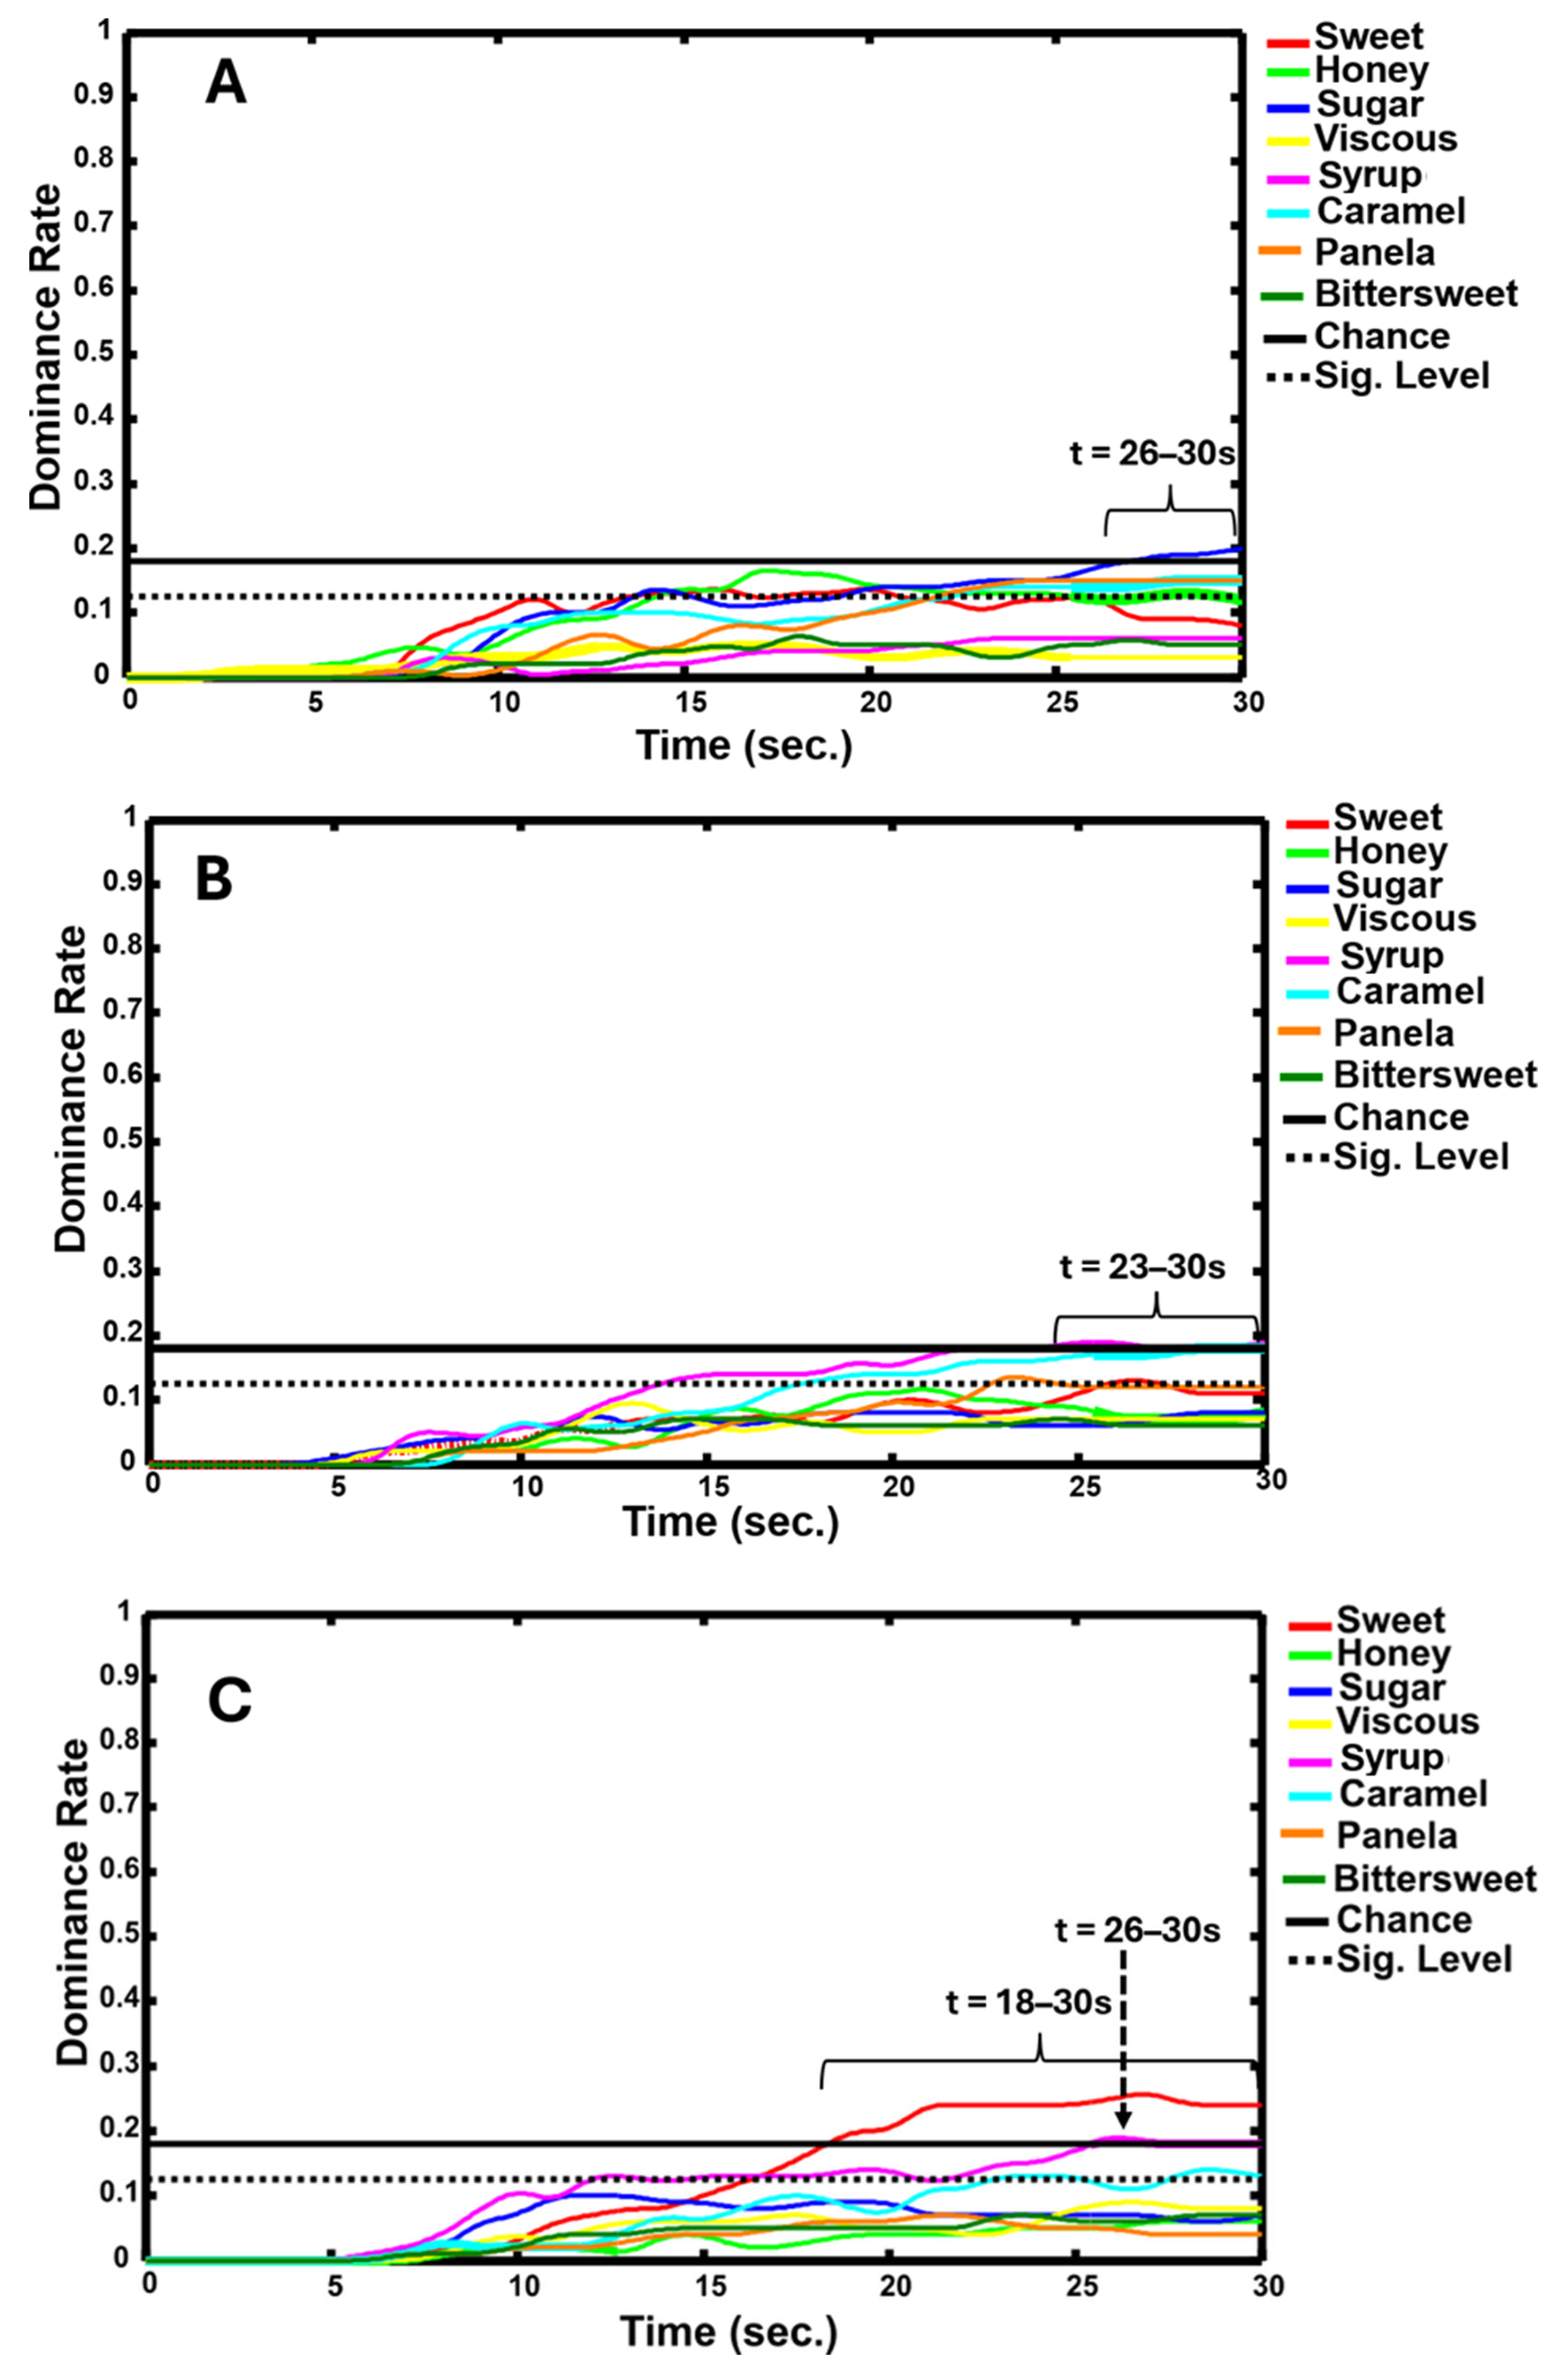
Figure 1 shows the TDS curves for the authentic and adulterated honey samples. In the authentic honey (AHO), honey flavor was the dominant sensory attribute, becoming significant from approximately 6 s and remaining dominant until the end of the evaluation period (t = 30 s) (Figure 1A). In contrast, sample AS1 (80% non-adulterated honey + 20% HFCS) exhibited a different sensory pattern, with sugar emerging as the dominant attribute from t = 26 s to the end of the test (t = 30 s) (Figure 1B).
However, adulterated sample AS2 (Figure 2A) exhibited a sensory pattern similar to that of sample ASI, with sugar remaining the dominant attribute from t = 26 to 30 s. In contrast, the dynamic behavior of sample AS3 was characterized by the dominance of the syrup attribute between t = 23 and 30 s. Sample AS4 exhibited a different sensory profile, in which sweet was the dominant attribute from t = 18 to 30 s, whereas syrup was dominant only briefly between t = 23 and 24 s and to a lesser extent.
The ANOVA results for the TDS parameters (Vmax and Tmax) are presented in Table 2. For the Vmax parameter, significant differences (p < 0.05) were observed only for the syrup attribute, with samples AS3 and AS4 exhibiting the highest dominance rates (0.20 ± 0.007 and 0.18 ± 0.007, respectively).
For the Tmax parameter, significant differences were detected only for the sugar and syrup attributes. For sugar, samples AS1 and AS2 required a longer time to reach their maximum dominance rate (Tmax = 28.25 ± 0.18 and 29.90 ± 0.18, respectively), whereas the more highly adulterated samples AS3 and AS4 reached their maximum dominance rate more rapidly (15.85 ± 0.18 and 13.25 ± 0.18, respectively).
A similar trend was observed for the syrup attribute. Samples AS2 and AS3 required a longer time to reach their maximum dominance rate (Tmax = 29.25 ± 2.17 and 29.62 ± 2.17, respectively), whereas samples with higher levels of adulteration exhibited lower Tmax values (Tmax = 26.25 ± 2.17 and 26.25 ± 2.17 s). These results indicate that increasing adulterant concentration modifies the temporal dynamics of sensory perception and suggest that Tmax may serve as a useful indicator for detecting honey adulteration.
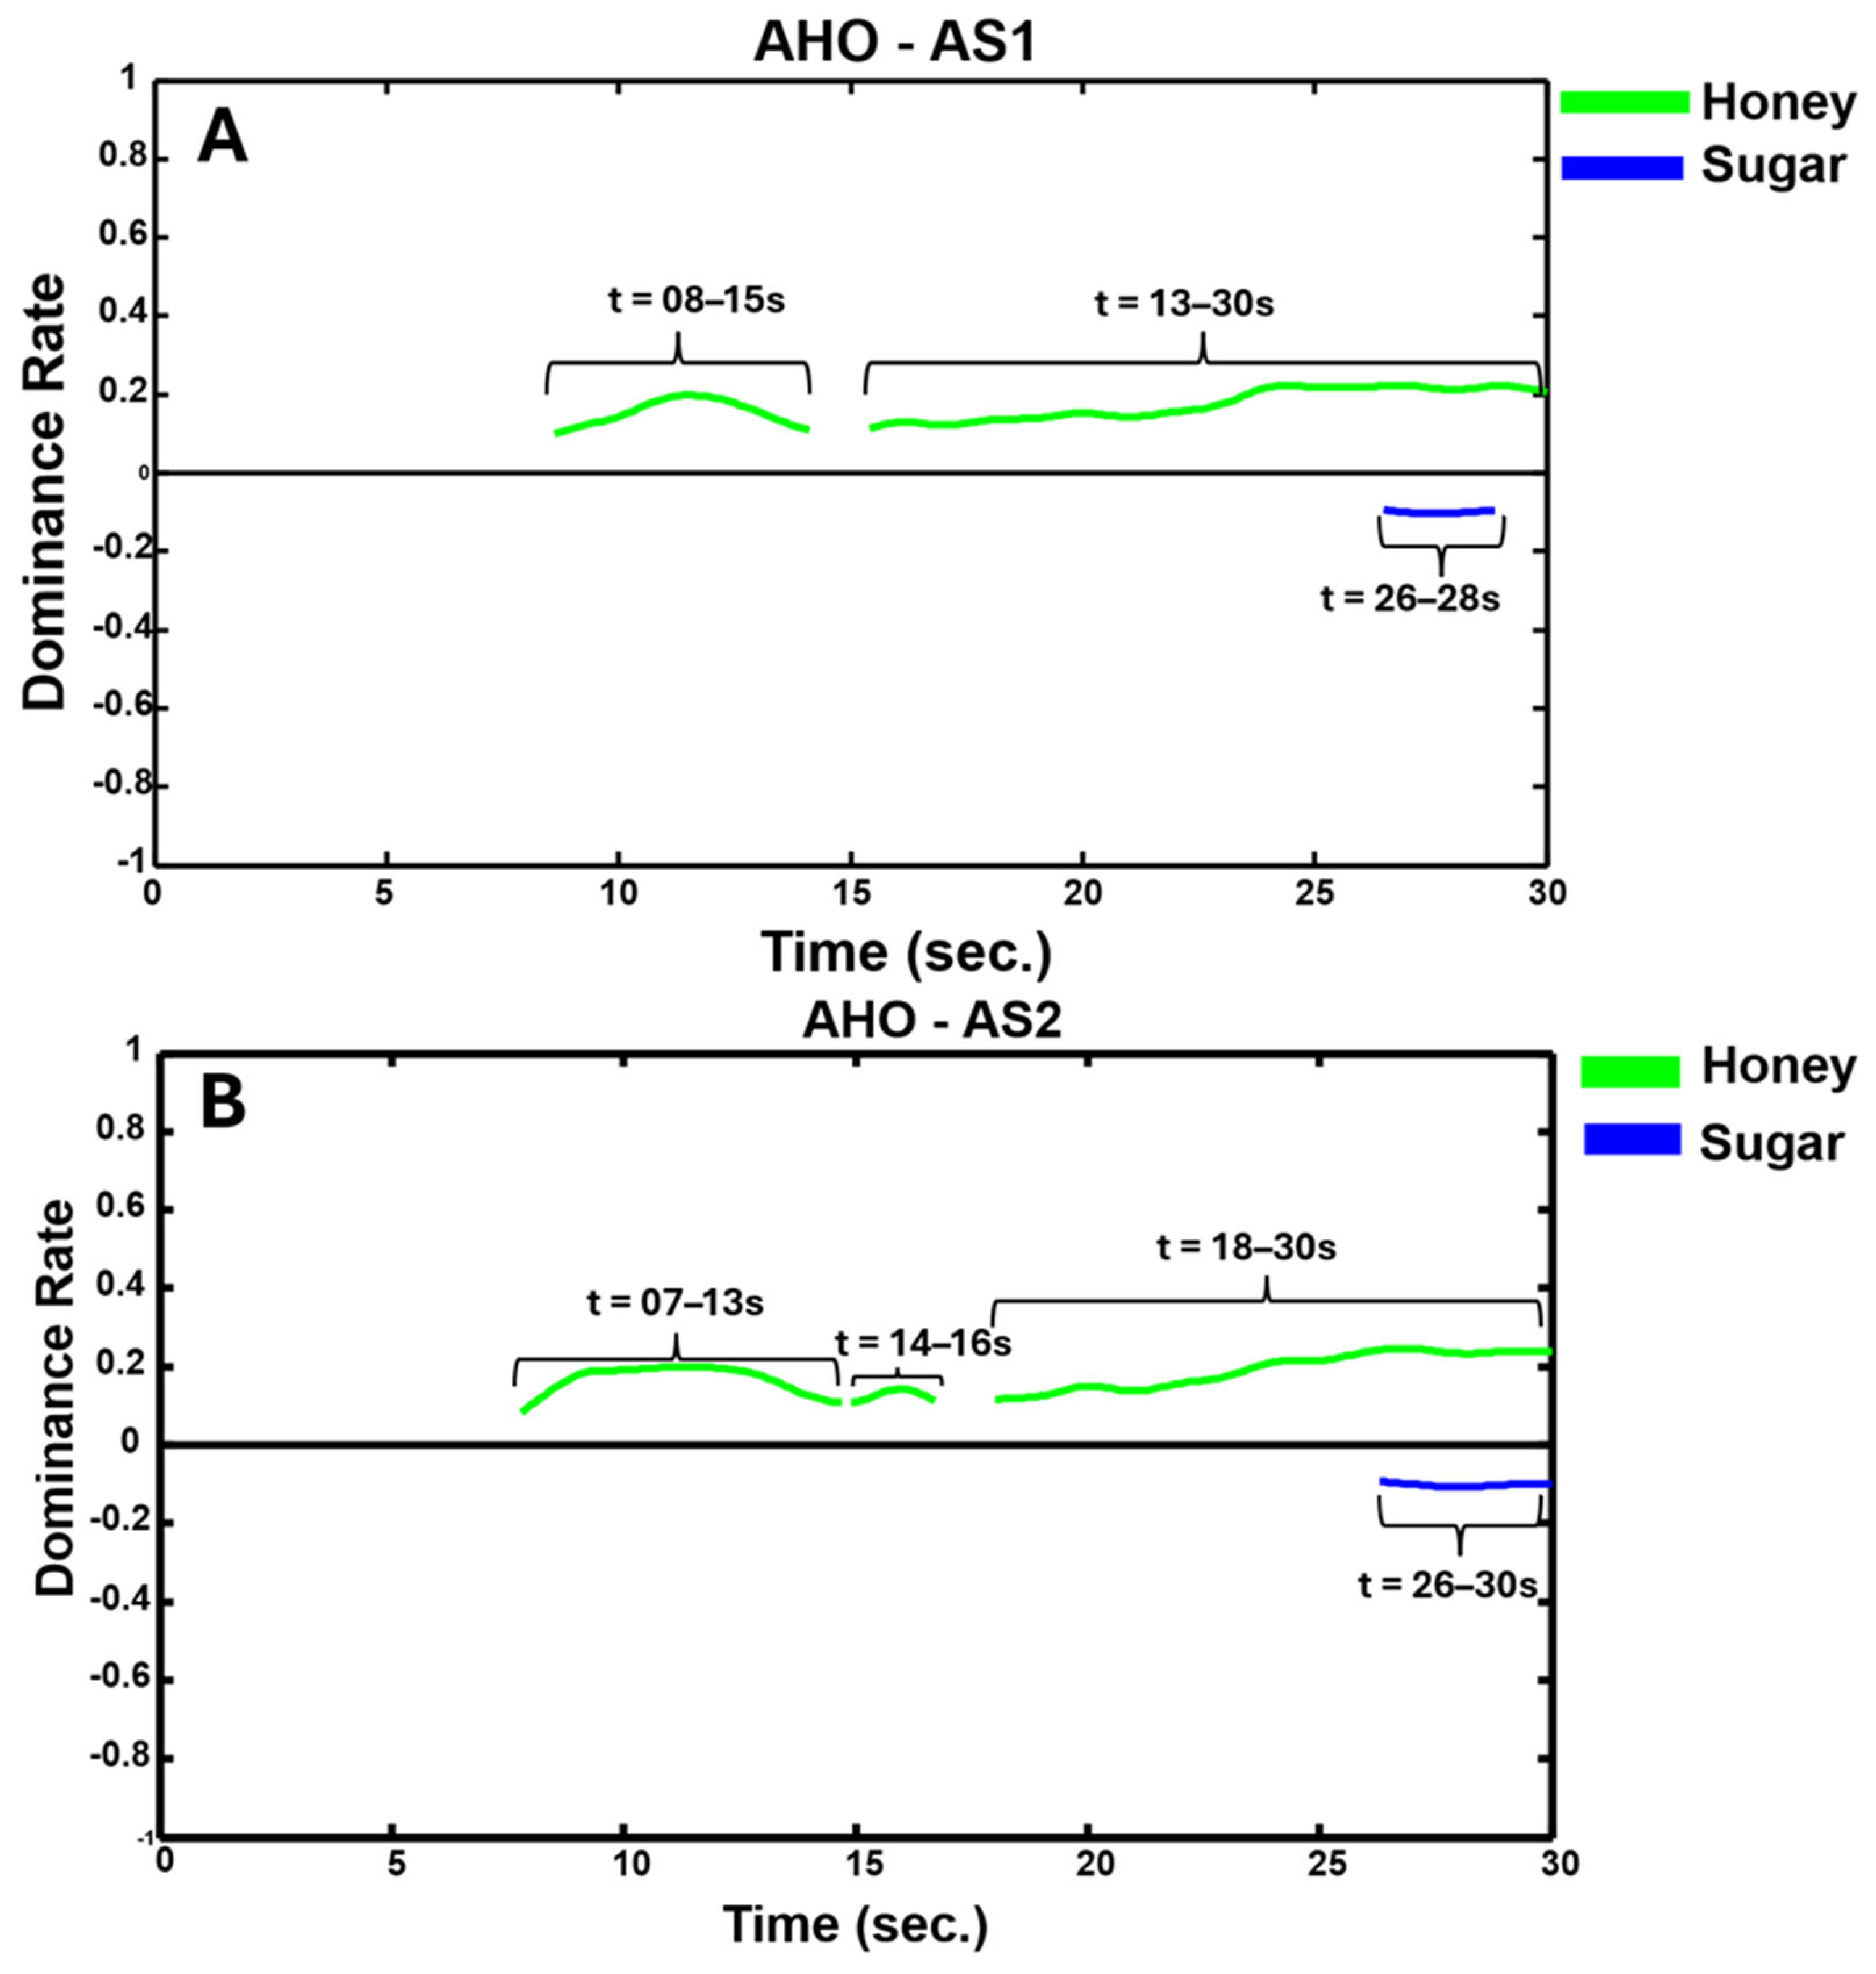
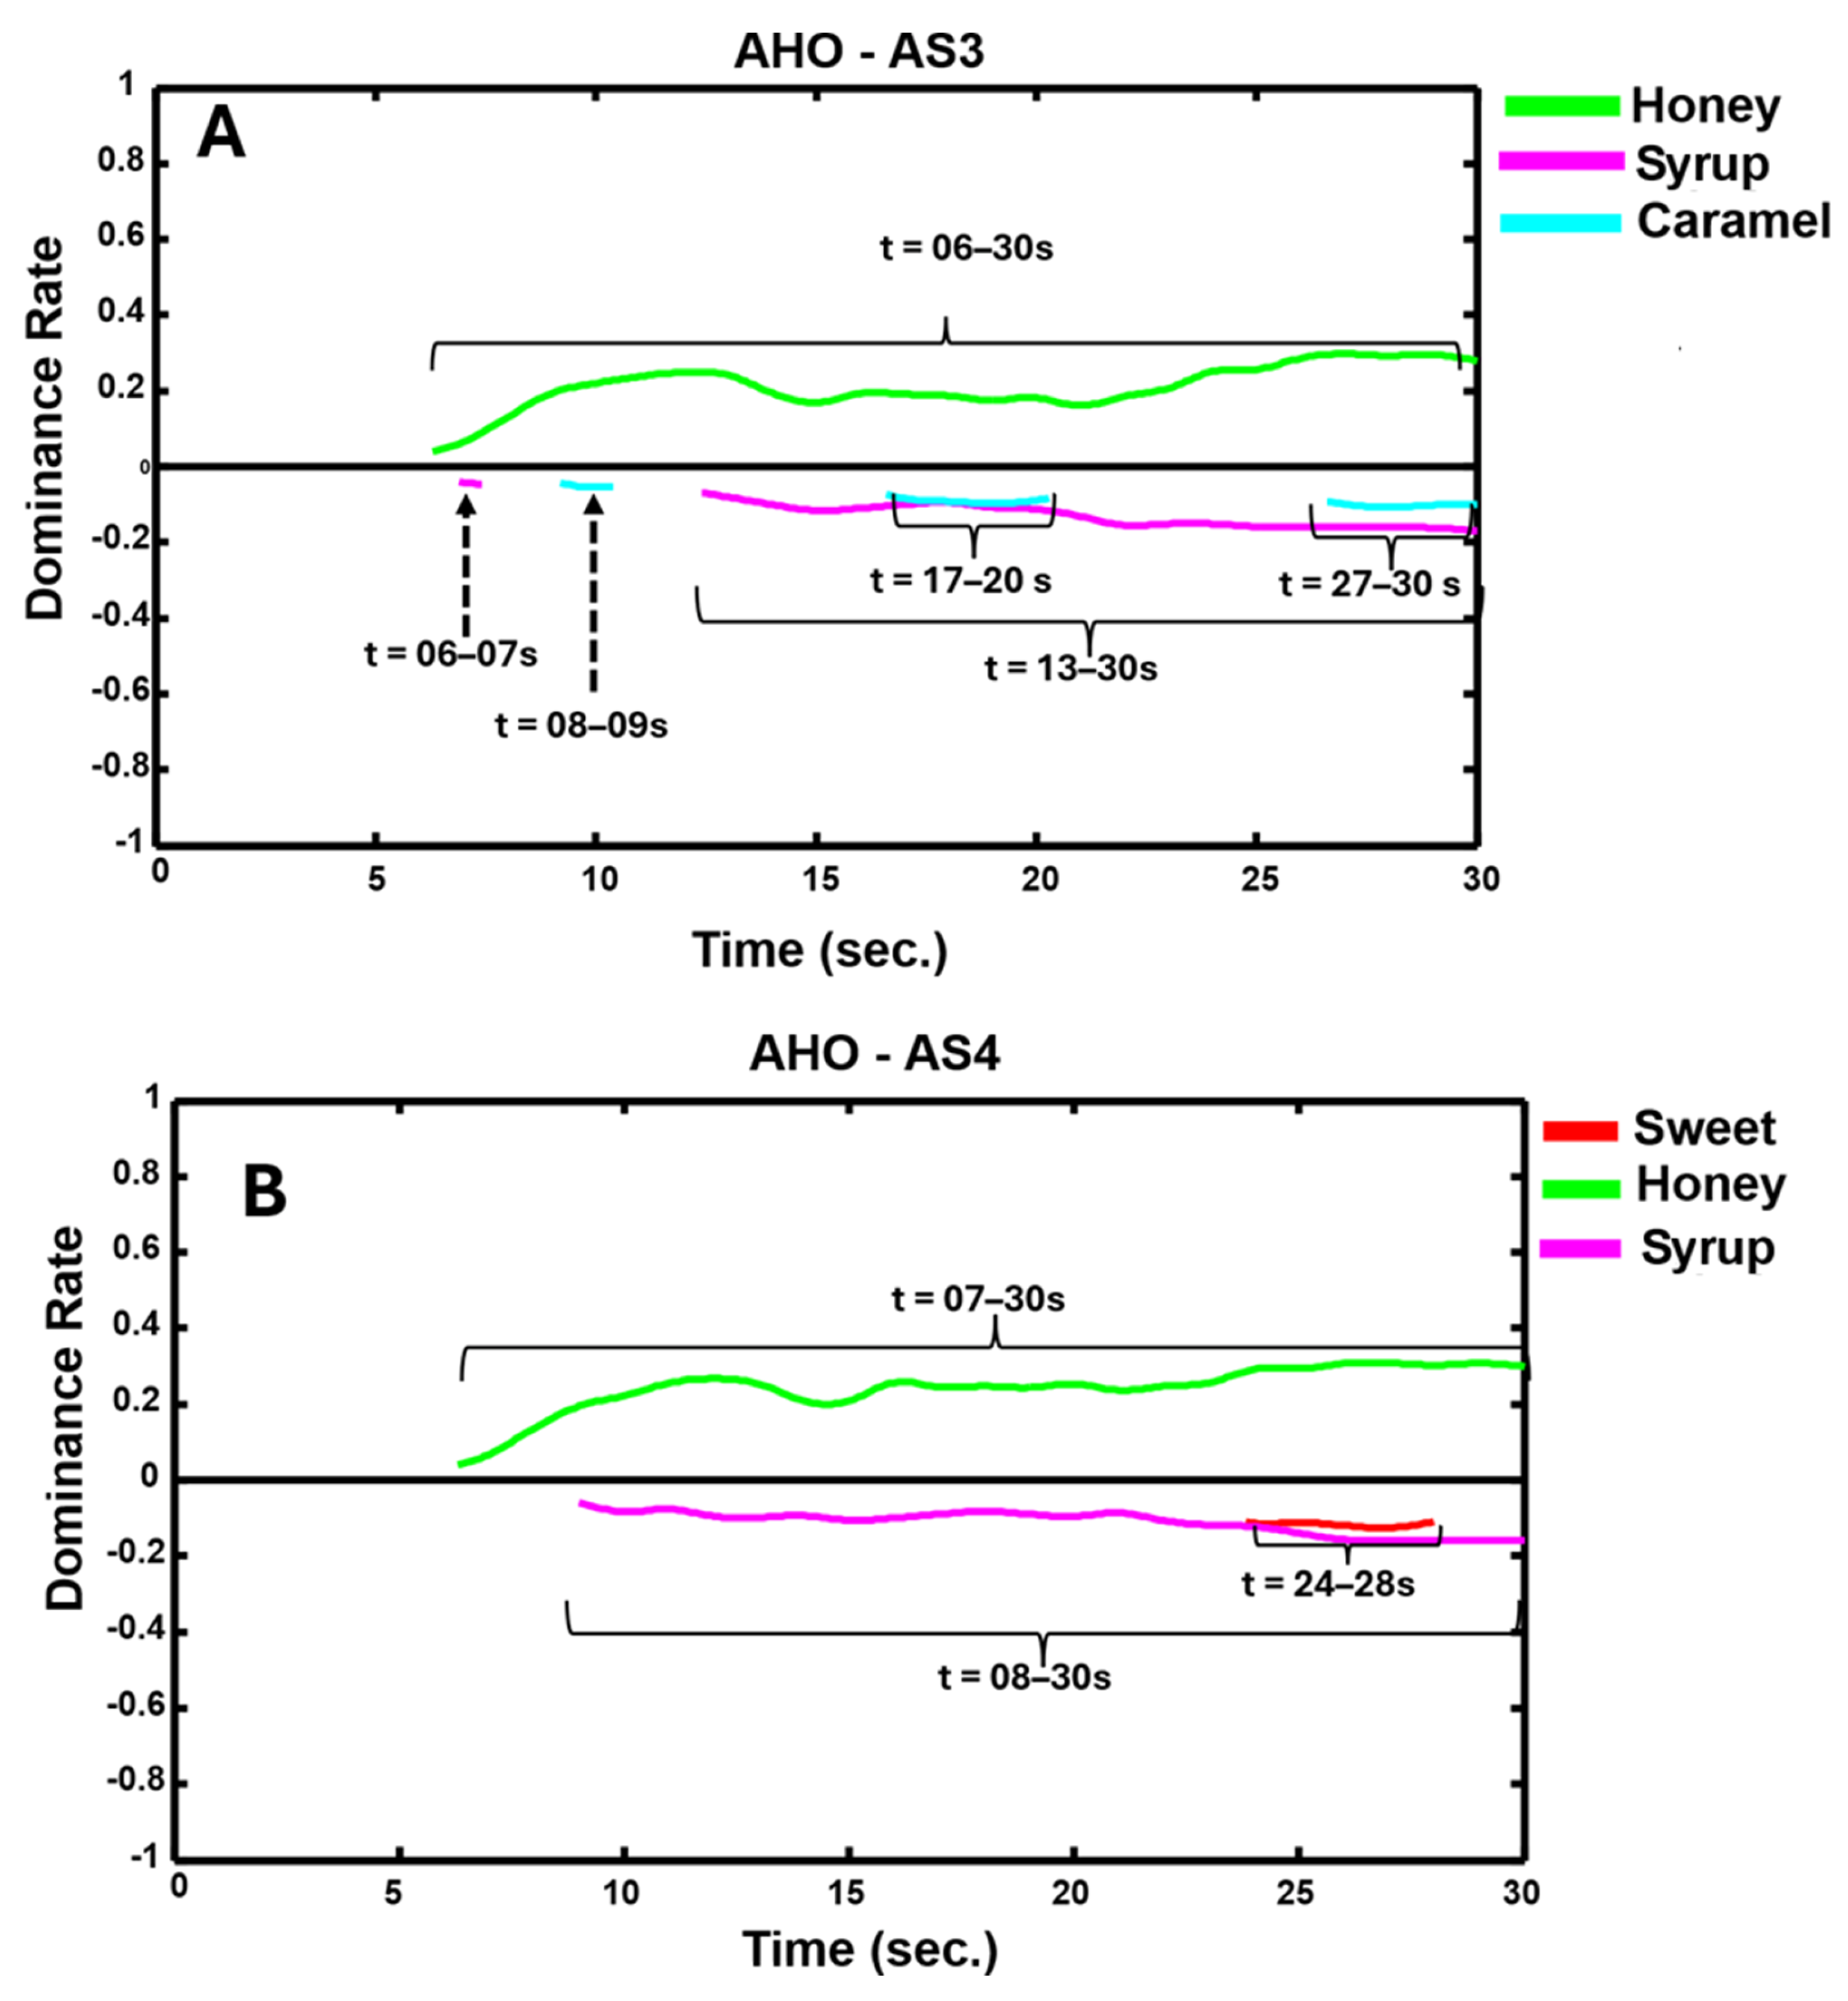
The comparison of the dynamic sensory behavior between the authentic honey and the adulterated samples is shown in Figure 3 and Figure 4. In the authentic honey, the honey flavor attribute predominated from t = 8 s to 15 s and again from t = 17 to 30 s (Figure 3A). In contrast, the sugar attribute was dominant from t = 26 to 28 s (Figure 3A) and from t = 26 to 30 s (Figure 3B) in adulterated samples ASI (80% non-adulterated honey + 20% HFCS) and AS2 (60% non-adulterated honey + 40% HFCS), respectively.
As the level of adulteration increased, greater sensory competition among attributes was observed. Compared with the authentic honey, in which the honey flavor remained dominant from t = 6 s to the end of the test (t = 30 s), sample AS3 (40% non-adulterated honey + 60% HFCS) exhibited competition between the caramel (t = 08 to 09 s; t = 17 to 20; t = 27 to 30 s) and syrup (t = 06 to 07 s; t = 13 to 30 s) attributes, with syrup showing a longer period of dominance during real-time consumption (Figure 4A).
A similar pattern was observed when comparing the authentic honey with sample AS4 (20% unadulterated honey + 80% HFCS). While the authentic honey was characterized by the dominance of the honey flavor throughout most of the evaluation period (t = 6–30 s), sample AS4 exhibited competition between the sweet and syrup attributes, with syrup remaining dominant for a longer period during consumption (Figure 4B).
The individual and comparative TDS curves demonstrate that honey flavor was the predominant sensory attribute in the authentic honey. This result is consistent with the Mexican standard NOM-004-SAG/GAN-2018 [10], which stablishes that honey should be free of abnormal or undesirable flavors.

3.2. Quantitative and Qualitative Validation of TDS Versus Static CATA and RATA Techniques

The results of Wilk’s Lambda (λ) test for each sensory technique are presented in Table 3. With the exception of the RATA technique, all sensory attributes significantly contributed to the differentiation of the honey samples.
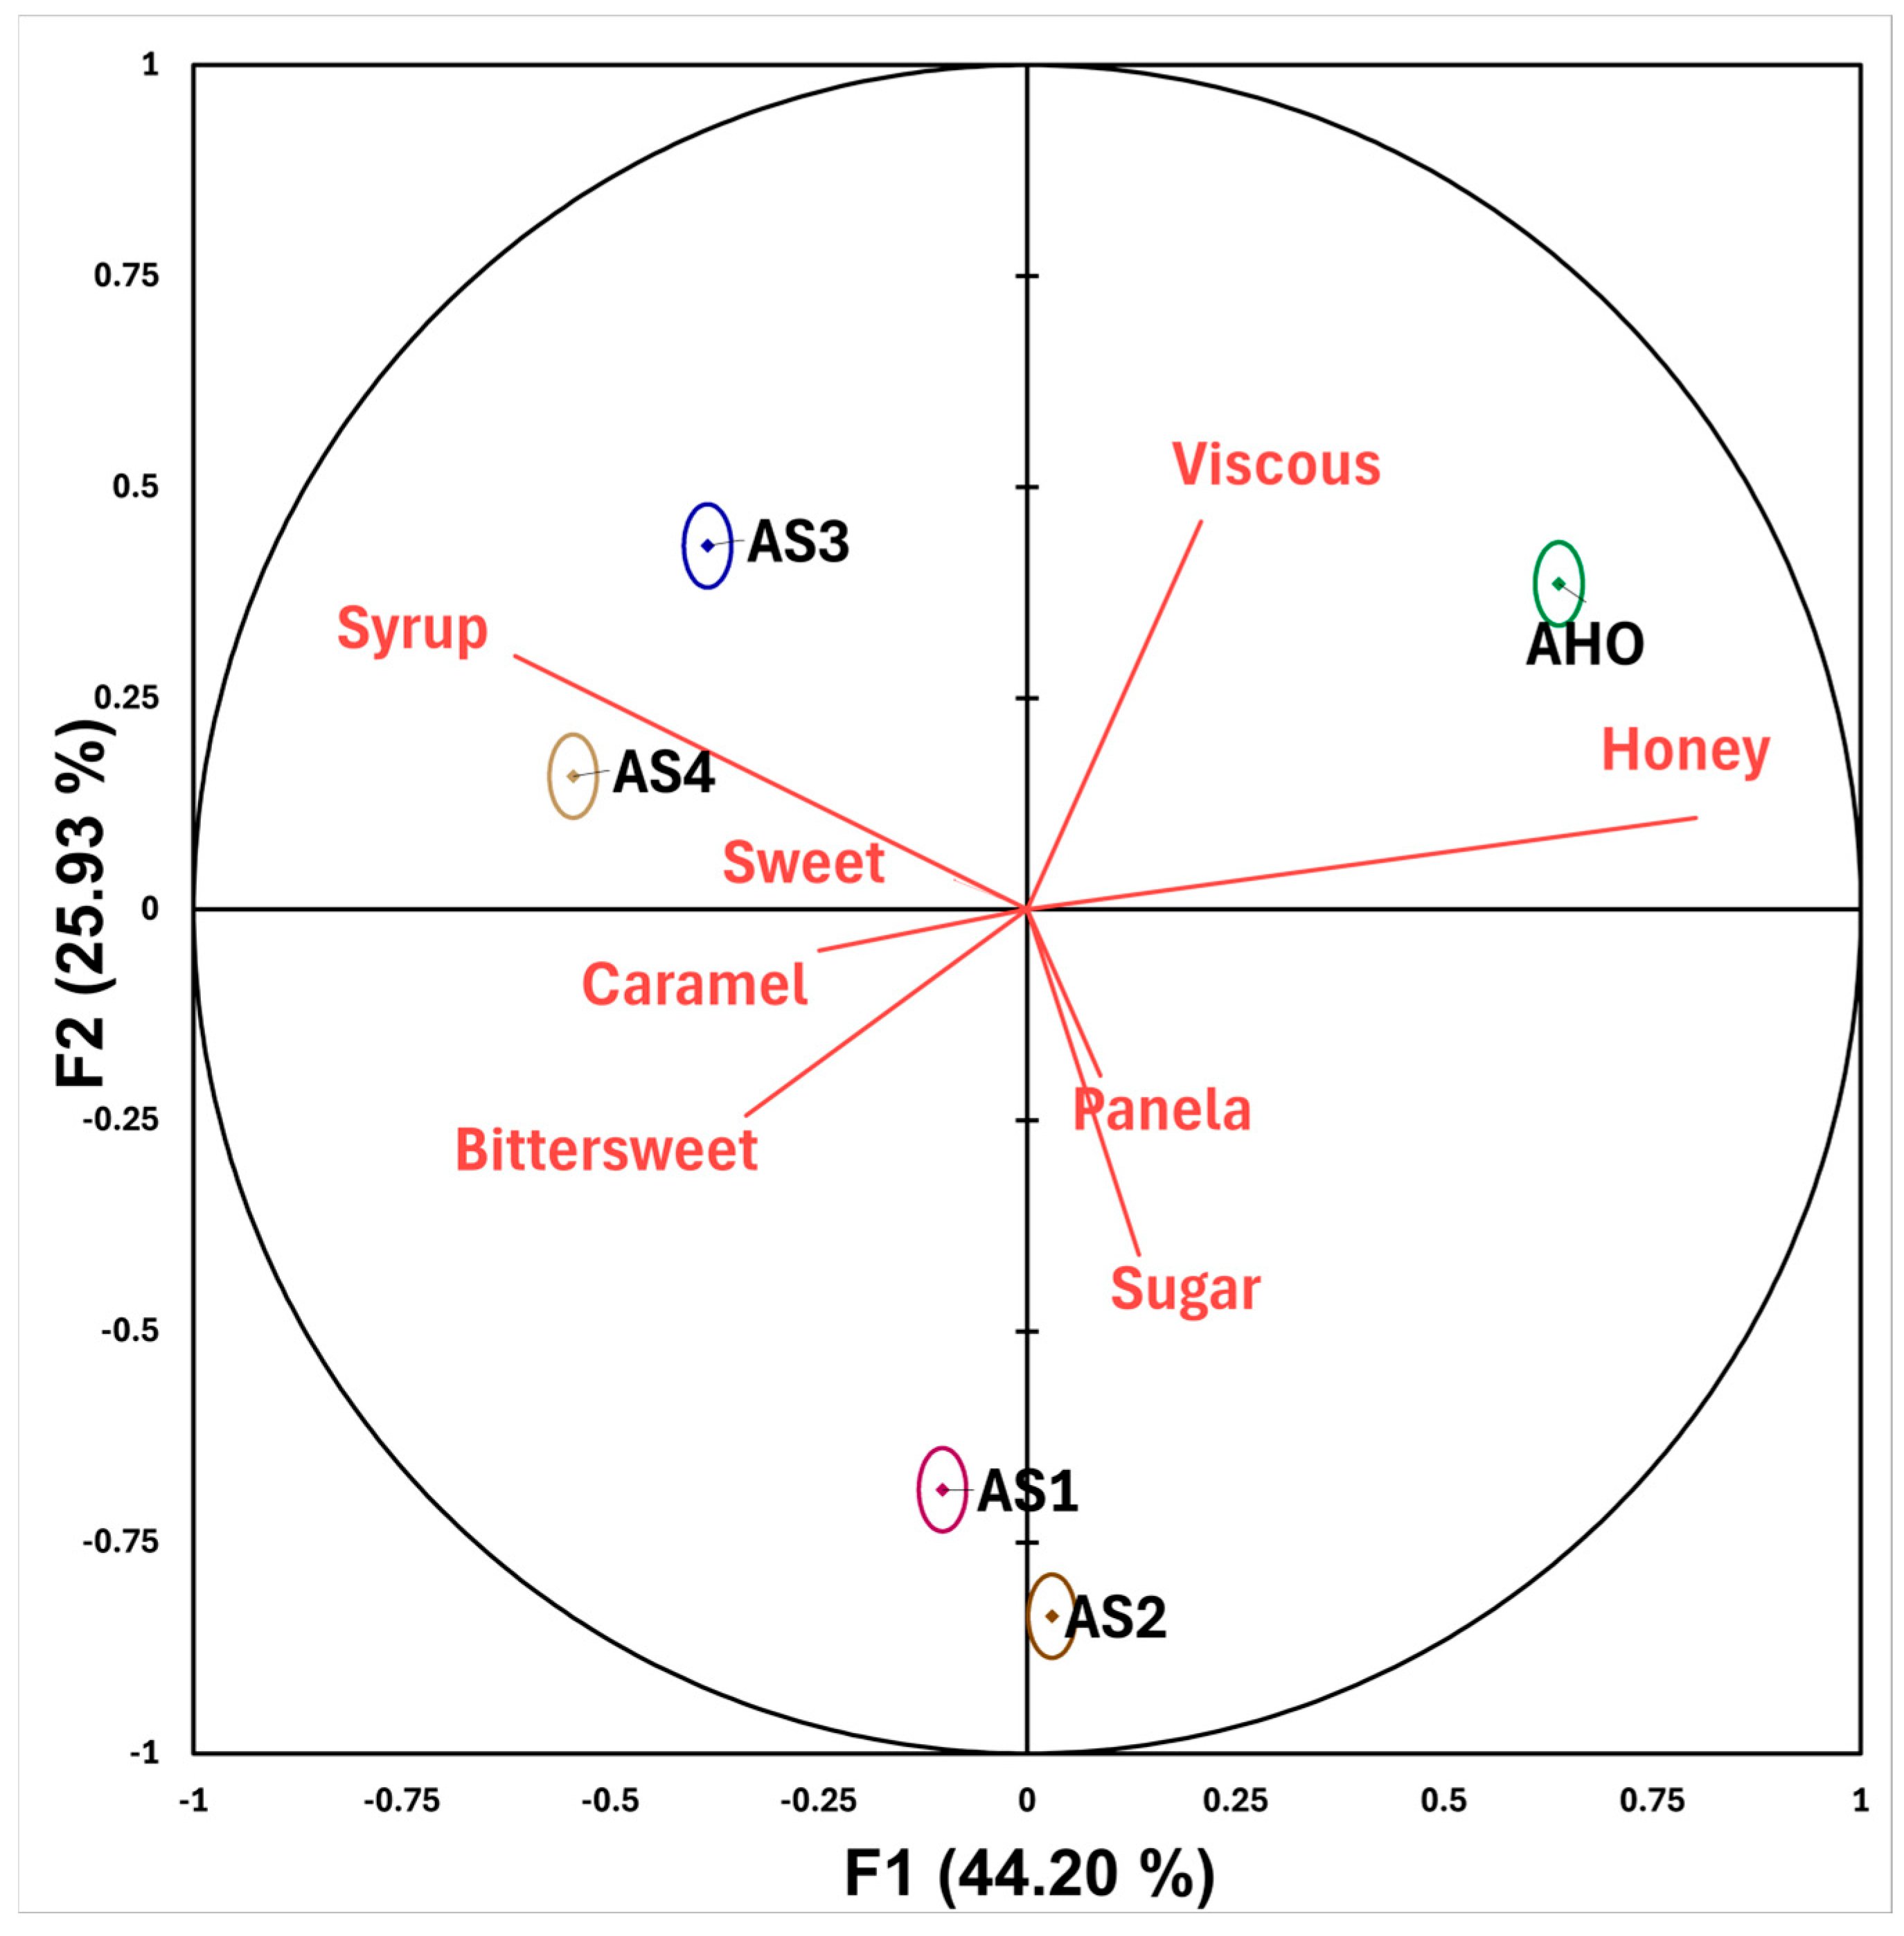
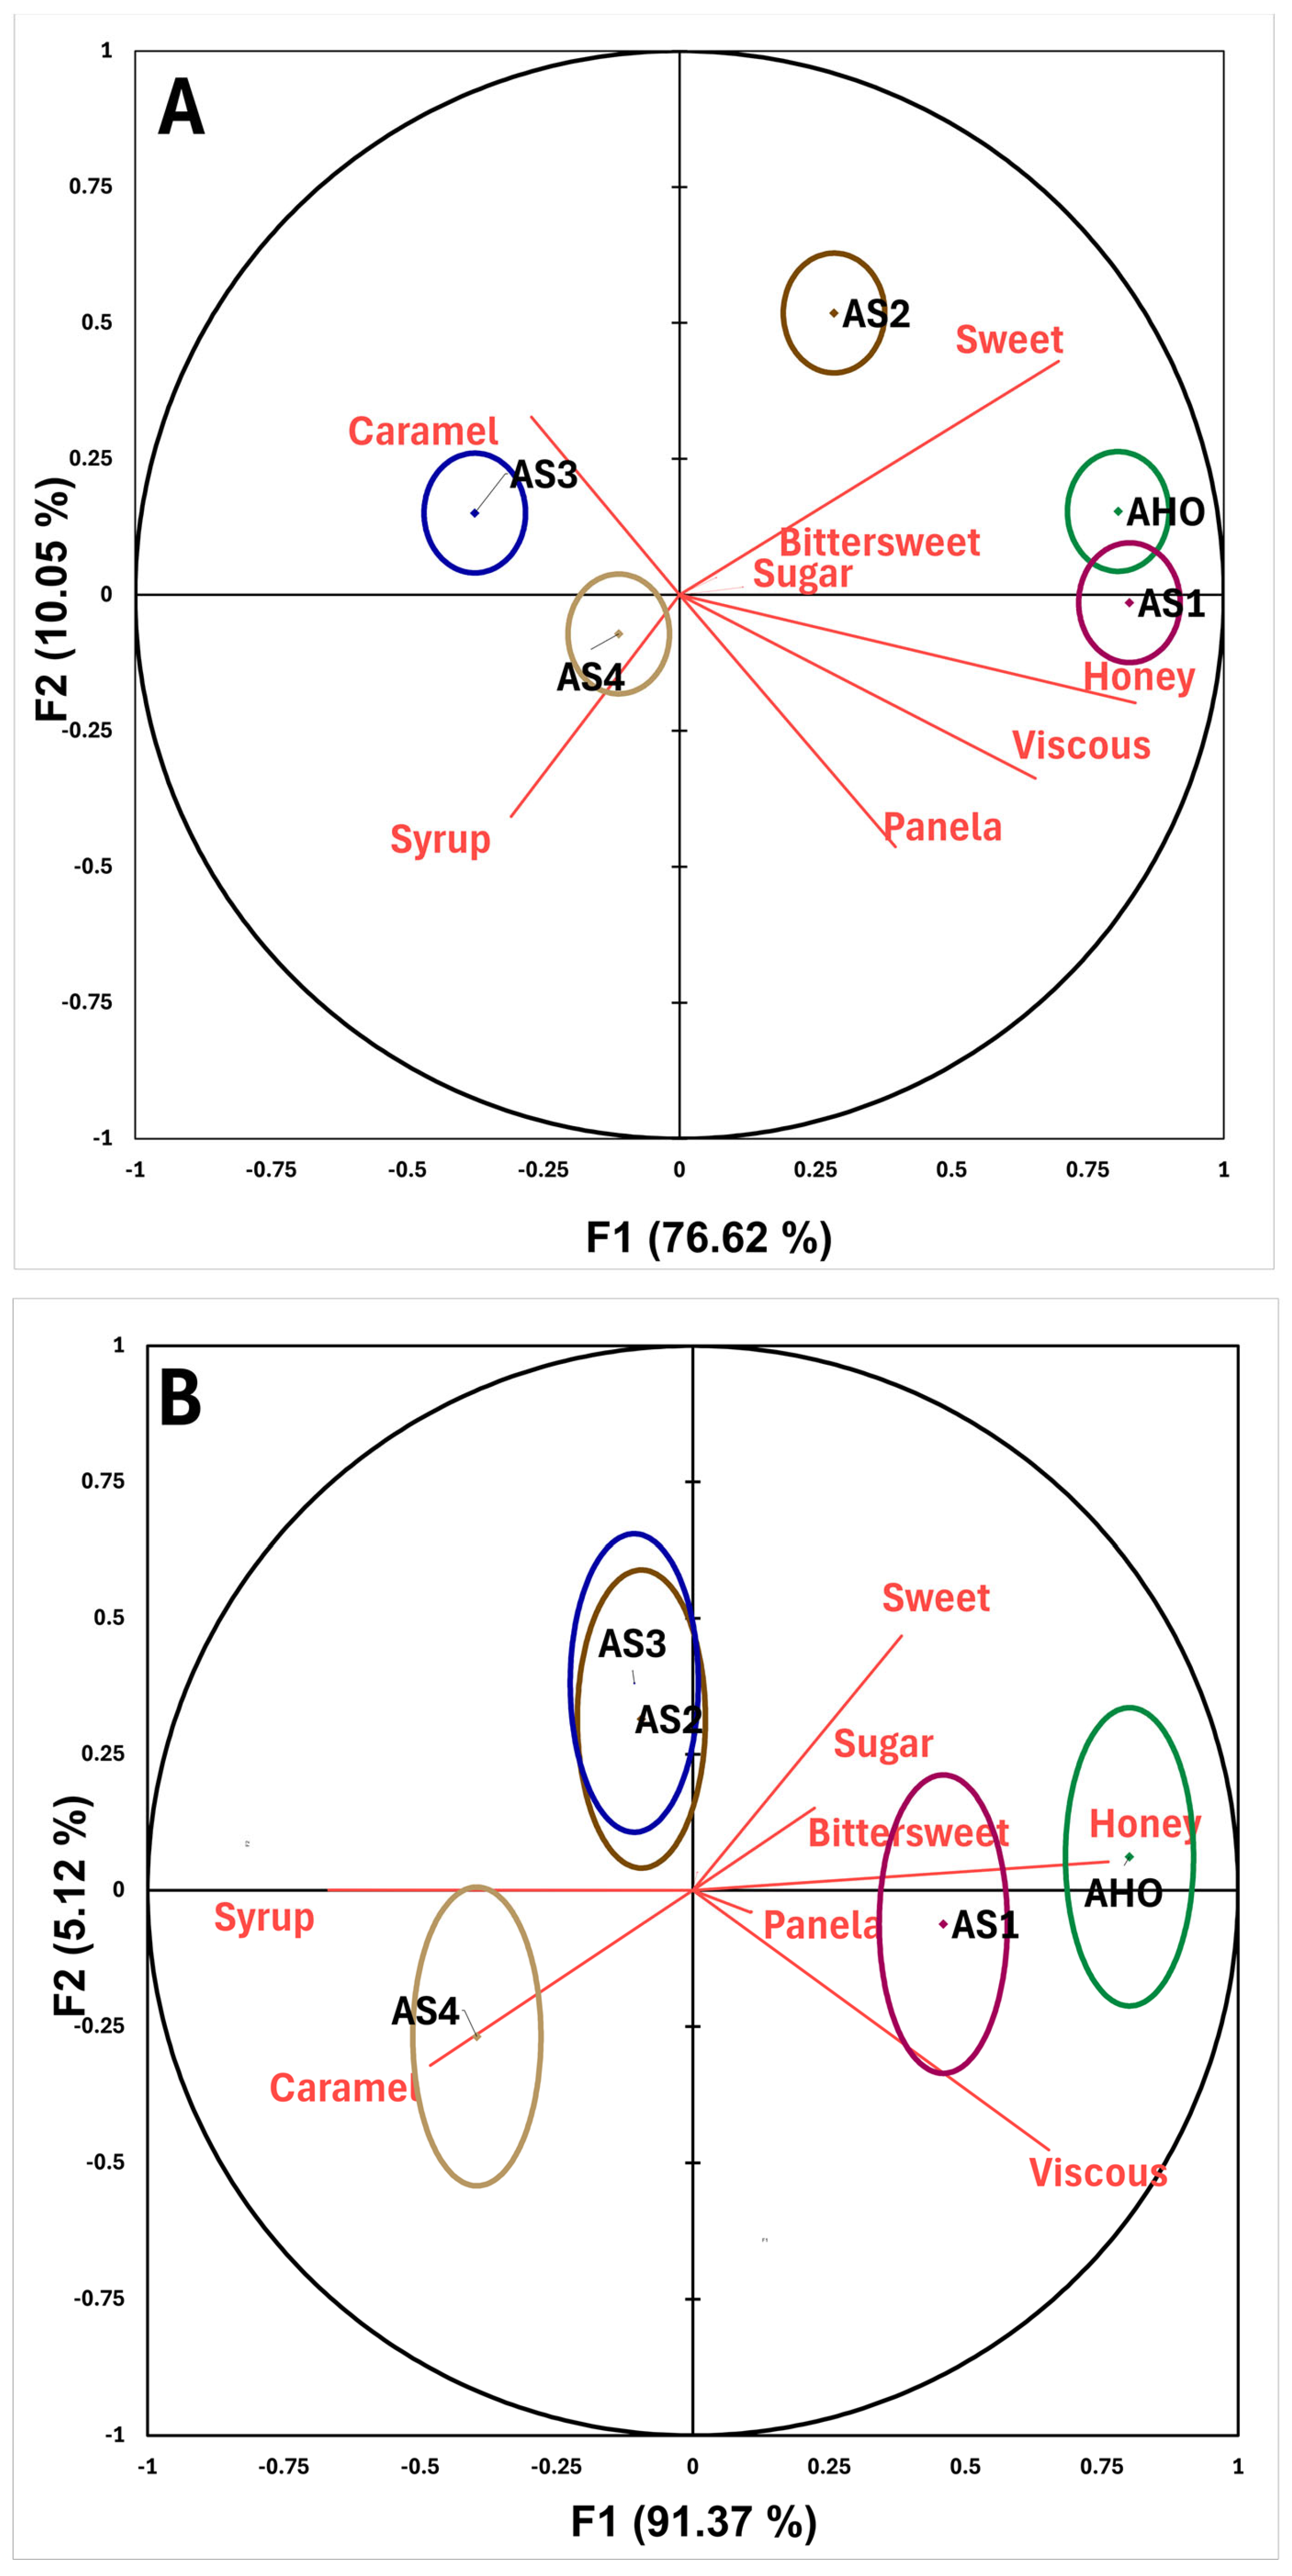
For the TDS technique (Figure 5), the confidence ellipses were relatively small and showed no overlap, indicating significant discrimination among samples (p < 0.05) within the sensory space. The authentic honey sample was characterized by the attributes honey and viscous, whereas adulterated samples AS1 and AS2 were associated with panela and sugar. In contrast, the samples with higher levels of adulteration (AS3 and AS4) were primarily associated with the attributes bittersweet, caramel, sweet and syrup.
For the CATA and RATA sensory techniques (Figure 6A and Figure 6B, respectively), the confidence ellipses exhibited greater dispersion and overlap than those obtained with TDS. In the CATA analysis (Figure 6A), overlap was observed between the authentic honey sample and adulterated sample AS1, whereas in the RATA analysis (Figure 6B), overlap occurred between adulterated samples AS2 and AS3. Regarding sample characterization, the CATA technique associated the authentic honey and sample AS1 with the attributes honey, viscous, bittersweet, and sugar, indicating similar sensory profiles. Sample AS2 was associated with the sweet attribute, whereas samples AS3 and AS4 were characterized by caramel and syrup.
The sensory configuration generated by the RATA technique (Figure 6B) showed a similar trend to that obtained with CATA. The authentic honey sample was characterized by a higher intensity of honey flavor, whereas sample AS1 was perceived with higher intensities of panela, bittersweet, and viscous attributes. Samples AS2 and AS3 exhibited similar sensory profiles, as evidenced by the overlap of their confidence ellipses, and were mainly characterized by the syrup flavor. In contrast, sample AS4 was associated with a greater intensity of the caramel attribute.
The sensory profiles obtained using TDS, CATA, and RATA demonstrate that honey adulteration significantly alters the sensory perception of consumers. For example, Bodor et al. [34] reported that the adulteration of honey with fructose syrup intensifies the perception of attributes such as sweet and caramel flavor. These changes are associated with biochemical modifications in specific compounds (e.g., 5-hydroxymethylfurfural and proline), leading to an increased presence of sugar-related compounds [8]. In contrast, Ramón-Canul et al. [7] They reported that adulteration affects the consumer’s sensory perception and cognitive aspects (emotions and memories), influencing their preferences and causing a rejection of adulterated honey.
The percentages of correct classification are presented in Table 4. Consumers using the TDS technique obtained better results in the classification of the honey samples evaluated, with values ranging between 69.77% and 85.38%. In comparison, consumers using the static CATA and RATA techniques obtained lower classification rates, ranging from 38.18% to 69.09% and from 6.36% to 63.64%, respectively. These findings are consistent with those reported by Bodor et al. [34], who observed that consumers were able to correctly identify honey samples containing up to 50% adulteration. Furthermore, the observed classification performance may be associated with an adequate understanding of the proposed sensory vocabulary, which has been reported to facilitate sample discrimination by consumers [25].

3.3. Correlation Between Dynamic and Static Results

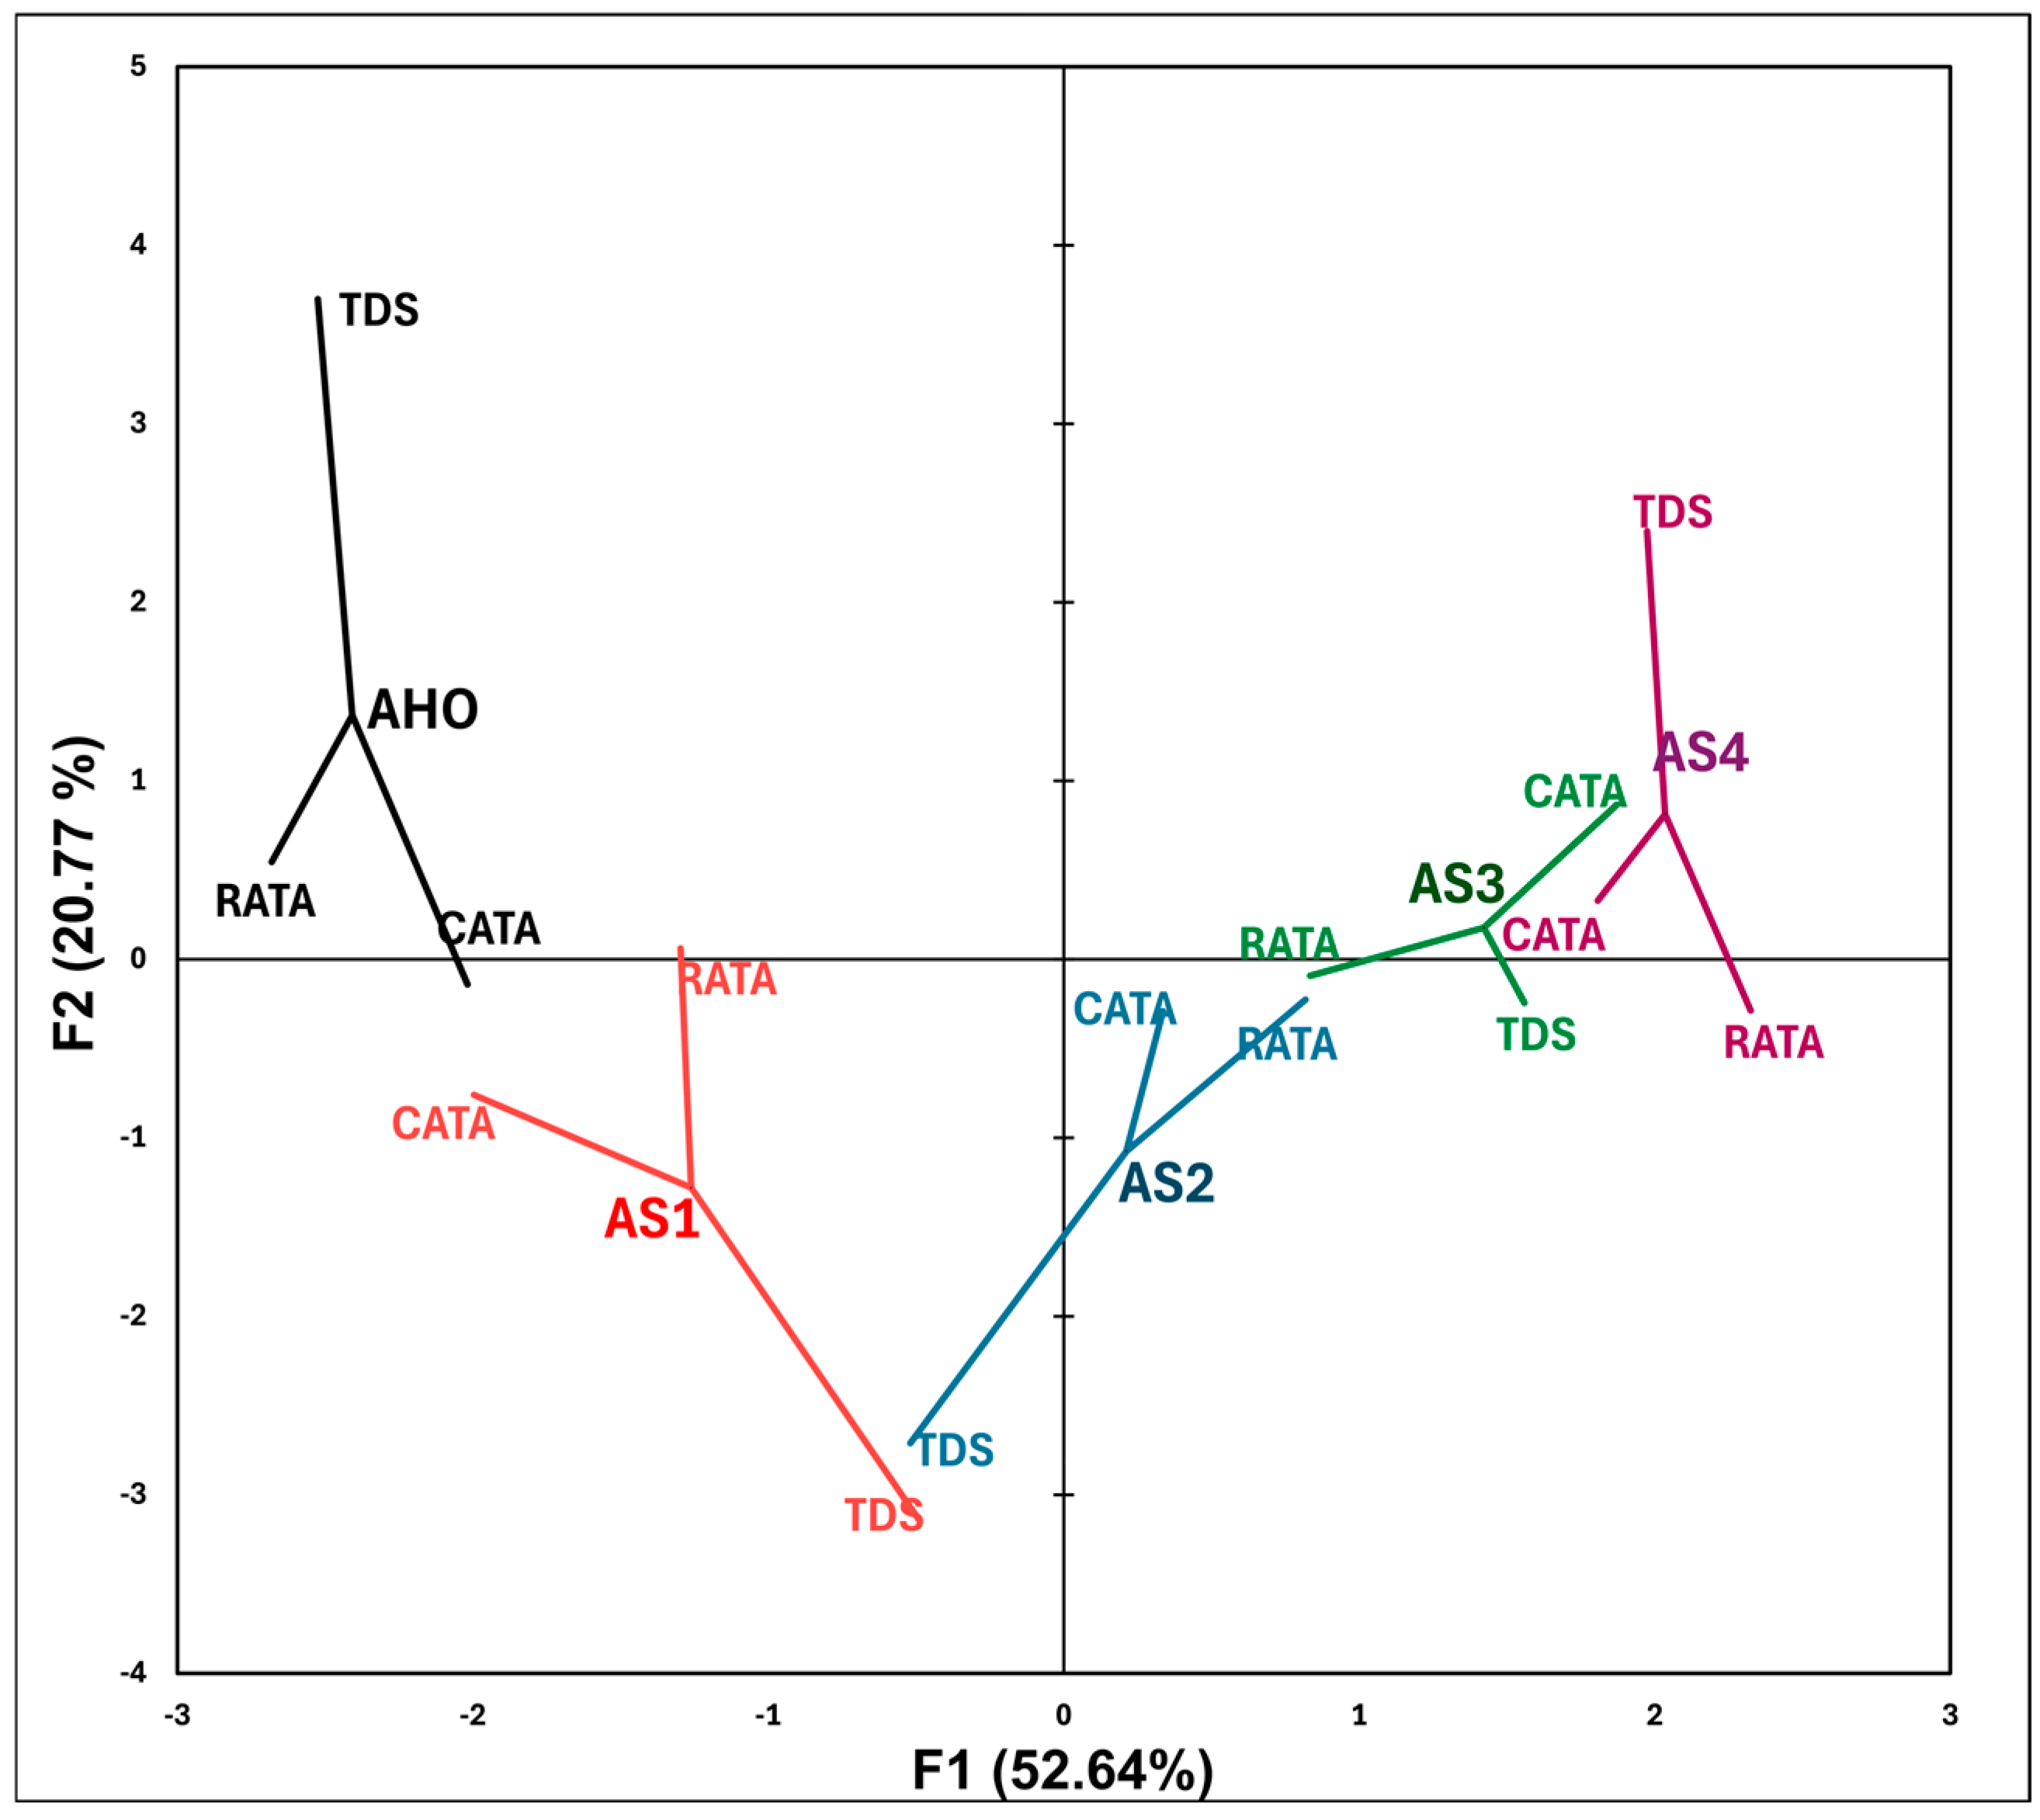
Figure 7 shows the partial clouds generated from the data obtained using the TDS, CATA, and RATA techniques for each honey sample. The distances between the centroids corresponding to each honey sample were similar, particularly for the samples with the highest levels of adulteration (AS3 and AS4), indicating a comparable sensory characterization across the three techniques. In contrast, greater differences among TDS, CATA, and RATA were observed for samples AHO, AS1, and AS2, as evidenced by the larger distance between the TDS configuration and the overall centroid relative to the other techniques.
Despite these differences, the Rv values of 0.70 (Rv TDS-CATA) and 0.82 (Rv TDS-RATA) indicate strong correlations between the sensory configurations generated by TDS and those obtained using the reference techniques, CATA and RATA [53]. These results are consistent with the findings of [54], who obtained values of Rv coefficient of 0.83 between the dynamic TDS technique and the static QDA method, suggesting a high degree of agreement between dynamic and conventional sensory profiling approaches.
The findings highlight four main aspects: First, the application of the TDS technique enabled the detection of differences (p < 0.05) for all sensory attributes evaluated, yielding results comparable with those obtained using the CATA technique. This finding suggests that, in the context of honey adulteration, it is important to include sensory attributes that consumers can readily identify and understand to facilitate the detection of sensory differences [55]. Furthermore, Nguyen and Wismer [56] indicated that dominant attributes may also be associated with consumer preference and choice, thereby contributing to sample discrimination.
Second, the confidence ellipses generated from the TDS data were smaller and showed no overlap, allowing the differentiation of all evaluated samples. In contrast, the confidence ellipses obtained from the CATA and RATA data exhibited overlap between some sample pairs [49].
Third, the highest percentages of correct classification were obtained using the TDS technique. This result may be related to the ability of dominant attributes to better represent consumer perception and the sensations that influence sensory evaluation [10]. Nevertheless, the partial cloud analysis revealed differences between the TDS results and those obtained using CATA and RATA for samples AHO, AS1, and AS2, despite the superior classification performance achieved by TDS. Factors such as panel performance and consumer consumption habits may have contributed to these differences [57,58]. In contrast, for the samples with the highest levels of adulteration (AS3 and AS4), the sensory characterization obtained using TDS was similar to that provided by the CATA and RATA techniques.
Finally, the highest correlation was observed between the TDS and RATA datasets, indicating a closer relationship between TDS and sensory methods that incorporate intensity evaluation than with methods based solely on the presence or absence of attributes, such as CATA. These results are consistent with those observed by Bruzzone et al. [54], who suggested that dominance and intensity represent closely related sensory concepts.

Limitations of the Research

The findings obtained in this research highlight the potential use of the TDS technique for identifying adulterated honey during real-time consumption. The use of the TDS technique for the analysis of honey adulteration provides insight into the behavior of honey during consumption, and its results differ from those obtained using static sensory techniques, where relationships between attributes and products are shown without indicating when sensory changes associated with adulteration occur.
However, the results obtained with this sensory technique should be correlated with instrumental data to identify the volatile compounds responsible for the flavors perceived by consumers and, additionally, as a means of validating the sensory results of adulterated honeys.
Furthermore, due to the ease of application of the TDS technique, sensory studies could be conducted with beekeepers, taking advantage of their sensory perception, which has been shown to differ from that of consumers [26].

4. Conclusions

The results of this investigation indicate that the TDS technique yielded the best performance in the following factors: (1) The highest sample discrimination (100% effectiveness) was obtained based on the probability values of Wilk’s Lambda test. This was confirmed by the 95% confidence ellipses, which showed no overlap between samples. (2) The highest percentages of correct classification were obtained (between 69.77% and 85.38%) compared with those obtained using the CATA (38.18% to 69.09%) and RATA (6.36% to 3.64%) techniques. (3) Similar honey sample characterizations and high correlation values were obtained among TDS, CATA, and RATA, with Rv TDS-CATA = 0.70 and Rv TDS-RATA = 0.82. In addition, the TDS curves demonstrated that the honey flavor attribute was the only one that remained unchanged in the authentic sample, whereas in the adulterated samples, sensory attributes such as sugar, sweetness, and syrupiness predominated. Furthermore, the TDS Vmax and Tmax indicators showed that samples with higher levels of adulteration were easier to identify based on their sugar and syrup attributes. Therefore, these TDS indicators can also serve as important parameters for identifying adulterated honey. Based on these findings, the TDS technique can be considered a versatile tool for recording dynamic changes during real-time consumption, not only of adulterated honey but also of other foods.

Author Contributions

Conceptualization, A.C.-P. and E.d.J.R.-R.; methodology, E.d.J.R.-R., A.C.-P., L.S.-A., J.A.-A., J.V. and L.G.R.-C.; software, V.D.C.-O., A.C.-P., L.S.-A. and J.A.-A.; validation, V.D.C.-O., J.V. and L.G.R.-C.; formal analysis, A.C.-P., L.S.-A., J.A.-A., J.V., H.M.-V. and L.G.R.-C.; investigation, E.d.J.R.-R., A.C.-P., L.S.-A. and J.A.-A.; resources, L.S.-A., H.M.-V., J.V. and L.G.R.-C.; data curation, J.A.-L., L.S.-A., J.A.-A., J.V., E.H.-L. and L.G.R.-C.; writing—original draft preparation, E.d.J.R.-R., A.C.-P., L.S.-A. and. J.A.-A.; writing—review and editing, A.C.-P., E.H.-L. and E.d.J.R.-R.; visualization, L.S.-A., J.A.-A., J.V. and L.G.R.-C.; supervision, A.C.-P., E.d.J.R.-R. and L.S.-A.; project administration, E.d.J.R.-R., J.A.-L. and A.C.-P. All authors have read and agreed to the published version of the manuscript.

Funding

Research and development for this study were financed through resources from the Tecnológico Nacional de México: Convocatoria Proyectos de Investigación Científica, Humanistica, de Desarrollo Tecnológico e Innovación 2026, de los Institutos Tecnológicos Federales, Descentralizados y Centros under code 25298.26-PD (entitled Soberania alimentaria y protección de la salud: modelo integral de autenticación de miel mexicana mediante sensometria validada con quimiometria avanzada).

Institutional Review Board Statement

This study was conducted in accordance with the ethical principles of the Declaration of Helsinki of the World Medical Association for research involving human participants. All participants provided informed consent prior to participation. As the study consisted solely of sensory evaluations and did not involve medical interventions or any foreseeable risk to participants, formal approval from an ethics committee was not required. However, the project was approved by the Postgraduate and Research Department of the Tecnologico Nacional de Mexico Campus Huatusco.

Informed Consent Statement

Informed consent was obtained from all participants involved in the sensory evaluation.

Data Availability Statement

The original contributions presented in this study are included in the article. Further inquiries can be directed to the corresponding authors.

Acknowledgments

The authors thank the National Technological Institute of Mexico, Huatusco Campus, for all the support and facilities provided to carry out the sensory evaluations performed in this research.

Conflicts of Interest

The authors declare no conflicts of interest.

References

  1. Luna-Olea, R.A.; Omaña-Silvestre, J.M.; Quintero-Ramírez, J.M.; Farrera-Vázquez, I.C. Logística de producción de miel en México y su mercado nacional [Honey production logistics in Mexico and its domestic market]. Rev. Mex. Cienc. Pecu. 2025, 16, 646–660. [Google Scholar] [CrossRef]
  2. He, Y.; Bai, X.; Xiao, Q.; Liu, F.; Zhou, L.; Zhang, C. Detection of adulteration in food based on nondestructive analysis techniques: A review. Crit. Rev. Food Sci. Nutr. 2021, 61, 2351–2371. [Google Scholar] [CrossRef] [PubMed]
  3. Statistisches Bundesamt (Destatis). Global Honey Bee Population on the Rise. Available online: https://www.destatis.de/EN/Themes/Countries-Regions/International-Statistics/Data-Topic/AgricultureForestryFisheries/Bees.html (accessed on 26 May 2026).
  4. Food and Agriculture Organization of the United Nations (FAO). Production Quantity of Honey (Natural) in 2020; Livestock Primary/World Regions/Production Quantity (2020); FAOSTAT: Rome, Italy, 2022; Available online: https://www.fao.org/faostat/en/#home (accessed on 11 April 2026).
  5. Ramírez Mijangos, K.T.; Palacios Rangel, M.; Aguilar Ávila, J.; Ocampo Ledesma, J.G. Producción y comercialización de miel en el estado de Oaxaca, México [Production and marketing of honey in the state of Oaxaca, Mexico]. Revere. Argent. Investig. Negoc. 2022, 8, 47–60. [Google Scholar]
  6. García-Pérez, M.L.; Fong-Reynoso, C. Los sistemas de información como estrategia contra la adulteración de la miel mexicana [Information systems as a strategy against adulteration of Mexican honey]. Estud. Soc. Rev. Aliment. Contemp. Desarro. Reg. 2023, 33, e231341. [Google Scholar] [CrossRef]
  7. Ramón-Canul, L.G.; Cabal-Prieto, A.; Rodríguez-Ramírez, T.A.; Sánchez-Arellano, L.; Ramírez-Sucre, M.O.; Rodríguez-Buenfil, I.M.; Valdivia-Sánchez, J.; Can-Herrera, L.A.; Herrera-Corredor, J.A.; Ramírez-Rivera, E.J. Pivot© and check-all-that-apply techniques for the analysis of honey adulteration: Impact on consumer liking, emotions and memories. Int. J. Food Sci. Technol. 2023, 58, 3865–3875. [Google Scholar] [CrossRef]
  8. Liu, T.; Ming, K.; Wang, W.; Qiao, N.; Qiu, S.; Yi, S.; Huang, X.; Luo, L. Discrimination of honey and syrup-based adulteration by mineral element chemometrics profiling. Food Chem. 2021, 343, 128455. [Google Scholar] [CrossRef] [PubMed]
  9. Hlavacek, R.J. Codex alimentarius commission. J. Am. Oil Chem. Soc. 1981, 58, 232–234. [Google Scholar]
  10. NOM-004-SAG/GAN-2018; Producción de Miel y Especificaciones. Diario Oficial de La Federación (DOF): Ciudad de México, Mexico, 2020. Available online: https://www.dof.gob.mx/nota_detalle_popup.php?codigo=5592435 (accessed on 5 May 2025).
  11. Wang, Q.; Zhao, H.; Zhu, M.; Zhang, J.; Cheng, N.; Cao, W. Method for identifying acacia honey adulterated by resin absorption: HPLC-ECD coupled with chemometrics. LWT-Food Sci. Technol. 2020, 118, 108863. [Google Scholar] [CrossRef]
  12. Truchado, P.; Martos, I.; Bortolotti, L.; Sabatini, A.G.; Ferreres, F.; Tomás-Barberán, F.A. Use of quinoline alkaloids as markers of the floral origin of chestnut honey. J. Agric. Food Chem. 2009, 57, 5680–5686. [Google Scholar] [CrossRef] [PubMed]
  13. Wang, S.; Guo, Q.; Wang, L.; Lin, L.; Shi, H.; Cao, H.; Cao, B. Detection of honey adulteration with starch syrup by high performance liquid chromatography. Food Chem. 2015, 172, 669–674. [Google Scholar] [CrossRef] [PubMed]
  14. Ruiz-Matute, A.I.; Rodriguez-Sanchez, S.; Sanz, M.L.; Martinez-Castro, I. Detection of adulterations of honey with high fructose syrups from inulin by GC analysis. J. Food Compos. Anal. 2010, 23, 273–276. [Google Scholar] [CrossRef]
  15. Juárez-Barrientos, J.M.; Tejeda-Paz, M.M.; Ramírez-Rivera, E.J.; Aguirre-Cruz, A.; Rodríguez-Miranda, J.; Martínez-Sánchez, C.E.; Herman-Lara, E. Use of quantitative descriptive analysis (QDA) coupled with multivariate statistical methods to detection and discrimination of adulterated fresh cheeses. J. Sens. Stud. 2018, 34, e12479. [Google Scholar] [CrossRef]
  16. Patrignani, M.; Ciappini, M.C.; Tananaki, C.; Fagúndez, G.A.; Thrasyvoulou, A.; Lupano, C.E. Correlations of sensory parameters with physicochemical characteristics of Argentinean honeys by multivariate statistical techniques. Int. J. Food Sci. Technol. 2018, 53, 1176–1184. [Google Scholar] [CrossRef]
  17. Kruzik, V.; Grégrová, A.; Rajchl, A.; Čížková, H. Study on honey quality evaluation and detection of adulteration by analysis of volatile compounds. J. Apic. Sci. 2017, 61, 17–27. [Google Scholar] [CrossRef]
  18. Rodrigues, N.P.A.; Givisiez, P.E.N.; Queiroga, R.C.R.E.; Azevedo, P.S.; Gebreyes, W.A.; Oliveira, C.J.B. Milk adulteration: Detection of bovine milk in bulk goat milk produced by smallholders in northeastern Brazil by a duplex PCR assay. J. Dairy Sci. 2012, 95, 2749–2752. [Google Scholar] [CrossRef] [PubMed]
  19. Dairou, V.; Sieffermann, J.-M. A Comparison of 14 Jams Characterized by Conventional Profile and a Quick Original Method, the Flash Profile. J. Food Sci. 2002, 67, 826–834. [Google Scholar] [CrossRef]
  20. Lawless, H.T.; Heymann, H. Sensory Evaluation of Food: Principles and Practices; Springer Science & Business Media: New York, NY, USA, 2010. [Google Scholar] [CrossRef]
  21. Pineau, N.; Schlich, P.; Cordelle, S.; Mathonnière, C.; Issanchou, S.; Imbert, A.; Rogeaux, M.; Etiévant, P.; Köster, E. Temporal dominance of sensations: Construction of the TDS curves and comparison with time–intensity. Food Qual. Prefer. 2009, 20, 450–455. [Google Scholar] [CrossRef]
  22. Bemfeito, R.M.; Rodrigues, J.F.; Silva, J.G.; Abreu, L.R. Temporal dominance of sensations sensory profile and drivers of liking of artisanal Minas cheese produced in the region of Serra da Canastra, Brazil. J. Dairy Sci. 2016, 99, 7886–7897. [Google Scholar] [CrossRef] [PubMed]
  23. Rodrigues, J.; Souza, V.; de Lima, R.; Carneiro, J.; Nunes, C.; Pinheiro, A. Temporal dominance of sensations (TDS) panel behavior: A preliminary study with chocolate. Food Qual. Prefer. 2016, 54, 14–21. [Google Scholar] [CrossRef]
  24. Ramos-Gabriel, S.U.; Herrera-Corredor, J.A.; Gamboa-Alvarado, J.G.; Ramírez-Rivera, E.J. Impact of fermented whey addition on resulting sensory characteristics and consumer preference of ripened cheeses. Emir. J. Food Agric. 2019, 31, 449–458. [Google Scholar] [CrossRef]
  25. Piana, M.L.; Cianciabella, M.; Daniele, G.M.; Badiani, A.; Rocculi, P.; Tappi, S.; Gatti, E.; Marcazzan, G.L.; Magli, M.; Medoro, C.; et al. Influence of the Physical State of Two Monofloral Honeys on Sensory Properties and Consumer Satisfaction. Foods 2023, 12, 986. [Google Scholar] [CrossRef] [PubMed]
  26. Vidal, L.; Tárrega, A.; Antúnez, L.; Ares, G.; Jaeger, S.R. Comparison of correspondence analysis based on Hellinger and chi-square distances to obtain sensory spaces from check-all-that-apply (CATA) questions. Food Qual. Prefer. 2015, 43, 106–112. [Google Scholar] [CrossRef]
  27. Oppermann, A.; Graaf, C.; Scholten, E.; Stieger, M.; Piqueras-Fiszman, B. Comparison of Rate-All-That-Apply (RATA) and Descriptive sensory Analysis (DA) of model double emulsions with subtle perceptual differences. Food Qual. Prefer. 2017, 56, 55–68. [Google Scholar] [CrossRef]
  28. Ramírez-Rivera, E.J.; Díaz-Rivera, P.; Ramón-Canul, L.G.; Juárez-Barrientos, J.M.; Rodríguez-Miranda, J.; Herman-Lara, E.; Prinyawiwatkul, W.; Herrera-Corredor, J.A. Comparison of performance and quantitative descriptive analysis sensory profiling and its relationship to consumer liking between the artisanal cheese producers panel and the descriptive trained panel. J. Dairy Sci. 2018, 101, 5851–5864. [Google Scholar] [CrossRef] [PubMed]
  29. Cohen, J. Statistical Power Analysis for the Behavioral Sciences, 2nd ed.; Taylor & Francis Group: Milton Park, UK, 1988; pp. 50–92. [Google Scholar] [CrossRef]
  30. Fakhlaei, R.; Selamat, J.; Khatib, A.; Faizal, A.; Razis, A.F.A.; Sukor, R.; Ahmad, S.; Babadi, A.A. The Toxic Impact of Honey Adulteration: A Review. Foods 2020, 9, 1538. [Google Scholar] [CrossRef] [PubMed]
  31. Brar, D.S.; Nayik, G.A.; Aggarwal, A.K.; Kaur, S.; Nanda, V.; Saxena, S.; Gautam, S.; Ramniwas, S.; Tolcha, T.D. Chemical and functional characteristics to detect sugar syrup adulteration in honey from different botanical origins. Int. J. Food Prop. 2023, 26, 1390–1413. [Google Scholar] [CrossRef]
  32. Tosun, M. Detection of adulteration in honey samples added various sugar syrups with 13C/12C isotope ratio analysis method. Food Chem. 2013, 138, 1629–1632. [Google Scholar] [CrossRef] [PubMed]
  33. Islam, M.K.; Sostaric, T.; Lim, L.Y.; Hammer, K.; Locher, C. Sugar Profiling of Honeys for Authentication and Detection of Adulterants Using High-Performance Thin Layer Chromatography. Molecules 2020, 25, 5289. [Google Scholar] [CrossRef] [PubMed]
  34. Bodor, Z.; Kovacs, Z.; Rashed, M.S.; Kókai, Z.; Dalmadi, I.; Benedek, C. Sensory and Physicochemical Evaluation of Acacia and Linden Honey Adulterated with Sugar Syrup. Sensors 2020, 20, 4845. [Google Scholar] [CrossRef] [PubMed]
  35. Piana, M.L.; Persano Oddo, L.; Bentabol, A.; Bruneau, E.; Bogdanov, S.; Guyot Declerck, C. Sensory analysis applied to honey: State of the art. Apidologie 2004, 35, S26–S37. [Google Scholar] [CrossRef]
  36. Deneulin, P.; Reverdy, C.; Rébénaque, P.; Danthe, E.; Mulhauser, B. Evaluation of the Pivot© Profile, a new method to characterize a large variety of a single product: Case study on honeys from around the world. Food Res. Int. 2018, 106, 29–37. [Google Scholar] [CrossRef] [PubMed]
  37. Husson, F.; Lee, S.D.; Pagès, J. Which value can be granted to sensory profiles given by consumers? Methodology and results. Food Qual. Prefer. 2001, 12, 291–296. [Google Scholar] [CrossRef]
  38. Worch, T.; Lê, S.; Punter, P. How reliable are the consumers? Comparison of sensory profiles from consumers and experts. Food Qual. Prefer. 2010, 21, 309–318. [Google Scholar] [CrossRef]
  39. ISO 8586-1; Sensory Analysis—General Guidance for the Selection, Training, and Monitoring of Assessors, Part 1—Selected Assessors. International Organization for Standardization: Geneva, Switzerland, 1993.
  40. ISO 11035; Analyse Sensorielle—Recherche et Sélection de Descripteurs pour l’Élaboration d’un Profil Sensoriel par Aproche Multidimensionnelle [Sensory Analysis—Identification and Selection of Descriptors for Establishing a Sensory Profile by a Multidimensional Approach]. International Organization for Standardization: Saint-Denis, France, 1994.
  41. ISO 5496; Sensory Analysis—Methodology—Initiation and Training of Assessors in the Detection and Recognition of Odors. International Organization for Standardization: Geneva, Switzerland, 2005.
  42. ISO 4120; Sensory Analysis—Methodology—Triangle Test. International Organization for Standardization: Geneva, Switzerland, 2004.
  43. ISO 10399; Sensory Analysis—Methodology—Duo-Trio Test. International Organization for Standardization: Geneva, Switzerland, 2004.
  44. Tripodi, G.; Merlino, M.; Torre, M.; Condurso, C.; Verzera, A.; Cincotta, F. Characterization of Aroma, Sensory Properties, and Consumer Acceptability of Honey from Capparis spinosa L. Foods 2025, 14, 1978. [Google Scholar] [CrossRef] [PubMed]
  45. MacFie, H.J.; Bratchell, N.; Greenhoff, K.; Vallis, L.V. Designs to balance the effect of order of presentation and first-order carry-over effects in hall tests. J. Sens. Stud. 1989, 4, 129–148. [Google Scholar] [CrossRef]
  46. Jaeger, S.R.; Cardello, A.V. Direct and indirect hedonic scaling methods: A comparison of the labeled affective magnitude (LAM) scale and best–worst scaling. Food Qual. Prefer. 2009, 20, 249–258. [Google Scholar] [CrossRef]
  47. Karoui, R.; Mazerolles, G.; Bosset, J.O.; de Baerdemaeker, J.; Dufour, E. Utilisation of mid-infrared spectroscopy for determination of the geographic origin of Gruyère PDO and L’Etivaz PDO Swiss cheeses. Food Chem. 2007, 105, 847–854. [Google Scholar] [CrossRef]
  48. Shintu, L.; Caldarelli, S. Toward the determination of the geographical origin of Emmental(er) cheese via high resolution MAS NMR: A preliminary investigation. J. Agric. Food Chem. 2006, 54, 4148–4154. [Google Scholar] [CrossRef] [PubMed]
  49. Cadoret, M.; Husson, F. Construction and Evaluation of Confidence Ellipses Applied at Sensory Data. Food Qual. Prefer. 2013, 28, 106–115. [Google Scholar] [CrossRef]
  50. Josse, J.; Pagès, J.; Husson, F. Testing the Significance of the RV Coefficient. Comput. Stat. Data Anal. 2008, 53, 82–91. [Google Scholar] [CrossRef]
  51. Pinheiro, A.C.M.; Nunes, C.A.; Vietoris, V. SensoMaker: A Tool for Sensorial Characterization of Food Products. Ciênc. Agrotec. 2013, 37, 199–201. [Google Scholar] [CrossRef]
  52. Addinsoft. XLSTAT, Data Analysis and Statistics Software for MS Excel, Version V2020; Addinsoft: New York, NY, USA, 2024.
  53. Dźwigoł, H. Evaluating strategic management of sustainable development in the European Union: A spatial-cluster perspective. J. Open Innov. Technol. Mark. Complex. 2026, 12, 100740. [Google Scholar] [CrossRef]
  54. Bruzzone, F.; Ares, G.; Giménez, A. Temporal Aspects of Yoghurt Texture Perception. Int. Dairy J. 2013, 29, 124–134. [Google Scholar] [CrossRef]
  55. Visalli, M.; Mahieu, B.; Peltier, C.; Cordelle, S.; Schlich, P. Temporal precision and resolution of TDS and TCATA used with consumers. Food Qual. Prefer. 2024, 117, 105172. [Google Scholar] [CrossRef]
  56. Nguyen, H.; Wismer, W.V. Temporal Sensory Profiles of Regular and Sodium-Reduced Foods Elicited by Temporal Dominance of Sensations (TDS) and Temporal Check-All-That-Apply (TCATA). Foods 2022, 11, 457. [Google Scholar] [CrossRef] [PubMed]
  57. Cadena, R.S.; Vidal, L.; Ares, G.; Varela, P. Dynamic Sensory Descriptive Methodologies: Time-Intensity and Temporal Dominance of Sensations. In Novel Techniques in Sensory Characterization and Consumer Profiling; Varela, P., Ares, G., Eds.; CRC Press: Boca Raton, FL, USA, 2014; pp. 333–364. [Google Scholar]
  58. Castura, J.C. Chapter 9—Dynamics of Consumer Perception. In Methods in Consumer Research, Volume 1: New Approaches to Classic Methods; Ares, G., Varela, P., Eds.; Elsevier Ltd.: Amsterdam, The Netherlands, 2018; pp. 211–240. ISBN 978-0-08-102089-0. [Google Scholar] [CrossRef]
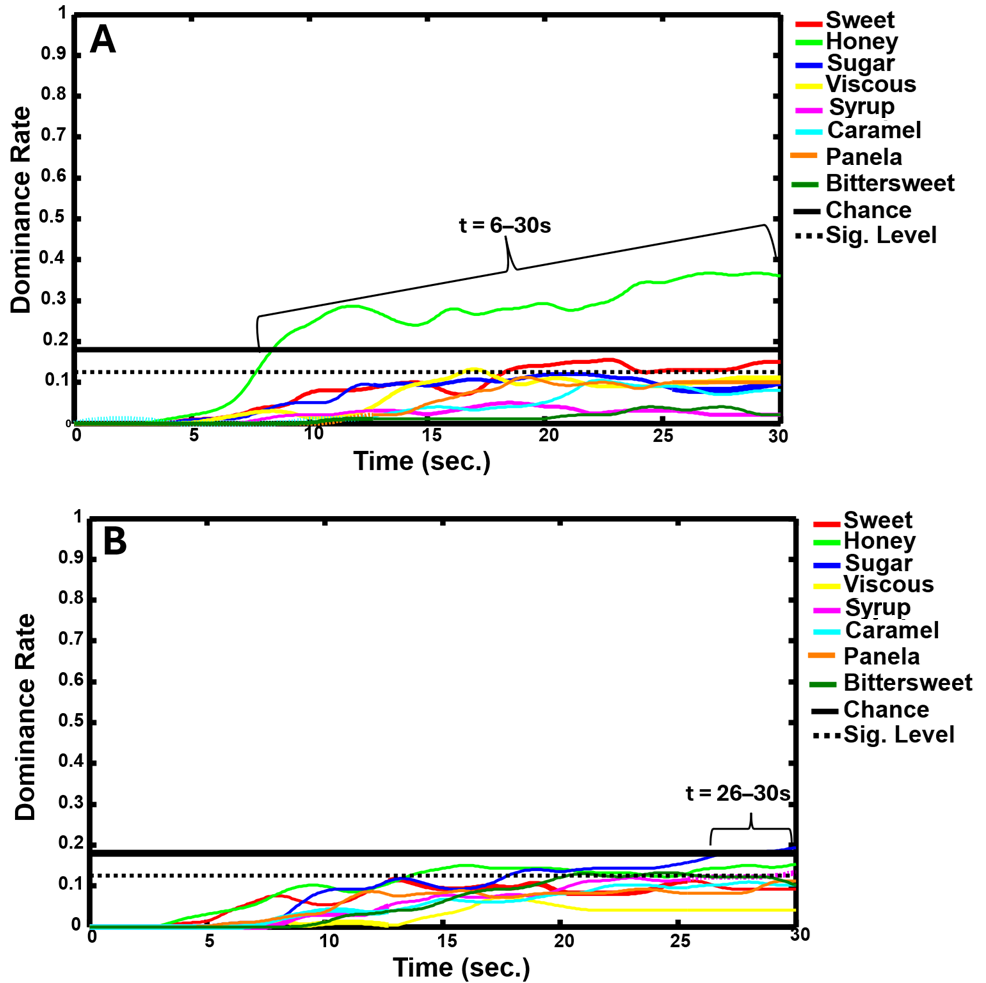
Figure 1. TDS curves: (A) authentic honey (AHO); (B) AS1 (80% non-adulterated honey + 20% HFCS). t = the time ranges in which a sensory attribute was dominant.
Processes 14 02511 g001
Figure 2. TDS curves: (A) AS2 (60% non-adulterated honey + 40% HFCS); (B) AS3 (40% non-adulterated honey + 60% HFCS); and (C) AS4 (20% non-adulterated honey + 80% HFCS). t = the time ranges in which a sensory attribute was dominant.
Processes 14 02511 g002
Figure 3. TDS curves: (A) authentic honey vs. AS1 (80% non-adulterated honey + 20% HFCS); (B) authentic honey vs. AS2 (60% non-adulterated honey + 40% HFCS). t = the time ranges in which a sensory attribute was dominant.
Processes 14 02511 g003
Figure 4. TDS curves: (A) authentic honey vs. AS3 (40% non-adulterated honey + 60% HFCS); (B) authentic honey vs. AS4 (20% non-adulterated honey + 80% HFCS). t = the time ranges in which a sensory attribute was dominant.
Processes 14 02511 g004
Figure 5. Sensory profiles of honeys via TDS with confidence ellipses (90% and with 500 times). AHO = authentic honey; AS1 = 80% non-adulterated honey + 20% HFCS; AS2 = 60% non-adulterated honey + 40% HFCS; AS3 = 40% non-adulterated honey + 60% HFCS); and AS4 (20% non-adulterated honey + 80% HFCS).
Processes 14 02511 g005
Figure 6. Sensory profile of honeys via CATA (A) and RATA (B) with confidence ellipses (90% and with 500 times). AHO = authentic honey; AS1 = 80% non-adulterated honey + 20% HFCS; AS2 = 60% non-adulterated honey + 40% HFCS; AS3 = 40% non-adulterated honey + 60% HFCS); and AS4 (20% non-adulterated honey + 80% HFCS).
Processes 14 02511 g006
Figure 7. Partial clouds of the sensory techniques TDS, CATA and RATA. Different colors indicate different honey products. AS1 = 80% non-adulterated honey + 20% HFCS; AS2 = 60% non-adulterated honey + 40% HFCS; AS3 = 40% non-adulterated honey + 60% HFCS); and AS4 (20% non-adulterated honey + 80% HFCS).
Processes 14 02511 g007
Table 1. Adulterated honey samples and their viscosity measurements.
HoneyBrixViscosity
(Pa s−1)
R2
Authentic honey (AHO)100% non-adulterated honey72.7619.97 ±1.430.99
AS180% non-adulterated honey + 20% HFCS7514.51 ± 1.410.99
AS260% non-adulterated honey + 40% HFCS78.56.61 ± 0.310.99
AS340% non-adulterated honey + 60% HFCS77.33.37 ± 0.440.99
AS420% non-adulterated honey + 80% HFCS76.71.84 ± 0.050.99
HFCS = high-fructose corn syrup.
Table 2. Probability values, averages and standard deviation of Vmax and Tmax.
Vmax
Sensory attributep-valuesAHOAS1AS2AS3AS4
Sweet0.0520.17 ± 0.02 a0.14 ± 0.02 a0.16 ± 0.02 a0.13 ± 0.02 a0.26 ± 0.02 a
Honey0.2570.39 ± 0.09 a0.17 ± 0.09 a0.16 ± 0.09 a0.12 ± 0.09 a0.06 ± 0.09 a
Sugar0.2140.13 ± 0.03 a0.19 ± 0.03 a0.20 ± 0.03 a0.09 ± 0.03 a0.10 ± 0.03 a
Viscous0.8000.14 ± 0.04 a0.07 ± 0.04 a0.07 ± 0.04 a0.09 ± 0.04 a0.09 ± 0.04 a
Syrup<0.00010.06 ± 0.007 c0.13 ± 0.007 b0.06 ± 0.007 c0.20 ± 0.007 a0.18 ± 0.007 a
Caramel0.4640.10 ± 0.02 a0.12 ± 0.02 a0.16 ± 0.02 a0.18 ± 0.02 a0.14 ± 0.02 a
Panela0.1130.12 ± 0.01 a0.11 ± 0.01 a0.16 ± 0.01 a0.13 ± 0.01 a0.07 ± 0.01 a
Bittersweet0.1590.05 ± 0.02 a0.14 ± 0.02 a0.06 ± 0.02 a0.07 ± 0.02 a0.08 ± 0.02 a
Tmax
Sensory attributep-valuesAHOAS1AS2AS3AS4
Sweet0.7720.05 ± 5.37 a19.25 ± 5.37 a17.25 ± 5.37 a26.00 ± 5.37 a24.00 ± 5.37 a
Honey0.4418.85 ± 4.79 a22.90 ± 4.79 a17.35 ± 4.79 a18.40 ± 4.79 a29.60 ± 4.79 a
Sugar0.0117.50±0.18 b28.25±0.18 a29.90±0.18 a15.85±0.18 b13.25 ± 0.18 b
Viscous0.6615.75 ± 0.46 a23.55 ± 0.46 a14.50 ± 0.46 a21.40 ± 0.46 a21.50 ± 0.46 a
Syrup0.0215.50 ± 2.17 b29.25 ± 2.17 a29.62 ± 2.17 a26.25 ± 2.17 a26.25 ± 2.17 a
Caramel0.5526.05 ± 2.36 a24.50 ± 2.36 a29.25 ± 2.36 a29.60 ± 2.36 a26.55 ± 2.36 a
Panela0.1922.40 ± 2.50 a29.50 ± 2.50 a26.60 ± 2.50 a26.45 ± 2.50 a20.00 ± 2.50 a
Bittersweet0.8527.05 ± 4.85 a20.75 ± 4.85 a20.75 ± 4.85 a22.05 ± 4.85 a24.50 ± 4.85 a
Different letters in a row indicate statistical differences between the means at p ≤ 0.05. Vmax = maximum value corresponding to a TDS dominance rate; Tmax = time to reach Vmax from the start of the evaluation. AS1 = 80% non-adulterated honey + 20% HFCS; AS2 = 60% non-adulterated honey + 40% HFCS; AS3 = 40% non-adulterated honey + 60% HFCS); and AS4 (20% non-adulterated honey + 80% HFCS).
Table 3. Probability values of the Wilk’s Lambda test (λ).
p-Valuesp-Valuesp-Values
Sensory attributeTDSCATARATA
Honey<0.0001<0.0001<0.0001
Sweet<0.0001<0.0001<0.0001
Panela<0.0001<0.0001>0.05
Syrup<0.0001<0.0001<0.0001
Caramel<0.0001<0.0001<0.0001
Viscous<0.0001<0.0001<0.0001
Bittersweet<0.0001<0.0001>0.05
Sugar<0.0001<0.0001>0.05
Table 4. Correct percentages for classifying samples by sensory technique.
SampleTDSCATARATA
AHO77.74%62.73%63.64%
SA181.40%38.18%46.36%
SA271.43%48.18%16.36%
SA385.38%69.09%6.36%
SA469.77%44.55%50.00%
Total77.14%52.55%36.55%
Disclaimer/Publisher’s Note: The statements, opinions and data contained in all publications are solely those of the individual author(s) and contributor(s) and not of MDPI and/or the editor(s). MDPI and/or the editor(s) disclaim responsibility for any injury to people or property resulting from any ideas, methods, instructions or products referred to in the content.