Article

Prior-Informed Separation of Long-Scale Shape and Short-Scale Texture on Blast Furnace Burden Surfaces

1
School of Information Science and Technology, Beijing University of Technology, 100 Pingleyuan, Chaoyang District, Beijing 100124, China
2
Faculty of Information Science and Technology, Hokkaido University, Kita 14, Nishi 9, Kita-ku, Sapporo 060-0814, Hokkaido, Japan
3
Department of Mathematics and Statistics, Sam Houston State University, Huntsville, TX 77341, USA
*
Author to whom correspondence should be addressed.
Processes 2026, 14(15), 2510; https://doi.org/10.3390/pr14152510
Submission received: 23 June 2026 / Revised: 21 July 2026 / Accepted: 30 July 2026 / Published: 5 August 2026

Abstract

Particle-scale analysis of blast furnace burden surfaces lacks an operational criterion for separating long-scale shape from short-scale texture on complex digital elevation models. This study proposes a prior-informed framework in which the application cutoff ω * = arg min J minimizes the mismatch between high-pass texture RMS height and the tiled-surface prior of the same particle batch. On cold-state large-coke belts with identical particles but different long-scale morphology, numerical validation via RMS–frequency transition analysis shows coincident transition structures. At a transition-informed validation cutoff of ω = 4.2 , absolute texture errors of 1.56–3.22 mm are comparable in magnitude to the approximately 2 mm instrument depth resolution. Grid-search application yields ω * = 5.8 and 4.4 with absolute errors of 0.03 and 0.35 mm and operationally distinct shape and texture components. The separated fields can supply bed-surface boundaries and local roughness inputs for gas–solid simulation and charging optimization.

1. Introduction

Precise control of ironmaking blast furnaces (BFs) is a key route to energy conservation and emission reduction in steel metallurgy. With refined control of burden particle size and particle-level detection, burden structure control is advancing to a finer spatial scale than previously attainable. However, the extreme internal environment of an operating BF—high temperature, high pressure, and heavy dust—makes direct measurement of burden distribution highly challenging, and only a few instruments, such as BF radars [1] and endoscopes [2], can measure the burden surface in situ. The burden surface formed during charging encodes the layer distribution: its overall shape reflects the charged-layer thickness, whereas its local roughness is linked to particle size, layer porosity, and gas-flow distribution. Particle-scale analysis, however, still lacks operational criteria for distinguishing shape from texture and for separating the two components reliably, which limits quantitative burden-surface metrology and precise detection.
In a series of previous studies [3,4,5], we established a cold-state measurement and characterization chain for BF burden surfaces. Tian et al. [3] obtained tiled-surface roughness statistics from digital elevation models (DEMs) and showed that the approach depends on depth information rather than on a specific RGBD device, so that it can be transferred to other routes such as industrial endoscope reconstruction [2]. Tian et al. [4] linked burden texture to particle contours and size distributions, and Tian et al. [5] characterized multiscale roughness through fractal analysis. What remains missing is a practical framework that determines the shape–texture cutoff on complex burden surfaces and separates the two components accordingly.
Separating long-scale shape from short-scale texture usually requires cutoff determination and filter-based extraction. Related work on general rough surfaces relies on power spectral density [6,7,8], regression from particle size and RMS roughness [9], wavelet-based texture extraction [10], fractal roughness separation [11], autocorrelation function-based approaches [12], and conventional filters [13,14]. Standardized filtration practice is summarized in the ISO 16610 series, including Gaussian profile and areal filters [15,16] and robust Gaussian regression filters [17]. These methods provide mature operators for wavelength separation, but the cutoff itself is commonly chosen from metrological convention or experience and is not, by itself, linked to batch-wise particle information available before BF charging. Because many internal BF states are not directly observable, process optimization and gas-flow simulation increasingly rely on measurable boundaries and reconstructed fields [2,18]. Shape–texture separation thus provides an intermediate step between DEM acquisition and process-model inputs: the shape can serve as a bed-surface boundary in gas–solid simulations, whereas the texture carries particle-scale roughness information for permeability and porosity modeling.
This study extends the series into a fourth stage by proposing a BF-specific, prior-informed separation framework. Its contributions are threefold: (i) an operational distinction between burden-surface shape and texture, motivated by prior roughness, particle-scale, and multiscale observations rather than by a universal definition for all rough surfaces; (ii) a prior-informed cutoff criterion that minimizes the mismatch between tiled-surface RMS height and the high-pass texture, implemented by discrete grid search and frequency-domain filtering; and (iii) cold-state DEM validation on coke burden belts that share identical particle properties but differ in long-scale shape, where transition analysis of RMS–frequency curves supports the validity of the criterion. Practically, the separated shape and texture fields can supply bed-surface boundaries and local roughness inputs for gas–solid simulation and charging optimization.

2. Materials and Methods

The burden surface is an artificially rough surface formed by burden stacking and descent in the BF throat. Different charging matrices and particle sizes alter the layer stacking, surface shape, porosity, and roughness. Following the approach of previous research [3,4,5], this study adopts a BF-specific operational distinction rather than a universal mathematical definition valid for all rough surfaces.
Remark 1.
The burden-surface shape is the long-scale overall outline associated with wavelengths larger than the separation cutoff wavelength, resulting from burden charging and descent in the BF throat (radial/circumferential undulations, platforms, and funnel-like features). The burden-surface texture is the short-scale local outline associated with wavelengths smaller than the separation cutoff wavelength, determined by particle geometry and local packing [3,4]. Operationally, a successful separation should (i) retain long-scale undulations in the shape component without particle-scale “mottling”, (ii) yield a texture component that approximates a tiled belt of the same batch and does not carry those long-scale undulations, and (iii) recover the DEM by summation of the two components within numerical tolerance. This distinction is a BF process operational definition equivalent to a low-/high-frequency decomposition at the separation cutoff wavelength, not a unique metrological terminology for all rough surfaces.
Shape and texture are separated in the frequency domain by low-pass and high-pass filtering about a cutoff index ω , followed by an inverse Fourier transform. Determining ω is the key step: the long-scale shape is governed by charging and descent and is difficult to characterize with a single common descriptor, whereas the short-scale texture is determined by particle geometry [4]. Because burden properties such as the particle size distribution are usually known before charging, tiled-surface roughness statistics can provide batch-wise prior information for cutoff determination.

2.1. Burden Materials and Experimental Setup

Cold-state simulated burden belts proportional to practical BF radial sectors were constructed in a pilot plant following Tian et al. [3]. Each belt measured 1 m × 4.5 m , corresponding to the radial sector from the furnace wall to the furnace center for BFs with throat radii of 4–5 m. Burden surfaces were scanned with an Asus Xtion PrimeSense Carmine RGBD camera (PrimeSense Ltd., Tel Aviv, Israel) mounted on a trolley track; at a 1 m measuring distance, the depth image resolution was 640 × 480 pixels, with azimuth and depth resolutions of 1.7 mm and 2 mm, respectively. DEMs were built from the depth data after border trimming and Gaussian noise suppression (S-filter) [3]. A polynomial form filter (F-filter) was not applied, meaning the long-scale burden morphology to be separated in this study is retained in the DEM. The simulated burden belt cases used the same batch of large coke as Case (b) in Table 1 but had different long-scale shapes based on shutdown observations of an actual BF [3]. Batch-wise tiled-surface roughness priors for cutoff determination are reported in Table 1 and used in Section 2.2.

2.2. Prior-Informed Cutoff Criterion

As summarized in Table 1 [3], tiled-surface roughness parameters for different particle batches are reported; the corresponding skewness and kurtosis are given in Supplementary Table S1. Because tiled burden belts have a flat long-scale shape, their roughness statistics represent the texture component of complex burden surfaces. Among these parameters, the RMS height varies most strongly with particle size (from 4.0 mm for small sintered ore to 24.3 mm for large coke) and is therefore used as the prior reference for cutoff determination. Skewness (0.03–0.38) and kurtosis (near 3) vary much more weakly across batches (Supplementary Table S1), so they are better suited as secondary diagnostics of distributional form than as the primary cutoff objective; future work may use them as auxiliary constraints after separation.
Based on this prior, the RMS height is selected as the quantification index for cutoff determination. Let Ω denote the burden-surface region and z ( x , y ) the surface height at any position ( x , y ) Ω . Let S q ref be the RMS height of the tiled burden surface for the same batch of particles, ω the cutoff index, G ω the corresponding high-pass filter in the frequency domain, and  Ω ω = { ω i } a discrete set of candidate cutoff indices. The optimization-based separation criterion is then formulated as
ω * = arg min ω i Ω ω J ( ω i ) ,
with J ( ω i ) = S q ref S q G ω i ( z ) , where
S q G ω ( z ) = 1 Ω d x d y Ω G ω ( z ( x , y ) ) 2 d x d y .
The separated components are then defined as
z texture ( x , y ) = G ω * ( z ( x , y ) ) , z shape ( x , y ) = z ( x , y ) z texture ( x , y ) ,
or equivalently through the corresponding low-pass component of z ( x , y ) .

2.3. Computational Implementation

All frequency-domain analyses were implemented in MATLAB (MathWorks, Natick, MA, USA) using the built-in two-dimensional fast Fourier transform (fft2) and its inverse (ifft2). No additional windowing or zero-padding was applied beyond the native DEM array size. After preprocessing, each burden belt DEM was represented on a regular Cartesian grid with uniform sampling intervals Δ x = Δ y = 1  mm along the scanning and belt-width directions, giving arrays of N x = 507 points across the cropped belt width and N y = 4500 points along the 4.5 m scanning direction.
The cutoff ω is a dimensionless radial index on the shifted two-dimensional discrete Fourier spectrum. Let ( k x , k y ) denote integer frequency-bin coordinates with the zero-frequency component at the spectrum center. The radial index is r = k x 2 + k y 2 . The ideal rectangular high-pass filter is defined as
G ω ( k x , k y ) = 1 , r ω , 0 , r < ω ,
and the corresponding low-pass filter is 1 G ω ( k x , k y ) . Because the mask is applied in bin-index space, the filter is isotropic in the frequency plane but maps to direction-dependent spatial wavelengths on the rectangular belt grid. Approximate physical wavelengths associated with a radial index ω are λ x N x Δ x / ω and λ y N y Δ y / ω . On the present belts, the shorter-side scale is λ short = min ( λ x , λ y ) , evaluated with the cropped DEM width after 1 mm resampling rather than an idealized full-width. Numerical λ short values at the validation and application cutoffs, and their relation to previously reported particle-dominated fractal scales [5], are reported in the Results and Discussion.
Rectangular filters provide a transparent cutoff and are convenient for evaluating candidate cutoffs over Ω ω . The framework itself is not restricted to rectangular masks: once a cutoff (or an equivalent λ c ) is specified, Gaussian, Butterworth, or ISO 16610-compatible operators, including robust Gaussian regression filters [17], can be used for the final separation [13,15,16]. In the main text we retain rectangular filters for the primary search and report a lightweight Butterworth comparison in the Supplementary Materials (Figure S1); robust Gaussian regression filters were not empirically benchmarked here. Edge effects at the belt boundaries are quantified in Section 3 and discussed in Section 4.
The candidate cutoff set was constructed as Ω ω = { 0.1 , 0.2 , , 50.0 } , i.e., uniformly spaced radial indices from 0.1 to 50.0 with a step of 0.1 (500 candidates in total). This range lies below the Nyquist radius in bin-index space and covers the transition region identified in the RMS–frequency curves. Absolute error is defined as | S q texture S q ref | . Validation residuals relative to the instrument depth resolution are discussed in the Results and Discussion.
With a single FFT of each DEM cached and candidate masks applied in the frequency domain, the exhaustive grid search required approximately 53 s per case for 500 candidates (about 0.11 s per candidate) in MATLAB R2024b on a laptop (AMD Ryzen 7 8845H, 32 GB RAM, NVIDIA GeForce RTX 4070 GPU). The procedure is therefore suitable for offline or near-line postprocessing rather than hard real-time in-furnace control.

2.4. Cutoff Determination Procedure

Because the objective in Equation (1) varies in a piecewise manner with the cutoff and depends on both the discrete frequency spectrum and the filter, monotonicity is not assumed and bisection search is not used. Instead, the application cutoff is determined by an exhaustive grid search over Ω ω : ω * = arg min ω i J ( ω i ) (Equation (1)). This quantitative prior-informed procedure is the method proposed for deployment. The  RMS–frequency transition analysis and separation previews in the following section constitute a numerical validation experiment: they show that a transition-informed choice ω = 4.2 yields texture S q close to the tiled prior and therefore support the validity of the criterion and algorithm; they are not introduced as a second selection rule.
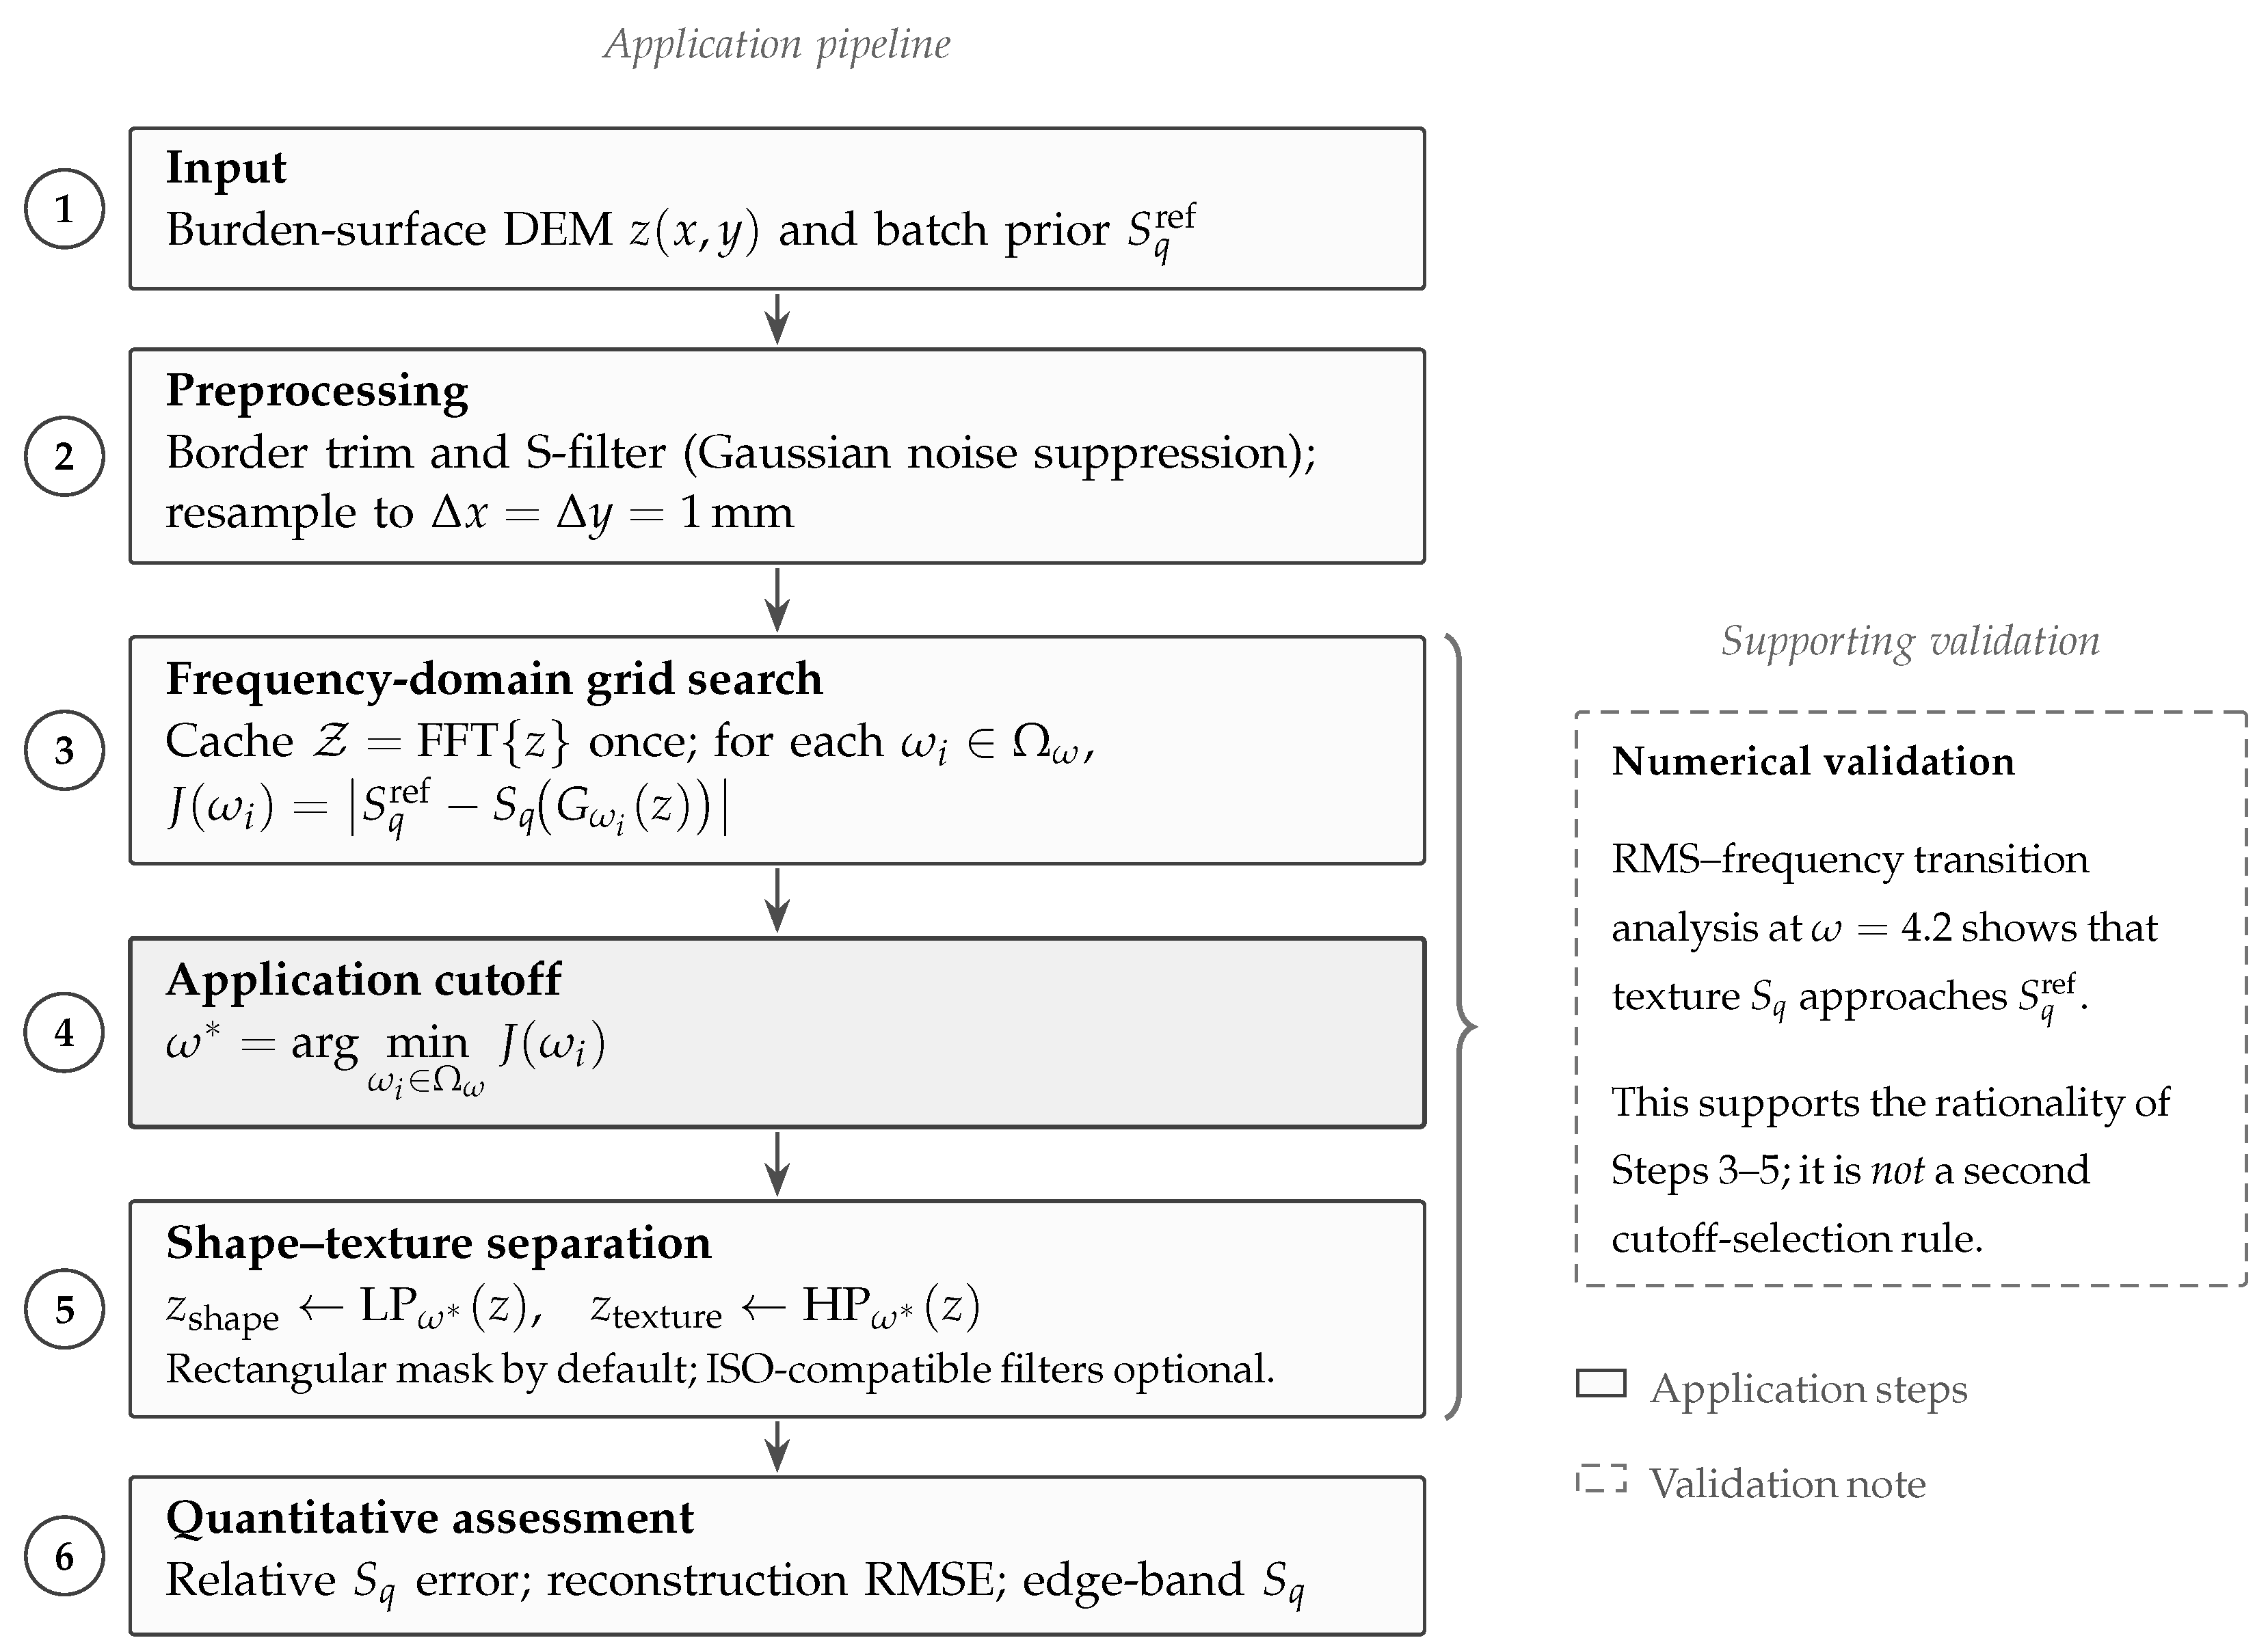
Figure 1 summarizes the corresponding application pipeline; the dashed panel marks the RMS–frequency numerical validation. Algorithm S1 in the Supplementary Materials provides expanded pseudocode.
In practice, prior roughness information can be obtained from tiled-surface measurement [3], near-line conveyor-belt detection [19,20], or particle-size–roughness estimation [4]. The framework requires only a burden-surface DEM and the corresponding batch-wise prior, and is not bound to a specific RGBD platform.

3. Results

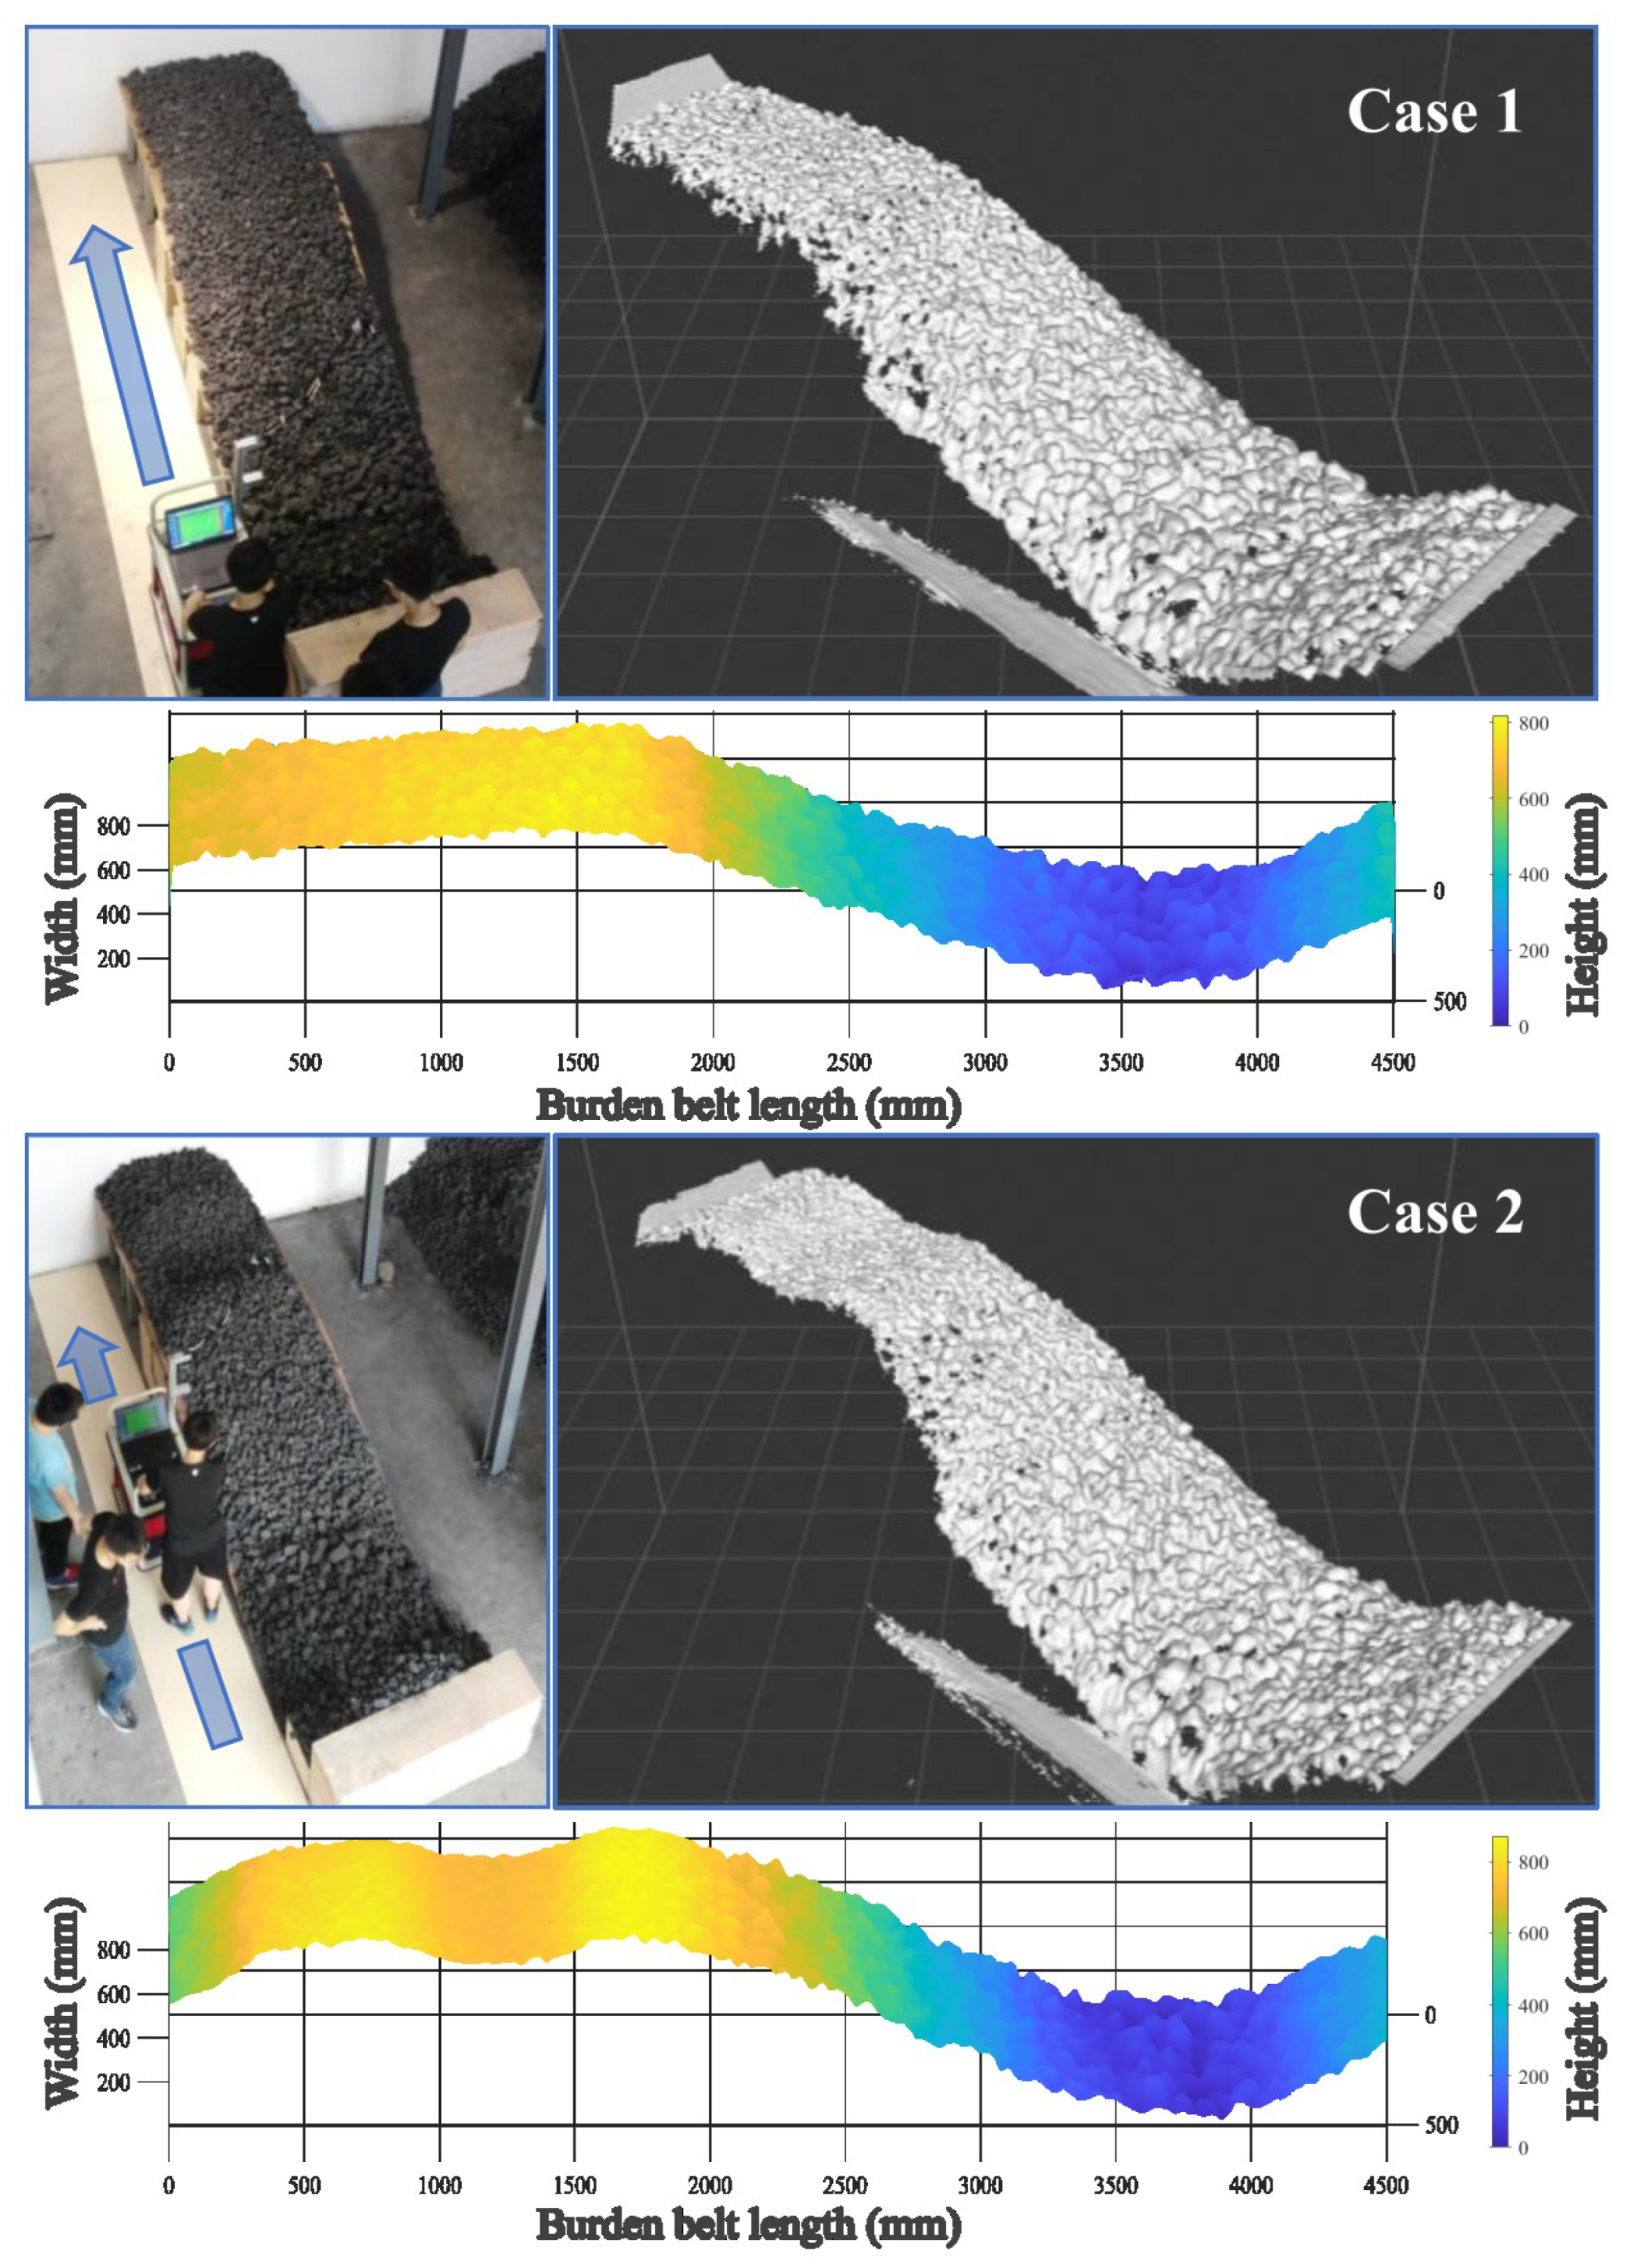
The Case 1 and Case 2 cold-state burden belts (Section 2.1) replicate the radial surface from the furnace wall to the furnace center. Both use the large coke of Table 1(b), while Case 2 additionally introduces local long-scale fluctuations over [0, 2000] mm (Figure 2). In each DEM, x = 0 and x = 4500  mm correspond to the furnace wall and center, respectively. Results are organized in two blocks: (i) RMS–frequency numerical validation at a transition-informed cutoff ω = 4.2 (Figure 3; Table 2), and (ii) application of the prior-informed grid search ω * = arg min J with quantitative separation and edge metrics (Figure 4 and Figure 5; Table 3).
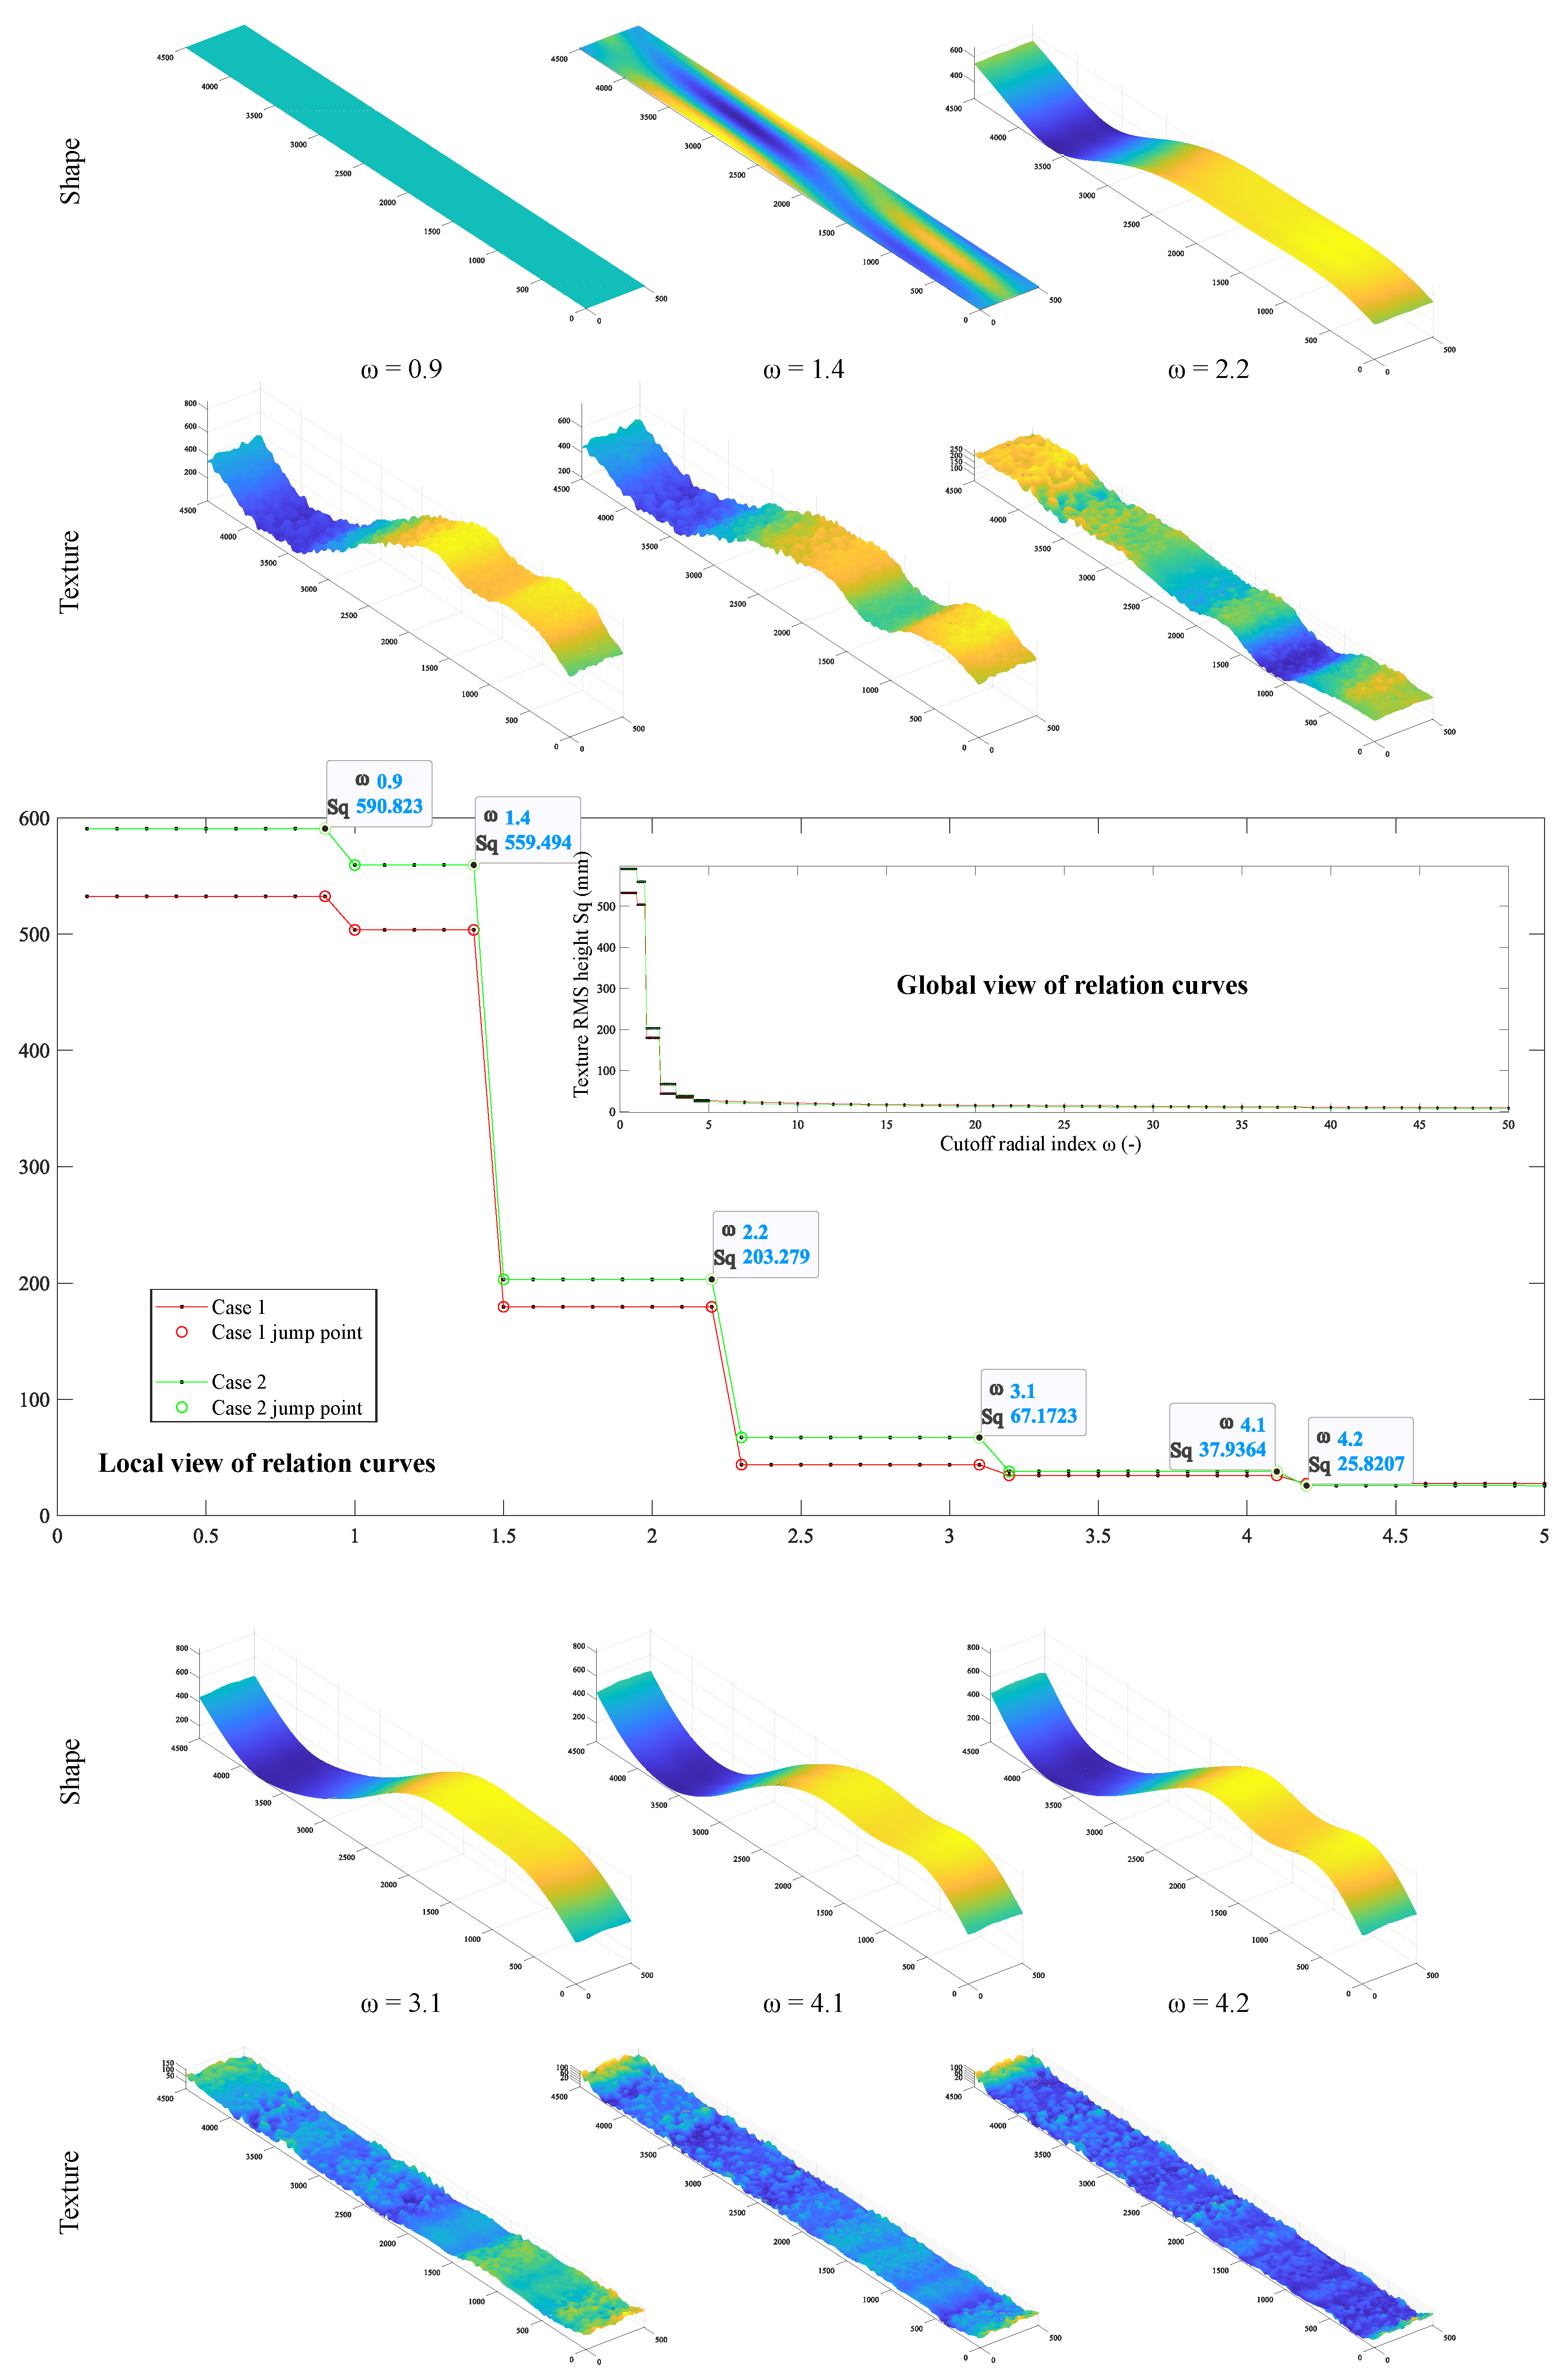
Figure 3 shows how the RMS height of the high-pass texture component varies with the cutoff index ω . In both cases, the transition indices coincide even though the long-scale shapes differ; S q varies gently over ω [ 5 , 50 ] but abruptly over ω [ 0.1 , 5 ] . At the transition-informed validation setting ω = 4.2 , Table 2 reports texture RMS heights of 27.48 and 25.82 mm with absolute errors of 3.22 and 1.56 mm from S q ref = 24.26  mm (Table 1(b)). The quantitative application procedure itself remains the grid search of J ( ω ) .
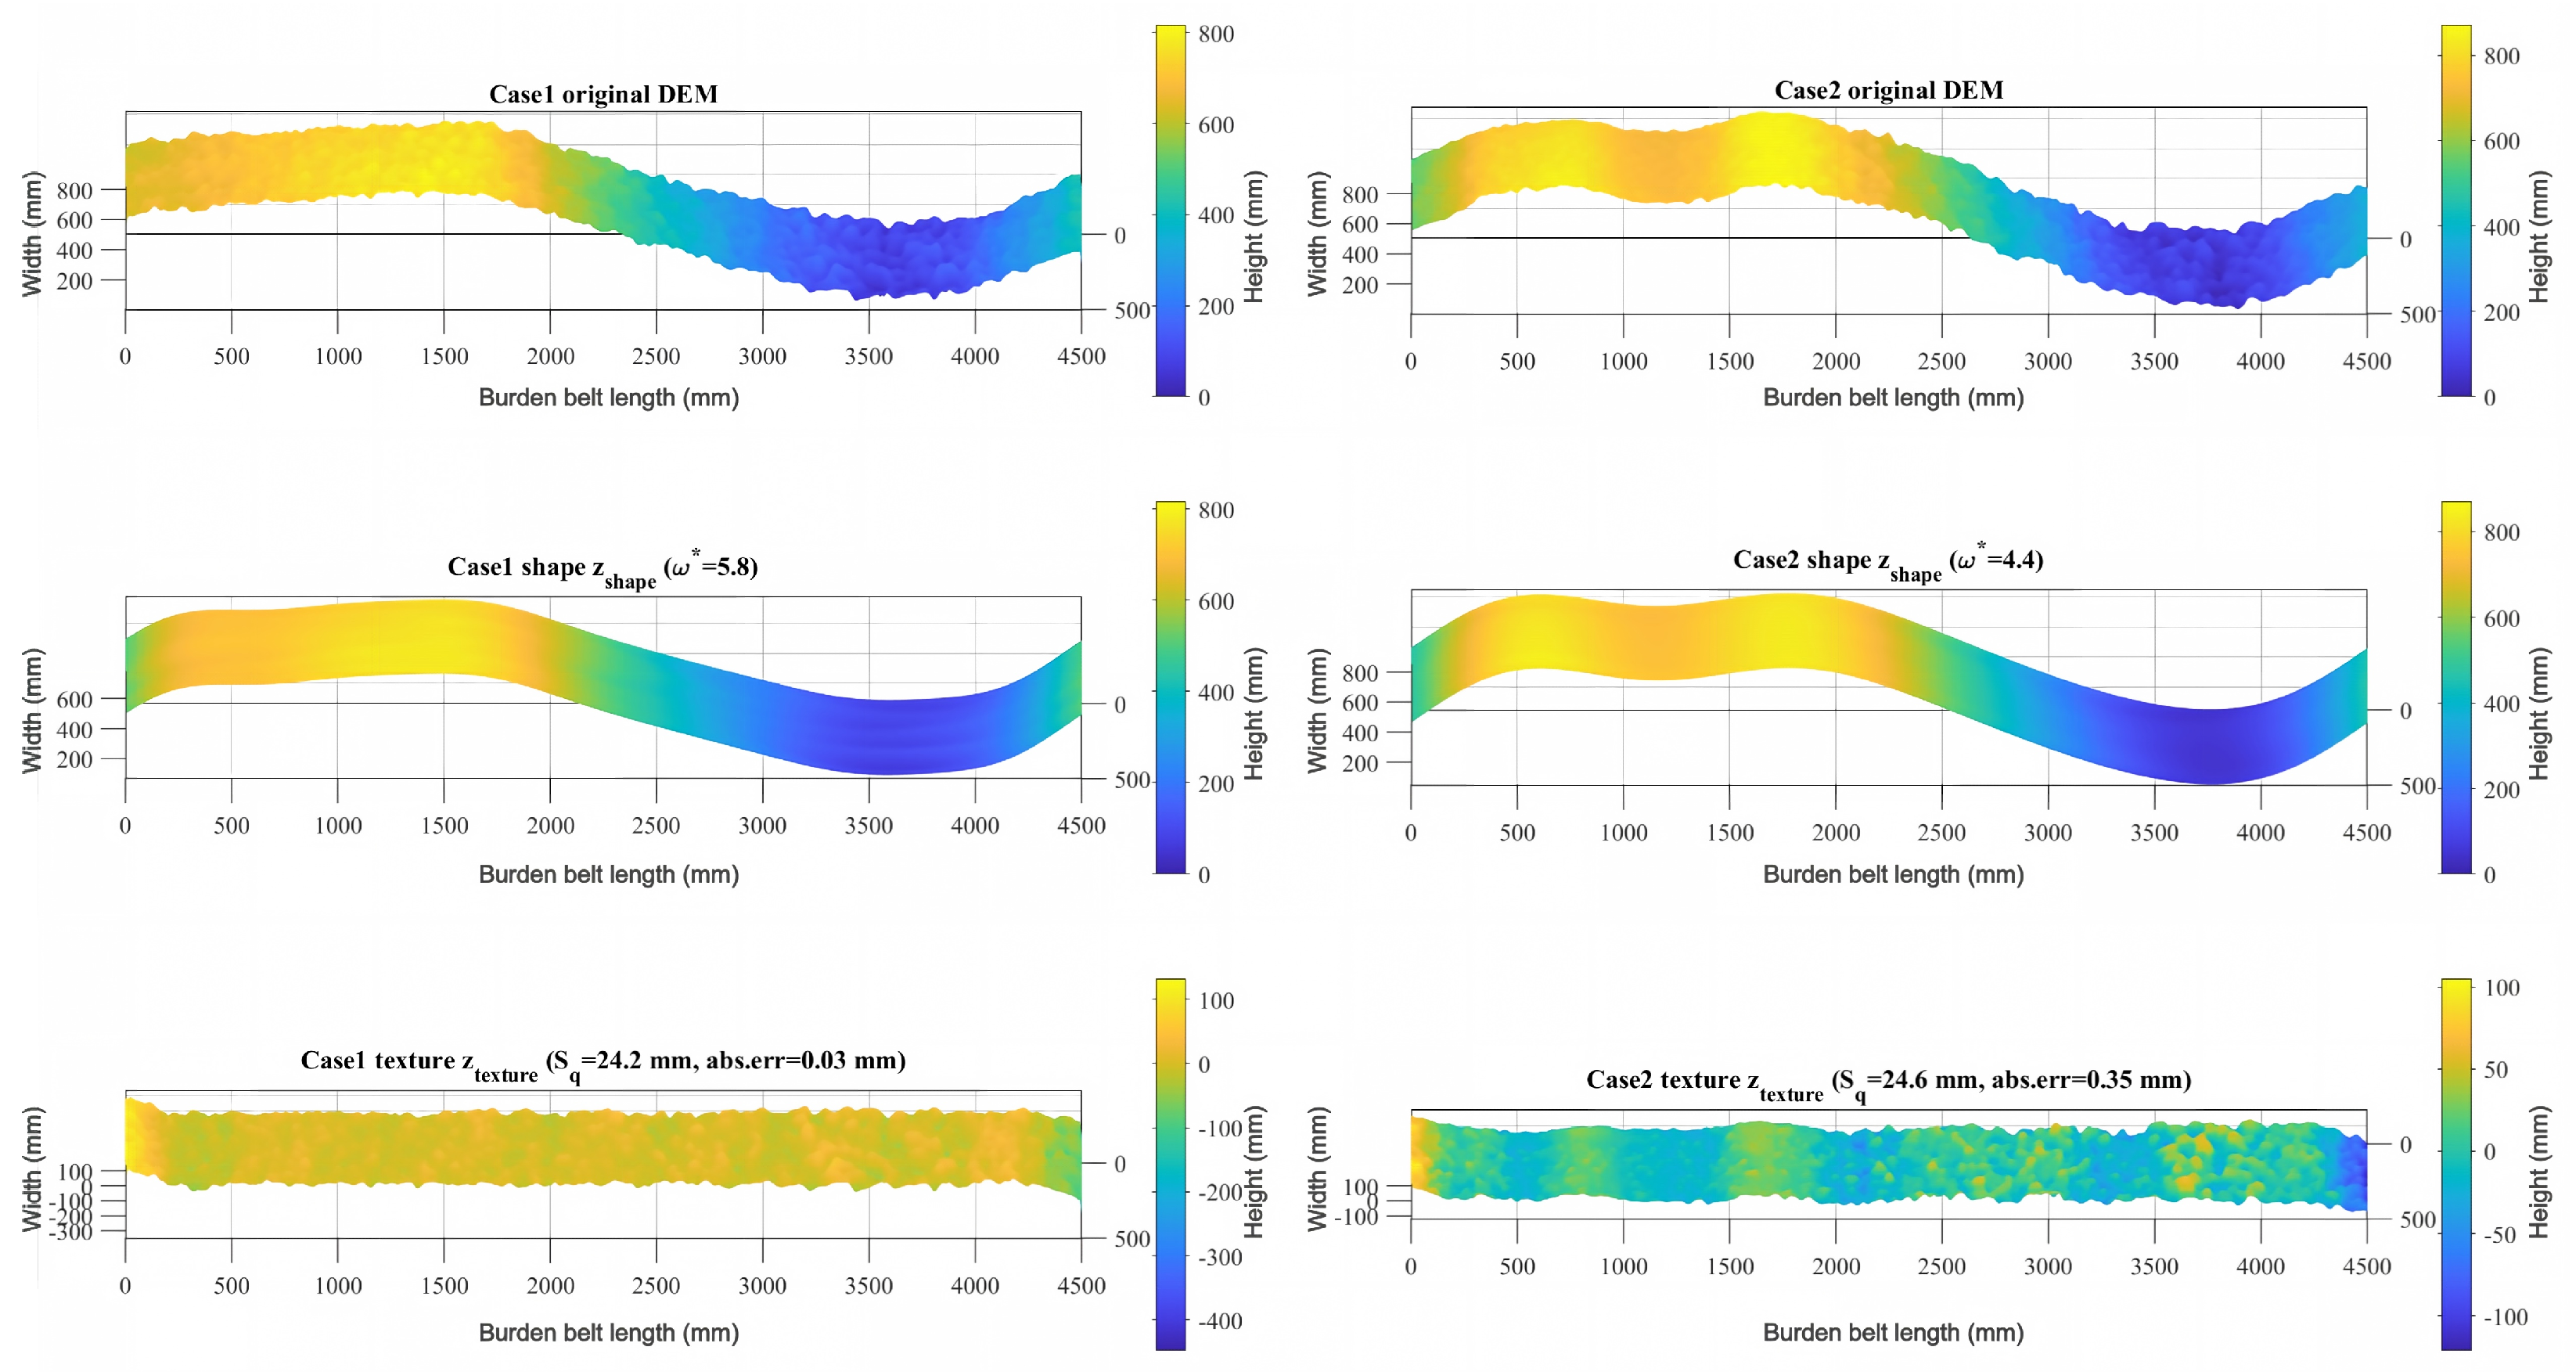
Figure 4 presents the separation outcomes obtained by applying the proposed prior-informed framework to the Case 1 and Case 2 DEMs in Figure 2. Rectangular low-pass and high-pass filters (Equations (3) and (4)) are used with the batch-wise prior S q ref = 24.26  mm for large coke (Table 1(b)) at the application cutoffs ω * = arg min J : ω * = 5.8 (Case 1) and ω * = 4.4 (Case 2). These results are distinct from the ω = 4.2 numerical validation in Figure 3 and Table 2.
As shown in Figure 4, the separated shape component in each case follows the overall radial trend of the original burden belt while presenting a substantially smoother surface. For Case 1, particle-scale irregularities are largely removed from the shape component, leaving a gently varying long-scale profile. For Case 2, the shape component retains the pronounced local undulations over [0, 2000] mm identified in Figure 2, confirming that these features are assigned to the shape rather than to the texture; the corresponding texture row preserves local particle-scale detail without carrying those long-scale fluctuations. This assignment is consistent with the operational distinction between BF burden-surface shape and texture introduced in Section 2.
Table 3 complements Figure 4 with quantitative separation and edge metrics at the application cutoffs ω * . The absolute errors from S q ref are 0.03 mm (Case 1) and 0.35 mm (Case 2), yielding tighter prior matching than the ω = 4.2 validation in Table 2. Reconstruction RMSE is on the order of 10 13  mm, confirming that the LP/HP pair implements an exact complementary decomposition up to floating-point error.
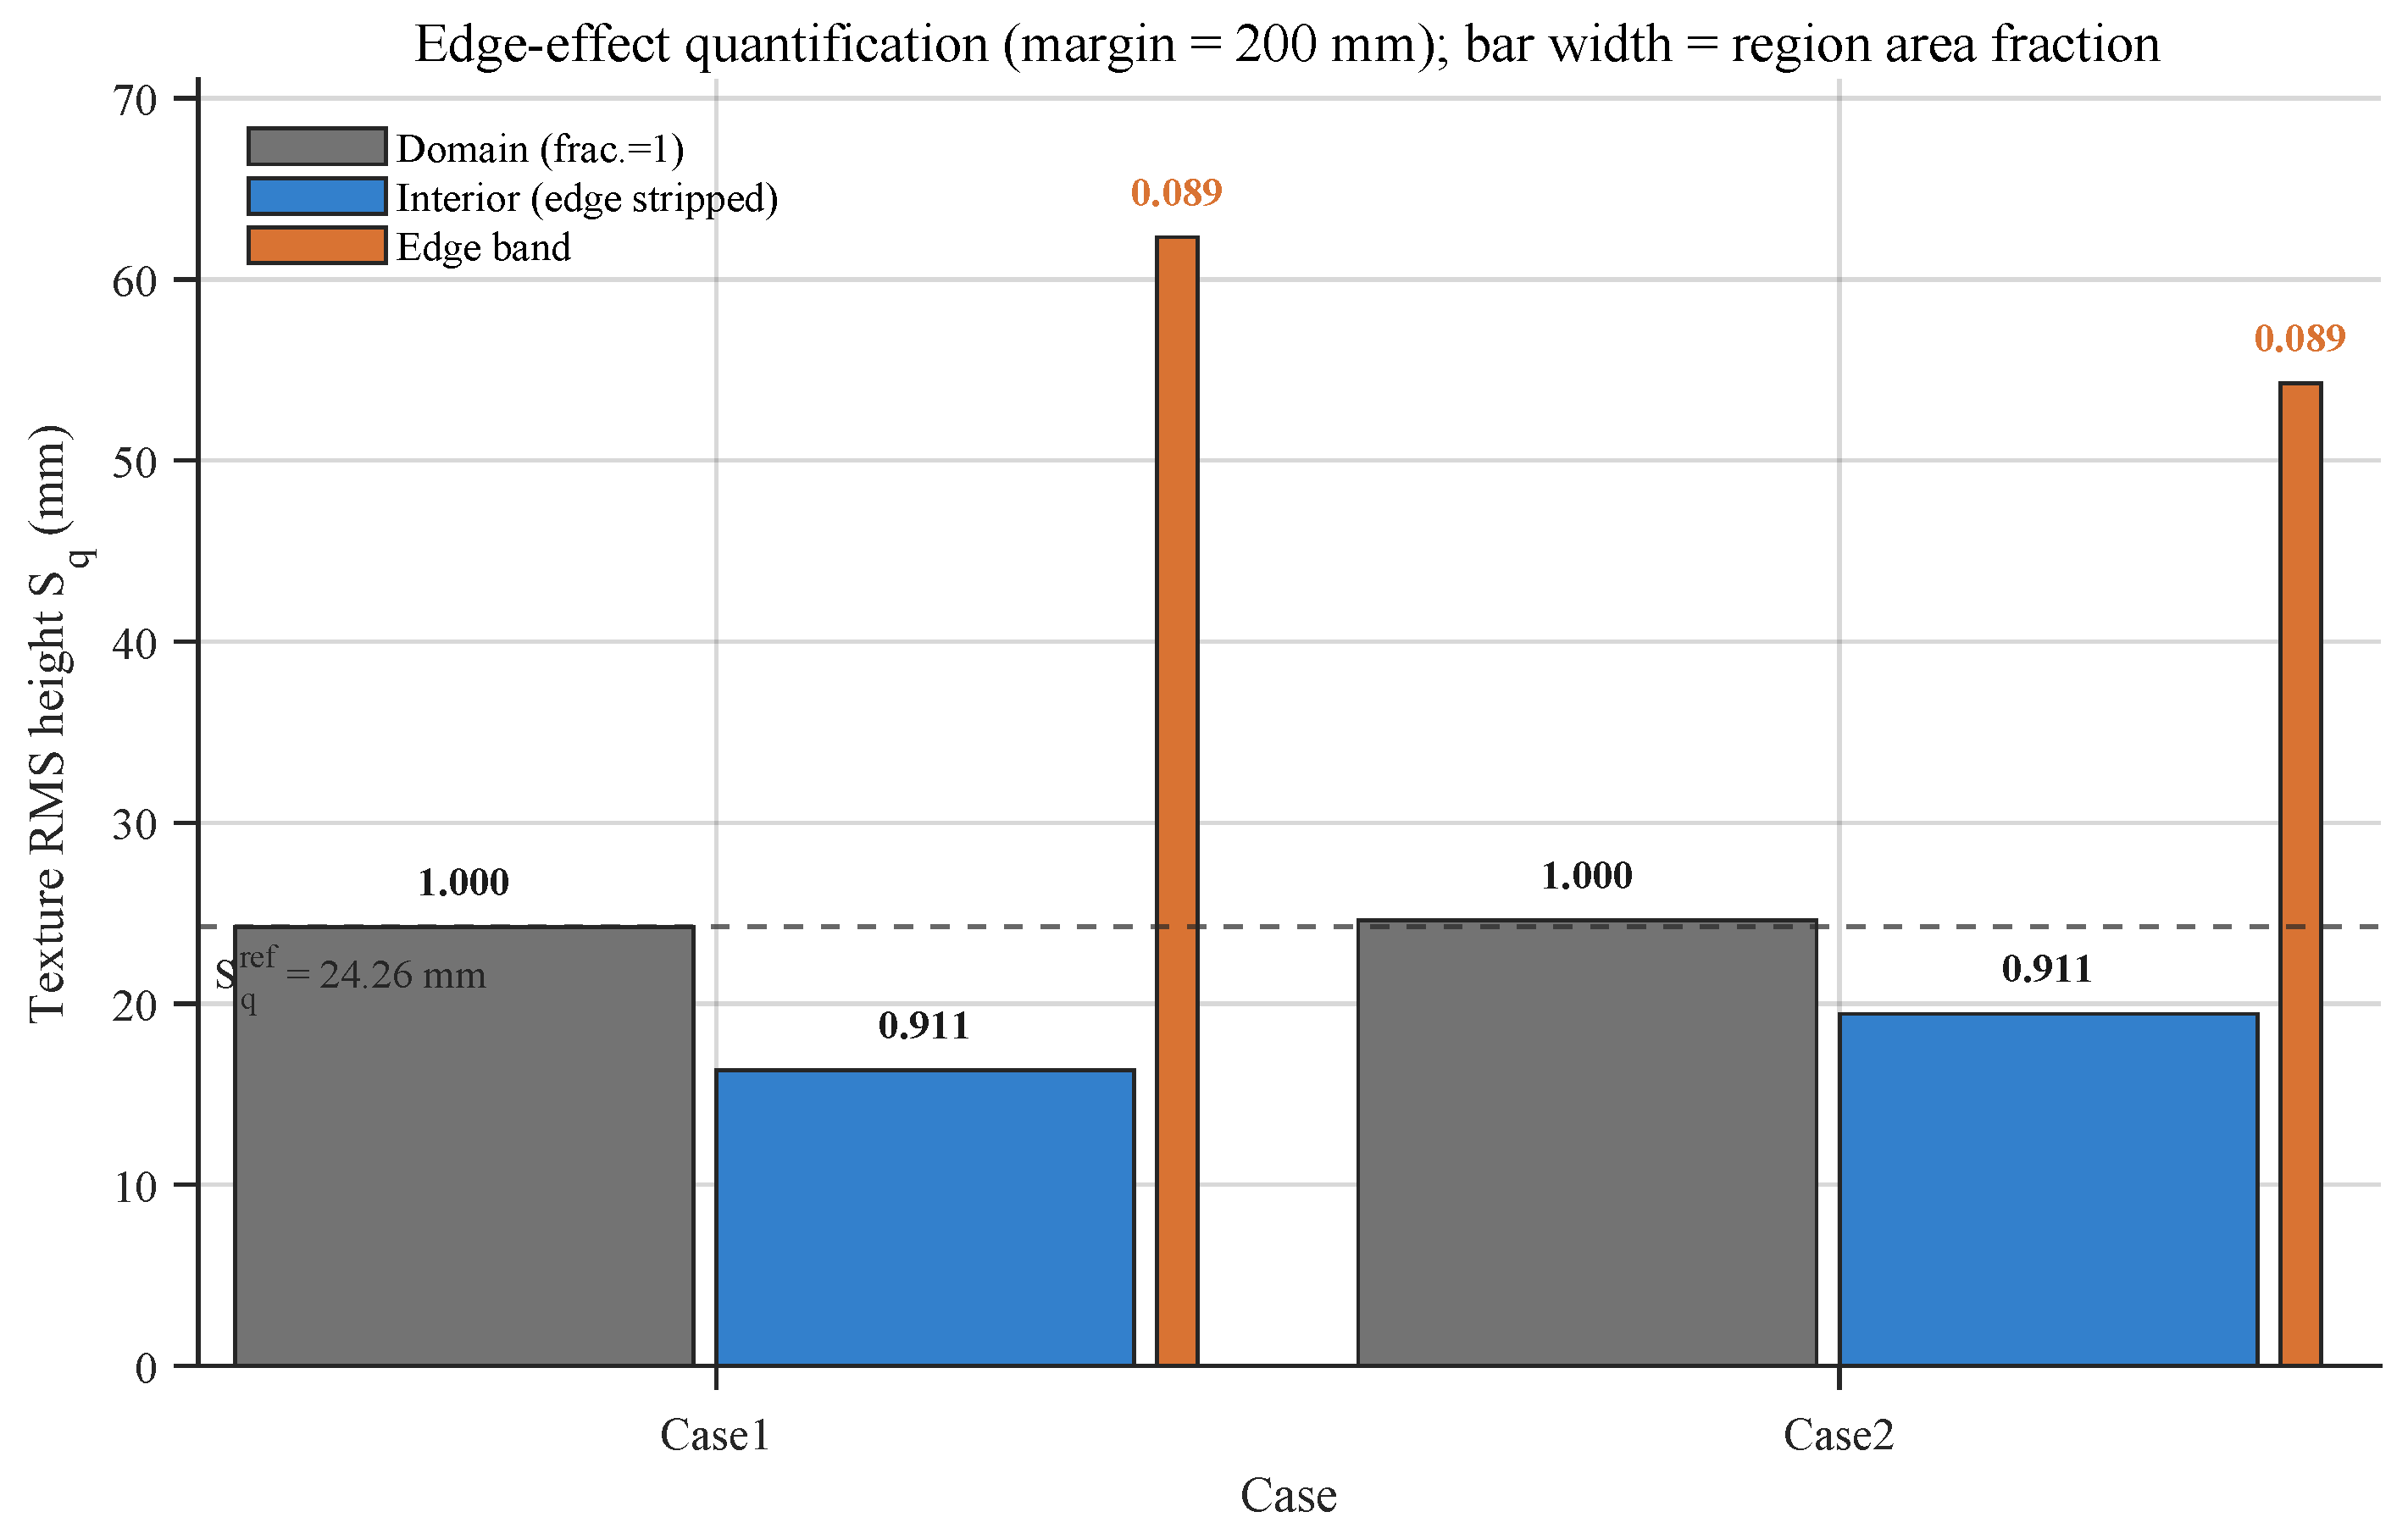
The edge effects observed in Figure 4 near [0, 200] and [4300, 4500] mm are quantified in Figure 5 and Table 3. Figure 5 uses variable-width bars that encode both texture amplitude and areal share: bar height is S q and bar width is the region area fraction (domain 1.000; interior 0.911 ; edge band 0.089 ). The edge columns are narrow but tall ( S q edge = 62.33 and 54.26 mm), whereas the interior columns are wide but lower ( S q int = 16.31 and 19.44 mm, below S q ref ); domain-wide S q all nevertheless remains close to the prior for both cases.
A lightweight filter comparison at the Case 2 application cutoff ω * = 4.4 (Supplementary Figure S1) shows that rectangular and second-order Butterworth high-pass filters both keep texture S q near the prior (absolute errors 0.35 and 0.04 mm, respectively). Filter choice therefore mainly modulates edge leakage and roll-off behavior rather than overturning the prior-informed cutoff logic; engineering deployments may prefer smoother ISO-compatible operators once ω * (or λ c ) is fixed.
As a numerical robustness property of the application procedure, additive Gaussian perturbations of standard deviation 4 mm—twice the ∼2 mm depth resolution of the RGBD sensor, adopted to simulate measurement error for a statistical repeatability check—are applied over 20 trials. For a fixed perturbed DEM, the grid search is deterministic; the arg min J cutoff remains stable at 5.8 ± 0.0 (Case 1) and 4.4 ± 0.0 (Case 2), with corresponding texture S q of 24.56 ± 0.0028 mm and 24.94 ± 0.0018 mm. Physical repeat stacking/scanning experiments were not performed in the present study and remain future work.


4. Discussion

4.1. Relation to Prior Series, Standards, and Alternative Methods

The present work constitutes the separation step in a broader BF burden-surface research chain rather than an isolated definitional study. It integrates tiled-surface statistics [3], particle-origin texture analysis [4], and multiscale roughness characterization [5] into a prior-informed cutoff criterion applicable to non-flat burden surfaces. Relative to spectral, fractal, wavelet, and conventional filtering approaches [6,7,8,9,10,11,12,13,14], the distinctive feature is the use of tiled-surface RMS height as a BF-specific prior whenever batch-wise particle information is available. Table 4 summarizes the conceptual relationship to ISO 16610-style practice: standardized filters provide mature operators, whereas the present contribution supplies a prior-informed cutoff layer that those operators can then apply.

4.2. Interpretation of the Validation Cutoff, Deviation Acceptability, and Edge Effects

The transition-informed validation cutoff ω = 4.2 in Figure 3 was selected by inspecting the RMS–frequency curves together with the associated shape–texture separation previews. On the cropped DEM width ( N x 507 ), this index maps to λ short 121 mm, which lies in the upper region of the particle-dominated fractal band (approximately 100–140 mm) reported previously [5]. This fractal-scale consistency provides an independent physical corroboration of the prior-informed cutoff criterion and of the frequency-domain separation algorithm, complementary to the absolute-error comparison with the ∼2 mm instrument depth resolution in Table 2 (3.22 and 1.56 mm for Cases 1 and 2). For BF applications, the relevant comparison is against sensor resolution and against the intended use of the shape boundary and texture roughness field rather than against a ground-truth shape–texture label.
Relative to the manually selected validation setting ω = 4.2 , the application cutoffs ω * = arg min J (Case 1: 5.8; Case 2: 4.4) achieve tighter domain-wide prior matching (absolute errors 0.03 and 0.35 mm; Figure 4; Table 3). At the same time, both ω * values are larger than 4.2, so the corresponding short-side wavelengths are shorter ( λ short 87.5 and 115.3 mm). Although the separated fields in Figure 4 appear well assigned, Figure 5 and Table 3 show that interior texture S q int (16.31 and 19.44 mm) lies below S q ref , whereas edge-band S q edge is strongly elevated. The area–amplitude pattern in Figure 5 shows that belt-edge inflation affects a small areal fraction but with disproportionately large S q , so domain-wide J ( ω ) remains sensitive to edge bands even when most interior pixels lie below S q ref . Because J ( ω ) is evaluated on the full domain, edge inflation raises domain-wide texture amplitude and thereby shifts arg min J toward higher ω (shorter λ ) to restore a domain S q near the prior. Refined constructions of J, such as interior-restricted or edge-down weighted designs, are planned for future work so that the grid search is less driven by finite-window artefacts; the filter comparison at fixed ω * in Supplementary Figure S1 addresses filter-family sensitivity only.

4.3. Industrial Feasibility, Validation Boundary, and Future Work

Methodological feasibility is supported at the input level: only a burden-surface DEM and batch-wise prior roughness or particle-size information are required [3,4,19,20]. Grid-search timings of about one minute per DEM are compatible with offline/near-line postprocessing of radar or endoscope data [1,2]. The present complex-surface validation is limited to two cold-state large-coke belts that share the same particle batch but differ in long-scale morphology; coincident RMS–frequency transition structures (Figure 3) support the internal consistency of the criterion under shape variation. Table 1 provides batch-wise tiled S q ref for four coke and sinter grades, but complex-surface separation was demonstrated for large coke only; sinter/mixed-charge complex morphologies and physical repeat experiments were outside the present scope. No hot-state ground-truth shape–texture labels are available. Future work includes (i) near-line monitoring modules integrated with radar/endoscope systems and gas–solid simulation or digital-twin workflows, (ii) refined J ( ω ) designs and adaptive, learning-assisted cutoff estimation for advanced deployment, and (iii) extension to sinter/mixed charges with repeated cold-state trials and limited hot-state comparison.

5. Conclusions

This study extends a blast furnace burden-surface research series by proposing a prior-informed framework for separating long-scale shape and short-scale texture on practical rough burden surfaces. The main conclusions are as follows:
  • A BF-specific operational distinction between burden-surface shape and texture is established from prior tiled-surface measurement, particle-scale morphology, and multiscale roughness studies, rather than from a universal definition for all rough surfaces.
  • A prior-informed cutoff criterion based on the tiled-surface RMS height of the charged particle batch is formulated. Cold-state RMS–frequency validation on large-coke burden belts with different long-scale shapes shows coincident transition structures. A transition-informed validation cutoff yields texture near the tiled prior with absolute errors comparable in magnitude to the instrument depth resolution (1.56–3.22 mm), supporting the validity of the criterion.
  • The proposed grid-search application ( ω * = arg min J ) yields cutoffs of 5.8 and 4.4 on the cold-state large-coke complex belts, with domain-wide absolute errors of 0.03 and 0.35 mm from the tiled prior and operationally distinct shape and texture components (Figure 4).
The separated components can supply bed-surface boundaries and local roughness inputs for gas–solid simulation and charging optimization, and the depth-based implementation remains transferable beyond a specific RGBD platform. As the fourth paper in the burden-surface series, this study provides a reproducible decomposition step that links DEM measurement to model-boundary preparation. Although validation is currently limited to cold-state large-coke complex belts, extending the framework to sinter and mixed charges, refining J ( ω ) where belt-edge texture inflation biases domain-wide evaluation (Section 4.2), and establishing quantitative checks in the absence of ground-truth shape–texture labels are logical next steps toward industrial deployment.

Supplementary Materials

The following supporting information can be downloaded at: https://www.mdpi.com/article/10.3390/pr14152510/s1. Table S1: Skewness and kurtosis of tiled burden surfaces; Algorithm S1: Expanded pseudocode for prior-informed cutoff grid search; Figure S1: Rectangular versus Butterworth separation at ω * = 4.4 (Case 2).

Author Contributions

Conceptualization, J.T. and A.T.; methodology, J.T.; software, J.T.; validation, J.T. and D.G.; formal analysis, J.T.; investigation, J.T.; resources, J.T. and D.G.; data curation, J.T.; writing—original draft preparation, J.T.; writing—review and editing, J.T., A.T. and D.G.; visualization, J.T.; supervision, A.T. and D.G.; project administration, J.T.; funding acquisition, J.T. All authors have read and agreed to the published version of the manuscript.

Funding

This research was partially supported by the R&D Program of Beijing Municipal Education Commission (No. KM202310005035) and the Chaoyang District Postdoctoral Research Grant (No. Q1001003202201).

Data Availability Statement

The experimental and computational parameter settings required to reproduce the separation procedure are reported in Section 2 and in the Supplementary Materials (Table S1 and Algorithm S1). Representative summary results are given in Table 2 and Table 3. Full cutoff-search curves and raw DEM files are available from the corresponding author upon reasonable request without embargo. These data are not publicly deposited because they were obtained from cold-state experimental setups associated with ongoing blast furnace measurement research.

Conflicts of Interest

The authors declare no conflicts of interest.

References

  1. Zankl, D.; Schuster, S.; Feger, R.; Stelzer, A.; Scheiblhofer, S.; Schmid, C.M.; Ossberger, G.; Stegfellner, L.; Lengauer, G.; Feilmayr, C.; et al. BLASTDAR—A Large Radar Sensor Array System for Blast Furnace Burden Surface Imaging. IEEE Sens. J. 2015, 15, 5893–5909. [Google Scholar] [CrossRef]
  2. Xu, T.; Chen, Z.; Jiang, Z.; Huang, J.; Gui, W. A real-time 3D measurement system for the blast furnace burden surface using high-temperature industrial endoscope. Sensors 2020, 20, 869. [Google Scholar] [CrossRef] [PubMed]
  3. Tian, J.; Tanaka, A.; Gao, D.; Liu, Z.; Hou, Q.; Chen, X. Characterization of the Blast Furnace Burden Surface: Experimental Measurement and Roughness Statistics. ISIJ Int. 2023, 63, 1217–1225. [Google Scholar] [CrossRef]
  4. Tian, J.; Tanaka, A.; Gao, D.; Hou, Q.; Chen, X. Burden Particle Contour Extraction from Digital Elevation Model of Blast Furnace Rough Surface. ISIJ Int. 2024, 64, 1218–1222. [Google Scholar] [CrossRef]
  5. Tian, J.; Tanaka, A.; Gao, D. Characterization of the Blast Furnace Burden Surface: A Fractal Analysis Approach. ISIJ Int. 2025, 65, 1760–1765. [Google Scholar] [CrossRef]
  6. Yang, H.; Baudet, B.A.; Yao, T. Characterization of the surface roughness of sand particles using an advanced fractal approach. Proc. R. Soc. A Math. Phys. Eng. Sci. 2016, 472, 20160524. [Google Scholar] [CrossRef] [PubMed]
  7. Jacobs, T.D.B.; Junge, T.; Pastewka, L. Quantitative characterization of surface topography using spectral analysis. Surf. Topogr. Metrol. Prop. 2017, 5, 013001. [Google Scholar] [CrossRef]
  8. Persson, B.N.J.; Albohr, O.; Tartaglino, U.; Volokitin, A.I.; Tosatti, E. On the nature of surface roughness with application to contact mechanics, sealing, rubber friction and adhesion. J. Phys. Condens. Matter 2004, 17, R1–R62. [Google Scholar] [CrossRef] [PubMed]
  9. Li, Y.; Otsubo, M.; Kuwano, R.; Nadimi, S. Quantitative evaluation of surface roughness for granular materials using Gaussian filter method. Powder Technol. 2021, 388, 251–260. [Google Scholar] [CrossRef]
  10. Wang, X.; Shi, T.; Liao, G.; Zhang, Y.; Hong, Y.; Chen, K. Using Wavelet Packet Transform for Surface Roughness Evaluation and Texture Extraction. Sensors 2017, 17, 933. [Google Scholar] [CrossRef] [PubMed]
  11. Czifra, Á.; Ancza, E. Micro- and Nano-Roughness Separation Based on Fractal Analysis. Materials 2024, 17, 292. [Google Scholar] [CrossRef] [PubMed]
  12. Podulka, P.; Macek, W.; Zima, B.; Lesiuk, G.; Branco, R.; Królczyk, G. Roughness evaluation of turned composite surfaces by analysis of the shape of autocorrelation function. Measurement 2023, 222, 113640. [Google Scholar] [CrossRef]
  13. Raja, J.; Muralikrishnan, B.; Fu, S. Recent advances in separation of roughness, waviness and form. Precis. Eng. 2002, 26, 222–235. [Google Scholar] [CrossRef]
  14. He, B.; Zheng, H.; Ding, S.; Yang, R.; Shi, Z. A review of digital filtering in evaluation of surface roughness. Metrol. Meas. Syst. 2021, 28, 217–253. [Google Scholar] [CrossRef]
  15. ISO 16610-21:2025; Geometrical Product Specifications (GPS)—Filtration—Part 21: Linear Profile Filters: Gaussian Filters. International Organization for Standardization: Geneva, Switzerland, 2025.
  16. ISO 16610-61:2015; Geometrical Product Specification (GPS)—Filtration—Part 61: Linear Areal Filters—Gaussian Filters. International Organization for Standardization: Geneva, Switzerland, 2015; Confirmed 2023; Amendment 1:2019.
  17. ISO 16610-31:2025; Geometrical Product Specifications (GPS)—Filtration—Part 31: Robust Profile Filters: Gaussian Regression Filters. International Organization for Standardization: Geneva, Switzerland, 2025.
  18. Gao, S.; Geng, X.; Zhang, X.; Jiang, Z.; Zhao, Z.; Zhang, Y. A Review on Numerical Simulation and Modeling Techniques in Blast Furnace Ironmaking. Processes 2026, 14, 2014. [Google Scholar] [CrossRef]
  19. Thurley, M.J.; Andersson, T. An industrial 3D vision system for size measurement of iron ore green pellets using morphological image segmentation. Miner. Eng. 2008, 21, 405–415. [Google Scholar] [CrossRef]
  20. Liu, J.; Jiang, Z.; Gui, W.; Chen, Z. A Novel Particle Size Detection System Based on RGB-Laser Fusion Segmentation with Feature Dual-Recalibration for Blast Furnace Materials. IEEE Trans. Ind. Electron. 2023, 70, 10690–10699. [Google Scholar] [CrossRef]
Figure 1. Prior-informed shape–texture separation workflow. Solid numbered boxes: Application pipeline from DEM and batch prior S q ref through FFT-based evaluation of J ( ω ) , ω * = arg min J , LP/HP separation, and assessment. Dashed panel (brace on Steps 3–5): RMS–frequency numerical validation.
Processes 14 02510 g001
Figure 2. Cold-state simulated burden belts and corresponding DEMs for Case 1 (top row) and Case 2 (bottom row). All spatial coordinates and elevations are in millimetres. (Top-left) Measurement scenario with RGBD scanning direction. (Top-right) Raw reconstructed surface. (Bottom) Preprocessed DEMs used in the analysis.
Processes 14 02510 g002
Figure 3. Numerical validation of the prior-informed criterion: relationship between texture RMS height S q (mm) and cutoff index ω (-) for Case 1 and Case 2. Central panel: Local and global S q ω curves; inset: ω [ 0.1 , 50 ] ; main panel: magnified ω [ 0.1 , 5 ] ; red for Case 1, green for Case 2. Upper and lower rows: Shape and texture previews (coordinates in millimetres) at selected cutoff indices. Transition structures coincide for both cases. At the transition-informed validation setting ω = 4.2 , Table 2 reports S q = 27.48 mm (Case 1) and 25.82 mm (Case 2) against S q ref = 24.26 mm.
Processes 14 02510 g003
Figure 4. Shape and texture separation for Case 1 (left; ω * = 5.8 ) and Case 2 (right; ω * = 4.4 ) obtained by the prior-informed grid search ω * = arg min J . All spatial coordinates and elevations are in millimetres. Each column shows, from top to bottom, the original preprocessed DEM, the low-pass shape component z shape , and the high-pass texture component z texture . Quantitative metrics are summarized in Table 3.
Processes 14 02510 g004
Figure 5. Edge-effect quantification at ω * (Case 1: 5.8; Case 2: 4.4). Variable-width bars: Height = texture S q (mm); width = areal fraction of each region (domain 1.000; interior 0.911 ; edge band 0.089 , Table 3), annotated above each bar. Interior excludes 200 mm margins along the scanning direction. The dashed line marks S q ref = 24.26 mm.
Processes 14 02510 g005
Table 1. Tiled burden-surface RMS height for different particle batches [3]. Thumbnail images correspond to sample burden particles in Cases (a)–(d); skewness and kurtosis are listed in Supplementary Table S1.
Parameter(a) Small
Coke
(b) Large
Coke
(c) Small
Sintered Ore
(d) Large
Sintered Ore
Processes 14 02510 i001Processes 14 02510 i002Processes 14 02510 i003Processes 14 02510 i004
RMS height (mm)13.918824.26224.00257.4235
Table 2. Texture RMS heights at the validation cutoff ω = 4.2 selected from the transition analysis in Figure 3. Absolute error is | S q texture S q ref | ; errors are comparable in magnitude to the ∼2 mm depth resolution of the RGBD measurement chain (1.56 mm for Case 2; 3.22 mm for Case 1).
Case ω S q texture (mm) S q ref (mm)Absolute Error (mm)
14.227.4824.263.22
24.225.8224.261.56
Table 3. Separation and edge metrics at the application cutoffs ω * = arg min J . Interior and edge bands use 200 mm margins along the scanning direction; λ short = min ( N x Δ x , N y Δ y ) / ω * . Area frac. (edge) is the edge-band area fraction along the scanning direction on the uniform DEM grid (interior fraction 1   Area frac. (edge)); bar widths in Figure 5 use the same fractions.
Case ω * λ short (mm) S q all (mm) S q int (mm) S q edge (mm)Area Frac. (Edge)Recon. RMSE (mm)
15.887.524.2316.3162.330.089 2.7 × 10 13
24.4115.324.6119.4454.260.089 3.2 × 10 13
Table 4. Conceptual comparison of cutoff determination approaches for surface component separation.
Method FamilyHow Cutoff is SetBatch PriorAdaptation to BF Burden Surfaces
ISO 16610 Gaussian/
robust filters [15,16,17]
Standard λ c /experienceUsually noMature operators; cutoff still needs application-specific choice
PSD/fractal scale analysis [6,8,11]Spectral or fractal scaleIndirect; surface-intrinsicMultiscale characterization; limited
link to BF prior-informed
shape boundaries
Wavelet/envelope methods [10]Decomposition levelUsually noUseful for texture extraction; level selection remains empirical
Prior-informed
framework
(this work)
arg min S q ref S q HP YesDirectly uses charging-batch
roughness prior
Disclaimer/Publisher’s Note: The statements, opinions and data contained in all publications are solely those of the individual author(s) and contributor(s) and not of MDPI and/or the editor(s). MDPI and/or the editor(s) disclaim responsibility for any injury to people or property resulting from any ideas, methods, instructions or products referred to in the content.