Article

Large-Scale Physical Simulation of CO2 Hydrate Dissociation and Reservoir Response

1
State Key Laboratory of Digital Intelligent Technology for Unmanned Coal Mining, Anhui University of Science & Technology, Huainan 232001, China
2
National Key Laboratory of Deep Coal Safety Mining and Environmental Protection, Anhui University of Science and Technology, Huainan 232001, China
3
School of Safety Science and Engineering, Anhui University of Science & Technology, Huainan 232001, China
*
Authors to whom correspondence should be addressed.
Processes 2026, 14(15), 2509; https://doi.org/10.3390/pr14152509
Submission received: 22 June 2026 / Revised: 29 July 2026 / Accepted: 3 August 2026 / Published: 5 August 2026
(This article belongs to the Section Petroleum and Low-Carbon Energy Process Engineering)

Abstract

Large-scale physical model experiments play a critical role in understanding the coupled thermo–hydro-mechanical responses during hydrate dissociation. In this study, a specially designed large-scale physical simulation apparatus (effective volume: 1178 L) was employed to investigate the depressurization-induced dissociation behavior of CO2 hydrate, which was used as a model system to simulate the macroscopic response of hydrate-bearing sediments under controlled laboratory conditions. Key reservoir parameters—including temperature, pressure, electrical resistivity, gas production rate, and stratum displacement—were continuously monitored using an integrated array of temperature sensors, pressure transducers, electrical resistivity probes, and displacement meters. During depressurization, the system pressure decreased from 3 MPa to 1 MPa (matching the backpressure), while the internal temperature dropped from 3.5 °C to approximately 1 °C due to the endothermic dissociation of the hydrate. Gas production exhibited a three-stage evolution: an initial slow release, a rapid increase as the dissociation front propagated through the sediment, and a plateau upon completion of hydrate dissociation. Based on the measured gas production and CO2 consumption, the hydrate saturation was estimated to be approximately 0.248. The dissociation process led to measurable sediment settlement, with a maximum vertical displacement of 88.3 mm (approximately 5.88% of the model height). Analysis of the evolution of effective stress indicates that depressurization reduced pore pressure and increased vertical effective stress by approximately 0.55 MPa, while hydrate dissociation weakened the sediment skeleton, jointly causing settlement. This study demonstrates the feasibility of using a large-scale apparatus to capture the coupled processes during hydrate dissociation. It provides benchmark experimental data for validating numerical models of hydrate-bearing sediment behavior. Further validation is required before these results can be extrapolated to CH4 hydrate systems.

1. Introduction

China’s energy structure is undergoing a rapid transformation from a coal-dominated structure to a more diversified, cleaner, and low-carbon system. In recent years, the share of non-fossil fuels in primary energy consumption has steadily increased, reaching over 18% in 2024 [1]. Natural gas hydrates (NGHs), with their high energy density, clean nature, and enormous gas reserves, are considered one of the most promising unconventional energy sources of the 21st century [2,3]. NGHs are widely distributed in permafrost regions and deep-sea sediments, with approximately 97% of known hydrate deposits occurring in marine sediments under high-pressure and low-temperature conditions [4,5]. Hydrate reservoirs, such as carbon storage layers and seafloor features, play an important role in the global carbon cycle. However, uncontrolled dissociation of hydrates due to natural processes or human activities could lead to sudden methane release into the atmosphere and cause submarine slope instability, resulting in marine geological disasters [6,7,8,9]. Therefore, the safe and controlled extraction of methane from hydrates is crucial not only for energy development but also for managing potential environmental risks. Gas hydrate mining, including hydrate dissociation, multi-phase flow, and sandstone reservoir movement, is a multi-field coupling process [10]. To enhance the recovery of natural gas from low-permeability hydrate reservoirs, the hydrate dissociation behavior and reservoir stability during the production process have attracted the attention of scholars and engineers.
Regarding natural gas hydrate extraction, the following methods or combinations are currently considered to have high feasibility, depressurization, heat injection, CO2 replacement, inhibitor injection, and solid-fluidized methods [11,12,13,14,15]. The essence of these methods is to alter the temperature-pressure environment of the hydrate, breaking the phase equilibrium to induce dissociation. Among these methods, depressurization is currently regarded as the most economical and effective. This technology lowers the pressure of a gas hydrate reservoir below the stability thresh-old, triggering hydrate dissociation and then methane release. Successful pilot tests in the Nankai Trough, Japan [16], the Mallik region, Canada [17], and the South China Sea [18,19] have demonstrated the feasibility of depressurization extraction. The hydrate extraction process involves complex multiphase and multifield interactions, such as: hydrate dissociation producing large amounts of gas-phase methane and liquid-phase water, which leads to changes in reservoir pore pressure and effective stress [20]; heat absorption from hydrate dissociation, which significantly alters the temperature field [21,22]; and the loss of hydrate cementation reducing the strength and stiffness of the reservoir, and significantly influencing its deformation characteristics [23,24]. Therefore, a deep understanding of multiphase and multifield evolution during hydrate extraction, including solid-phase transformation, heat transfer, fluid flow, and deformation, as well as the associated reservoir failure mechanisms, is essential for ensuring the safe and efficient extraction of hydrate energy.
Due to the high cost and risk of field testing, which limits widespread implementation, laboratory experiments have become an important means to study hydrate extraction behavior. Over the past two decades, many researchers have conducted extensive experiments on the dissociation behavior of hydrates under depressurization conditions. Early studies, such as those by Masuda [25], Yousif [26], and Vanoudheusden [27], primarily used one-dimensional sand column experiments to explore the dissociation dynamics and gas-water production characteristics of hydrates under depressurization. Subsequently, Bai et al. [28] developed a two-dimensional experimental system for hydrate dissociation in porous media, studying multiphase fluid flow during dissociation. Muraoka et al. [29] used a two-dimensional glass micromodel to observe the pore-scale distribution of methane hydrate and evaluate its effect on water permeability. Visual and in-situ monitoring technologies have also been widely used. For instance, Seol et al. [30] used X-ray computed tomography (CT) to visualize and quantify methane hydrate formation and dissociation to investigate the effects of water flow in hydrate-bearing sands with different particle-size distributions. Zhao et al. [31] used high-resolution magnetic resonance imaging (MRI) to visually study gas–water migration in the Gas Hydrate Stability Zone (GHSZ) and experimentally investigate the formation of hydrate caps. In recent years, experimental systems have become more integrated and refined, incorporating supergravity, temperature and pressure control, multi-point sensing, and image acquisition technologies, and sediment sample selection has increasingly reflected real geological conditions, enhancing the representative-ness and engineering applicability of experimental results [32,33,34,35]. These studies provide a solid foundation for understanding heat transfer, fluid migration, and changes in pore structure during hydrate dissociation.
Despite these advances, most laboratory experiments are limited by factors such as small physical scale, simplified boundary conditions, and lack of representativeness regarding field geological and geomechanical conditions [36,37]. These limitations hinder the ability to fully capture the complex coupling relationships involved in heat, water, and thermo–hydro-mechanical (THM) processes during hydrate extraction [38,39]. Moreover, current numerical simulation models heavily rely on empirical parameter calibration, which requires validation using high-fidelity experimental data. Small-scale tests, however, cannot reliably provide such data. As a result, significant uncertainty remains in extrapolating laboratory observations to real-world applications, particularly concerning production efficiency, reservoir stability, and gas–water two-phase flow behavior [40,41].
Numerical and field-scale studies have further highlighted the importance of coupled reservoir responses during hydrate production. Rutqvist et al. [42] investigated wellbore stability using coupled multiphase flow and geomechanical modeling, while Moridis et al. [43] evaluated hydrate production under single- and multi-well scenarios at the NGHP-02-09 site. Konno et al. [44] summarized the first offshore methane hydrate production test in Japan and discussed the challenges associated with field-scale production. These studies demonstrate the need for reliable large-scale experimental data to support model validation and field-scale prediction.
This study utilizes a specially designed large-scale experimental simulation apparatus (with an effective volume of 1178 L) to conduct a systematic investigation of gas hydrate reservoirs at the laboratory scale. Depressurized hydrate mining was simulated in the laboratory using a specially designed large-scale hydrate experimental apparatus. During the experiment, key parameters—including temperature distribution, pore pressure evolution, electrical resistivity variation, and sediment deformation–were continuously monitored using temperature sensors, pressure sensors, electrical resistivity probes, and dis-placement meters. In addition, the coupling mechanisms of heat–water–mechanical (THM) interactions and their comprehensive impact on reservoir stability and gas pro-duction efficiency were analyzed. The findings provide laboratory-scale insights into the dynamic response patterns of key parameters—such as temperature distribution, pore pressure evolution, electrical resistivity variation, and sediment deformation—during depressurization-induced dissociation processes. Compared with previous one-dimensional, two-dimensional, and small-scale experiments, the present experimental system integrates temperature, pressure, electrical resistivity, gas production, overburden pressure, and vertical displacement measurements. This configuration enables real-time observation of coupled multi-field responses and the acquisition of large-scale experimental data for numerical model validation.

2. Experimental Method

2.1. Experimental Apparatus

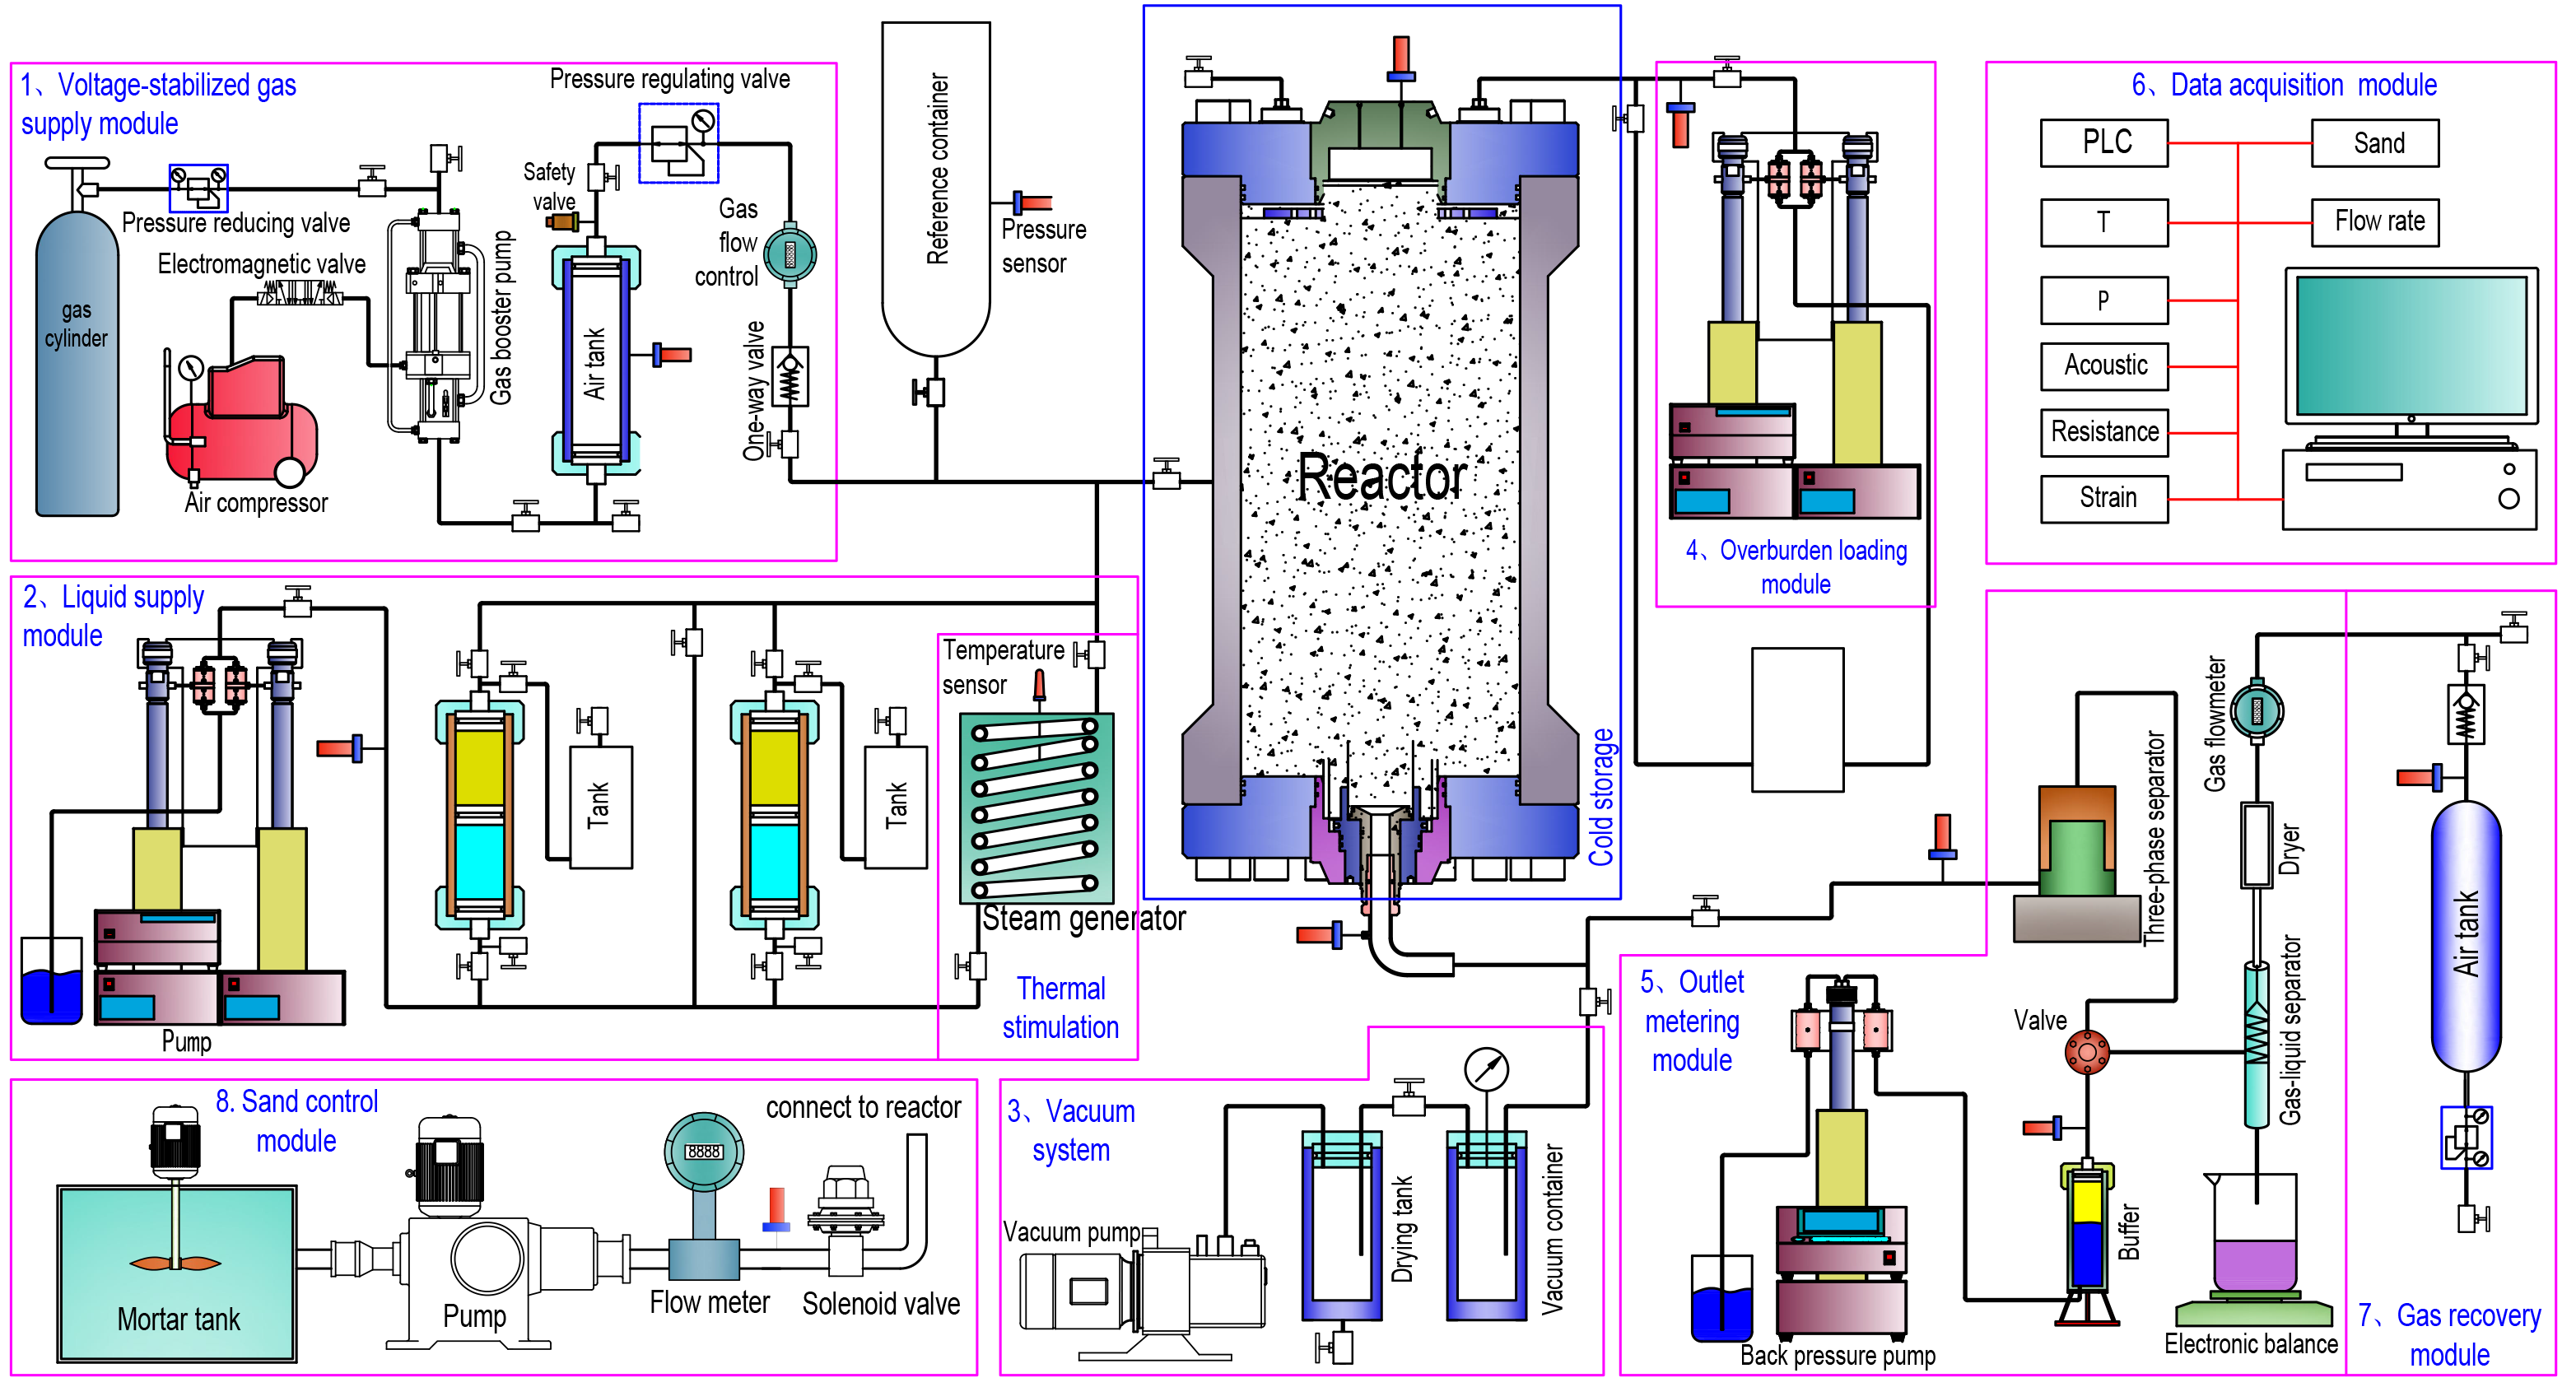
The experimental system is a specially designed large-scale hydrate simulation system, as shown in Figure 1. The design of the system adopts a modular approach with a compact structure, comprising the following modules: (1) voltage-stabilized gas supply module; (2) liquid supply module; (3) vacuum module; (4) overburden loading module; (5) outlet metering module; (6) data acquisition module; (7) gas recovery module; and (8) sand control module. Depending on the specific research objectives, different modules can be combined to conduct experiments with various functions and modes.

2.1.1. High-Pressure Reactor

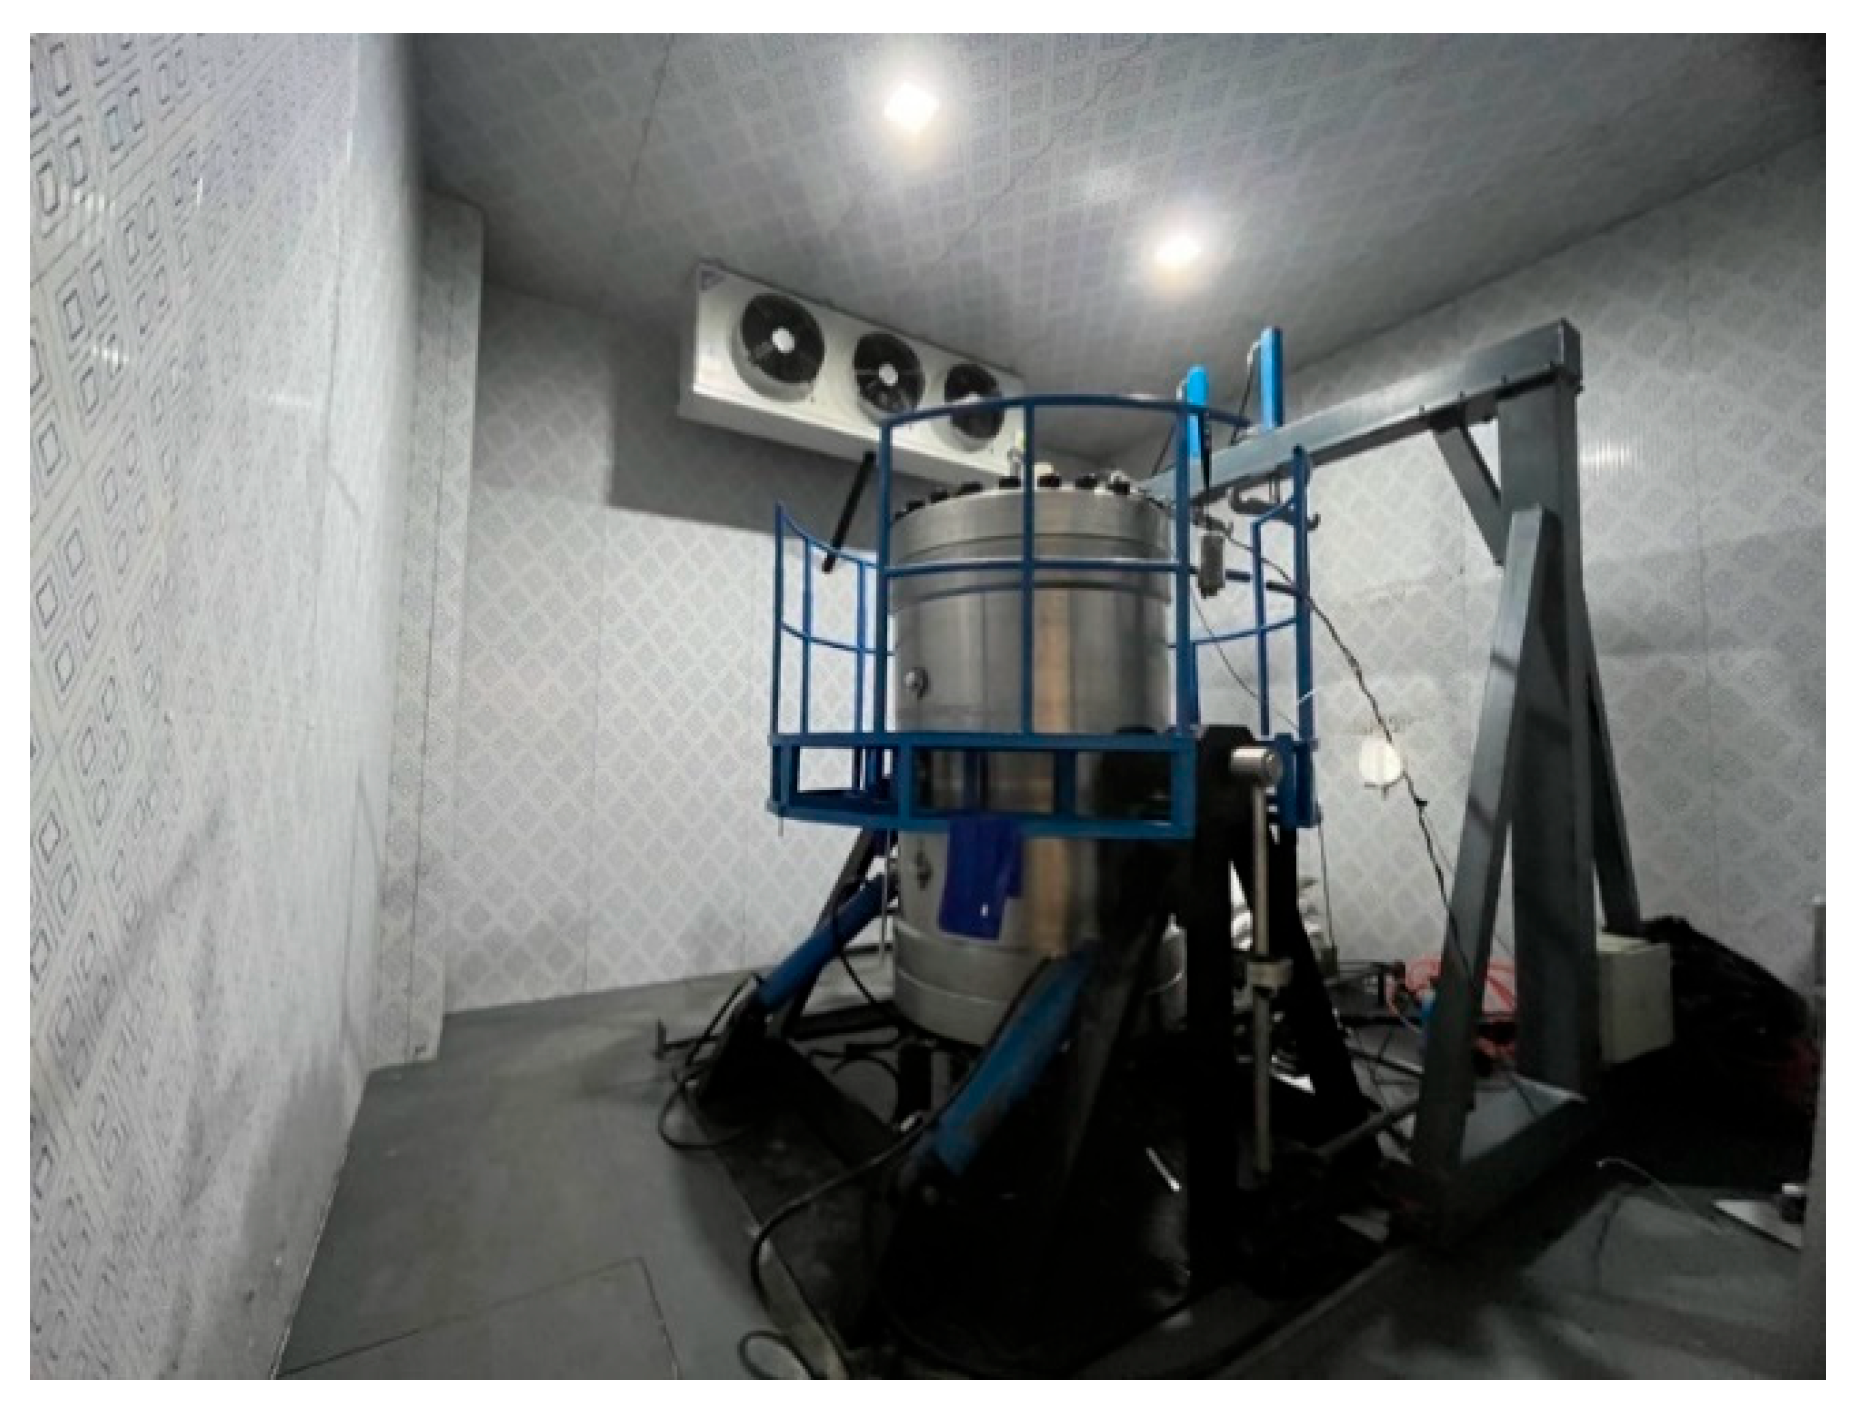
The primary function of the high-pressure reactor is to provide high-pressure and low-temperature conditions for gas hydrate depressurization experiments. The system is also integrated with multi-parameter monitoring capabilities, enabling real-time, synchronized collection and recording of key environmental indicators such as temperature and pressure, as shown in Figure 2. The high-pressure reactor has an internal diameter of 1000 mm, an internal height of 1500 mm, an effective volume of approximately 1178 L, and a design pressure tolerance of up to 30 MPa, making it suitable for various extreme experimental conditions. The large sample volume reduces the surface-area-to-volume ratio and increases the distance between the production outlet and the reactor boundaries. This allows multidimensional pressure propagation, gas–water migration, and hydrate dissociation fronts to develop over longer flow paths. Consequently, wall heat transfer and boundary-induced preferential flow have a smaller relative influence on the measured responses.
Large-scale experimental reactors for simulating hydrate formation and production have been systematically reviewed in previous studies [45]. To place the scale and monitoring capabilities of the present reactor in context, Table 1 compares it with representative large-scale hydrate experimental systems. From this, it is clear that the present reactor has an effective volume of 1178 L and integrates measurements of temperature, pressure, electrical resistivity, gas production, and vertical displacement. This configuration enables the coupled responses during CO2 hydrate dissociation to be investigated under large-scale experimental conditions.

2.1.2. Sensor Deployment

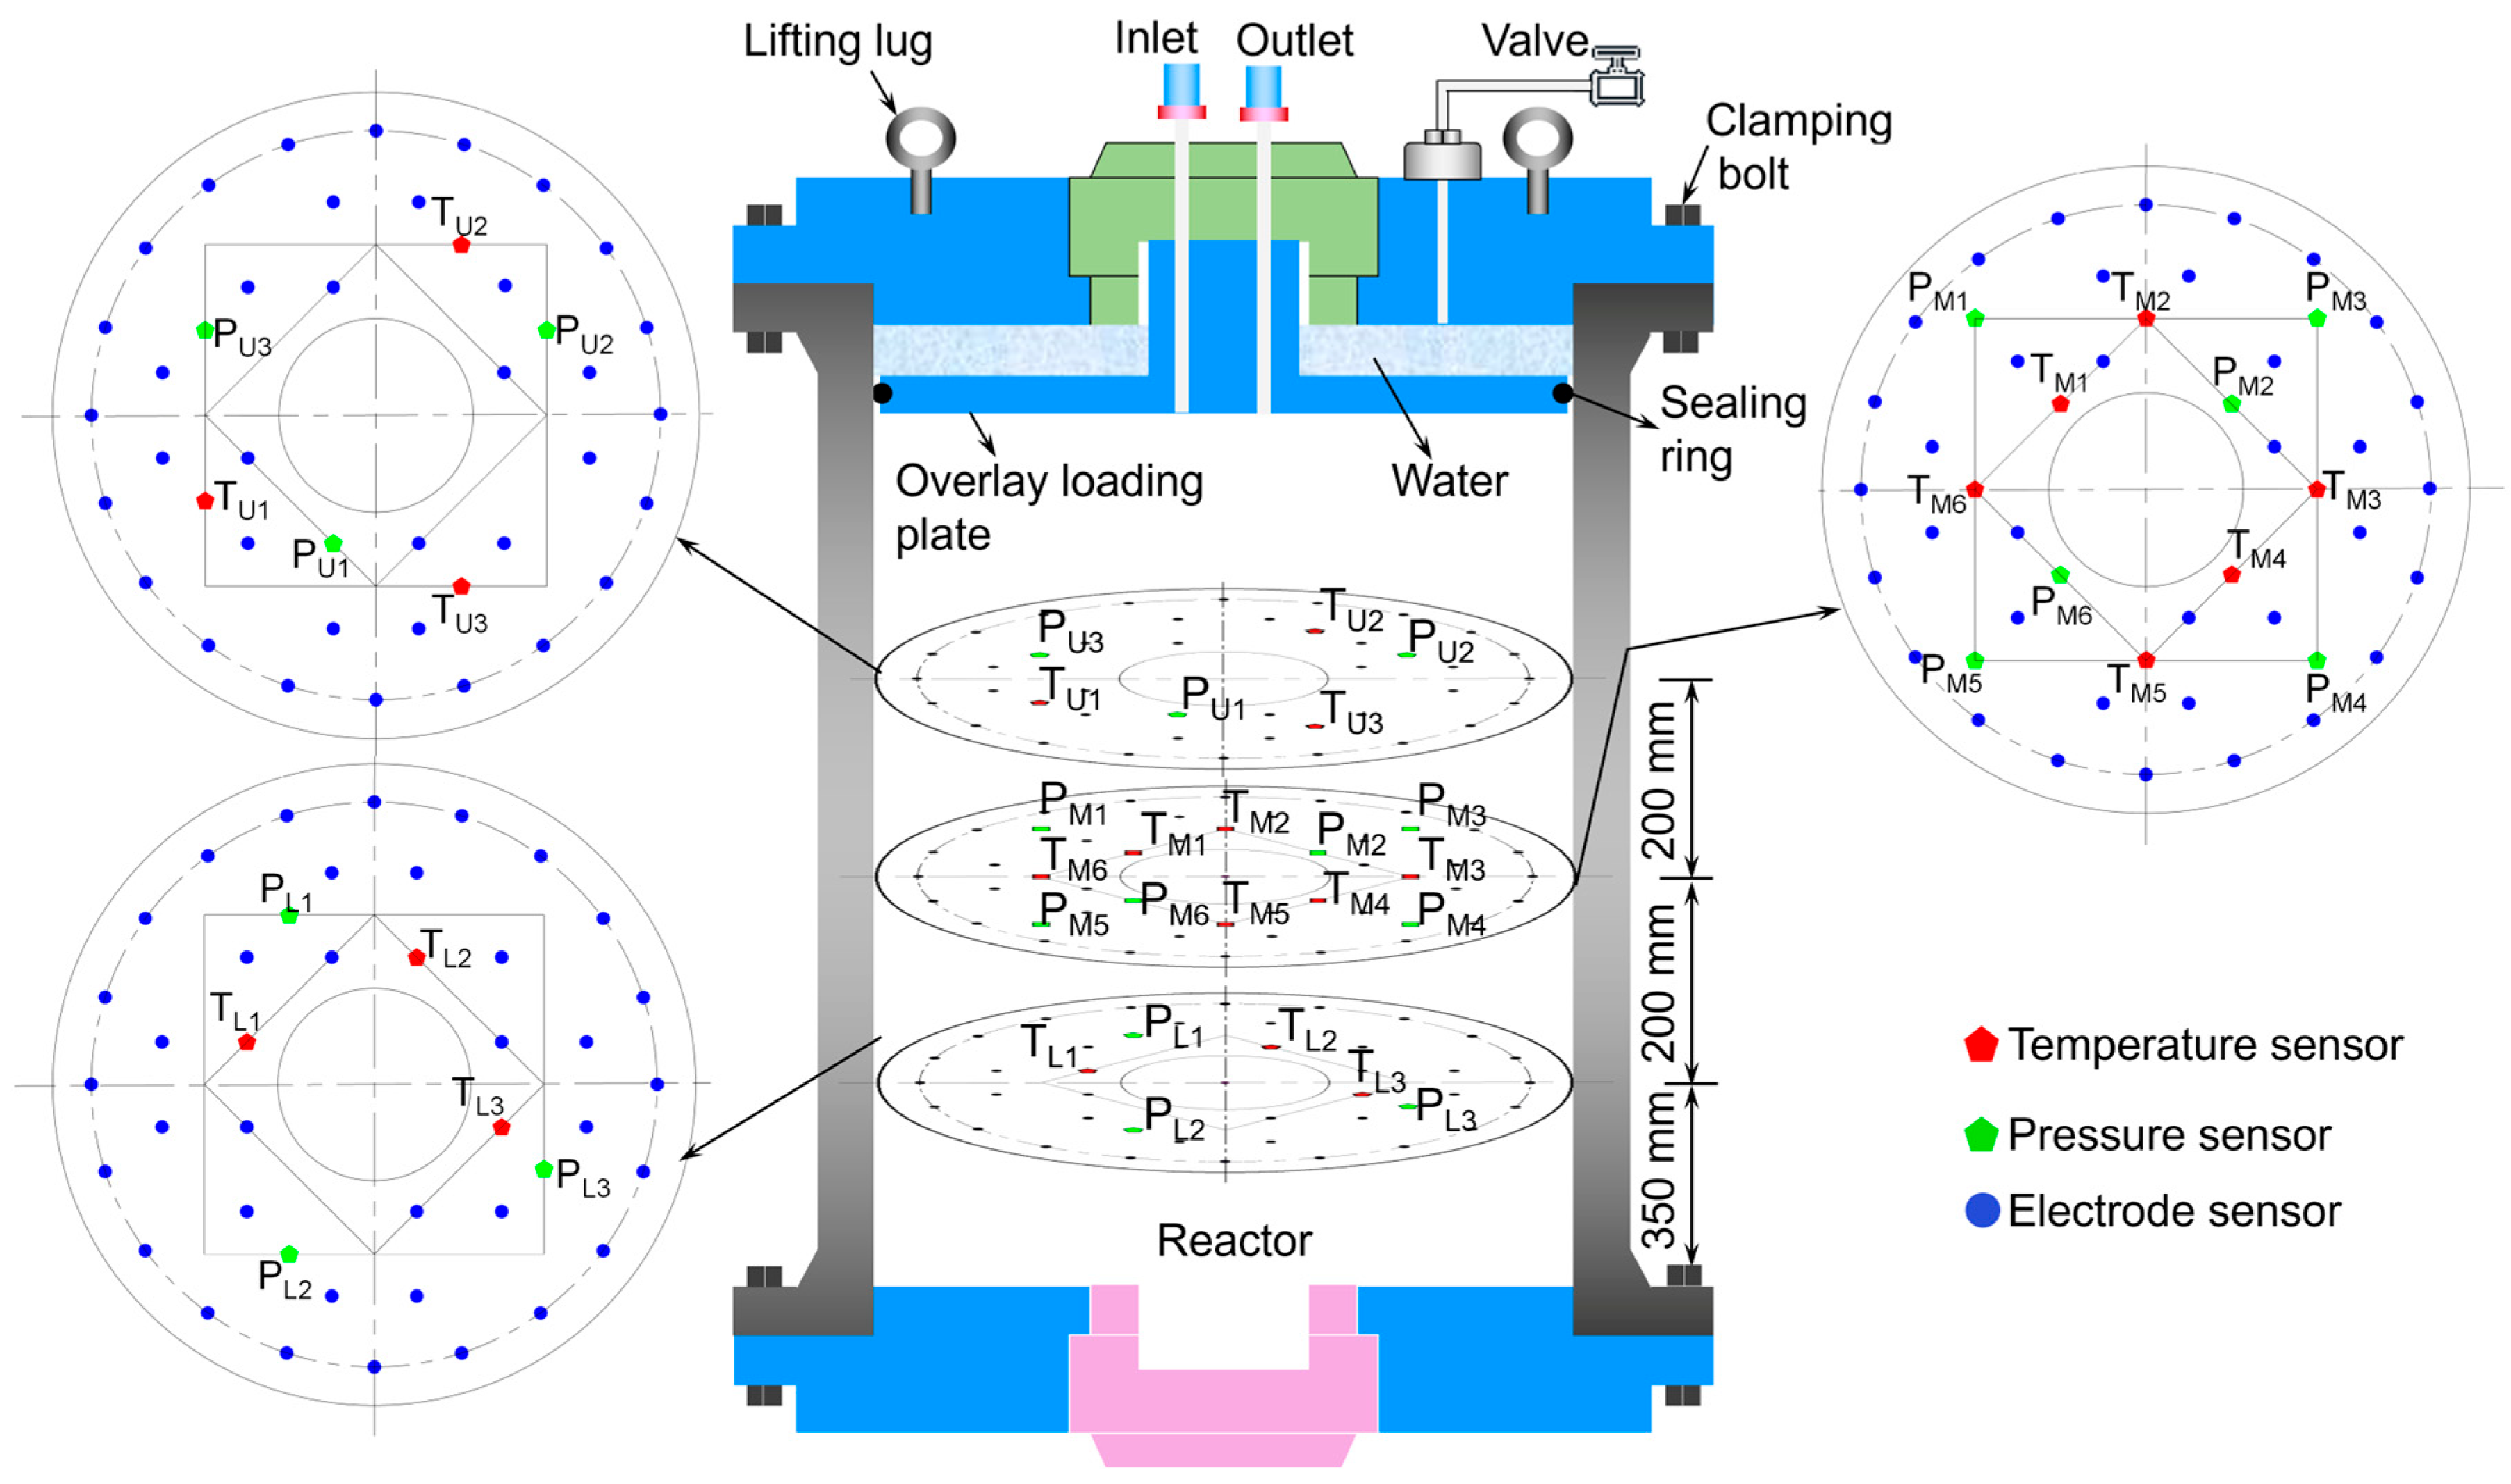
The monitoring interfaces are uniformly arranged in the lower cover area using a circular distribution method. The system is equipped with 36 monitoring channels, with resistivity sensors arranged in three layers, forming 108 resistivity monitoring points. This setup enables full spatial sensing and precise monitoring of the electrical changes in the experimental medium. There are 12 pressure monitoring points, with 3 distributed in the upper layer, 6 in the middle layer, and 3 in the lower layer, to capture pressure variation at multiple depths. Similarly, 12 temperature monitoring points are arranged, with an identical distribution pattern to that of the pressure monitoring points, enabling the capture of temperature changes at different layers during the experiment. The layout of the sensors is shown in Figure 3. Moreover, vertical displacement was measured using displacement sensors installed along the model’s height.

2.2. Experimental Procedures

2.2.1. Soil Materials

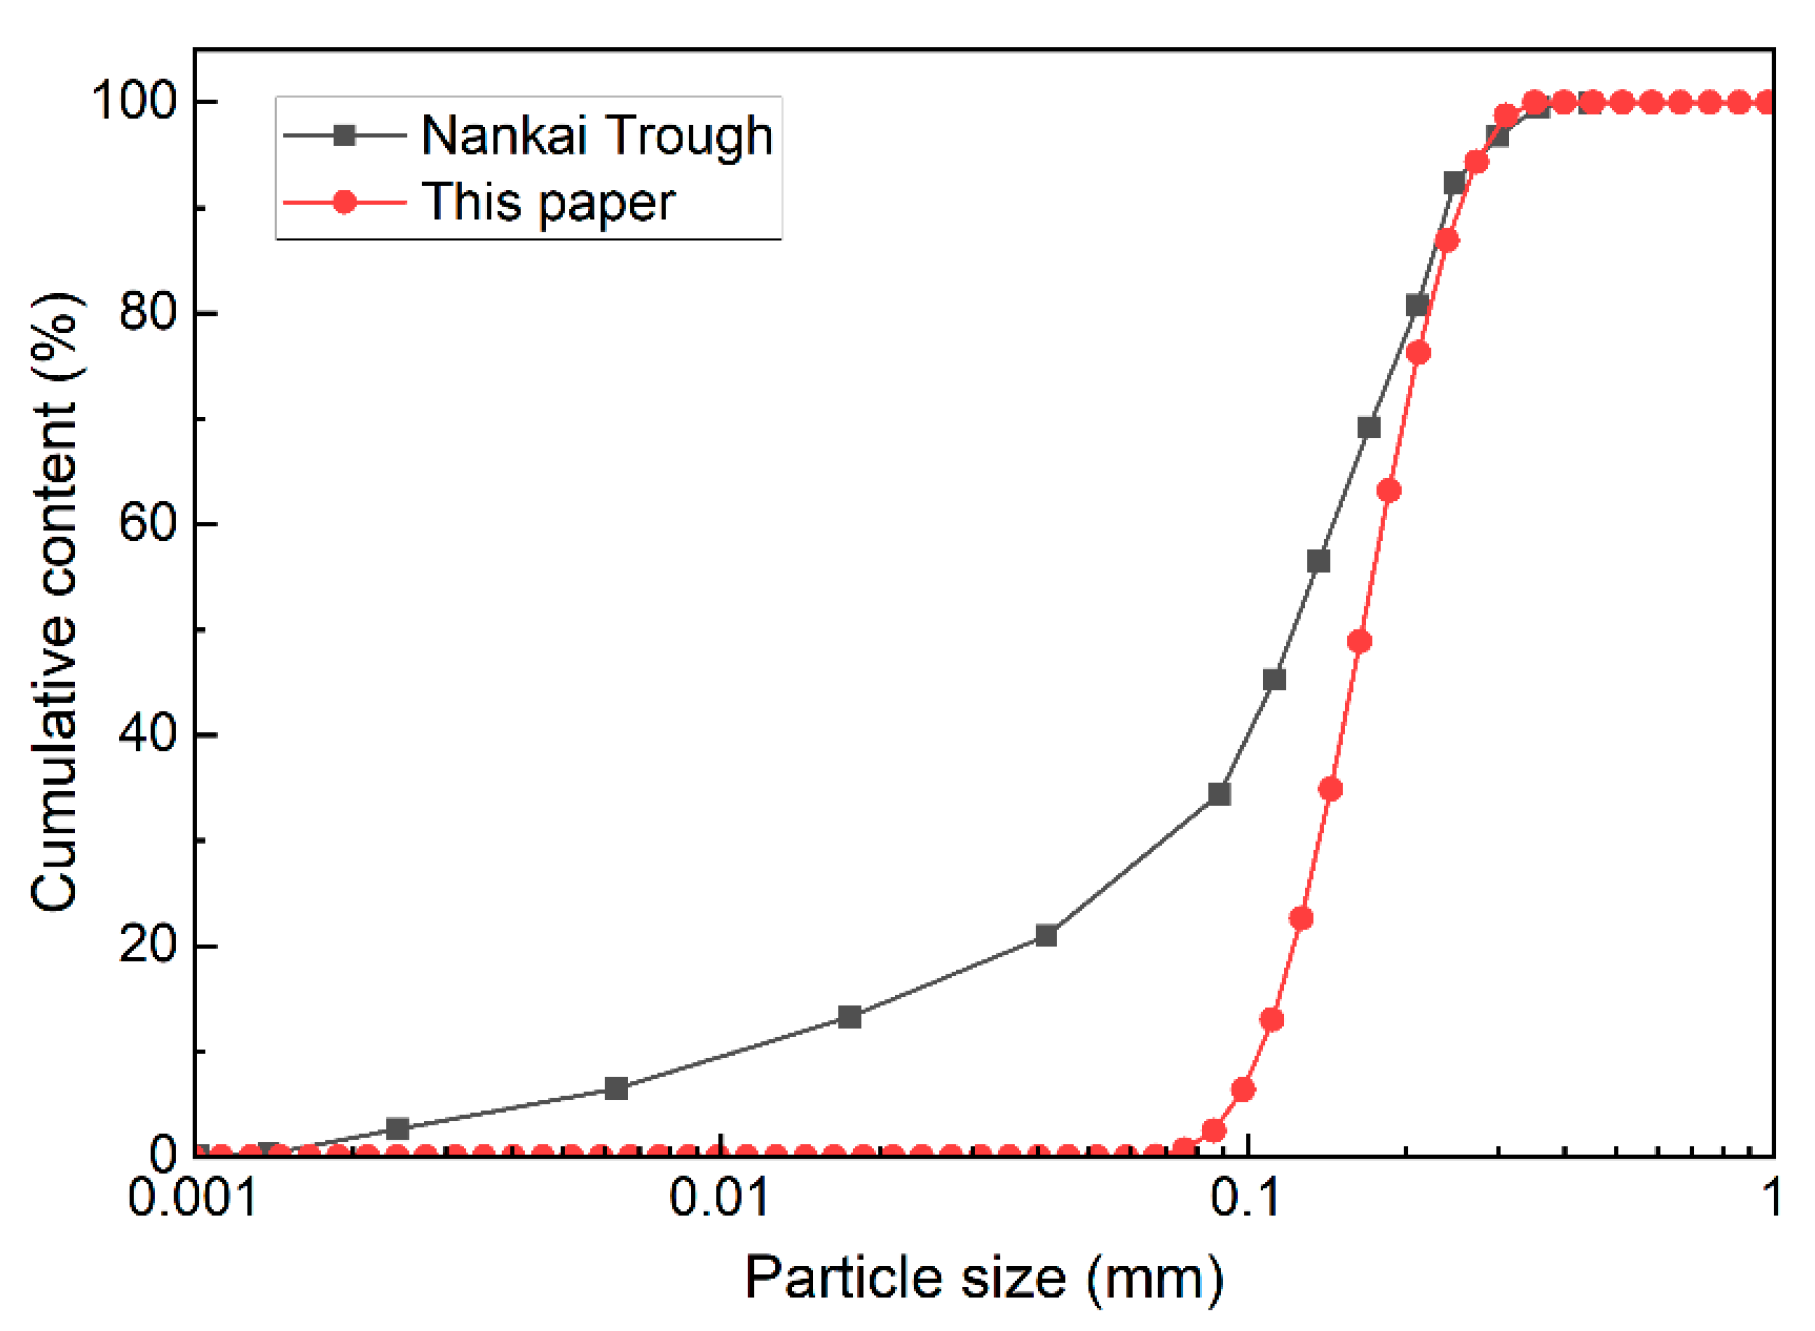
The sediment skeleton material used in the experiment is 110 mesh quartz sand, with a relative mass density of 2.73. The particle gradation is similar to the in situ sediment characteristics in the Nankai Trough area, and the particle size distribution curve is shown in Figure 4. Based on the particle size distribution curve, the particle size ranges from 60 μm to 350 μm, with a median particle size of 165.2 μm. According to the geotechnical testing standards, particles with a diameter greater than 75 μm account for more than 50% of the total, resulting in a classification of coarse-grained sand. Additionally, as shown in Table 2, the uniformity coefficient Cu < 5 and the curvature coefficient Cc < 1 further classify the sand as poorly graded [51].
Compared to methane (CH4) hydrates, carbon dioxide (CO2) hydrates form more readily under experimental conditions, and their crystal structure and mechanical properties exhibit a high degree of consistency with CH4 hydrates. Therefore, CO2 hydrates are widely used as experimental substitutes for CH4 hydrates in related studies [52,53,54,55,56]. Based on this consideration, the system initially uses CO2 gas with a purity of 99.9% as the substitute gas source to synthesize a CO2 hydrate reservoir model, enabling verification of system performance and experimental case analysis under basic operating conditions.
The CO2 hydrate-bearing sediment model was used to investigate macroscopic thermo, hydraulic, and mechanical responses during depressurization. The observed dissociation stages and THM coupling processes can provide a qualitative reference for CH4 hydrate studies. However, the measured data are specific to the present experimental conditions. Owing to differences between CO2 and CH4 hydrates in terms of phase equilibrium, dissociation kinetics, gas solubility, and multiphase flow behavior, further validation is required.

2.2.2. Preparation and Hydrate Formation Process

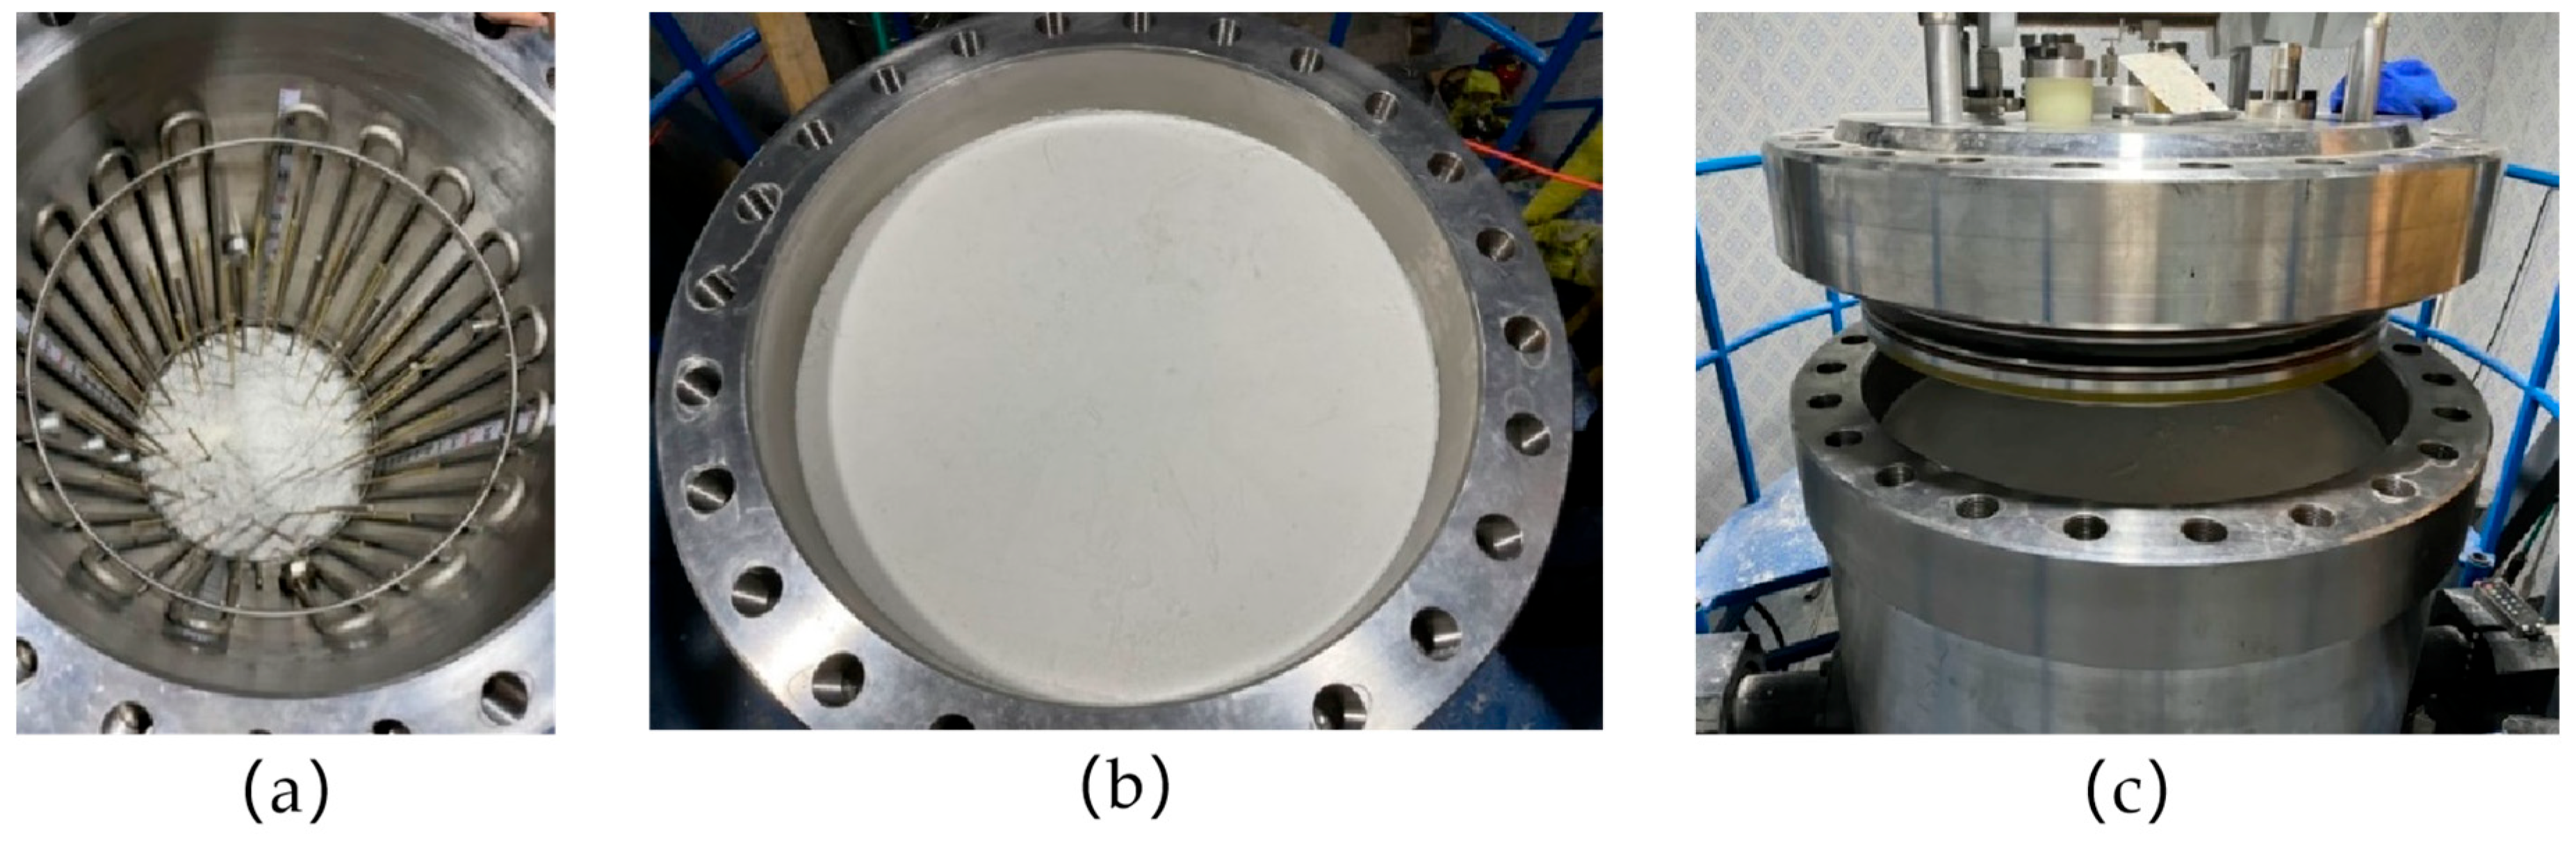
In this experiment, the unsaturated method was used to prepare the hydrate reservoir model. The unsaturated method involves compacting sand at a specified initial water content, evacuating the system, injecting CO2 to the target pressure, and cooling the system to form hydrate. To minimize residual air, a multi-step vacuum-assisted saturation procedure was adopted. After layered compaction of the sediment, the assembled model was subjected to prolonged vacuum extraction (approximately –0.095 MPa for 48 h) to remove entrapped air from the pore space. Subsequently, degassed water was injected from the bottom boundary upward under a controlled pressure of 0.2–0.3 MPa to displace any remaining air. Afterward, the model was water-saturated. This method results in faster hydrate formation and higher experimental efficiency. Moreover, by controlling the initial liquid water distribution in the soil matrix, it is easier to control the uniformity of hydrate formation, which is crucial to ensure the consistency and comparability of results. Hence, it is commonly used in hydrate model experiments [34,57]. First, quartz sand and deionized water were thoroughly mixed at a mass ratio of 12:1 to ensure uniform distribution of water between the sand grains. After preparation, the mixture was added to the reaction vessel in 8 layers (with an effective model volume of 1178 L), and each layer was compacted using a standard compaction hammer to ensure the density and uniformity of the model. The thickness of each layer was 187.5 mm, and the entire filling process is shown in Figure 5. Based on the volume and the mixture ratio, a total of 1440 kg of quartz sand and 120 kg of deionized water was used. Through physical parameter conversion and experimental measurements, the final pore volume of the model was found to be 629 L, corresponding to a porosity of approximately 0.534, as shown in Table 1. This pore structure meets the requirements for hydrate formation experiments, providing a solid porous-medium foundation for subsequent gas injection and hydrate formation.
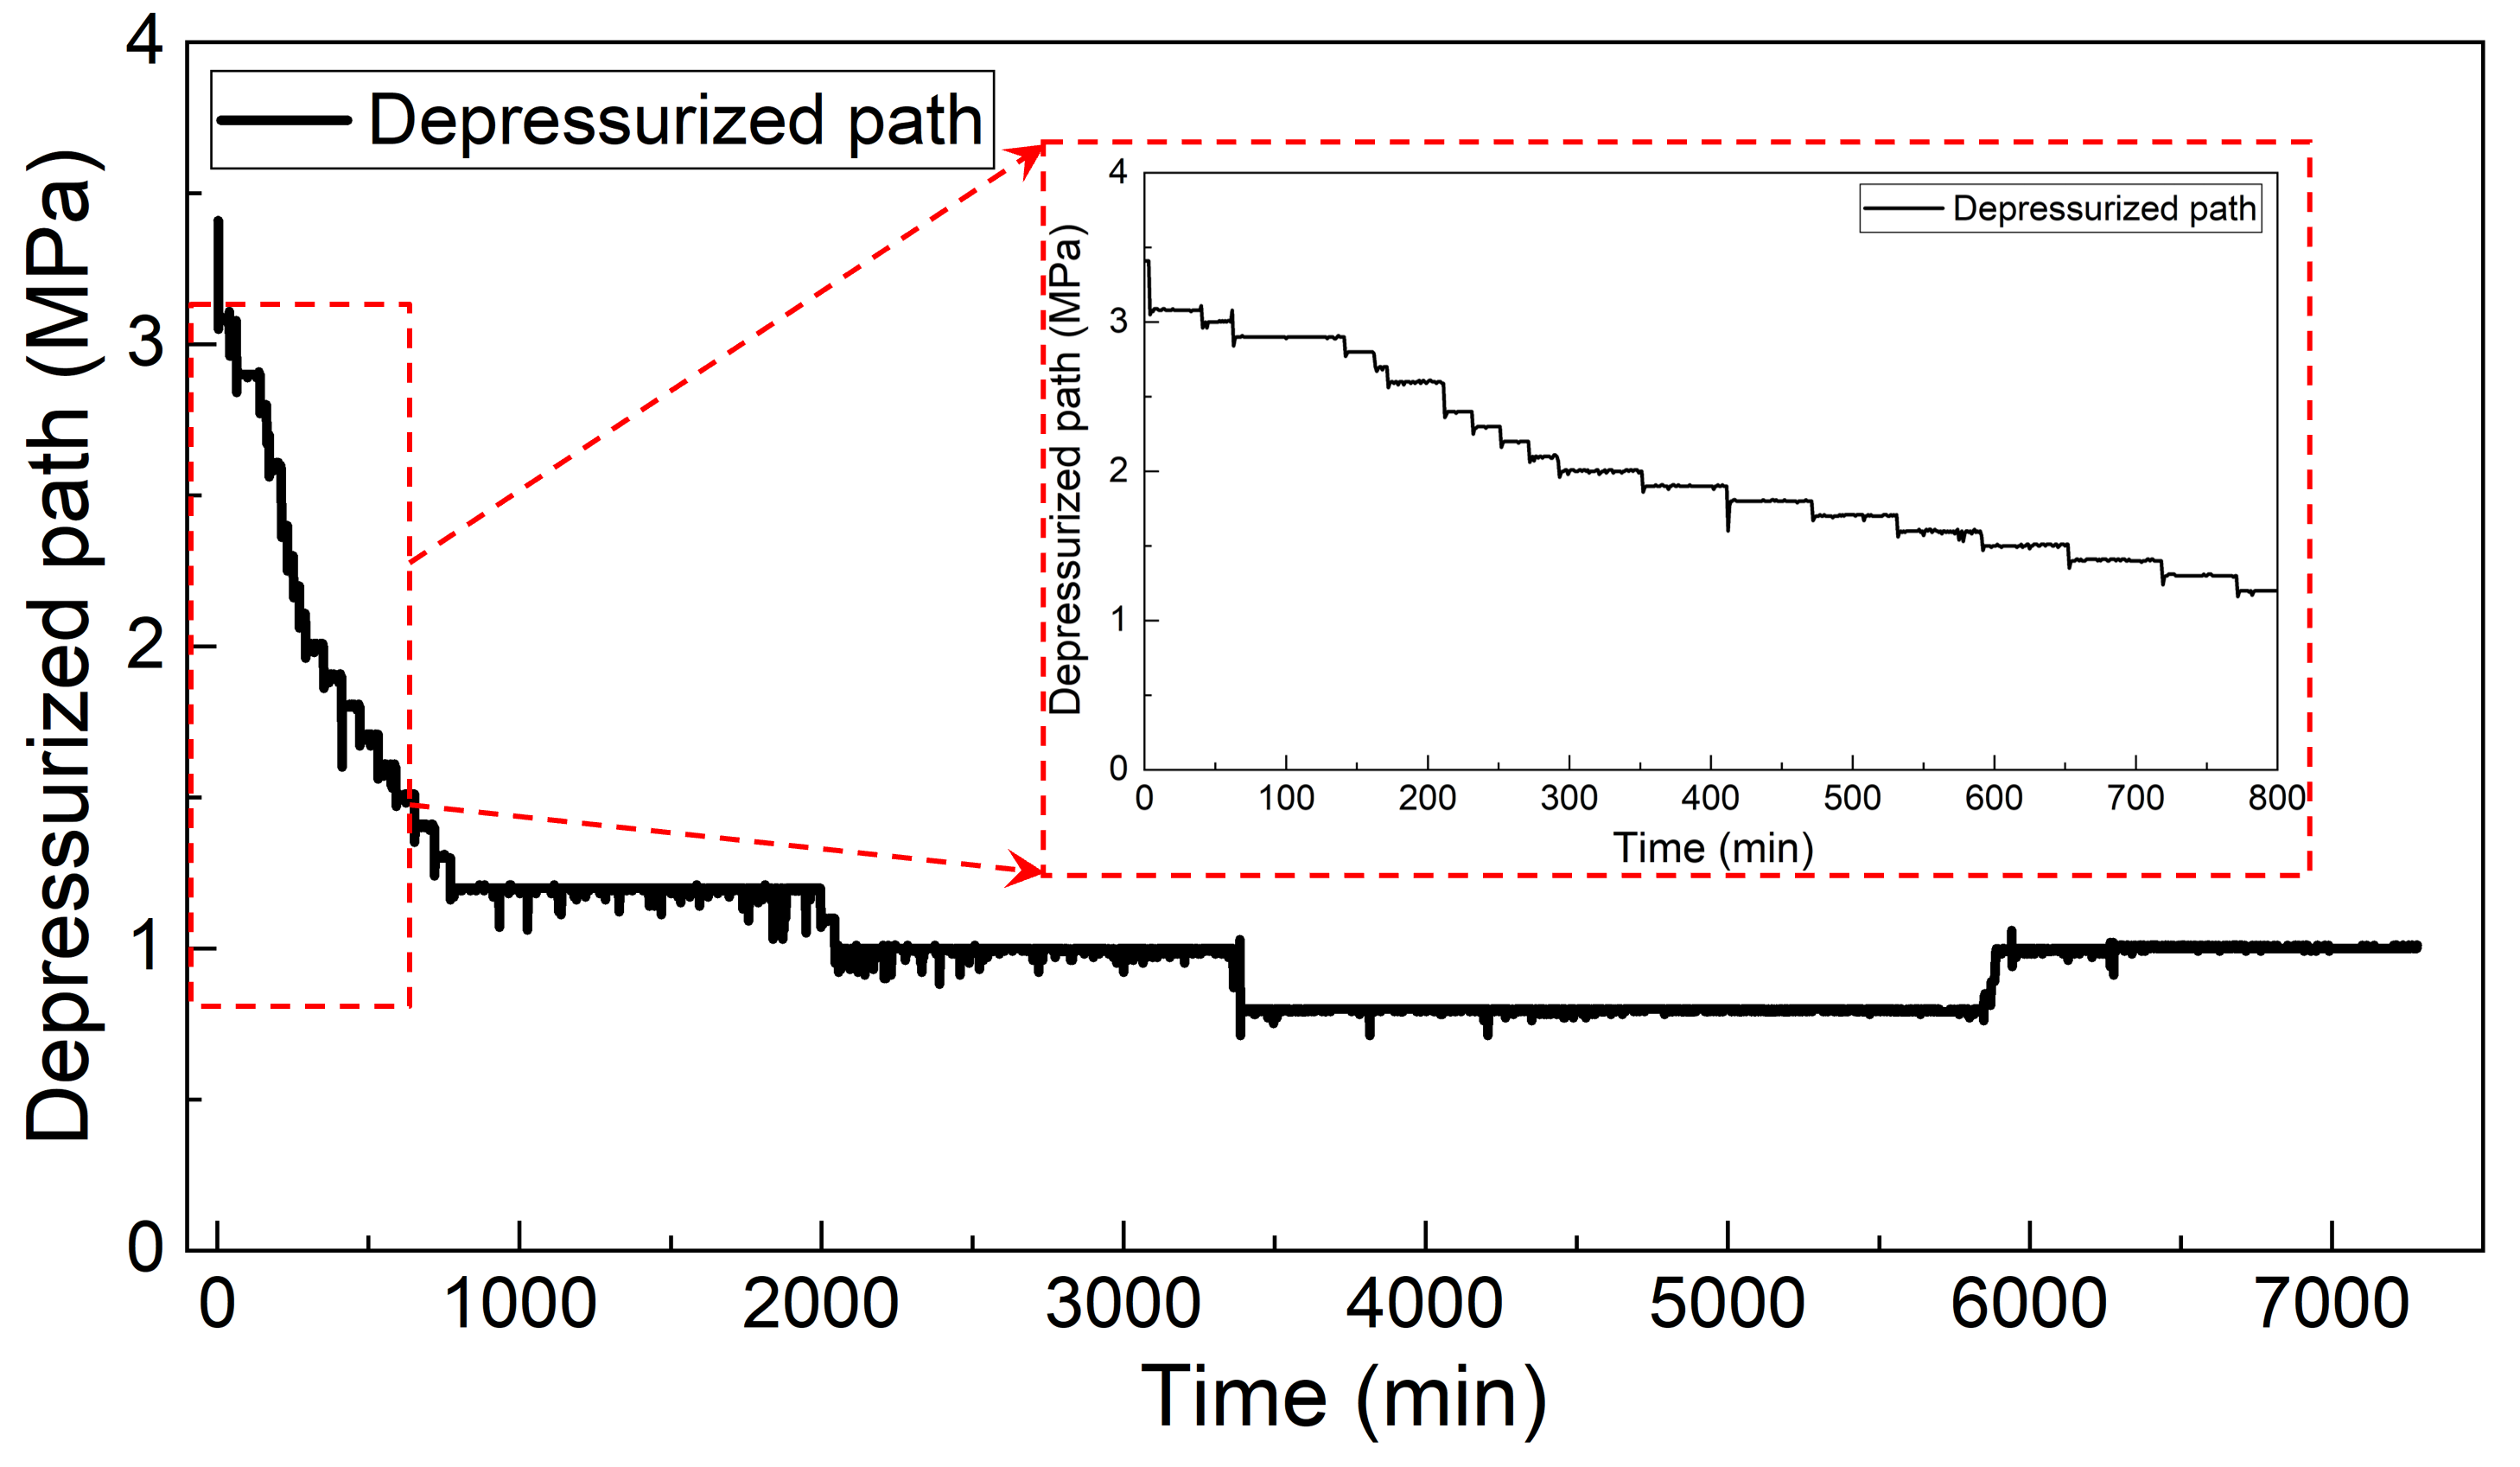
Following the preparation and compaction of the sand sample model, the vessel lid was carefully secured. The overburden loading system was then used to increase the pressure to 5 MPa, in a range suitable for CO2 hydrate formation, thereby creating appropriate in situ stress conditions for subsequent hydrate synthesis. The refrigeration system of the cold storage was first activated to gradually lower the model’s internal temperature, with real-time monitoring of temperature changes until the internal temperature reached 3 °C, and it remained stable throughout the experiment. After cooling, a vacuum was applied to remove air from the model, followed by CO2 injection to raise the pressure inside the vessel to 3.5 MPa and maintain stability. When the model’s temperature–pressure conditions exceeded the hydrate phase equilibrium boundary, gaseous CO2 and liquid water began to react to form solid-phase hydrate. This released heat, causing the internal pressure to drop rapidly and the temperature to rise slightly. To ensure that the hydrate in the model skeleton reached the desired saturation level, a secondary CO2 injection was performed, raising the vessel pressure again to 3.5 MPa. With increased gas injection, the Joule–Thomson effect and the exothermic nature of the hydrate formation process caused the temperature inside the vessel to rise again. The temperature was then stabilized using the temperature control system. After the hydrate preparation was completed, the hydrate saturation of the model was calculated to be approximately 0.248, based on the amount of CO2 gas consumed during the process [58]. Deionized water was injected to displace the remaining CO2 and increase pressure inside the reactor to 3.5 MPa. Once the temperature stabilized, the pressure was gradually reduced from 3 MPa to 1.0 MPa at a rate of 0.1 MPa per step. After each pressure reduction, the system was allowed to stabilize before proceeding to the next stage of depressurization. The system was considered stabilized when the pressure variation at all monitoring points remained within 0.01 Mpa for at least 180 min, after which the next depressurization step was initiated. This process continued until complete dissociation of the hydrate was achieved. The depressurization path is illustrated in Figure 6.

3. Results

This section focuses primarily on the changes in temperature, pressure, and saturation within the experimental model during the depressurization of gas hydrates. Through systematic analysis, the staged variations in gas production under different depressurization conditions and their impact on total gas recovery are examined. Furthermore, the changes in overburden pressure and model deformation during the experiment are analyzed in detail to assess their effects on experimental stability, gas release behavior, and overall extraction performance.

3.1. Temperature–Pressure Path and Characteristics

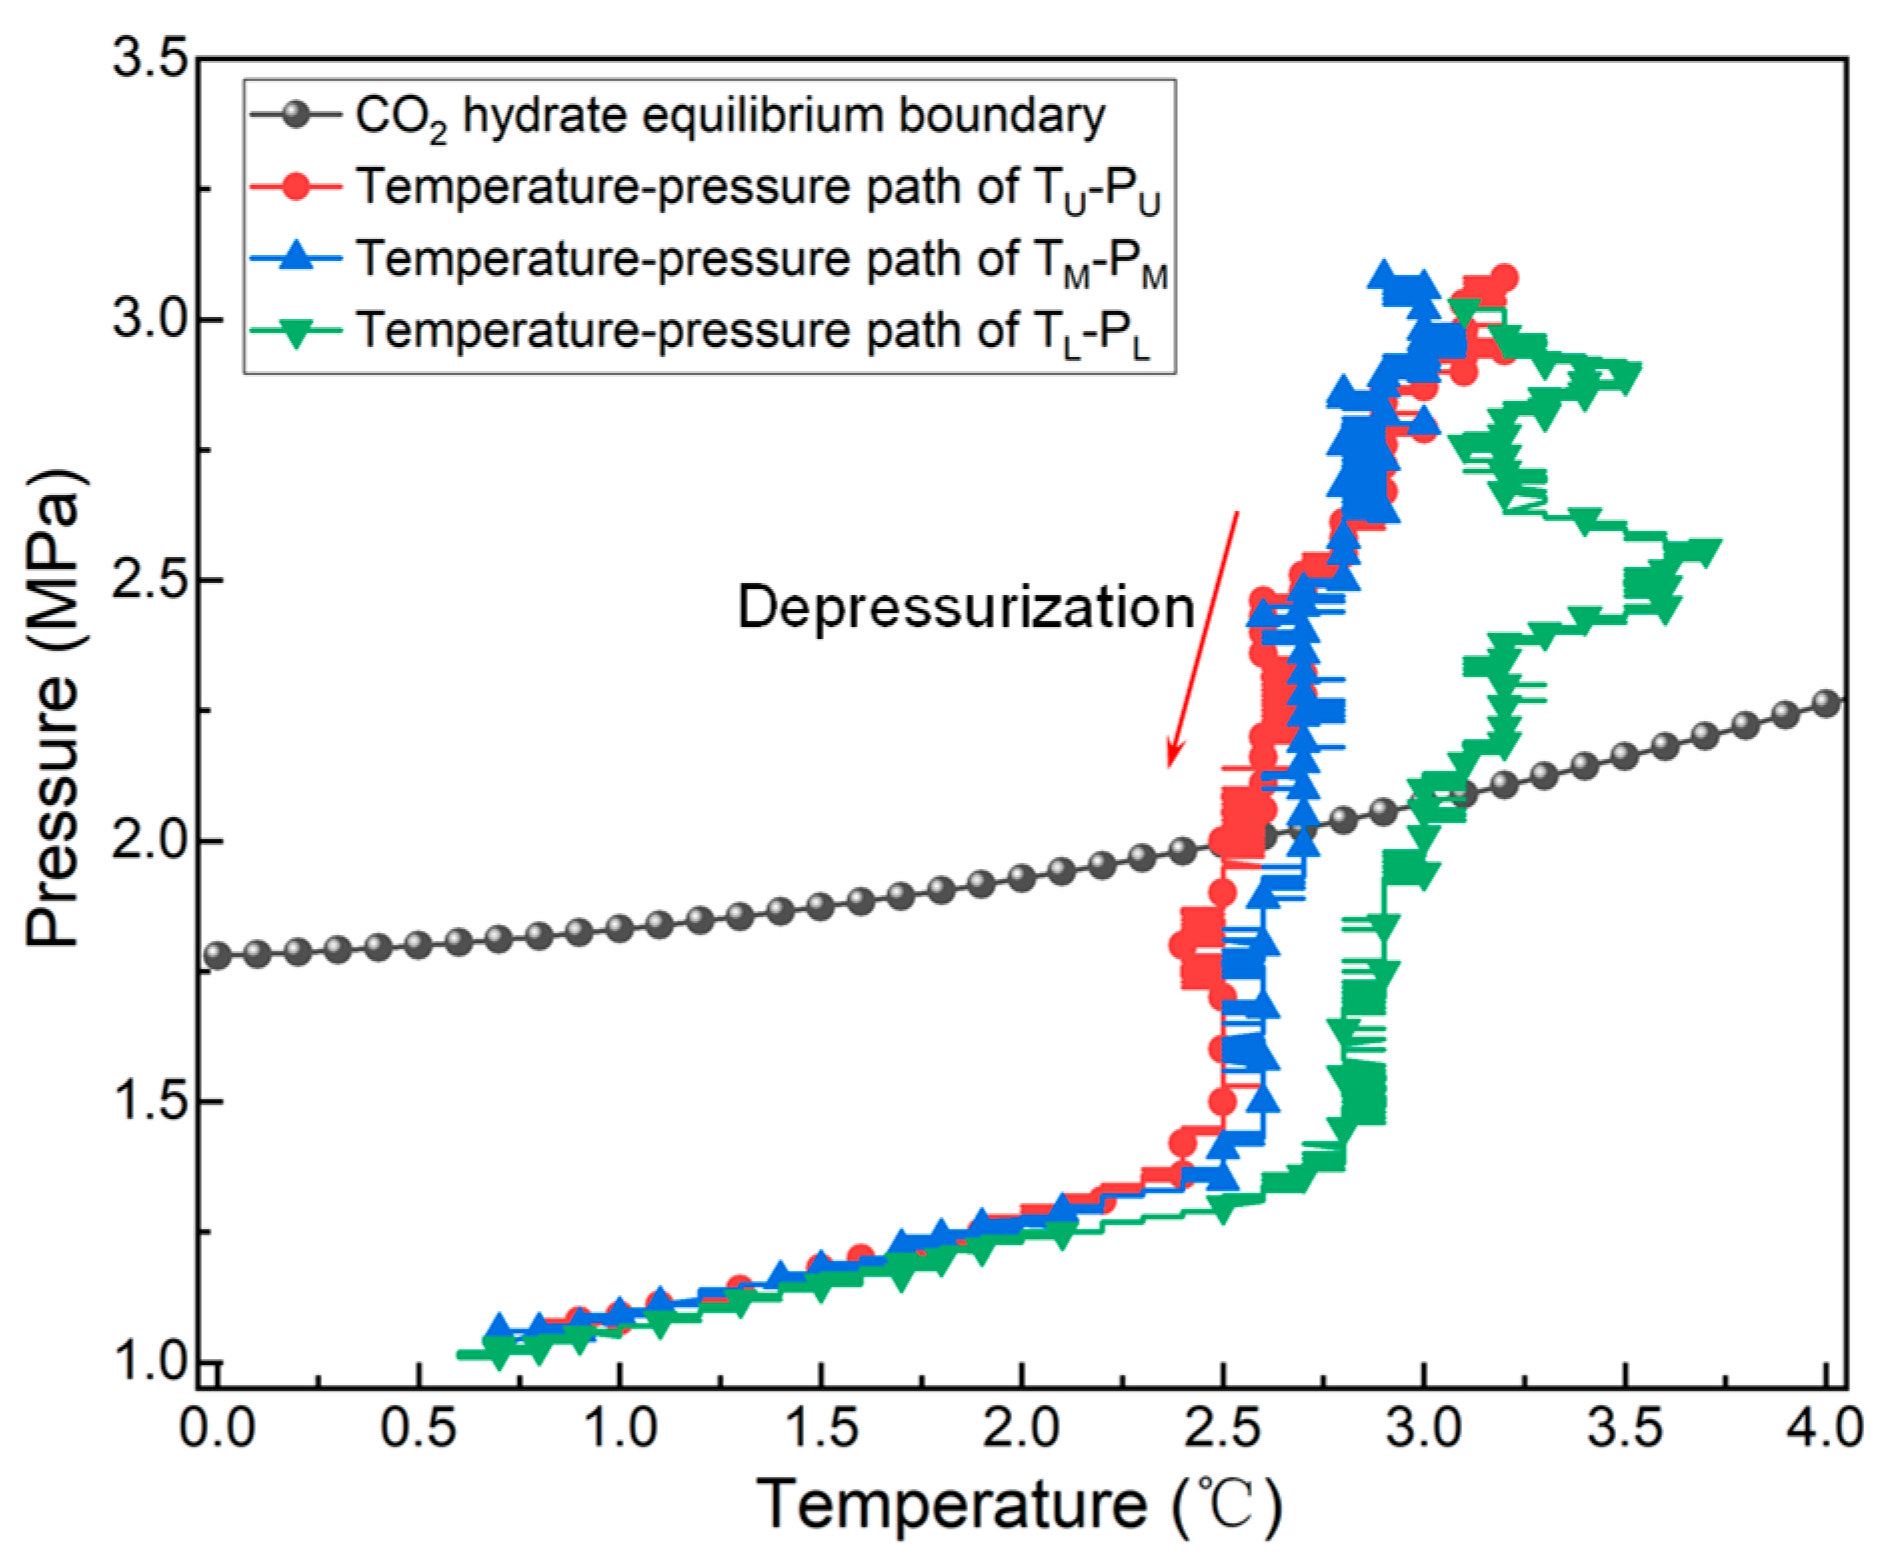
The average temperature and pressure in various layers were used to plot the temperature–pressure path curves for each layer during the depressurization dissociation of gas hydrates, as shown in Figure 7. The temperature–pressure paths in various layers exhibit significant consistency, indicating that the changes in temperature and pressure during the depressurization process follow a predictable pattern. As depressurization progresses, the temperature–pressure curves for each layer gradually approach the hydrate’s phase equilibrium curve. Once the temperature and pressure surpass this boundary, the hydrate begins to dissociate.
In the early stages of hydrate dissociation, as the pressure decreases gradually, a noticeable endothermic effect is observed within the system, leading to a continuous decrease in the model’s internal temperature. As the depressurization process continues, the hydrate gradually dissociates with gas continually released from the solid hydrate, causing the dissociation zone to expand progressively. The expansion of the dissociation zone causes the system to absorb more heat, thereby exacerbating the temperature decrease. As the dissociation zone continues to grow, the trend of temperature decrease becomes more pronounced, and the system’s thermo-dynamic state undergoes significant changes. Throughout this process, the phase change behavior of the hydrate has a profound impact on the thermodynamic evolution of the system, revealing the complex coupling relationship between the hydrate dissociation and the thermodynamic behavior of the system.
Based on the analysis of the temperature–pressure path, the time at which the phase equilibrium threshold is reached differs among the upper, middle, and lower layers due to temperature variations. Specifically, the upper layer reaches this threshold at around 2500 min, the middle layer at 2200 min, and the lower layer at 980 min. This difference is primarily because the lower layer, which is farther from the gas extraction point, experiences lower pressure and is more sensitive to temperature–pressure changes, leading to the dissociation of the hydrate in the lower layer first.
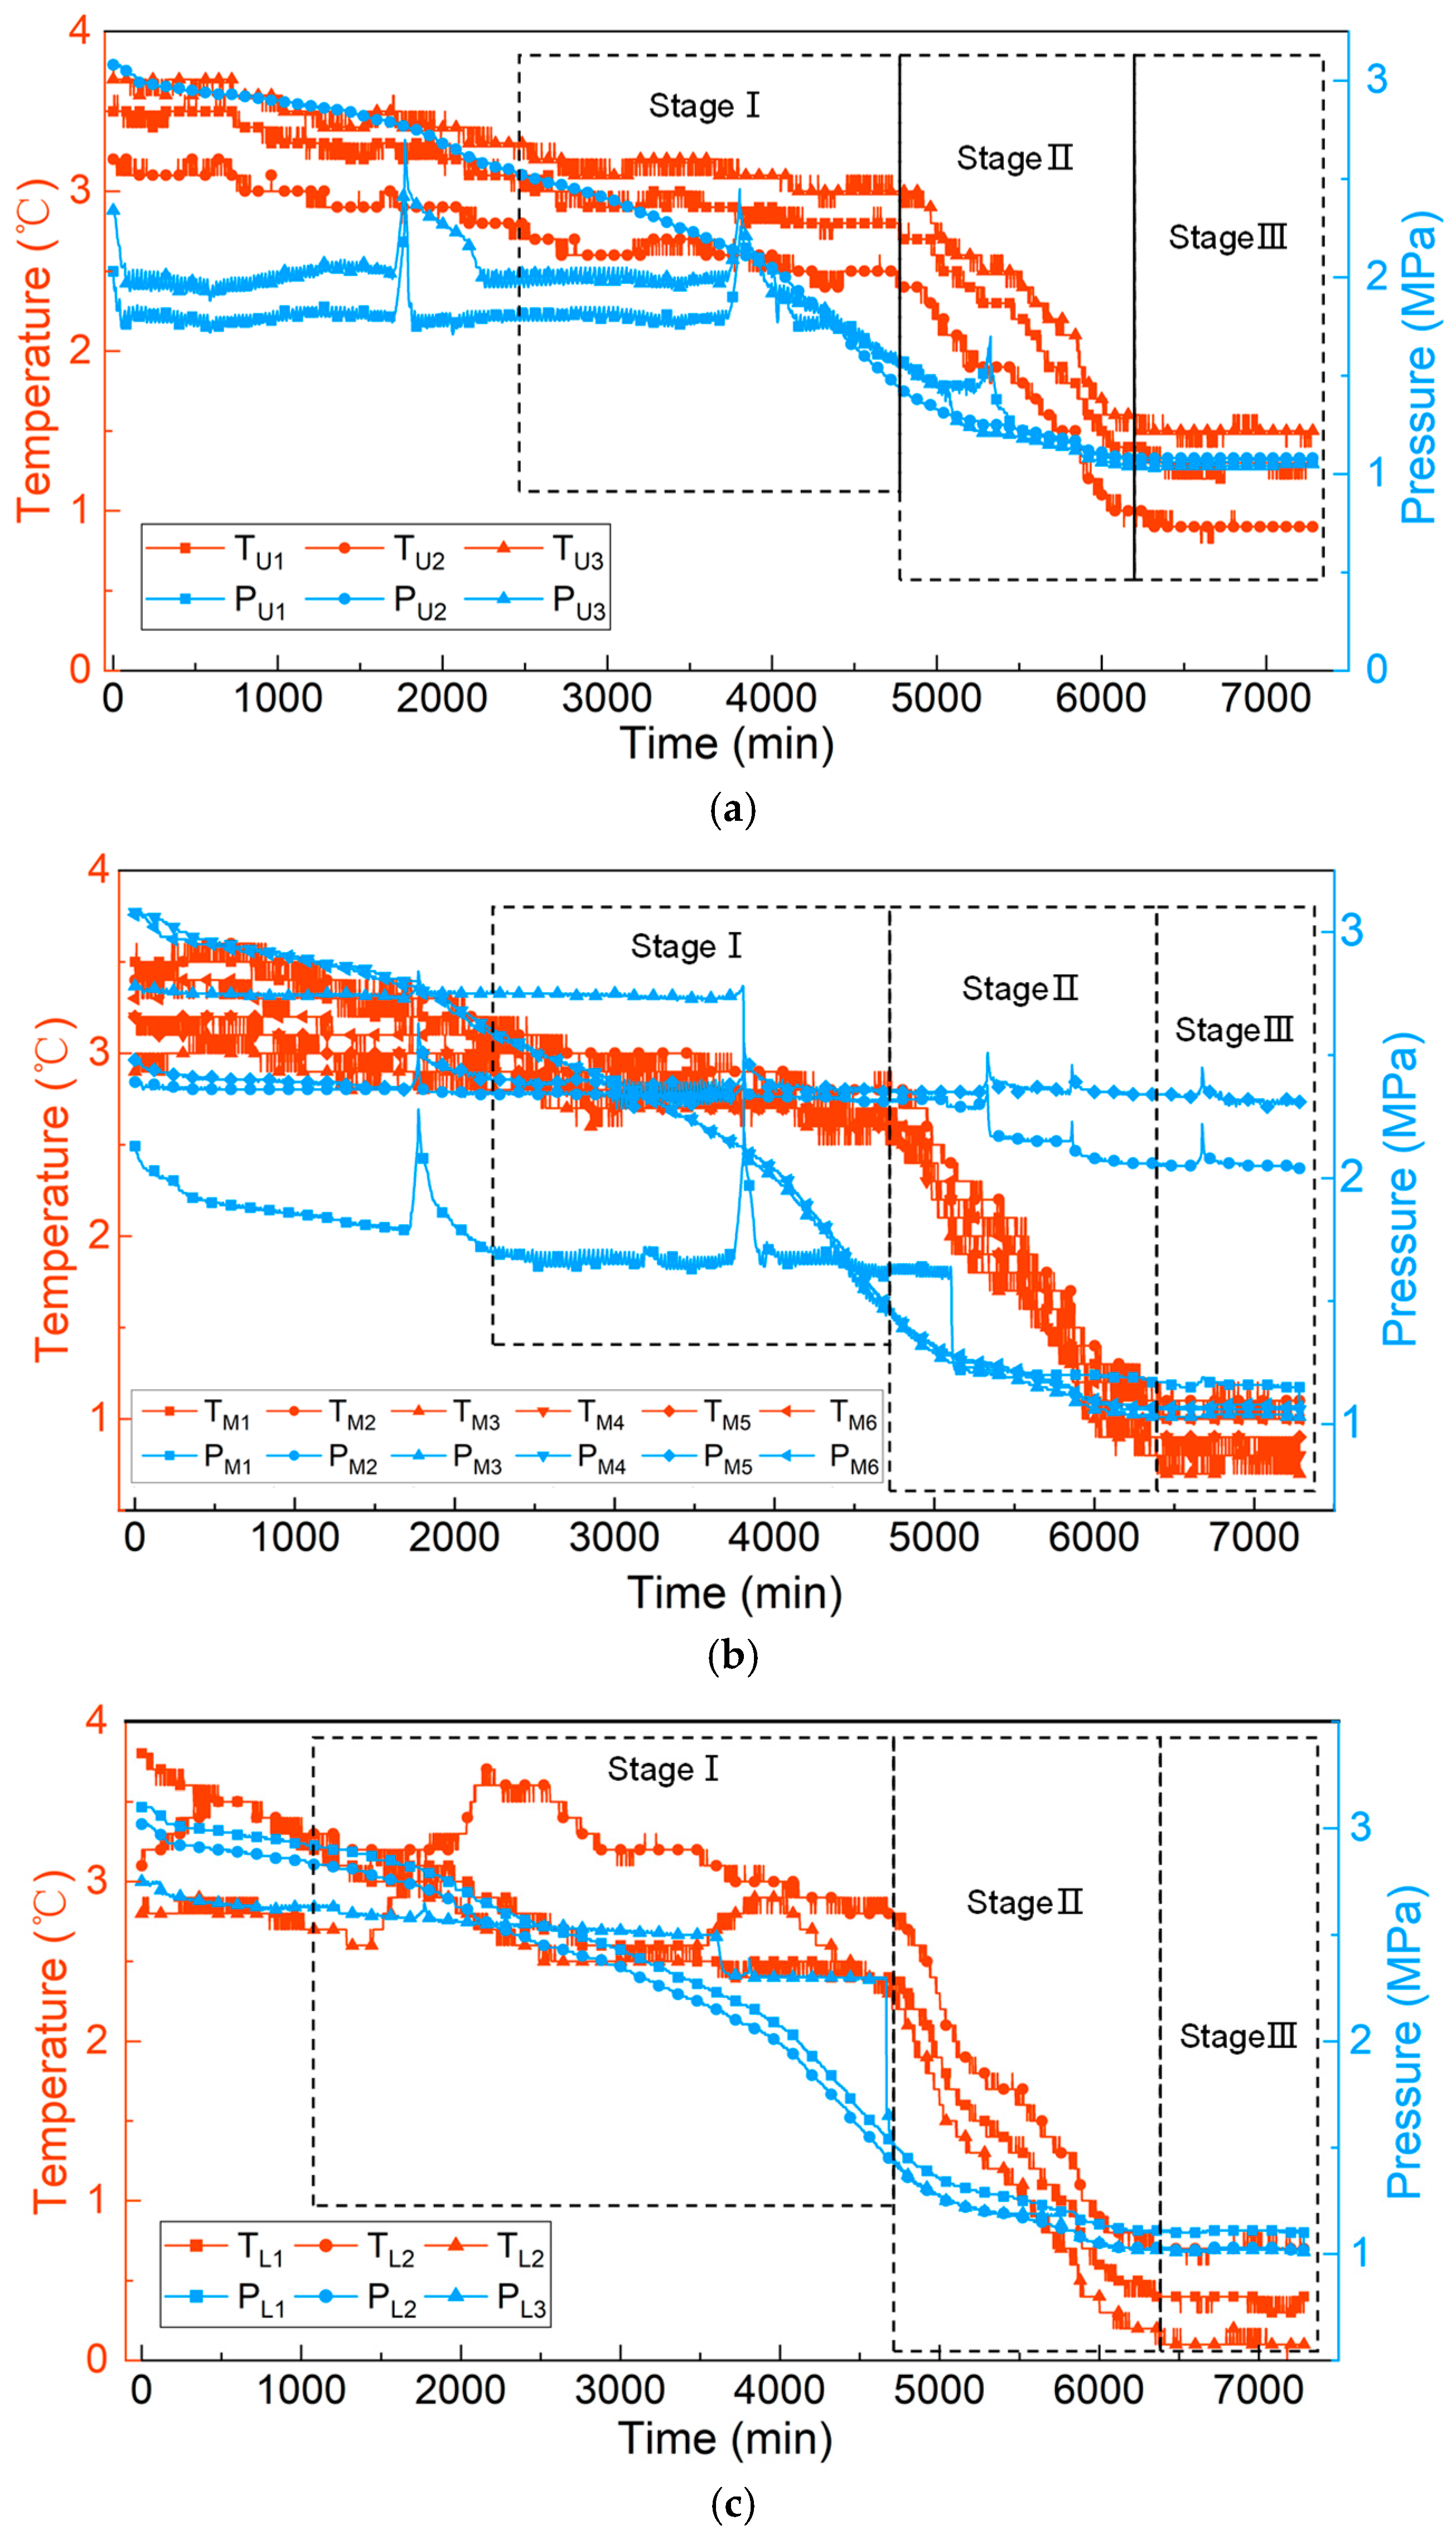
To further investigate the changes during the depressurization dissociation process, the temperature and pressure time curves for different layers are presented separately, as shown in Figure 8. It can be observed that the temperature changes during depressurization dissociation are broadly divided into three stages: a slow decrease, a rapid decrease, and a stable stage. Once the hydrate surpasses the phase equilibrium conditions, dissociation begins, and the temperature decreases slowly. Due to the heat absorption from dis-sociation, the rate of temperature decrease gradually accelerates. As the dissociation zone expands, the temperature begins to drop rapidly. After the complete dissociation of the hydrate, the temperature stabilizes.
In contrast to the temperature, changes in pressure are more complex. The pressure variation is not only directly controlled by the depressurization process, but it is also influenced by indirect factors such as dissociation rate, secondary hydrate formation, and interlayer seepage, which complicate pressure control and regulation. Taking the lower layer as an example, hydrate dissociation causes the pore pressure to decrease. At the PL3 point, a sharp drop in pore pressure is observed, indicating that the presence of hydrate blocks the flow pathways. After the dissociation of the hydrate, the pore pressure experiences a sharp drop, and the gas is driven upward due to the pressure gradient. When the gas reaches the sensor position in the middle layer, a short pressure peak is detected in both the middle and upper layers.
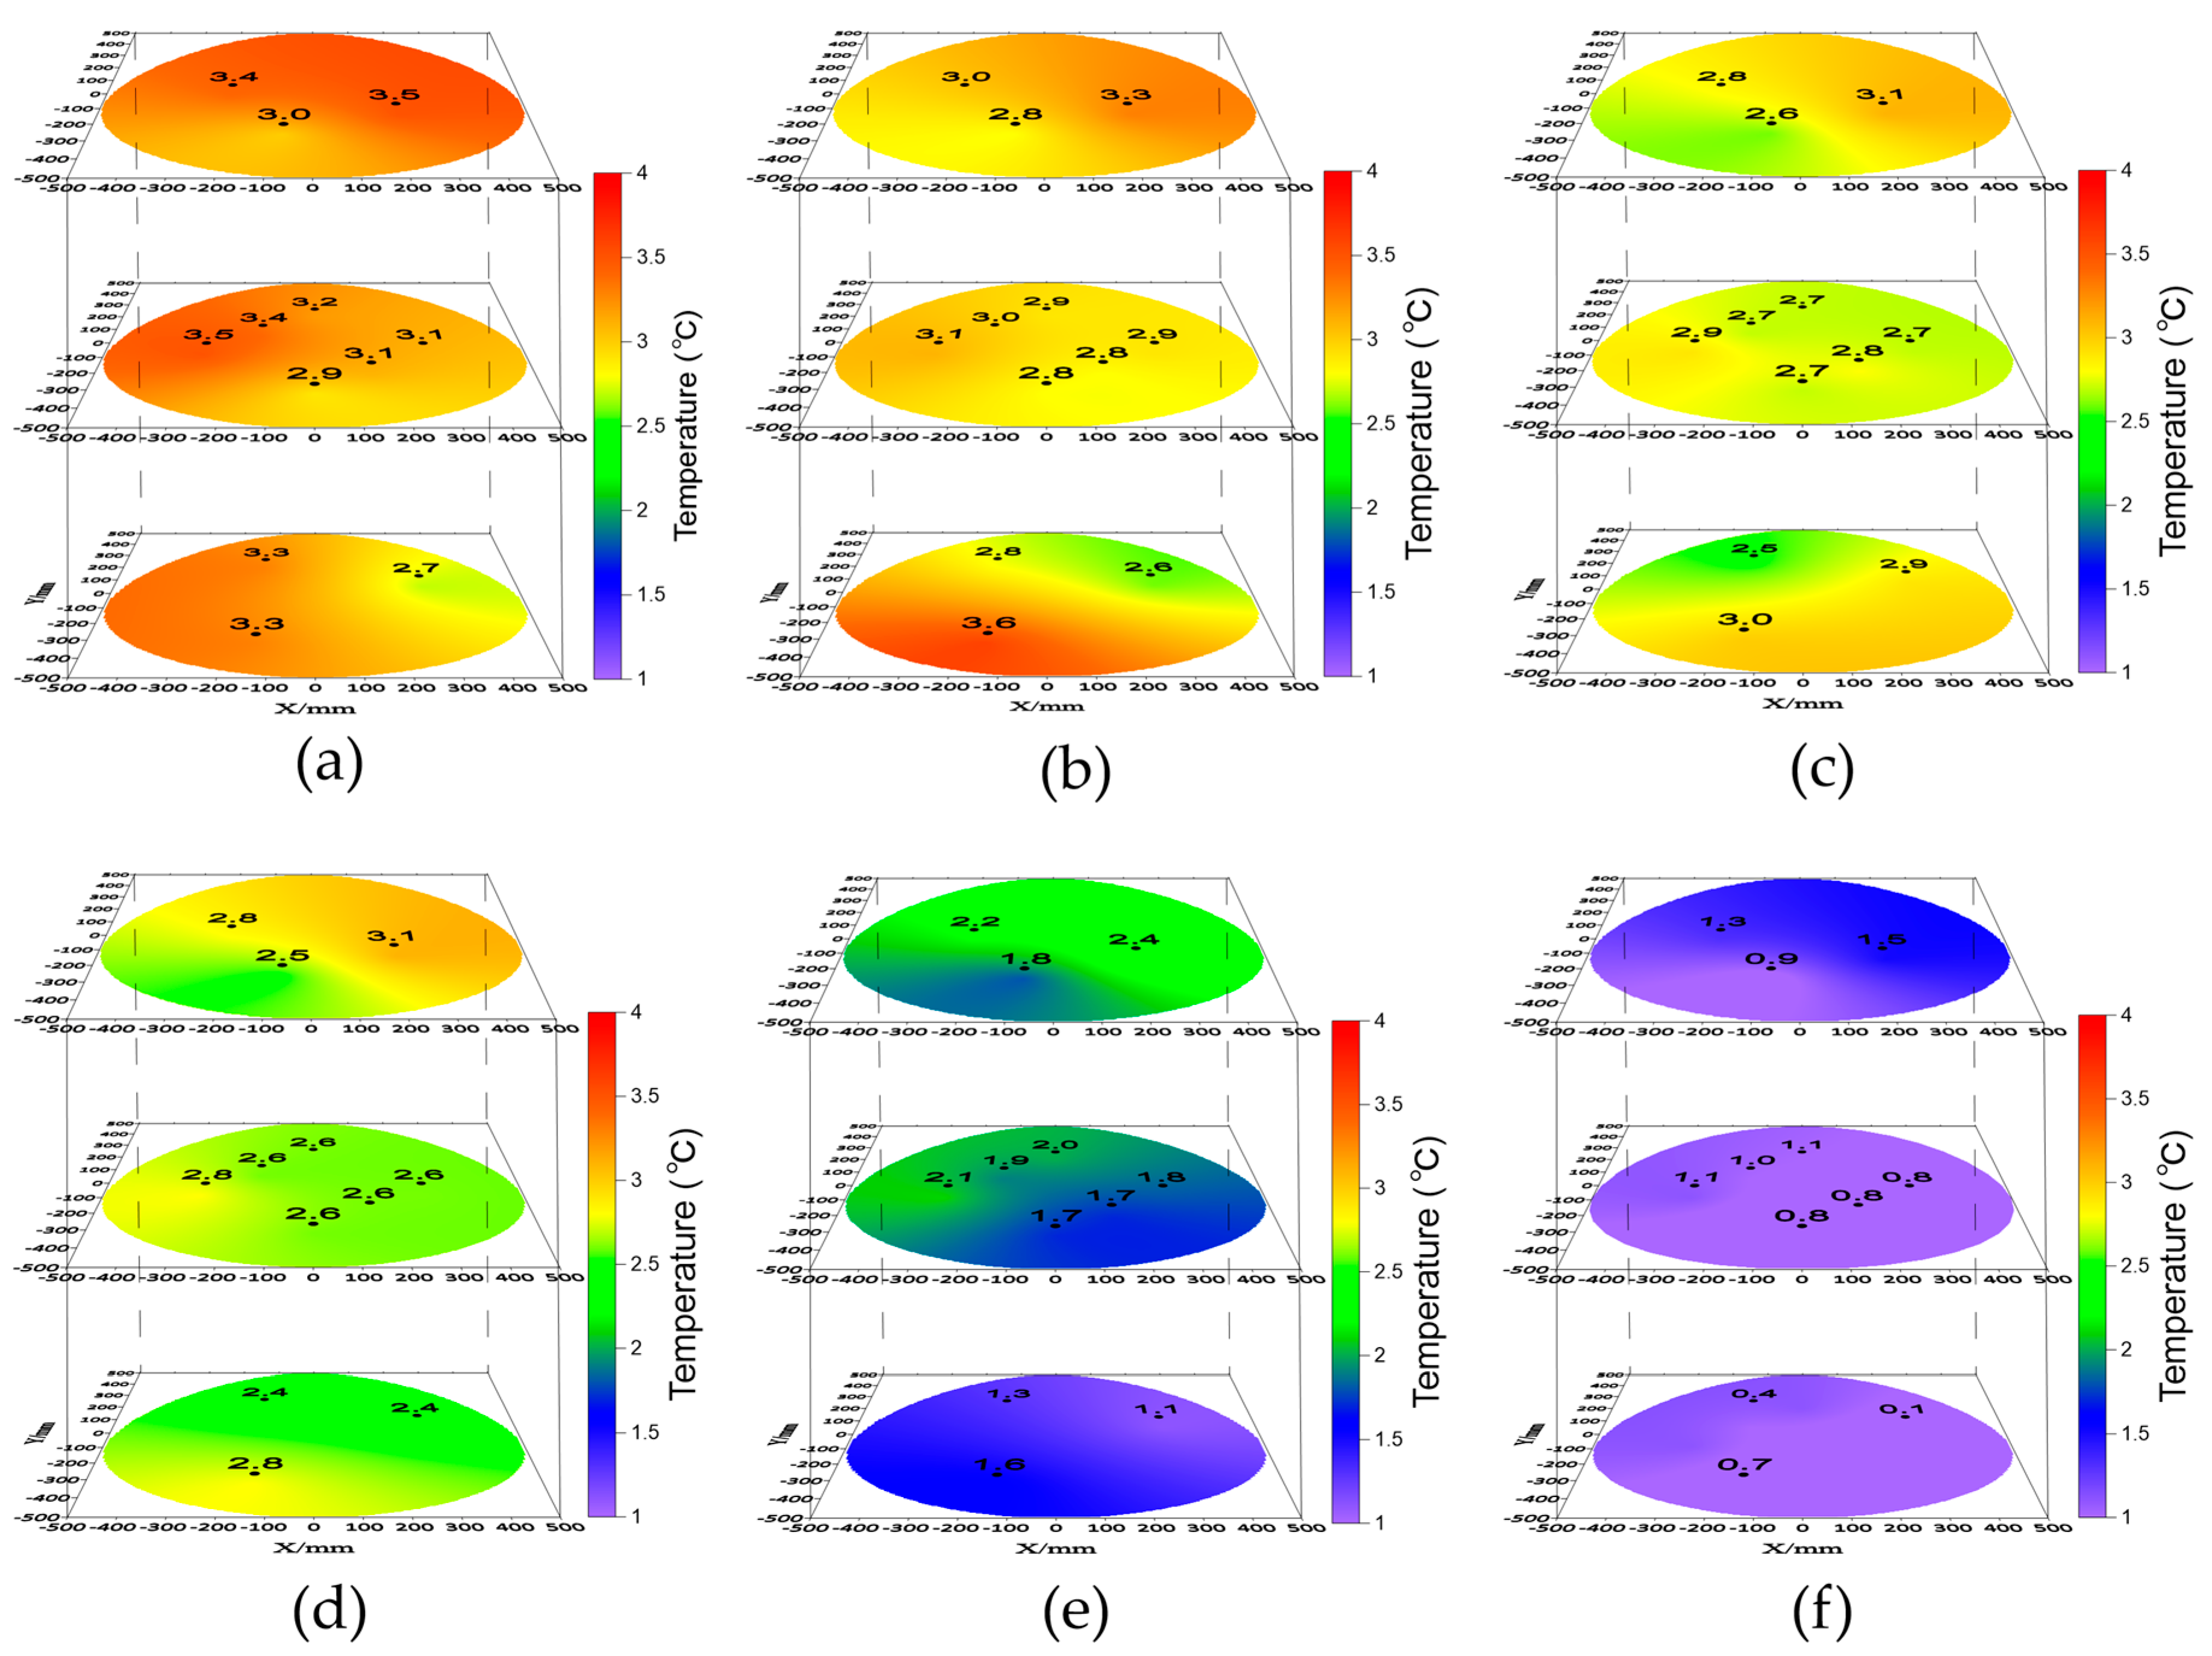
The spatiotemporal distributions of temperature during hydrate dissociation were examined using contour plots generated at discrete time points (Figure 9). The analysis focuses on several key time points during the depressurization process: t = 1000 min, t = 2500 min, t = 4000 min, t = 4500 min, t = 5500 min, and t = 7000 min. As shown in Figure 9, at t = 1000 min, dissociation begins in the lower layer, forming a relatively low-temperature region due to the heat absorption from hydrate dissociation. At t = 2500 min, the dissociation zone expands, particularly in the lower-left corner of Figure 9b. Where dissociation starts in the middle and upper layers, the overall temperature of the model begins to decrease. By t = 4500 min, widespread dissociation occurs within the model, absorbing more heat and causing the temperature to drop rapidly. At t = 5500 min, during the rapid depressurization stage, the lower- and middle-layer hydrates are almost completely dissociated. By t = 7000 min, the hydrate is fully dissociated, and the model temperature reaches approximately 1 °C, which is 3 °C lower than the ambient temperature.
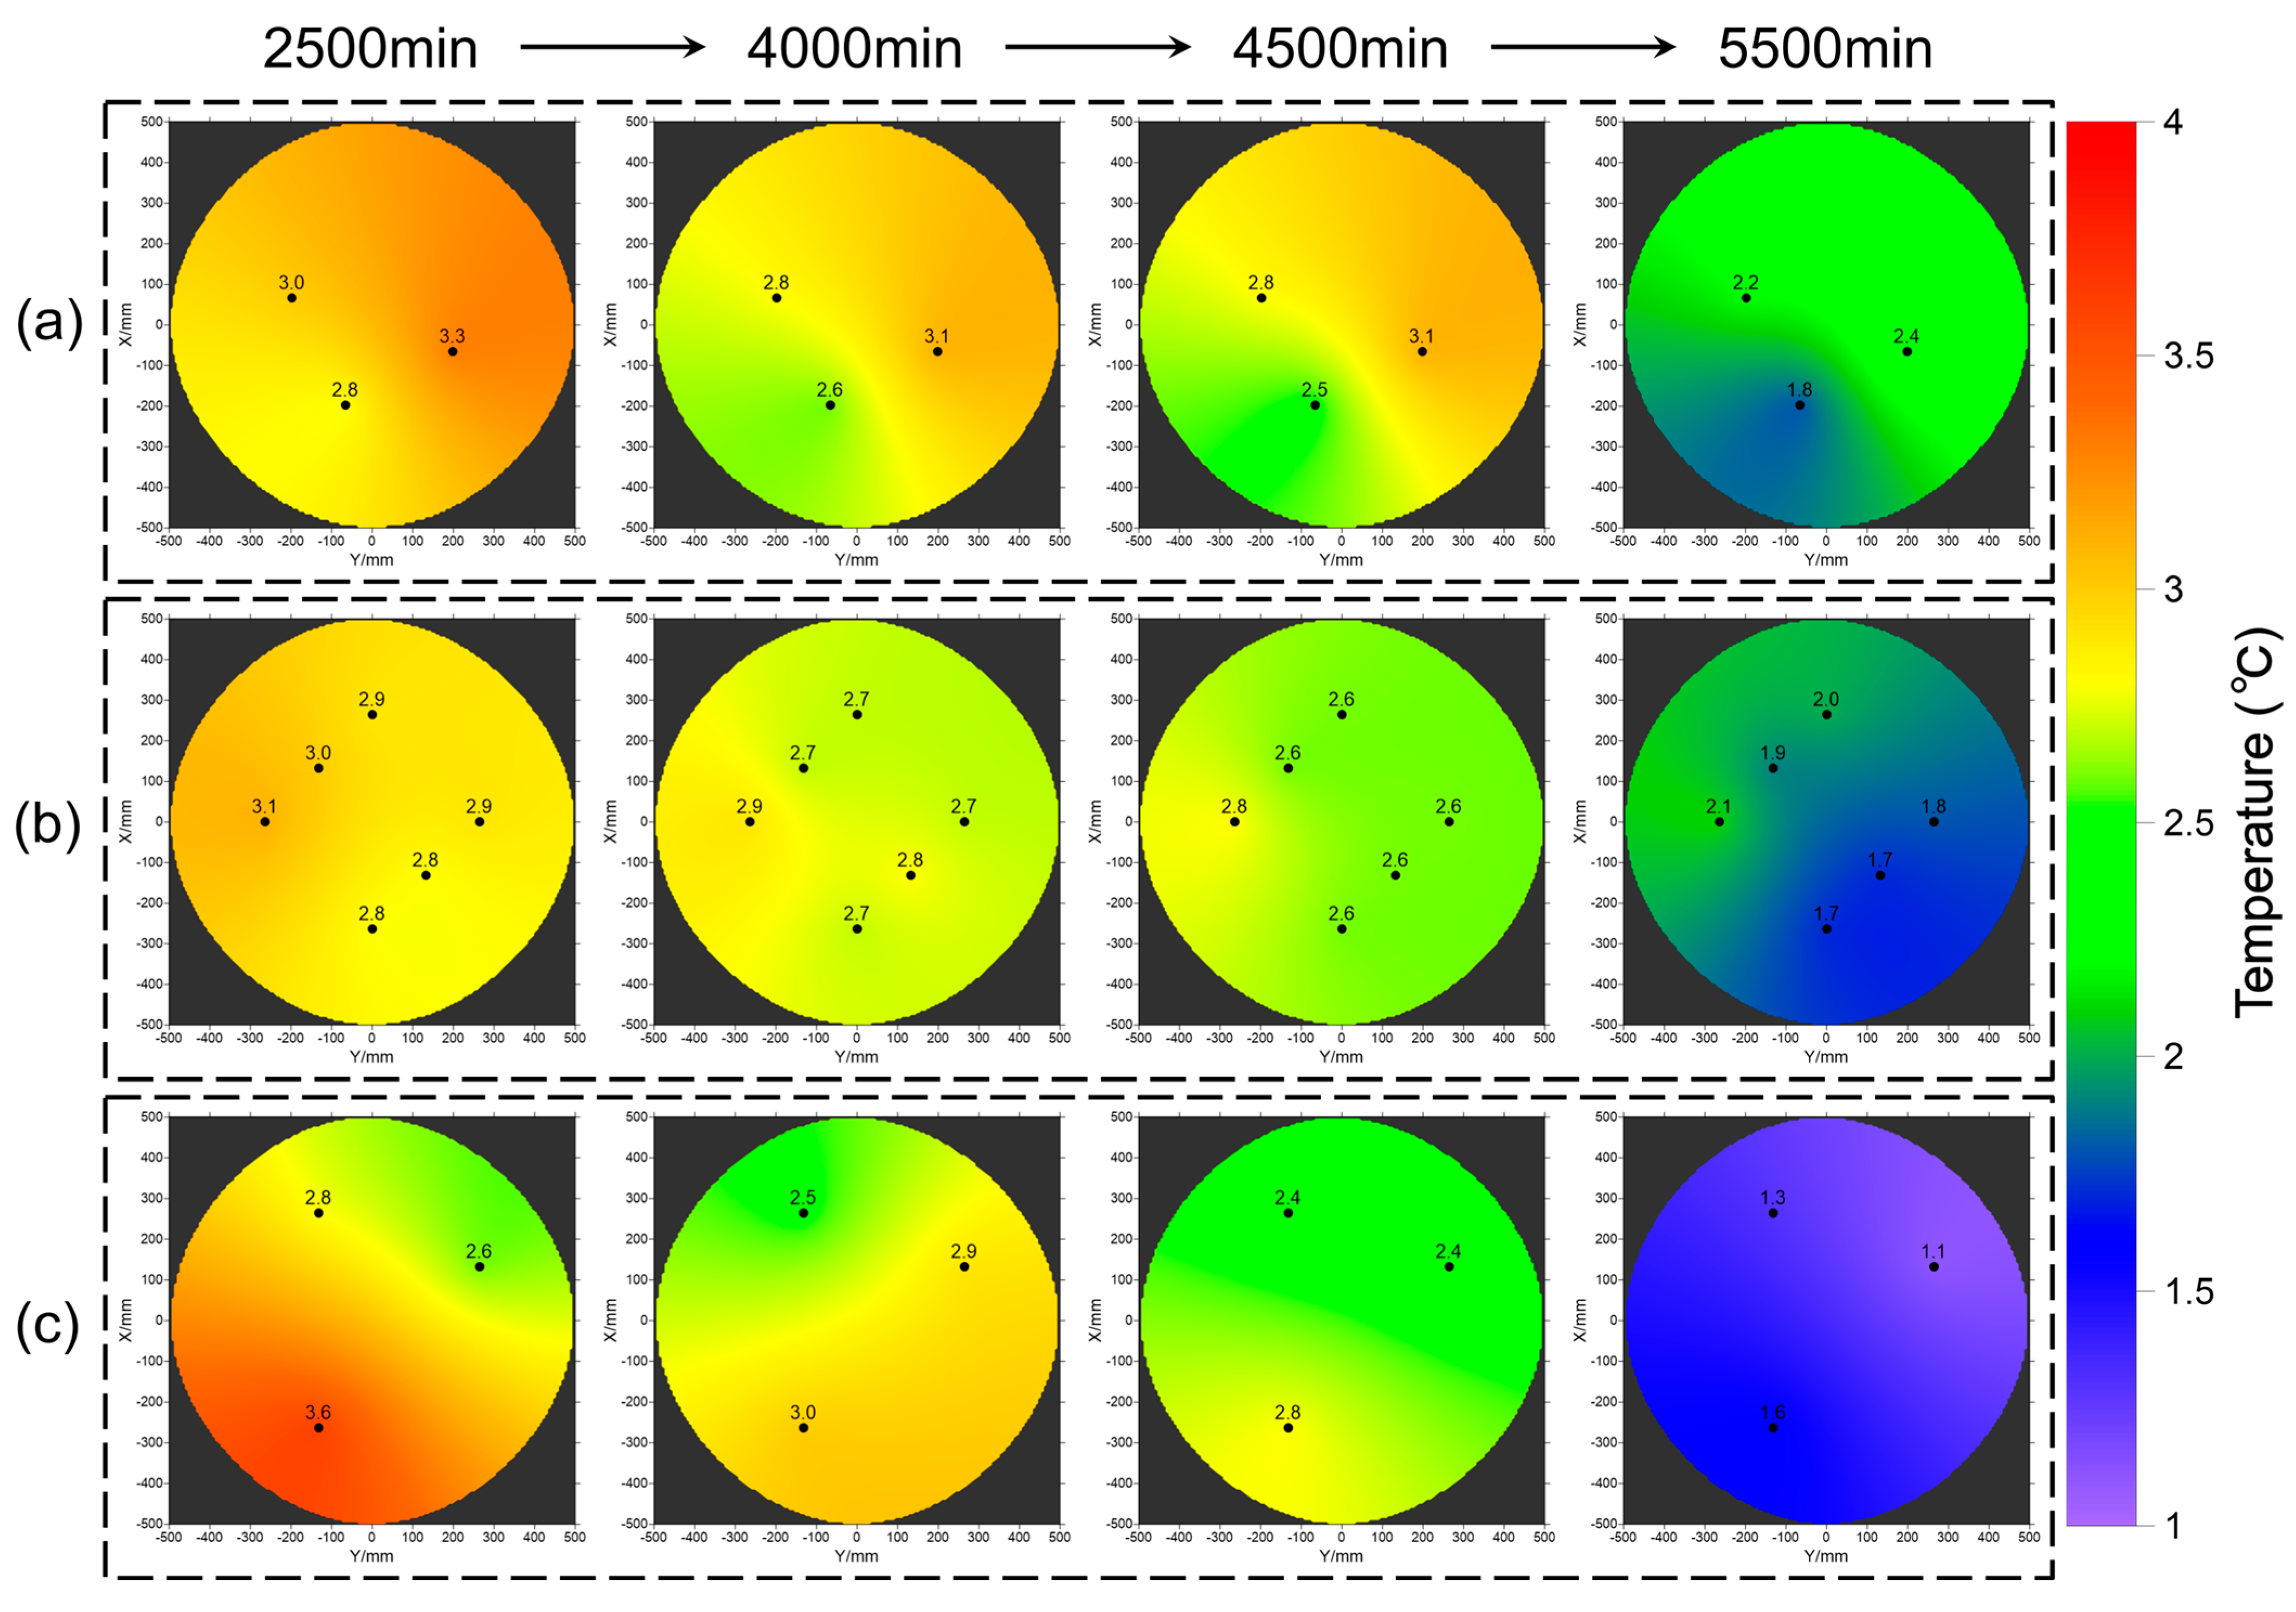
Figure 10 shows the layered temperature distributions for the upper (a), middle (b), and lower (c) layers. Temperature gradually decreases over time for all layers, with the lower layer showing the earliest and most pronounced drop. This indicates that hydrate dissociation initiates from the bottom and propagates upward. The middle and upper layers show delayed temperature decreases, consistent with bottom-to-top heat conduction, confirming that the dissociation front advances progressively through the strata. It should be noted that under natural field conditions, hydrate dissociation may be more complex due to heterogeneous geological and boundary conditions.
Figure 10. Layered nephogram of temperature distribution at different time points: (a) upper layer; (b) middle layer; (c) lower layer.
Processes 14 02509 g010
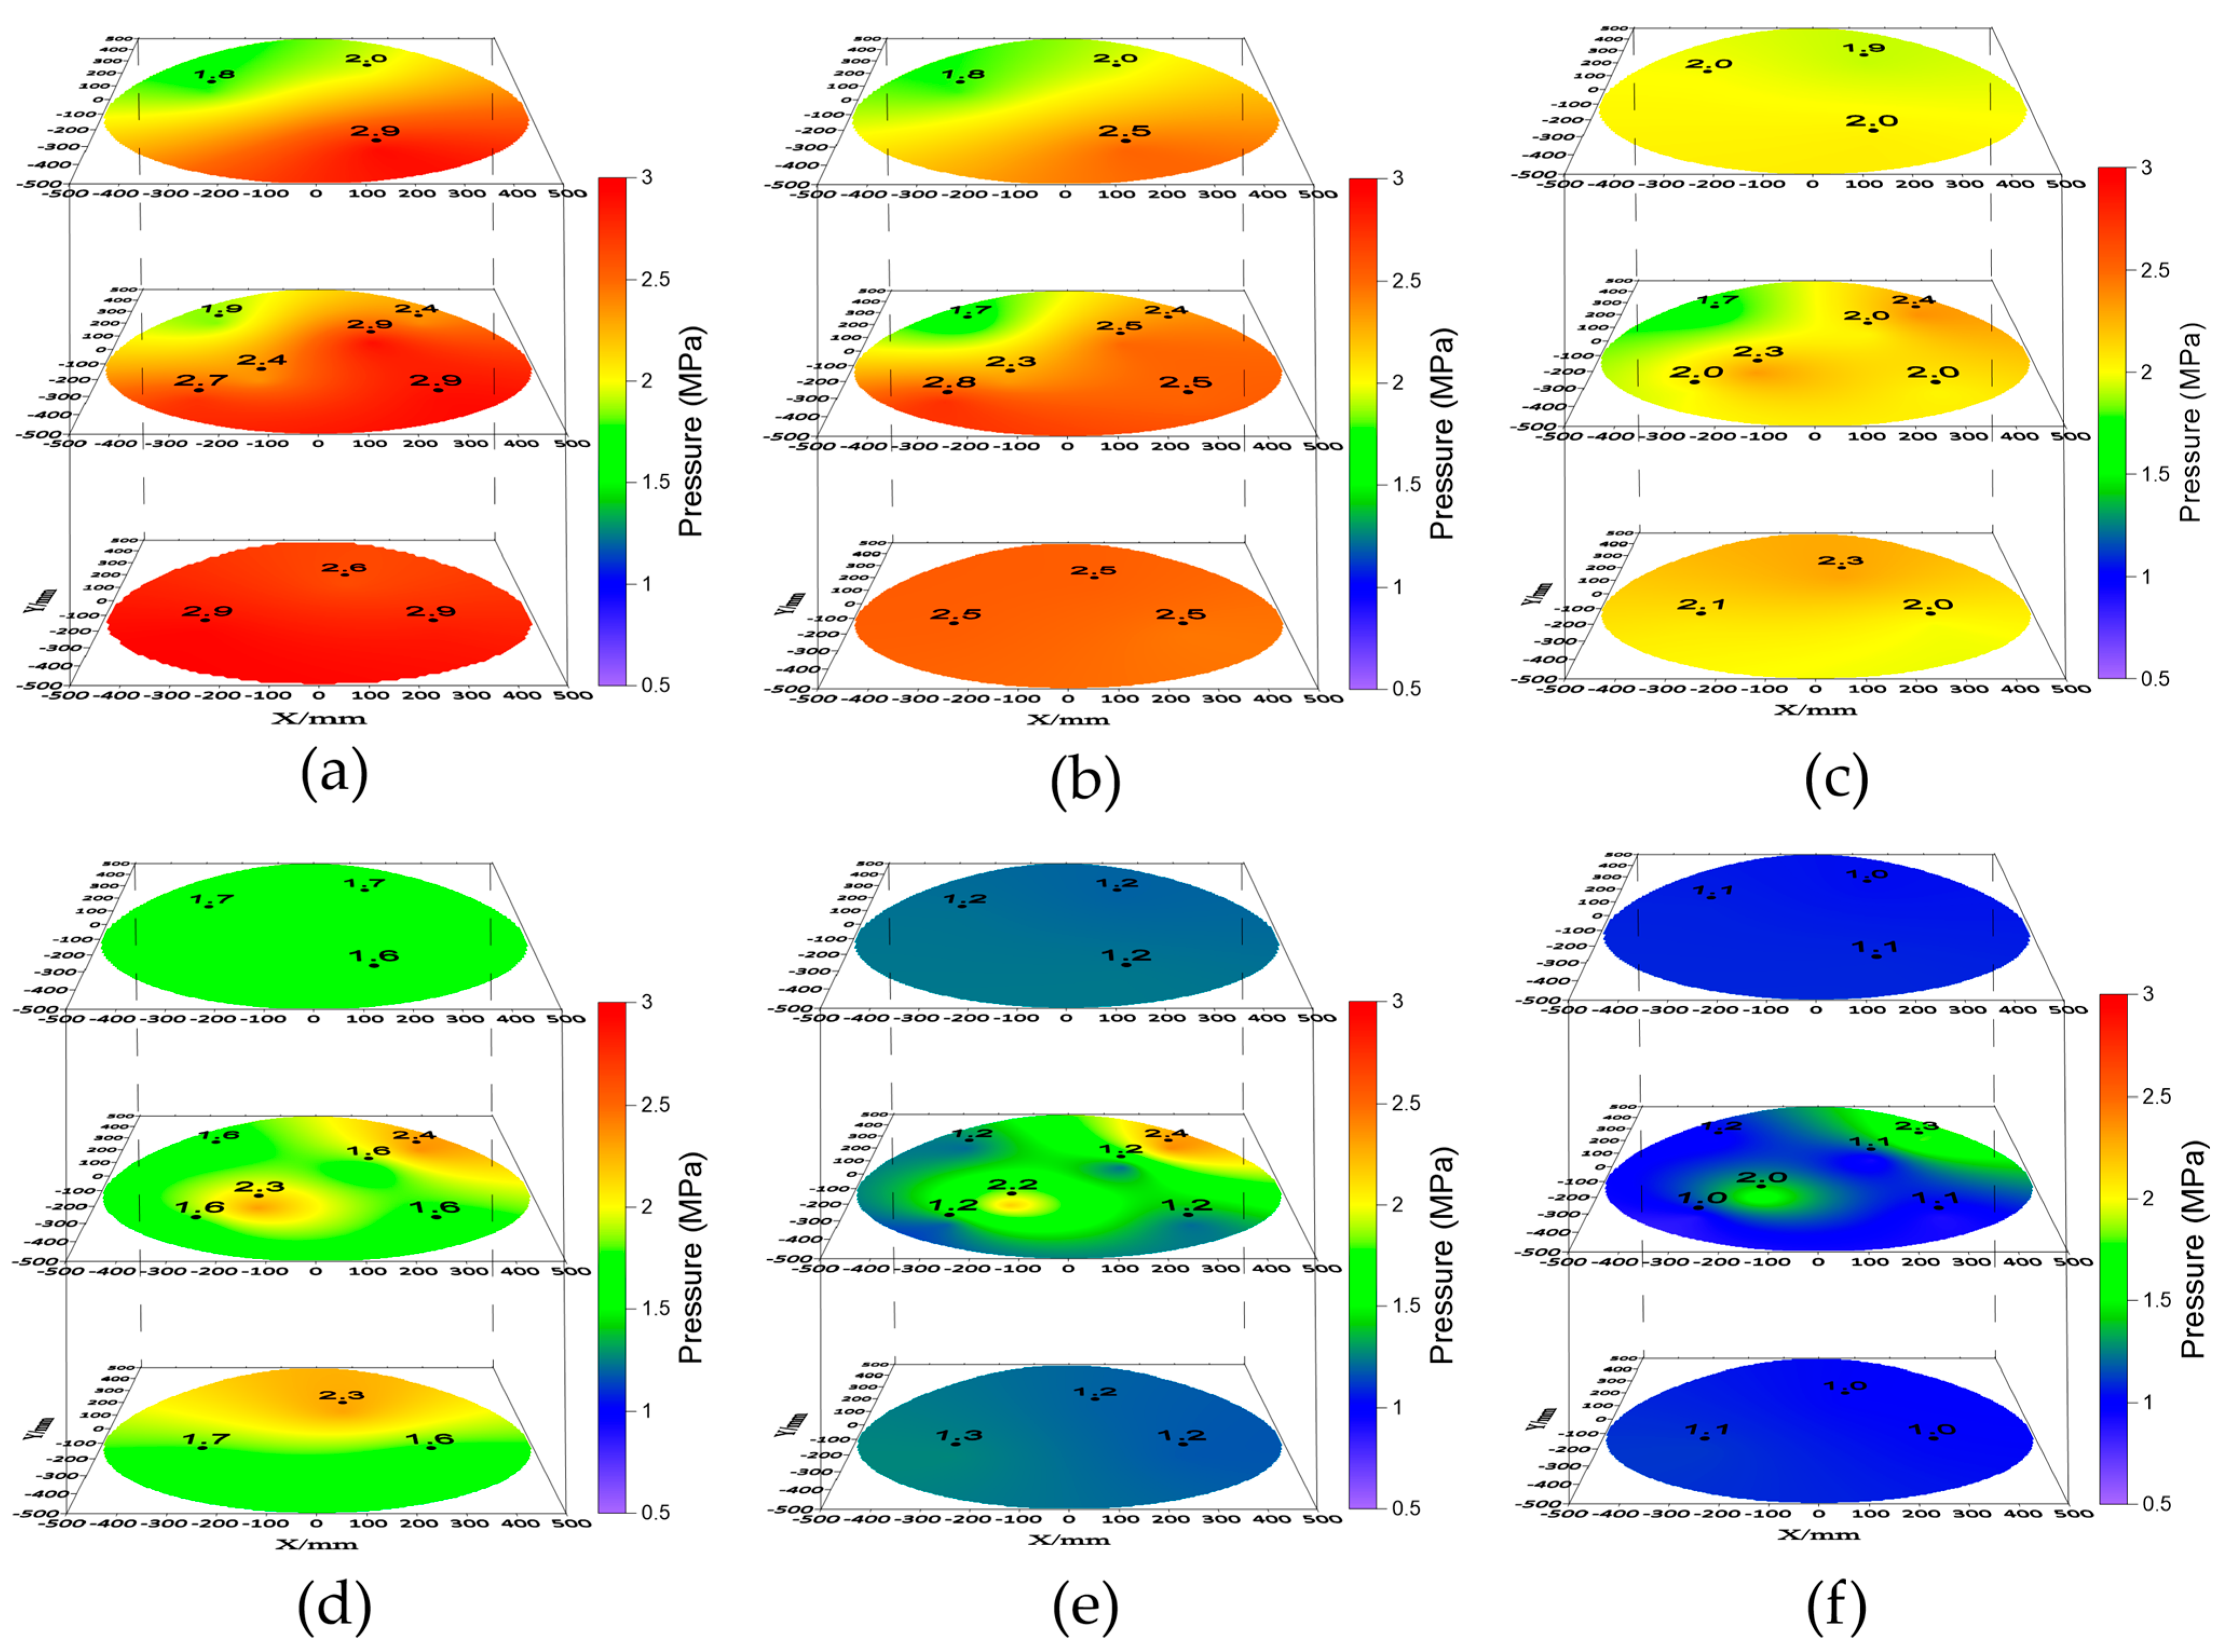
From the pressure contour plots (Figure 11), it is clear that at t = 1000 min, due to the dissociation of hydrates in the lower layer, the pressure starts to decrease. This extends to the pressure in the upper layer near the depressurization outlet. As the experiment progresses, the gas generated from dissociation migrates upward under the influence of the pressure gradient. At t = 2500 min, a local high-pressure zone appears in the middle layer. At t = 4000 min and t = 4500 min, the flow paths are blocked, resulting in localized high pressure. By t = 5500 min, this results in the gas being trapped in the middle layer. At t = 7000 min, when the hydrate is fully dissociated, the pressure within the model drops to the level of the backpressure.
Figure 11. Nephogram showing pore pressure distribution at different time points. (a) t = 1000 min. (b) t = 2500 min. (c) t = 4000 min. (d) t = 4500 min. (e) t = 5500 min. (f) t = 7000 min.
Processes 14 02509 g011
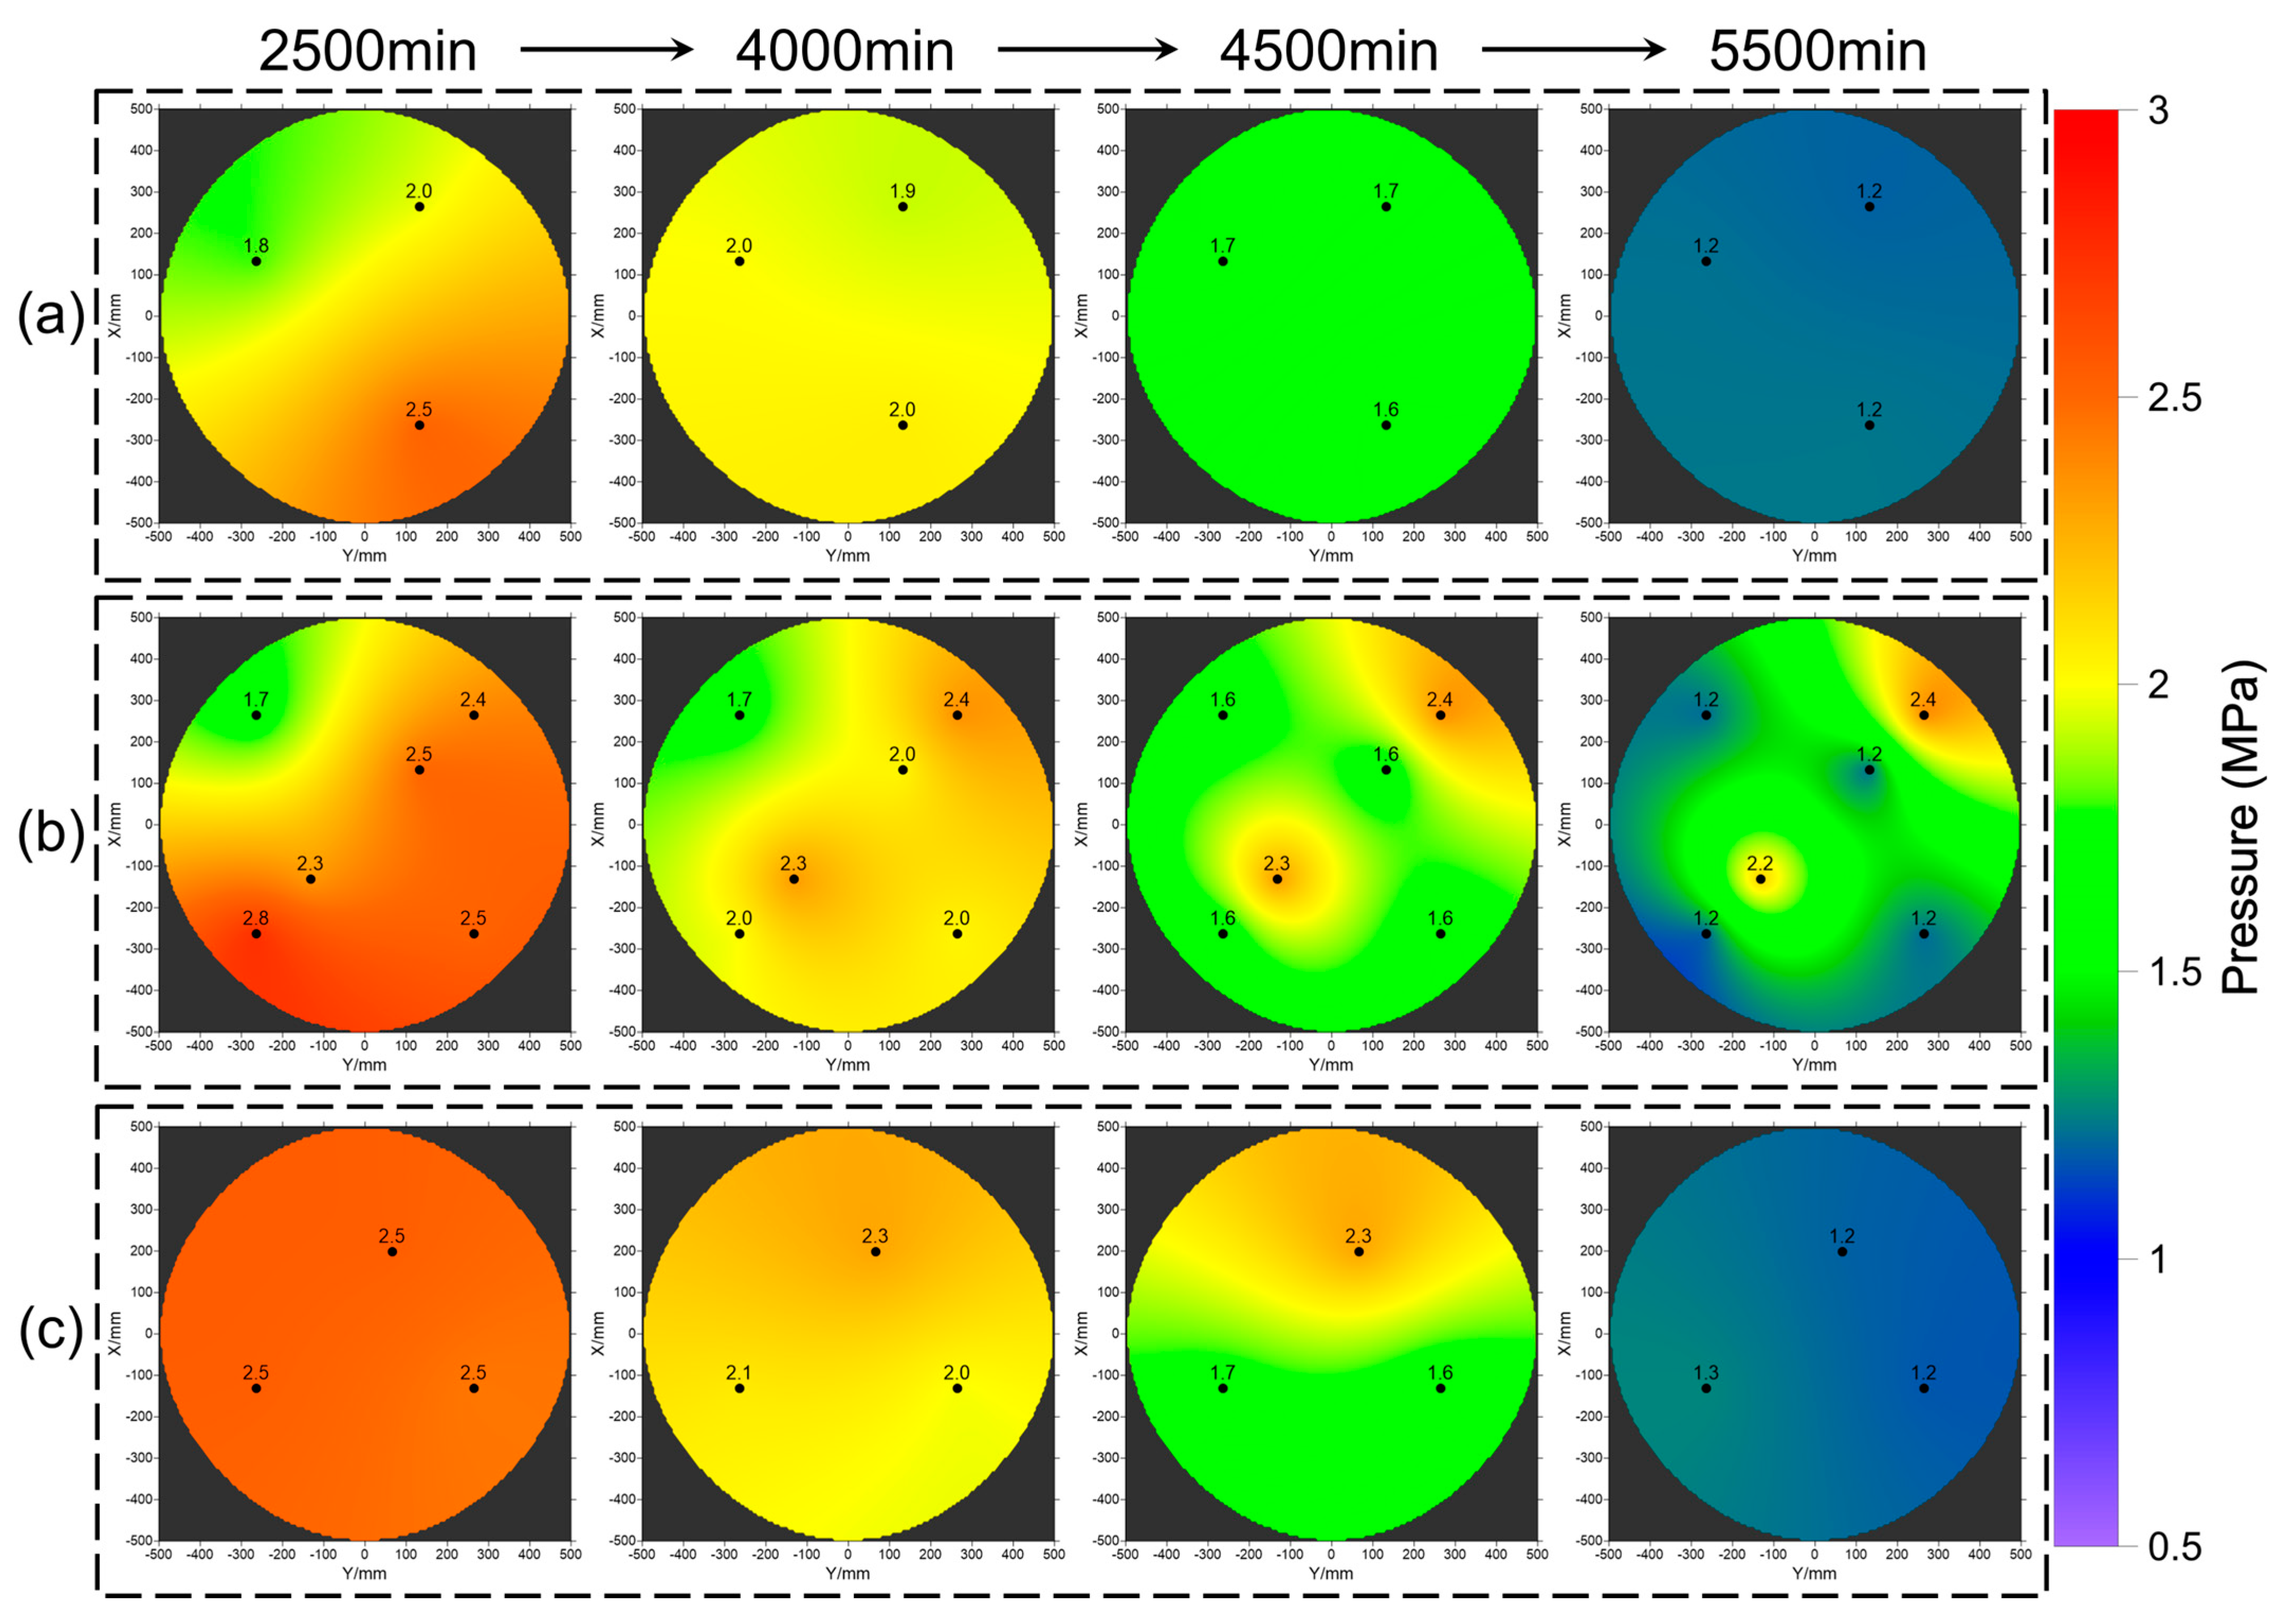
Figure 12 illustrates the layered pore pressure nephogram across the upper (a), middle (b), and lower (c) layers. Similar to temperature, the pressure decreases also follow a bottom-up sequence. At 2500 min, pressure decreases are most prominent in the lower layer, whereas the upper and middle layers remain at relatively high levels. As dissociation continues, gas accumulates due to migration resistance, forming localized high-pressure zones in the middle layer at 4500 min. These high-pressure regions reflect the temporary blockage of flow pathways by an undissociated hydrate. By 5500 min, most regions across all layers exhibit significantly reduced pressures, indicating that dissociation is nearly complete and the system approaches pressure equilibrium.

3.2. Electrical Resistivity

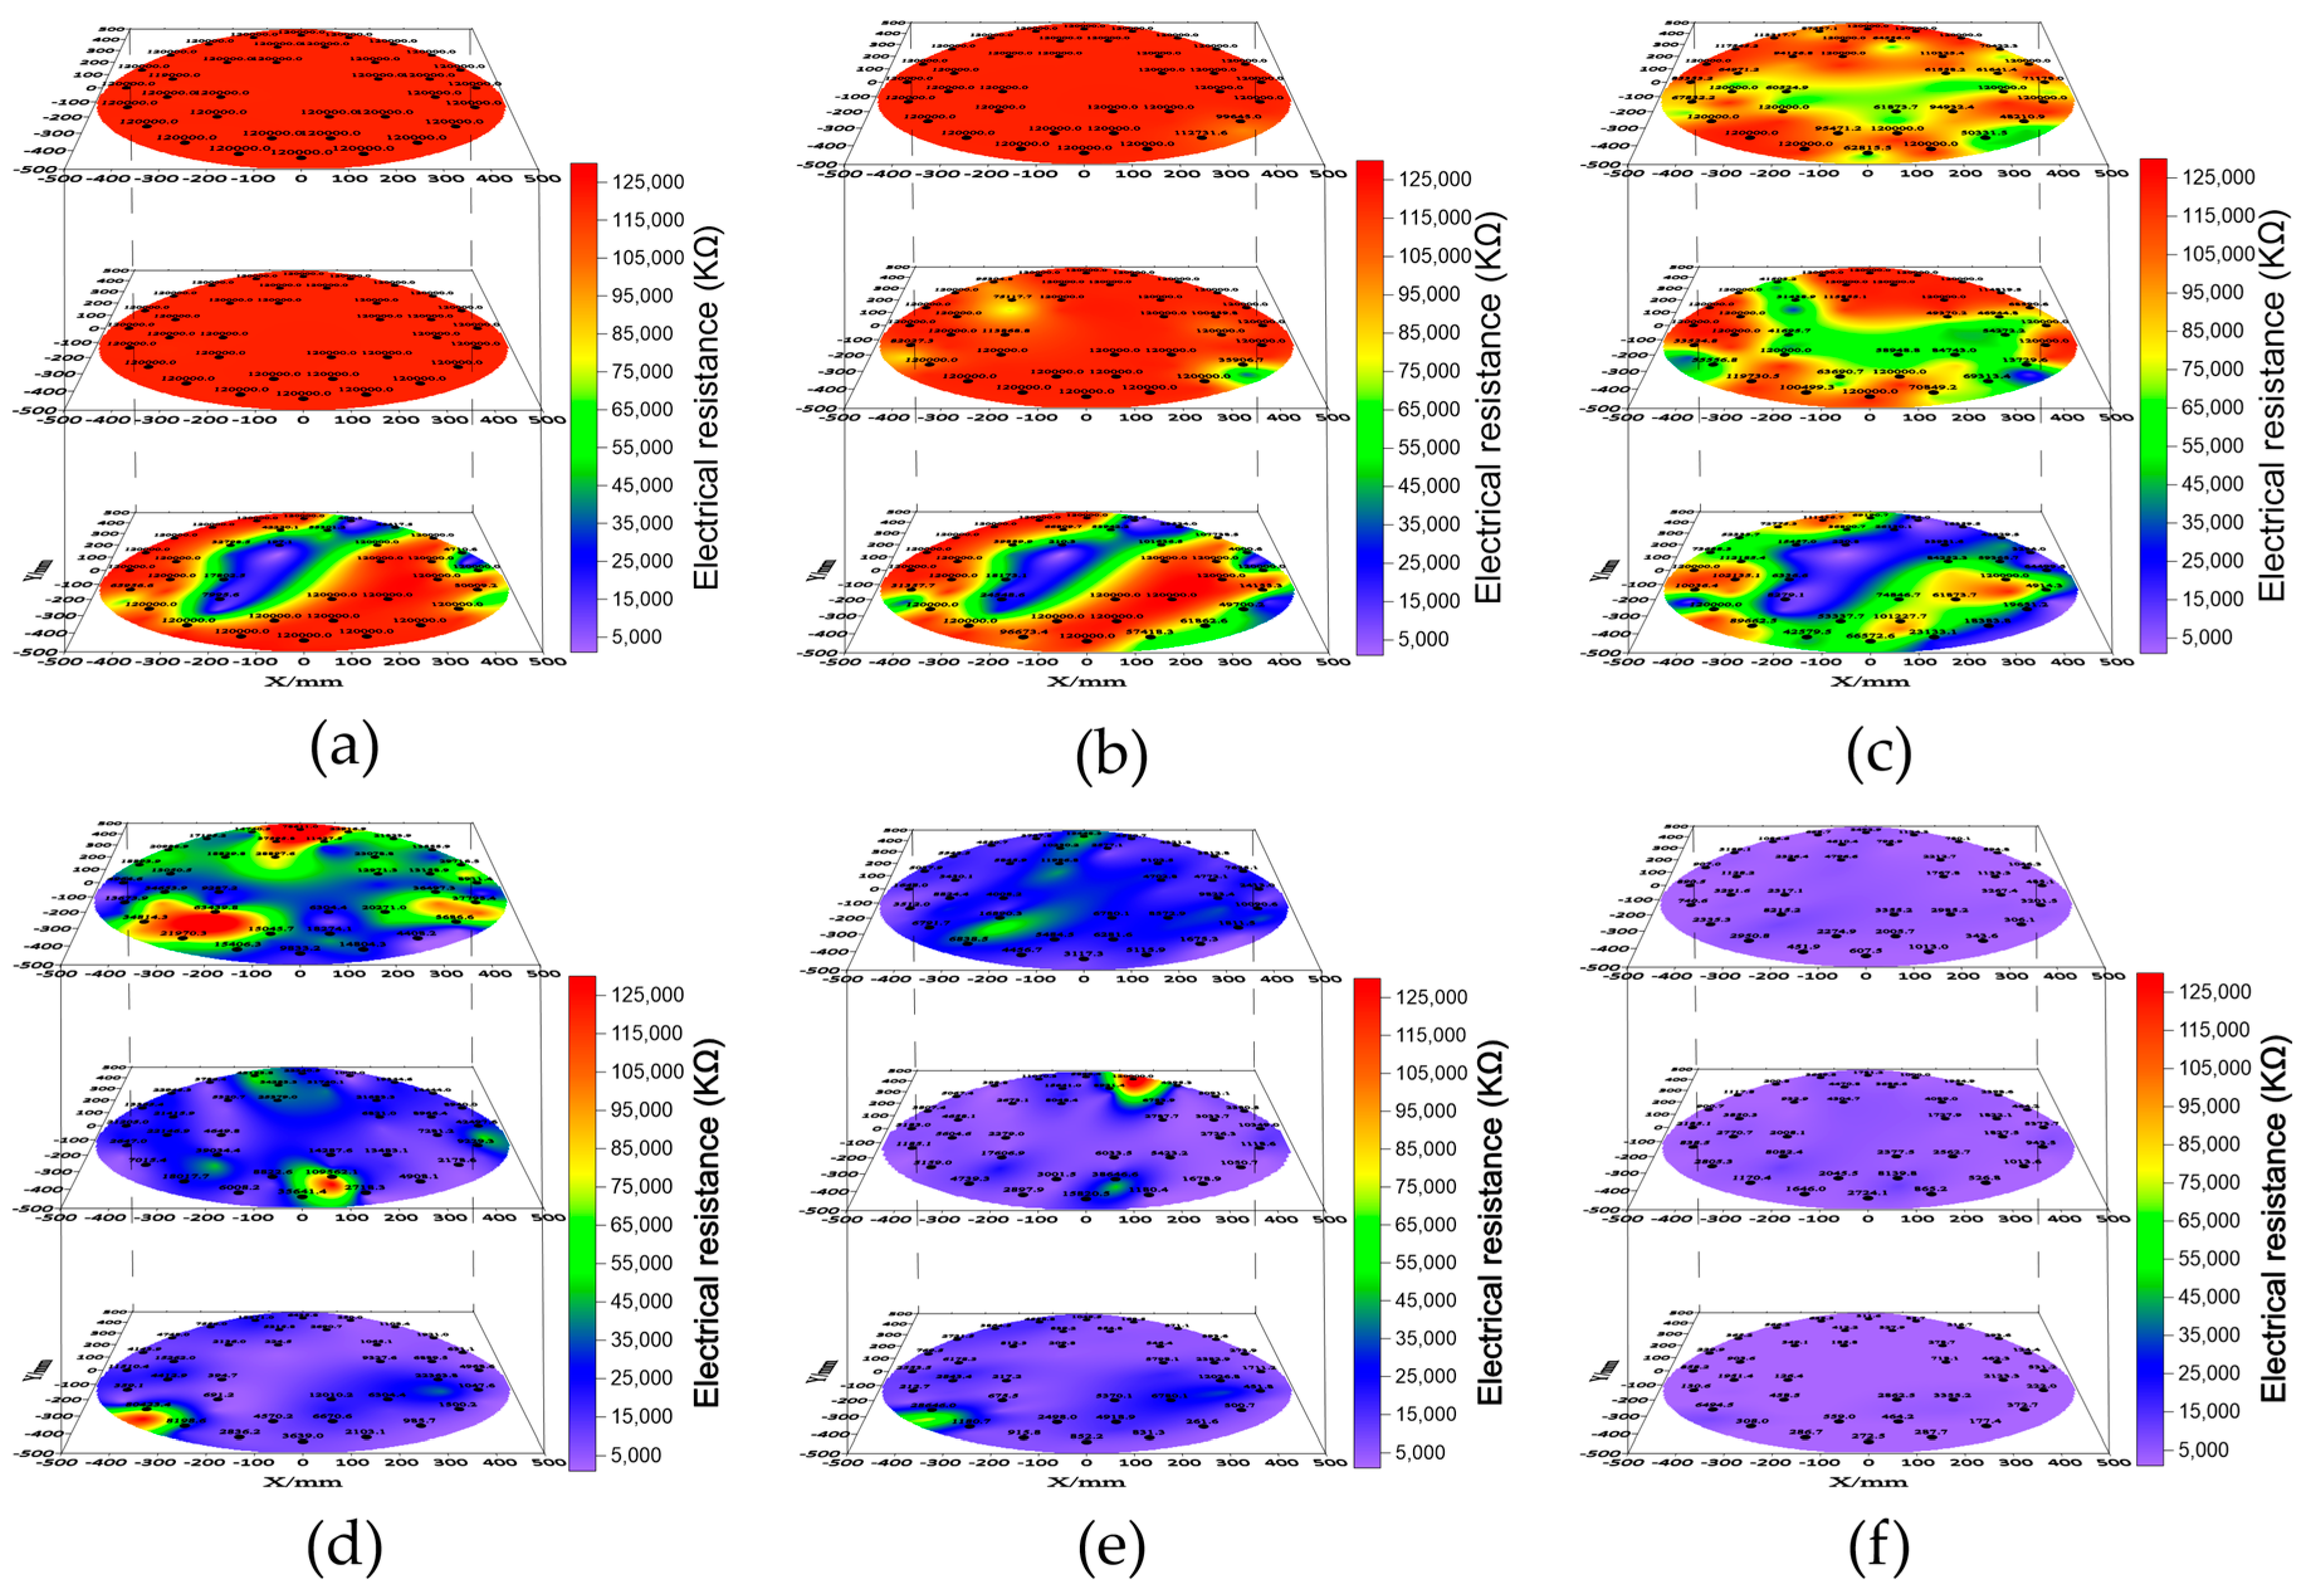
Electrical resistivity has long been used to evaluate natural gas hydrate abundance and spatial distribution [37,59,60]. In general, the resistivity of hydrate-bearing sediments increases with hydrate saturation. During dissociation, hydrate loss and released pore water improve conductive pathways, causing resistivity to decrease. The spatial expansion of this decrease therefore reflects the progression of the dissociation zone. However, since no widely representative quantitative model is currently available [61], this section focuses only on the qualitative analysis of hydrate saturation changes.
Figure 13 includes a nephogram showing the resistivity changes that occur inside the model during the depressurization dissociation process. It can be observed that at t = 1000 min, the dissociation of the lower layer begins, leading to changes in resistivity. At t = 2500 min, the dissociation area of the lower layer gradually expands, while small-scale dissociation occurs in the middle and upper layers. As the experiment progresses, the dissociation area continues to expand, and by t = 4000 min and t = 4500 min, the dissociation region enlarges, causing resistivity to decrease gradually. At t = 5500 min, the hydrate in the lower and middle layers is nearly dissociated, significantly reducing the hydrate saturation in the upper layer. By t = 7000 min, the resistivity within the model drops below 2000 kΩ, indicating that the hydrate has fully dissociated and the experiment is nearing completion.
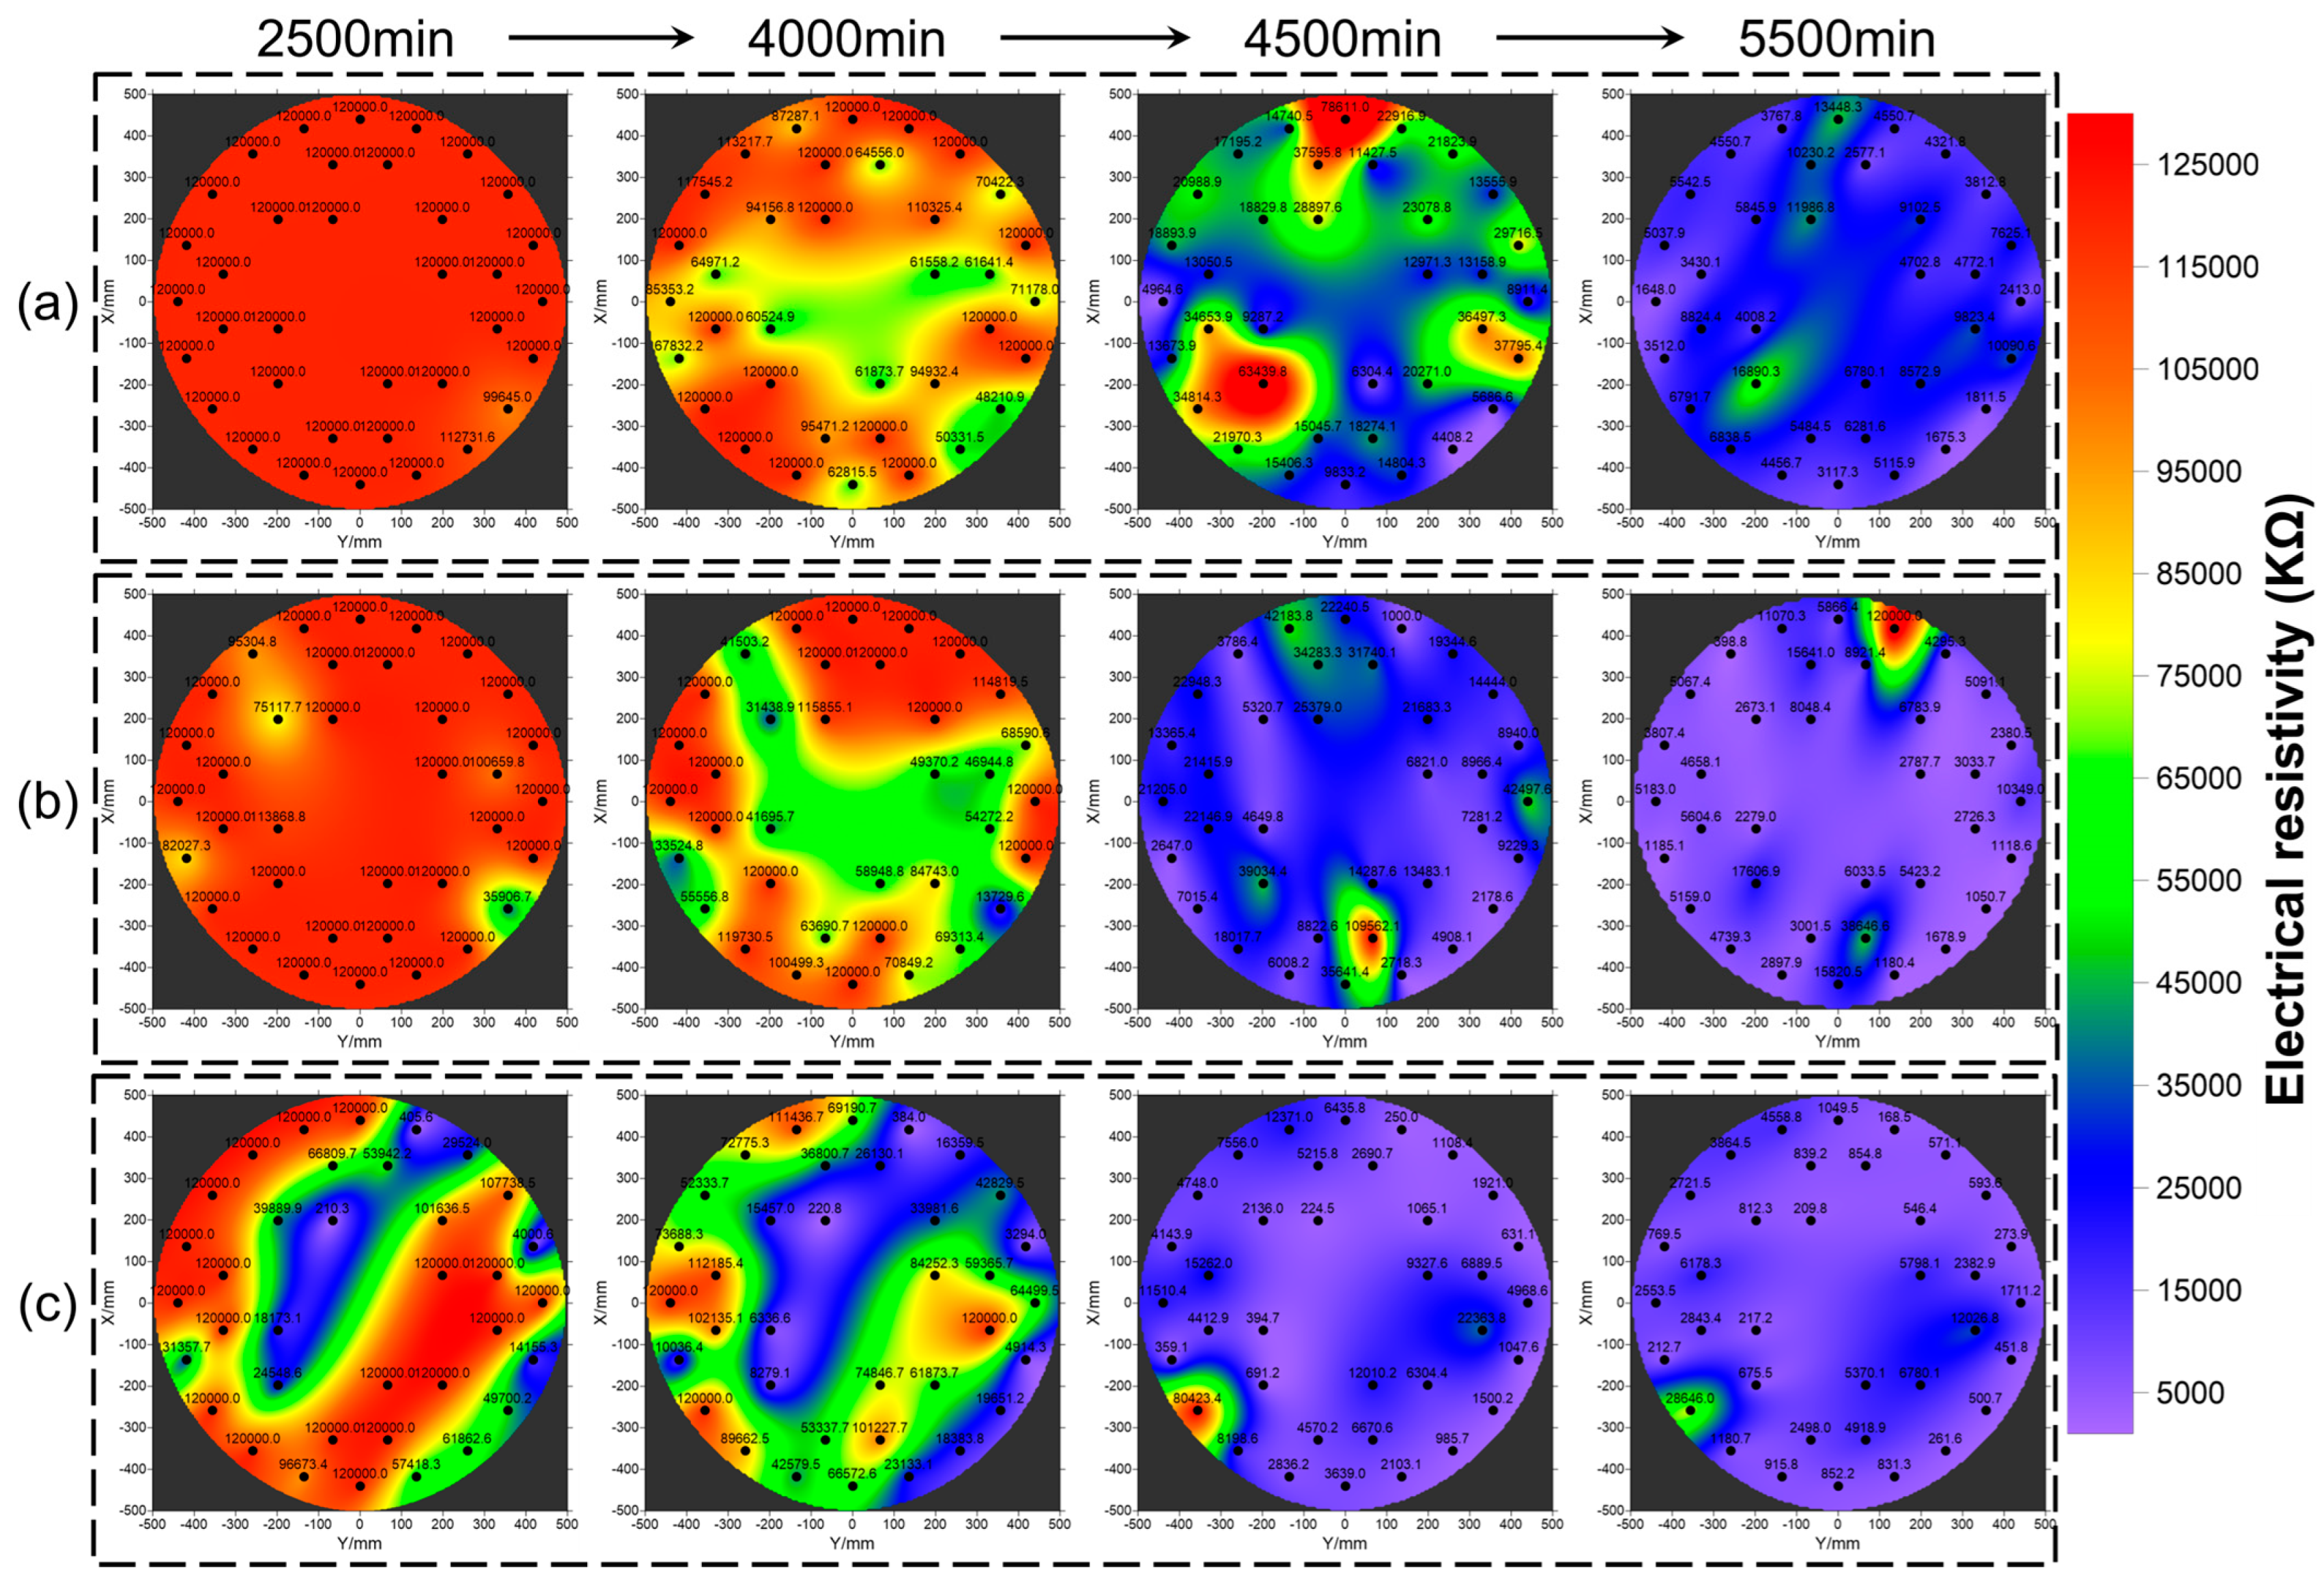
To further characterize the spatial evolution of hydrate saturation during the depressurization process, Figure 14 presents the layered electrical resistivity distributions across the upper (a), middle (b), and lower (c) layers. The spatial variation in resistivity reflects hydrate saturation status, drawing on the correlation between water consumption and electrical conductivity. At 2500 min, high resistivity values dominate all layers, with slight reductions observed locally in the lower layer, indicating the initial onset of hydrate dissociation. By 4000 min, the dissociation region expands significantly in the lower and middle layers, accompanied by a noticeable decrease in resistivity in localized zones. At 4500 min, the hydrate dissociation accelerates, and low-resistivity regions begin to spread across all three layers, suggesting substantial consumption of hydrate-bound water. At 5500 min, the resistivity in most regions of the model decreases markedly, especially in the lower and middle layers, implying that hydrate saturation is largely reduced and the system is approaching complete dissociation. These results further confirm the vertical progression of hydrate dissociation.

3.3. Gas Production Characteristics

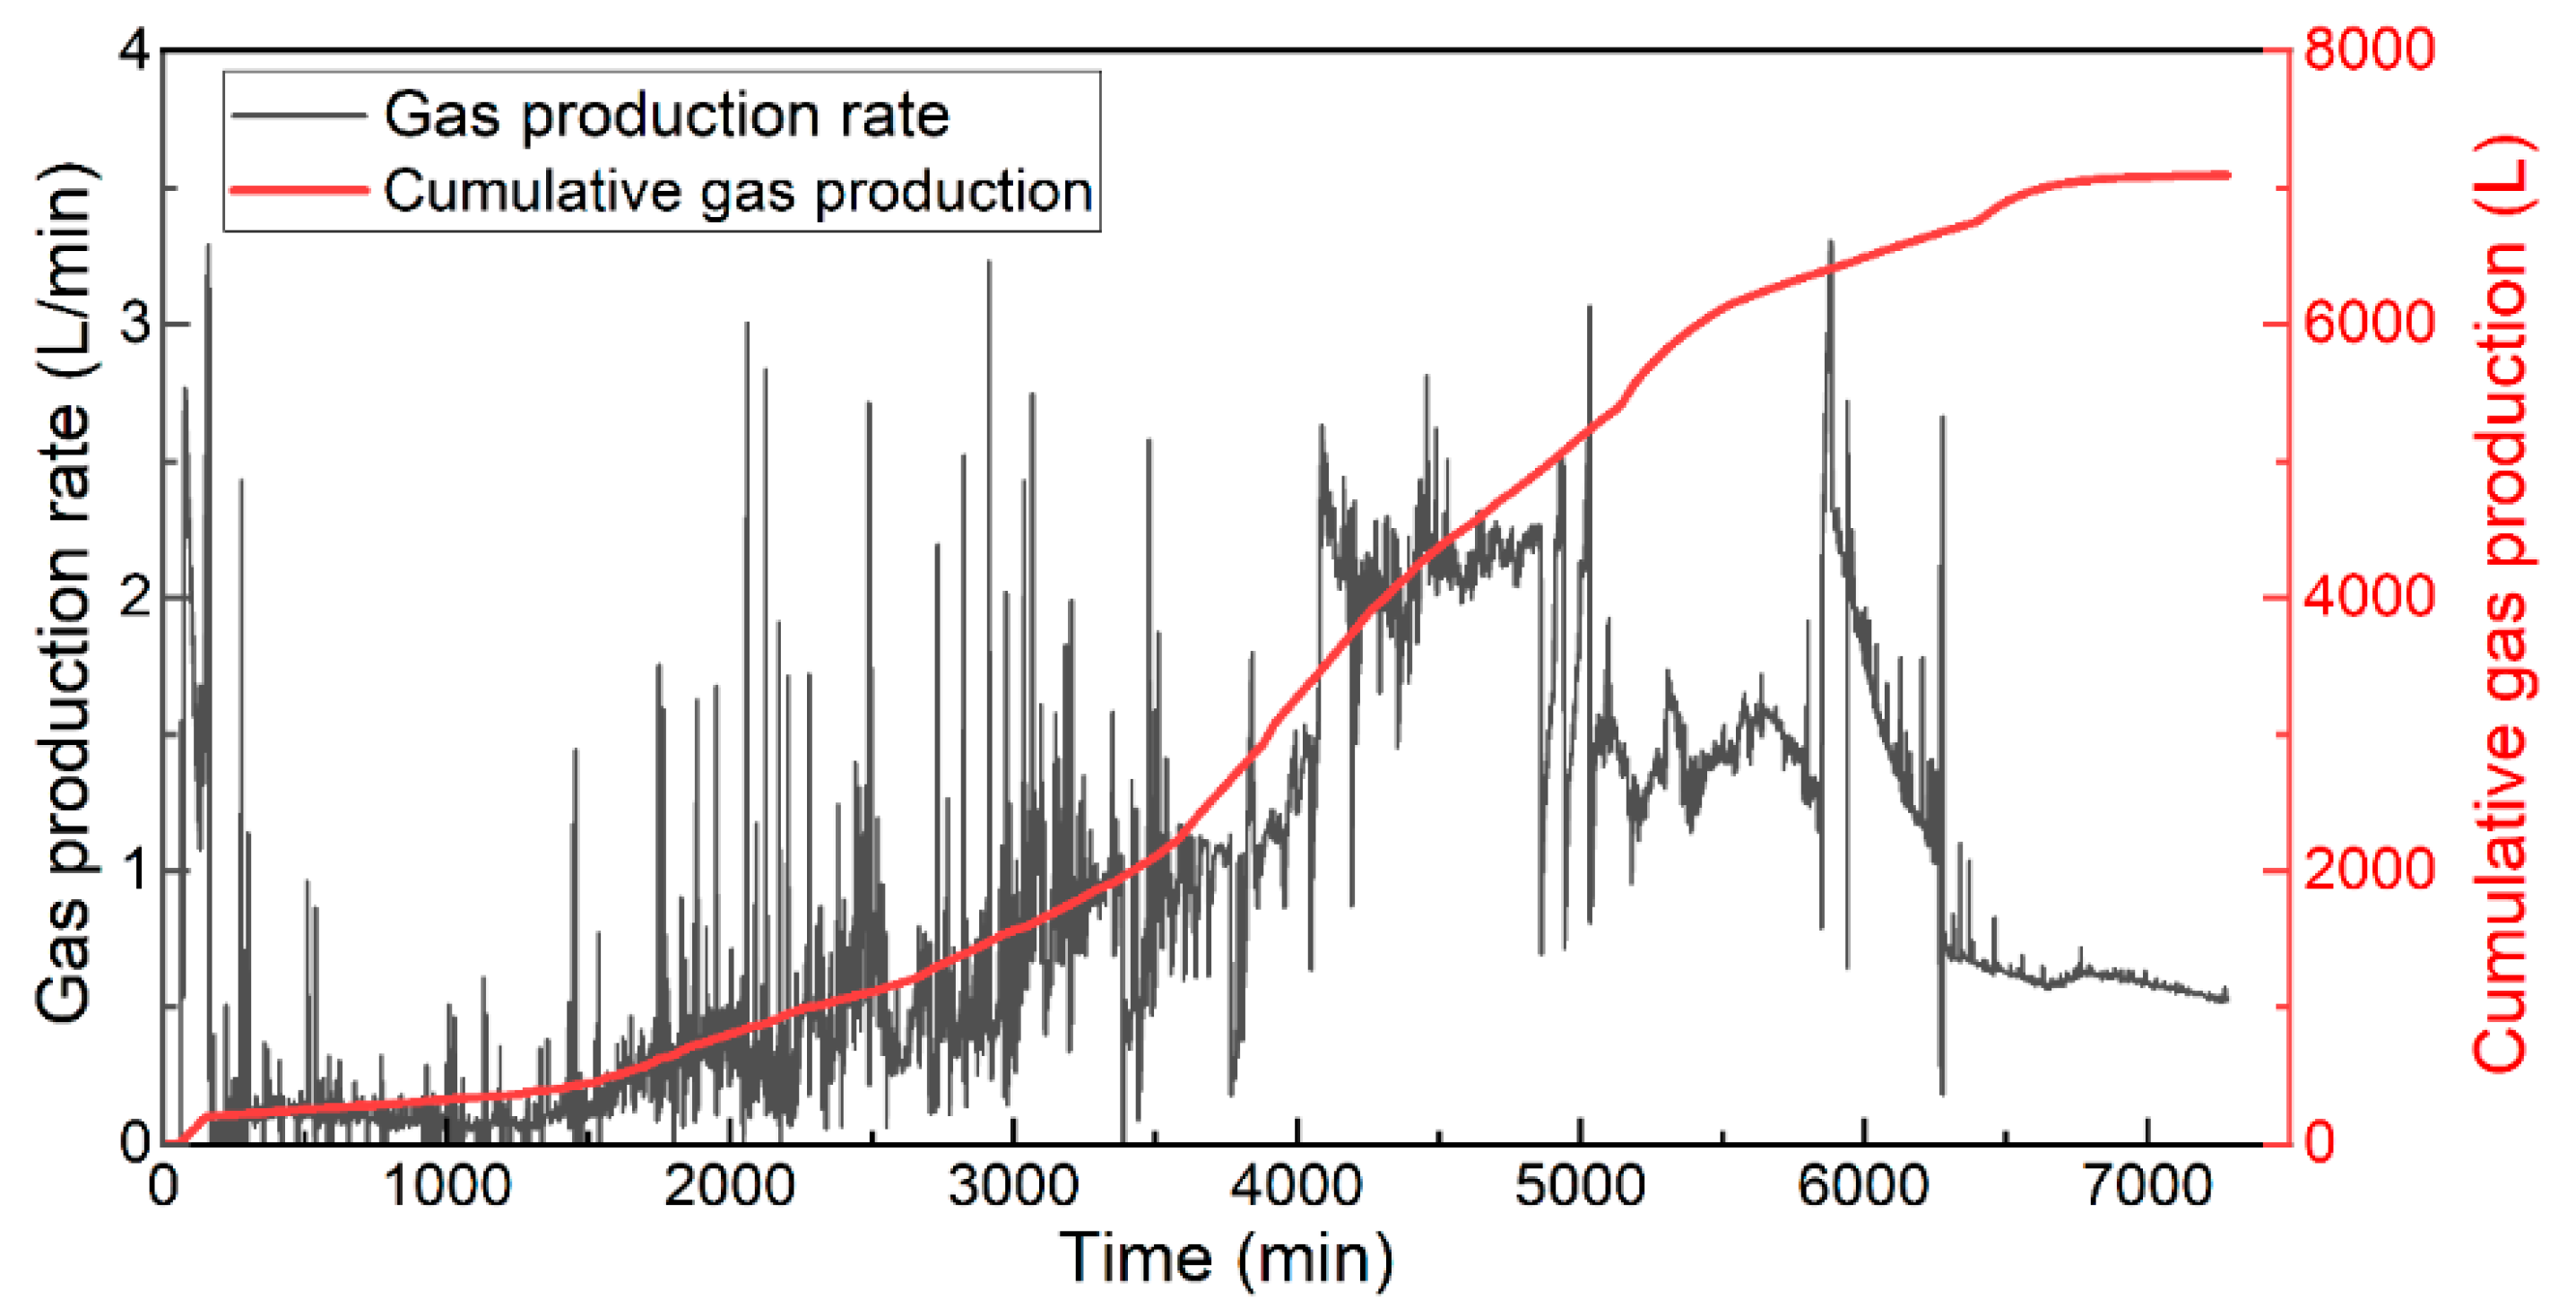
Figure 15 illustrates the gas production process during hydrate dissociation. The red line shows the time curve of the cumulative flow at the outlet, demonstrating that the gas production rate initially increases slowly before accelerating and finally stabilizing. The black line in Figure 15 shows the time curve of the instantaneous flow at the outlet. It can be observed that during the early stages of the experiment, there is a short period of rapid instantaneous flow, during which the primary gas released is the free gas in the model. This observation is consistent with the previous analysis. In the early stages of the experiment, the dissociation area is small, resulting in lower instantaneous flow and a slow increase in cumulative flow. As the dissociation area expands, the amount of gas released increases, which causes a rise in instantaneous flow. The cumulative flow begins to increase more rapidly. At 4500 min, the instantaneous flow reaches its maximum value, at which point the cumulative flow grows the fastest. After the complete dissociation of the hydrate, the instantaneous flow essentially drops to zero, and the cumulative flow stabilizes.

3.4. Sediment Settlement

Sediment settlement during hydrate dissociation is governed by changes in the mechanical properties of the sediment and the evolution of pore pressure. As the hydrate dissociates, the solid hydrate that occupies pore space and contributes to sediment cementation gradually disappears, leading to a reduction in sediment strength and stiffness. This loss of mechanical integrity, combined with the redistribution of stress within the sediment matrix, constitutes the primary mechanism that drives reservoir deformation.
In this depressurization experiment, contrary to the intuitive expectation that gas generation increases pore pressure, the system’s pressure was progressively reduced and maintained at a lower level through the backpressure valve. Therefore, the overall pore pressure in the sediment did not increase; instead, it decreased in response to the imposed pressure drawdown. However, local and transient pore pressure fluctuations could still occur due to the rapid release of gas from dissociating hydrate, which temporarily affects the local effective stress distribution. Under the prevailing boundary conditions, the net effect of depressurization was a reduction in pore pressure, which increased the effective stress on the sediment skeleton (following Terzaghi’s effective stress principle: σeff = σtotalppore), thereby promotes compaction and settlement. Based on Terzaghi’s effective stress principle, the representative vertical effective stress was approximately 2.25 MPa at the beginning of depressurization (5.25−3.00 MPa) and increased to approximately 2.80 MPa at the end of the experiment (3.80−1.00 MPa). Thus, the estimated vertical effective stress increased by approximately 0.55 MPa.
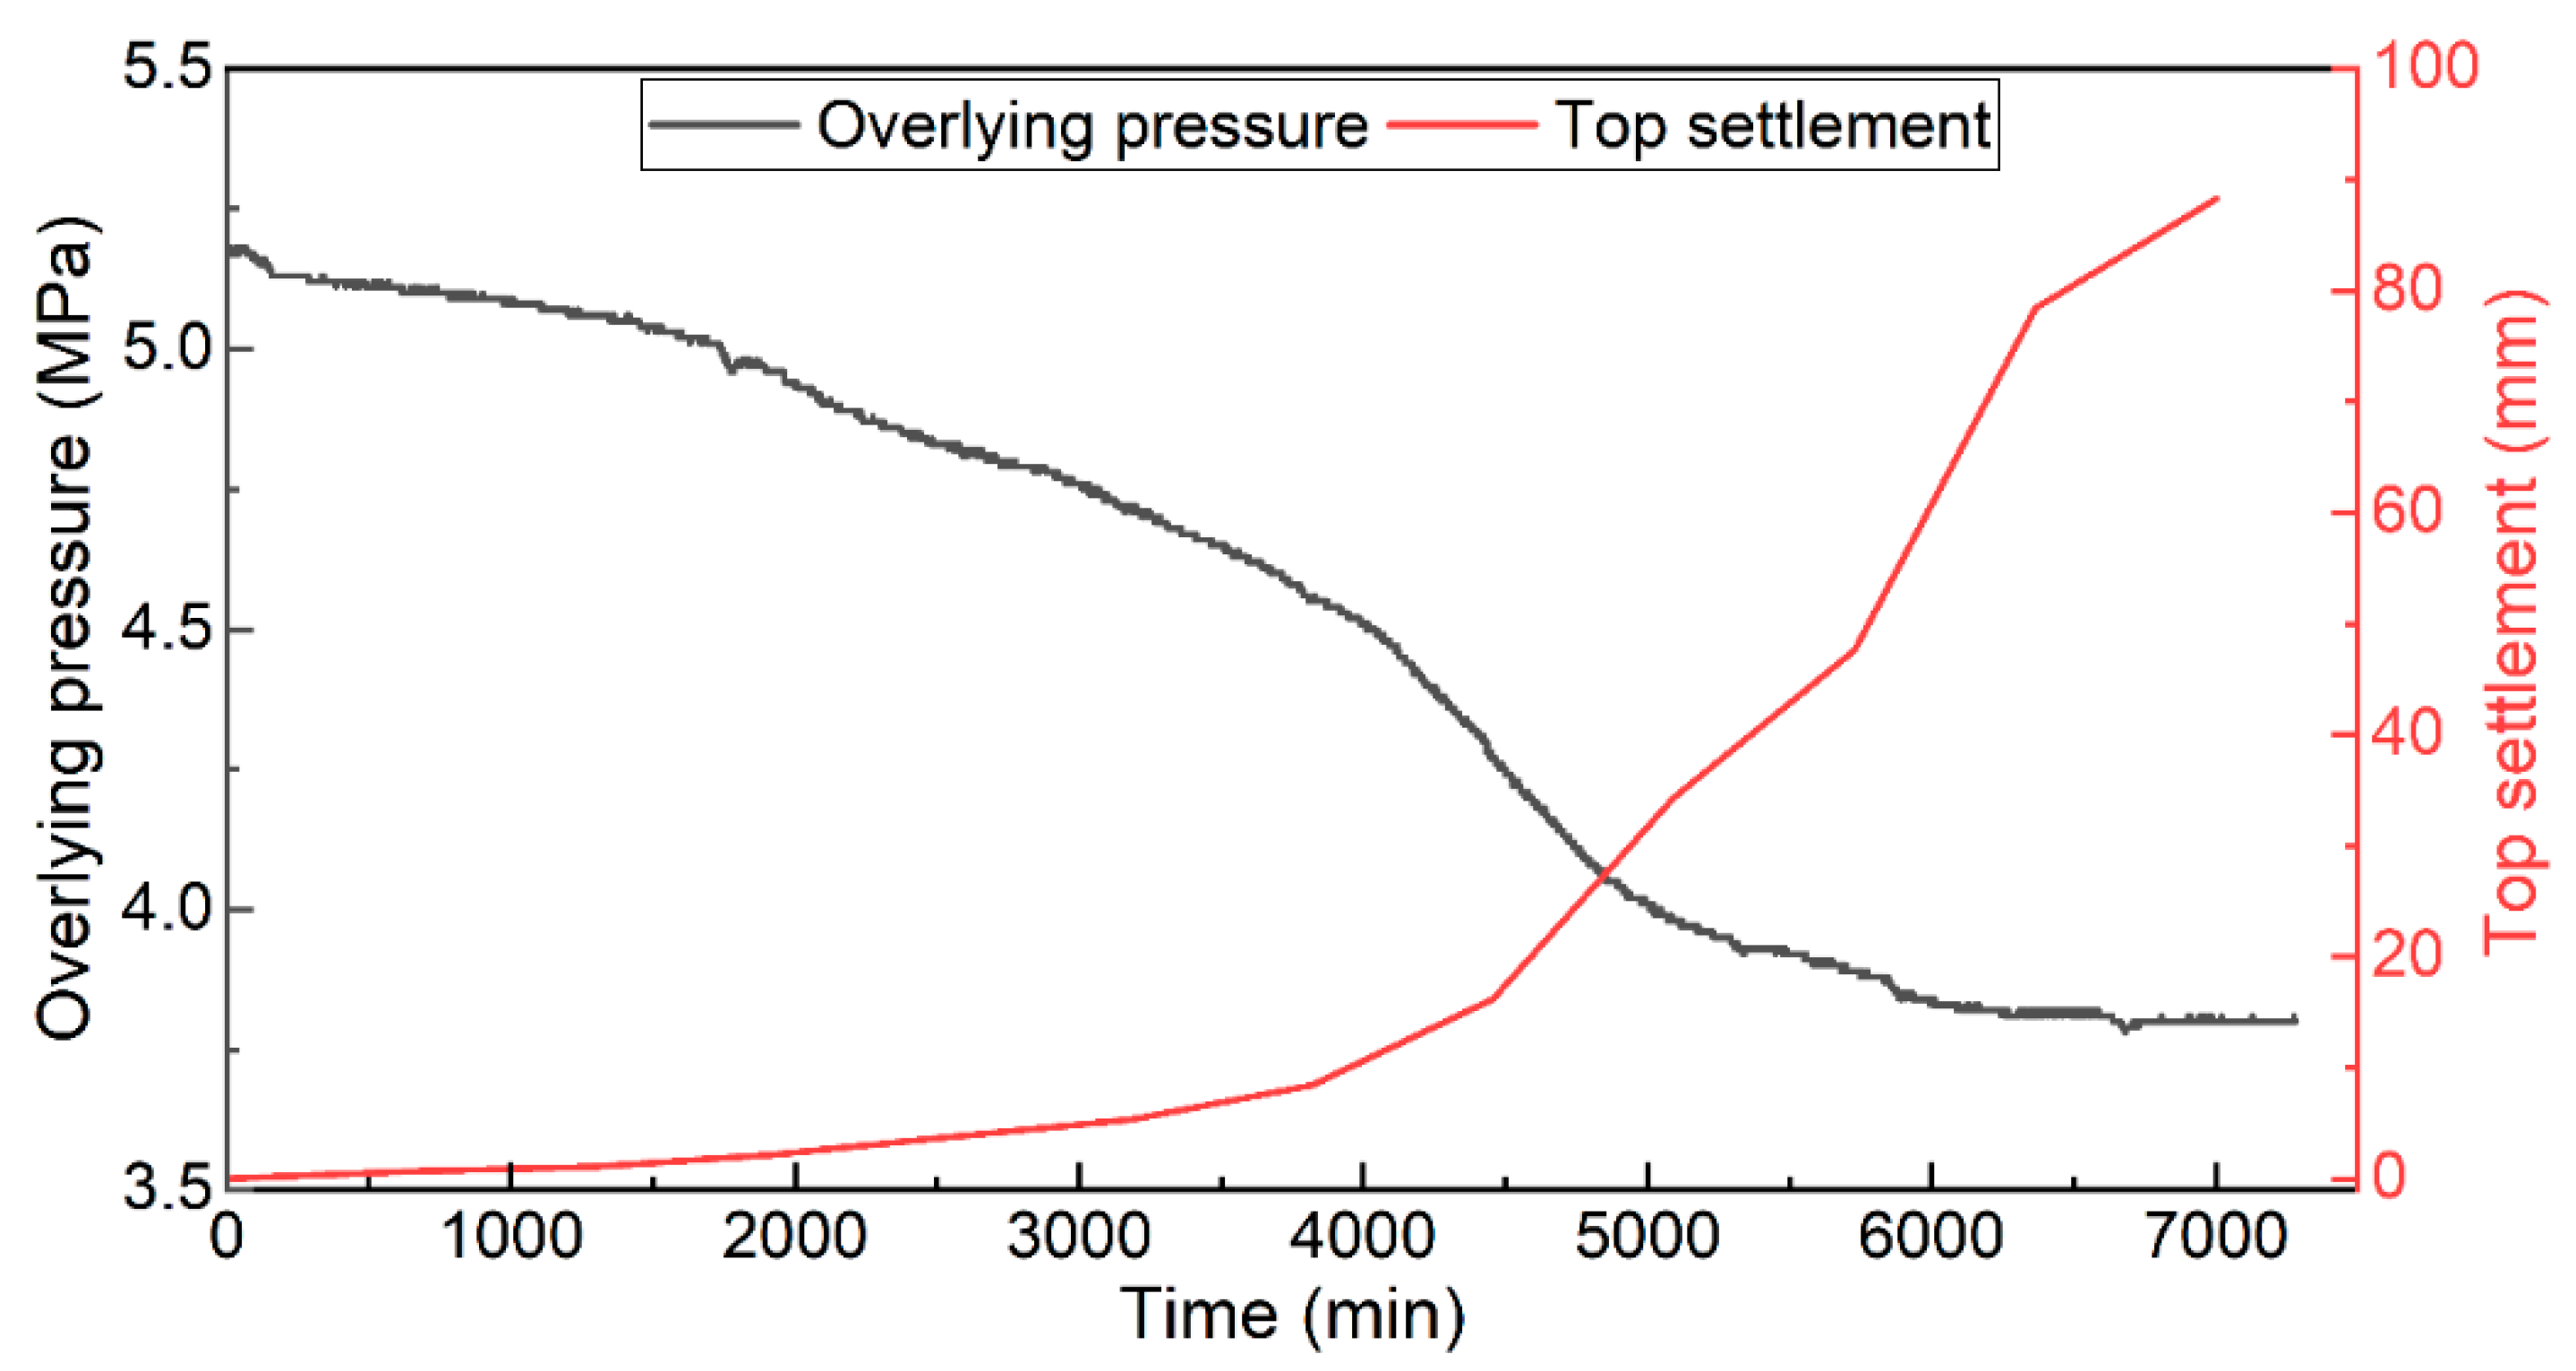
Figure 16 presents the time-series measurements of sediment settlement and overburden pressure during the experiment. The settlement curve (red line) exhibits three distinct stages: (1) an initial slow phase (0–4000 min) with minimal displacement, corresponding to the early stage of hydrate dissociation when the dissociation front was localized near the production well. Increased effective stress drove initial compaction, while the largely intact hydrate skeleton limited deformation; (2) an accelerated settlement phase (4000–6000 min), during which the dissociation front propagated outward and the weakened zone expanded significantly, leading to a rapid increase in vertical displacement. Rapid loss of hydrate cementation and support controlled the accelerated settlement, while pore-pressure reduction continued to provide compactive loading; and (3) a stabilization phase (after 6000 min), when hydrate dissociation approached completion and the sediment skeleton reached a new equilibrium state. Hydrate dissociation and effective-stress changes stabilized, and the sediment reached a new equilibrium state. The maximum settlement recorded was approximately 88.3 mm, which is equivalent to 5.88% of the total model height.
The overburden pressure curve (black line) decreased from approximately 5.25 MPa to about around 3.80 MPa over the course of the experiment. The reduction in overburden pressure exhibits a similar temporal trend to the settlement, suggesting a coupled interaction between reservoir compaction and load transfer: as the sediment settles, the load-bearing capacity of the reservoir changes, leading to a gradual decrease in the measured overburden pressure. This observation is consistent with the hydrate dissociation analysis presented in Section 3.1 and Section 3.2.
Overall, the observed settlement behavior reflects the combined effects of hydrate dissociation-induced mechanical weakening and pore pressure evolution under controlled depressurization. These results provide quantitative insights into the coupled thermo–hydro–mechanical response of hydrate–bearing sediments during gas production.

4. Discussion

4.1. Coupled Thermo–Hydraulic Response

The experimental results show that depressurization drove the CO2 hydrate-bearing system across the phase equilibrium boundary, resulting in hydrate dissociation and a clear endothermic cooling response. The decrease in temperature was spatially heterogeneous, with the lower layer responding earlier than the middle and upper layers, indicating that hydrate dissociation propagated progressively within the model under the combined effects of pressure drawdown, heat transfer, and gas migration. The pressure field exhibited local fluctuations during the overall depressurization process, suggesting that gas release, pore-fluid redistribution, and temporary blockage of flow channels jointly controlled the hydraulic response. The gas production process exhibited an initial slow-release stage, a rapid production stage, and a final stabilization stage, which is consistent with the gradual development and eventual depletion of the dissociation zone. However, the measured gas production should be regarded as apparent gas output from the CO2 hydrate model, because free gas, dissolved gas, and hydrate-derived gas were not fully separated in the present mass-balance analysis.

4.2. Mechanical Response

The observed settlement reflects the combined influence of hydrate dissociation, a weakened sediment skeleton, pore pressure reduction, and stress redistribution. As the hydrate dissociated, its loss reduced the stiffness and supporting effect of the sediment framework. Meanwhile, under the imposed depressurization conditions, the average pore pressure decreased, which increased the effective stress borne by the sediment skeleton according to the conventional effective stress principle. Therefore, the settlement should be attributed mainly to the combined effects of increased effective stress caused by pore pressure reduction and the degradation of a hydrate-related mechanical support.
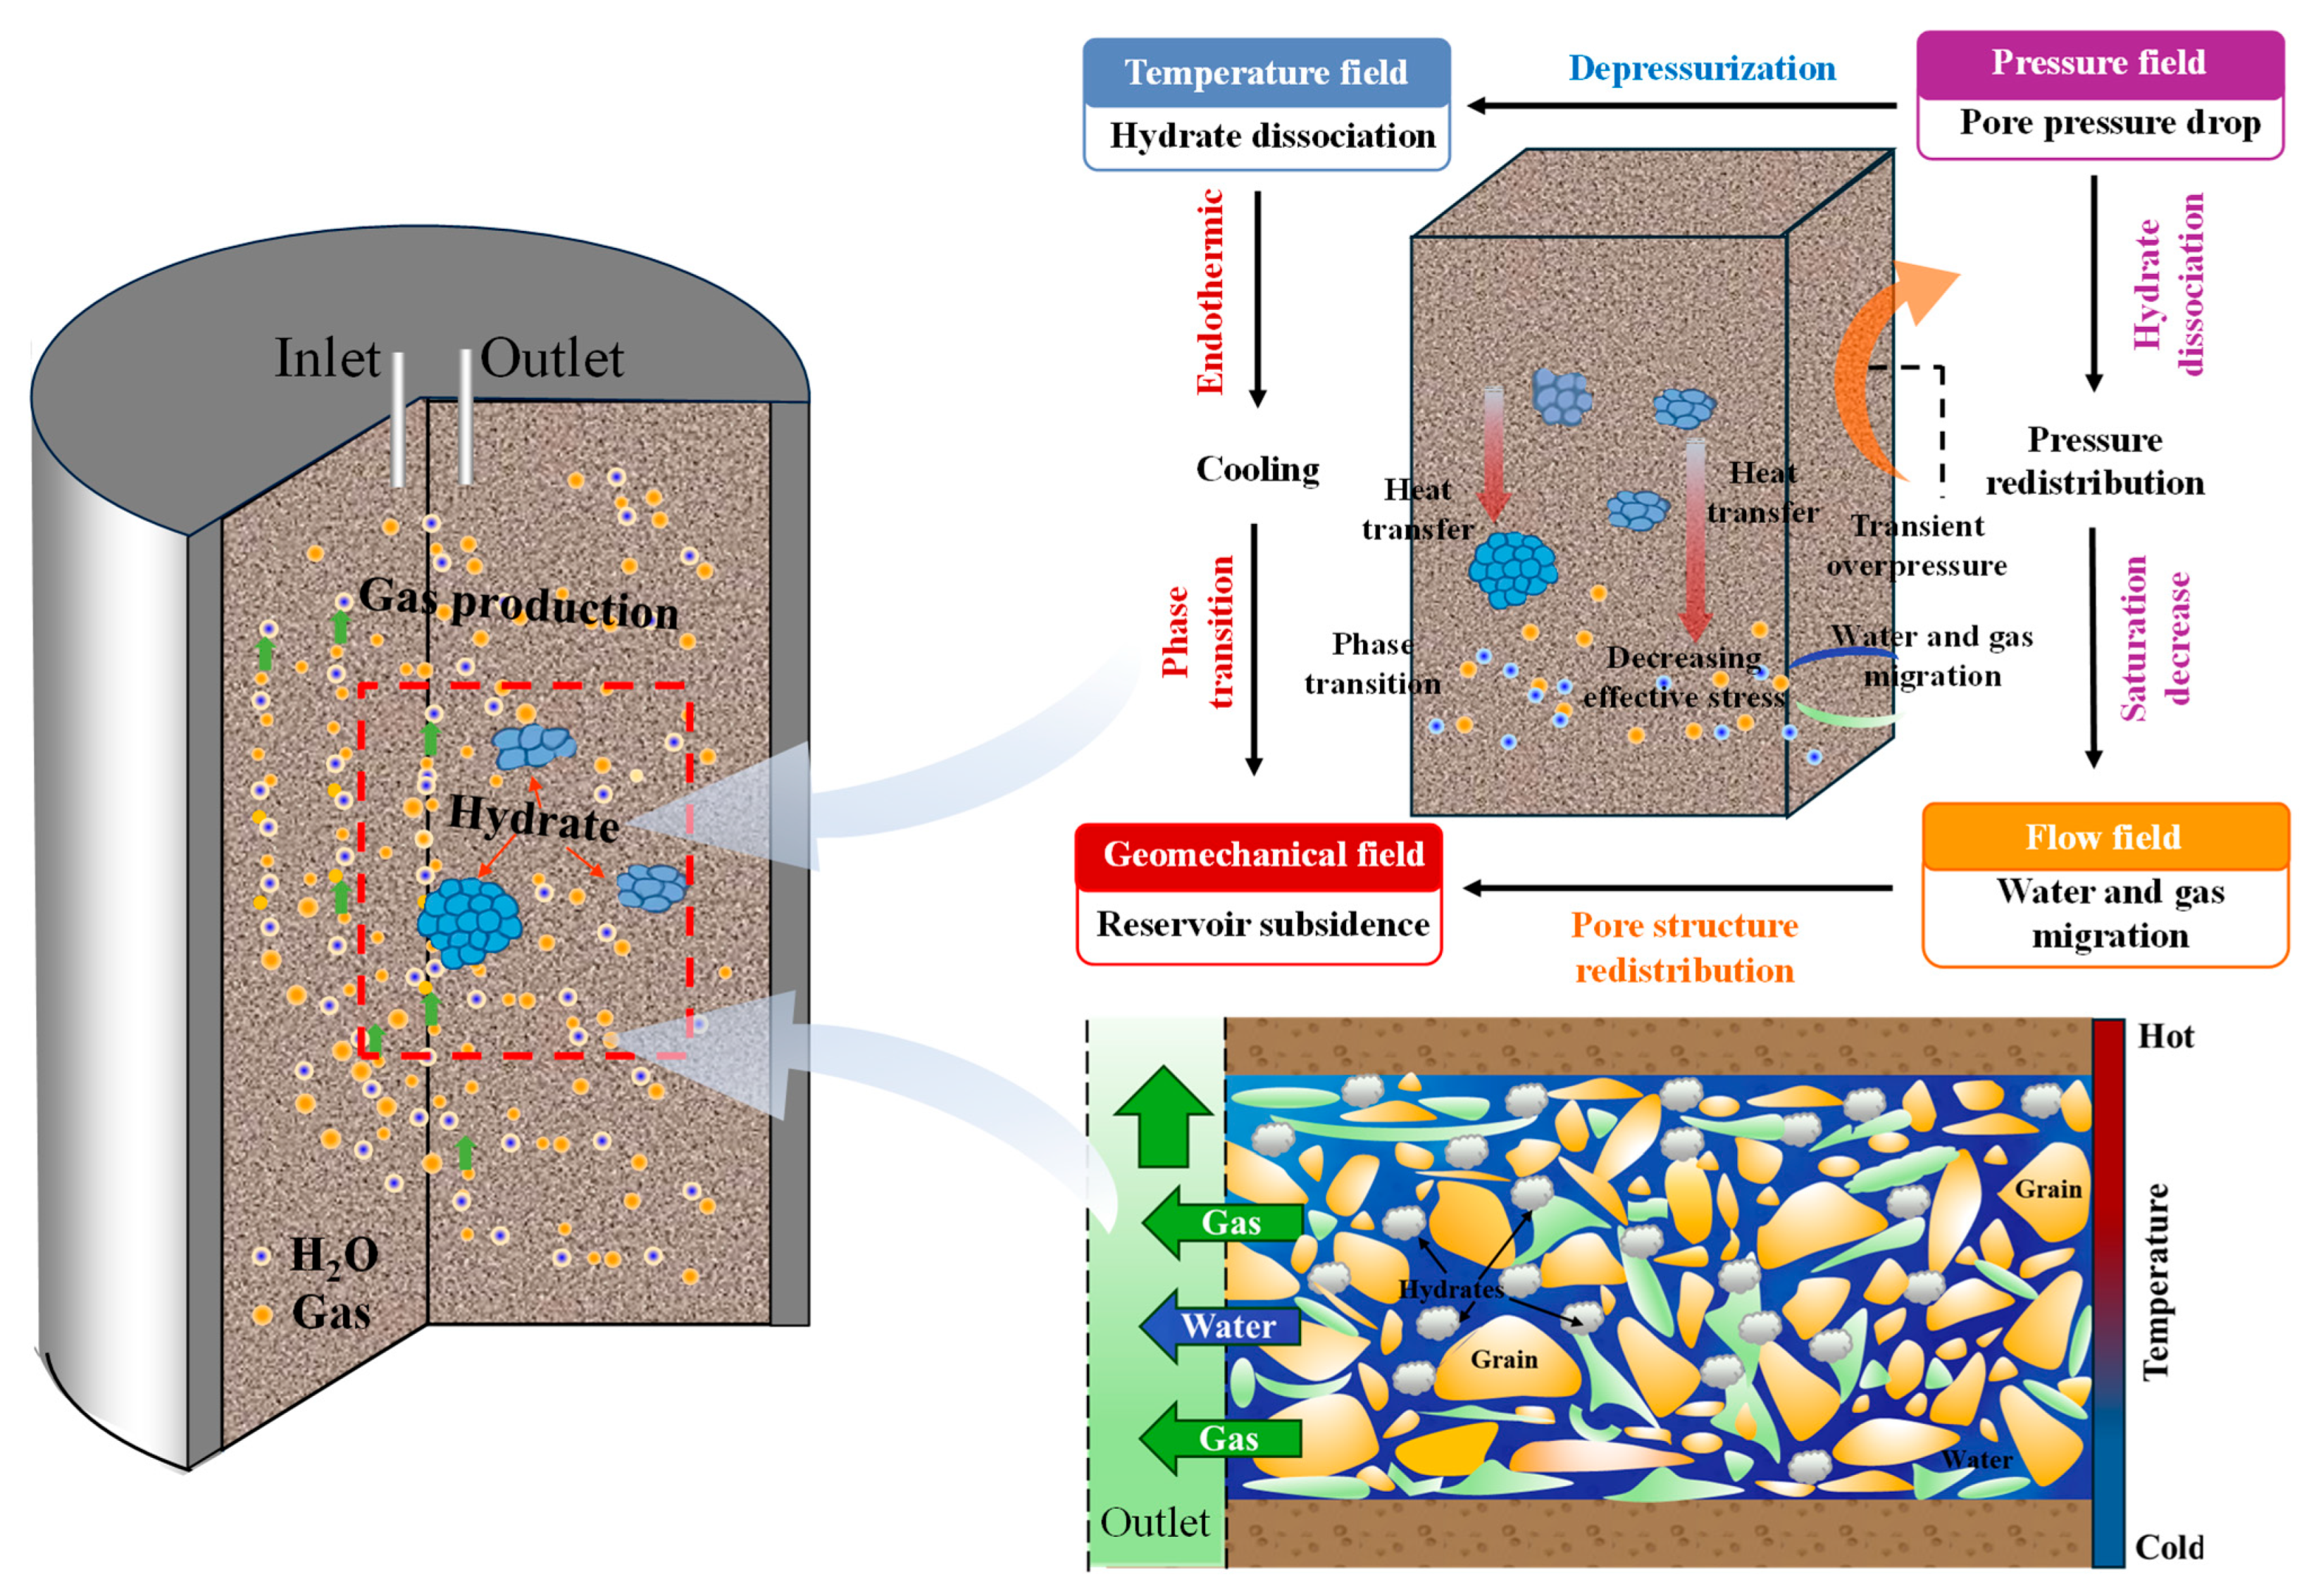
This result supports the interpretation that the overall decrease in pore pressure promoted sediment compaction and settlement. The maximum settlement reached 88.3 mm, indicating significant deformation of the model sediment; however, this value is specific to the experimental sediment, hydrate saturation, boundary conditions, and depressurization path. The conceptual coupling mechanism among depressurization, hydrate dissociation, thermo response, gas–water migration, pore pressure redistribution, and sediment deformation is summarized in Figure 17.

4.3. Implications and Limitations

This study provides a large-scale laboratory observation of the coupled thermo–hydraulic–mechanical response of CO2 hydrate-bearing sediments during depressurization. The simultaneous monitoring of temperature, pressure, electrical resistivity, gas production, and displacement revealed the coordinated evolution of hydrate dissociation, heat absorption, gas–water migration, pore pressure redistribution, and sediment settlement. These results provide reference data for validating numerical models of hydrate-bearing sediment behavior under controlled laboratory conditions. However, the present results should be limited to the CO2 hydrate model system. Because the CO2 hydrate and CH4 hydrate differ in phase equilibrium, dissociation kinetics, gas solubility, and flow behavior, the findings should not be directly generalized to methane hydrate production without further comparative experiments or scaling analysis.
In addition, the large-scale measurements provide benchmarks for calibrating coupled THM models and interpreting field-scale pressure, thermo, gas production, and de-formation responses. Direct extrapolation, however, requires consideration of reservoir heterogeneity, in situ stress, well configuration, and boundary conditions. The present study is also based on a single experiment. Future work will repeat the baseline test and examine different initial hydrate saturations and depressurization rates. Control tests without hydrate will distinguish pressure-induced compaction from dissociation-related deformation. Resistivity calibration and complete gas–water mass-balance measurements will reduce uncertainty. Comparative tests will assess the applicability of the CO2 hydrate results to CH4 hydrate systems.

5. Conclusions

This study used a specially designed large-scale simulation apparatus to investigate CO2 hydrate dissociation and gas production under depressurization. Based on the monitored temperature, pressure, electrical resistivity, gas production, and sediment settlement, the main conclusions are as follows:
(1)
Hydrate dissociation began when the temperature–pressure conditions crossed the phase-equilibrium boundary. Endothermic cooling occurred, and the dissociation front propagated from the lower to the upper layer.
(2)
Gas production exhibited slow-release, rapid-production, and stabilization stages. Gas migration caused pore-pressure redistribution and localized pressure peaks, while decreasing electrical resistivity reflected the expansion of the dissociation zone.
(3)
Sediment settlement resulted from the combined effects of reduced hydrate support and increased effective stress caused by pore-pressure reduction. These coupled thermo–hydro-mechanical responses characterize the laboratory-scale behavior of the CO2 hydrate model system.
It should be emphasized that these conclusions are derived from experiments on CO2 hydrate-bearing sediments. Owing to the differences between CO2 and CH4 hydrates in phase equilibrium, dissociation kinetics, gas solubility, and multiphase flow behavior, further comparative experiments and scaling analyses are required before the present findings can be applied to CH4 hydrate reservoirs.

Author Contributions

Conceptualization, L.Y.; Methodology, T.Z.; Validation, J.C.; Formal analysis, T.Z. and J.L.; Data curation, X.S.; Writing—original draft, X.S.; Writing—review & editing, J.L., J.C., and L.Y.; Visualization, X.S.; Project administration, T.Z. and L.Y.; Funding acquisition, L.Y. All authors have read and agreed to the published version of the manuscript.

Funding

This research was funded by the National Natural Science Foundation of China, grant number No. 42407218, the National Key Research and Development Program of China, grant number No. 2021YFC2800903-05, the Scientific Research Foundation for High-level Talents of Anhui University of Science and Technology, grant number No. 2023yjrc11, the National Natural Science Foundation of China, grant number No. 42477201, the National Science and Technology Major Project, grant number No. 2024ZD1700201, the National Key Laboratory of Deep Coal Mining and Environmental Protection Fund of China, grant number No. HNKY2024ZD201, Excellent Youth Project of Anhui Province, China, grant number No. 2022AH030086; the Anhui Provincial General Fund Project, grant number No. 2308085ME154; the Anhui Provincial Key Research and Development Program Fund Project, grant number No. 2023z04020001, the Anhui Province Coal Mine Safety Mining Equipment Manufacturing Innovation Center Initiative, grant number No. CMSMEICAP2024005. The APC was funded by No. 42407218.

Data Availability Statement

The original contributions presented in this study are included in the article. Further inquiries can be directed to the corresponding authors.

Conflicts of Interest

The authors declare no conflicts of interest.

References

  1. National Energy Administration of China. How to Continuously Optimize and Adjust the Energy Structure. 2025. Available online: https://www.nea.gov.cn/20250425/2589f1f571974d80912891e4d1c126a6/c.html (accessed on 21 July 2026).
  2. Song, X.L.; Nian, T.K.; Mestdagh, T.; De Batist, M. Long- and short-term dynamic stability of submarine slopes undergoing hydrate dissociation. Gas Sci. Eng. 2023, 111, 204934. [Google Scholar] [CrossRef]
  3. Zhang, H.; Nian, T.K.; Song, X.L.; Sun, X.; Della Vecchia, G. Effect of wellhead depressurization on the stability of submarine hydrate-bearing reservoir using THMC coupling. Energy 2025, 320, 134961. [Google Scholar] [CrossRef]
  4. Khasanov, M.K.; Stolpovsky, M.V.; Gimaltdinov, I.K. Study of regimes for methane-carbon dioxide replacement in natural gas hydrates by liquid carbon dioxide injection into a porous stratum. Thermophys. Aeromech. 2020, 27, 831–838. [Google Scholar] [CrossRef]
  5. Sloan, E.D. Fundamental principles and applications of natural gas hydrates. Nature 2003, 426, 353–359. [Google Scholar] [CrossRef] [PubMed]
  6. Bai, Y.H.; Li, Q.P.; Zhao, Y.; Li, X.F.; Du, Y. The experimental and numerical studies on gas production from hydrate reservoir by depressurization. Transp. Porous Media 2009, 79, 443–468. [Google Scholar] [CrossRef]
  7. Ge, Y.; Wang, L.; Song, Y.C. Large-scale experimental study on marine hydrate-based CO2 sequestration. Energy 2024, 312, 133649. [Google Scholar] [CrossRef]
  8. Solomon, E.A.; Spivack, A.J.; Kastner, M.; Torres, M.E.; Robertson, G. Gas hydrate distribution and carbon sequestration through coupled microbial methanogenesis and silicate weathering in the Krishna–Godavari Basin, offshore India. Mar. Pet. Geol. 2014, 58, 233–253. [Google Scholar] [CrossRef]
  9. Tian, Z.Y.; Jia, Y.G.; Zhu, J.J.; Chen, T.; Wang, H.; Ji, C.S.; Liu, C.; Lu, L.; He, M. Microseismic observations reveal that internal waves intensify seabed methane release. Sci. China Earth Sci. 2024, 67, 3186–3203. [Google Scholar] [CrossRef]
  10. Li, Q.; Wang, F.; Wu, J.; Li, Q.; Zhang, G. Multivariate coupling model and reservoir characteristics of enhanced geothermo reservoirs. Energies 2026, 19, 3180. [Google Scholar] [CrossRef]
  11. Huang, L.; Kang, J.L.; Bu, Q.T.; Meng, Q.G.; Liu, C.L.; Wu, N.Y. Experimental investigation of hydrate production via deep depressurization using a large-scale laboratory reactor. Energy Fuels 2023, 37, 2799–2810. [Google Scholar] [CrossRef]
  12. Lu, C.; Qin, X.W.; Yu, L.; Geng, L.T.; Mao, W.J.; Bian, H.; Meng, F. The characteristics of gas-water two-phase radial flow in clay-silt sediment and effects on hydrate production. Geofluids 2021, 2021, 6623802. [Google Scholar] [CrossRef]
  13. Song, Y.C.; Cheng, C.X.; Zhao, J.F.; Zhu, Z.H.; Liu, W.G.; Yang, M.J.; Xue, K. Evaluation of gas production from methane hydrates using depressurization, thermo stimulation and combined methods. Appl. Energy 2015, 145, 265–277. [Google Scholar] [CrossRef]
  14. Zhao, J.F.; Zhu, Z.H.; Song, Y.C.; Liu, W.G.; Zhang, Y.; Wang, D.Y. Analyzing the process of gas production for natural gas hydrate using depressurization. Appl. Energy 2015, 142, 125–134. [Google Scholar] [CrossRef]
  15. Zhang, G.; Li, J.; Yang, H.W.; Huang, H.L.; Liu, G.H.; Wang, B.; Chen, M. Parameter optimization for natural gas hydrate solid fluidization. Phys. Fluids 2024, 36, 123357. [Google Scholar] [CrossRef]
  16. Yamamoto, K.; Ruppel, C. Preface to the special issue on gas hydrate drilling in the Eastern Nankai Trough. Mar. Pet. Geol. 2015, 66, 295. [Google Scholar] [CrossRef]
  17. Giunti, S.; Bojanowski, M.J. Glendonites as proxy for gas hydrate in paleoseeps: Evidence from the Outer Carpathians (Poland). Geol. Soc. Am. Bull. 2025, 137, 2999–3010. [Google Scholar] [CrossRef]
  18. Xiao, C.W.; Li, X.S.; Li, G.; Yu, Y.; Yu, J.X.; Lv, Q.N. Numerical analysis of production behaviors and permeability characteristics on the second gas hydrate production test in the South China Sea. Energy Fuels 2022, 36, 10960–10974. [Google Scholar] [CrossRef]
  19. Ye, J.L.; Qin, X.W.; Qiu, H.J.; Xie, W.W.; Lu, H.F.; Lu, C.; Zhou, J.; Liu, J.; Yang, T.; Cao, J.; et al. Data report: Molecular and isotopic compositions of the extracted gas from China’s first offshore natural gas hydrate production test in South China Sea. Energies 2018, 11, 2793. [Google Scholar] [CrossRef]
  20. Yang, J.Y.; Liu, Y.Z.; Xu, Q.H.; Liu, Z.Y.; Dai, X.Y.; Shi, L.; Luo, K.H. Pore-scale visualization of hydrate dissociation and mass transfer during depressurization using microfluidic experiments. Fuel 2024, 368, 131519. [Google Scholar] [CrossRef]
  21. Wang, Y.; Feng, J.C.; Li, X.S.; Zhang, Y.; Chen, Z.Y. Large-scale experimental investigation on influences of reservoir temperature and production pressure on gas production from methane hydrate in sandy sediment. Energy Fuels 2016, 30, 2760–2770. [Google Scholar] [CrossRef]
  22. Li, N.; Sun, Z.F.; Sun, C.Y.; Li, P.; Chen, G.J.; Ma, Q.L.; Liu, B. Simulating natural hydrate formation and accumulation in sediments from dissolved methane using a large three-dimensional simulator. Fuel 2018, 216, 612–620. [Google Scholar] [CrossRef]
  23. Li, Q.; Li, Q.; Wu, J.; He, K.; Xia, Y.; Liu, J.; Wang, F.; Cheng, Y. Wellhead Stability During Development Process of Hydrate Reservoir in the Northern South China Sea: Sensitivity Analysis. Processes 2025, 13, 1630. [Google Scholar] [CrossRef]
  24. Wang, Y.; Kou, X.; Feng, J.C.; Li, X.S.; Zhang, Y. Sediment deformation and strain evaluation during methane hydrate dissociation in a novel experimental apparatus. Appl. Energy 2020, 262, 114397. [Google Scholar] [CrossRef]
  25. Ma, Y.R.; Zhong, X.P.; Li, X.T.; Nie, S.S.; Li, Q.C.; Tu, G.G.; Chen, C. Numerical simulation of gas extraction from marine hydrate sediments using sodium chloride injection. Fuel 2023, 342, 127910. [Google Scholar] [CrossRef]
  26. Yousif, M.H.; Abass, H.H.; Selim, M.S.; Sloan, E.D. Experimental and theoretical investigation of methane-gas-hydrate dissociation in porous media. SPE Reserv. Eng. 1991, 6, 69–76. [Google Scholar] [CrossRef]
  27. Vanoudheusden, E.; Sultan, N.; Cochonat, P. Mechanical behaviour of unsaturated marine sediments: Experimental and theoretical approaches. Mar. Geol. 2004, 213, 323–342. [Google Scholar] [CrossRef]
  28. Bai, C.Y.; Su, P.B.; Su, X.; Cui, H.P.; Shang, W.; Han, S.J.; Zhang, G. Characterization of the sediments in a gas hydrate reservoir in the northern South China Sea: Implications for gas hydrate accumulation. Mar. Geol. 2022, 453, 106912. [Google Scholar] [CrossRef]
  29. Muraoka, M.; Yamamoto, Y.; Tenma, N. Simultaneous measurement of water permeability and methane hydrate pore habit using a two-dimensional glass micromodel. J. Nat. Gas Sci. Eng. 2020, 77, 103279. [Google Scholar] [CrossRef]
  30. Seol, Y.; Kneafsey, T.J. X-ray computed-tomography observations of water flow through anisotropic methane hydrate-bearing sand. J. Pet. Sci. Eng. 2009, 66, 121–132. [Google Scholar] [CrossRef]
  31. Zhao, J.H.; Liu, C.L.; Chen, Q.; Zou, C.C.; Liu, Y.; Bu, Q.T.; Kang, J.; Meng, Q. Experimental investigation into three-dimensional spatial distribution of the fracture-filling hydrate by electrical property of hydrate-bearing sediments. Energies 2022, 15, 3537. [Google Scholar] [CrossRef]
  32. Chen, H.D.; Zhao, J.; Liang, Q.Y.; Li, C.J.; Feng, J.X.; Xiao, X.; Chen, Z.; Li, Y.; Xiong, Y. Methane clumped isotopes of shallow gas hydrates in the Haima cold seeps, South China Sea: Implications for marine carbon cycling and sequestration. Mar. Pet. Geol. 2025, 180, 107449. [Google Scholar] [CrossRef]
  33. Li, B.; Sun, Y.H.; Guo, W.; Shan, X.L.; Wang, P.K.; Pang, S.J.; Jia, R.; Zhang, G. The mechanism and verification analysis of permafrost-associated gas hydrate formation in the Qilian Mountain, Northwest China. Mar. Pet. Geol. 2017, 86, 787–797. [Google Scholar] [CrossRef]
  34. Wang, L.J.; Wang, P.; Zhu, B.; Kong, D.Q.; Wang, X.B.; Chen, Y.M. Physical modeling of hydrate dissociation in sandy sediment by depressurization under hypergravity and normal gravity conditions. J. Geotech. Geoenviron. Eng. 2024, 150, 04024096. [Google Scholar] [CrossRef]
  35. Xie, Y.; Feng, J.C.; Chen, X.Y.; Wang, J.W.; Xu, L.H.; Zhou, Z.W.; Wang, B.; Wang, Y.; Zhang, S.; Yang, Z. CH4 hydrate dissociation and CH4 leakage characteristics: Insights from laboratory investigation based on stratified environment reconstruction of natural gas hydrate reservoir. Renew. Sustain. Energy Rev. 2024, 206, 114891. [Google Scholar] [CrossRef]
  36. Wan, K.; Li, X.S.; Wang, Y.; Li, X.Y.; Kou, X.; Hu, H.Q.; Zhang, Y. Pilot-scale experimental investigation of multifield coupling and heterogeneity during hydrate dissociation. Energy Fuels 2021, 35, 7967–7980. [Google Scholar] [CrossRef]
  37. Yuan, Y.L.; Gong, Y.; Xu, T.F.; Zhu, H.X. Multiphase flow and geomechanical responses of interbedded hydrate reservoirs during depressurization gas production for deepwater environment. Energy 2023, 262, 125603. [Google Scholar] [CrossRef]
  38. Ruan, X.K.; Xu, C.G.; Yan, K.F.; Li, X.S. Experimental and modeling study of kinetics for hydrate dissociation induced by depressurization in a porous medium. Front. Energy Res. 2021, 9, 779635. [Google Scholar] [CrossRef]
  39. Liu, T.; Wu, P.; Chen, Z.R.; Li, Y.H. Review on carbon dioxide replacement of natural gas hydrate: Research progress and perspectives. Energy Fuels 2022, 36, 7321–7336. [Google Scholar] [CrossRef]
  40. Shi, K.J.; Wei, R.P.; Guo, X.W.; Li, Q.P.; Lv, X.; Fan, Q.; Dong, H.; Yang, L.; Zhao, J.; Song, Y. Enhancing gas production from hydrate-bearing reservoirs through depressurization-based approaches: Knowledge from laboratory experiments. Energy Fuels 2021, 35, 6344–6358. [Google Scholar] [CrossRef]
  41. Wan, T.H.; Li, Z.Z.; Yu, Y.J.; Liang, Q.Y.; Lu, H.F.; Wang, J.L. Depressurization-induced gas production from hydrate reservoirs in the Shenhu sea area using horizontal well: Numerical simulation on horizontal well section deployment for gas production enhancement. Front. Earth Sci. 2023, 11, 1137217. [Google Scholar] [CrossRef]
  42. Rutqvist, J.; Moridis, G.J.; Grover, T.; Silpngarmlert, S.; Collett, T.S.; Holdich, S.A. Coupled multiphase fluid flow and wellbore stability analysis associated with gas production from oceanic hydrate-bearing sediments. J. Petrol. Sci. Eng. 2012, 92–93, 65–81. [Google Scholar] [CrossRef]
  43. Moridis, G.J.; Reagan, M.T.; Queiruga, A.F.; Boswell, R. Evaluation of the performance of the oceanic hydrate accumulation at site NGHP-02-09 in the Krishna–Godavari Basin during a production test and during single and multi-well production scenarios. Mar. Pet. Geol. 2019, 108, 660–696. [Google Scholar] [CrossRef]
  44. Konno, Y.; Fujii, T.; Sato, A.; Akamine, K.; Naiki, M.; Masuda, Y.; Yamamoto, K.; Nagao, J. Key findings of the world’s first offshore methane hydrate production test off the coast of Japan: Toward future commercial production. Energy Fuels 2017, 31, 2607–2616. [Google Scholar] [CrossRef]
  45. Guan, D.; Shi, K.J.; Guo, X.W.; Jia, Y.X.; Zhang, L.X.; Yang, L.; Zhao, J.; Song, Y. Progress on laboratory-scale reactors for simulating gas production from hydrate reservoir. Energy Fuels 2021, 35, 16416–16431. [Google Scholar] [CrossRef]
  46. Wang, L.B.; Wang, X.H.; Bu, Y.H.; Xu, Z.B.; Sun, X.; Sun, Y.F.; Xiao, P.; Li, Q.-P.; Zhou, S.-W.; Linga, P.; et al. Development and feasibility test of a fan-shaped hydrate simulator with a radius of 3 m. Pet. Sci. 2025, 22, 4794–4808. [Google Scholar] [CrossRef]
  47. Heeschen, K.U.; Abendroth, S.; Priegnitz, M.; Spangenberg, E.; Thaler, J.; Schicks, J.M. Gas production from methane hydrate: A laboratory simulation of the multistage depressurization test in Mallik, Northwest Territories, Canada. Energy Fuels 2016, 30, 6210–6219. [Google Scholar] [CrossRef]
  48. Priegnitz, M.; Thaler, J.; Spangenberg, E.; Rücker, C.; Schicks, J.M. A cylindrical electrical resistivity tomography array for three-dimensional monitoring of hydrate formation and dissociation. Rev. Sci. Instrum. 2013, 84, 104502. [Google Scholar] [CrossRef] [PubMed]
  49. Nagao, J. Development of methane hydrate production method—A large-scale laboratory reactor for methane hydrate production tests. Synthesiology 2012, 5, 89–97. [Google Scholar] [CrossRef]
  50. Ge, Y.; Li, Q.P.; Lv, X.; Chen, M.Q.; Yang, B.; Song, B.J.; Zhao, J.; Song, Y. A large-scale experimental simulator for natural gas hydrate recovery and its experimental applications. Petroleum 2023, 9, 607–612. [Google Scholar] [CrossRef]
  51. ASTM D2487-17; Standard Practice for Classification of Soils for Engineering Purposes (Unified Soil Classification System). ASTM International: West Conshohocken, PA, USA, 2017.
  52. Li, Y.H.; Li, J.Y.; You, Z.S.; Wu, P.; Qu, Y.; Zhang, A.; Sun, X.; Song, Y. A particle-scale investigation of mechanical behavior of cemented hydrate-bearing sediment using Discrete Element Method. Geomech. Energy Environ. 2023, 33, 100436. [Google Scholar] [CrossRef]
  53. Ndlovu, P.; Babaee, S.; Naidoo, P. Review on CH4-CO2 replacement for CO2 sequestration and CH4/CO2 hydrate formation in porous media. Fuel 2022, 320, 123795. [Google Scholar] [CrossRef]
  54. Rossi, A.; Ciulla, M.; Canale, V.; Zannotti, M.; Minicucci, M.; Di Profio, P.; Giovannetti, R. Constant pressure CO2 replacement of CH4 in different hydrate environments: Structure and morphology. Energy Fuels 2023, 37, 18968–18976. [Google Scholar] [CrossRef]
  55. Tanaka, H.; Matsumoto, M.; Yagasaki, T. Efficiency and energy balance for substitution of CH4 in clathrate hydrates with CO2 under multiple-phase coexisting conditions. J. Chem. Phys. 2023, 159, 194504. [Google Scholar] [CrossRef] [PubMed]
  56. Li, Q.; You, D.; Li, Q.; Wang, F.; Wang, Y.; Yang, Y. Analysis of sedimentation behavior and influencing factors of solid particles in CO2 fracturing fluid. Processes 2025, 13, 4049. [Google Scholar] [CrossRef]
  57. Zhao, G.J.; Yang, M.J.; Lv, X.; Zheng, J.N.; Song, Y.C. MRI insight on multiphase flow in hydrate-bearing sediment and development mechanism of hydrate seal. Pet. Sci. 2023, 20, 3854–3864. [Google Scholar] [CrossRef]
  58. Song, X.; Zhang, T.; Liu, J.; Cheng, J.; Yuan, L.; Li, Y. Investigating the mechanism of hydrate-based CO2 sequestration in marine sediments: A large-scale experimental simulation approach. Int. J. Greenh. Gas Control 2026, 153, 104662. [Google Scholar] [CrossRef]
  59. Liu, Y.; Chen, Q.; Li, S.Z.; Wang, X.J.; Zhao, J.H.; Zou, C.C. Characterizing spatial distribution of ice and methane hydrates in sediments using cross-hole electrical resistivity tomography. Gas Sci. Eng. 2024, 128, 205378. [Google Scholar] [CrossRef]
  60. Chen, Q.; Wu, N.Y.; Liu, C.L.; Zou, C.C.; Liu, Y.; Sun, J.Y.; Li, Y.; Hu, G. Research progress on global marine gas hydrate resistivity logging and electrical property experiments. J. Mar. Sci. Eng. 2022, 10, 645. [Google Scholar] [CrossRef]
  61. Li, F.G.; Sun, C.Y.; Li, S.L.; Chen, G.J.; Guo, X.Q.; Yang, L.Y.; Pan, H.; Li, S.; Zhang, K. Experimental studies on the evolvement of electrical resistivity during methane hydrate formation in sediments. Energy Fuels 2012, 26, 6210–6217. [Google Scholar] [CrossRef]
Figure 1. Schematic diagram of the hydrate simulation apparatus.
Processes 14 02509 g001
Figure 2. Illustration of the high-pressure reactor.
Processes 14 02509 g002
Figure 3. Sensor layout diagram.
Processes 14 02509 g003
Figure 4. Particle size distribution of sand.
Processes 14 02509 g004
Figure 5. Preparation process of simulated reservoir. (a) Sand filling. (b) Layer-by-layer compaction. (c) Sealing cover installation.
Processes 14 02509 g005
Figure 6. Back pressure reduction path curve.
Processes 14 02509 g006
Figure 7. Temperature–pressure response of the model during hydrate dissociation.
Processes 14 02509 g007
Figure 8. Whole-process temperature and pressure curves. (a) Upper layer. (b) Middle layer. (c) Lower layer.
Processes 14 02509 g008
Figure 9. Temperature distribution nephogram at different time points. (a) t = 1000 min. (b) t = 2500 min. (c) t = 4000 min. (d) t = 4500 min. (e) t = 5500 min. (f) t = 7000 min.
Processes 14 02509 g009
Figure 12. Layered nephogram of pore pressure distribution at different times: (a) upper layer; (b) middle layer; (c) lower layer.
Processes 14 02509 g012
Figure 13. Nephogram showing electrical resistivity distribution at different time points. (a) t = 1000 min. (b) t = 2500 min. (c) t = 4000 min. (d) t = 4500 min. (e) t = 5500 min. (f) t = 7000 min.
Processes 14 02509 g013
Figure 14. Layered nephogram showing electrical resistivity distribution at different time points: (a) upper layer; (b) middle layer; (c) lower layer.
Processes 14 02509 g014
Figure 15. Gas production process during hydrate dissociation.
Processes 14 02509 g015
Figure 16. Stratum mechanical response during hydrate dissociation.
Processes 14 02509 g016
Figure 17. Mechanism diagram of multi-field coupling for hydrate dissociation.
Processes 14 02509 g017
Table 1. Comparison of representative large-scale hydrate experimental systems.
Experimental SystemSample GeometryEffective Sample
Volume
Main Monitoring Parameters
Pilot-Scale Hydrate Simulator (PHS) [21,36]Φ0.50 m × 0.60 m117.8 LTemperature, pressure, electrical resistivity, and fluid production
Fan-Shaped Hydrate Simulator (FCHS) [46]6° sector
radius 3.0 m
height 0.30 m
142 LTemperature, pressure, and P-wave velocity
Three-Dimensional Hydrate Simulator (TDHS) [22]Φ0.50 m × 1.00 m196 LTemperature, pressure, and electrical/acoustic responses
Large-Scale Reservoir Simulator (LARS) [47,48]Φ0.46 m × 1.30 m210 L
(425 L total reactor)
Temperature, pressure, electrical resistivity, and fluid production
Field-Like Hydrate System (FLYS) [11]Φ0.60 m × 1.00 m282.6 L
(521 L total reactor)
Temperature, pressure, and gas/water/sand production
High-Pressure Giant Unit for Methane Hydrate Analysis (HIGUMA) [49]Φ1.00 m × 1.00 m810 L
(1710 L total system)
Temperature, pressure, and fluid production
Large-Scale Hydrate Recovery Simulator (LHRS) [50]Φ1.20 m × 1.50 m600 L (1700 L reactor)Temperature, pressure, and multiwell fluid migration
Present apparatusΦ1.00 m × 1.50 m1178 LTemperature, pressure, electrical resistivity, gas production, and vertical displacement
Table 2. Sand packing data for the experimental model.
PropertiesValueUnit
Particle size distribution
d10105.4μm
d30137.0μm
d50165.2μm
d60180.8μm
Uniformity coefficient Cu (Cu = d60/d10)1.72-
Curvature coefficient Cc (Cc = d302/(d60 × d10))0.985-
Built-in model
Apparent density1.32g/cm3
Apparent volume1178L
Pore volume629L
Porosity53.4%
Disclaimer/Publisher’s Note: The statements, opinions and data contained in all publications are solely those of the individual author(s) and contributor(s) and not of MDPI and/or the editor(s). MDPI and/or the editor(s) disclaim responsibility for any injury to people or property resulting from any ideas, methods, instructions or products referred to in the content.