Article

Response Surface Optimization of Apple Powder Incorporation and Processing Conditions for Improving the Quality of Whipped Yeast-Free Frozen Dough and Bread

Faculty of Food Technology, Almaty Technological University, Almaty 050012, Kazakhstan
*
Author to whom correspondence should be addressed.
Processes 2026, 14(15), 2500; https://doi.org/10.3390/pr14152500
Submission received: 2 June 2026 / Revised: 28 July 2026 / Accepted: 31 July 2026 / Published: 4 August 2026
(This article belongs to the Section Food Process Engineering)

Abstract

Mechanically aerated yeast-free dough is particularly susceptible to freeze–thaw damage because its porous structure is formed before freezing and cannot be restored during thawing due to the absence of fermentation. This study investigated the combined effects of apple powder incorporation and technological processing conditions on the rheological, structural, physicochemical, nutritional, and sensory properties of whipped yeast-free frozen dough and the resulting bread. Apple powder was incorporated at three formulation levels (50, 100, and 150 g per batch), while whipping speed (450–900 rpm), whipping time (3–7 min), freezing temperature (−14 to −38 °C), and microwave thawing time (4–8 min) were optimized using response surface methodology based on a Draper–Lin composite design. Dough properties were evaluated using Mixolab analysis and structural–mechanical measurements, whereas bread quality was assessed by specific volume, porosity, physicochemical characteristics, biochemical composition, amino acid profile, microbiological safety, and sensory evaluation. The developed regression models adequately described the effects of technological variables on dough quality (R2 > 0.95). Deep freezing at −38 °C followed by 4 min of microwave thawing minimized structural deterioration and improved dough stability after freeze–thaw treatment. Apple powder increased the nutritional value of the bread by enhancing the dietary fiber (4.8–7.3%), potassium (125.6–156.7 mg/100 g), iron (2.45–3.20 mg/100 g), and vitamin C (0–2.2 mg/100 g) contents. Although the highest level of apple powder provided the greatest nutritional enrichment, it also reduced the dough rheological stability and produced a less homogeneous crumb structure. Overall, the formulation containing 100 g of apple powder per batch combined with a whipping speed of 900 rpm, whipping time of 7 min, freezing at −38 °C, and microwave thawing for 4 min provided the best balance between rheological stability, freeze–thaw resistance, bread quality, nutritional enhancement, microbiological stability, and sensory acceptability. These findings demonstrate that simultaneous optimization of formulation and processing conditions is an effective strategy for improving mechanically aerated yeast-free frozen bakery products and provides a scientific basis for the development of functional frozen bread technologies.

1. Introduction

Frozen dough technology has become an integral part of industrial bakery production because it separates dough preparation from baking, facilitates centralized manufacturing, and improves the flexibility of product distribution in retail and food-service systems [1,2]. Nevertheless, maintaining the structural stability of frozen dough during storage remains a major technological challenge. Freeze–thaw cycles alter the balance between water, gluten, and starch, resulting in reduced gas retention, deterioration of dough handling properties, and lower bread quality.
Structural deterioration during frozen storage is mainly associated with ice crystal formation, redistribution of unfrozen water, and progressive weakening of the gluten–starch matrix. As water freezes, the concentration of the remaining unfrozen phase increases, molecular mobility changes, and the viscoelastic network is subjected to mechanical and osmotic stresses. Consequently, frozen dough gradually loses elasticity, structural continuity, and its ability to maintain a stable porous structure after thawing [1,2,3].
The extent of these changes strongly depends on processing conditions. Rapid freezing generally restricts the growth of large ice crystals, whereas slow freezing promotes water migration and more severe structural disruption [4,5]. Likewise, thawing conditions considerably influence the recovery of dough structure. Microwave thawing offers a rapid alternative to conventional thawing; however, uncontrolled microwave energy may produce non-uniform heating, local overheating, and undesirable modifications of dough components [5]. Therefore, freezing and thawing should be considered as interconnected stages of a single technological process rather than as independent operations.
These problems are particularly critical for mechanically aerated yeast-free dough systems. Unlike conventional yeast-leavened dough, where fermentation after thawing can partially restore gas cells and dough structure, whipped yeast-free dough relies entirely on the stability of mechanically incorporated air cells formed before freezing [6,7,8]. Since no fermentation occurs after thawing, the quality of the final product depends directly on the ability of the dough matrix to preserve both water distribution and the integrity of entrapped air cells throughout frozen storage.
Various cryoprotective strategies have been proposed to improve the freeze–thaw stability of dough, including the incorporation of hydrocolloids, proteins, and plant-derived polysaccharides [9,10,11,12]. Dietary fiber has attracted particular attention because of its high water-binding capacity, which may reduce the mobility of free water and partially stabilize dough during freezing and thawing. However, excessive fiber addition may interfere with gluten development, increase dough density, and reduce extensibility because of competition for water and the disruption of gluten network continuity [13,14,15]. Consequently, the technological effect of dietary fiber depends not only on its concentration, but also on its particle size, chemical composition, hydration behavior, and interactions with the dough matrix.
Among the plant-derived fiber sources, apple powder represents a particularly promising ingredient because it combines pectin-rich dietary fiber with organic acids, phenolic compounds, vitamins, and mineral components that can simultaneously improve nutritional value and modify dough functionality [16]. Compared with many other fruit powders, apple powder possesses a high content of soluble pectin capable of binding water, reducing the amount of freezable water, and stabilizing the gluten–starch matrix during freeze–thaw treatment. In addition, apple-derived phenolic compounds exhibit antioxidant activity, while its natural organic acids may contribute to microbiological stability and flavor development. Previous studies have demonstrated that moderate incorporation of apple-derived ingredients can improve dough viscoelasticity and water retention, whereas excessive addition may adversely affect gluten structure and bread quality [9,10]. In mechanically aerated dough systems, these effects become even more important because apple components influence not only water immobilization, but also the stability of the thin protein films surrounding mechanically incorporated air bubbles [17,18].
Despite increasing interest in frozen bakery technologies and fiber-enriched products, research on whipped yeast-free frozen dough remains limited, particularly under conditions where formulation variables and technological processing parameters act simultaneously. Most previous studies have investigated conventional yeast-leavened dough, individual freezing or thawing parameters, or the incorporation of plant fibers into fresh dough systems [5,13,14,15,19,20,21]. Although these investigations have considerably improved our understanding of gluten weakening, water migration, and fiber–gluten interactions during frozen storage, they do not adequately explain the behavior of mechanically aerated yeast-free dough, whose porous structure depends entirely on the stability of pre-formed air cells rather than post-thaw fermentation.
Furthermore, no comprehensive study has simultaneously evaluated the combined influence of apple powder incorporation, whipping conditions, freezing temperature, and microwave thawing using response surface methodology while integrating rheological, structural, physicochemical, nutritional, and microbiological quality characteristics. This represents the principal research gap addressed in the present study [22,23,24].
Therefore, the novelty of this work lies in the integrated optimization of both formulation and technological processing parameters for mechanically aerated yeast-free frozen dough using response surface methodology. The study combines Mixolab rheological analysis, structural–mechanical characterization, physicochemical evaluation, nutritional assessment, and laboratory baking tests to establish quantitative relationships between processing conditions, dough stability, and bread quality.
Accordingly, the objective of this study was to investigate the combined effects of apple powder incorporation, whipping conditions, freezing temperature, and microwave thawing on the rheological, structural, physicochemical, nutritional, and baking characteristics of mechanically aerated yeast-free frozen dough and to identify the optimal technological conditions for producing high-quality frozen bakery products.

2. Materials and Methods

2.1. Materials and Sample Preparation

First-grade wheat flour complying with GOST 26574–2017 [25] was used as the main raw material. Food-grade sodium chloride (GOST 13830–97 [26]), food-grade citric acid, and potable water were used for dough preparation.
Apple powder was prepared from fresh dessert apples (Malus domestica Borkh., cultivar “Golden Delicious”), harvested at commercial maturity during the 2024 growing season in the Almaty region (Kazakhstan). Fruits free from visible defects were washed with potable water, manually cored, and sliced into 4–5 mm thick slices without chemical pretreatment.
The slices were dried at 50–55 °C in a forced-air convection dryer (Model HKN-DHD10, Hurakan, Guangzhou, China) until constant weight corresponding to a final moisture content of 5.2 ± 0.2%. The dried material was milled using a laboratory grinder (Model GM-H100, Infitek Co., Ltd., Shanghai, China) and passed through a 250 μm sieve, producing a homogeneous fine powder suitable for uniform incorporation into dough systems. The mean particle size of the obtained apple powder was approximately 180–220 μm. The chemical composition of the apple powder is presented in Table 1.
All analyses were performed in triplicate. Moisture, protein, ash, dietary fiber, vitamins, and mineral contents were determined according to the corresponding AOAC standard methods.
Four dough formulations were prepared: a control formulation without apple powder and three formulations containing apple powder. Apple powder was incorporated by partial replacement of wheat flour at nominal levels of 5%, 10%, and 15% of flour weight (corresponding to 50, 100, and 150 g of apple powder per 950 g wheat flour, respectively). The formulation percentages therefore refer to the replacement level of wheat flour rather than the total dry matter of the formulation, following the approach commonly used in bakery technology.
The basic dough formulation consisted of 950 g wheat flour, 15 g sodium chloride, 5 g citric acid, and water. Water addition was adjusted to compensate for the increased water absorption of apple powder and amounted to 880, 820, and 780 g, respectively.
All experiments were carried out at the Research Institute of Food Safety and the Research Institute of Food Technologies, Almaty Technological University (Almaty, Kazakhstan). The formulation of whipped yeast-free dough containing apple powder is presented in Table 2.
Table 2. Formulation of whipped yeast-free dough containing apple powder.
Ingredient (g)150 g AP
Ingredient (g)Control50 g AP100 g AP150 g AP
First-grade wheat flour950950950950
Apple powder (AP)050100150
Salt15151515
Citric acid5555
The experimental design was developed using a Draper–Lin small composite response surface design (RSM). Preliminary screening experiments were performed to establish the practical ranges of whipping speed, whipping time, freezing temperature, and microwave thawing time while excluding technologically insignificant factor levels.
The experimental matrix consisted of 16 factorial and axial design points together with two replicated center points, giving a total of 18 experimental runs. The center-point replicates were included to estimate pure experimental error and verify model reproducibility.
Apple powder level was considered an independent formulation variable, whereas whipping speed, whipping time, freezing temperature, and microwave thawing time were treated as technological processing factors. The response surface analysis was subsequently performed to quantify the combined influence of these variables on dough rheology, structural stability, physicochemical characteristics, and bread quality. The actual processing conditions used in the experiments are summarized in Table 3.
The processing conditions applied to the whipped frozen dough samples are summarized in Table 3. Selected experimental variants were repeated under identical conditions to ensure reproducibility of the results.

2.2. Dough Processing and Experimental Design

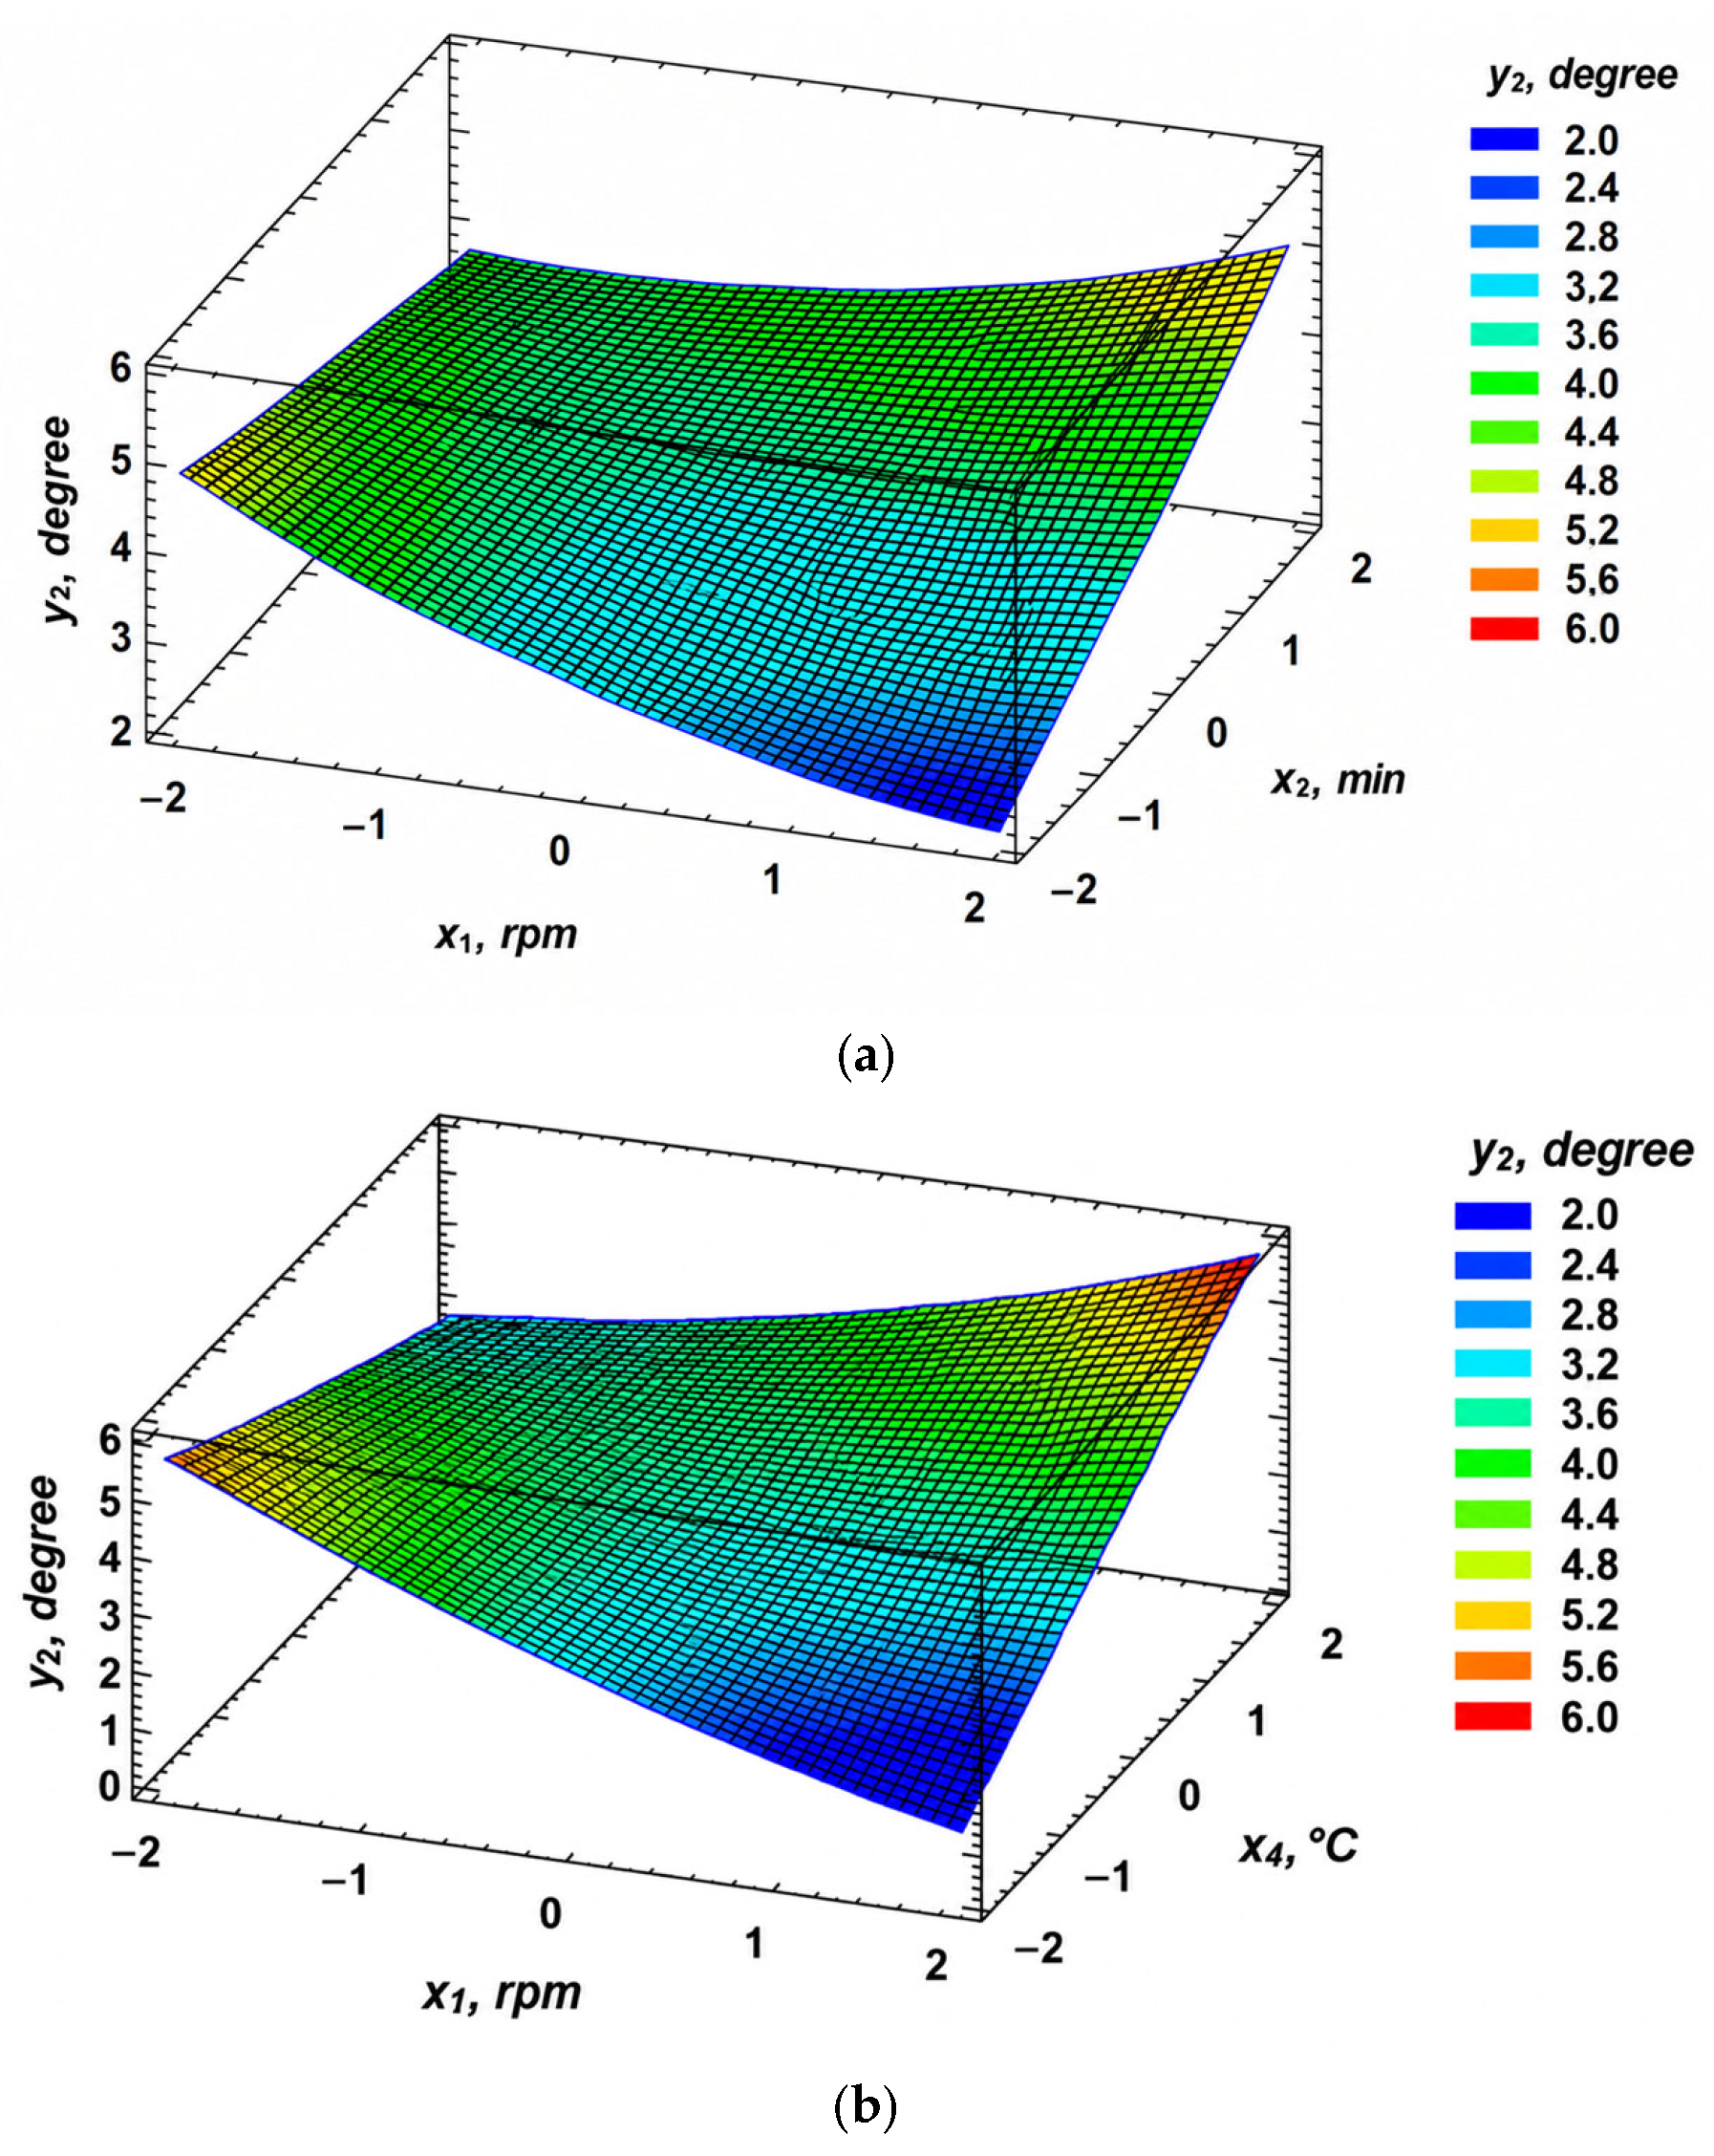
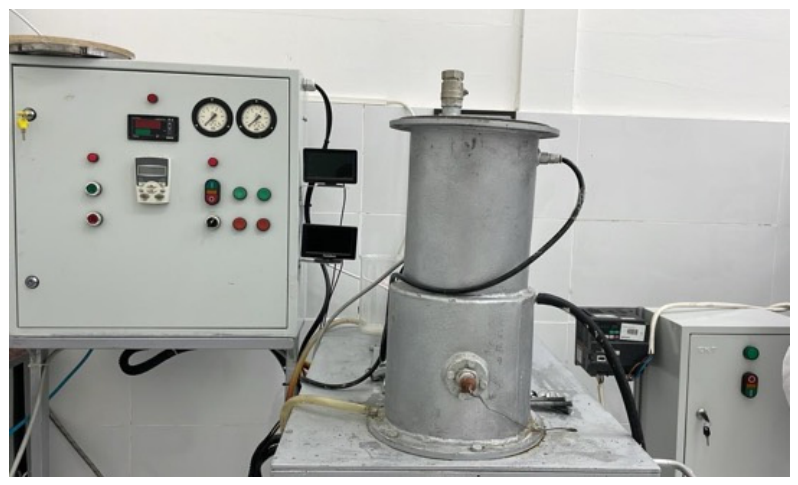
The preparation of mechanically aerated yeast-free dough was carried out using a laboratory whipping apparatus (Voronezh State University of Engineering Technologies, Voronezh, Russia) specifically designed for the production of whipped dough systems (Figure 1). The apparatus provided controlled mechanical aeration of the dough by regulating whipping speed and processing time, thereby ensuring reproducible incorporation and stabilization of air bubbles before freezing.
The experimental program was developed using response surface methodology (RSM) based on a Draper–Lin small composite design, which enables the efficient modeling of nonlinear relationships while minimizing the number of experimental runs. The design was selected because it provides a reliable estimation of quadratic response surfaces for multivariable technological processes using a relatively small experimental matrix.
Prior to RSM optimization, preliminary screening experiments were conducted to determine the practical operating ranges of whipping speed, whipping time, freezing temperature, and microwave thawing time. Factor ranges were selected according to technological feasibility, equipment limitations, and the structural stability of mechanically aerated dough.
The independent processing variables included:
whipping speed (450–900 rpm);
whipping time (3–7 min);
freezing temperature (−14 to −38 °C);
microwave thawing time (4–8 min).
Apple powder level was treated as a formulation variable and was not included as an independent factor in the response surface optimization. Therefore, the optimization of technological parameters was performed separately for each dough formulation containing different levels of apple powder.
The experimental matrix consisted of 16 factorial and axial combinations generated according to the Draper–Lin design together with two replicated center-point experiments, giving a total of 18 experimental runs. The replicated center points were included to estimate pure experimental error, evaluate process reproducibility, and verify the adequacy of the regression models.
All regression models were developed using coded factor values. Second-order polynomial equations were fitted to the experimental data after eliminating statistically insignificant coefficients. Model adequacy was assessed by analysis of variance (ANOVA), coefficients of determination (R2 and adjusted R2), lack-of-fit tests, and residual analysis. The experimental design and the actual processing conditions are presented in Table 3.

2.3. Freezing, Thawing and Baking Procedures

After whipping, approximately 450 ± 10 g of dough was placed into rectangular baking molds (180 × 90 × 70 mm) and immediately transferred for freezing.
Shock freezing was performed in a MODI UP W5U blast freezer (Coldline Srl, Torreglia, Italy). Dough samples were frozen at either −14 °C or −38 °C, depending on the experimental design, until the core temperature reached −18 ± 1 °C, which was monitored using a calibrated thermocouple probe (Model TP-01, Testo SE & Co. KGaA, Lenzkirch, Germany) inserted into the geometric center of the dough. Frozen samples were subsequently stored at −18 ± 1 °C until thawing.
Microwave thawing was performed using a Samsung ME-88SUT/BW microwave oven (Samsung Electronics, Suwon, Republic of Korea) operating at 800 W and 2450 MHz. Frozen dough samples were thawed for either 4 or 8 min, according to the experimental design. During thawing, samples were positioned in the center of the rotating glass plate without protective covering to ensure uniform exposure to microwave radiation.
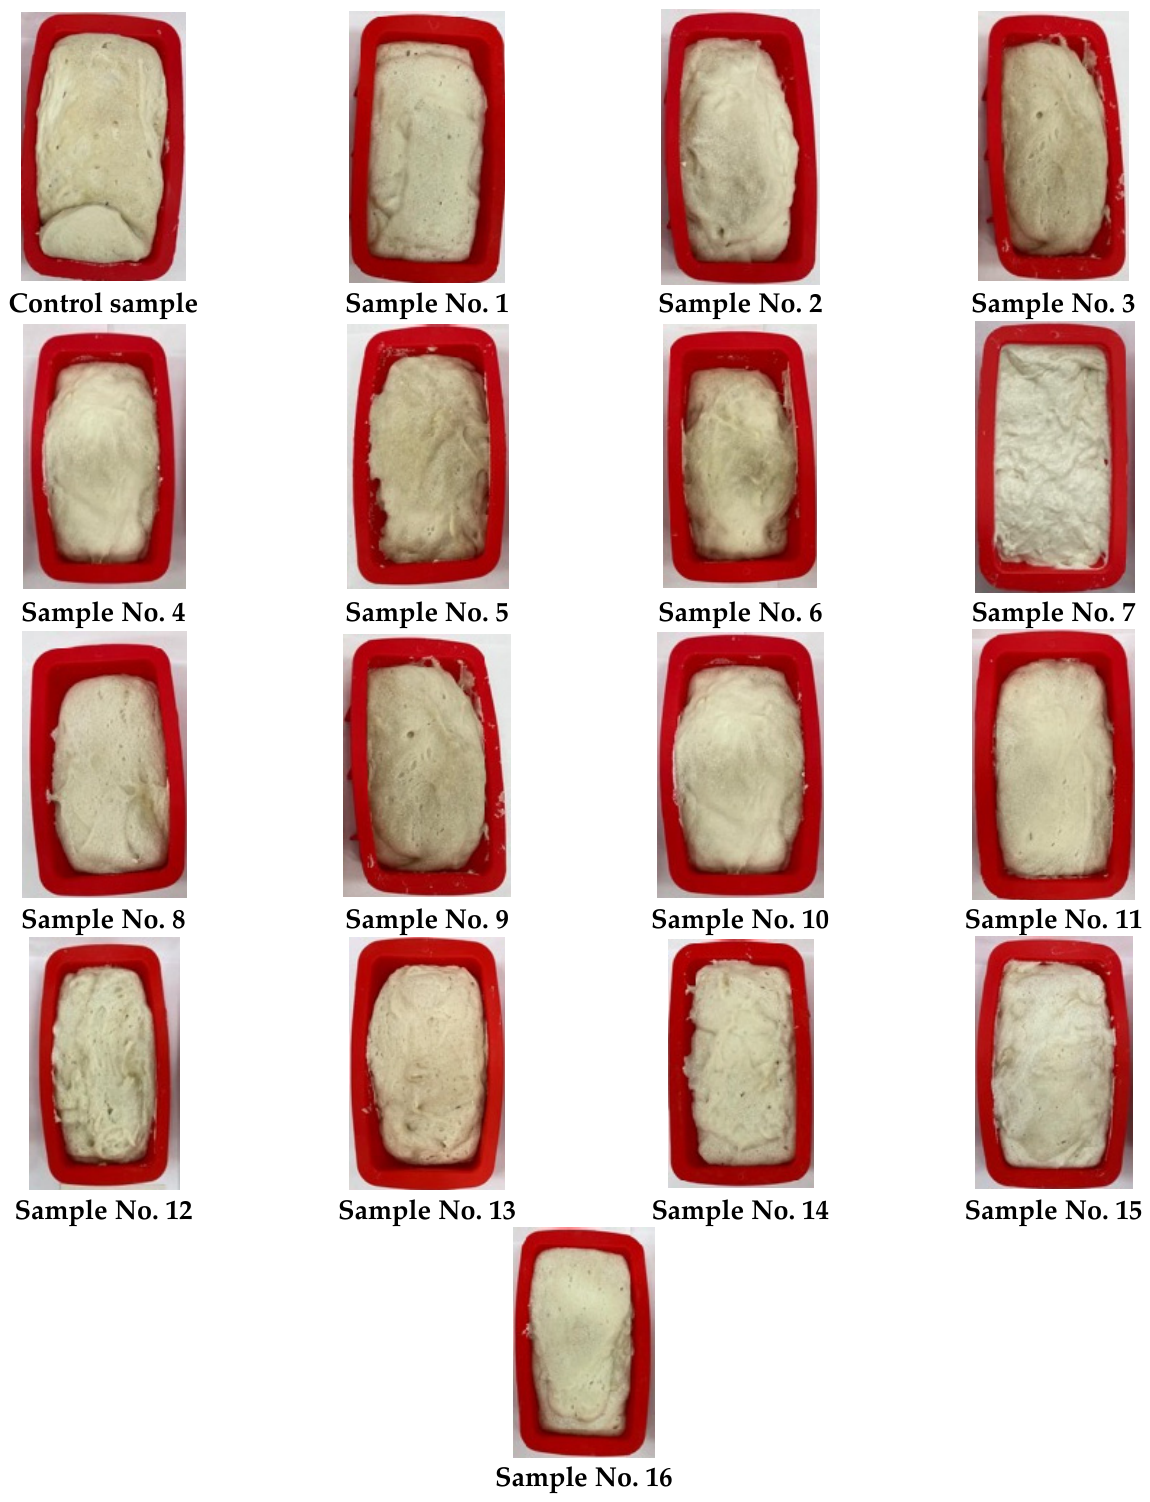
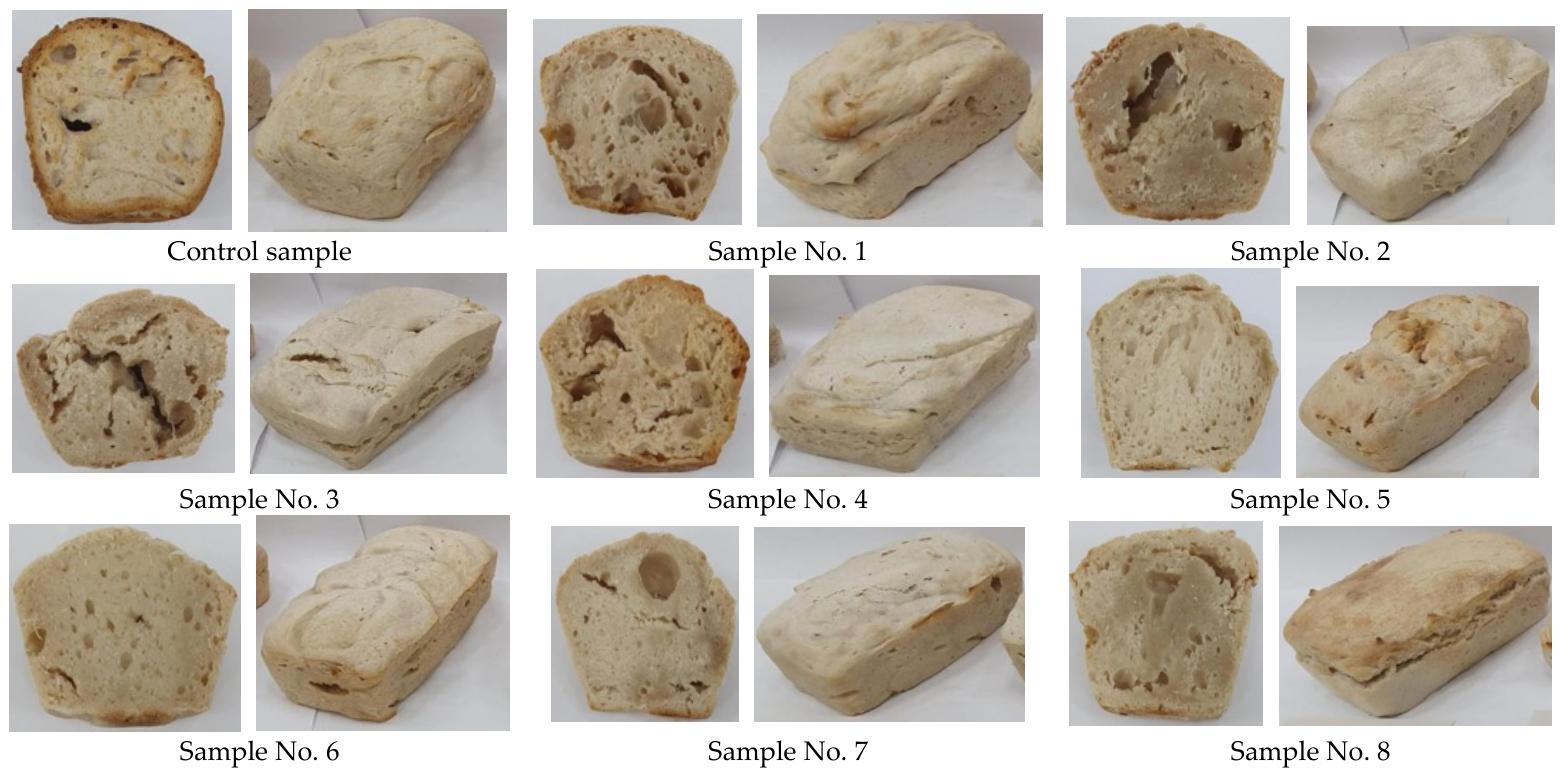
Immediately after microwave treatment, the internal temperature at the center of each dough sample was measured using a digital penetration thermometer (Testo 104-IR BT, Testo SE & Co. KGaA, Lenzkirch, Germany). The samples were subsequently equilibrated at 22 ± 2 °C for 10 min before further analysis and baking. Representative photographs of the control sample and all eighteen experimental dough samples (Samples 1–18) after microwave thawing are presented in Figure 2. The samples are arranged according to the experimental design described in Table 3, allowing for direct visual comparison of the effects of apple powder level, whipping speed, whipping time, freezing temperature, and microwave thawing time on dough structure before baking.
Baking was carried out in a laboratory rotary oven (LMO-E8) at 220 °C for 40 min. After baking, loaves were cooled at room temperature for 2 h before physicochemical, rheological, and sensory analyses.

2.4. Rheological and Structural Analysis

The thermo-mechanical properties of dough were determined using a Mixolab 2 analyzer (Chopin Technologies, Villeneuve-la-Garenne, France) according to AACC International Approved Method 54-60.02. Measurements were performed on thawed dough before baking to eliminate the influence of thermal processing.
For each determination, 75.0 ± 0.1 g of dough was analyzed under standard Mixolab conditions using a mixing speed of 80 rpm. The temperature program consisted of heating from 30 °C to 90 °C, followed by cooling to 50 °C.
The following parameters were recorded automatically:
water absorption;
dough development time;
dough stability;
protein weakening (C2);
starch gelatinization (C3);
cooking stability (C4);
starch retrogradation (C5).
Structural and textural properties of dough and bread crumb were evaluated using an ST-2 Structurometer (Quality Laboratory LLC, Moscow, Russia).
Cylindrical specimens were compressed to 50% deformation at 25 ± 1 °C using a crosshead speed of 1.0 mm s−1.
The following structural parameters were calculated from the force–deformation curves:
total deformation (H1, mm);
plastic deformation (H2, mm);
elastic deformation (H3, mm).
Each instrumental determination was performed in five independent replicates, and the results are expressed as mean ± standard deviation (M ± SD).
The measured rheological and structural responses were subsequently used as dependent variables (y1–yn) for regression modeling and response surface optimization.

2.5. Physicochemical, Biochemical and Mineral Composition Analysis

The physicochemical properties of bread were determined according to standardized analytical procedures. Moisture content and titratable acidity were measured according to GOST 21094–2022 [27] and GOST 5670–2022 [28]. Bread porosity was determined using the Zhuravlev apparatus in accordance with GOST 5669–96 [29], whereas specific loaf volume was measured by the grain displacement method following GOST 27669–88 [30].
Protein content was determined by the Kjeldahl method according to GOST 10846–91 [31], whereas crude fat was measured by solvent extraction according to GOST 29033–91 [32]. Dietary fiber was determined according to GOST 31675–2012 [33], and total carbohydrates were calculated by difference.
Water-soluble vitamins (B-group vitamins and vitamin C) were quantified by high-performance liquid chromatography (HPLC) according to GOST EN 14122-2020 [34] and GOST 34151-2017 [35]. Fat-soluble vitamins (A and E) were determined by chromatographic methods in accordance with GOST 30417–96 [36] and GOST 30418–96 [37].
Mineral elements (K, Ca, Na, Mg, P, Fe, and Zn) were quantified by atomic absorption spectrometry (AAS) according to GOST 30178–96 [38]. Fluorine and iodine contents were determined according to GOST 4386–89 [39] and GOST 26930–86 [40].
Potentially toxic elements (Pb, Cd, As, and Hg) were analyzed by graphite-furnace atomic absorption spectrometry according to GOST 26932–86, GOST 26933–86, and GOST 26927–86 [41,42,43].
The amino acid composition was determined after acid hydrolysis using an automatic amino acid analyzer according to the standardized analytical procedures [44,45,46]. Amino acid concentrations were expressed consistently as g/100 g dry matter in both the Methods section and the corresponding results table.
Microbiological safety was evaluated by determining the total viable count, yeast and mold counts, and the presence of sanitary-indicator microorganisms using standard microbiological methods [44,45,46].
Unless otherwise stated, all physicochemical, biochemical, mineral, amino acid, and microbiological analyses were performed in triplicate, and the results are expressed as mean ± standard deviation (M ± SD).

2.6. Mathematical Modeling and Statistical Analysis

Optimization of the technological process was performed using response surface methodology (RSM) based on a Draper–Lin small composite design. The selected design allows for the efficient estimation of second-order polynomial models while reducing the total number of experimental trials compared with conventional central composite designs.
Four independent technological variables were included in the optimization:
x1—whipping speed (rpm);
x2—whipping time (min);
x3—microwave thawing time (min);
x4—freezing temperature (°C).
The response variables (Y1–Yn) included the principal quality characteristics of dough and bread, namely elastic deformation, plastic deformation, total deformation, dough stability, viscosity index, starch retrogradation index, bread porosity, specific loaf volume, crumb moisture, and titratable acidity. The response variables retain their original numbering from the experimental database and Statgraphics project used during model development. Consequently, the response identifiers are not presented in consecutive numerical order (e.g., y2, y5, y7, y8), since each number corresponds to a specific measured quality characteristic throughout the regression analysis.
The experimental matrix consisted of 16 factorial and axial design points together with two replicated center points, giving a total of 18 experimental runs. The replicated center points were incorporated to estimate pure experimental error and verify model reproducibility.
Regression analysis was performed using the following second-order polynomial model:
y = b 0 + i = l 4 b i × Xi + i = i 4 b i i × X i 2 + i < j 4 b i j × X i × X j
where y is the predicted response, b0 is the intercept, bi are the linear coefficients, bii are the quadratic coefficients, and bij are the interaction coefficients.
Regression coefficients were estimated by the least-squares method using coded variables. The statistical significance of each coefficient was evaluated using Student’s t-test (α = 0.05). Statistically insignificant coefficients (p > 0.05) were removed stepwise from the regression equations to obtain the final predictive models.
The adequacy of each regression model was evaluated by analysis of variance (ANOVA), including the model F-value, model p-value, coefficient of determination (R2), adjusted coefficient of determination (adjusted R2), lack-of-fit test, and residual analysis. Regression models satisfying these statistical criteria were accepted for response surface construction and optimization.
Experimental results are presented as mean ± standard deviation (M ± SD). Statistical comparisons among treatments were performed using one-way analysis of variance followed by Tukey’s multiple comparison test. Differences were considered statistically significant at p < 0.05.
All statistical analyses, regression modeling, and response surface construction were performed using Statgraphics Centurion XIX (Statgraphics Technologies Inc., Warrenton, VA, USA).
The resulting regression equations were subsequently used to generate three-dimensional response surface plots describing the combined effects of technological variables on the rheological, structural, physicochemical, and baking properties of whipped yeast-free frozen dough.

2.7. Sensory Evaluation

The sensory quality of the bread samples was evaluated after cooling for 2 h at room temperature by a trained panel consisting of 12 assessors (six males and six females, aged 25–52 years) with previous experience in the sensory evaluation of bakery products. Prior to the study, all panelists were familiarized with the evaluation protocol and assessment criteria. The panel size of 12 trained assessors was selected for a laboratory quality-oriented sensory assessment rather than a population-level consumer preference study. Each assessor evaluated all samples under the same controlled conditions; therefore, the panel was used for comparative product profiling, and the limited panel size is acknowledged as a study limitation.
Sensory evaluation was conducted in individual sensory booths under standardized laboratory conditions (22 ± 2 °C, neutral white illumination, and controlled humidity). Bread samples were coded using random three-digit numbers and presented in a randomized serving order to minimize positional bias. Unsalted crackers and drinking water were provided between samples for palate cleansing.
The panel evaluated the following sensory attributes:
loaf appearance;
crust color;
crumb color;
crumb structure and porosity;
aroma;
taste;
texture and mouthfeel;
overall acceptability.
Each sensory attribute was first evaluated using a 5-point hedonic scale, where:
5 = excellent;
4 = good;
3 = acceptable;
2 = poor;
1 = unacceptable.
The individual scores were subsequently converted into weighted values to calculate the overall 100-point sensory score.
Each bread formulation was evaluated in triplicate, and the results are reported as mean ± standard deviation (M ± SD). Statistical differences among samples were analyzed by one-way analysis of variance (ANOVA) followed by Tukey’s multiple comparison test at a significance level of p < 0.05.
The sensory evaluation involved commercially available bakery ingredients and did not include human health interventions or the collection of personal or sensitive data. Therefore, according to the institutional regulations of Almaty Technological University, formal ethical committee approval was not required. All assessors participated voluntarily and provided informed consent before the evaluation.

3. Results and Discussion

3.1. Rheological and Structural–Mechanical Properties of Dough

The rheological and structural–mechanical properties of mechanically aerated yeast-free dough were evaluated to determine the combined effects of apple powder incorporation and technological processing parameters on dough stability before baking. Particular attention was paid to the structural integrity of the dough after freeze–thaw treatment because mechanically aerated dough lacks a fermentation stage capable of restoring its porous structure after thawing [47,48].
Mixolab analysis was used to characterize the thermomechanical behavior of the dough, whereas structural–mechanical properties were determined by compression testing. The viscosity index and starch retrogradation index were selected as the principal rheological parameters reflecting changes in the stability of the gluten–starch–air matrix formed during whipping and subsequent freezing [47,48]. Total (H1), plastic (H2), and elastic (H3) deformation were used to characterize the structural response of the dough to mechanical loading.
The structural–mechanical properties of whipped dough after freeze–thaw treatment are presented in Table 4.
The results demonstrated considerable variation in deformation behavior among the experimental samples. Total deformation (H1) ranged from 1.95 to 10.04 mm, indicating substantial differences in dough flexibility depending on formulation and processing conditions.
The control sample exhibited relatively high total deformation (8.43 mm), primarily because of its large plastic deformation component (H2 = 5.07 mm), indicating comparatively lower resistance of the dough structure to mechanical loading. In contrast, several dough formulations containing apple powder exhibited a greater proportion of elastic deformation, suggesting improved structural recovery after compression.
Among all formulations, Sample No. 5 exhibited the highest total deformation (10.04 mm) together with the highest elastic deformation (H3 = 6.40 mm), indicating the formation of a highly resilient dough structure capable of recovering after mechanical loading. This behavior may be associated with the improved hydration of gluten proteins and interactions between gluten and pectin-rich apple components, resulting in a more stable gluten–starch matrix during freeze–thaw treatment [49,50]. Conversely, Sample No. 12 exhibited the lowest total deformation (1.95 mm) and the smallest elastic component (H3 = 1.00 mm), indicating the formation of a comparatively rigid dough structure under the corresponding technological conditions.
Analysis of variance (ANOVA) showed that freezing temperature (X4) significantly affected the deformation characteristics (p < 0.05), whereas the interaction between whipping speed (X1) and whipping time (X2) significantly influenced elastic deformation, confirming that both mechanical aeration and freezing conditions contribute to the development of the gluten–air structure.
The rheological parameters determined by Mixolab analysis are summarized in Table 5.
Significant differences were observed among the experimental samples with respect to viscosity index and starch retrogradation index.
Regression analysis demonstrated that starch retrogradation (Y8) was significantly influenced by whipping speed (X1) and freezing temperature (X4), including their quadratic effects (p < 0.05). Furthermore, the interaction between microwave thawing time (X3) and freezing temperature (X4) significantly affected starch retrogradation, indicating that the rheological behavior of thawed dough depended on the combined influence of freezing and thawing conditions.
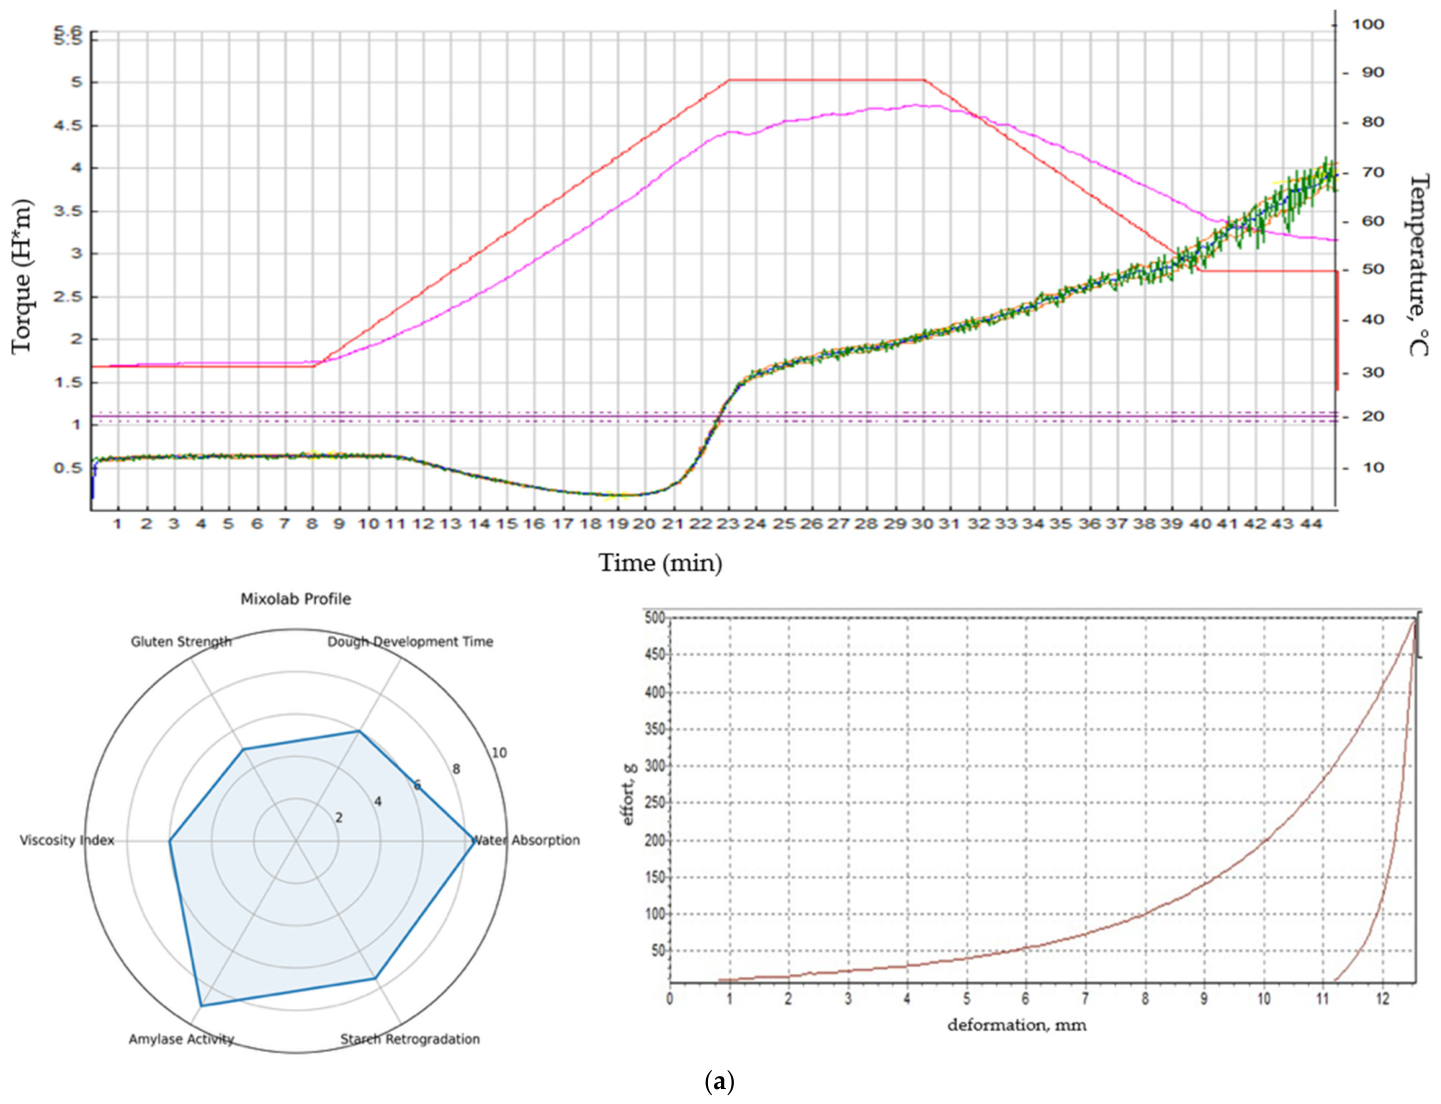
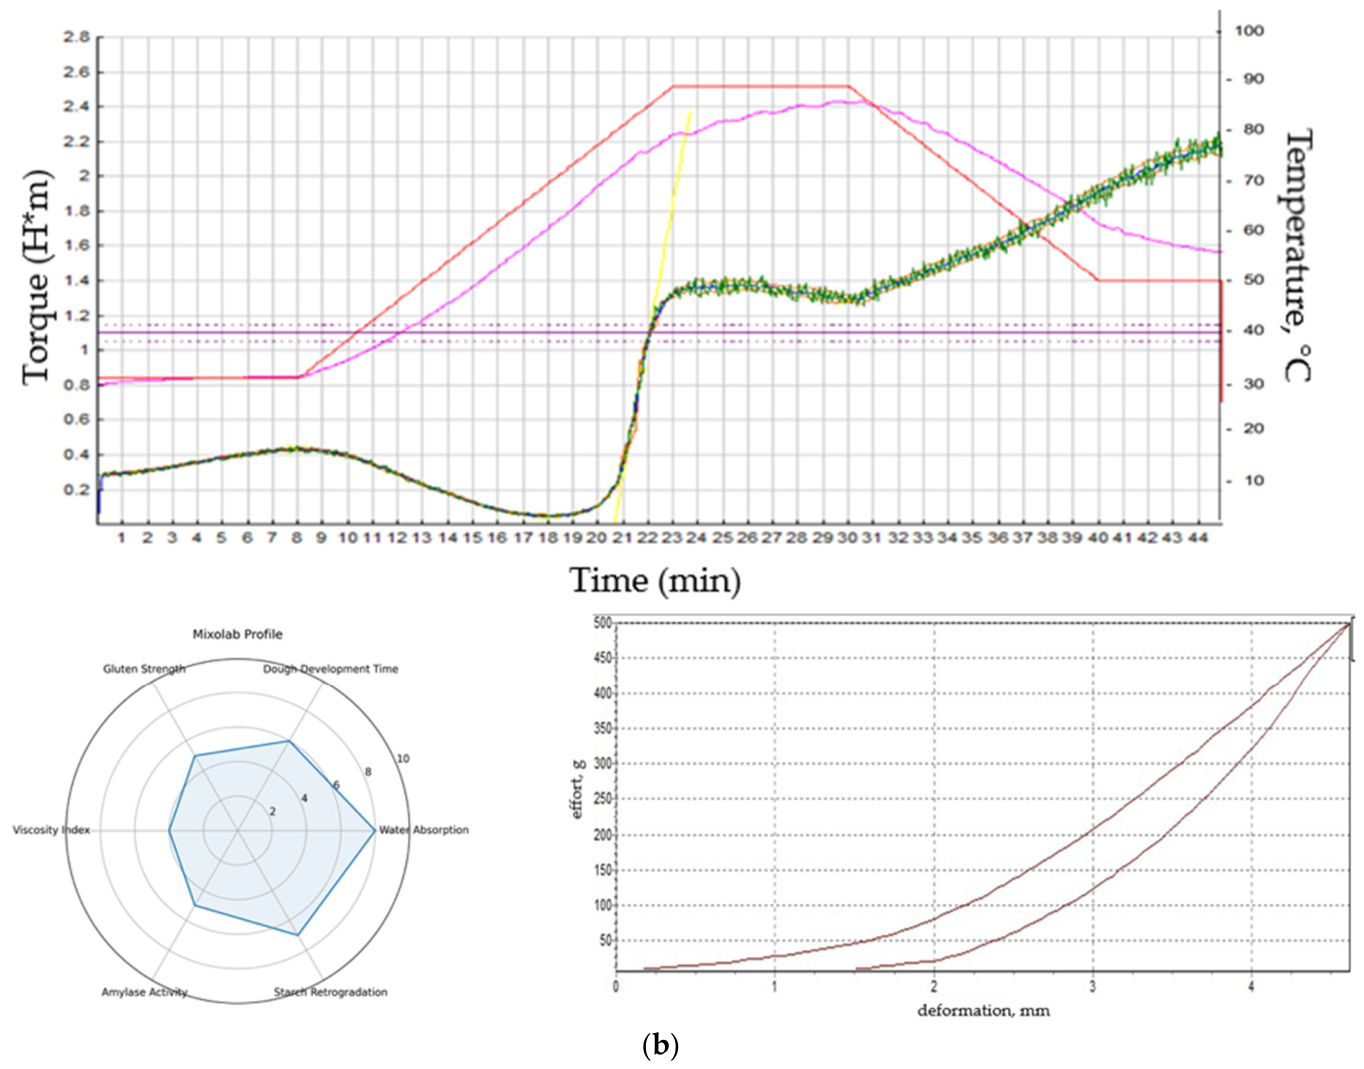
The control dough exhibited the lowest rheological stability, with viscosity and starch retrogradation indices equal to 1.0. The highest viscosity index (5.0) was observed for Sample Nos. 4, 6, and 7, indicating greater resistance of the dough matrix during thermomechanical loading. Among these formulations, Sample No. 7 also exhibited the highest starch retrogradation index (4.0), suggesting more pronounced starch recrystallization during cooling. In contrast, Sample Nos. 4 and 6 combined a high viscosity index with a comparatively lower retrogradation index (3.0), indicating a more balanced rheological response after freeze–thaw treatment.
Comparison of the structural and rheological characteristics indicates that dough quality should not be evaluated using a single parameter. Although Sample No. 5 did not exhibit the highest Mixolab viscosity index, it demonstrated the greatest elastic deformation and structural recovery after compression, indicating superior mechanical resilience of the whipped dough. Conversely, Sample Nos. 4, 6, and 7 exhibited the highest resistance to thermomechanical loading according to Mixolab analysis. These findings demonstrate that structural stability and thermomechanical stability describe different aspects of dough behavior and should therefore be interpreted together.
Representative rheological profiles are presented in Figure 3. Figure 3a shows the Mixolab curves of the samples exhibiting the highest and lowest thermomechanical stability, whereas Figure 3b presents the corresponding force–deformation curves obtained by texture analysis. These profiles clearly illustrate the influence of processing conditions on dough rheology and structural integrity after frozen storage.
The present results are consistent with previous studies on frozen dough systems containing plant-derived dietary fiber, where moderate fiber incorporation improved water retention and structural stability, whereas excessive enrichment increased dough rigidity and reduced extensibility during freeze–thaw treatment [51,52,53,54]. However, unlike conventional yeast-leavened dough, the mechanically aerated yeast-free dough investigated in the present study depended primarily on the preservation of the pre-formed air-cell structure throughout freezing and thawing. Consequently, the rheological response was determined not only by formulation composition, but also by the combined effects of whipping intensity, freezing temperature, and microwave thawing conditions.
Overall, the results demonstrate that the optimization of mechanically aerated frozen dough should be based on integrated evaluation of both rheological and structural–mechanical characteristics. Although Sample Nos. 4, 6, and 7 exhibited the highest thermomechanical stability according to Mixolab analysis, Sample No. 5 demonstrated the greatest elastic recovery after compression. Therefore, comprehensive assessment of dough quality requires the consideration of multiple complementary indicators rather than a single rheological parameter.

3.2. Physicochemical and Sensory Properties of Bread

To evaluate the technological performance of the developed formulations, the physicochemical characteristics of whipped dough were determined before freezing and after freeze–thaw treatment, followed by the assessment of bread quality after baking. The physicochemical properties of the dough are summarized in Table 6.
Table 6 shows that the moisture content of the dough remained within a relatively narrow range despite the different apple powder incorporation levels. The moisture content varied from 43.9 to 46.3%, indicating that adjustment of the water addition successfully compensated for the higher water-binding capacity of apple powder.
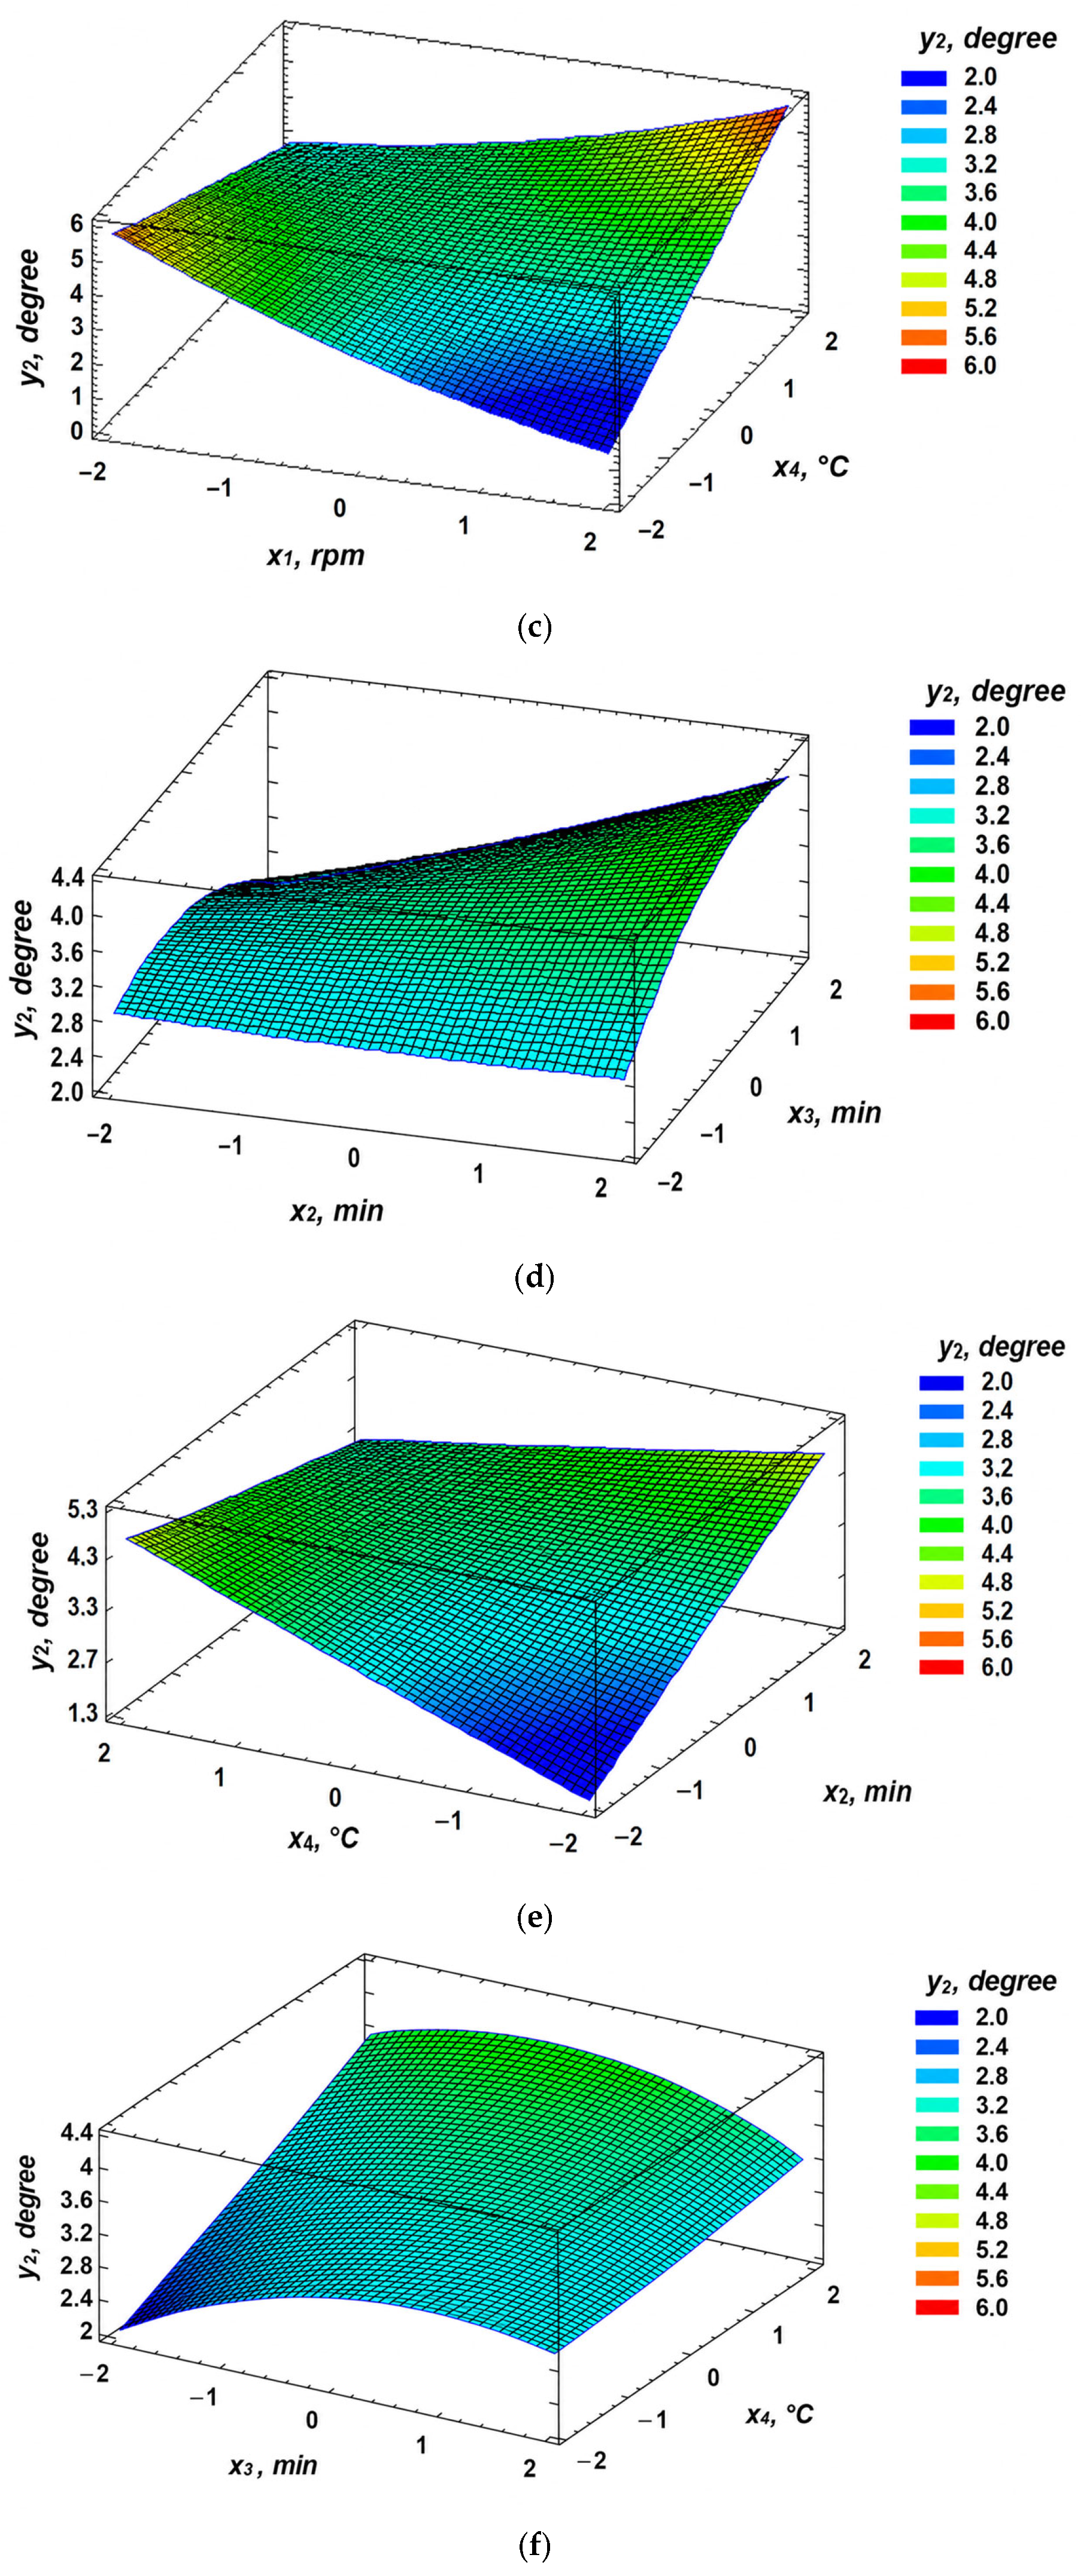
The acidity of the dough increased progressively with increasing apple powder incorporation. The control dough exhibited the lowest acidity (2.6 °T), whereas samples containing 150 g apple powder reached acidity values of 3.8–4.2 °T. Response surface analysis demonstrated that dough acidity (Y2) was significantly affected by whipping time (X2) and freezing temperature (X4) (p < 0.05). The interaction between whipping speed (X1) and freezing temperature (X4) produced the strongest positive effect, whereas the interaction between whipping time and freezing temperature (X2X4) exerted the opposite influence. The developed regression model showed high predictive capability (R2 > 0.95), confirming the adequacy of the selected technological variables.
Following freeze–thaw treatment, all dough samples exhibited a slight increase in density, reflecting partial structural changes during frozen storage. However, formulations containing apple powder generally demonstrated lower density values after thawing (0.57–0.68 g cm−3) than the control (0.69 g cm−3), indicating better preservation of the mechanically aerated structure. These observations suggest that apple powder contributed to maintaining dough integrity during freeze–thaw treatment, probably because of its higher water-binding capacity.
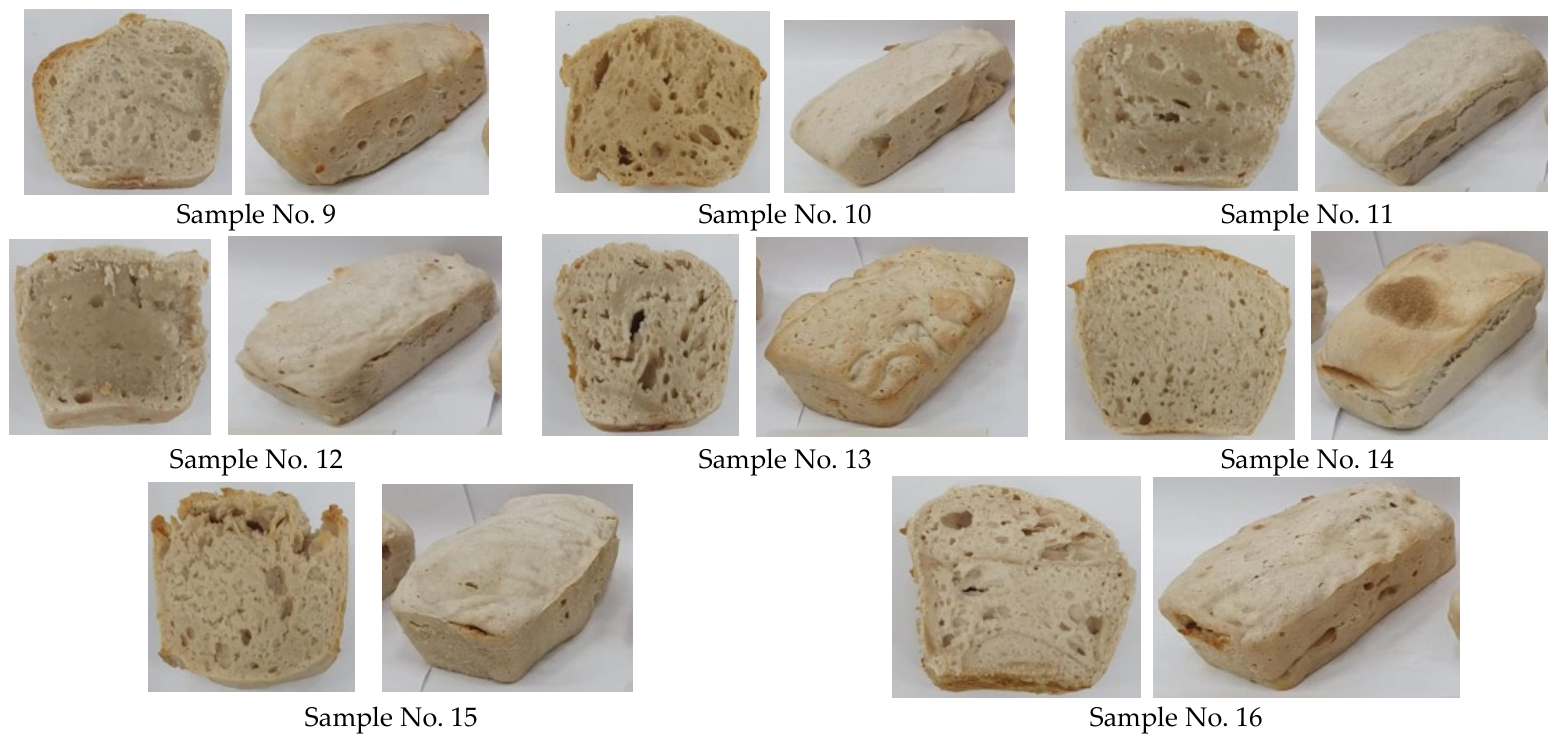
Representative photographs of the baked bread samples are presented in Figure 4.
The control bread exhibited a regular loaf shape, a smooth crust surface, and a cream-colored crumb with a relatively uniform pore distribution. Bread prepared with apple powder showed gradual changes in crumb color and internal structure depending on the level of incorporation.
Samples containing 50 g apple powder (Sample Nos. 1–5) maintained a homogeneous crumb structure with evenly distributed medium-sized pores and only a slight darkening of the crust compared with the control. No pronounced structural defects were observed after freeze–thaw treatment.
Bread containing 100 g apple powder (Sample Nos. 6–10) exhibited a more pronounced cream-beige crumb color and slightly greater variability in pore size distribution. Nevertheless, the crumb remained well-developed and retained satisfactory structural uniformity.
The highest enrichment level (150 g apple powder; Sample Nos. 11–16) resulted in noticeably denser crumb structure, reduced pore uniformity, and partial compression of the crumb in several samples. These structural changes indicate that excessive apple powder incorporation negatively affected gas retention during baking.
Overall, increasing the apple powder level progressively intensified crumb color and increased crumb compactness. Nevertheless, formulations containing 5–100 g apple powder preserved desirable loaf geometry and crumb structure considerably better than formulations containing 150 g apple powder.
The sensory characteristics of the bread samples are summarized in Table 7.
Table 7. Sensory evaluation of control and apple powder-enriched whipped yeast-free bread samples (100-point scale, mean ± SD, n = 12).
SampleSurface ConditionShapeCrumb Color (Score)TasteAromaCrumb StructureOverall Acceptability
Control80 ± 275 ± 390 ± 268 ± 370 ± 380 ± 277.2 ± 2.1
Sample 176 ± 383 ± 282 ± 386 ± 286 ± 290 ± 283.8 ± 1.9
Sample 270 ± 363 ± 370 ± 376 ± 370 ± 283 ± 372.0 ± 2.4
Sample 363 ± 460 ± 370 ± 380 ± 365 ± 378 ± 369.3 ± 2.7
Sample 480 ± 283 ± 286 ± 285 ± 280 ± 380 ± 282.3 ± 2.0
Sample 596 ± 290 ± 298 ± 196 ± 297 ± 196 ± 295.5 ± 1.3
Sample 697 ± 196 ± 296 ± 297 ± 197 ± 198 ± 196.8 ± 1.2
Sample 790 ± 288 ± 280 ± 390 ± 287 ± 291 ± 287.7 ± 1.8
Sample 878 ± 375 ± 380 ± 386 ± 280 ± 270 ± 378.2 ± 2.3
Sample 995 ± 294 ± 295 ± 297 ± 195 ± 295 ± 295.2 ± 1.4
Sample 1096 ± 196 ± 196 ± 197 ± 197 ± 197 ± 196.5 ± 1.1
Sample 1184 ± 280 ± 285 ± 286 ± 283 ± 278 ± 382.7 ± 2.0
Sample 1264 ± 460 ± 470 ± 370 ± 373 ± 360 ± 466.2 ± 2.8
Sample 1390 ± 290 ± 290 ± 295 ± 290 ± 295 ± 291.7 ± 1.7
Sample 1497 ± 190 ± 290 ± 296 ± 197 ± 195 ± 294.2 ± 1.5
Sample 1586 ± 286 ± 286 ± 290 ± 290 ± 295 ± 288.8 ± 1.9
Sample 1688 ± 285 ± 280 ± 390 ± 290 ± 297 ± 188.3 ± 1.8
Note: Values are presented as mean ± standard deviation (M ± SD, n = 12). Bread crumb color was visually classified as follows: Control—cream; Samples 1–8—cream with a yellowish tint; Samples 9–12—light cream with a yellowish tint; Samples 13–16—light cream. Overall acceptability was calculated as the arithmetic mean of the sensory attributes evaluated according to the procedure described in Section 2.7.
Overall sensory acceptability ranged from 66.2 to 96.8 points. The lowest score was recorded for Sample No. 12 (66.2 points), which exhibited poorer loaf shape, lower crumb uniformity, and reduced structural stability after baking.
The control sample achieved an overall acceptability score of 77.2 points. Most formulations containing apple powder demonstrated improved sensory quality compared with the control, although the final quality depended strongly on the processing conditions applied.
The highest sensory scores were obtained for Sample No. 6 (96.8 points) and Sample No. 10 (96.5 points), followed by Sample No. 5 (95.5 points) and Sample No. 9 (95.2 points). These samples consistently received high scores for crust appearance, loaf shape, crumb structure, flavor, aroma, and overall acceptability.
Statistical analysis confirmed significant differences among treatments (p < 0.05). The results indicate that moderate incorporation of apple powder (5–10%) combined with optimized whipping and freeze–thaw conditions produced bread with superior sensory quality compared with both the control formulation and bread containing 150 g apple powder.

3.3. Nutritional, Amino Acid, and Microbiological Characteristics

The physicochemical characteristics of the baked whipped bread are presented in Table 8 and demonstrate the combined influence of apple powder incorporation and technological processing conditions on the quality of the finished products.
As shown in Table 8, the incorporation of apple powder affected all evaluated quality parameters. Bread moisture gradually decreased from 41.2% in the control sample to 38.9–39.6% in formulations containing 150 g apple powder, whereas titratable acidity increased from 2.8 °T to 3.8–4.3 °T. Regression analysis demonstrated that protein content (Y14) was significantly influenced by freezing temperature (X4) together with the quadratic effects of whipping time (X22) and microwave thawing time (X32) (p < 0.05). Moisture retention in baked bread (Y16) depended primarily on microwave thawing time (X3), indicating that thawing conditions contributed substantially to water retention in the finished product.
Both porosity and specific volume increased progressively with increasing apple powder incorporation. Bread prepared with 100 g apple powder exhibited a favorable combination of high porosity (68–74%) and specific volume (2.8–3.2 cm3 g−1) while maintaining satisfactory crumb uniformity. Although formulations containing 150 g apple powder demonstrated the highest instrumental porosity (70–76%) and specific volume (2.9–3.4 cm3 g−1), visual evaluation (Figure 4) revealed a less homogeneous crumb characterized by larger pores separated by thicker cell walls and localized compact regions. Thus, higher instrumental porosity did not necessarily correspond to a more uniform crumb structure. These observations indicate that excessive apple powder incorporation altered gas-cell distribution during baking despite increasing the overall pore volume.
The biochemical composition of the bread samples is summarized in Table 9.
Apple powder enrichment resulted in a progressive improvement in the nutritional composition of the finished products. Protein content increased from 7.5% in the control sample to 8.6% in bread containing 150 g apple powder, while dietary fiber increased from 4.8% to 7.3%, representing an increase of more than 50% compared with the control formulation. Similar increases were observed for vitamins and minerals. Vitamin C, which was not detected in the control bread, reached 2.2 mg 100 g−1 in the formulation containing 150 g apple powder. Potassium increased from 125.6 to 156.7 mg 100 g−1, whereas iron increased from 2.45 to 3.20 mg 100 g−1, confirming the nutritional contribution of apple powder.
These results demonstrate that nutritional enrichment increased proportionally with apple powder incorporation. However, improvement of nutritional value was accompanied by gradual changes in bread structure, particularly at the highest enrichment level. Therefore, technological quality should be considered together with nutritional enhancement when selecting the optimum formulation.
The observed nutritional improvements are consistent with previous reports describing fruit- and fiber-enriched bakery products, where the incorporation of plant-derived powders increased the dietary fiber, vitamin, and mineral content while simultaneously affecting dough hydration and crumb structure [55,56].
To further evaluate protein quality, the amino acid composition of the finished bread was determined (Table 10).
The amino acid profile demonstrated moderate but consistent improvements with increasing apple powder incorporation. Lysine, the principal limiting amino acid in wheat-based bakery products, increased from 0.26 to 0.34 g 100 g−1 product, whereas threonine increased from 0.29 to 0.41 g 100 g−1 product. Similar increases were observed for valine, methionine, phenylalanine + tyrosine, and several non-essential amino acids.
Although the absolute changes were relatively small, the results indicate gradual improvement of protein quality following apple powder incorporation. Nevertheless, the amino acid concentrations remained below the FAO/WHO reference pattern for essential amino acids, which is typical for cereal-based bakery products. Consequently, apple powder should be regarded primarily as a functional ingredient improving the nutritional profile rather than as a major source of essential amino acids.
The formulation containing 150 g apple powder exhibited the highest total amino acid content; however, previous rheological and structural analyses demonstrated that this enrichment level adversely affected dough handling and crumb uniformity. In contrast, the 100 g apple powder formulation provided a more balanced combination of nutritional improvement and technological performance.
Microbiological characteristics of the bread samples are presented in Table 11.
Total mesophilic aerobic counts increased during storage in all formulations, as expected. After 72 h of storage, microbial counts increased from 4.7 × 10³ to 6.2 × 10³ CFU g−1 in the control bread, whereas corresponding values for bread containing 5%, 10%, and 150 g apple powder remained lower (3.9 × 10³, 3.4 × 10³, and 3.1 × 10³ CFU g−1, respectively). The reduced microbial growth observed in the enriched formulations may be associated with the presence of naturally occurring organic acids and phenolic compounds in apple powder, together with the higher titratable acidity of these products.
Coliform bacteria were not detected in any of the analyzed samples. Yeast and mold counts remained below 102 CFU g−1 throughout the storage period, indicating compliance with microbiological safety requirements. Toxic elements (Pb, Cd, As, and Hg) were below the analytical detection limits and therefore not detected in any bread sample.
Overall, increasing the apple powder content improved the nutritional composition and contributed to enhanced microbiological stability. Nevertheless, considering the combined rheological, structural, physicochemical, nutritional, sensory, and microbiological characteristics, the formulation containing 100 g apple powder provided the most balanced technological performance and overall product quality.

3.4. Mathematical Modeling and Optimization

Response surface methodology (RSM) based on the Draper–Lin small composite design was used to quantify the effects of the technological variables on the rheological, structural–mechanical, physicochemical, and quality characteristics of whipped yeast-free frozen dough and the resulting bread. Four independent variables were included in the regression analysis:
x1—whipping speed (rpm);
x2—whipping time (min);
x3—microwave thawing time (min);
x4—freezing temperature (°C).
The regression equations presented below were developed using coded factor values in accordance with the Draper–Lin response surface design described in Section 2.6. The coded-variable models were subsequently used for response surface construction and optimization of the technological parameters. Apple powder level was not included as an RSM factor because optimization was performed only within each formulation group, whereas the regression models evaluated the influence of processing conditions after the formulation had been established. This approach enabled the technological variables to be analyzed independently of formulation composition, thereby avoiding confounding effects between ingredient level and processing parameters, as recommended for multi-factor optimization studies.
A second-order polynomial model was fitted for each response according to Equation (1).
The principal response variables selected for regression modeling included dough acidity (y2), elastic deformation (y5), viscosity index (y7), and starch retrogradation index (y8). These identifiers correspond to the original response numbering adopted during statistical analysis and are retained throughout the manuscript for consistency.
The general form of the regression equation for the four factors is as follows:
yi = b0 + b1 x1 + b2 x2 + b3 x3 + b4 x4 + b12 x1 x2 + b13 x1 x3 + b14 x1 x4 + b23 x2 x3 + b24 x2 x4 + b34 x3 x4 + b11 x12 + b22 x22 + b33 x32 + b44 x42.
where:
yi—response variables characterizing dough and bread quality;
x1—whipping speed (rpm);
x2—whipping time (min);
x3—microwave thawing time (min);
x4—freezing temperature (°C).
The developed regression models enable the prediction of dough and bread quality parameters as a function of technological conditions and can be used to identify optimal processing regimes. The regression equations describing the influence of technological parameters on the studied responses are presented below:
y2 = 3.43178 − 0.178381x1 + 0.237842x2 + 0.0639032x3 + 0.237842x4 + 0.115417x12 +
0.262842x1x2 + 0.175x1x3 + 0.462842x1x4 + 0.00935024x22 + 0.125x2x3 − 0.303381x2x4
0.132072x32 − 0.075x3x4 + 0.00935024x42.
Regression analysis showed that dough acidity was influenced not only by the individual technological parameters, but also by their interactions. Among the studied factors, the interaction between whipping speed and freezing temperature showed the strongest influence, indicating that the acidity of whipped dough depended on the combined effect of mechanical treatment and freeze–thaw conditions.
y5 = 3.29854 + 0.0772986x1 − 0.112975x2 + 0.0626691x3 + 1.4984x4 + 0.00845434x12 +
1.4309x1x2 − 0.0675x1x3 − 0.590475x1x4 − 0.514806x22 + 0.1475x2x3 − 0.630201x2x4
0.300906x32 + 0.1675x3x4 + 0.224123x42.
For elastic deformation of the dough, analysis of the regression coefficients showed that freezing temperature exerted the strongest positive effect. The interaction between whipping speed and whipping time was also substantial, indicating that elastic recovery depends on the combined development of the mechanically aerated gluten–starch network.
y7 = 1.06194 + 0.297302x1 − 0.300216x3 + 0.951367x4 + 0.136186x12 + 0.713867x1x2
0.4625x1x3 + 0.2875x1x4 − 0.0405912x22 +
0.6625x2x3 − 0.290198x2x4 − 0.0405912x32 − 0.3625x3x4 + 0.80794x42.
Analysis of the regression model showed that freezing temperature had a strong influence on viscosity development, especially through its quadratic effect and its interaction with whipping parameters. This suggests that the rheological properties of the dough were affected by the combined action of freezing conditions and mechanical treatment during processing.
y8 = 1.0406 + 0.594605x1 − 0.118921x2 − 0.168414x3 + 0.594605x4 + 0.3326951x12 +
0.307105x1x2 − 0.2125x1x3 + 0.0935791x1x4 + 0.0441073x22 + 0.3125x2x3 + 0.282105x2x4
0.0266036x32 − 0.6875x3x4 + 0.326951x42.
The regression model for dough acidity demonstrated satisfactory predictive capability and significant overall model adequacy (ANOVA, p < 0.05). Among the linear effects, freezing temperature (x4) and whipping time (x2) exerted the greatest influence. Significant interaction terms were also observed, particularly x1x4 (whipping speed × freezing temperature) and x2x4 (whipping time × freezing temperature), indicating that acidity development depended on the combined action of mechanical aeration and freeze–thaw treatment rather than on individual technological factors alone.
The regression model showed that elastic deformation was primarily governed by freezing temperature and the interaction between whipping speed and whipping time. The positive quadratic effect of freezing temperature indicates the existence of an optimum freezing regime rather than a simple linear response.
These results demonstrate that the elastic recovery of mechanically aerated dough depends on both the development of the gluten–starch–air network during whipping and its subsequent preservation during frozen storage.
The viscosity index was significantly affected by freezing temperature together with several interaction terms involving whipping conditions. The significant quadratic coefficients confirm that the rheological response of whipped dough is nonlinear within the investigated processing domain.
Higher viscosity index values were generally predicted at whipping speeds of 700–900 rpm, whipping times of 5–7 min, freezing temperatures below −35 °C, and microwave thawing periods of 4–6 min.
The starch retrogradation model demonstrated that freezing temperature and whipping speed positively affected starch stability, whereas the interaction between microwave thawing time and freezing temperature produced the strongest negative effect.
The response surface analysis indicated that deep freezing combined with relatively short microwave thawing minimized starch retrogradation and therefore improved structural stability of the dough during freeze–thaw treatment.
Three-dimensional response surface plots illustrating the influence of the technological variables on dough acidity are presented in Figure 5.
Overall analysis of the regression models demonstrated that the investigated technological variables affected different quality characteristics to different extents. Rheological properties were influenced predominantly by whipping conditions, whereas physicochemical characteristics were jointly controlled by whipping parameters and freeze–thaw conditions. Structural characteristics of the baked bread depended on the combined action of all four technological variables included in the optimization procedure.
Among the investigated formulations, the technological conditions corresponding to whipping speeds of 700–900 rpm, whipping times of 5–7 min, freezing temperatures below −35 °C, and microwave thawing for 4–6 min provided the most favorable combination of rheological stability, reduced starch retrogradation, satisfactory bread structure, and improved nutritional quality.
These optimized processing conditions were subsequently confirmed experimentally and served as the basis for selecting the formulation containing 100 g apple powder, which provided the best overall balance between technological performance, nutritional enhancement, and sensory acceptability.
The present study demonstrates that the quality of mechanically aerated yeast-free frozen dough depends on the combined effects of formulation composition and processing conditions rather than on any individual technological factor. In contrast to conventional yeast-leavened frozen dough, whipped yeast-free systems lack a fermentation stage capable of restoring structural defects after thawing. Consequently, preservation of the gluten–starch–air matrix during freezing and thawing becomes the principal determinant of dough stability and bread quality.
The rheological results obtained in this study confirm that freezing temperature and whipping conditions play a decisive role in maintaining dough integrity. Samples processed under intensive whipping and deep-freezing conditions exhibited higher elastic deformation and viscosity indices together with lower starch retrogradation, indicating improved resistance of the dough matrix to freeze–thaw damage. These findings agree with recent reviews describing freezing-induced modifications of gluten proteins, including partial depolymerization, redistribution of water, and weakening of intermolecular interactions, all of which reduce dough elasticity during frozen storage [44,54,57]. Similarly, Guo et al. [45] and Chen et al. [58] demonstrated that preservation of the gluten–starch matrix largely depends on limiting structural disruption during ice crystal formation.
The beneficial effect of lower freezing temperatures observed in the present work is consistent with previous studies showing that rapid freezing produces smaller ice crystals and minimizes mechanical damage to gluten continuity [50,51]. In contrast, slow freezing promotes water migration, larger ice crystals, and more extensive disruption of the protein network, resulting in greater deterioration of the rheological properties after thawing [45,52]. The response surface models obtained in the present study support these mechanisms, indicating that freezing temperature exerted the strongest influence on elastic deformation, viscosity development, and starch retrogradation.
Microwave thawing also significantly influenced dough quality. The regression analysis demonstrated that thawing time interacted with freezing temperature in determining starch retrogradation and moisture retention. These observations are consistent with Yang et al. [48] and Yang et al. [53], who reported that microwave thawing can effectively reduce thawing time and limit moisture redistribution provided that the heating process is carefully controlled. Excessive thawing, however, may accelerate local starch gelatinization and gluten weakening, whereas insufficient thawing results in incomplete structural recovery before baking. The present results indicate that thawing for approximately 4–6 min after deep freezing provided the most favorable balance between structural preservation and technological performance.
Apple powder acted simultaneously as a source of dietary fiber and as a functional ingredient modifying dough hydration. Moderate incorporation improved dough stability after freeze–thaw treatment, whereas excessive enrichment gradually reduced structural uniformity despite increasing nutritional value. This behavior is consistent with previous reports describing the dual role of dietary fiber in wheat dough systems. Fiber components reduce the mobility of free water and may stabilize frozen dough; however, they also compete with gluten proteins for available water, thereby limiting gluten network development when present at high concentrations [46,49]. Similar mechanisms have recently been described for fruit-derived dietary fibers incorporated into wheat dough [55,56,57].
The present study also demonstrated that the technological response depended not only on the amount of apple powder but also on its interaction with mechanical processing conditions. Samples containing approximately 100 g apple powder showed the most balanced combination of rheological stability, bread quality, and nutritional improvement. Higher incorporation levels further increased dietary fiber, vitamin C, and mineral contents but simultaneously produced less homogeneous crumb structures. Similar observations have been reported for bakery products enriched with fruit pomace or fruit fiber, where moderate enrichment improved functional value while excessive addition reduced gas retention and crumb regularity because of the partial disruption of gluten continuity [47,55,56].
An interesting observation of the present work is that bread prepared with 150 g apple powder exhibited higher instrumental porosity and specific volume but visually showed a less homogeneous crumb structure. This apparent contradiction can be explained by differences in pore morphology rather than total pore volume. Instrumental porosity reflects the total gas volume within the crumb, whereas visual assessment considers pore size distribution and structural uniformity. Larger irregular pores separated by thicker cell walls may increase the total porosity while simultaneously producing a denser visual appearance. Similar discrepancies between instrumental and visual quality assessment have been reported for fiber-enriched bakery products [47,55].
The nutritional analyses confirmed that apple powder substantially improved the functional value of the bread through increased dietary fiber, vitamins, and mineral elements. Although improvements in essential amino acid concentrations were relatively modest, the enriched formulations demonstrated a gradual enhancement of overall protein quality compared with the control bread. These findings support previous reports showing that fruit-derived ingredients primarily contribute dietary fiber and micronutrients rather than substantially modifying the amino acid balance of cereal-based products [47,55].
Overall, the present study demonstrates that the optimization of processing conditions is as important as formulation design in mechanically aerated frozen dough systems. The response surface methodology enabled a simultaneous evaluation of whipping intensity, freezing temperature, and microwave thawing conditions, providing a comprehensive optimization strategy for frozen bakery products. Within the investigated processing domain, the formulation containing 100 g apple powder combined with intensive whipping, deep freezing, and controlled microwave thawing provided the most favorable balance between rheological stability, technological performance, nutritional enhancement, and sensory quality.
Despite these promising results, several limitations should be acknowledged. The experiments were performed under laboratory-scale conditions using one type of wheat flour and a single apple powder preparation method. Future studies should investigate the influence of apple cultivar, particle size distribution, industrial-scale processing, longer frozen storage periods, and microstructural characterization by microscopic techniques to further elucidate the mechanisms responsible for freeze–thaw stabilization in mechanically aerated yeast-free dough systems.

4. Conclusions

This study demonstrated that the technological performance of mechanically aerated yeast-free frozen dough is governed by the combined effects of formulation composition and processing conditions rather than by individual technological factors. The application of response surface methodology (RSM) made it possible to quantify the influence of whipping speed, whipping time, freezing temperature, and microwave thawing duration on the rheological, structural, physicochemical, nutritional, and sensory characteristics of frozen dough systems.
The regression models showed that freezing temperature was the dominant processing factor affecting dough elasticity, viscosity development, starch retrogradation, and structural stability after freeze–thaw treatment. Deep freezing at −38 °C, combined with controlled microwave thawing for 4 min, minimized structural deterioration of the gluten–starch matrix and promoted better preservation of dough quality throughout frozen storage.
Apple powder acted as a multifunctional ingredient by simultaneously improving the nutritional value and modifying the technological behavior of the dough. Increasing the apple powder level progressively enhanced the dietary fiber, vitamin C, and mineral contents; however, excessive incorporation adversely affected dough rheology and crumb uniformity despite increasing instrumental porosity and specific volume. These results demonstrate that nutritional enrichment and technological performance should be optimized simultaneously when developing frozen bakery products.
Among the investigated formulations, bread containing 100 g apple powder provided the most balanced combination of rheological stability, freeze–thaw resistance, physicochemical quality, nutritional enhancement, microbiological stability, and sensory acceptability. The optimum technological conditions identified by response surface analysis were a whipping speed of 900 rpm, whipping time of 7 min, freezing temperature of −38 °C, and microwave thawing for 4 min.
The novelty of this work lies in the integrated optimization of formulation and processing variables for mechanically aerated yeast-free frozen dough systems using response surface methodology. Unlike previous studies that mainly investigated conventional yeast-leavened frozen dough or individual technological factors, the present work demonstrates how mechanical aeration, freeze–thaw treatment, and apple powder incorporation interact to determine dough functionality and bread quality.
The obtained results provide a scientific basis for the development of functional frozen bakery products enriched with fruit-derived ingredients and may be applied in the optimization of industrial frozen dough technologies. Future research should focus on long-term frozen storage, microstructural characterization of the gluten–starch matrix, antioxidant activity, nutrient bioavailability, and industrial-scale validation of the proposed technological approach.

Author Contributions

Conceptualization, data curation, formal analysis, funding acquisition, investigation and software, A.I., B.I., D.A., B.M. and F.Y.; methodology, resources, writing—review and editing, and writing—original draft S.T., Z.N., M.Y., M.M. All authors have read and agreed to the published version of the manuscript.

Funding

The authors thank the Science Committee of the Ministry of Science and Higher Education of the Republic of Kazakhstan for their financial support (grant for scientific and (or) scientific and technical projects for 2024–2026 (Ministry of Science and Higher Education of the Republic of Kazakhstan)): No. AP23490384 “Development of innovative technology for accelerated preparation of frozen dough enriched with plant crops”.

Institutional Review Board Statement

This study did not involve biomedical, clinical, or behavioral research involving human participants. Sensory evaluation was conducted exclusively for food quality assessment by 12 adult panelists (food science researchers and bakery technology specialists) with previous experience in the sensory evaluation of bakery products. Participation was voluntary, and informed verbal consent was obtained from all participants prior to the evaluation. No personal, sensitive, or identifiable information was collected or recorded. The sensory assessment involved only the evaluation of commercially acceptable food products and did not include clinical procedures, biological sample collection, or interventions involving human participants. Therefore, according to the institutional regulations governing food quality studies, formal approval by an Institutional Review Board (IRB) or Ethics Committee Republic of Kazakhstan was not required. No animal experiments were performed in this study.

Data Availability Statement

The original contributions presented in the study are included in the article; further inquiries can be directed to the corresponding author.

Conflicts of Interest

The authors declare no conflicts of interest.

References

  1. Qi, X.; Han, C.; Wang, Y.; Jin, Y.; Xu, D.; Wu, F.; Xu, X. Freeze-thaw stability of frozen dough containing superheated steam-treated wheat flour: Evidence from water states and starch properties. Food Hydrocoll. 2026, 175, 112521. [Google Scholar] [CrossRef]
  2. Sanchez, K.; Hu, P.; Cheng, L. Influence of freezing rate on gluten structure and water migration in frozen dough. LWT 2022, 161, 113367. [Google Scholar] [CrossRef]
  3. Zhang, Y.; Yang, F.; Wu, G. Effect of shock freezing on structural stabilization of frozen bakery doughs. Carbohydr. Polym. 2021, 259, 117633. [Google Scholar] [CrossRef] [PubMed]
  4. Zhang, F.; Guo, J.; Li, P.; Zhao, F.; Yang, X.; Cheng, Q.; Elmore, J.S.; Wang, P.; Cui, C. Effects of different thawing methods on physical and physicochemical properties of frozen dough and quality of corresponding steamed bread. Food Chem. 2024, 447, 138932. [Google Scholar] [CrossRef] [PubMed]
  5. Yu, X.; Li, C.; Chen, J. Effects of apple fiber on physicochemical properties of frozen dough. Food Chem. 2024, 440, 138194. [Google Scholar] [CrossRef] [PubMed]
  6. Hu, W.; Li, H.; Jin, Z. Physical aspects of pectin–gluten interactions. LWT 2021, 152, 112758. [Google Scholar] [CrossRef]
  7. Wang, X.; Xu, Y.; Wang, L. Ice crystal formation and water migration in frozen dough systems. Food Res. Int. 2021, 140, 109889. [Google Scholar] [CrossRef] [PubMed]
  8. Li, H.; Ma, S.; Wang, Z. Effects of freezing on gluten network stability. J. Cereal Sci. 2022, 105, 103464. [Google Scholar] [CrossRef]
  9. Xu, Y.; Wang, X.; Ma, Y. Effects of microwave thawing on frozen dough quality. Food Hydrocoll. 2023, 135, 108201. [Google Scholar] [CrossRef]
  10. Tursunbayeva, S.; Iztayev, A.; Iztayev, B.; Muldabekova, B.; Yakiyayeva, M.; Mamyrayev, M.; Nurgozhina, Z. Development of innovative yeast-free bakery products through mechanical aeration. Processes 2026, 14, 212. [Google Scholar] [CrossRef]
  11. Gu, Y.; Zhang, L.; Li, X. Cryo-induced structural changes in wheat gluten during frozen storage. Food Hydrocoll. 2022, 128, 107584. [Google Scholar] [CrossRef]
  12. Zhu, Y.; Hu, W.; Li, B. Plant-derived polysaccharides as cryoprotectants in frozen dough. Food Hydrocoll. 2021, 118, 106719. [Google Scholar] [CrossRef]
  13. Li, D.; Shi, Y.; Ouyang, Z.; Teng, Y.; Chen, B.; Chen, Y.; Luo, Y.; Zhang, N.; Kumar, N.; Li, Y.; et al. Pea-protein-stabilized emulsion as a cryoprotectant in frozen dough. Foods 2024, 13, 3840. [Google Scholar] [CrossRef] [PubMed]
  14. Su, J.-P.; Fang, J.-Q.; Liu, C.; Liu, S.-P.; Tan, C.-P.; Wang, P.-P.; Fu, X.; Chen, C. Alleviative effects of Dendrobium officinale polysaccharide on quality deterioration of frozen dough. Int. J. Biol. Macromol. 2025, 304, 140705. [Google Scholar] [CrossRef] [PubMed]
  15. Li, Y.; Zhu, K.; Guo, X. Freeze–thaw stability of wheat dough supplemented with dietary fiber. LWT 2023, 171, 114115. [Google Scholar] [CrossRef]
  16. Culețu, A.; Mohan, G.; Duță, D.E. Rheological characterization of the dough with added dietary fiber by rheometer: A review. Bulletin of University of Agricultural Sciences and Veterinary Medicine Cluj-Napoca. Food Sci. Technol. 2020, 77, 13–24. [Google Scholar] [CrossRef]
  17. Liu, X.; Chen, L.; Sun, Q. Effects of dietary fiber on frozen dough quality deterioration. LWT 2022, 164, 113666. [Google Scholar] [CrossRef]
  18. Wang, L.; Chen, Y.; Zhao, L. Effect of pectin-rich ingredients on dough viscoelastic properties. Food Chem. 2021, 356, 129711. [Google Scholar] [CrossRef] [PubMed]
  19. Guo, X.; Li, Y.; Zhu, K. Freeze–thaw tolerance improvement by fruit fiber addition. Foods 2023, 12, 1865. [Google Scholar] [CrossRef] [PubMed]
  20. Sun, J.; Zhao, Q.; Li, Y. Rheological behavior of composite wheat–fruit dough systems. J. Cereal Sci. 2022, 106, 103498. [Google Scholar] [CrossRef]
  21. Zhang, X.; Ma, S.; Wang, Z. Interaction of fruit polyphenols with wheat gluten proteins. Food Chem. 2021, 343, 128470. [Google Scholar] [CrossRef] [PubMed]
  22. Jiao, M.; Liu, Y.; Fu, B.; Jiang, P.; Wen, C.; Qi, L.; Shang, S. Effects of different thawing methods on the physicochemical and structural properties of frozen quinoa dough. J. Cereal Sci. 2026, 128, 104391. [Google Scholar] [CrossRef]
  23. Iztayev, A.; Kulazhanov, T.; Iskakova, G.; Alimardanova, M.; Zhienbaeva, S.; Iztayev, B.; Tursunbayeva, S.; Yakiyayeva, M. The innovative technology of dough preparation for bread by the accelerated ion–ozone cavitation method. Sci. Rep. 2023, 13, 17937. [Google Scholar] [CrossRef] [PubMed]
  24. AACC International. Approved Methods of Analysis, 11th ed.; AACC International: St. Paul, MN, USA, 2010; Method 54-60.02; Available online: https://www.sciepub.com/reference/241713 (accessed on 8 July 2026).
  25. GOST 26574–2017; Wheat Flour. General Specifications. StandardInform: Moscow, Russia, 2018. Available online: https://internet-law.ru/gosts/gost/65490 (accessed on 8 July 2026).
  26. GOST 13830–97; Edible Salt. General Technical Conditions. StandardInform: Moscow, Russia, 1998. Available online: https://internet-law.ru/gosts/gost/44789/ (accessed on 8 July 2026).
  27. GOST 21094–2022; Bread and Bakery Products. Method for Determination of Moisture Content by Gravimetric Drying. StandardInform: Moscow, Russia, 2022. Available online: https://internet-law.ru/gosts/gost/78939/ (accessed on 8 July 2026).
  28. GOST 5670–2022; Bread and Bakery Products. Methods for Determination of Titratable Acidity. StandardInform: Moscow, Russia, 2022. Available online: https://internet-law.ru/gosts/gost/4080/ (accessed on 8 July 2026).
  29. GOST 5669–96; Bread and Bakery Products. Method for Determination of Porosity Using the Zhuravlev Apparatus. StandardInform: Moscow, Russia, 1996. Available online: https://internet-law.ru/gosts/gost/4217/ (accessed on 8 July 2026).
  30. GOST 27669–88; Bread and Bakery Products. Method for Determination of Specific Volume by Grain Displacement. StandardInform: Moscow, Russia, 1988. Available online: https://internet-law.ru/gosts/gost/1096/ (accessed on 8 July 2026).
  31. GOST 10846–91; Grain and Grain Products. Method for Determination of Protein by the Kjeldahl Method. StandardInform: Moscow, Russia, 2009. Available online: https://internet-law.ru/gosts/gost/28268/ (accessed on 8 July 2026).
  32. GOST 29033–91; Bakery Products. Method for Determination of Fat Content by Solvent Extraction. StandardInform: Moscow, Russia, 2008. Available online: https://internet-law.ru/gosts/gost/10417/ (accessed on 8 July 2026).
  33. GOST 31675–2012; Grain and Products of Its Processing. Method for Determination of Crude Fiber. StandardInform: Moscow, Russia, 2013. Available online: https://internet-law.ru/gosts/gost/52702/ (accessed on 8 July 2026).
  34. GOST EN 14122-2020; Foodstuffs. Determination of Vitamin B1 by High Performance Liquid Chromatography. Russian Institute of Standardization: Moscow, Russia, 2024. Available online: https://internet-law.ru/gosts/gost/82704/ (accessed on 8 July 2026).
  35. GOST 34151-2017; Foodstuffs. Determination of Vitamin C by High Performance Liquid Chromatography. StandardInform: Moscow, Russia, 2019. Available online: https://internet-law.ru/gosts/gost/64838/ (accessed on 8 July 2026).
  36. GOST 30417–96; Food Products. Method for Determination of Vitamin A by Chromatography. StandardInform: Moscow, Russia, 1996. Available online: https://internet-law.ru/gosts/gost/9112/ (accessed on 8 July 2026).
  37. GOST 30418–96; Food Products. Method for Determination of Vitamin E by Chromatography. StandardInform: Moscow, Russia, 1996. Available online: https://internet-law.ru/gosts/gost/9156 (accessed on 8 July 2026).
  38. GOST 30178–96; Raw Materials and Food Products. Determination of Potassium, Calcium, Sodium, Magnesium, Phosphorus, Iron and Zinc by Atomic Absorption Spectrometry. StandardInform: Moscow, Russia, 1996. Available online: https://internet-law.ru/gosts/gost/9123 (accessed on 8 July 2026).
  39. GOST 4386–89; Food Products. Method for Determination of Fluorine Content. StandardInform: Moscow, Russia, 1989. Available online: https://internet-law.ru/gosts/gost/19519/ (accessed on 8 July 2026).
  40. GOST 26930–86; Raw Materials and Food Products. Method for Determination of Iodine Content. StandardInform: Moscow, Russia, 1986. Available online: https://internet-law.ru/gosts/gost/19879/ (accessed on 8 July 2026).
  41. GOST 26932–86; Raw Materials and Food Products. Methods for Determination of Lead. StandardInform: Moscow, Russia, 2010. Available online: https://internet-law.ru/gosts/gost/12234/ (accessed on 8 July 2026).
  42. GOST 26933–86; Raw Materials and Food-Stuff. Methods for Determination of Cadmium. StandardInform: Moscow, Russia, 2010. Available online: https://internet-law.ru/gosts/gost/12363/ (accessed on 8 July 2026).
  43. GOST 26927–86; Raw Material and Food-Stuffs. Methods for Determination of Mercury. StandardInform: Moscow, Russia, 2010. Available online: https://internet-law.ru/gosts/gost/29102/ (accessed on 8 July 2026).
  44. GOST 32195-2013; Feed, Compound Feed. Method for Determining Amino Acid Content. StandardInform: Moscow, Russia, 2020. Available online: https://internet-law.ru/gosts/gost/56066/ (accessed on 8 July 2026).
  45. Guo, X.; Li, C.; Ma, S.; Wang, X. Mechanisms of ice crystal formation and their impact on gluten network stability in frozen dough systems. Food Hydrocoll. 2022, 129, 107624. [Google Scholar] [CrossRef]
  46. Davidson, I. Hydrolysis of samples for amino acid analysis. In Protein Sequencing Protocols; Humana Press: Totowa, NJ, USA, 2003; pp. 111–122. [Google Scholar] [CrossRef] [PubMed]
  47. Zhang, X.; Liu, Y.; Wang, J.; Xu, B. Effect of fruit pomace powder on physicochemical, rheological and antioxidant properties of wheat bread. Food Chem. 2022, 373, 131408. [Google Scholar] [CrossRef] [PubMed]
  48. Yang, J.; Zhang, Y.; Jiang, J.; Zhang, B.; Li, M.; Guo, B. Effects of frozen storage time, thawing treatments, and their interaction on the rheological properties of non-fermented wheat dough. Foods 2023, 12, 4369. [Google Scholar] [CrossRef] [PubMed]
  49. Zhao, Q.; Liu, H.; Huang, W. Cryoprotective effects of plant polysaccharides on gluten structure and starch retrogradation during frozen storage. Carbohydr. Polym. 2021, 272, 118484. [Google Scholar] [CrossRef] [PubMed]
  50. Tungyshbayeva, U.; Mannino, S.; Uazhanova, R.; Adilbekov, M.; Yakiyayeva, M.; Kazhymurat, A. Development of a methodology for determining the critical limits of the critical control points of the production of bakery products in the Republic of Kazakhstan. East.-Eur. J. Enterp. Technol. 2021, 3, 57–69. [Google Scholar] [CrossRef]
  51. Liu, Q.; Zhang, H.; Sun, S. Impact of ice crystal size on structural integrity of frozen dough systems. Food Res. Int. 2022, 156, 111174. [Google Scholar] [CrossRef] [PubMed]
  52. Wang, Y.; Zhao, L.; Chen, J. Influence of freeze–thaw cycles on rheological and microstructural properties of wheat dough. LWT 2023, 176, 114537. [Google Scholar] [CrossRef]
  53. Yang, S.; Jeong, S.; Lee, S. Elucidation of rheological properties and baking performance of frozen doughs under different thawing conditions. J. Food Eng. 2020, 284, 110084. [Google Scholar] [CrossRef]
  54. Li, J.; Sun, Q.; Zhu, K. Modification of gluten structure during frozen storage and its impact on dough functionality. Food Hydrocoll. 2022, 127, 107560. [Google Scholar] [CrossRef]
  55. Verbeke, C.; Debonne, E.; Versele, S.; Van Bockstaele, F.; Eeckhout, M. Technological evaluation of fiber effects in wheat-based dough and bread. Foods 2024, 13, 2582. [Google Scholar] [CrossRef] [PubMed]
  56. Xu, X.; Zhang, L.; Zhao, Y. Rheological and structural properties of composite dough with fruit-derived additives. LWT 2022, 165, 113703. [Google Scholar] [CrossRef]
  57. Iztayev, A.; Urazaliev, R.; Yakiyayeva, M.; Maemerov, M.; Shaimerdenova, D.; Iztayev, B.; Toxanbayeva, B.; Dauletkeldi, Y. Regress models of ion-ozon treatment without and with cavitation, describing changes of indicators for grain crops quality. Acta Tech. CSAV (Ceskoslovensk Akad. Ved) 2018, 63, 1–8. Available online: http://actatechnica.com/63(2018)-1B/Paper%20D-24%20Izitayev.pdf (accessed on 8 July 2026).
  58. Chen, H.; Liu, Y.; Wang, S. Structural evolution of gluten–starch matrix during freezing and thawing. J. Cereal Sci. 2022, 104, 103431. [Google Scholar] [CrossRef]
Figure 1. Laboratory whipping equipment used throughout the study.
Processes 14 02500 g001
Figure 2. Appearance of the control dough and all eighteen experimental whipped dough samples (Samples 1–18) after microwave thawing prior to baking.
Processes 14 02500 g002
Figure 3. Representative rheological profiles of the most and least favorable whipped dough samples: (a) Mixolab curves; (b) force–deformation profiles.
Processes 14 02500 g003aProcesses 14 02500 g003b
Figure 4. Control and apple powder-enriched whipped yeast-free bread samples after baking (external appearance and crumb structure).
Processes 14 02500 g004aProcesses 14 02500 g004b
Figure 5. Response surfaces of dough acidity (y2) as affected by technological parameters: (a) x1–x2; (b) x1–x3; (c) x1–x4; (d) x2–x3; (e) x2–x4; (f) x3–x4.
Processes 14 02500 g005aProcesses 14 02500 g005b
Table 1. Chemical composition of the apple powder (mean ± SD, n = 3).
ParameterValue
Protein (%)2.8 ± 0.1
Carbohydrates (%)88.4 ± 0.6
Dietary fiber (%)16.7 ± 0.4
Ash (%)3.1 ± 0.1
Vitamin E (mg/100 g)0.52 ± 0.04
Vitamin C (mg/100 g)12.6 ± 0.8
Calcium (mg/100 g)78 ± 3
Potassium (mg/100 g)1120 ± 35
Magnesium (mg/100 g)42 ± 2
Iron (mg/100 g)2.7 ± 0.2
Zinc (mg/100 g)0.66 ± 0.03
Table 3. Processing conditions applied to whipped frozen dough samples.
Sample NumberApple Powder (g/batch)Whipping
Speed (rpm)
Whipping Time (min)Freezing
Temperature (°C)
Microwave Thawing Time (min)
1509007−388
2504507−388
3509003−388
4504503−388
5509007−384
6504507−384
71009003−384
81004503−384
91009007−148
101004507−148
111009003−148
121004503−148
131509007−148
141504507−144
151509003−144
161504503−144
171006755−266
181006755−266
Table 4. Structural–mechanical properties of whipped yeast-free dough before baking (mean ± SD, n = 5).
SampleTotal Deformation (H1), mmPlastic Deformation (H2), mmElastic Deformation (H3), mmDough Temperature (°C)
Control8.43 ± 0.215.07 ± 0.183.36 ± 0.1526.1 ± 0.2
Sample 15.71 ± 0.192.30 ± 0.113.40 ± 0.1324.2 ± 0.3
Sample 25.07 ± 0.172.34 ± 0.102.72 ± 0.1227.5 ± 0.3
Sample 34.21 ± 0.161.46 ± 0.092.75 ± 0.1026.0 ± 0.2
Sample 47.27 ± 0.204.01 ± 0.153.25 ± 0.1424.5 ± 0.2
Sample 510.04 ± 0.243.64 ± 0.136.40 ± 0.1925.1 ± 0.2
Sample 63.89 ± 0.141.42 ± 0.082.46 ± 0.0925.9 ± 0.3
Sample 76.85 ± 0.183.49 ± 0.123.35 ± 0.1326.6 ± 0.2
Sample 86.46 ± 0.173.32 ± 0.113.14 ± 0.1223.9 ± 0.3
Sample 95.02 ± 0.161.49 ± 0.093.53 ± 0.1426.1 ± 0.2
Sample 103.20 ± 0.131.59 ± 0.081.60 ± 0.0826.4 ± 0.2
Sample 113.71 ± 0.142.35 ± 0.101.36 ± 0.0725.3 ± 0.3
Sample 121.95 ± 0.100.88 ± 0.051.00 ± 0.0525.0 ± 0.2
Sample 136.94 ± 0.192.73 ± 0.114.21 ± 0.1624.7 ± 0.2
Sample 143.12 ± 0.121.57 ± 0.081.54 ± 0.0724.3 ± 0.2
Sample 154.11 ± 0.152.13 ± 0.091.98 ± 0.0825.3 ± 0.2
Sample 163.61 ± 0.131.58 ± 0.082.00 ± 0.0924.7 ± 0.2
Note: Values are presented as mean ± standard deviation (M ± SD, n = 5).
Table 5. Mixolab rheological indices of whipped yeast-free dough after freeze–thaw treatment.
Sample NumberViscosity IndexStarch Retrogradation Index
Control1.01.0
11.51.0
21.01.0
31.01.0
45.03.0
51.01.0
65.03.0
75.04.0
81.01.0
92.02.0
101.01.0
111.81.0
121.01.0
131.91.0
141.01.0
151.01.4
161.71.0
Note: Rheological indices were automatically generated by the Mixolab software (Version 4.2, Chopin Technologies, Villeneuve-la-Garenne, France) based on the thermomechanical response of the dough. Higher viscosity index values indicate greater resistance of the dough during heating, whereas higher starch retrogradation index values indicate increased starch recrystallization during cooling.
Table 6. Physicochemical characteristics of whipped dough before freezing and density after freeze–thaw treatment (mean ± SD, n = 3).
SampleMoisture (%)Acidity (°T)Density After Thawing (g cm−3)
Control46.1 ± 0.22.6 ± 0.10.69 ± 0.01
50 g Apple Powder (Samples 1–5)45.9 ± 0.33.0 ± 0.10.66 ± 0.02
100 g Apple Powder (Samples 6–10)45.2 ± 0.33.5 ± 0.20.63 ± 0.02
150 g Apple Powder (Samples 11–16)44.3 ± 0.34.0 ± 0.20.60 ± 0.02
Note: Values are presented as mean ± standard deviation (M ± SD, n = 3).
Table 8. Ranges of physicochemical properties of baked whipped bread obtained under different processing conditions.
Sample GroupIndicators
Moisture (%)Acidity (°T)Porosity (%)Specific Volume (cm3 g−1)
Control41.2 ± 0.32.8 ± 0.162.0 ± 1.02.40 ± 0.05
Samples 1–5 (50 g AP)40.8 ± 0.23.2 ± 0.166.0 ± 1.82.65 ± 0.12
Samples 6–10 (100 g AP)40.1 ± 0.33.5 ± 0.171.0 ± 2.03.00 ± 0.15
Samples 11–16 (150 g AP)39.2 ± 0.24.0 ± 0.273.0 ± 2.33.15 ± 0.18
Note: Values represent the ranges observed among the experimental formulations within each apple powder level.
Table 9. Biochemical composition of whipped yeast-free bread (mean ± SD, n = 3).
ParameterControl50 g Apple Powder100 g Apple Powder150 g Apple Powder
Protein (%)7.50 ± 0.127.80 ± 0.158.20 ± 0.148.60 ± 0.18
Fat (%)0.42 ± 0.020.48 ± 0.020.61 ± 0.030.73 ± 0.03
Carbohydrates (%)22.9 ± 0.424.3 ± 0.526.8 ± 0.428.4 ± 0.5
Dietary fiber (%)4.8 ± 0.25.4 ± 0.26.1 ± 0.37.3 ± 0.3
Vitamin B1 (mg/100 g)0.04 ± 0.010.05 ± 0.010.05 ± 0.010.06 ± 0.01
Vitamin B2 (mg/100 g)0.03 ± 0.010.03 ± 0.010.04 ± 0.010.04 ± 0.01
Vitamin B3 (mg/100 g)1.40 ± 0.051.65 ± 0.061.82 ± 0.071.94 ± 0.08
Vitamin B6 (mg/100 g)0.13 ± 0.010.16 ± 0.010.22 ± 0.020.30 ± 0.02
Vitamin C (mg/100 g)n.d.0.70 ± 0.041.50 ± 0.062.20 ± 0.08
Iron (mg/100 g)2.45 ± 0.082.73 ± 0.103.14 ± 0.123.20 ± 0.11
Potassium (mg/100 g)125.6 ± 3.4147.3 ± 4.1150.2 ± 4.5156.7 ± 4.8
Calcium (mg/100 g)23.0 ± 0.824.4 ± 0.926.7 ± 1.028.1 ± 1.1
Pbn.d.n.d.n.d.n.d.
Cdn.d.n.d.n.d.n.d.
Asn.d.n.d.n.d.n.d.
Hgn.d.n.d.n.d.n.d.
Note: Values are presented as mean ± standard deviation (M ± SD, n = 3). n.d. = not detected (below the analytical limit of detection).
Table 10. Amino acid composition of whipped yeast-free bread (g/100 g product, mean ± SD, n = 3).
Amino AcidControl50 g Apple Powder100 g Apple Powder150 g Apple Powder
Lysine0.26 ± 0.010.29 ± 0.010.31 ± 0.010.34 ± 0.02
Threonine0.29 ± 0.010.32 ± 0.010.36 ± 0.020.41 ± 0.02
Valine0.43 ± 0.020.47 ± 0.020.52 ± 0.020.58 ± 0.03
Leucine + Isoleucine0.51 ± 0.020.55 ± 0.020.60 ± 0.030.66 ± 0.03
Methionine0.20 ± 0.010.21 ± 0.010.23 ± 0.010.26 ± 0.01
Phenylalanine + Tyrosine0.53 ± 0.020.57 ± 0.020.63 ± 0.030.71 ± 0.03
Histidine0.05 ± 0.010.06 ± 0.010.07 ± 0.010.08 ± 0.01
Proline0.65 ± 0.030.73 ± 0.030.89 ± 0.041.05 ± 0.05
Alanine0.35 ± 0.020.39 ± 0.020.46 ± 0.020.53 ± 0.03
Glycine0.32 ± 0.010.36 ± 0.020.41 ± 0.020.48 ± 0.02
Arginine0.24 ± 0.010.28 ± 0.010.33 ± 0.020.38 ± 0.02
Serine0.43 ± 0.020.47 ± 0.020.54 ± 0.030.62 ± 0.03
Note: Values are presented as mean ± standard deviation (M ± SD, n = 3) and expressed on a fresh product basis (g/100 g product).
Table 11. Microbiological characteristics of whipped yeast-free bread during storage (mean ± SD, n = 3).
SampleTotal Mesophilic Aerobic Count (CFU g−1, 0 h)Total Mesophilic Aerobic Count (CFU g−1, 72 h)Coliform BacteriaYeasts and Molds (CFU g−1)
Control(4.7 ± 0.2) × 103(6.2 ± 0.3) × 103Not detected<1.0 × 10²
50 g Apple Powder(3.2 ± 0.2) × 103(3.9 ± 0.2) × 103Not detected<1.0 × 10²
100 g Apple Powder(2.6 ± 0.1) × 103(3.4 ± 0.2) × 103Not detected<1.0 × 10²
150 g Apple Powder(2.1 ± 0.1) × 103(3.1 ± 0.2) × 103Not detected<1.0 × 10²
Note: Values are presented as mean ± standard deviation (M ± SD, n = 3). Coliform bacteria were not detected in any sample. Yeast and mold counts remained below the analytical detection limit throughout storage.
Disclaimer/Publisher’s Note: The statements, opinions and data contained in all publications are solely those of the individual author(s) and contributor(s) and not of MDPI and/or the editor(s). MDPI and/or the editor(s) disclaim responsibility for any injury to people or property resulting from any ideas, methods, instructions or products referred to in the content.