An Identification Method for Coal and Gas Outburst Based on Stacking Ensemble Learning



Abstract
1. Introduction
2. Analysis of Coal and Gas Outburst Indices and Feature Selection
2.1. Coal and Gas Outburst Indices
- (1)
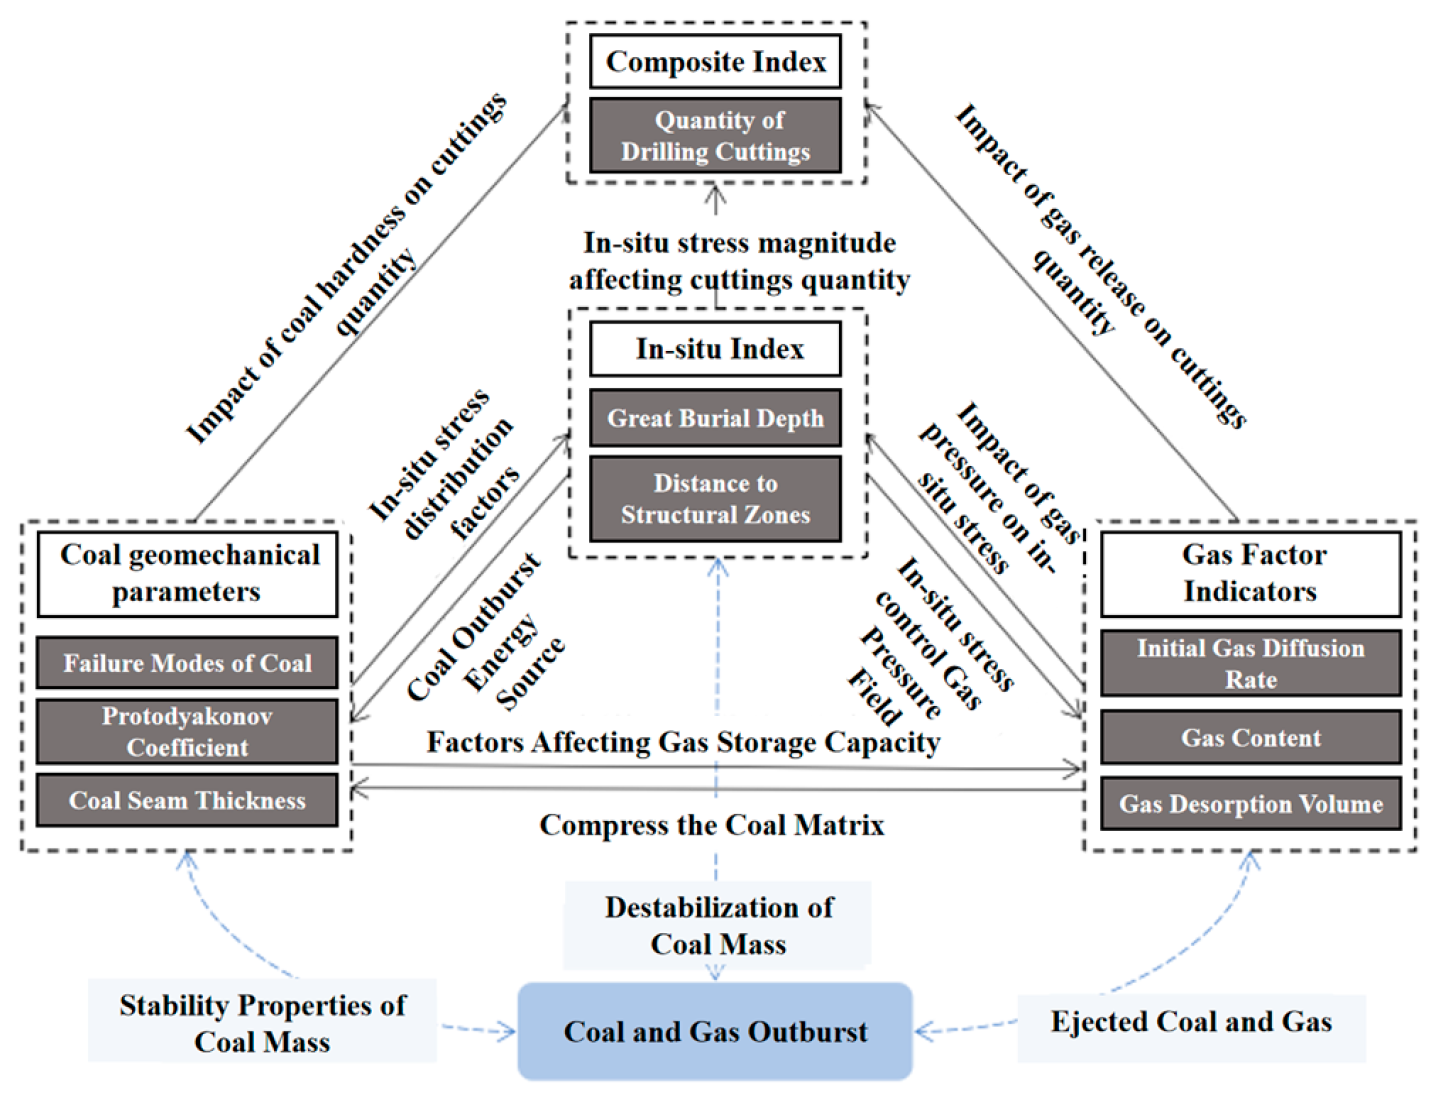
- Crustal stress. Crustal stress is a natural stress free of engineering disturbance in the earth’s crust, playing a relatively important role in coal and gas outburst. Not composed of a single stress factor, crustal stress is formed by multi-stress superposition, mainly including strata stress, concentrated stress, and tectonic stress. The buried depth mainly affects strata stress and concentrated stress. With the increase in coal seam depth, gas is further endowed with power, aggravating the risk of outburst. The distance from the geological structural belt mainly influences tectonic stress, and the division of tectonic complexity is closely related to such characteristics as faults, wrinkles, and joints [19]. In special small tectonic belts that cannot be discovered and surveyed by the existing detection techniques, this index can be quantitatively substituted by the tectonic activity of geomorphic features to reduce errors.
- (2)
- Gas factors. Gas refers to the methane-dominated flammable and explosive gas produced from coal seams and surrounding rocks in mining. As a necessary condition for coal and gas outburst, gas functions mainly by throwing and transporting coal masses out in the process of outburst [20]. The indices closely correlated with gas factors include the initial gas diffusion speed, gas content, and gas desorption capacity. A danger of outburst will occur when the gas content and gas diffusion speed in a coal seam reach specific critical values.
- (3)
- Physical and mechanical properties of coal. This factor, which also determines the difficulty in outburst occurrence and development, is related to such factors as coal failure type, coal firmness coefficient, and coal thickness [21]. The smaller the coal firmness coefficient, the softer the coal body; the greater the coal seam thickness, the poorer the coal stability. All the above factors will intensify the risk of outburst.
- (4)
- Comprehensive index. The amount of drilling cuttings is an index that comprehensively reflects the stress, gas pressure, and physical and mechanical properties of coal. The harder the coal body, the smaller the amount of drilling cuttings. A higher crustal stress will aggravate the difficulty in drilling, further increasing the amount of drilling cuttings.
2.2. Evaluation of Coal and Gas Outburst Risk
2.3. Characteristic Engineering
2.3.1. Statistical Test of Data
2.3.2. Spearman Correlation Analysis
- (1)
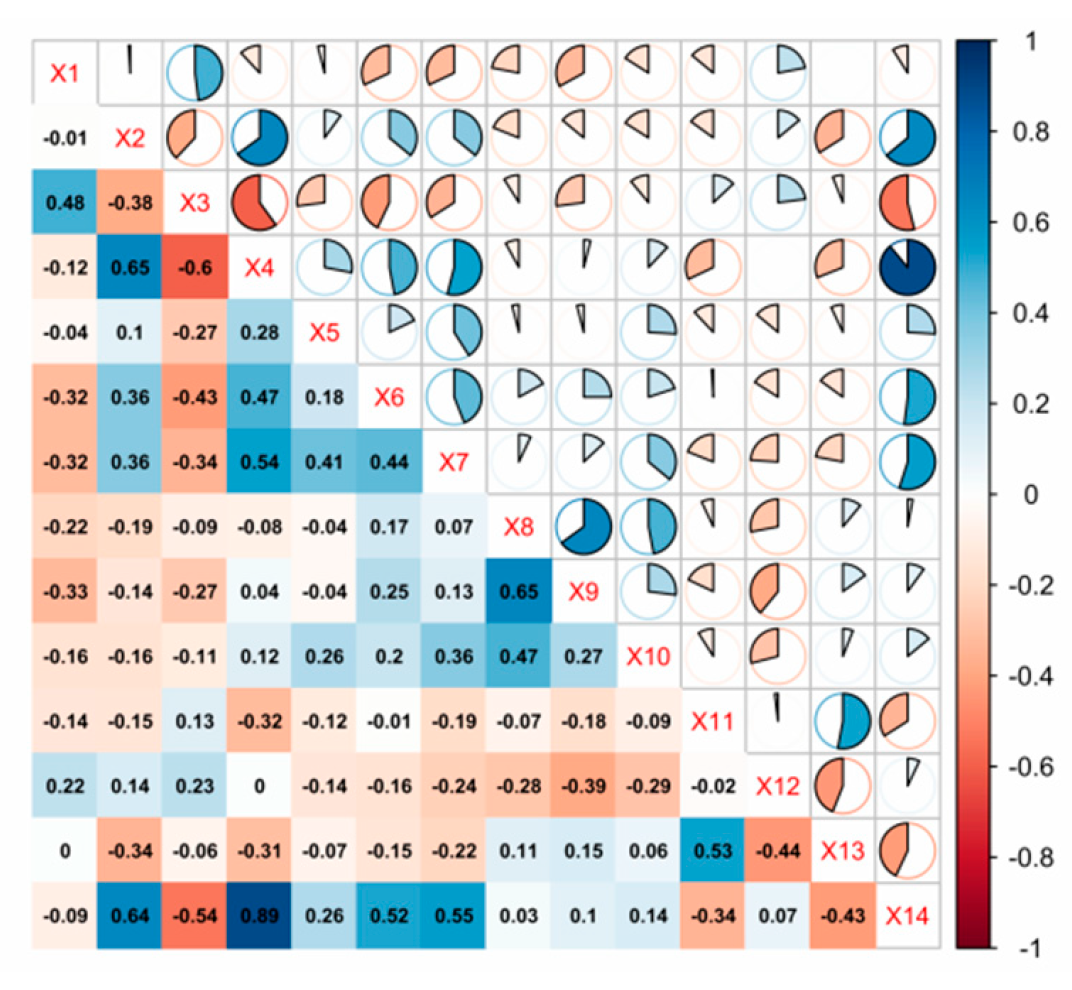
- Correlation analysis between each feature and outburst risk level: The four variables—the initial gas diffusion speed, the coal firmness coefficient, gas content, and the 2nd gas desorption capacity—are closely related to the gas outburst risk level. Among them, the correlation coefficients of X2 (initial gas diffusion speed) and X6–X7 (the second and third gas desorption capacities) with X14 (outburst risk) are 0.64, 0.52, and 0.55, respectively, reaching moderate positive correlation degrees; the correlation coefficient between X4 (gas content) and X14 (outburst risk) is 0.89, reaching a highly positive correlation degree; and the correlation coefficient between X3 (coal firmness coefficient) and X14 (outburst risk) is −0.54, reaching a moderate negative correlation degree.
- (2)
- Correlation analysis between feature sets: Among the feature indices regarding coal and gas outburst data, specific correlations are observed between multiple groups of variables, e.g., some moderately correlated feature sets: the correlation coefficient between X2 (initial gas diffusion speed) and X4 (gas content) is 0.65, and that between X8 (amount of drilling cuttings at the first position) and X9 (amount of drilling cuttings at the second position) is 0.65.
2.3.3. Contribution Rate Analysis of Influencing Factors Based on RF
3. Establishment of the Coal and Gas Outburst Early Warning Model
3.1. Processing of Unbalanced Data Based on Borderline-SMOTE
- (1)
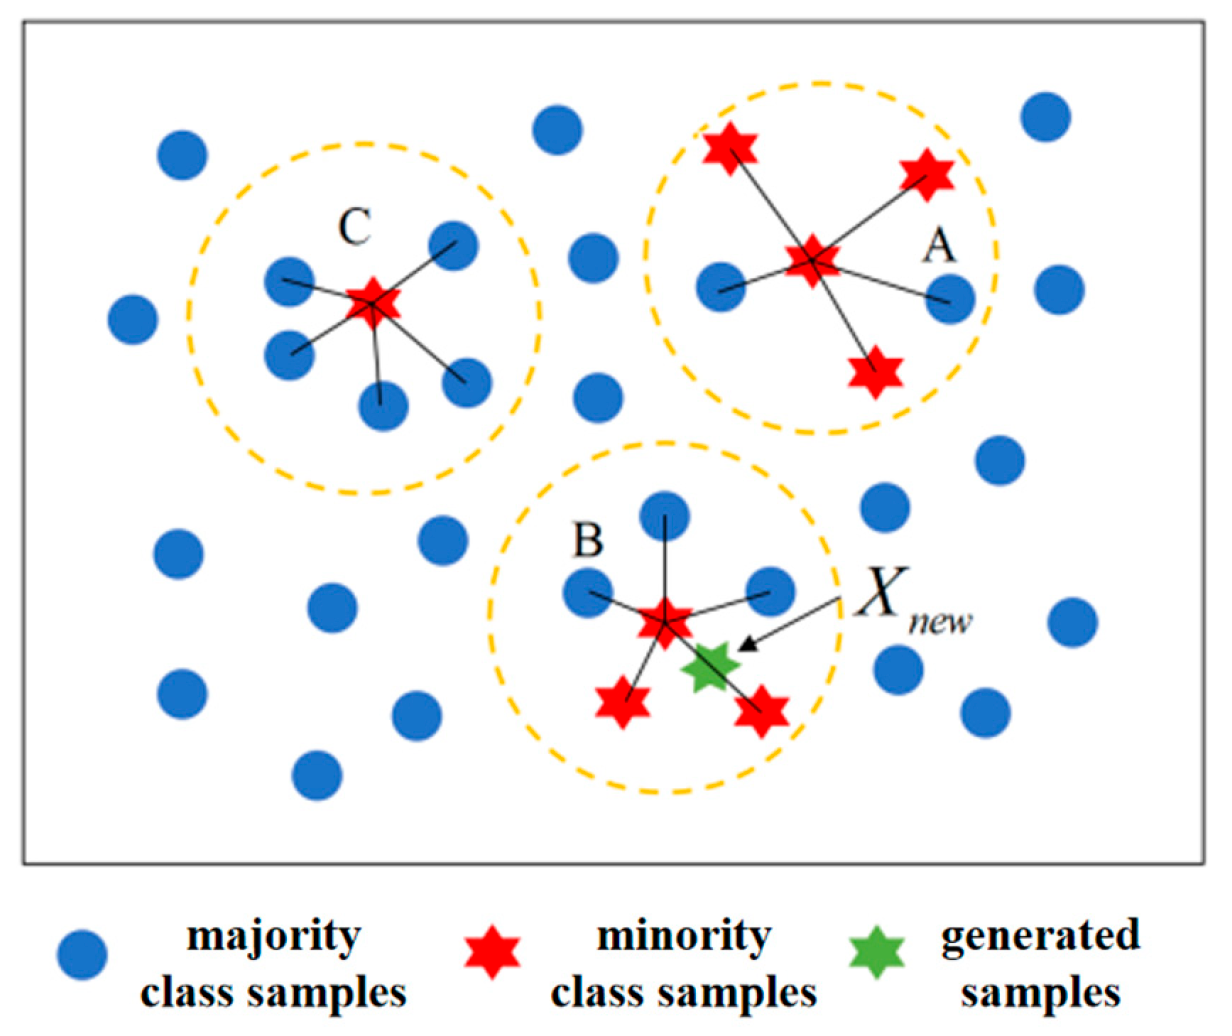
- Samples nearest to the minority category sample are solved through the k-nearest neighbor method, and their distance is solved as per Formula (1): solving the difficulty in learning boundary samples in the process of expanding unbalanced data [24], specifically as follows:where denotes the Euclidean distance between two sample points, and are two sample points (feature vectors) in the dataset, n is the number of feature dimensions, and and are the k-th feature values of the two samples, and .
- (2)
- The category samples in the -nearest neighbor samples are counted and denoted as . Category division is performed for this minority category sample according to the rules corresponding to different values. If , this sample is considered a safety point when over half of the points around the sample are minority category samples, as shown in Point A in Figure 6; if , this sample is regarded as a risk point when over half of the points around the sample are majority category samples, e.g., Point B in Figure 6; and if , this sample is considered a noise point when all points around the sample are majority category samples, like Point C in Figure 6.
- (3)
- Since risk categories can be easily misclassified, only the randomly selected minority category samples marked as risk categories were subject to the synthesis of new samples, as seen in Formula (2):where denotes a randomly selected minority-class sample that has been labeled as a risk point (i.e., more than half of its k-nearest neighbors belong to the majority class); denotes one of the risk-point samples among the k-nearest neighbors of ; and rand(0,1) is a random number drawn from a uniform distribution over the interval [0, 1], which determines the interpolation position between and . The newly synthesized sample is assigned the same class label as (minority class). This interpolation procedure generates new samples along the line segment connecting the selected minority sample and its neighboring risk-point sample, thereby augmenting the minority class while preserving the local data structure. The complete synthesis process is governed by Equation (2).
3.2. Coal and Gas Outburst Model Based on Stacking Ensemble Learning
3.2.1. Principle of Stacking Ensemble Learning
3.2.2. Modeling
4. Experimental Results and Discussion
4.1. Model Evaluation Indices
4.2. Data Balancing Effect
4.3. Parameter Optimization and Model Validation
4.3.1. Model Training and Parameter Optimization
4.3.2. Comparative Evaluation of Models
4.4. Model Stability Test
5. Analysis of Coal and Gas Outburst Cases
6. Conclusions
- (1)
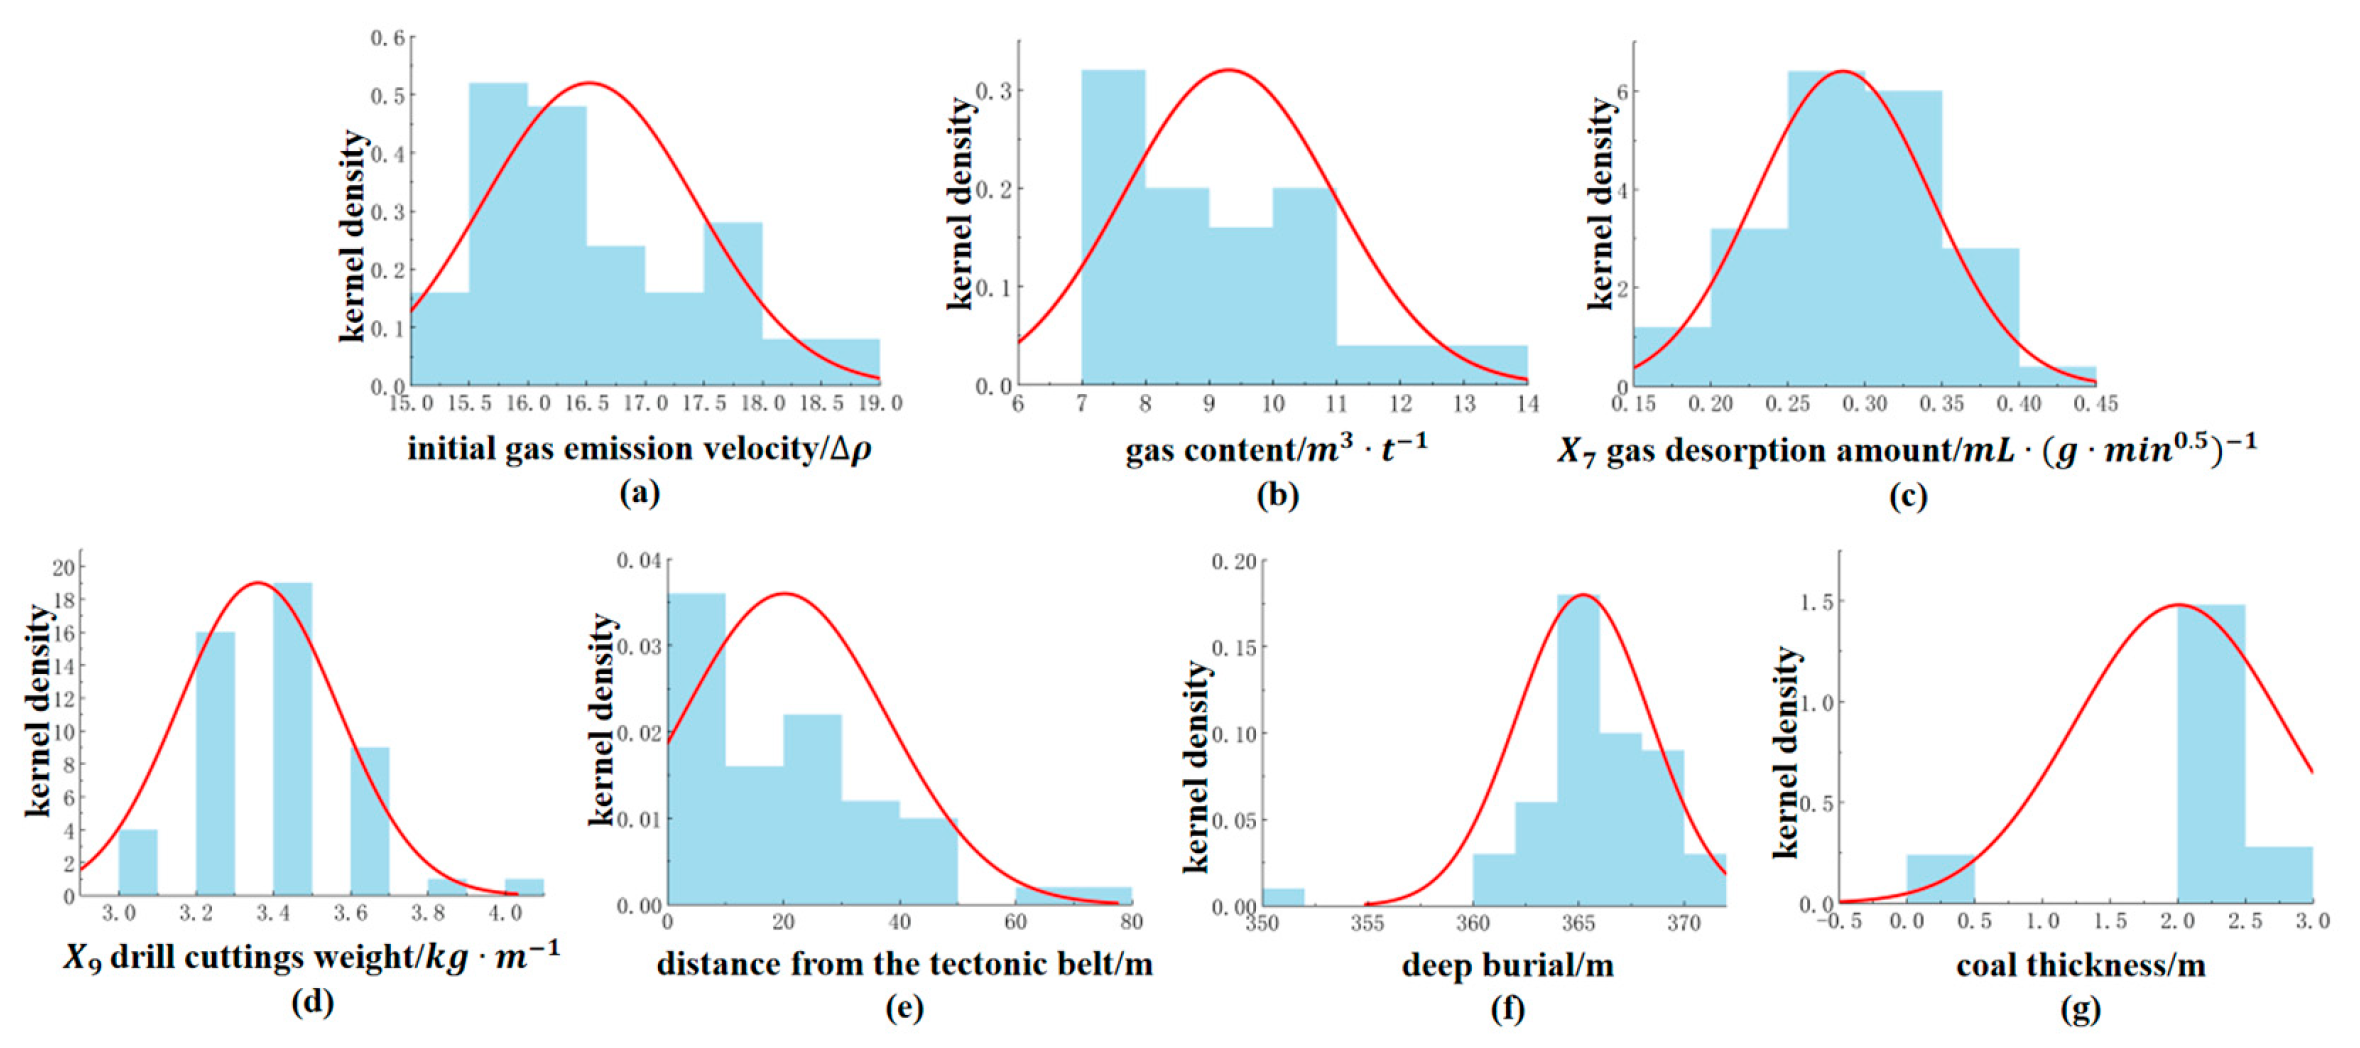
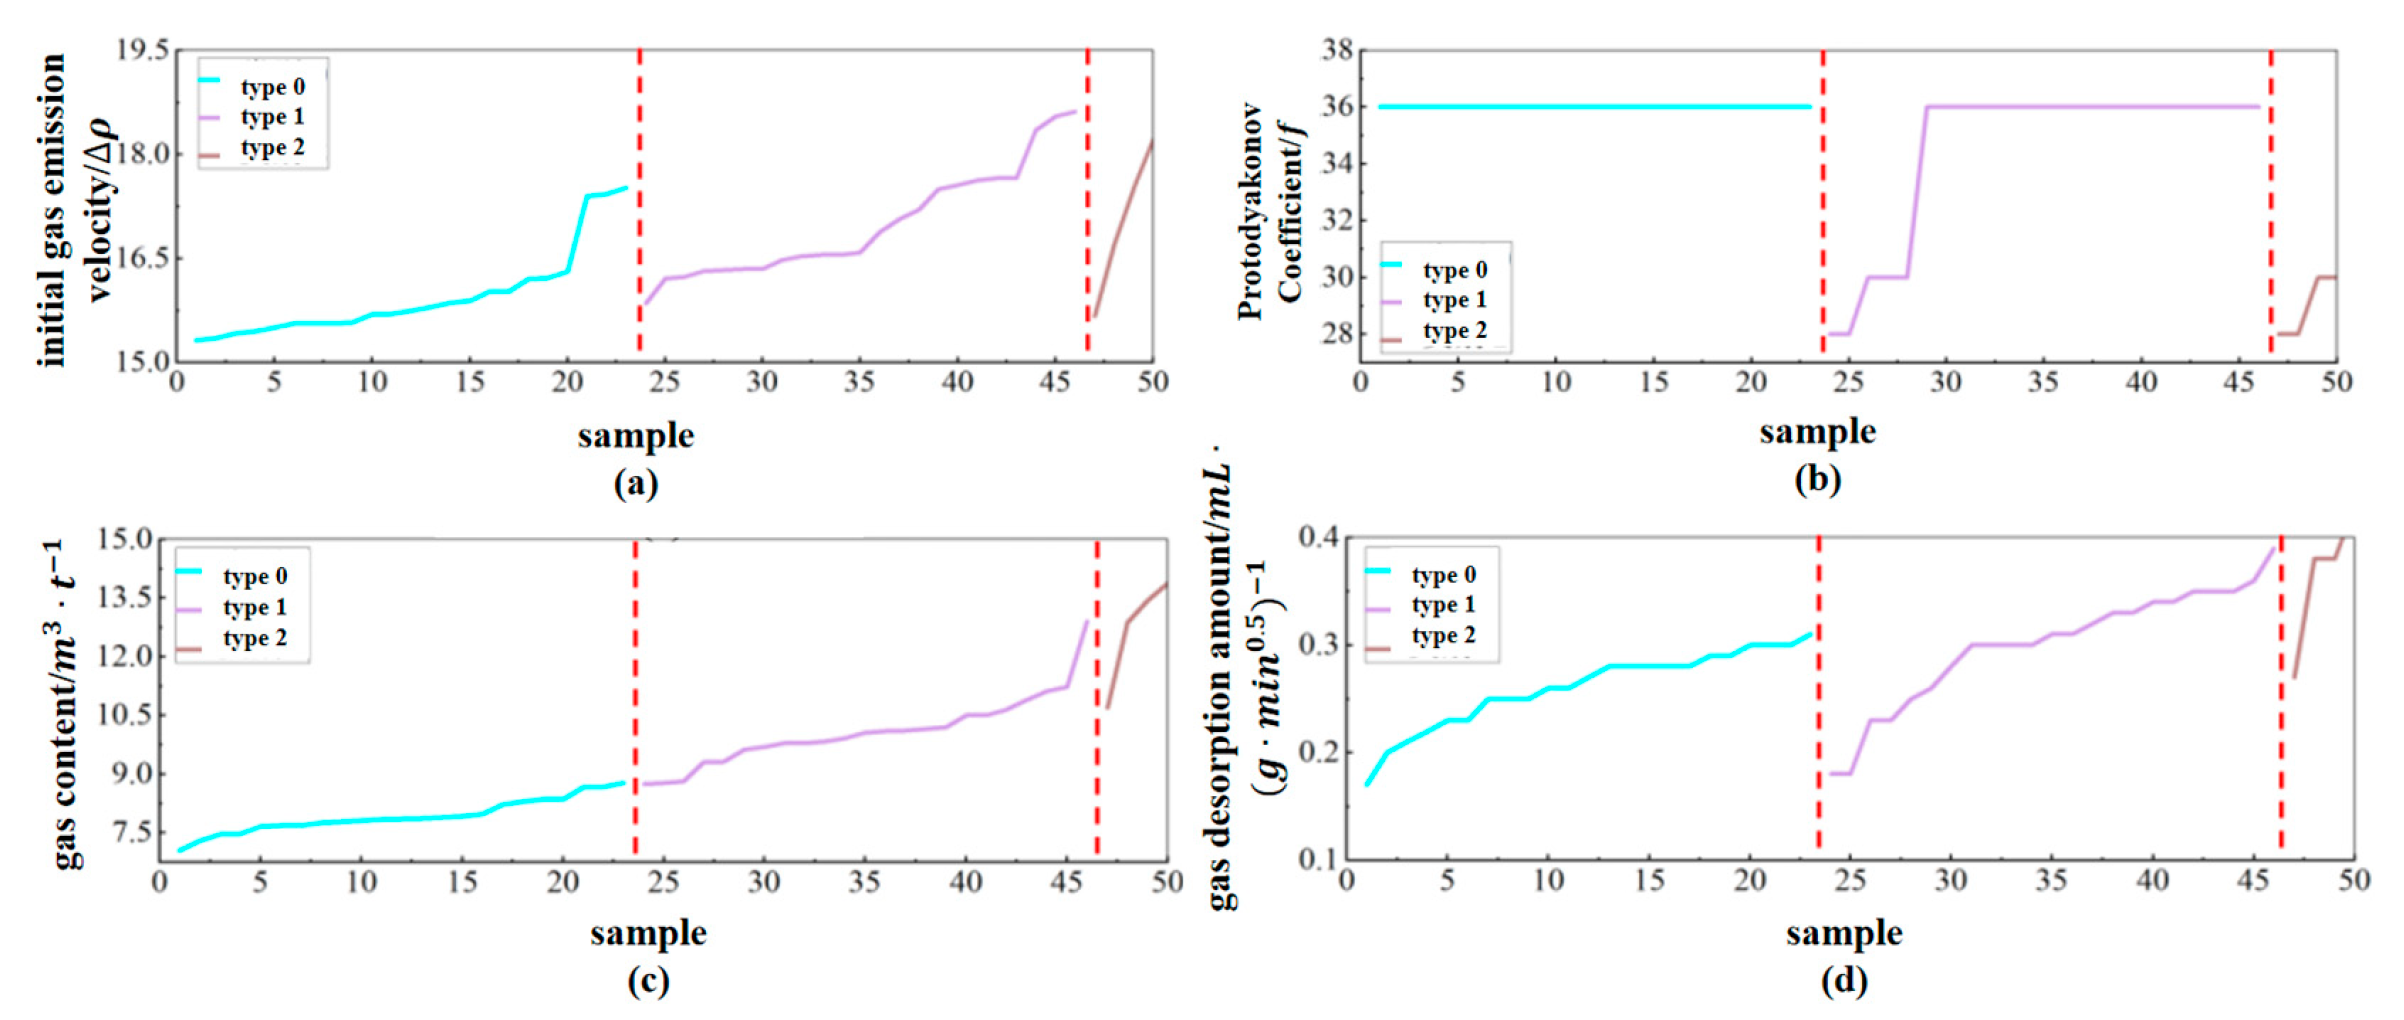
- When mining the influencing factors of coal and gas outburst, the coal and gas outburst datasets were subject to the Spearman correlation analysis. Combining the coal and gas outburst index system and the visualization analysis and test, the relevant conclusions were drawn as follows: The initial gas diffusion speed, gas content, and gas desorption capacity have positive effects on the outburst risk; the threshold interval for the gas content without any gas outburst risk is 7.0–8.7 and that for the gas content with gas outburst risks is 8.7–13.9. The coal firmness coefficient influences the outburst risk negatively: the lower the coal firmness coefficient, the higher the corresponding outburst risk.
- (2)
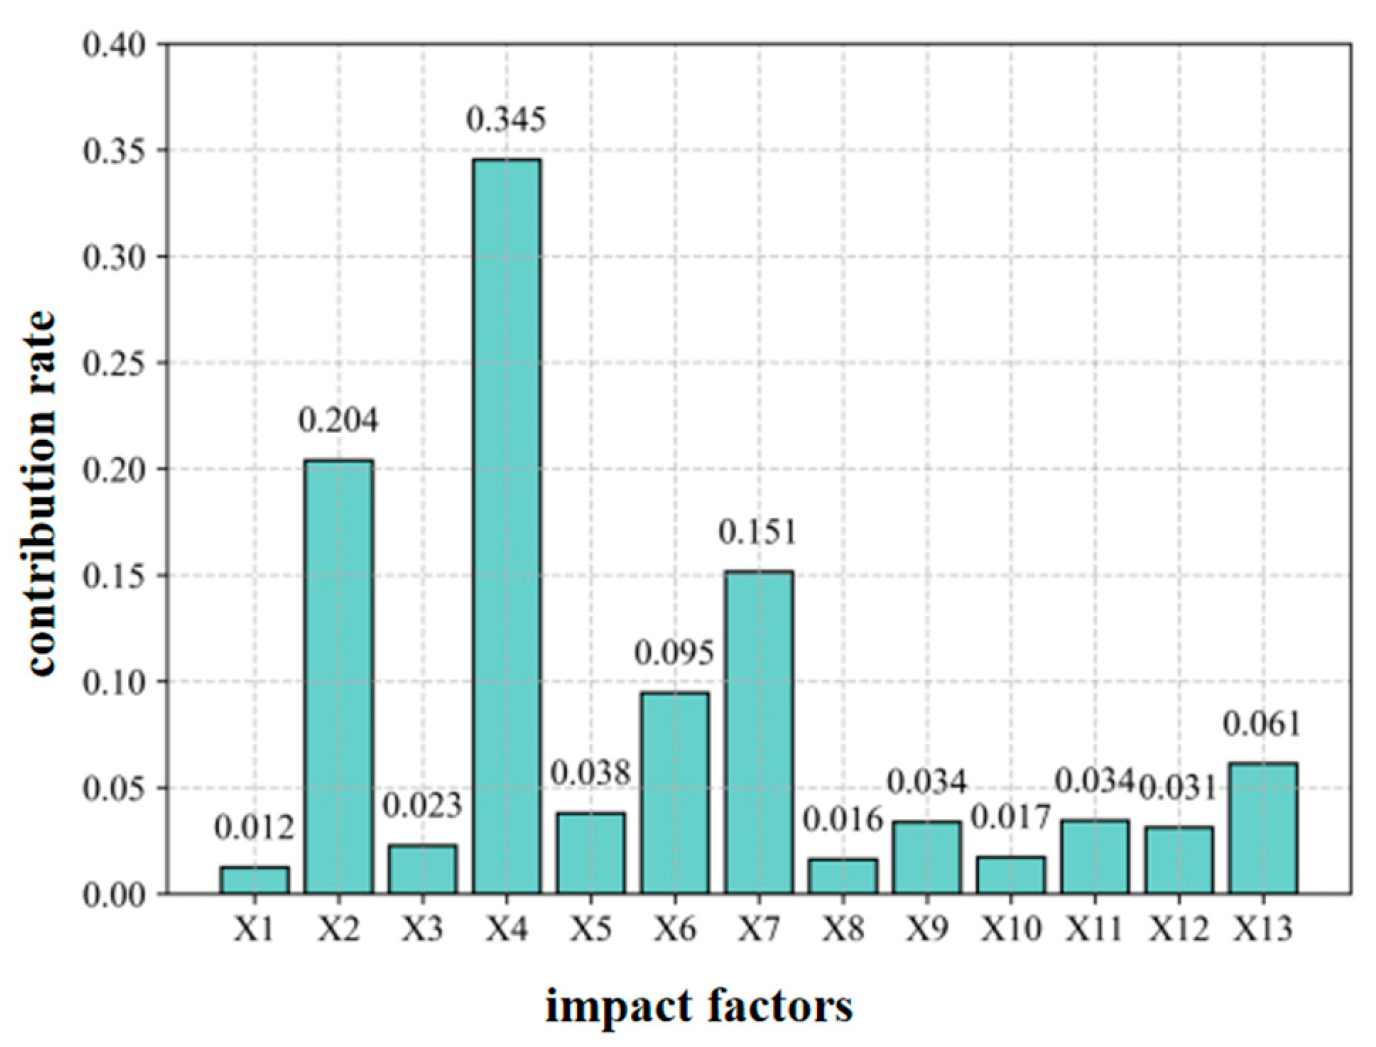
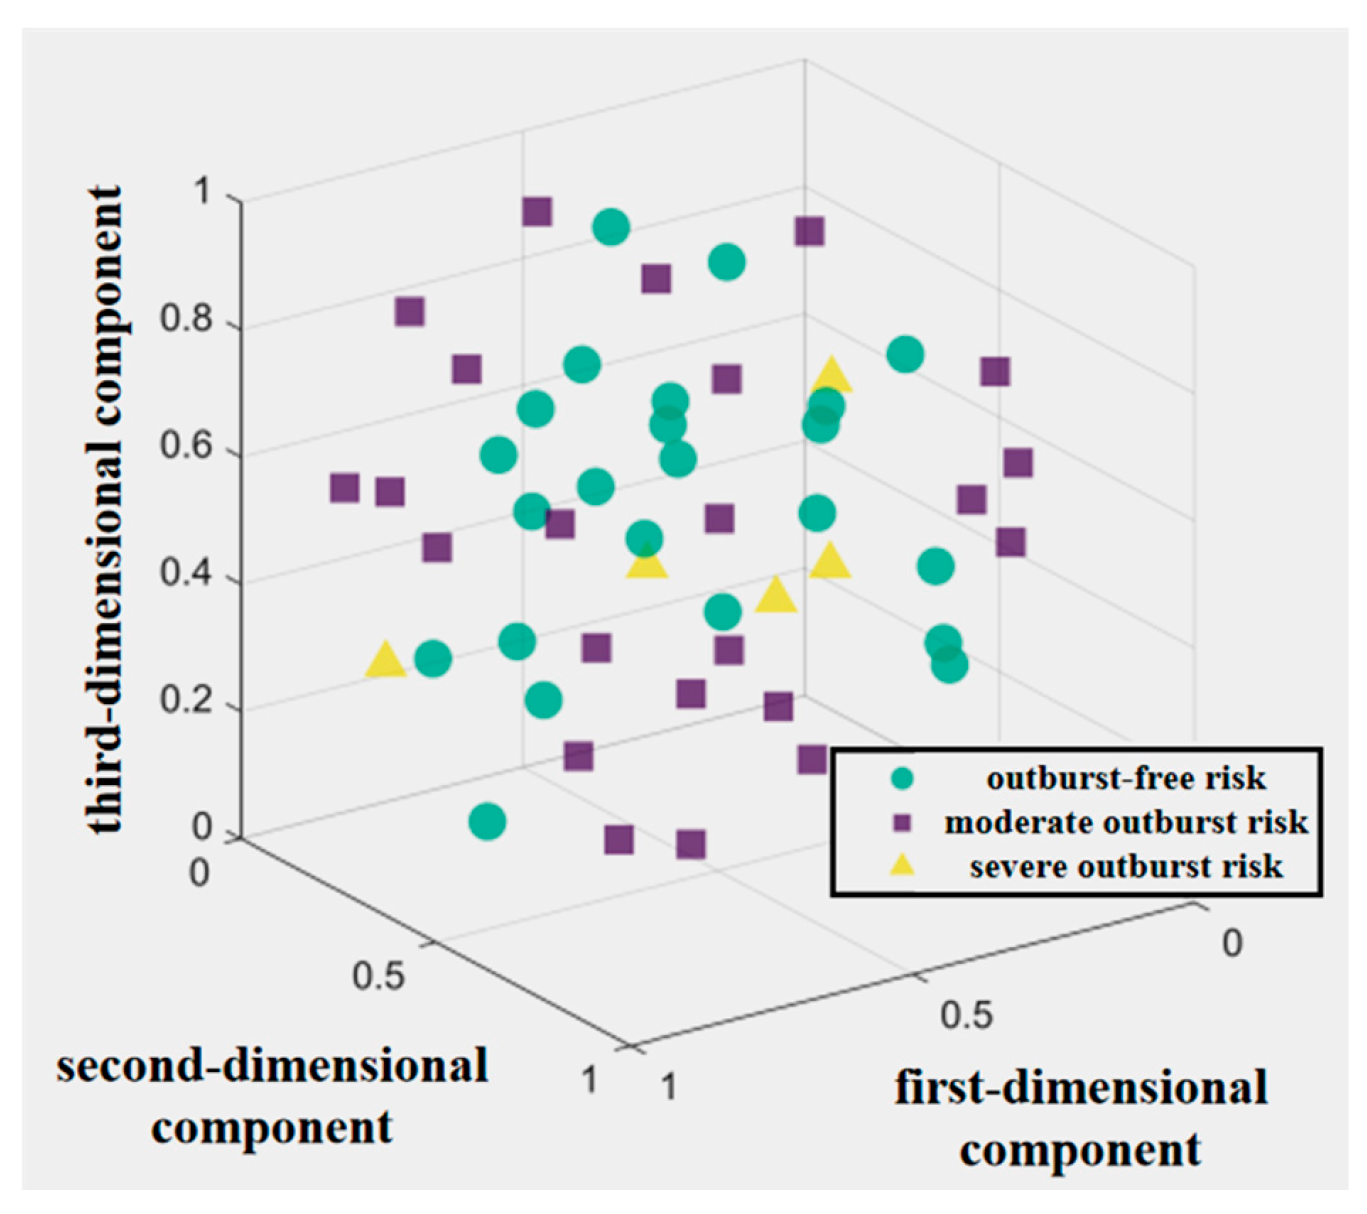
- In the characteristic engineering processing of data, the contribution rates of characteristic factors were ranked through the RF method, and redundant variables were excluded; the dataset after RF-based dimension reduction was reconstructed via the Borderline-SMOTE algorithm, improving the sample data imbalance of the original data, further enhancing data diversity and category balance, and ensuring a reasonable data distribution.
- (3)
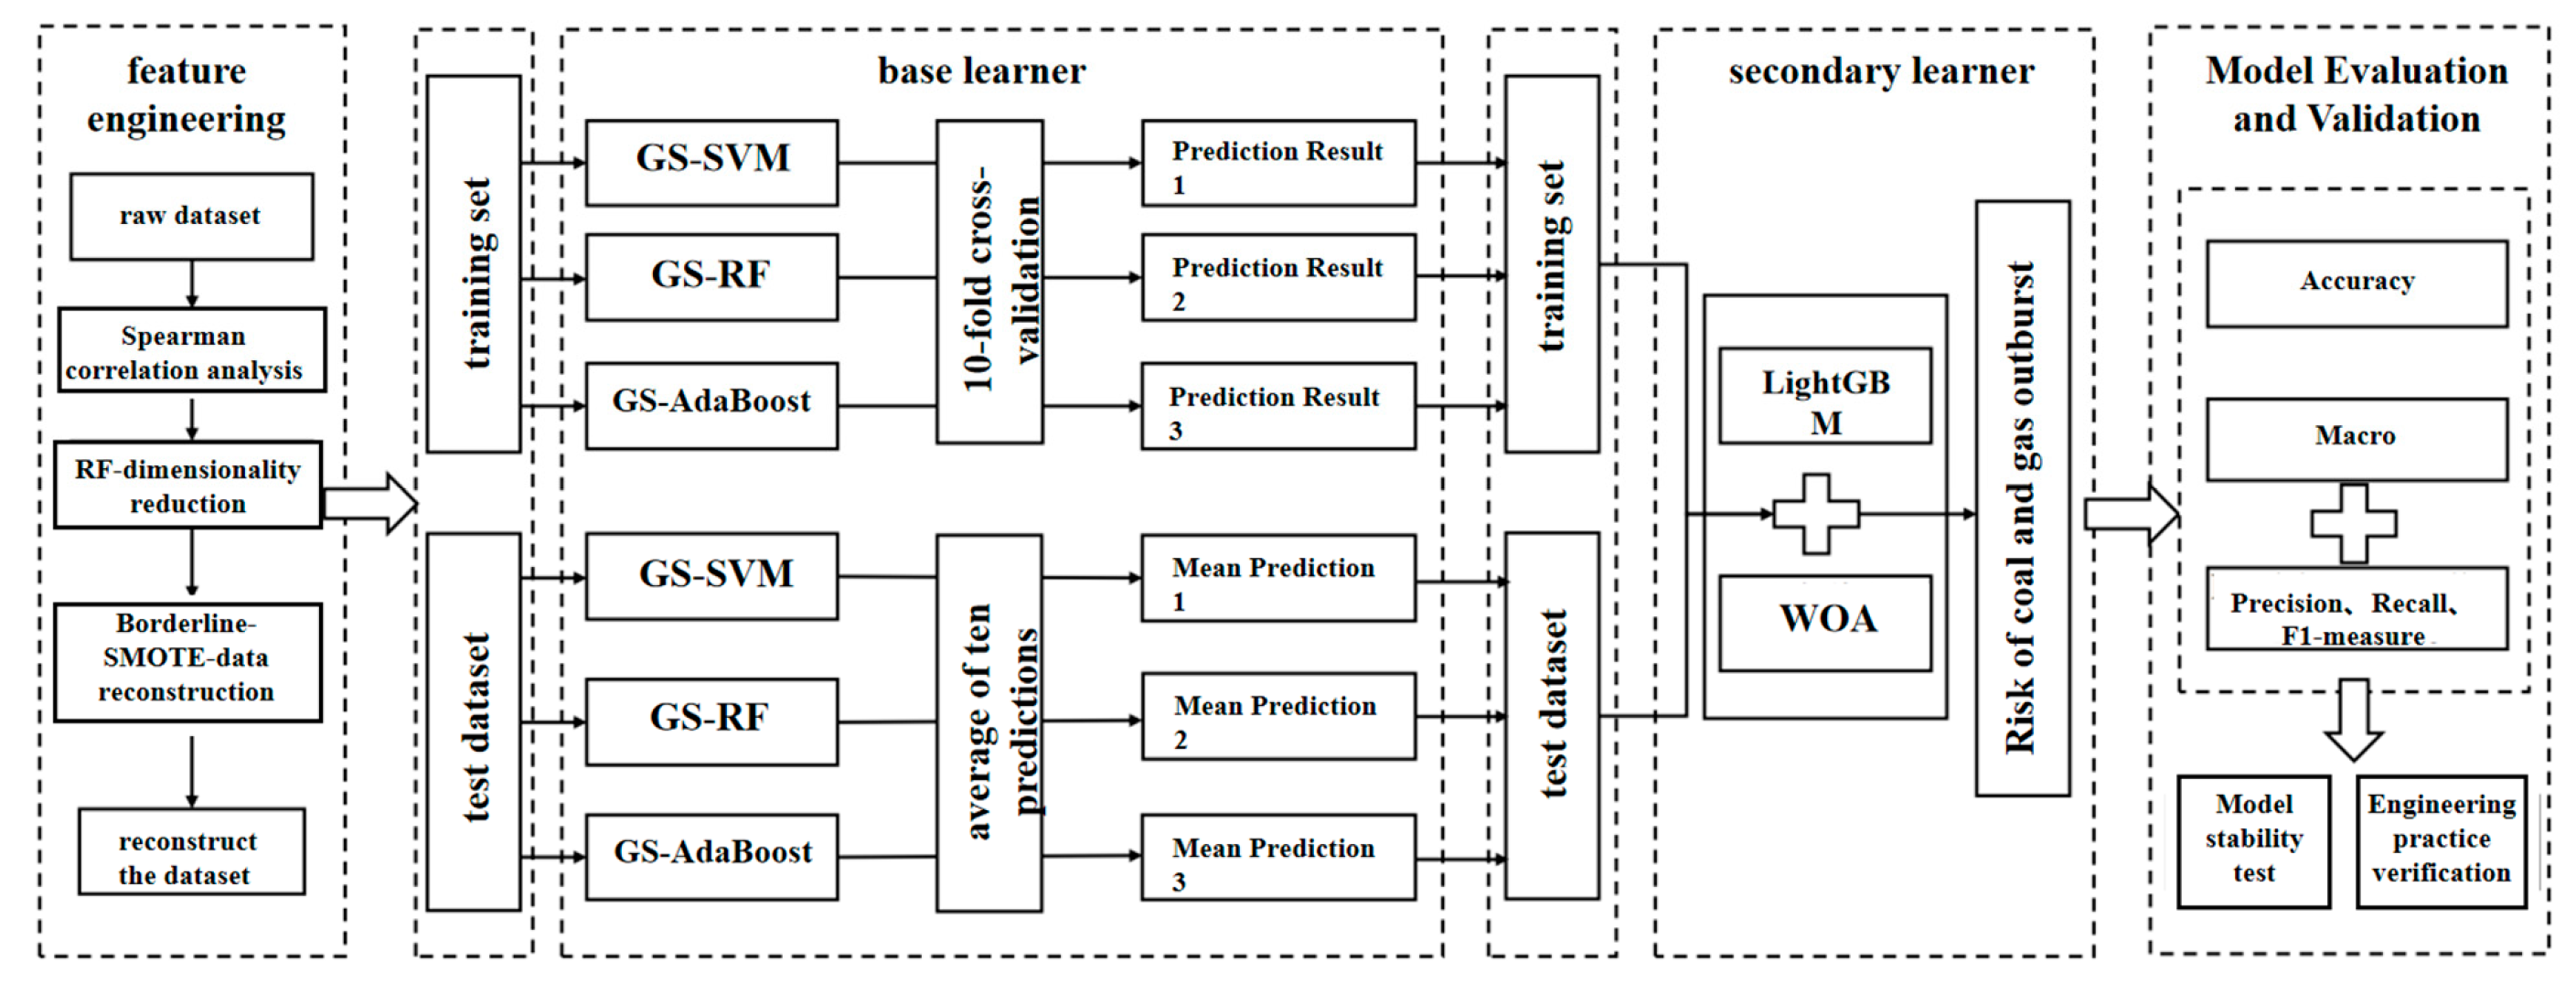
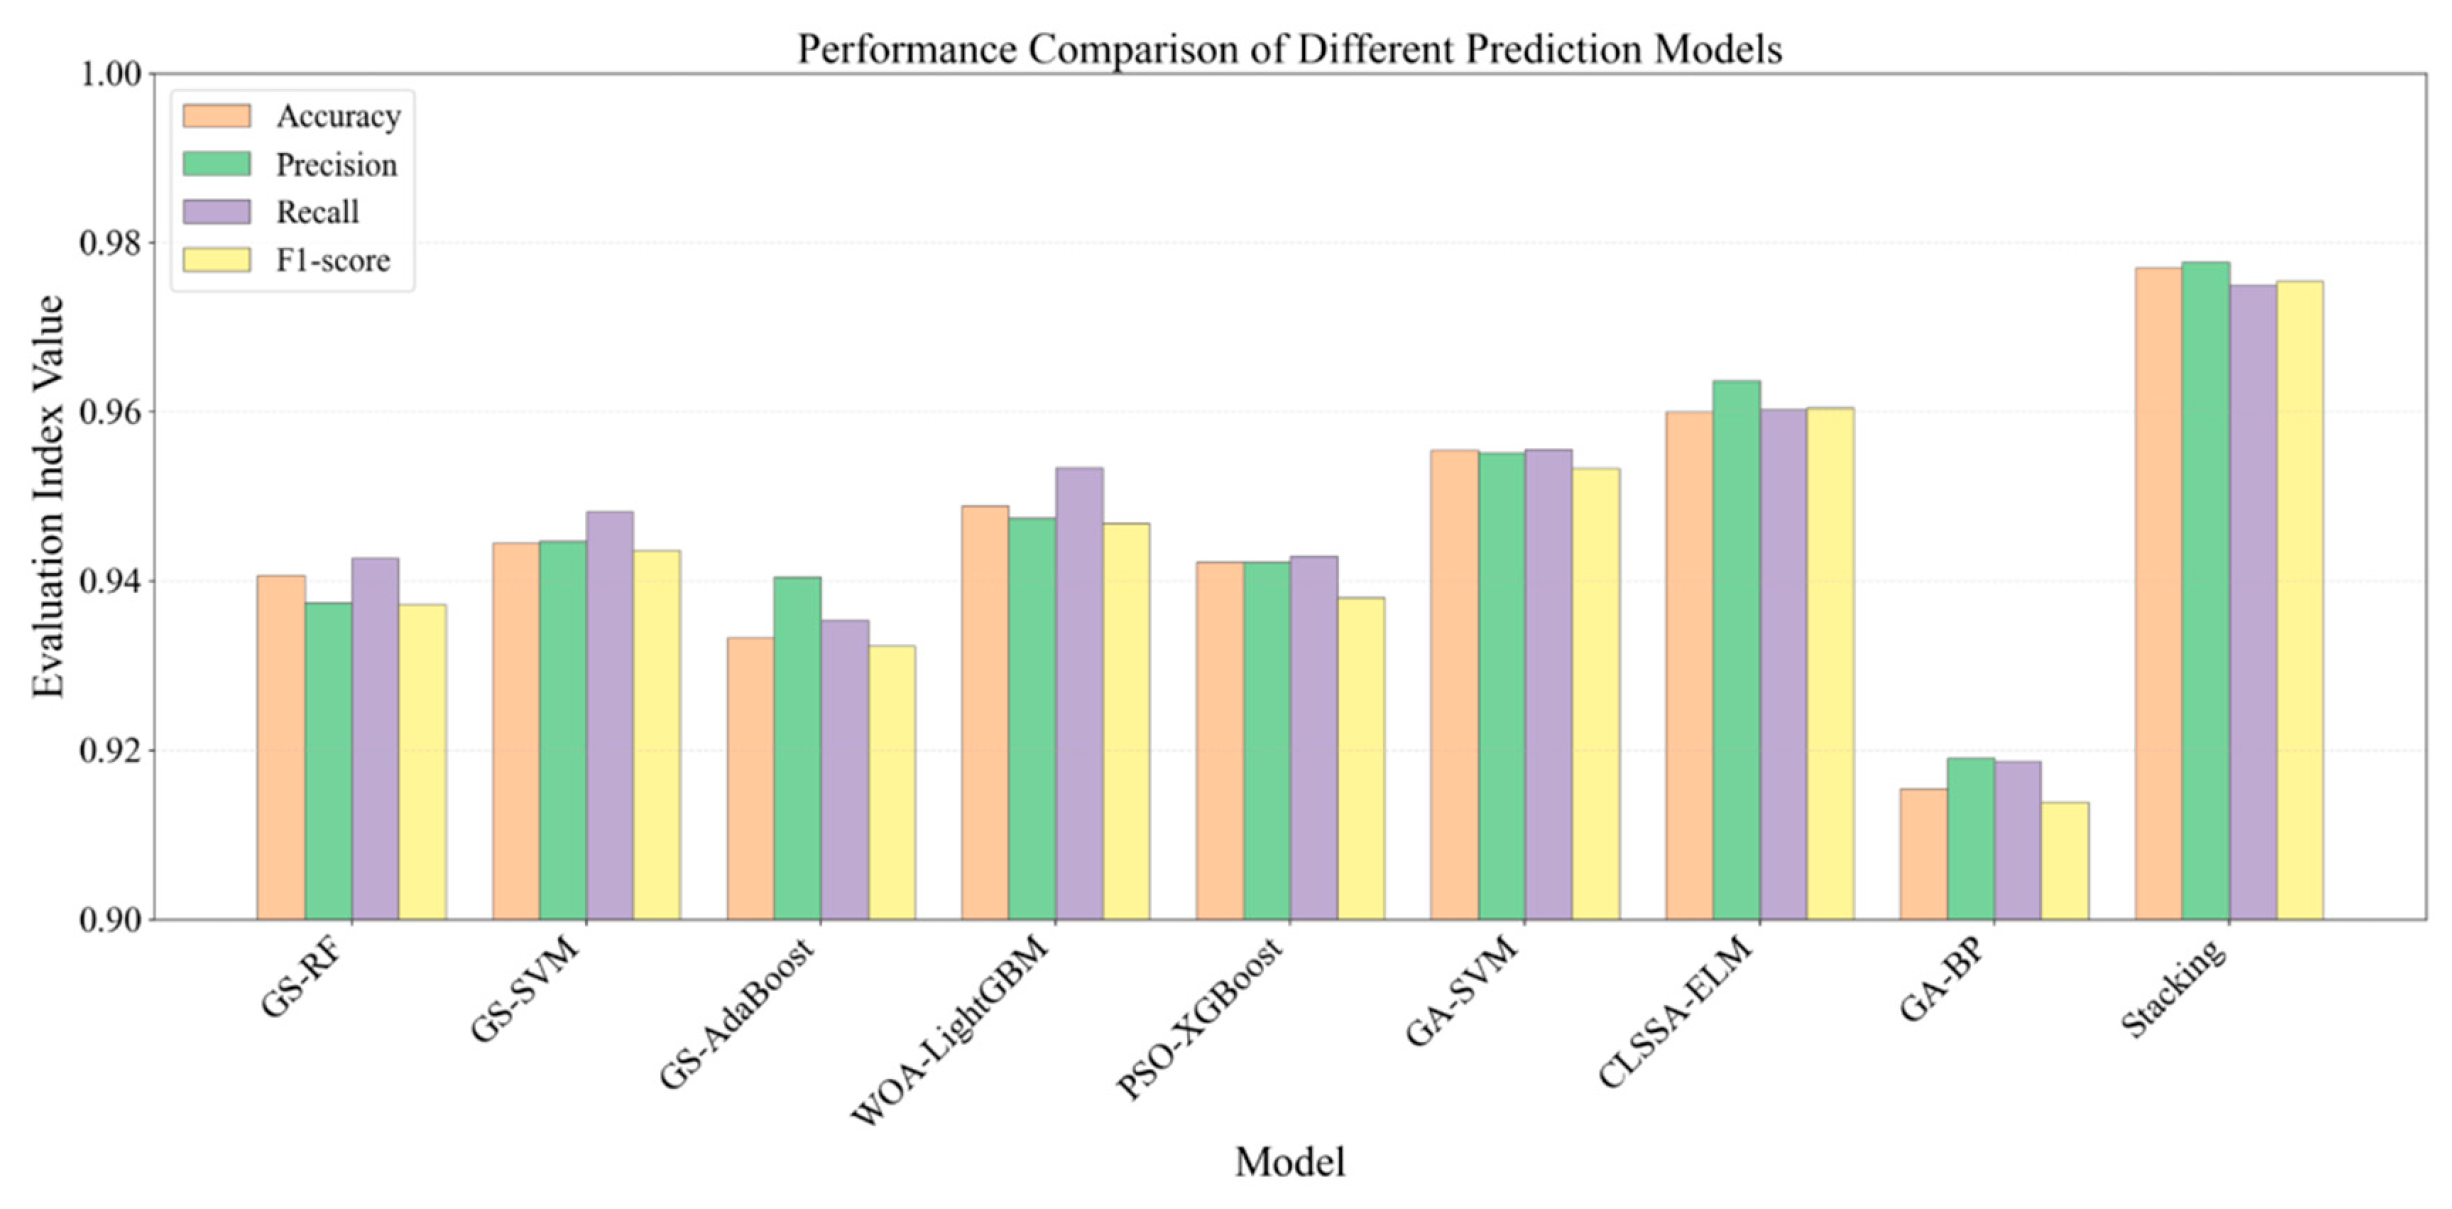
- The Stacking ensemble learning model established in this study reaches 0.9770, 0.9777, 0.9750, and 0.9755, respectively, in accuracy, precision, recall, and F1-score, with 2.96%, 3.10%, 2.27%, and 3.03% increases compared with those of the WOA-LightGBM model, which performs well among single models. In comparison with such models as CLSSA-ELM and PSO-XGBoost, the Stacking model performs best in prediction accuracy, error control, and stability, and the classification error rates for each category are distributed in the most balanced manner. In the prediction of practical engineering cases, the Stacking model exhibits relatively higher accuracy and applicability in the prediction of coal and gas outburst risks, manifesting that the proposed Stacking model effectively fuses the advantages of characteristic engineering and ensemble learning, providing reliable technical support for the prediction of coal and gas outburst risks.
7. Outlook and Limitations
- (1)
- expanding the dataset by collecting outburst records from multiple coal mines with diverse geological settings to enhance model generalizability;
- (2)
- exploring lightweight ensemble strategies or model compression techniques to reduce inference time for on-site applications [31];
- (3)
- incorporating interpretability tools such as SHAP or LIME to provide actionable insights for mine safety engineers [32];
- (4)
- investigating the integration of real-time monitoring data (e.g., acoustic emission or electromagnetic radiation signals) into the current framework to enable dynamic early warning [33].
Author Contributions
Funding
Data Availability Statement
Conflicts of Interest
Abbreviations
| WOA | Whale optimization algorithm |
| GS | Grid search |
| AE | Autoencoder |
| IPSO | Improved particle swarm optimization |
| KELM | Kernel extreme learning machine |
| CLSSA | Chaotic lens slime swarm algorithm |
| BP | Back propagation |
| SMOTE | Synthetic minority oversampling technique |
| KNN | K-nearest neighbors |
| t-SNE | t-distributed stochastic neighbor embedding |
| SMOTE-NC | SMOTE for nominal continuous |
| ReLU | Rectified linear unit |
| Adam | Adaptive moment estimation |
| PSO | Particle swarm optimization |
| XGBoost | Extreme gradient boosting |
| GA | Research Hypotheses 1 to 5 |
| SHAP | SHapley Additive exPlanations |
| LIME | Local interpretable model-agnostic explanations |
References
- Li, Q.C.; Wang, H.P.; Yuan, L. Experimental Study on Damage Deterioration of Coal Rock Mechanical Properties by Adsorbed Gas Volume. J. China Univ. Min. Technol. 2019, 48, 955–965. [Google Scholar] [CrossRef]
- Liu, T.; Lin, B. Time-Dependent Dynamic Diffusion Processes in Coal: Model Development and Analysis. Int. J. Heat Mass Transf. 2019, 134, 1–9. [Google Scholar] [CrossRef]
- Li, X.; Chai, Y. Determination of Pillar Width to Improve Mining Safety in a Deep Burst-Prone Coal Mine. Saf. Sci. 2019, 113, 244–256. [Google Scholar] [CrossRef]
- He, Z.; Wu, Q.; Wen, L.; Fu, G. A Process Mining Approach to Improve Emergency Rescue Processes of Fatal Gas Explosion Accidents in Chinese Coal Mines. Saf. Sci. 2019, 111, 154–166. [Google Scholar] [CrossRef]
- Zou, Q.; Liu, H.; Zhang, Y.; Li, Q.; Fu, J.; Hu, Q. Rationality Evaluation of Production Deployment of Outburst-Prone Coal Mines: A Case Study of Nantong Coal Mine in Chongqing, China. Saf. Sci. 2020, 122, 104515. [Google Scholar] [CrossRef]
- Cheng, X.; Chen, X.Z. Application of Grey Correlation Degree Analysis Method in Coal and Gas Protrusion Simulation Test. Coal Technol. 2018, 37, 179–181. [Google Scholar] [CrossRef]
- Bi, J.; Li, X.J. Analysis of Causes of Coal and Gas Protrusion Accidents Based on Fuzzy Fault Tree. Min. Technol. 2019, 19, 97–100. [Google Scholar] [CrossRef]
- Cheng, Y.P.; Zhou, H.X. Progress of Research on Sensitive Indicators and Their Critical Values for Coal and Gas Protrusion Prediction. Coal Sci. Technol. 2021, 49, 146–154. [Google Scholar] [CrossRef]
- Li, X.; Jiang, Q.; Yuan, Q. Research and Application of Early Warning System for Coal and Gas Protrusion at Working Face. Coal Eng. 2021, 53, 107–111. [Google Scholar]
- Wang, Y.H.; Liu, L.L.; Fu, H.; Xu, Y. Gas Protrusion Prediction Based on Acoustic Emission Multiparameter Time Series. China J. Saf. Sci. Technol. 2018, 28, 129–134. [Google Scholar] [CrossRef]
- Wang, E.Y.; Li, Z.H.; Li, D.X.; Liu, X.; Li, J. Application of Electromagnetic Radiation Monitoring Technology Equipment in Monitoring and Early Warning of Coal and Gas Protrusion. Coal Mine Saf. 2020, 51, 46–51. [Google Scholar] [CrossRef]
- Yin, L.; Wu, S.Y.; Sun, W.; Qu, H. GIS-Based Prediction of Coal Seam Gas Protrusion Hazardous Areas. Min. Res. Dev. 2021, 41, 44–49. [Google Scholar]
- Wu, Y.Q.; Li, H.J.; Xu, D.N. Coal and Gas Protrusion Prediction Algorithm Based on IPSO-Powell Optimised SVM. Ind. Min. Autom. 2020, 46, 46–53. [Google Scholar] [CrossRef]
- Xie, G.N.; Huang, R.L.; Liu, M.; Tu, N.W. L-Isomap-KELM Model for Coal and Gas Herniation. Control Eng. 2020, 27, 1802–1806. [Google Scholar]
- Wen, T.X.; Gao, Q. Coal and Gas Protrusion Hazard Prediction Model Based on AE-CLSSA-ELM. China Saf. Prod. Sci. Technol. 2023, 19, 73–79. [Google Scholar]
- Long, N.Z.; Yuan, M.; Ao, X.J.; Li, X.; Zhang, P. Coal and Gas Protrusion Intensity Prediction Based on LLE-FOA-BP Model. Ind. Min. Autom. 2019, 45, 68–73. [Google Scholar]
- Yan, X.; Zhu, Y.H.; Tu, N.W.; Wu, S.; Wang, Y. Prediction of Coal and Gas Protrusion in Working Face Based on PCA and Weighted Bayes. Comput. Eng. 2021, 47, 315–320. [Google Scholar]
- Sun, L.Y. Applied Research on Coal and Gas Protrusion Prediction Based on Gray Correlation Analysis and PSO-SVM. Master’s Thesis, China University of Mining and Technology, Xuzhou, China, 2019; pp. 40–42. [Google Scholar]
- Ye, A.S.; Xia, H.L.; Zhang, L.L. CW-TOPSIS Evaluation Model for Coal and Gas Protrusion. Min. Res. Dev. 2018, 38, 61–65. [Google Scholar] [CrossRef]
- Chen, X.Z. Research on the Effect of Coal Sample Particle Size on the Intensity of Coal and Gas Protrusion. Coal Technol. 2017, 36, 142–143. [Google Scholar] [CrossRef]
- Wang, G.; Wu, M.M.; Wang, H.Y.; Hang, Q.; Zhong, Y. Sensitivity Analysis of Factors Affecting Coal and Gas Protrusion Based on Energy Balance Model. J. Rock. Mech. Eng. 2015, 34, 238–248. [Google Scholar] [CrossRef]
- Xie, X.; Fu, G.; Xue, Y.; Zhao, Z.; Chen, P.; Lu, B.; Jiang, S. Risk Prediction and Factors Risk Analysis Based on IFOA-GRNN and Apriori Algorithms: Application of Artificial Intelligence in Accident Prevention. Process Saf. Environ. Prot. 2019, 122, 169–184. [Google Scholar] [CrossRef]
- Wang, C.; Wei, L.; Hu, H.; Wang, J.; Jiang, M. Early Warning Method for Coal and Gas Outburst Prediction Based on Indexes of Deep Learning Model and Statistical Model. Front. Earth Sci. 2022, 10, 811978. [Google Scholar] [CrossRef]
- Chen, Y.; Chang, R.; Guo, J.F. Effects of Data Augmentation Method Borderline-SMOTE on Emotion Recognition of EEG Signals Based on Convolutional Neural Network. IEEE Access 2021, 9, 47491–47502. [Google Scholar] [CrossRef]
- Huang, F.; Cao, Z.; Jiang, S.H.; Zhou, C.; Huang, J.; Guo, Z. Landslide Susceptibility Prediction Based on a Semi-Supervised Multiple-Layer Perceptron Model. Landslides 2020, 17, 2919–2930. [Google Scholar] [CrossRef]
- Xu, G.T.; Shen, Y.T. Multi-Classification Detection Method for Malicious Programmes Based on XGBoost and Stacking Fusion Model. Inf. Netw. Secur. 2021, 21, 52–62. [Google Scholar]
- Lin, H.F.; Zhou, J.; Jin, H.W.; Wang, P.; Zhang, Q. A Collaborative Prediction Method of Coal and Gas Protrusion Hazard Class Based on Feature Selection and Machine Learning. J. Min. Saf. Eng. 2023, 40, 361–370. [Google Scholar]
- Sun, F.C. Research on Coal and Gas Protrusion Prediction Model Based on Optimised Quantum Gate Node Neural Network. Master’s Thesis, Liaoning University of Engineering and Technology, Fuxin, China, 2020; pp. 52–55. [Google Scholar]
- Xing, H.J.; Liu, W.T.; Wang, X.Z. Bounded Exponential Loss Function Based AdaBoost Ensemble of OCSVMs. Pattern Recognit. 2024, 148, 110191. [Google Scholar] [CrossRef]
- Xu, Y.; Zhang, J. A Hybrid Nonlinear Whale Optimization Algorithm with Sine Cosine for Global Optimization. Biomimetics 2024, 9, 602. [Google Scholar] [CrossRef] [PubMed]
- Alkhoury, F.; Buschjäger, S.; Welke, P. Splitting Stump Forests: Tree Ensemble Compression for Edge Devices (Extended Version). Mach. Learn. 2025, 114, 219. [Google Scholar] [CrossRef]
- Sun, M.; Liang, D.; Wang, J.; Bate, B.; Xue, F. Clarity in DEM Cementation Predictions: Integrating Automated Machine Learning and Interpretability Analysis of Shear Wave Velocity. Adv. Eng. Inform. 2026, 69, 104060. [Google Scholar] [CrossRef]
- Liu, C.F.; Wang, E.Y.; Wang, Y.; Li, Z.H.; Xu, J.K. Online Early Warning of Coal and Gas Outbursts Through Reliability-Constrained Fusion of Acoustic Emission, Electromagnetic Radiation, and Gas Concentration. Reliab. Eng. Syst. Saf. 2026, 275, 112772. [Google Scholar] [CrossRef]





| Risk | Group Number of Pressure Relief Holes | Amount of Coal Bursting Out |
|---|---|---|
| No | ||
| General | ||
| Serious |
| S/N | |||||||||||||
|---|---|---|---|---|---|---|---|---|---|---|---|---|---|
| AVG | 2.80 | 16.52 | 0.35 | 9.31 | 0.26 | 0.28 | 0.29 | 3.37 | 3.36 | 3.37 | 20.17 | 365.22 | 2.01 |
| SD | 0.40 | 0.91 | 0.03 | 1.65 | 0.08 | 0.06 | 0.06 | 0.20 | 0.21 | 0.19 | 17.61 | 3.18 | 0.77 |
| MIN | 2.00 | 15.32 | 0.28 | 7.05 | 0.10 | 0.15 | 0.17 | 3.00 | 3.00 | 3.00 | 0.00 | 351.00 | 0.00 |
| Q1 | 3.00 | 15.76 | 0.36 | 7.87 | 0.19 | 0.23 | 0.25 | 3.20 | 3.20 | 3.20 | 7.10 | 364.00 | 2.10 |
| Q2 | 3.00 | 16.33 | 0.36 | 8.80 | 0.25 | 0.28 | 0.29 | 3.40 | 3.40 | 3.40 | 15.50 | 365.00 | 2.30 |
| Q3 | 3.00 | 17.35 | 0.36 | 10.14 | 0.31 | 0.32 | 0.32 | 3.40 | 3.40 | 3.40 | 30.50 | 367.00 | 2.40 |
| MAX | 3.00 | 18.62 | 0.36 | 13.88 | 0.43 | 0.41 | 0.43 | 3.80 | 4.00 | 3.80 | 78.00 | 370.00 | 2.60 |
| Data Type | Accuracy | Precision | Recall | F1-Score |
|---|---|---|---|---|
| A-RF | 0.8375 | 0.5764 | 0.6370 | 0.5987 |
| B-RF | 0.9111 | 0.9091 | 0.9196 | 0.9076 |
| C-RF | 0.9422 | 0.9441 | 0.9453 | 0.9425 |
| D-RF | 0.9422 | 0.9510 | 0.9416 | 0.9431 |
| A-SVM | 0.8500 | 0.8948 | 0.8111 | 0.8173 |
| B-SVM | 0.9377 | 0.9401 | 0.9418 | 0.9377 |
| C-SVM | 0.9333 | 0.9311 | 0.9335 | 0.9305 |
| D-SVM | 0.9443 | 0.9431 | 0.9534 | 0.9453 |
| A-AdaBoost | 0.8500 | 0.7771 | 0.6475 | 0.6887 |
| B-AdaBoost | 0.9245 | 0.9236 | 0.9298 | 0.9223 |
| C-AdaBoost | 0.9288 | 0.9267 | 0.9299 | 0.9251 |
| D-AdaBoost | 0.9288 | 0.9321 | 0.9307 | 0.9259 |
| Model | Optimal Parameters |
|---|---|
| RF | ‘max_depth’ = 5; ‘min_samples_split’ = 1; ‘min_samples_leaf’ = 5 |
| SVM | ‘C’ = 0.001; ‘kernel’ = ’poly’; ‘degree’ = 6; ‘coef0’ = −1 |
| AdaBoost | ‘n_estimators’ = 50; ‘learning_rate’ = 0.1; ‘algorithm’ = ’SAMME’ |
| Model | Accuracy | Precision | Recall | F1 | E0 | E1 | E2 |
|---|---|---|---|---|---|---|---|
| GS-RF | 0.9407 | 0.9374 | 0.9427 | 0.9372 | 0.0047 | 0.1395 | 0.0481 |
| GS-SVM | 0.9445 | 0.9447 | 0.9482 | 0.9436 | 0.1083 | 0.0355 | 0.0065 |
| GS-AdaBoost | 0.9333 | 0.9405 | 0.9354 | 0.9323 | 0.0329 | 0.0148 | 0.1420 |
| WOA-LIghtGBM | 0.9489 | 0.9474 | 0.9534 | 0.9468 | 0.0064 | 0.1027 | 0.0413 |
| PSO-XGBOOST | 0.9422 | 0.9422 | 0.9429 | 0.9380 | 0.0740 | 0.0159 | 0.0617 |
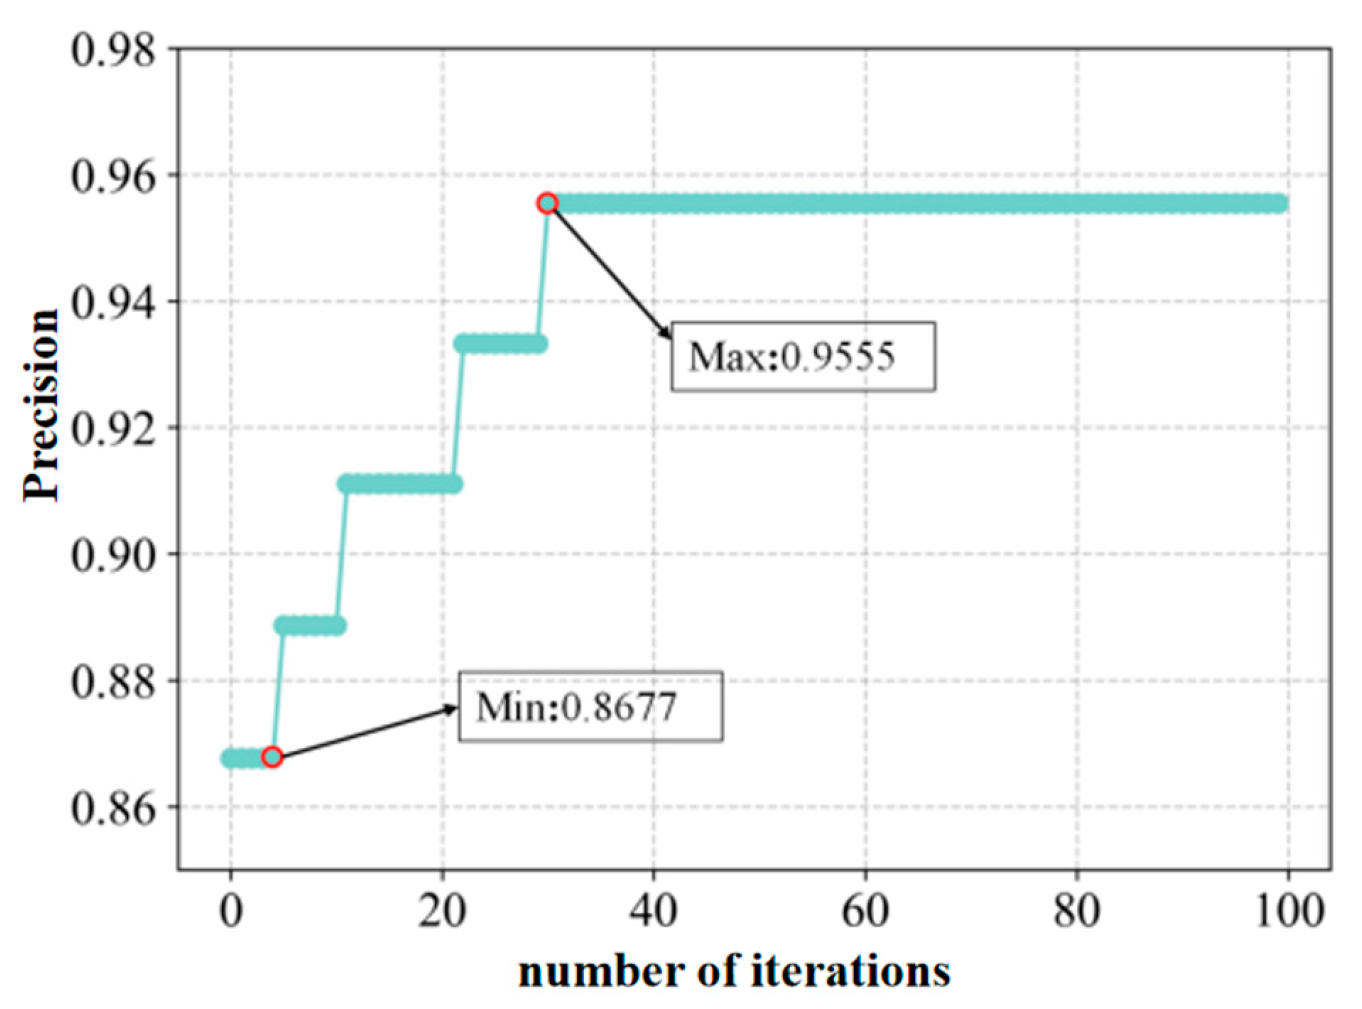
| GA-SVM | 0.9555 | 0.9552 | 0.9556 | 0.9533 | 0.0872 | 0.0241 | 0.0073 |
| CLSSA-ELM | 0.9600 | 0.9637 | 0.9603 | 0.9605 | 0.0074 | 0.0423 | 0.0698 |
| GA-BP | 0.9155 | 0.9191 | 0.9187 | 0.9139 | 0.0516 | 0.0455 | 0.1463 |
| Stacking model established in this study | 0.9770 | 0.9777 | 0.9750 | 0.9755 | 0.0068 | 0.0148 | 0.0479 |
| Case | Outburst Amount/ | |||||||||||
|---|---|---|---|---|---|---|---|---|---|---|---|---|
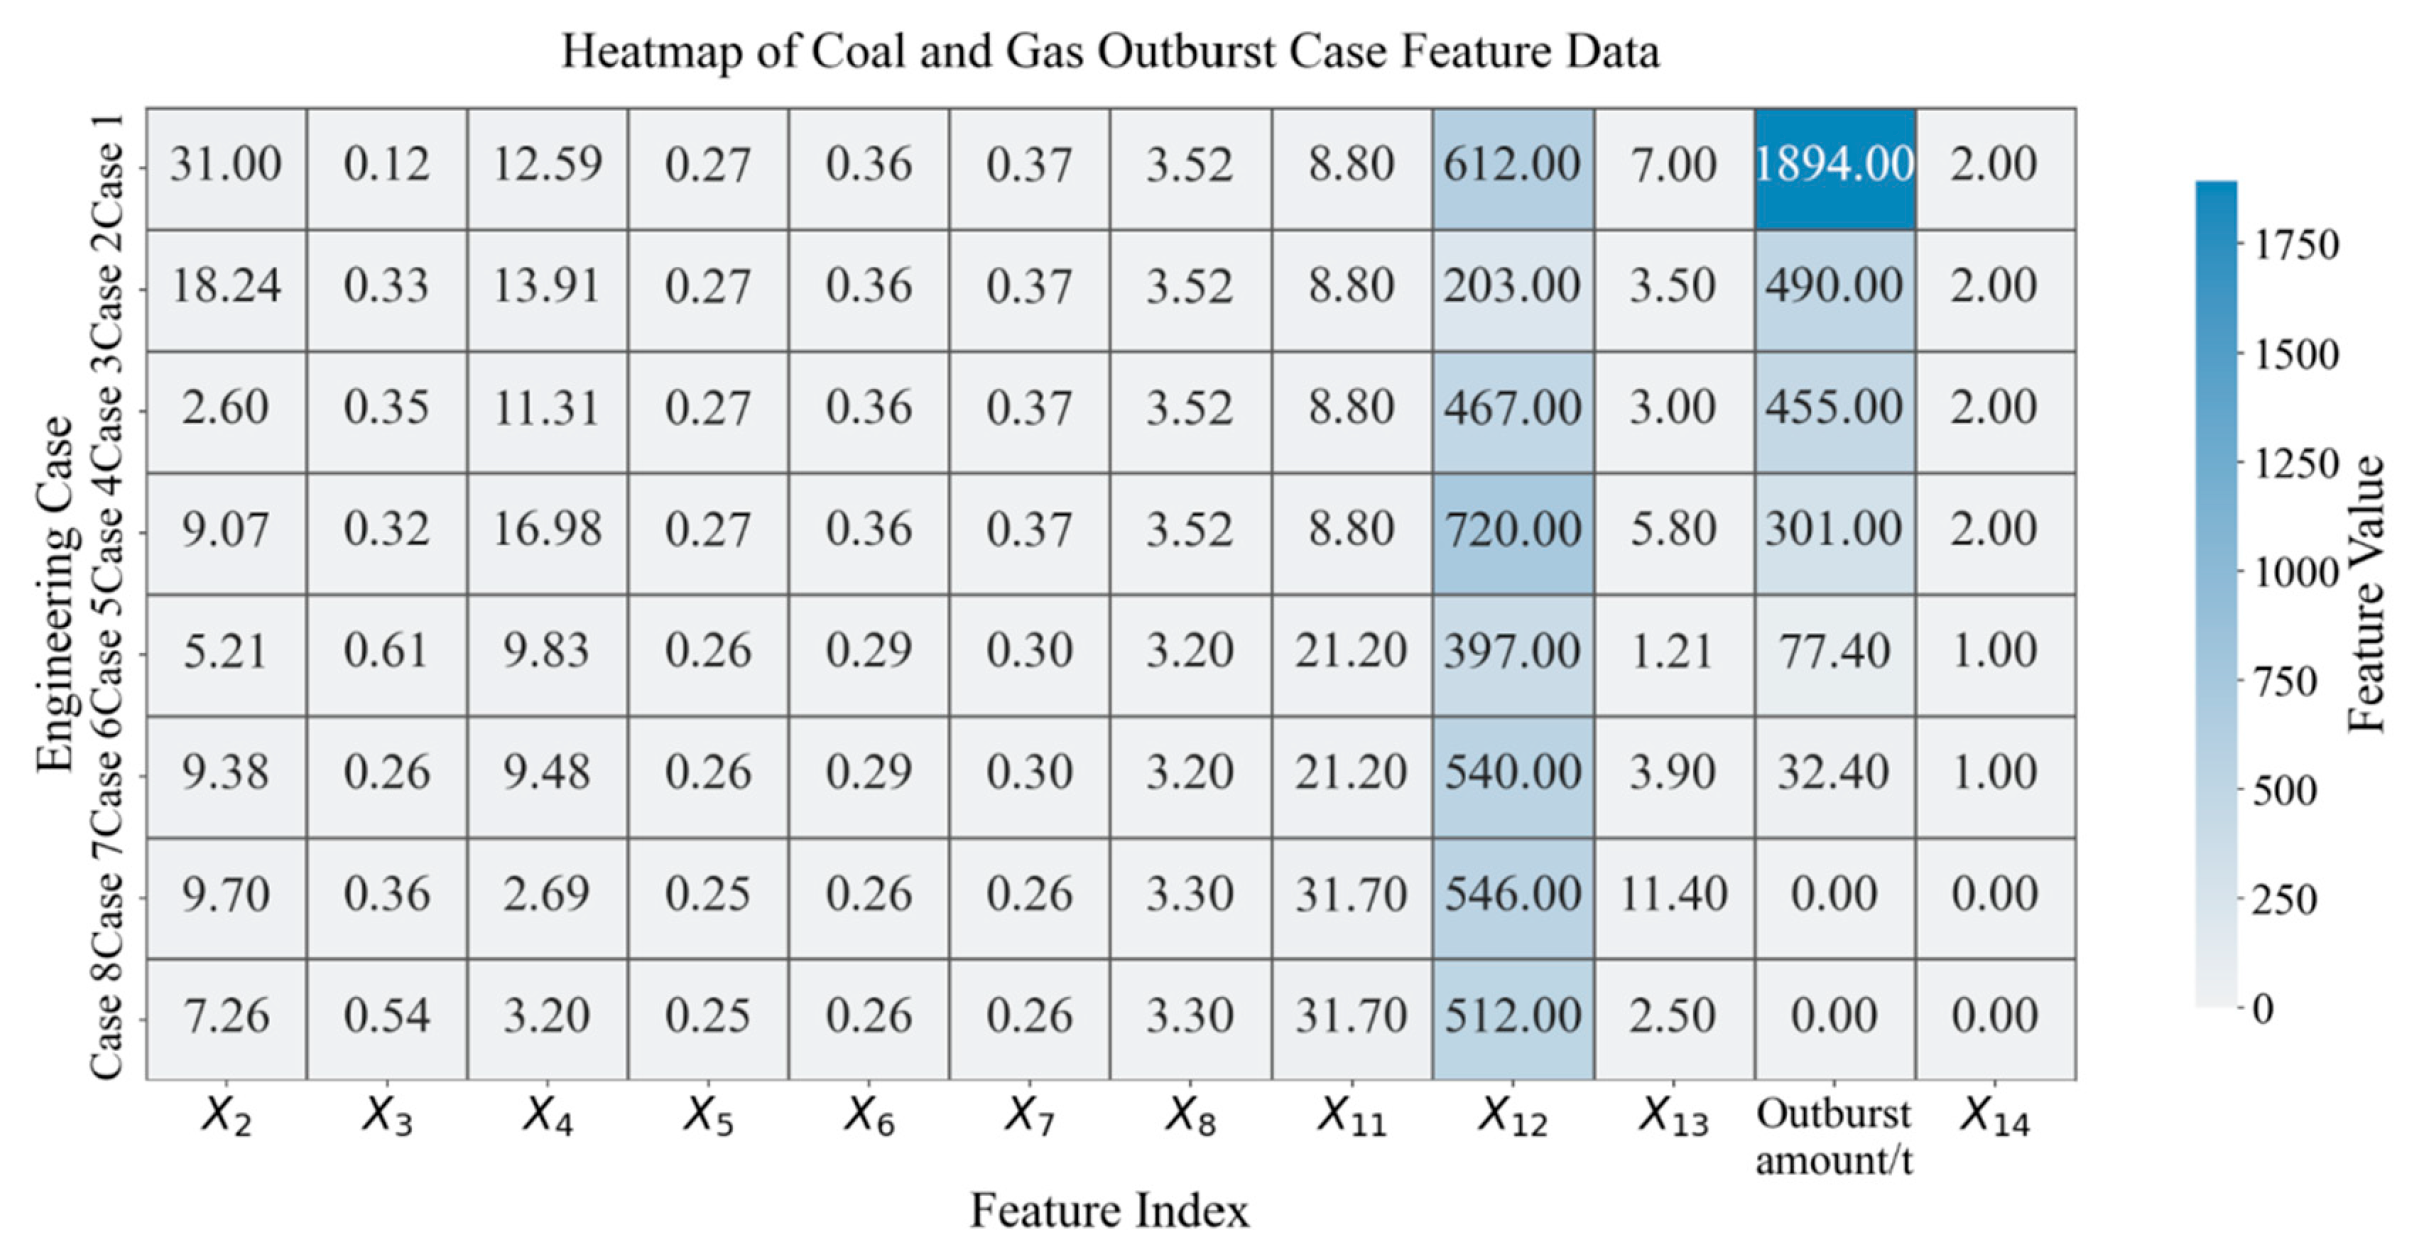
| 1 | 31.00 | 0.12 | 12.59 | 0.27 | 0.36 | 0.37 | 3.52 | 8.8 | 612 | 7 | 1894 | 2 |
| 2 | 18.24 | 0.33 | 13.91 | 0.27 | 0.36 | 0.37 | 3.52 | 8.8 | 203 | 3.5 | 490 | 2 |
| 3 | 2.6 | 0.35 | 11.31 | 0.27 | 0.36 | 0.37 | 3.52 | 8.8 | 467 | 3 | 455 | 2 |
| 4 | 9.07 | 0.32 | 16.98 | 0.27 | 0.36 | 0.37 | 3.52 | 8.8 | 720 | 5.8 | 301 | 2 |
| 5 | 5.21 | 0.61 | 9.83 | 0.26 | 0.29 | 0.30 | 3.2 | 21.2 | 397 | 1.21 | 77.4 | 1 |
| 6 | 9.38 | 0.26 | 9.48 | 0.26 | 0.29 | 0.30 | 3.2 | 21.2 | 540 | 3.9 | 32.4 | 1 |
| 7 | 9.7 | 0.36 | 2.69 | 0.25 | 0.26 | 0.26 | 3.3 | 31.7 | 546 | 11.4 | 0 | 0 |
| 8 | 7.26 | 0.54 | 3.2 | 0.25 | 0.26 | 0.26 | 3.3 | 31.7 | 512 | 2.5 | 0 | 0 |
| Case | 1 | 2 | 3 | 4 | 5 | 6 | 7 | 8 |
|---|---|---|---|---|---|---|---|---|
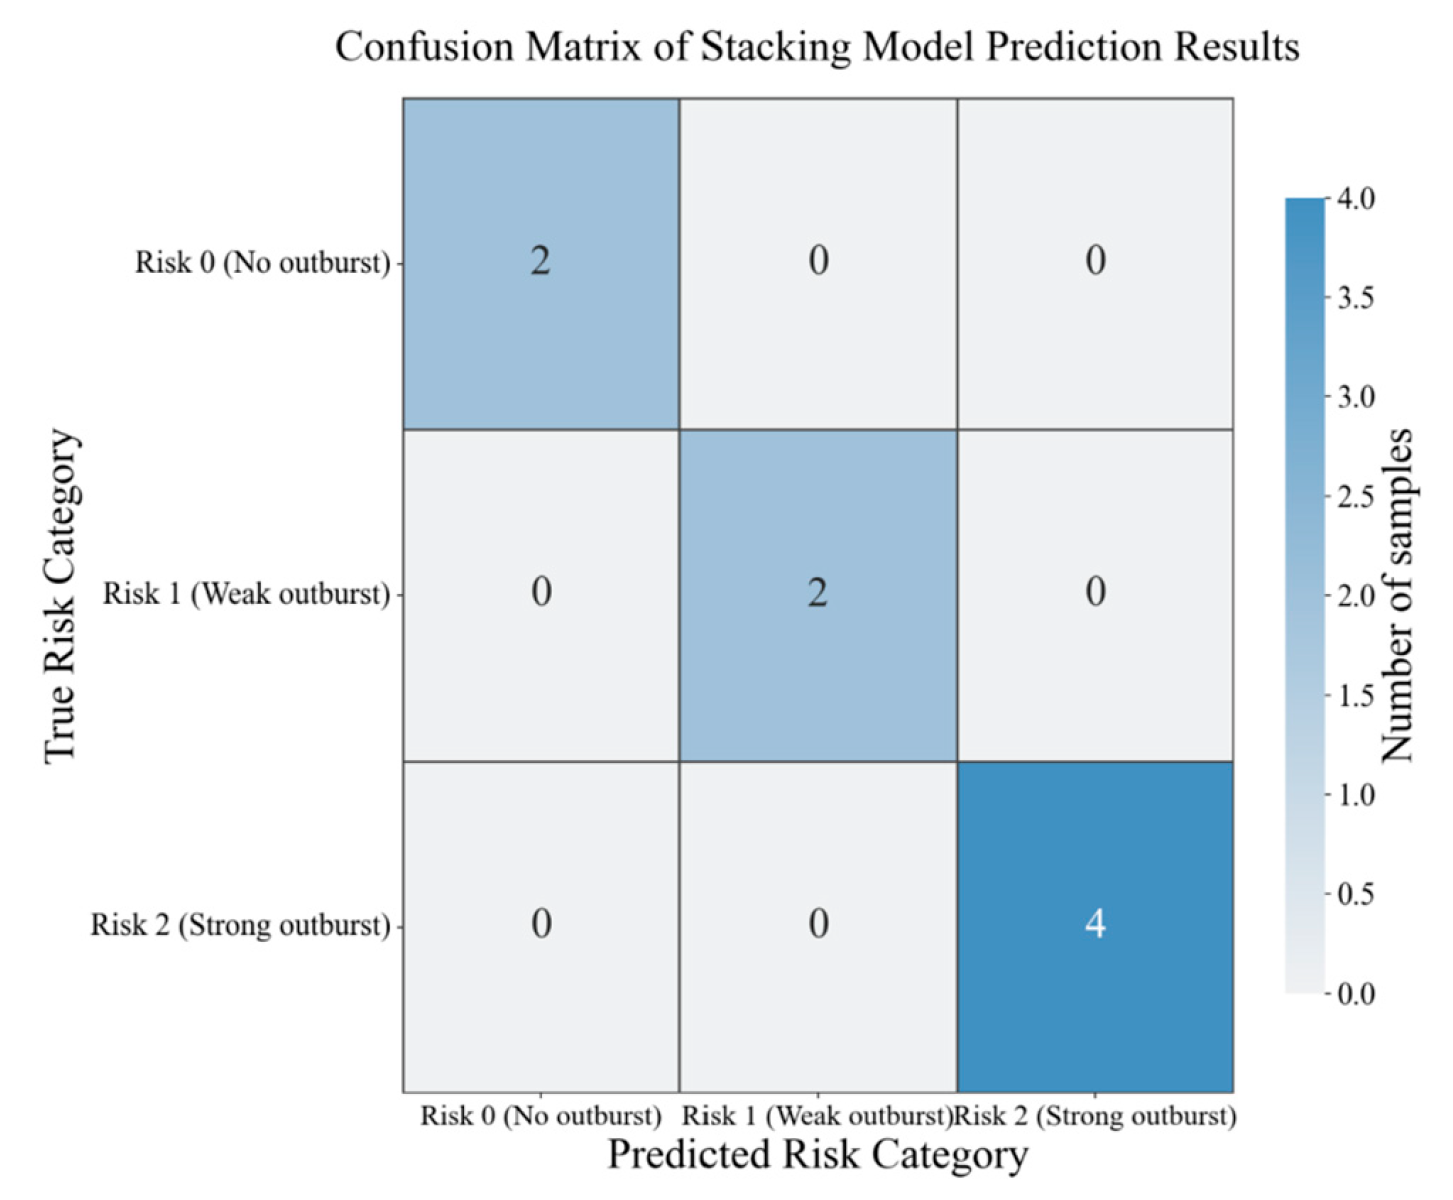
| Risk category | 2 | 2 | 2 | 2 | 1 | 1 | 0 | 0 |
| PSO-XGBOOST | 2 | 2 | 2 | 2 | 1 | 1 | 0 | 0 |
| GA-BP | 2 | 1 | 2 | 2 | 0 | 2 | 0 | 0 |
| CLSSA-ELM | 1 | 0 | 2 | 2 | 1 | 2 | 1 | 0 |
| WOA-LightGBM | 2 | 2 | 2 | 2 | 1 | 1 | 0 | 0 |
| Stacking in this study | 2 | 2 | 2 | 2 | 1 | 1 | 0 | 0 |
Disclaimer/Publisher’s Note: The statements, opinions and data contained in all publications are solely those of the individual author(s) and contributor(s) and not of MDPI and/or the editor(s). MDPI and/or the editor(s) disclaim responsibility for any injury to people or property resulting from any ideas, methods, instructions or products referred to in the content. |
© 2026 by the authors. Licensee MDPI, Basel, Switzerland. This article is an open access article distributed under the terms and conditions of the Creative Commons Attribution (CC BY) license.
Share and Cite
Liu, Y.; Qu, X.; Cui, K.; Yu, S.; Chen, R.; Guo, Y.; Chen, J. An Identification Method for Coal and Gas Outburst Based on Stacking Ensemble Learning. Processes 2026, 14, 2215. https://doi.org/10.3390/pr14132215
Liu Y, Qu X, Cui K, Yu S, Chen R, Guo Y, Chen J. An Identification Method for Coal and Gas Outburst Based on Stacking Ensemble Learning. Processes. 2026; 14(13):2215. https://doi.org/10.3390/pr14132215
Chicago/Turabian StyleLiu, Yuhan, Xueqi Qu, Kai Cui, Shaohan Yu, Riyuan Chen, Yanlei Guo, and Jian Chen. 2026. "An Identification Method for Coal and Gas Outburst Based on Stacking Ensemble Learning" Processes 14, no. 13: 2215. https://doi.org/10.3390/pr14132215
APA StyleLiu, Y., Qu, X., Cui, K., Yu, S., Chen, R., Guo, Y., & Chen, J. (2026). An Identification Method for Coal and Gas Outburst Based on Stacking Ensemble Learning. Processes, 14(13), 2215. https://doi.org/10.3390/pr14132215