Article

Influence of Soil Properties and Soil Aeration Design on Subsurface Methane Removal During Soil Aeration Operations

by
Jui-Hsiang Lo
1,
J. R. R. Navodi Jayarathne
2,*,
Daniel J. Zimmerle
3 and
Kathleen Smits
2
1
Department of Civil and Environmental Engineering, Colorado State University, Fort Collins, CO 80523, USA
2
Department of Civil and Environmental Engineering, Southern Methodist University, Dallas, TX 75205, USA
3
Energy Institute, Colorado State University, Fort Collins, CO 80523, USA
*
Author to whom correspondence should be addressed.
Processes 2026, 14(13), 2202; https://doi.org/10.3390/pr14132202
Submission received: 13 May 2026 / Revised: 20 June 2026 / Accepted: 25 June 2026 / Published: 6 July 2026
(This article belongs to the Section Process Control, Modeling and Optimization)

Abstract

Soil aeration is a widely used field method to remove subsurface methane (CH4) following natural gas (NG) pipeline leaks, reducing safety risks and enabling site recovery. However, conventional aeration practices often rely on generalized guidance and do not explicitly account for site-specific soil conditions, resulting in inefficient CH4 removal and prolonged cleanup times. This study investigated the influence of soil properties and aeration system design on CH4 removal using controlled field-scale experiments and a validated multiphase transport model. Six field-scale aeration experiments and 39 numerical simulations were conducted across representative soil types, soil moisture conditions, vacuum pressures, and bar hole configurations. Results show that CH4 removal occurs in two distinct stages: an initial advection-dominated removal phase followed by a slower diffusion-controlled phase. More than 50% of the residual CH4 mass was removed within the first 10 min of aeration in permeable soils, while greater than 90% removal was achieved within 30 min under favorable conditions. Increasing vacuum pressure improved CH4 removal by approximately 15 percentage points after 60 min and increased the effective radius of influence of individual bar holes. Soil permeability exerted a primary control on performance, with high-permeability soils exhibiting substantially faster CH4 removal and larger treatment zones than lower-permeability soils. Bar hole configuration was equally important; properly spaced bar holes improved plume coverage and removal efficiency, whereas excessive overlap reduced aeration effectiveness through airflow interference. Overall, the results demonstrate that CH4 removal during NG soil aeration is governed by coupled interactions among soil properties, moisture conditions, vacuum pressure, and bar hole deployment. Incorporating these factors into aeration system design can improve removal efficiency, reduce aeration duration, and provide utilities with a quantitative basis for safer and more effective NG leak mitigation.

1. Introduction

Natural gas (NG) from underground pipeline leaks can lead to elevated methane (CH4) concentrations in the vadose zone, creating environmental, operational, and public safety risks. Methane can migrate through soil, accumulate in confined spaces, and contribute to greenhouse gas emissions if not effectively removed [1]. Following leak repair or during leak pinpointing, utilities commonly use NG soil aeration to remove subsurface gas and reduce CH4 concentrations below safety thresholds. Based on personal communication and a review of industry standard operating procedures (SOPs), in practice, operators install boreholes, commonly referred to as bar holes, near suspected or confirmed leak locations and remove gas through passive venting or vacuum-assisted extraction using purgers or aerators. Although this approach is widely used, aeration performance can vary substantially across sites, with incomplete CH4 removal, concentration rebound, and prolonged cleanup durations reported in practice.
A key limitation of current NG soil aeration practice is that design and operation are often based on generalized guidance, site access, and operator experience rather than quantitative relationships between subsurface conditions and system performance. Bar hole number, spacing, placement, vacuum pressure, and aeration time are commonly selected without explicitly accounting for plume geometry, soil type, soil moisture, or gas transport behavior. Current soil aeration practices form the basis of standard mitigation guidance [2]; however, they do not provide quantitative methods for linking site-specific soil conditions to removal efficiency or aeration duration. As a result, sites with low-permeability soils or elevated moisture saturation can experience reduced gas mobility and prolonged aeration. For example, in Georgetown, Texas, NG venting continued for more than 30 days without achieving non-hazardous concentration targets, with post-incident analyses attributing the extended cleanup to low soil permeability and elevated moisture content that restricted gas transport ([3,4,5]).
The effectiveness of NG soil aeration is controlled by coupled advective and diffusive gas transport. Advective transport refers to bulk gas movement driven by pressure gradients, such as vacuum applied at bar holes, whereas diffusive transport describes slower gas migration along concentration gradients through soil pores [6,7,8]. These processes are strongly influenced by soil structure, texture, permeability, tortuosity, and moisture content [9]. Coarse-grained soils generally support more rapid gas migration, while fine-grained or water-saturated soils restrict airflow [10,11,12,13,14]. In layered or heterogeneous systems, permeability contrasts can further promote gas entrapment and contribute to rebound following aeration. These mechanisms indicate that aeration performance should depend not only on applied vacuum and bar hole layout but also on the subsurface conditions controlling gas mobility.
Previous studies have improved understanding of NG migration in soils using field observations and numerical simulation. Okamota & Gomi [15] demonstrated that methane concentrations exceeding 50% v/v can spread more than 2 m from a leak source, highlighting the combined roles of advective and diffusive transport in natural soils. Chamindu Deepagoda et al. [16] and Gao et al. [17] further showed that methane migration is strongly affected by soil properties, with high-permeability soils promoting rapid gas migration and elevated moisture saturation limiting gas movement. These studies provide an important foundation for understanding subsurface NG transport. However, they primarily address leak migration behavior rather than the interaction between soil properties, aeration system design, and CH4 removal performance during active NG soil aeration.
Conceptual guidance can also be drawn from environmental remediation technologies, particularly soil vapor extraction (SVE), air sparging, and bioventing. SVE uses vacuum-driven airflow to remove volatile contaminants from the vadose zone and has demonstrated the importance of soil permeability, moisture, applied vacuum, extraction flow rate, and well spacing in controlling gas removal [18,19,20,21,22]. However, direct transfer of SVE-based design approaches to NG soil aeration is limited. SVE typically involves long-term remediation of larger contaminant plumes, whereas NG soil aeration is applied at localized leak sites over short operational timescales and often under higher vacuum pressures. These differences result in distinct gas transport behavior, rebound mechanisms, and design objectives. Therefore, while SVE provides a useful conceptual framework, NG soil aeration requires approaches developed specifically for short-duration, site-specific methane removal following pipeline leaks.
Numerical modeling provides a practical means to evaluate how soil conditions and aeration design influence subsurface CH4 removal. Gas transport models developed for SVE and vadose-zone applications provide established tools for analyzing advective and diffusive gas movement [22,23,24,,25,26,27]. However, direct modeling studies of NG soil aeration remain limited, and few studies have systematically evaluated how soil type, moisture, vacuum pressure (also referred to as pressure drawdown), and bar hole deployment jointly control CH4 removal efficiency, radius of influence, and aeration duration. This gap limits the development of quantitative, field-applicable design guidance for NG leak mitigation.
Motivated by these considerations, this study integrates controlled field-scale experiments with numerical simulations to investigate subsurface CH4 migration and removal during NG soil aeration under varying soil conditions and system designs. We hypothesize that CH4 removal efficiency and aeration bar hole radius of influence are governed by soil physical properties and their interaction with aeration design and operational conditions. Six controlled field-scale experiments were conducted to characterize subsurface CH4 behavior during aeration and evaluate model performance. A modified multiphase, multicomponent transport model based on Gao et al. [17] was then used to conduct 39 simulations assessing residual CH4 mass, bar hole radius of influence, and aeration time across representative soil types, moisture conditions, vacuum pressures, and bar hole configurations. To the authors’ knowledge, this is the first study to systematically evaluate the combined influence of soil properties, moisture conditions, vacuum pressure, and bar hole deployment on subsurface CH4 removal during NG soil aeration using both controlled field experiments and numerical simulations. The results bridge the gap between subsurface gas transport processes and current NG soil aeration practice by linking site conditions and aeration system design to CH4 removal performance, enabling more efficient methane mitigation and improved pipeline safety outcomes.

2. Methods

2.1. Controlled Soil Aeration Experiments

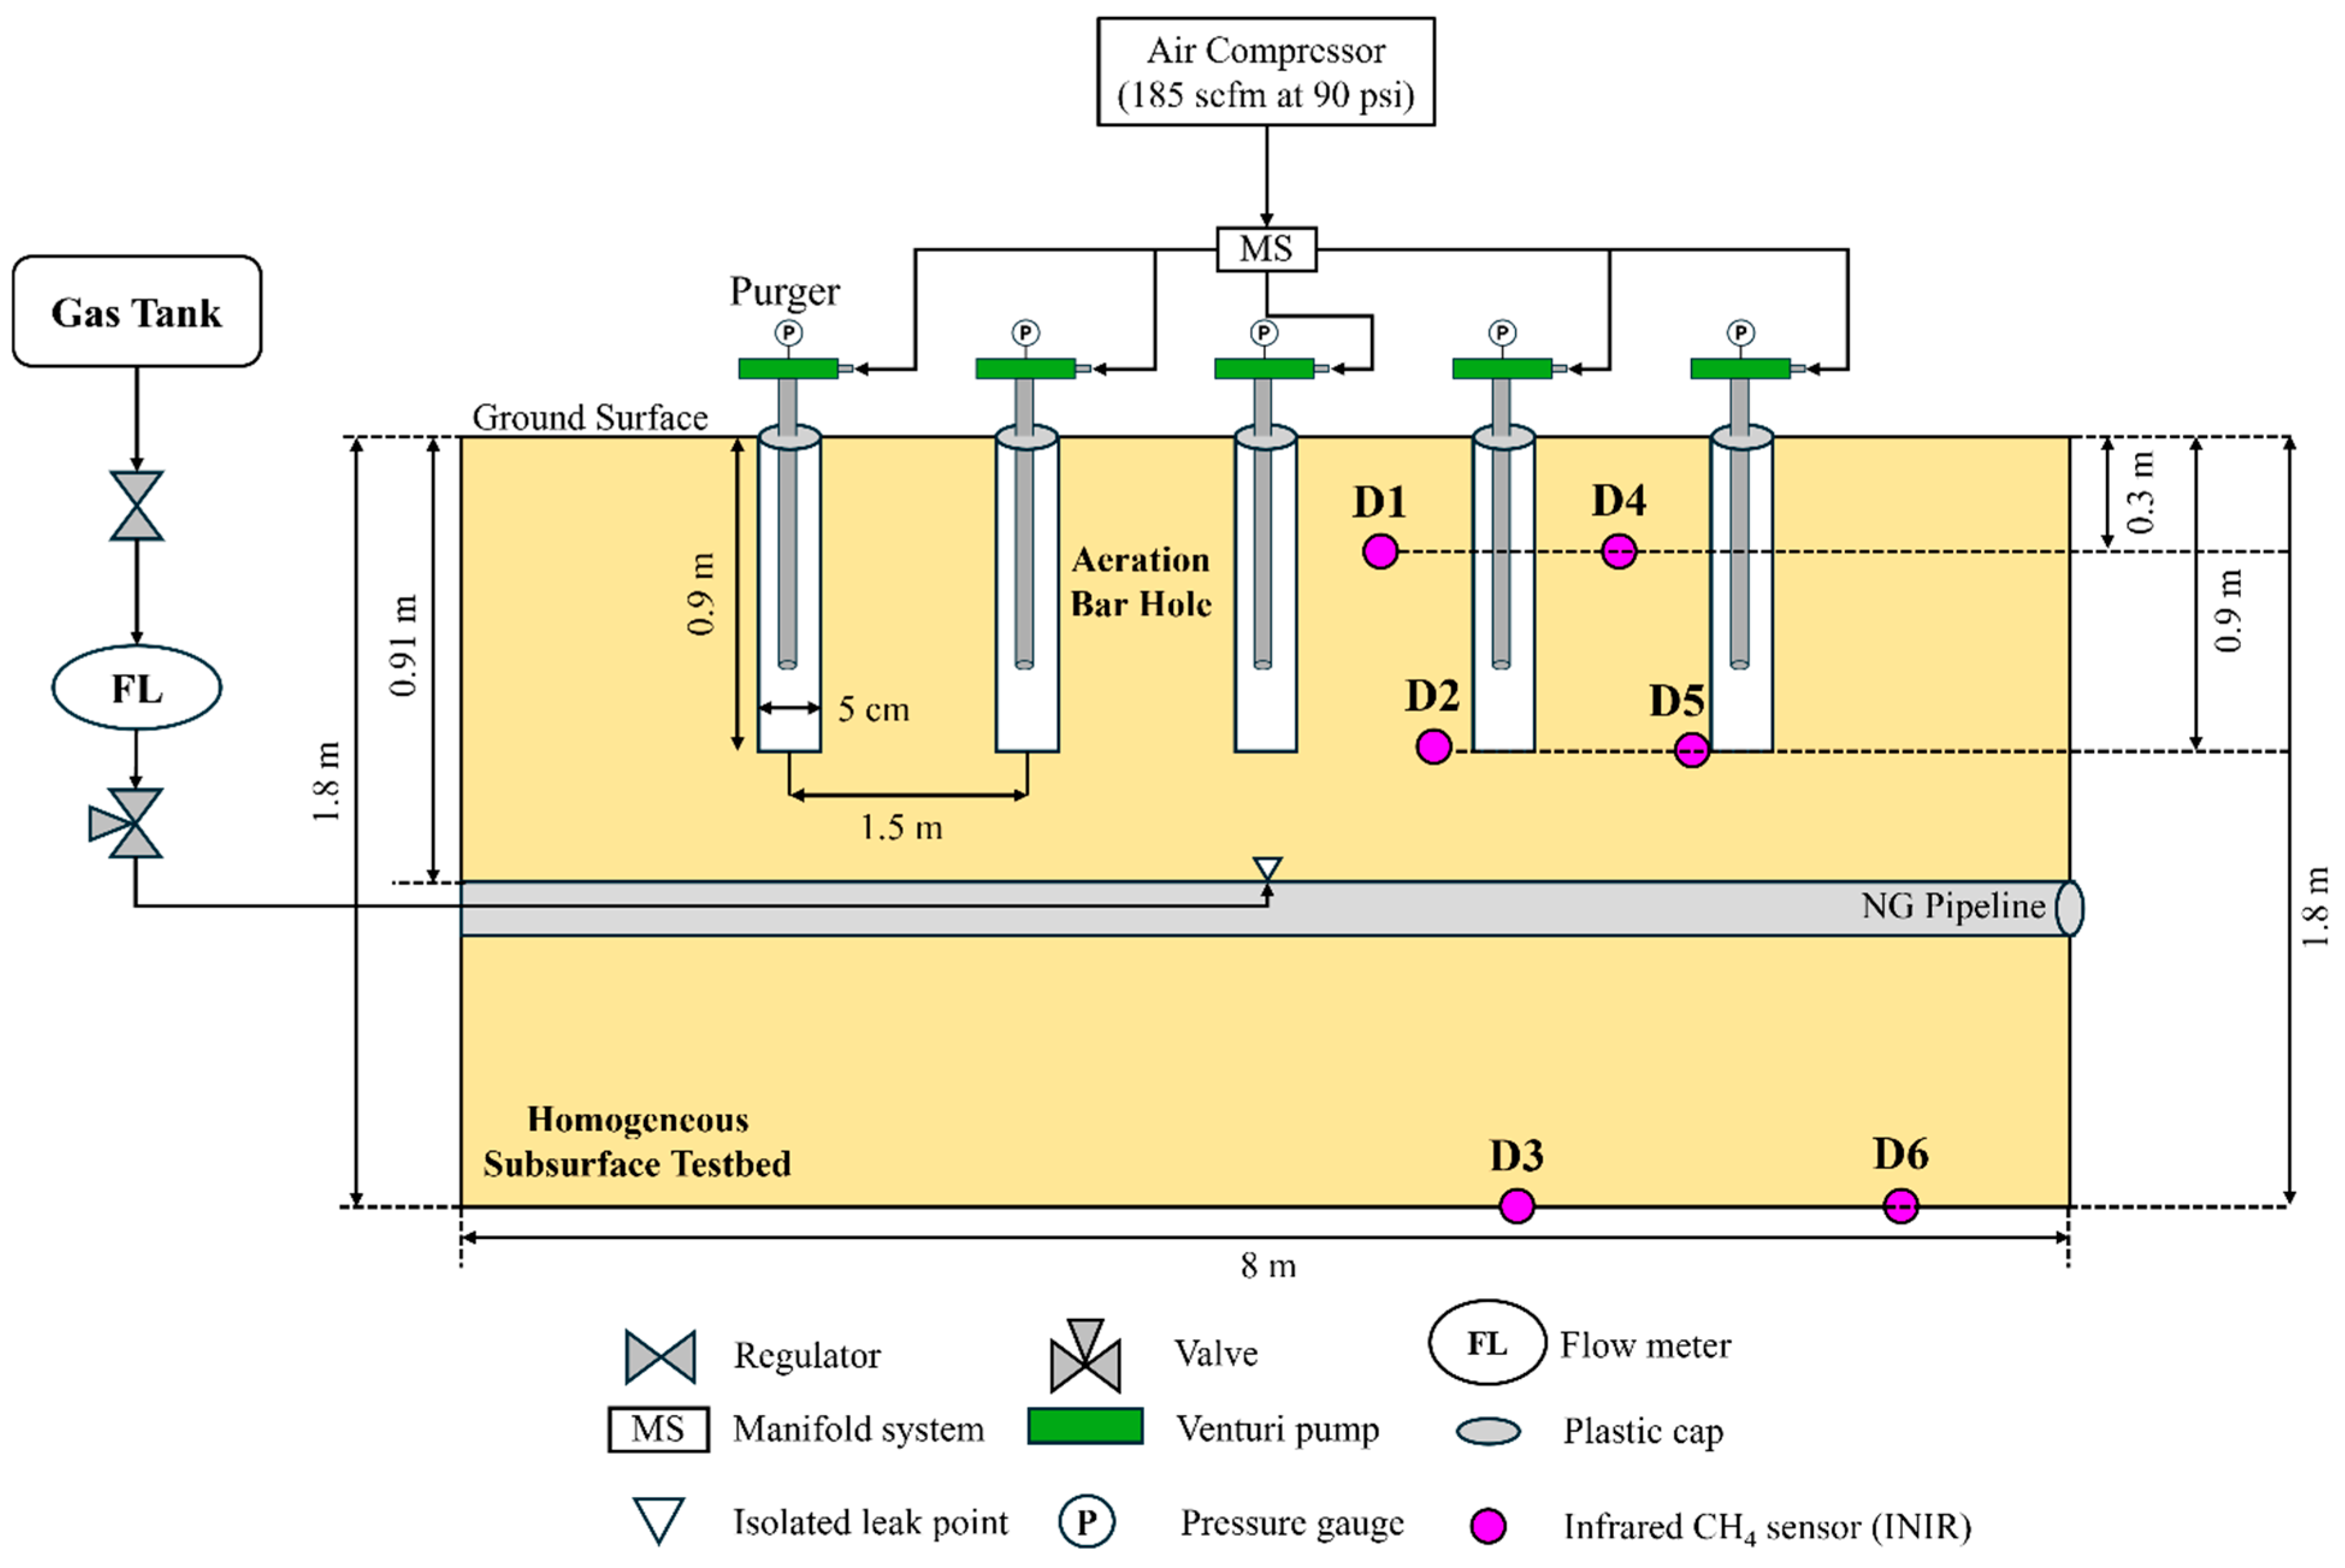
In this study, we first use controlled field-scale experiments to understand general aeration behavior, including subsurface CH4 plume distribution prior to aeration and the changes in CH4 concentrations and plume size during aeration. Six controlled field-scale soil aeration experiments were conducted to obtain measurements for evaluating NG soil aeration performance and validating the numerical model. Experiments were conducted at the Methane Emissions Technology Evaluation Center (METEC), Colorado State University (Fort Collins, CO, USA), which supports controlled NG releases under monitored atmospheric, surface, and subsurface conditions. A rural, grass-covered testbed was selected for the soil aeration experiments, as shown in Figure 1. Testbed construction details are provided in Jayarathne et al. [1,,28]. The testbed soil was classified as sandy loam based on laboratory grain-size analysis. A controlled leak source was installed at a depth of 0.91 m below the ground surface to release NG at prescribed rates and to establish a subsurface CH4 plume prior to aeration (Figure 1). Subsurface CH4 concentrations were monitored using six non-dispersive infrared CH4 sensors (INIR-ME100, SGX Sensortech Inc., Corcelles-Cormondrèche, Switzerland) installed at depths of 0.3, 0.6, and 1.8 m and horizontal distances of 1 to 3.6 m from the leak point. Data were recorded at 5 s intervals. Co-located soil moisture and temperature sensors (TEROS 10 and 11, and 5TM, METER Group Inc., Pullman, WA, USA) were used to track hydrothermal conditions during the experiments. To achieve the required near-surface high moisture saturations (Sw = 0.8), the testbed was watered using a hose before aeration and re-watered when required to maintain the Sw = 0.8 level.
For soil aeration monitoring, the aeration system consisted of pre-drilled bar holes connected to venturi-based purgers that were supplied by a high-pressure air compressor through a manifold (Figure 1). Bar holes were spaced approximately 1.5 m apart. In each scenario, only selected holes were activated, and the remaining holes were sealed. Details of all six experiments can be found in Supplementary Materials Section S1 and Table S1. For each scenario, experiments were started by releasing NG for 8 h at a leak rate of 0.4 kg/h (10 SLPM) to establish a quasi-stable subsurface plume [17,29,30]. The leak was terminated prior to initiating aeration. Aeration was initiated by operating the venturi-based purgers to achieve average vacuum pressures of 0.3 atm (5 psi) relative to atmospheric pressure at the active bar holes, resulting in a maximum total extraction flow rate of 0.25 m3/min per purger. During aeration, subsurface CH4 concentrations were monitored using the six infrared CH4 sensors. Aeration was initially conducted for 1 h. At the end of the first hour, the venturi-based purgers were closed and observed for gas rebound. The aeration process was restarted if rebound occurred. This cycle was repeated until subsurface CH4 concentrations reached 50 ppm or the infrared sensors indicated a stable reading. Out of the six experimental scenarios conducted, three scenarios were used to evaluate the effects of near-surface moisture saturation and bar hole number, as shown in Table 1.

2.2. Numerical Simulations

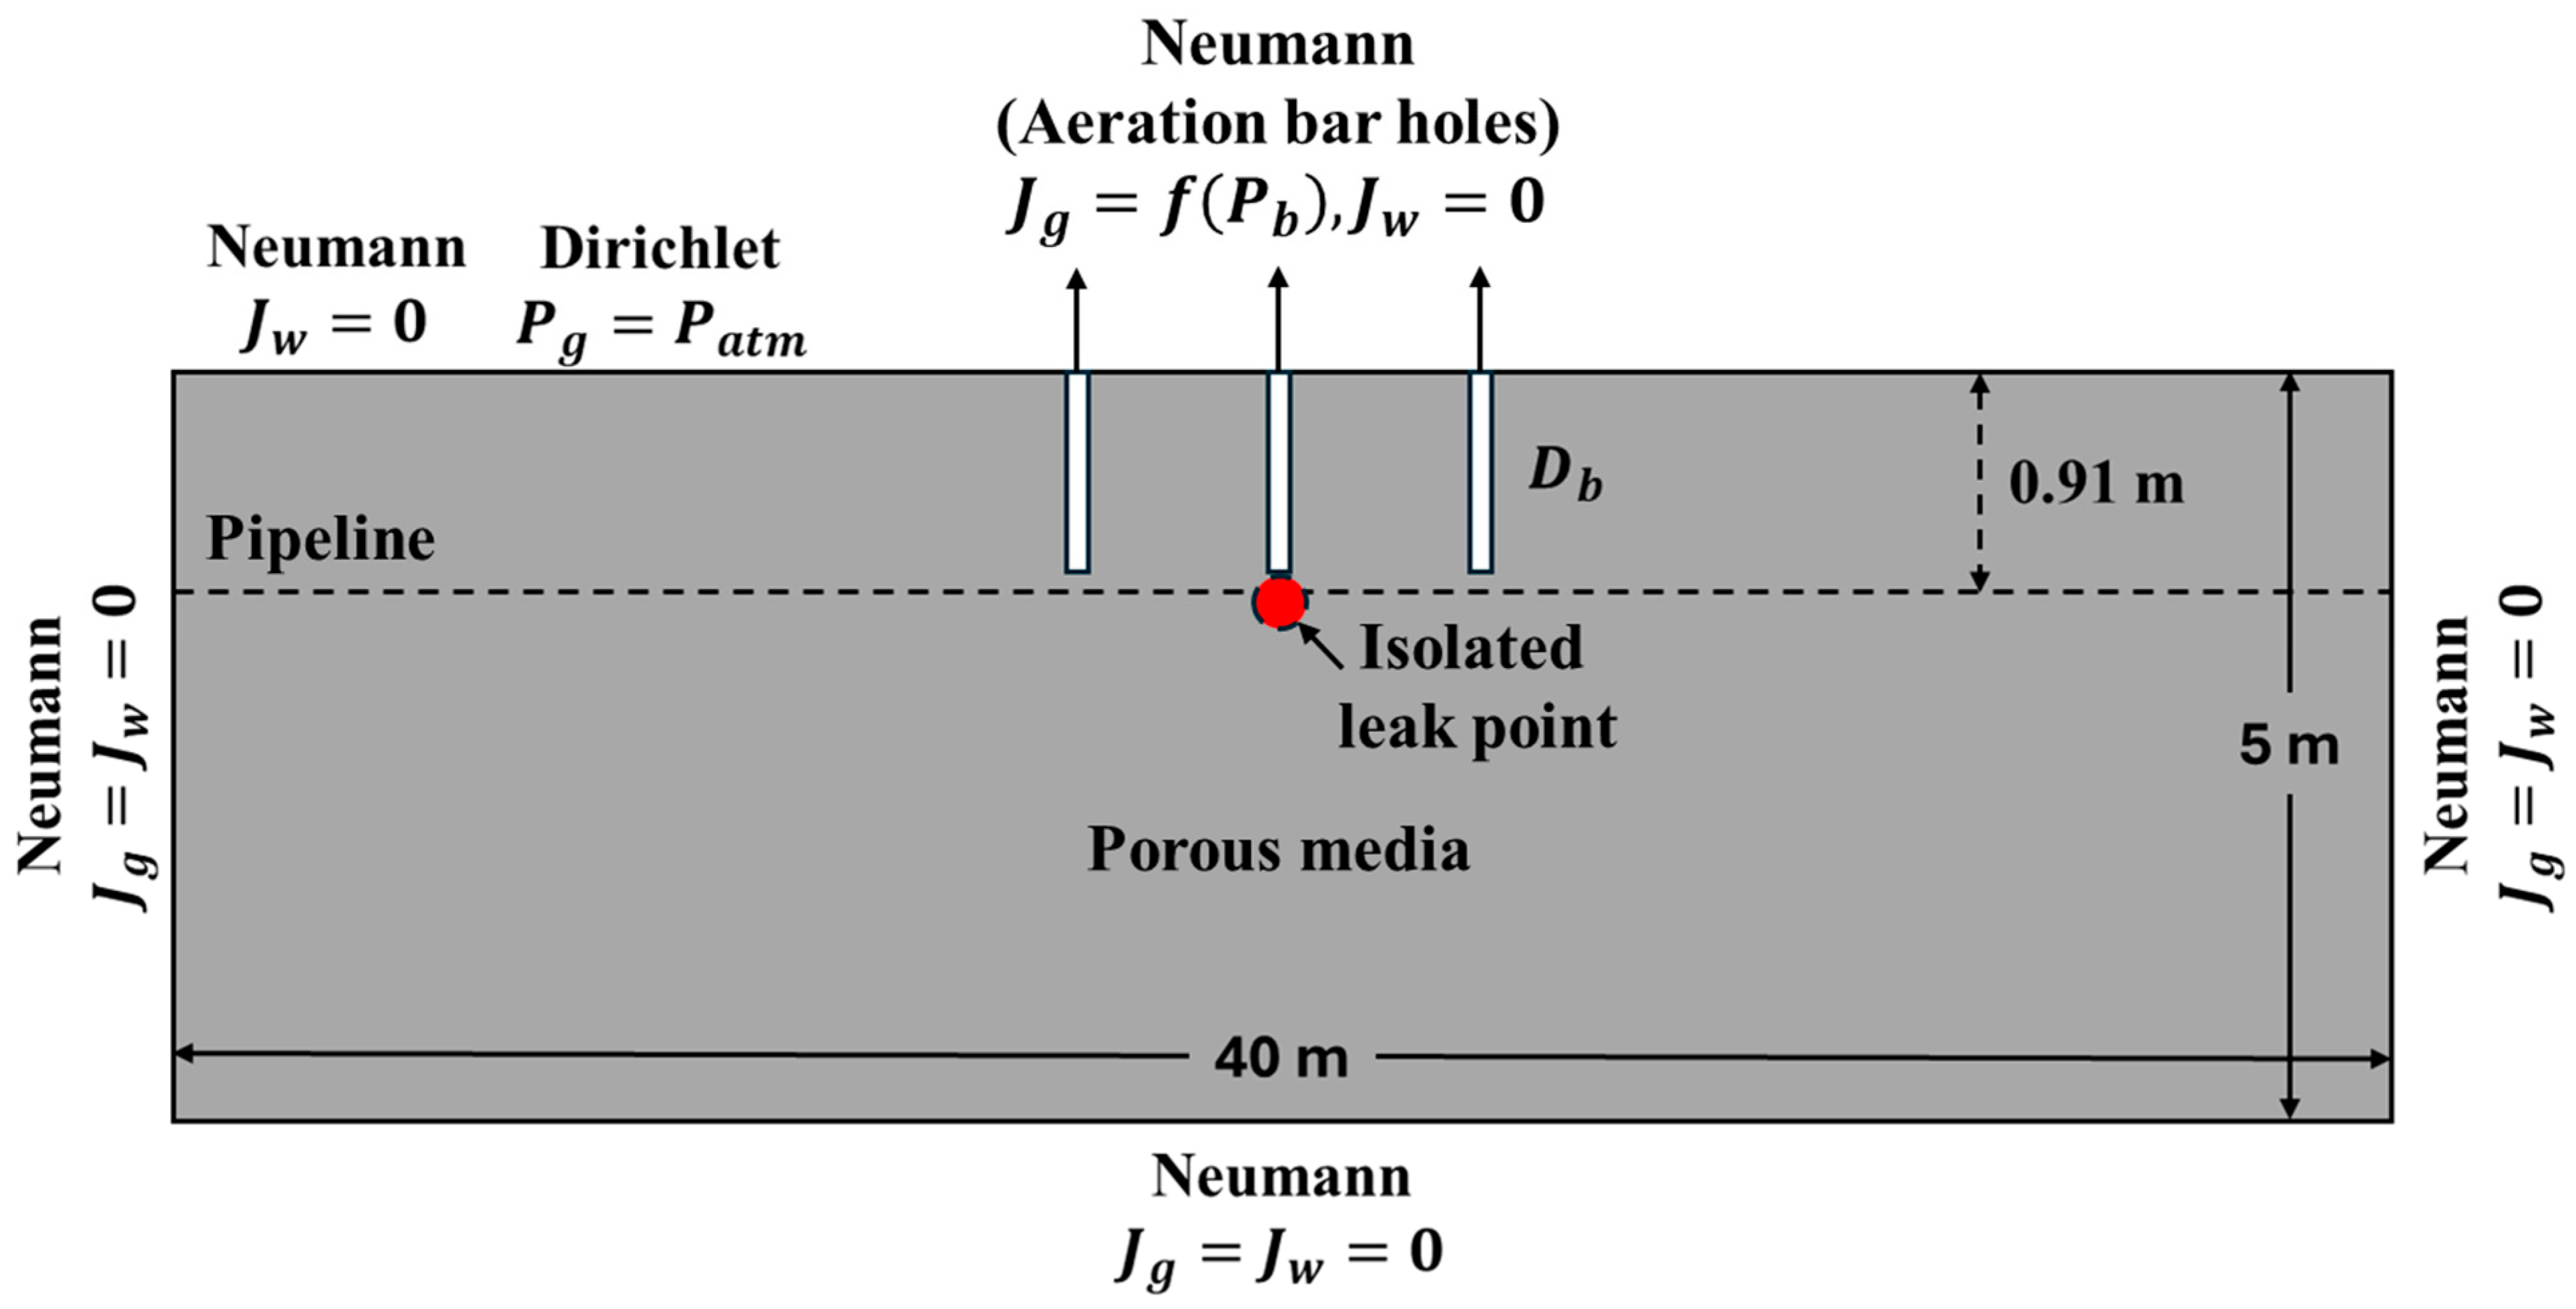
Numerical modeling was used to further investigate the influence of soil properties and aeration system design on CH4 removal. A previously developed two-dimensional, two-phase (water and gas), and two-component (CH4 and air) transport model [17] was adapted and recalibrated to simulate CH4 removal from the vadose zone during NG soil aeration under varying soil conditions and system designs (Figure 2). This model was selected because it had been calibrated for METEC testbeds, which are representative of the experiments used in this study. During these calibrations, the outputs from the 2D simulation domain were compared against field data and showed R2 > 0.96 compatibility [17,30]. Further, the two-dimensional vertical domain was used because the objective of the modeling was to evaluate dominant gas transport mechanisms and relative effects of soil properties, vacuum pressure, and bar hole configuration under controlled conditions, rather than to fully resolve three-dimensional plume geometry. The model domain represents the monitored experimental cross-section, where subsurface CH4 concentrations were measured, allowing direct comparison between simulations and field observations. This approach is consistent with the available experimental data and with the intended use of the model as a screening-level tool for identifying first-order controls on NG soil aeration performance.
To represent soil aeration conditions, the model was extended to include bar holes and operational parameters such as elevated vacuum pressures and short-duration aeration. Model performance was evaluated through comparison with field-scale experimental data, with results provided in Supplementary Materials Section S2.2.
The model assumes the solid phase is unreactive, rigid, and incompressible, with soil properties treated as homogeneous and isotropic under isothermal conditions. Simulations were conducted in a two-dimensional Cartesian domain extending 40 m horizontally and 5 m vertically. The primary bar hole was positioned above the leak location, with additional bar holes placed symmetrically at a depth of 0.9 m based on prescribed spacing.
Moisture saturation was prescribed and held constant during aeration, as the simulation durations were short relative to water redistribution timescales. Dissolution of CH4 into pore water was neglected due to its low solubility relative to the gas phase under the modeled conditions [17]. To represent a post-repair scenario, the leak source was terminated prior to the onset of aeration.
Governing equations for two-phase flow and CH4 transport follow Gao et al. [17], enabling us to quantify how soil properties and aeration design jointly control gas migration and removal. Mass conservation for the gas and water phases is given by Equation (1).
ϕ ( ρ i S i ) t + · ρ i u i = 0  
where the subscript i represents the liquid water (w) and gas (g) phases, ϕ is the porosity of the soil (-), ρ i is the density of the fluid in the i phase (kg/m3), S i is the saturation of the fluid in the i phase, and u i is the Darcy velocity of the fluid in the i phase (m/s) (Equation (2)).
u i = k k r i μ i ( P i + ρ i g )  
where k is the soil permeability (m2), k r i is the relative permeability of the fluid in i phase (-), μ i is the viscosity of the fluid in the i phase (Pa·s), P i is the pressure of the fluid in the i phase (Pa), and g is the gravitational acceleration (m/s2). The relationship between capillary pressure, saturations of the gas and aqueous phases, and relative permeability is described by the van Genuchten model [31].
Gas phase transport of CH4 is described by
ϕ ( ρ g w C H 4 S g ) t + · ρ g w C H 4 u g · D C H 4 ρ g w C H 4 = 0
where w C H 4 is the mass fraction of CH4 (-) and D C H 4 * is the effective diffusion coefficient tensor of CH4 in the vadose zone (m2/s), which is estimated by the Millington & Quirk (1961) [32] equation.
The mass conservation (Equation (1)) and the CH4 transport (Equation (2)) equations carry a density term ( ρ i or ρ g ) inside the accumulation and advective flux terms, making the transported mass flux proportional to density. Therefore, any buoyancy-driven motion in u i or u g directly translates into density-weighted mass transport. In this study, where CH4 is transported in porous media, the formulations represent the gas-phase migration controlled by buoyancy acting through density contrasts and Darcy velocities.
Boundary conditions for gas flow and CH4 transport are shown in Figure 2. At the ground surface, gas pressure was fixed at atmospheric conditions ( P a t m ), allowing both inflow and outflow depending on the local pressure gradients. Prior to aeration, the initial gas pressure within the plume was assumed to gradually reach atmospheric pressure, starting at higher pressures due to the leak. The bar hole boundary was represented as a specified vacuum (pressure) boundary based on manufacturer purger specifications, without explicitly simulating internal flow within the bar hole. No-flow boundary conditions were applied at the lateral and bottom boundaries to minimize artificial boundary losses.
For the water phase, saturation was prescribed and held constant during aeration with an initial saturation profile defined under hydrostatic equilibrium. For CH4 transport, the bar hole boundary was treated as an outlet. At the ground surface, an open boundary condition was applied with an inflow CH4 mass fraction set to atmospheric background levels. For outflow, a convective boundary condition with zero diffusive flux was imposed. Zero diffusive flux conditions were also applied to the lateral and bottom boundaries to minimize boundary losses [26].

Soil Characteristics and Design Parameters of Soil Aeration

Soil characteristics, particularly permeability, strongly influence gas migration and CH4 removal efficiency. High-permeability coarse soils (e.g., sand) promote rapid gas movement and effective CH4 removal, while low-permeability fine soils (e.g., clay) restrict airflow and reduce removal efficiency. Therefore, sand, sandy loam, and silty clay were selected as representative soils for the numerical simulations. Clay soils with intrinsic permeability varying between 10−19 to 10−16 m2 [33,34] were not considered in this study as aeration is generally not recommended for soils with permeabilities in the range of 10−15 m2 [21]. Soil moisture saturation ( S w ) varied at the surface (0.2, 0.4, and 0.6), with a fixed bottom saturation of 0.3. The van Genuchten model was used to relate relative permeability to saturation, and soil temperature was held constant at 20 °C. Physical and hydraulic properties were obtained from Gao et al. [17] (Table 2). Key design parameters included applied vacuum pressure ( P b ) and bar hole deployment. Vacuum pressure ( P b ) was defined based on industry purger specifications and ranged from 0 to 0.9 atm (0 to 13 psi) relative to atmospheric pressure (1 atm, 14.7 psi). A pressure of 0 atm represents passive aeration, where CH4 migration occurs solely by natural diffusion. Simulation scenarios were divided into three cases based on the number and spacing of aeration bar holes (Table 3): Case #1 used a single bar hole above the leak, while Cases #2 and #3 used three bar holes spaced symmetrically at 1 m and 5 m, respectively. Here, despite the 1.5 m bar hole spacing determined during field experiments based on sensor spacing and drilling constraints, 1 m and 5 m spacings were selected. 1 m represented a denser configuration with overlap between effective areas of aeration and 5 m represented a spacing wider than potential radius influences, thus avoiding any overlap of effective areas of aeration.
A total of 39 numerical simulations were conducted to evaluate the influence of soil properties and system design on CH4 removal during NG soil aeration. Simulations varied in soil type, vacuum pressure, soil moisture saturation, and bar hole configuration. All simulations were run for 60 min, consistent with typical field aeration durations. Model initialization details are provided in Supplementary Materials Section S2.1. Case #1, a simulation in sand at S w = 0.2 and P b = 0.9 atm, served as a benchmark for comparative analysis across scenarios. Aeration performance was evaluated using subsurface CH4 migration behavior, mass removal efficiency, and the time to reach the target concentration threshold [22,36,37]. The following section describes the methods for estimating each indicator.

2.3. Evaluation of Soil Aeration Performance

2.3.1. Normalized Residual CH4 Mass

To facilitate comparison across scenarios, the normalized residual CH4 mass ( M C H 4 ) was used to represent the fraction of CH4 remaining in the vadose zone during aeration:
M C H 4 ( t ) = M C H 4 ( t ) M 0 C H 4
where M C H 4 t (g) is the total mass of CH4 remaining in the vadose zone at time t (min), and M 0 C H 4 (g) is the initial CH4 mass prior to aeration. This metric was used to quantify removal efficiency and compare the effects of soil properties, bar hole configuration, and operating conditions on CH4 mass reduction over time. A value of M C H 4 = 1 indicates no removal, while values approaching zero indicate effective CH4 removal.

2.3.2. Radius of Influence

The radius of influence (RI) defines the effective aeration zone as the maximum lateral distance from the bar hole to the point over which pressure-driven (advective) gas transport remains significant. Because NG soil aeration occurs over short durations (15 to 60 min), pressure conditions remain transient. Therefore, in this study, R I represents the maximum lateral distance (at z = 0.9 m) over which advective transport is non-negligible during transient aeration.
In this study, the radius of influence (RI) is estimated from the simulated advective CH4 flux for a 60 min aeration:
R I = max r J a d v C H 4 r ,   z , t > ε }
where R I is the radius of influence (m), J a d v C H 4 is the advective flux of CH4 (kg m−2 min−1) at horizontal distance r from the bar hole and depth z (0.9 m in this study), t is the aeration time (min), and ε is a small threshold value (10−8 kg m−2 min−1 in this study) below which the advective flux is considered negligible. Here, 10−8 kg m−2 min−1 represents a cutoff for identifying the boundary beyond which active advective removal is effectively negligible based on the 0.005% v/v minimum CH4 concentration.

2.3.3. Aeration Time

Aeration time is typically determined on a site-specific basis, considering safety thresholds, environmental requirements, and project objectives. Following Johnson et al. [36], operational duration was evaluated using both cumulative mass removal and residual concentration levels. In NG aeration practice, operations often continue until the CH4 concentration at the bottom of the bar hole decreases below 0.005% v/v (50 ppmv). Because CH4 removal varies spatially within the domain, the normalized residual CH4 mass ( M C H 4 (Equation (4))) was used to provide a consistent, domain-integrated measure of removal performance. This metric enables direct comparison of aeration time across simulation scenarios and is used to quantify the time required to achieve target removal thresholds.

3. Results and Discussion

This section evaluates how soil properties and aeration system design influence soil aeration performance using experimental observations supported by numerical simulations. First, general soil aeration behavior is described based on controlled field-scale experiments. To further understand the underlying gas transport mechanisms, experimental scenarios are simulated within the numerical modeling framework. Prior to scenario simulations, the model domain was calibrated using field-scale data, as described in Supplementary Materials Section S2. A series of numerical simulations was conducted, varying soil properties and aeration design parameters, to systematically evaluate the impact on CH4 removal performance and bar hole radius of influence.

3.1. General Soil Aeration Behavior

The general behavior of soil aeration is first evaluated using field-scale experimental results. These observations are then interpreted in conjunction with numerical simulations that replicate the experimental scenarios, enabling the identification of governing gas migration mechanisms.
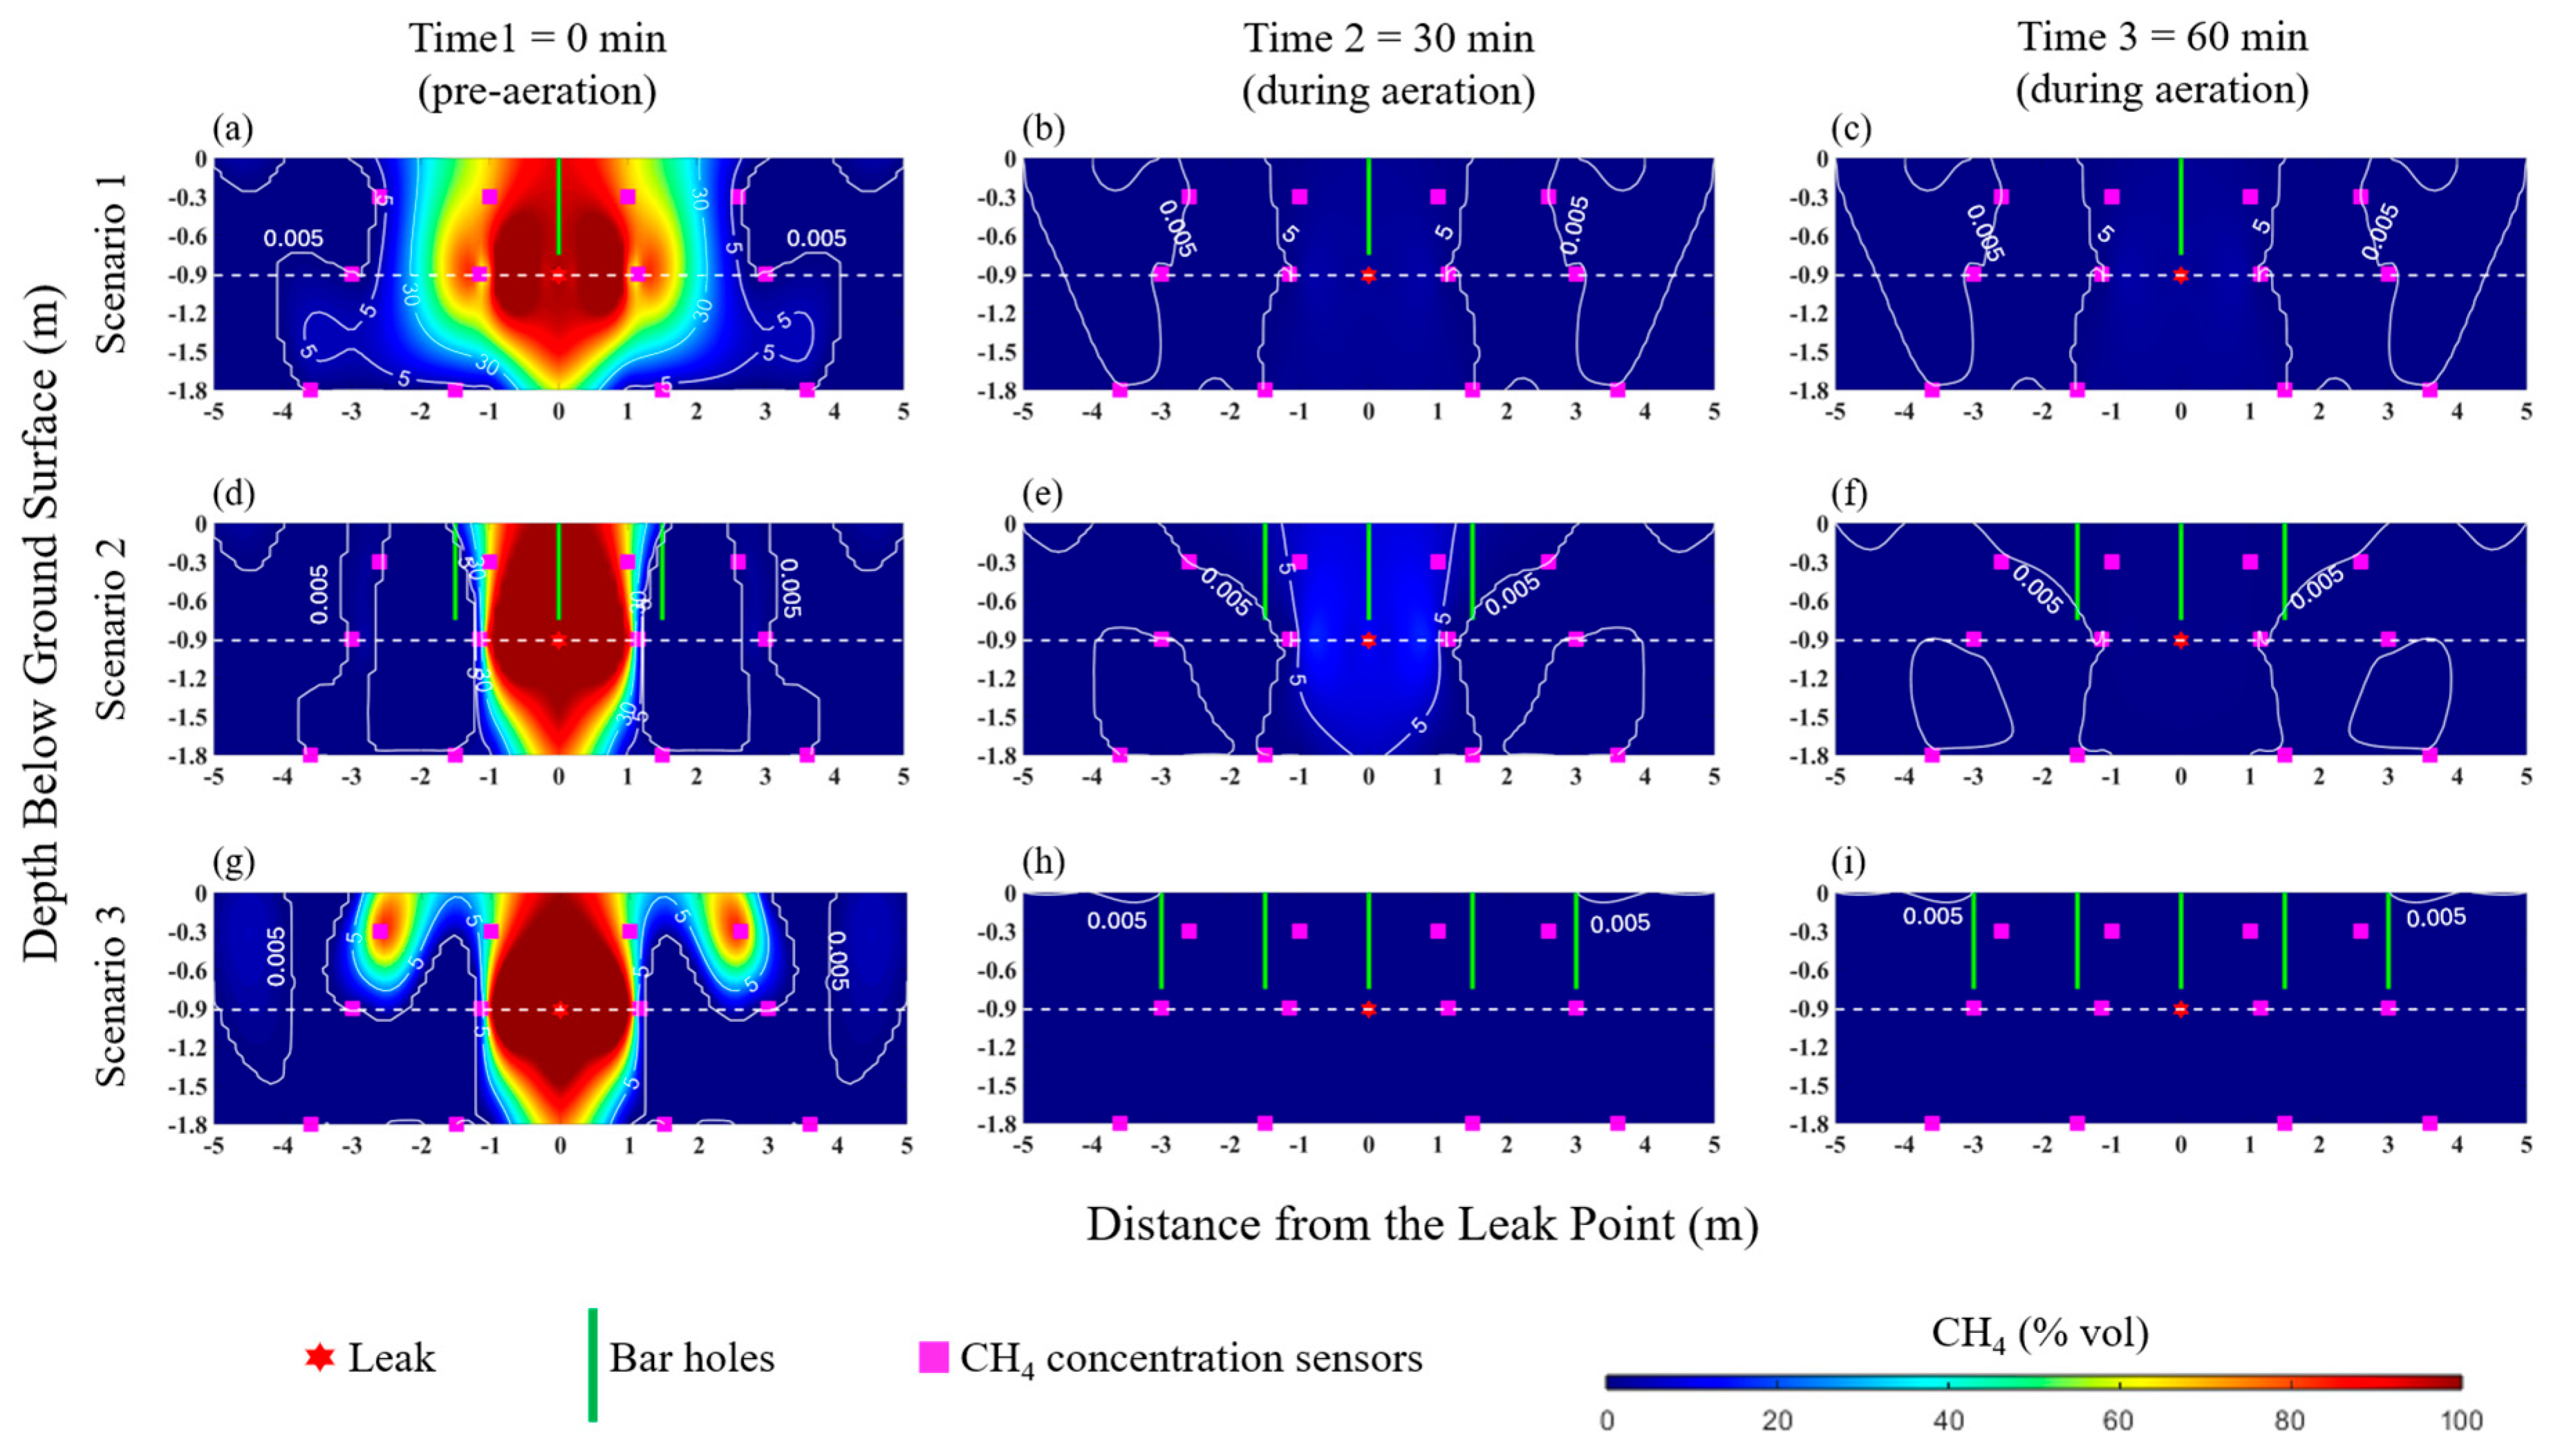
Figure 3 shows the spatial distribution of the observed methane concentrations for soil aeration experiments under three bar hole scenarios (Figure 1 and Table 1), with bar hole numbers ranging from 1 to 5. Measured CH4 concentrations were spatially interpolated to generate concentration fields. For the five bar hole scenario, concentrations were scaled during 2D plotting to account for measurement variability (Figure 3g–i).
Prior to aeration (t = 0 min), CH4 distributions exhibit a bulb-shaped plume in all scenarios (Figure 3a,d,g), reflecting buoyancy-driven upward migration combined with lateral and downward diffusion. The initial plume shows relatively concentric concentration contours centered at the leak location, extending up to approximately 4 m laterally at the leak depth (−0.9 m), as indicated by the 0.005% CH4 contour. Concentrations exceeding 60% CH4 v/v are observed within 1.5–2 m of the leak source. Vertically, CH4 concentrations remain elevated with minimal gradient near the source region. Minor variations between scenarios are due to small, unavoidable differences in the initial conditions prior to each experimental run.
During aeration, all scenarios exhibit a two-stage removal behavior: an initial drastic reduction in CH4 concentration near the leak, followed by a gradual contraction of the overall CH4 plume. Within the first 30 min of aeration (Figure 3b,e,h), residual CH4 concentrations decrease to below 40% across all scenarios, indicating advection-dominated removal near the bar hole region under the applied vacuum pressure. During this period, the 5% CH4 and 0.005% CH4 concentration contours remain relatively unchanged in position, except in the 5 bar hole scenario, suggesting limited plume contraction despite significant local concentration reduction. After 60 min of aeration (Figure 3c,f,i), CH4 concentrations continue to decrease near the leak, and the 5% and 0.005% contours shift inward towards the source. This inward movement reflects progressive contraction of the plume over time, with the most pronounced reduction observed in the three bar hole configuration.
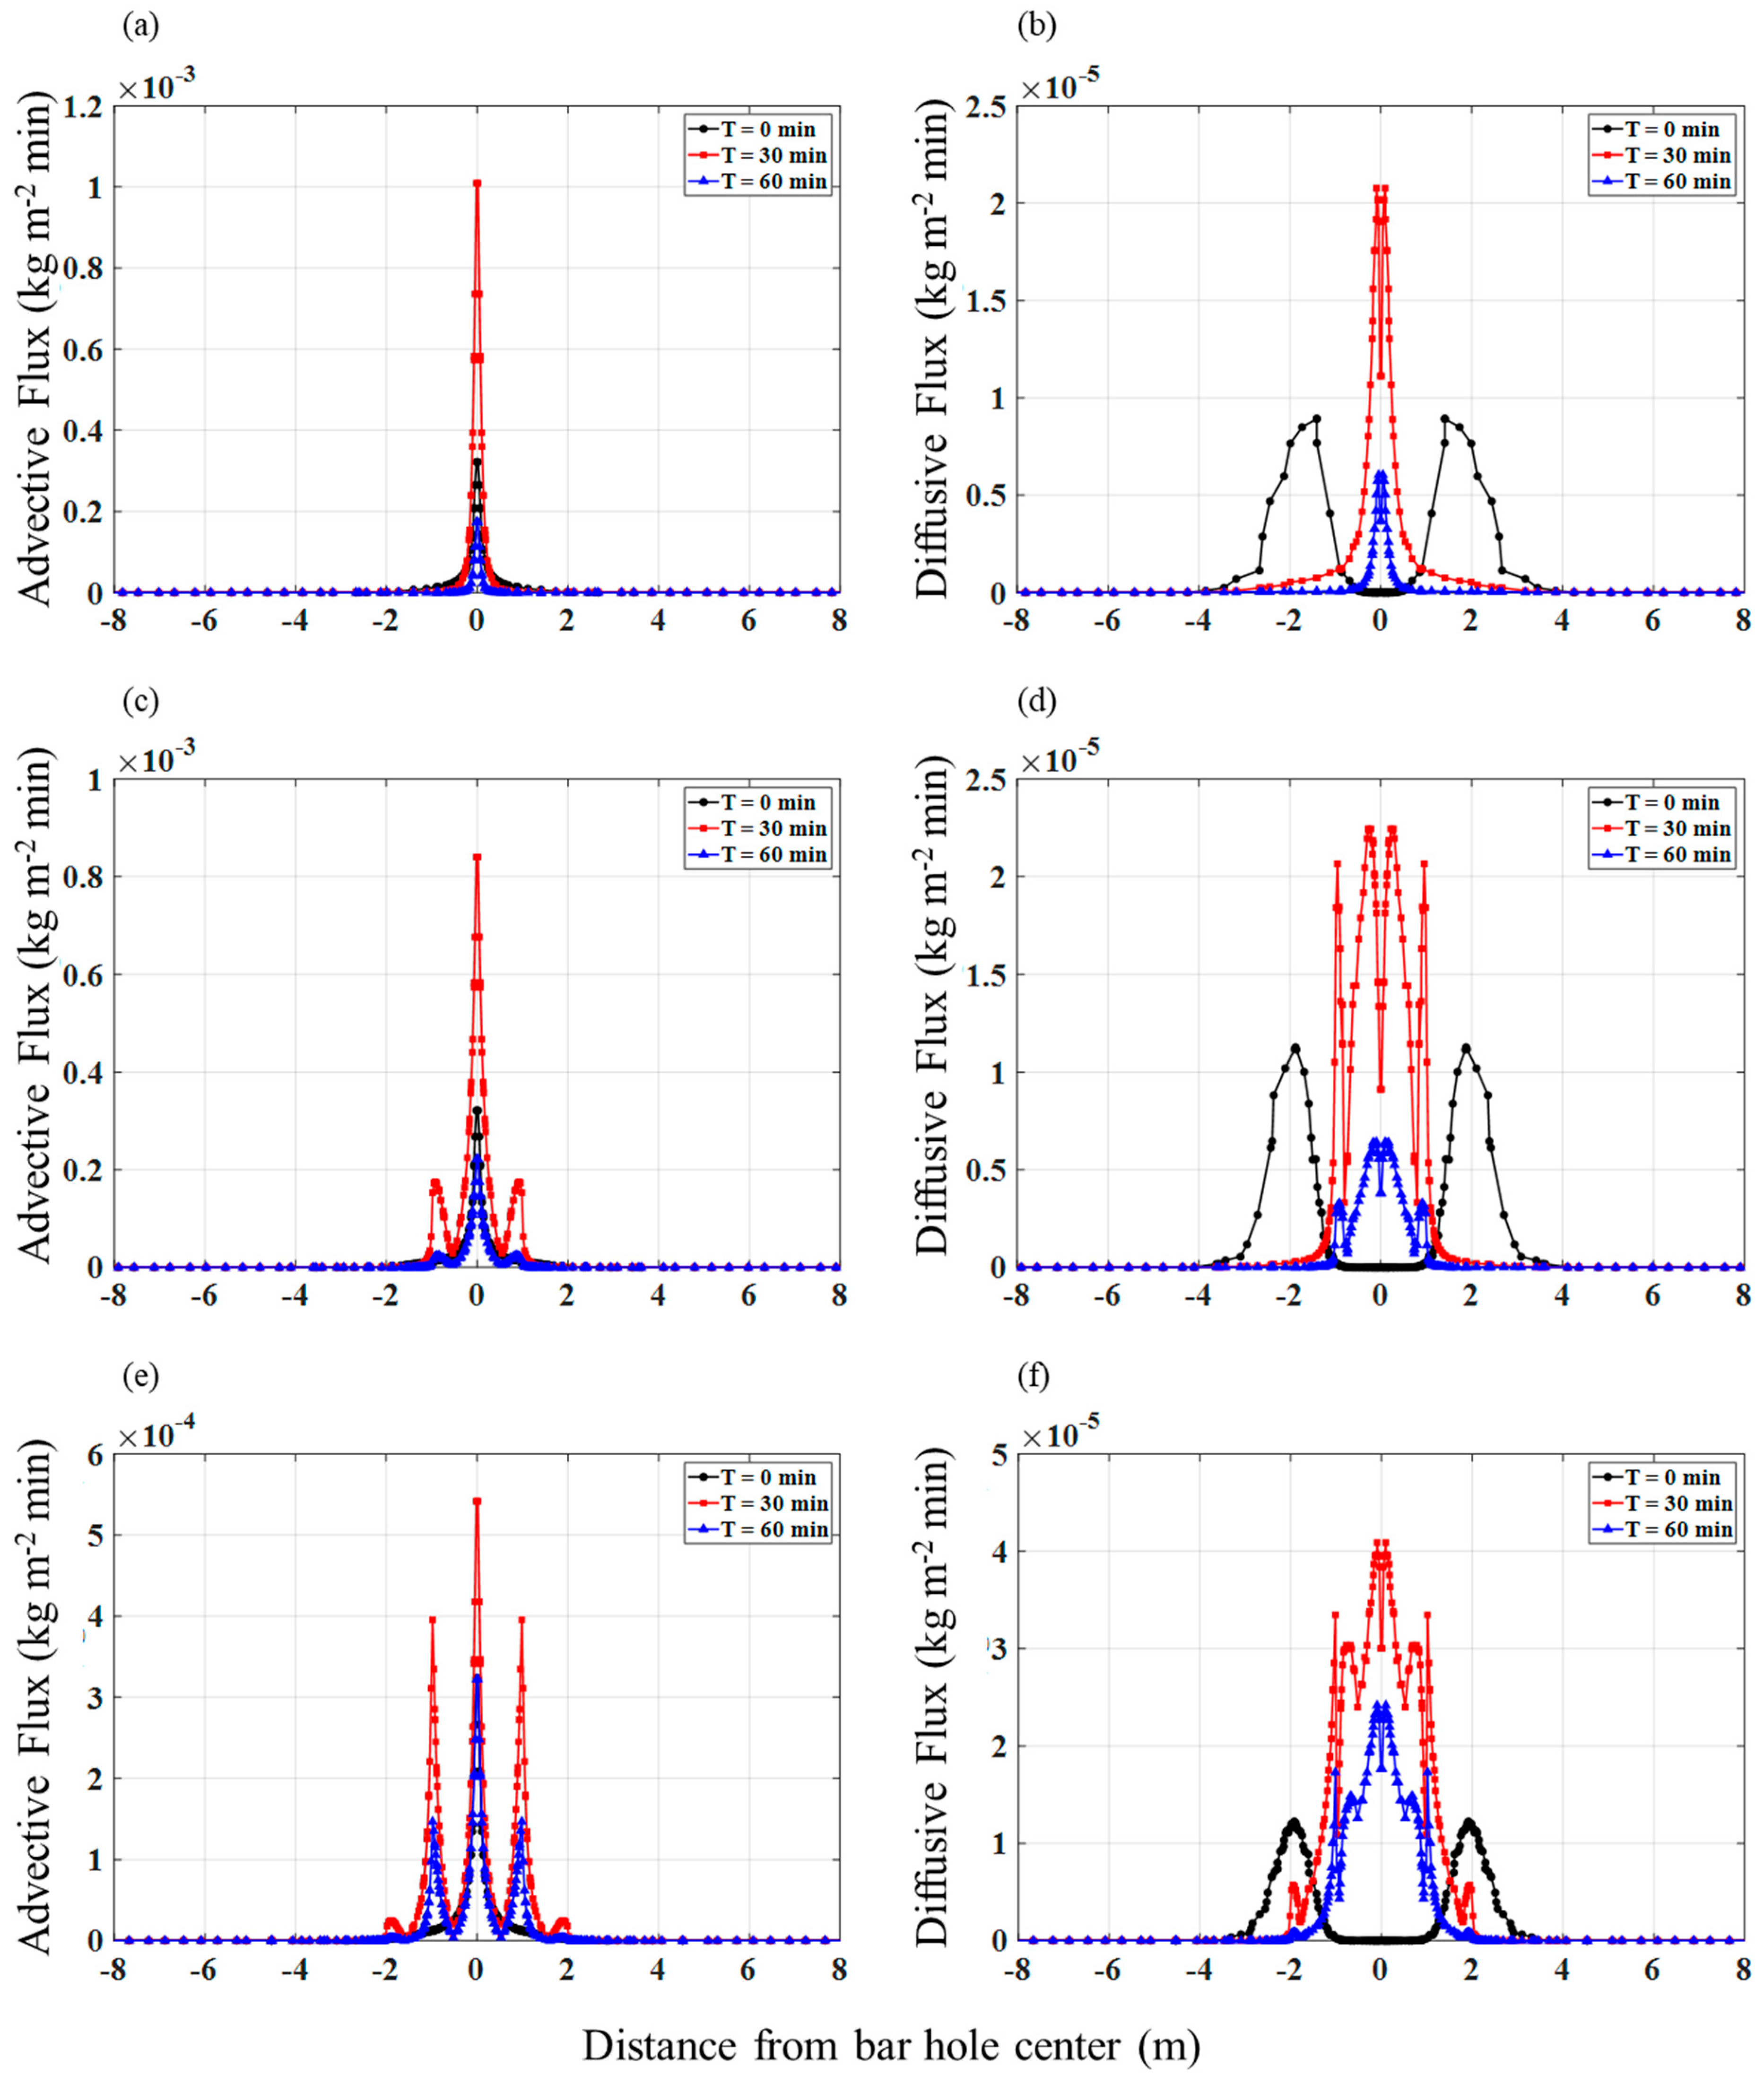
The initial decrease in high CH4 concentrations near the bar hole locations is driven by pressure-driven advective transport. As aeration progresses, the slower removal of the remaining CH4 is governed by diffusion, arising from concentration gradients within the soil pore space. Figure 4 compares simulated advective and diffusive fluxes for each aeration scenario along a transect located 0.9 m below the surface. Across all scenarios, advective fluxes are at least one order of magnitude greater than diffusive fluxes and peak at locations corresponding to the bar holes (Figure 4a,c,e). In contrast, diffusive fluxes showed the opposite behavior, reaching maximum values away from the bar holes where advective fluxes diminish (Figure 4b,d,f). Under continued application of vacuum pressure, flux magnitudes increase during the next 30 min of aeration. The elevated advective fluxes near the bar holes explain the rapid reduction in CH4 concentrations to below 40% that is observed during this period. Over longer durations (30–60 min), advective fluxes decrease by more than half, while diffusive fluxes decrease more gradually. This sustained diffusive transport contributes to the continued migration of CH4 from less accessible regions towards bar holes, resulting in progressive plume contraction. This behavior is consistent with the observed inward movement of the 0.005% concentration contours during the later stages of aeration.
In scenario 1 (single bar hole), subsurface CH4 concentrations decreased to below 20% within the first 30 min of aeration, predominantly near the leak location. The plume exhibited initial contraction toward the bar hole, as evidenced by the inward movement of the 5% contour from approximately 2.5 m before aeration to 1–1.5 m. This behavior is attributed to the placement of the bar hole directly above the leak, where the highest CH4 concentrations are present (Figure 3a–c). During this period, the 0.005% contour remained largely unchanged, indicating limited impact on the outer plume boundary.
Continued aeration from 30 to 60 min resulted in minimal additional CH4 removal, with both the 5% and 0.005% contours remaining relatively unchanged. This behavior is consistent with the decline in the advective transport after the initial aeration period. Advective fluxes were active within approximately 1.5 m of the bar hole and drove the rapid, early removal of highly concentrated gas. In contrast, diffusive fluxes extended up to ~4 m and contributed to the limited inward movement of the 5% contour during the first 30 min. Over time, both advective and diffusive fluxes diminished (Figure 4a,b), approaching a quasi-steady state that corresponds to the stabilization of plume boundaries observed at 60 min (Figure 3c).
In Scenario 2 (three bar holes), residual CH4 concentrations decreased to approximately below 30% within the first 30 min of aeration (Figure 3e). While the 5% contour remained largely unchanged during this period, the 0.005% contour shifted toward the bar holes located ±1 m from the plume center, indicating partial contraction of the plume boundary. After 60 min (Figure 3f), residual CH4 concentrations further decreased to below 5%; however, the outer plume boundary remained largely unchanged.
Minor irregularities in the plume shape are likely due to the sensor placement relative to the bar holes. Compared to Scenario 1, CH4 concentrations remained approximately 10% higher during the first 30 min, reflecting differences in advective transport behavior. As shown in Figure 4c, three distinct advective peaks correspond to the bar hole locations, but their magnitudes are lower than in the single bar hole scenario. Advective fluxes at ±1 m are approximately one-quarter of those at the center, suggesting that overlapping pressure-driven flow fields reduce the effectiveness of localized gas removal. This interaction can lead to competing flow paths and reduced removal efficiency. In contrast, diffusive fluxes extend over a broader region with multiple bar holes (Figure 4d), contributing to the removal of lower-concentration CH4 and influencing the movement of the outer plume boundary. Although smaller advective fluxes near the plume center continue to remove residual CH4, limited diffusive transport beyond this region results in minimal change in the outer plume extent over time.
In Scenario 3 (five bar holes spaced 1.5 m apart), CH4 removal was significantly enhanced (Figure 3g–i). Within the first 30 min, the CH4 plume was effectively eliminated from the subsurface (Figure 3h). This improved performance is associated with higher-magnitude advective fluxes that extend up to approximately 2 m from each bar hole, along with increased diffusive transport relative to the other scenarios. Although some overlap of advective zones is present, the greater spatial coverage and higher flux magnitudes result in rapid and near-complete removal of residual CH4 within the aeration period.

3.2. Effect of Soil Type

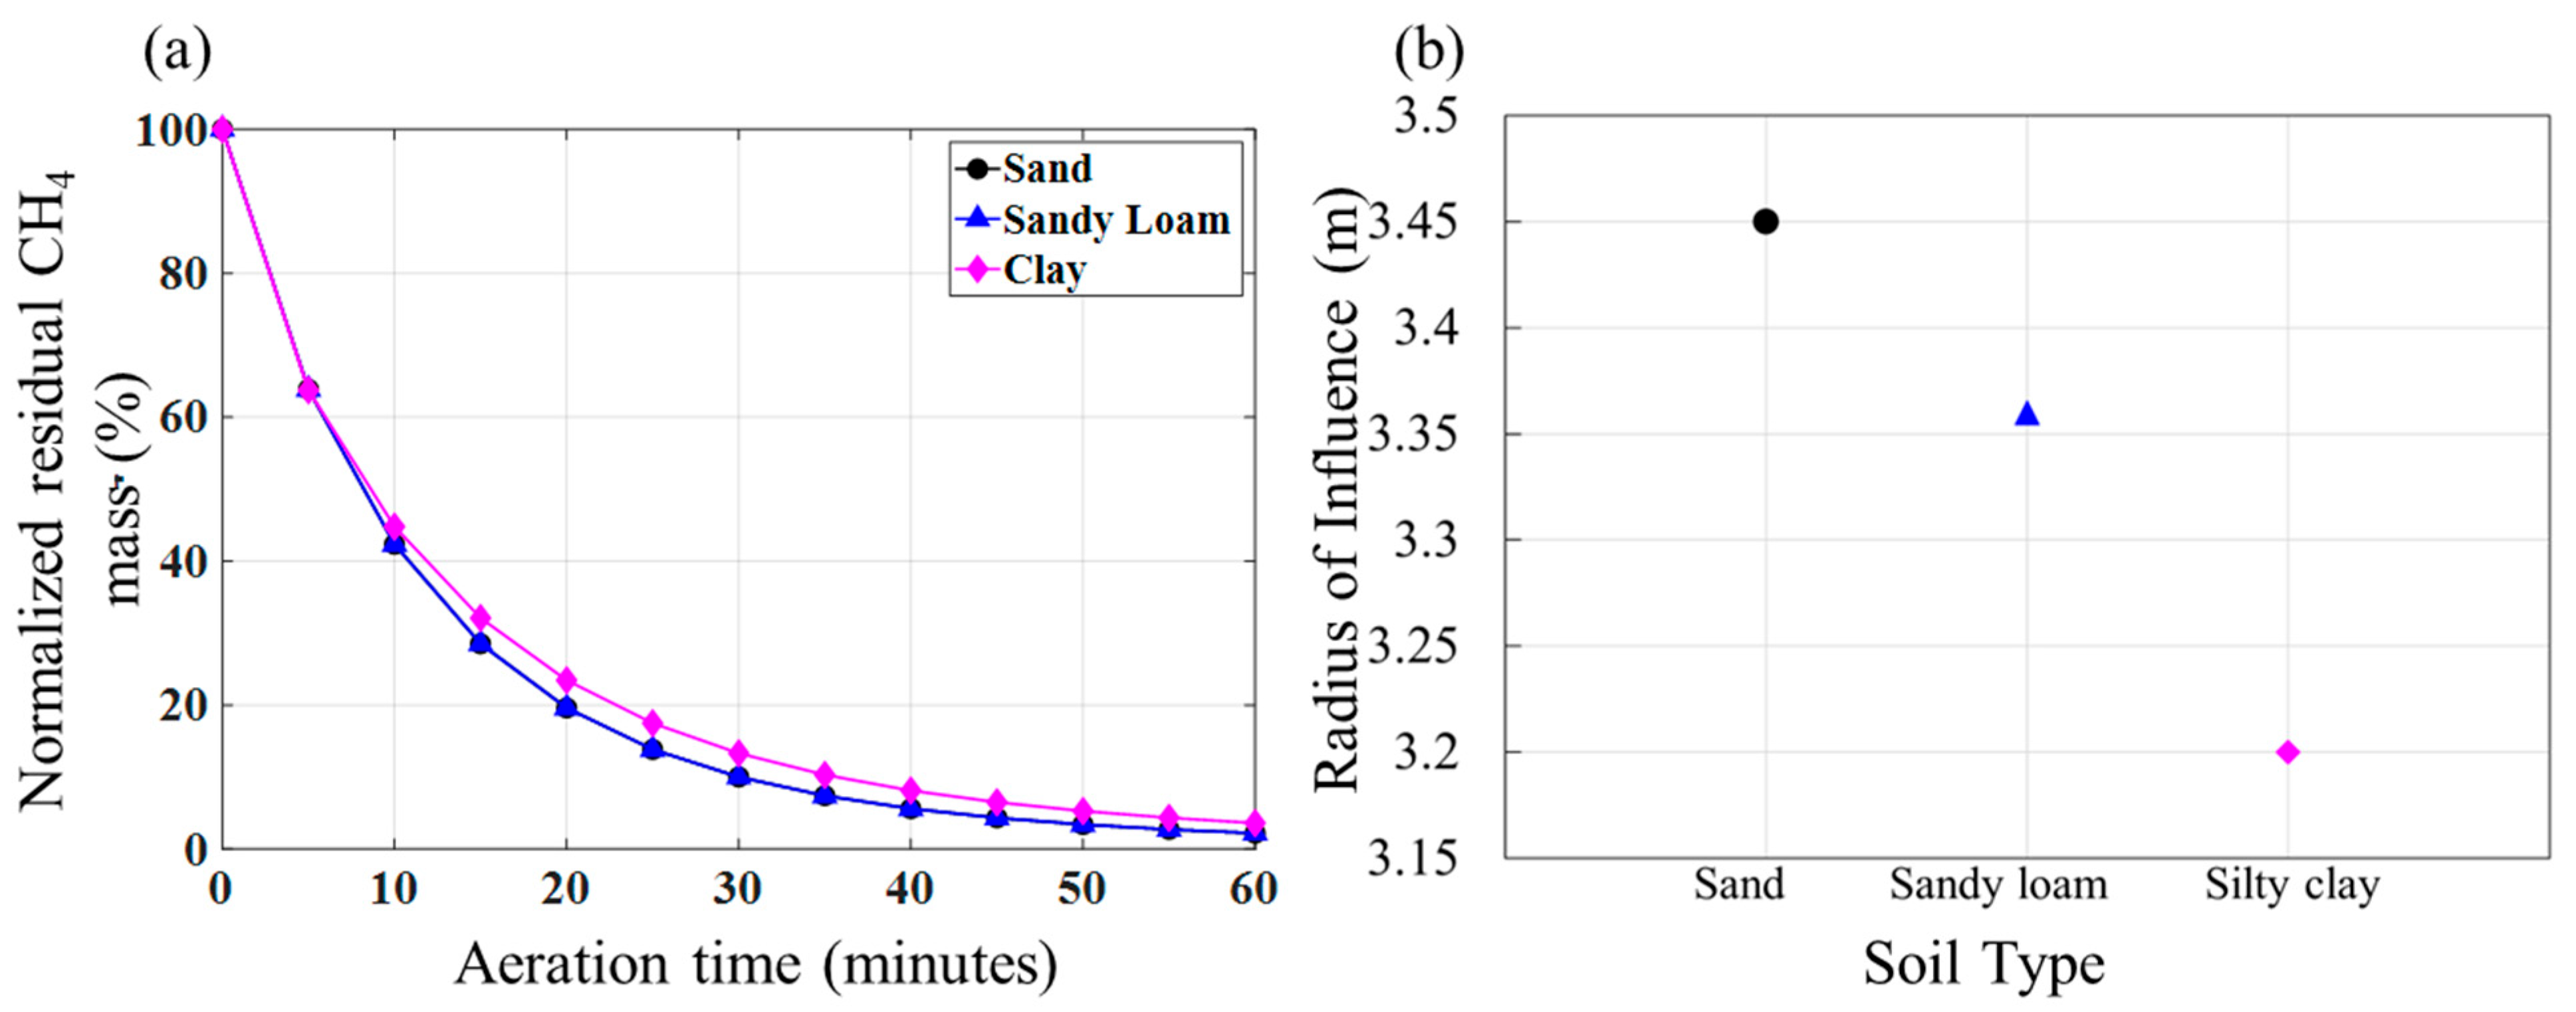
This section evaluates the influence of soil type on aeration performance using numerical simulations. The variation in residual CH4 mass and radius of influence is compared for sand, sandy loam, and silty clay soils (Figure 5). Simulations were conducted at a soil moisture saturation of 0.2 under a vacuum pressure of 0.9 atm.
Results show that silty clay exhibits a significantly slower response to aeration compared to sand and sandy loam, which demonstrate similar and more rapid CH4 removal rates (Figure 5a). In addition, silty clay yields a smaller radius of influence, whereas sand and sandy loam show only minor differences (approximately 0.05 m) in radius of influence (Figure 5b). These trends reflect differences in soil permeability, which governs advective gas transport. The permeability of sand used in this study (1.80 × 10⁻¹¹ m2) is approximately five times greater than that of sandy loam (3.53 × 10⁻¹² m2), while silty clay permeability (3.82 × 10⁻¹⁴ m2) is three orders of magnitude lower than sand. The rate of CH4 removal is controlled by the extent to which advective airflow can access and mobilize residual gas [6], which is strongly influenced by soil permeability and pore structure [9,12,13]. As a result, higher-permeability soils facilitate more effective gas transport and removal.
Figure 5a further illustrates the temporal behavior of CH4 removal. For sand and sandy loam, removal follows a non-linear pattern, with more than 50% of the residual CH4 mass removed within the first 10 min and approximately 90% removed within 30 min. This rapid initial removal is consistent with advection-dominated transport, where advective fluxes exceed diffusive fluxes by up to two orders of magnitude (Figure 4). At later times, removal rates decrease as transport becomes diffusion-limited, with CH4 migrating from less accessible pore spaces into the active aeration zone. This behavior is consistent with previous observations of rapid initial recovery followed by prolonged low-rate removal (e.g., Brusseau et al. [38] and Yoon et al. [7]).
The radius of influence (RI) defines the effective aeration zone as the maximum lateral distance from the bar hole over which pressure-driven (advective) gas transport remains significant. This is reflected in Figure 5b, where sand exhibits a larger RI compared to sandy loam, consistent with its higher permeability. In low-permeability soil, gas migration is dominated by diffusion, and the effective aeration zone is governed by diffusion length rather than pressure-driven flow [7,39]. Under these conditions, aeration efficiency is significantly reduced, often requiring longer durations with limited overall mass removal. These findings support current industry practice, where soil aeration is most effective in highly permeable soils such as sand and sandy loam. However, the results also highlight the importance of recognizing the non-linear nature of CH4 removal. Substantial mass removal occurs early in the aeration process, followed by a slower, diffusion-limited phase. As a result, effective aeration requires not only appropriate system design but also sufficient operating time to achieve meaningful removal beyond the immediate bar hole influence.

3.3. Effect of Soil Moisture

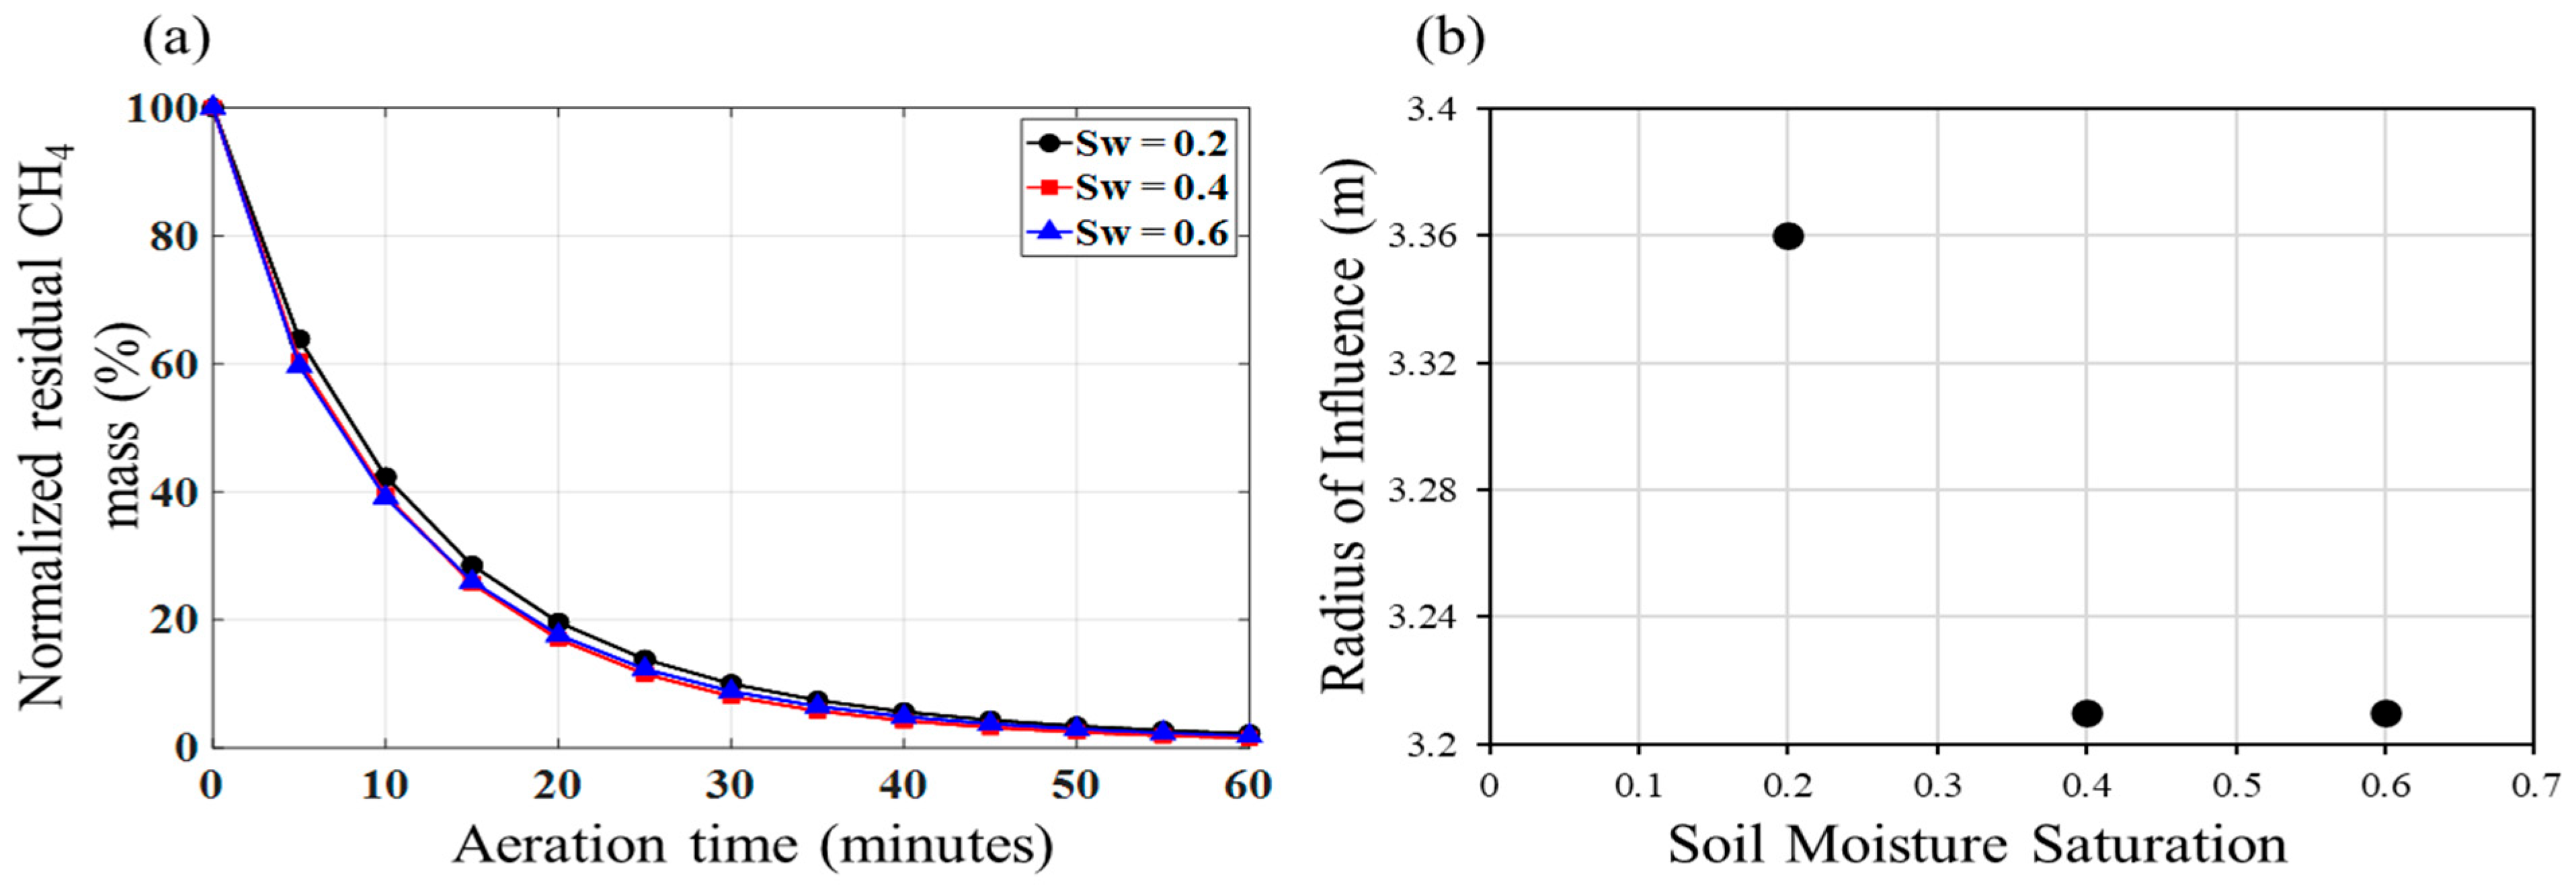
Numerical simulations were used to evaluate the impact of soil moisture on aeration performance, enabling controlled representation of vertical moisture profiles that are difficult to isolate under field conditions. To maintain consistency with field experiments, simulations were conducted for sandy loam soils. The impact of soil moisture was assessed at three saturation levels (Sw = 0.2, 0.4, and 0.6). Figure 6 compares the simulated variation in normalized residual CH4 mass and radius of influence of a single bar hole under these moisture conditions. All simulations were conducted at a vacuum pressure of 0.9 atm.
Figure 6a shows that soil moisture saturation has a limited influence on normalized residual CH4 mass over the full aeration duration (60 min) for sandy loam under a vacuum pressure of 0.9 atm. However, during the intermediate period (5–40 min), higher moisture saturations ( S w = 0.4 and 0.6) exhibit a slightly faster reduction in CH4 mass compared to S w = 0.2 . By 50–60 min, residual CH4 mass converges across all moisture conditions.
This behavior reflects the competing effects of soil moisture on advective and diffusive transport. Increasing moisture content can enhance pressure-driven (advective) transport through connected macropore networks [10,11,12,40], while simultaneously reducing diffusive transport by limiting gas movement through smaller pore spaces [41]. As a result, short-term removal may be slightly enhanced under higher moisture conditions, but long-term removal becomes diffusion-limited, leading to similar overall performance across moisture levels [6,7].
The influence of moisture is more clearly reflected in the radius of influence (Figure 6b), which decreases with increasing saturation. The largest radius of influence is observed at S w = 0.2 , while increasing saturation to 0.4 reduces the radius by approximately 5%, with minimal additional change at S w = 0.6 . This trend suggests that increasing moisture reduces the extent of pressure propagation through the soil, although connected macropore pathways continue to support advective flow under higher saturation conditions.
From a practical perspective, these results indicate that soil aeration is most effective under lower moisture conditions, where both gas transport and radius of influence are maximized. However, when aeration needs to be conducted under higher moisture conditions, applying higher vacuum pressure can partially offset these limitations by maintaining advective transport and preserving effective aeration coverage. This has direct implications for bar hole spacing, as comparable radius of influence values can be achieved under higher moisture conditions when sufficient pressure is applied.

3.4. Effect of Vacuum Pressure

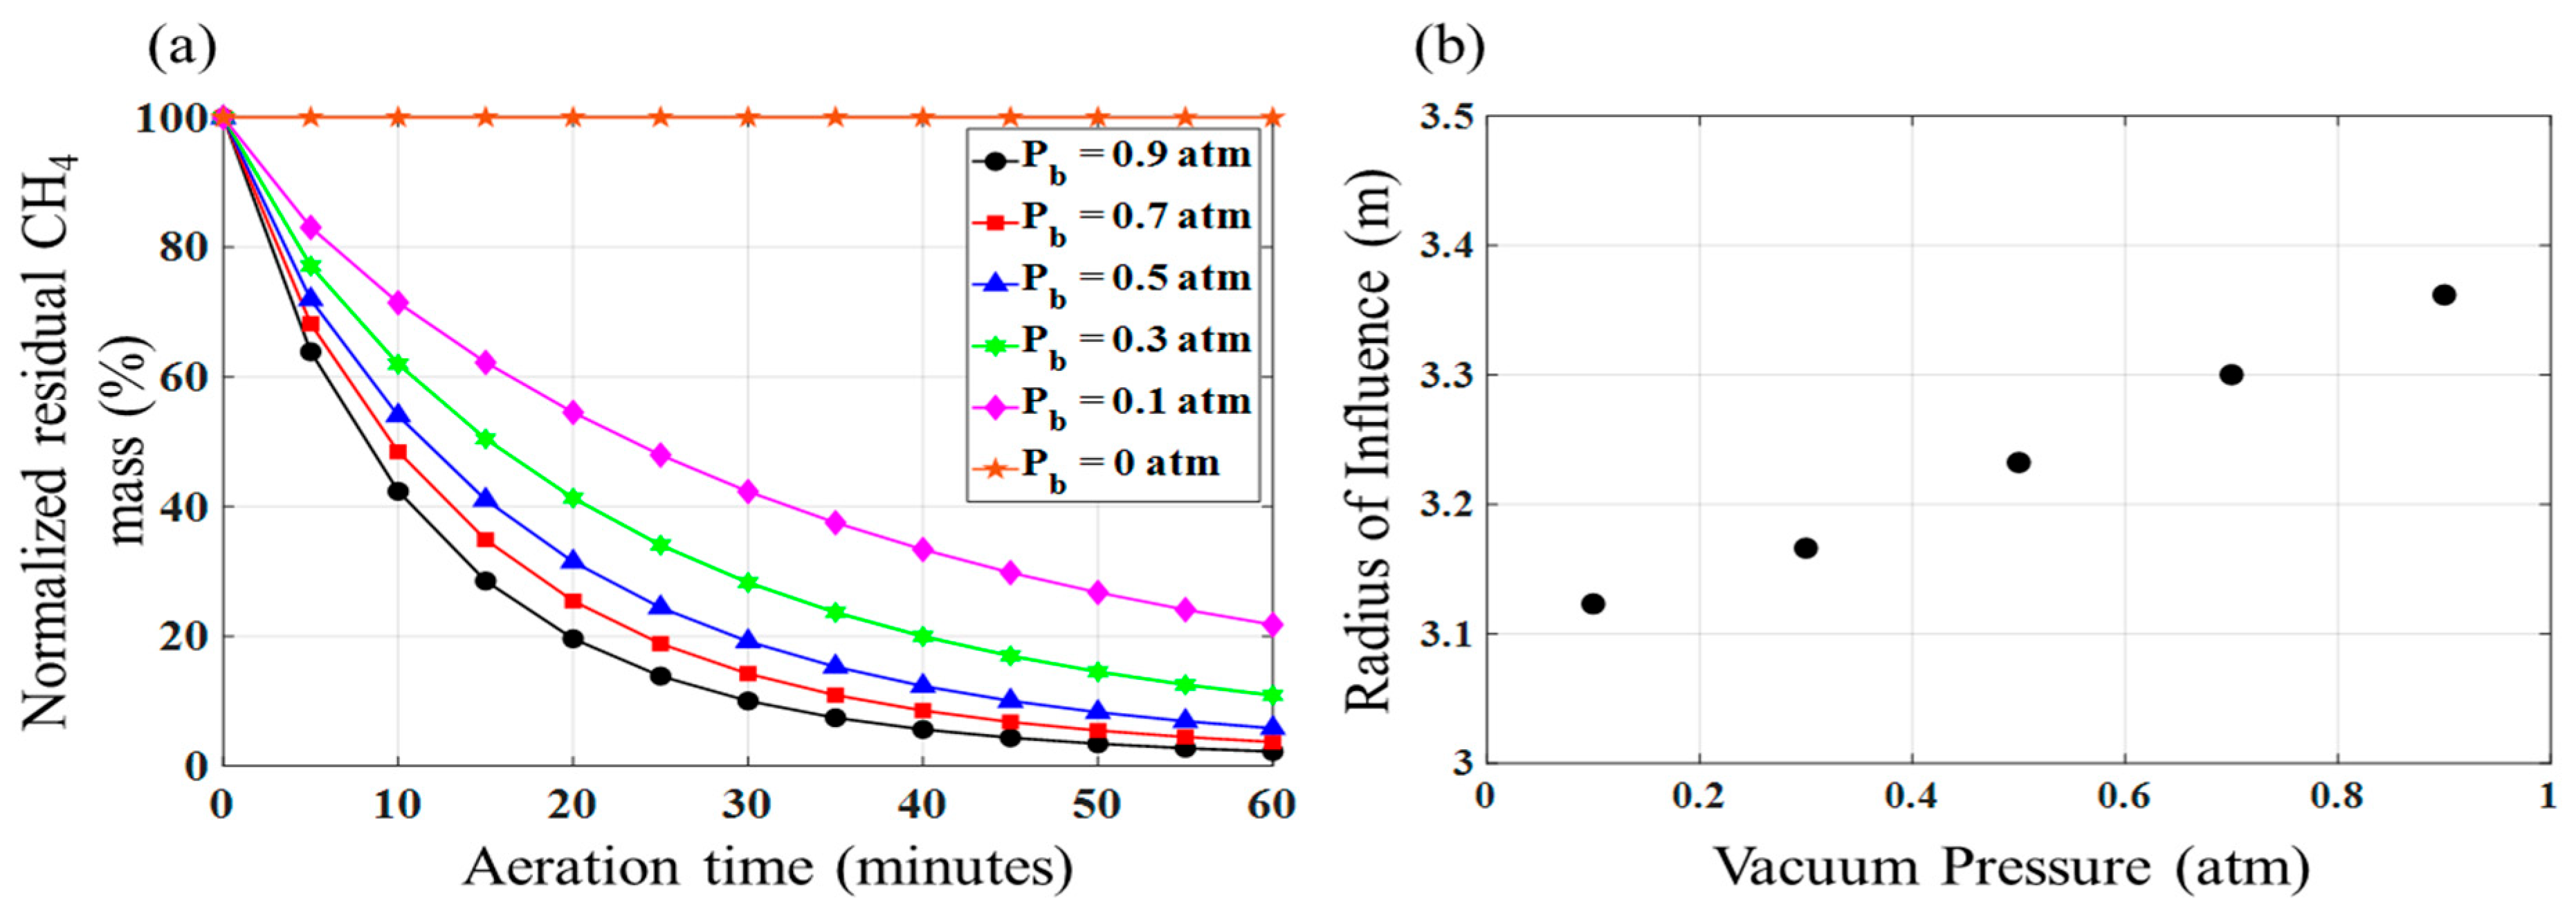
Figure 7 shows the variation in normalized residual CH4 mass over time and radius of influence in sandy loam (Sw = 0.2) for a single bar hole under varying vacuum pressures (0–0.9 atm). Results demonstrate that increasing vacuum pressure significantly enhances CH4 removal. Under passive conditions (0 atm), residual CH4 mass remains essentially unchanged over time. In contrast, applying even a small vacuum pressure (0.1 atm) results in substantial removal, reducing residual CH4 mass to approximately 20% after 60 min. Increasing the vacuum pressure to 0.9 atm further reduces residual CH4 mass to approximately 5%, representing a 15 percentage-point improvement over the same duration. This behavior is driven by increased advective transport resulting from stronger pressure gradients, which enhance gas removal from the subsurface. The corresponding increase in radius of influence (Figure 7b) further reflects the expanded effective aeration zone under higher vacuum pressures.
However, the relationship between vacuum pressure and residual methane concentration is nonlinear. The largest gains occur at lower pressure ranges; for example, increasing pressure from 0 to 0.1 atm results in an approximately 80 percentage-point reduction in residual CH4 mass. In contrast, increasing pressure from 0.7 to 0.9 atm yields only a modest additional reduction of approximately 5 percentage points. These results indicate diminishing returns at higher vacuum pressures, suggesting that moderate-to-high pressure ranges can achieve substantial removal without the need for maximum applied vacuum.
Figure 7b shows the variation in the radius of influence (RI) of a single bar hole under varying vacuum pressures in a sandy loam soil (Sw = 0.2). Simulation results show that RI increases with increasing vacuum pressure, exhibiting an approximately linear relationship over the range of conditions tested. This behavior reflects the dependence of R I on the applied pressure gradient. As vacuum pressure increases, the resulting pressure difference between the bar hole and the surrounding soil expands the region over which pressure-driven (advective) transport is effective, thereby increasing the radius of influence. The increase in R I corresponds to an expansion of the effective aeration zone, which contributes to the enhanced CH4 removal observed under higher vacuum pressures (Figure 7a).
From a practical perspective, these results suggest that applying moderate-to-high vacuum pressures can improve aeration performance by increasing both the rate of removal and the spatial extent of treatment.

3.5. Effect of Number of Bar Holes

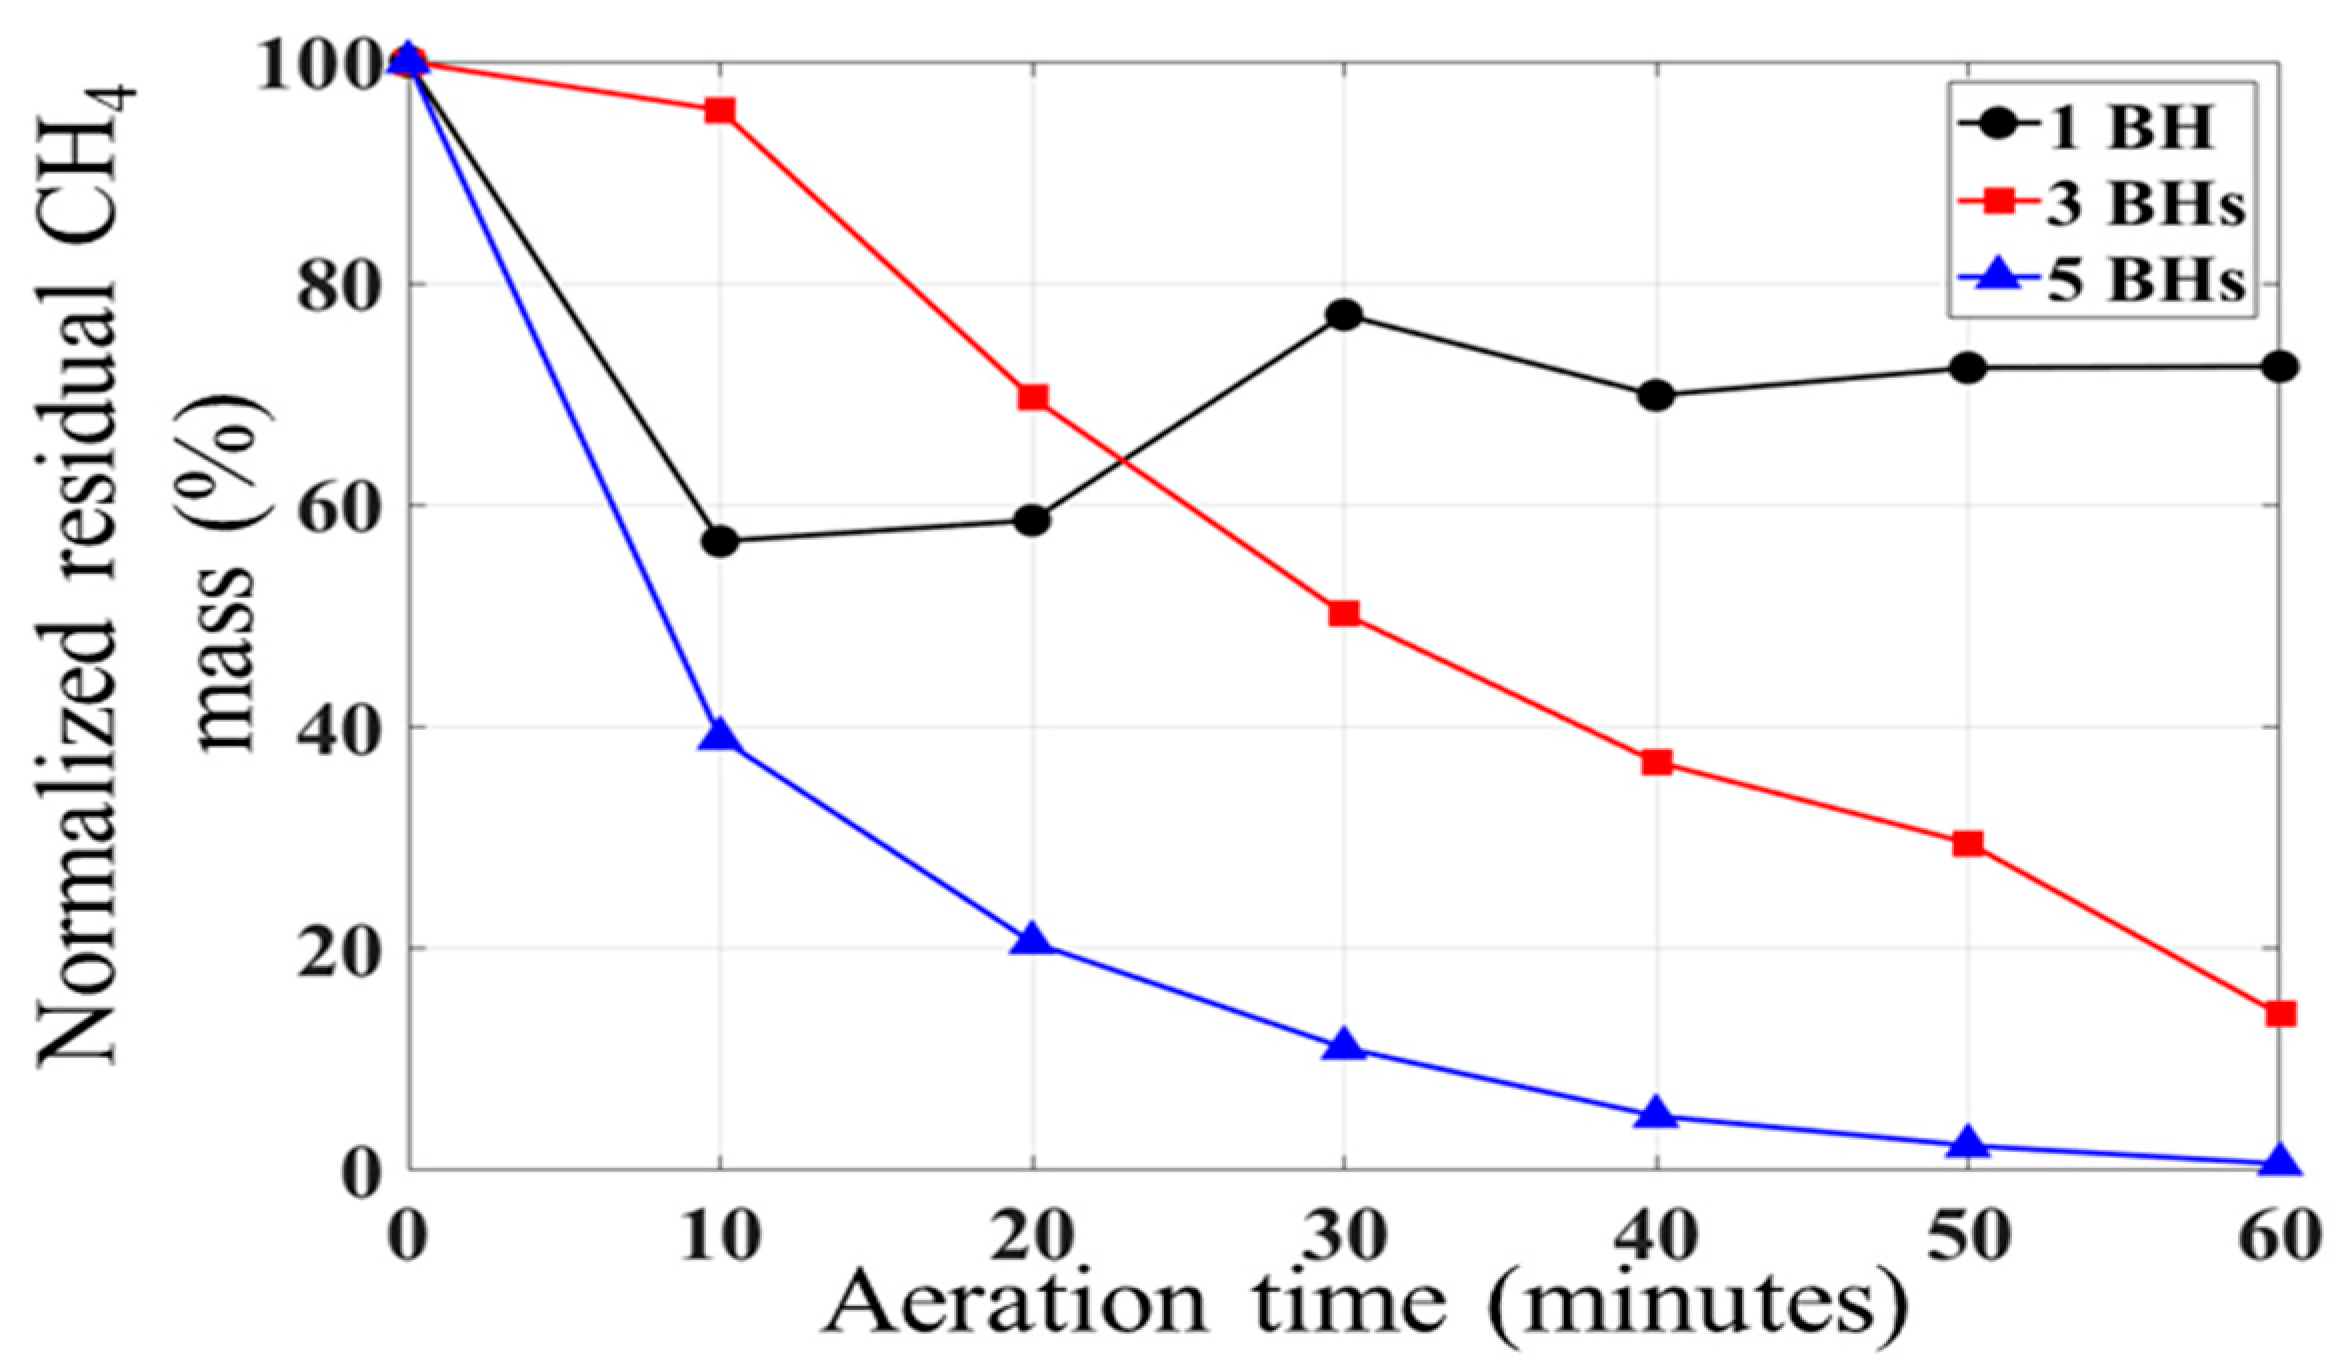
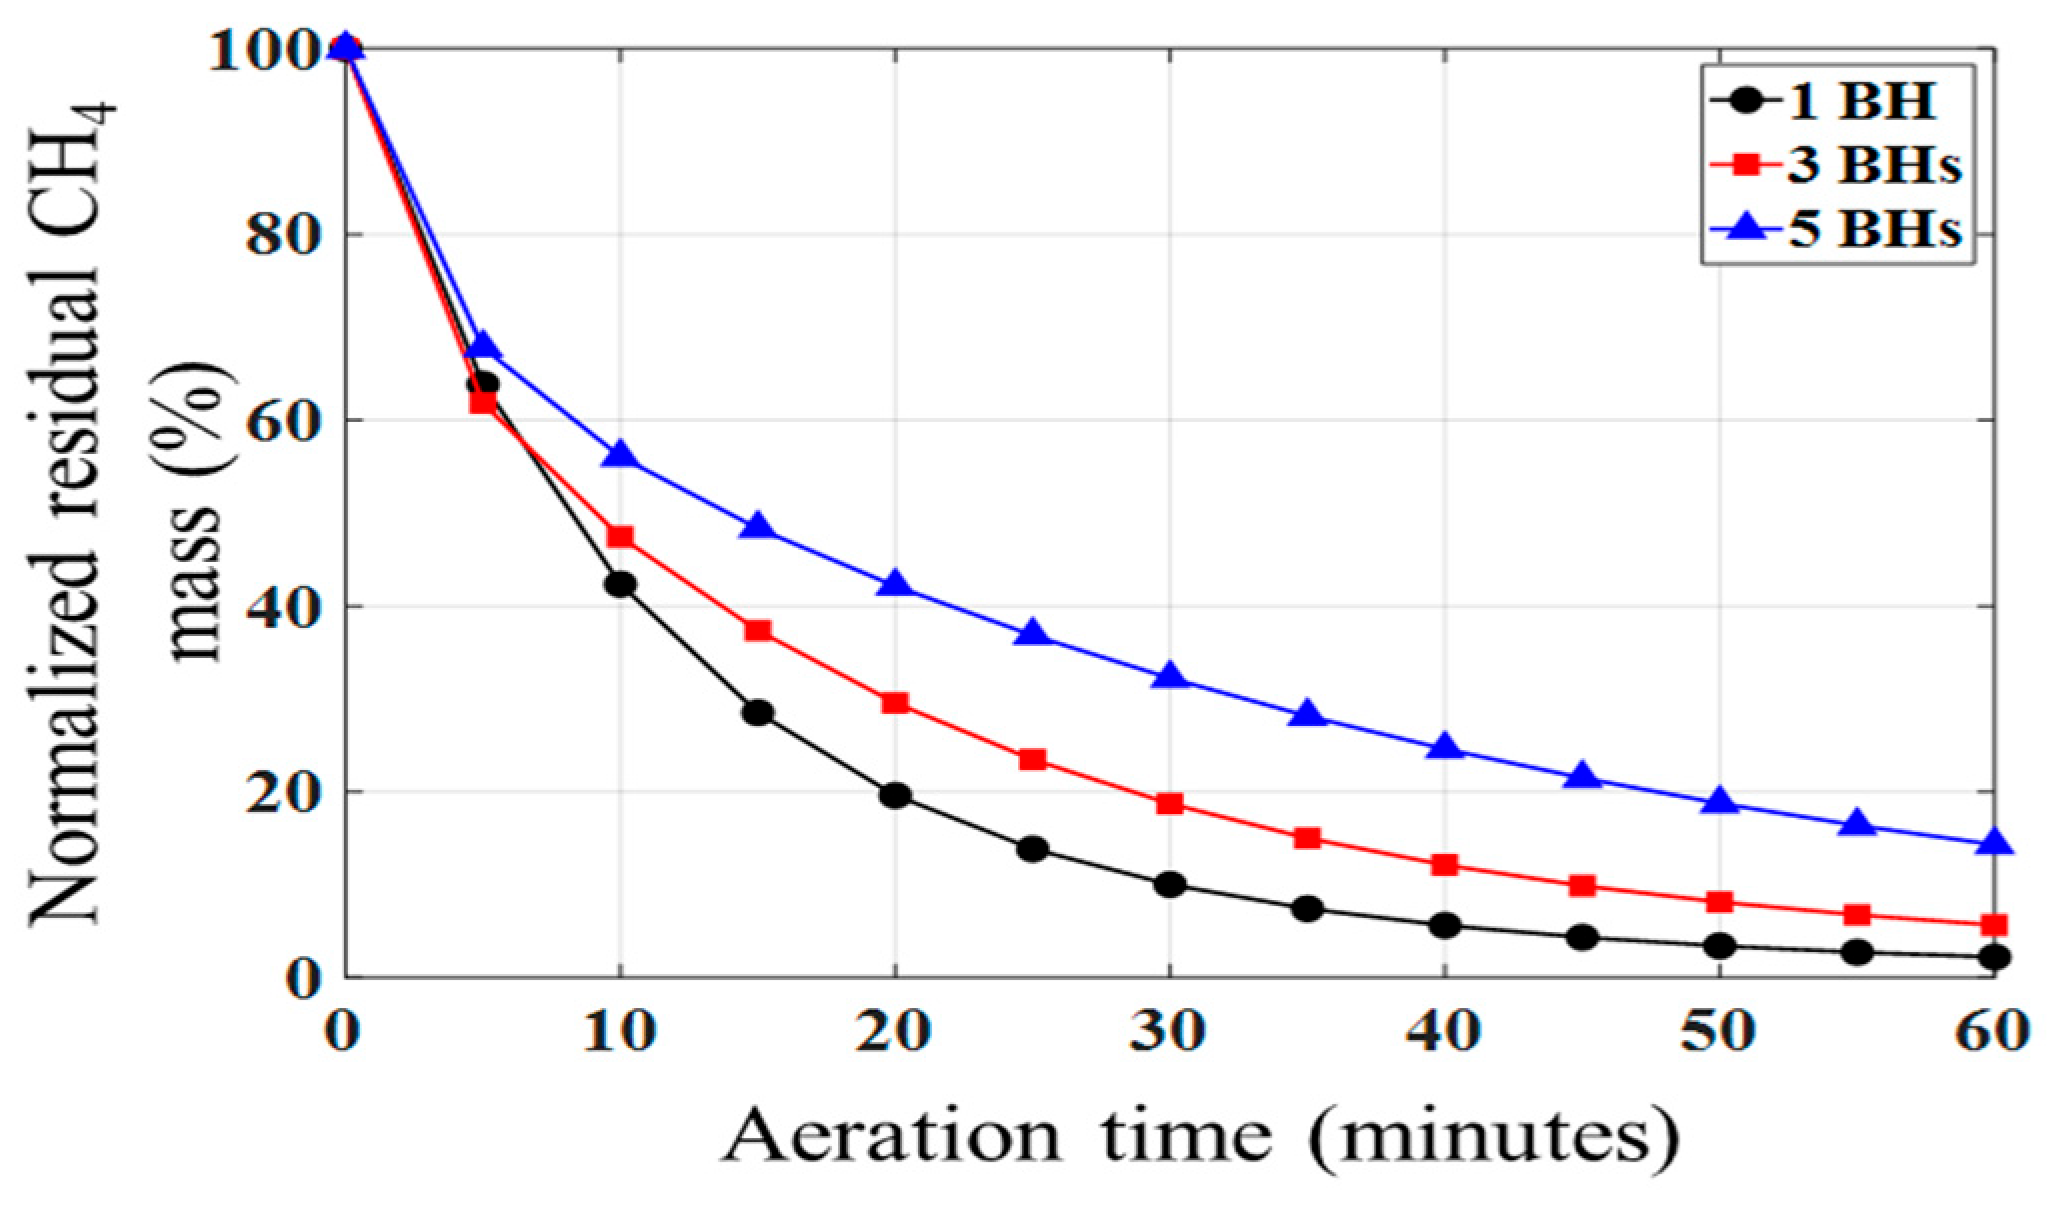
Selection of the number of bar holes for a given NG plume is governed by the radius of influence (RI), which depends on the soil type, soil moisture saturation, and applied vacuum pressure. To achieve effective plume coverage, bar hole placement and spacing between bar holes should be equal to or less than two times RI. This study compares the experimental residual CH4 mass under different bar hole configurations, with bar holes placed at equal spacing (1.5 m apart as shown in Figure 1) in sandy loam soil at a moisture saturation of 0.2 and a vacuum pressure of 0.4 atm (Figure 8). Results show that increasing the number of bar holes improves CH4 removal performance. After 60 min of aeration, the five bar hole configuration resulted in the lowest residual CH4 mass, followed by the three bar hole configuration, while the single bar hole configuration exhibited the least removal. These results indicate that increasing the number of bar holes enhances removal by expanding the effective aeration coverage and improving access to the plume. However, this improvement is dependent on appropriate spacing relative to the radius of influence, as improper placement can reduce efficiency despite increasing the number of bar holes.
Three scenarios with varying bar hole numbers showed distinct patterns of aeration. In scenarios with single and five bar holes, residual CH4 mass decreased rapidly during the initial stages of aeration, with more than 60% removal occurring within the first 10–20 min. This early-time behavior is followed by distinct trends depending on the bar hole configuration. The three bar hole scenario had a gradual decrease throughout the aeration period. For the single bar hole scenario, residual CH4 mass exhibits a sudden reduction at the start, followed by an increase in residual CH4 mass, then a plateau between 40–60 min, indicating a transition to diffusion-limited conditions as advective transport reaches equilibrium. A slight increase in residual CH4 mass around 20 min of aeration suggests rebound due to diffusion from regions outside the effective aeration zone.
Increasing the number of bar holes enhances later-time removal; however, it slows down early removal while improving sustained, long-term reduction, with no signs of rebound. The reduced initial removal rate in this case is attributed to the overlap of advective flow zones, which reduces the magnitude of localized fluxes despite increasing overall coverage. In contrast, the five bar hole configuration shows a more consistent decrease in residual CH4 mass over the full 60 min period, ultimately achieving the greatest overall removal. It can be said that the better plume coverage with five bar holes still removes more CH4 despite the possible overlap of advective flow zones.
The role of bar hole number becomes more complex under higher vacuum pressures. Figure 9 presents simulation results at 0.9 atm, where overall CH4 removal is significantly enhanced compared to 0.4 atm conditions. Under these conditions, the single bar hole configuration exhibits the highest removal rate, while configurations with three and five bar holes show reduced efficiency. This behavior is attributed to the expansion of the radius of influence with increasing vacuum pressure, which leads to greater overlap of advective zones in multi-bar hole configurations. As a result, competing flow fields reduce effective gas transport and create regions of incomplete aeration. For example, a simulated NG plume before aeration expands up to ~2 m from the leak point (Figure S4), and the advective flux from a single bar hole expands ~2 m from a bar hole (Figure 4a), matching the plume radius. As discussed in Section 3.1, CH4 moves towards the bar hole when vacuum pressure is applied, and in this single bar hole scenario, the entire plume is now drawn towards the single bar hole. Contrastingly, when multiple bar holes are placed, the advective effects overlap. As a high vacuum pressure (0.9) is applied from three points, with two of the bar holes placed near the edge of the plume (Figure S4), the CH4 plume originally concentrated around the leak point starts redistributing laterally, reducing the removal of higher concentrations. Further introduction of bar holes, placed at the same spacing, will reside outside of the plume, causing extended lateral expansion, especially of higher concentrations of the plume upon application of vacuum pressure, thereby reducing the removal efficiency. Gas migration patterns under varying bar hole numbers and spacings (determined based on applied vacuum pressure) can be found in Supplementary Materials Figures S6 and S7.
In contrast, under lower vacuum pressure (0.4 atm), the smaller radius of influence limits overlap between bar holes. In this scenario, increasing the number of bar holes improves overall removal by expanding plume coverage, even though individual bar hole effectiveness is lower.
These results demonstrate that the optimal number of bar holes depends on the interaction between vacuum pressure and radius of influence. From a practical perspective, bar hole number and spacing should be determined based on plume size and the radius of influence of a single bar hole to ensure adequate coverage while minimizing interference between flow fields.

3.6. Effect of Bar Hole Spacing

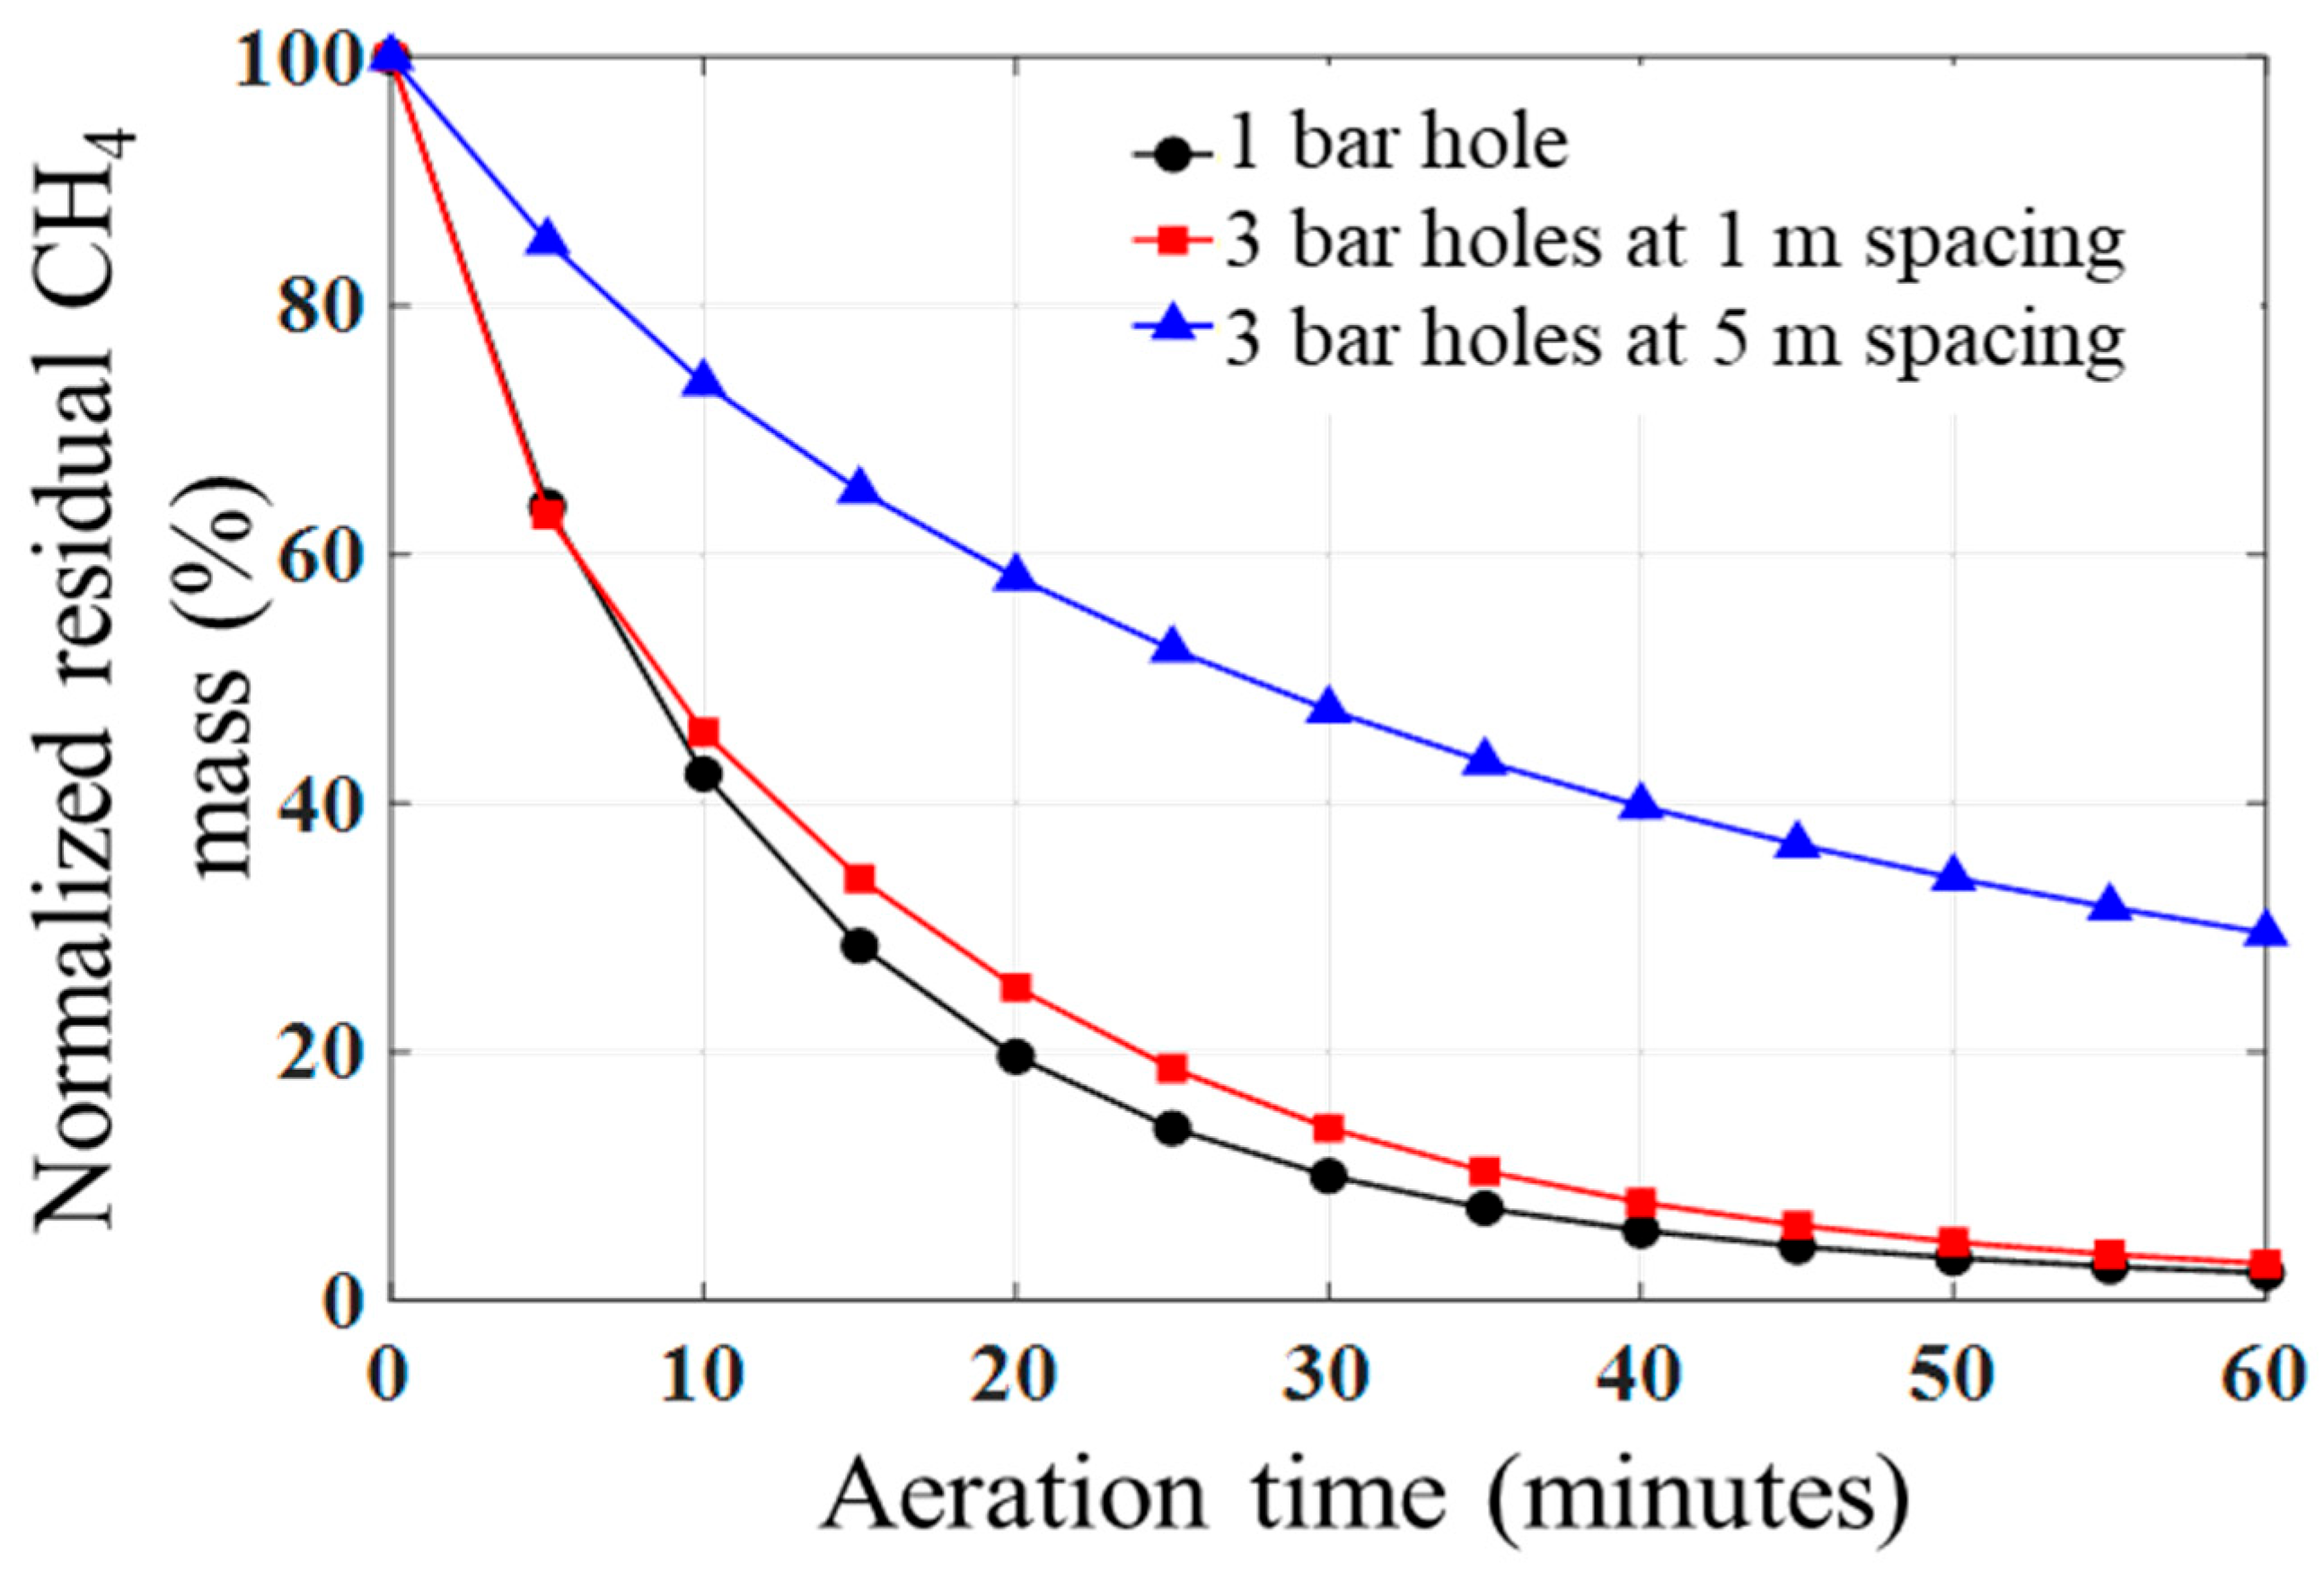
Results from both experiments and simulations indicate that CH4 removal performance is strongly influenced by bar hole placement relative to the plume and spacing relative to the radius of influence, in addition to the applied vacuum pressure. To further evaluate these effects, three bar hole configurations were simulated for a leak in sandy loam soil at S w = 0.2 under a vacuum pressure of 0.9 atm (Cases 1–3, Table 2).
Case 1 consists of a single bar hole located directly above the leak, corresponding to the highest concentration region. Case 2 includes three bar holes spaced 1 m apart and symmetrically distributed across the plume, representing a spacing smaller than the radius of influence. Case 3 also uses three bar holes, but with 5 m spacing, representing a spacing greater than the radius of influence ( R I = 3.36 m for sandy loam). Simulated CH4 distributions are provided in Supplementary Materials (Figure S7).
Figure 10 compares residual CH4 mass across the three configurations. After 60 min of aeration, Case 1 achieves the highest removal (98%), followed closely by Case 2 (97%), while Case 3 achieves significantly lower removal (70%). Under these conditions, the initial plume length (~3 m) is smaller than the radius of influence, indicating that a single bar hole is sufficient to effectively capture the plume. As a result, additional bar holes provide limited benefits and may introduce airflow interference rather than improving removal.
In Case 2, the 1 m spacing places all bar holes within the plume and within the radius of influence, resulting in effective coverage. However, slight overlap of advective flow zones reduces overall efficiency relative to the single bar hole case. In contrast, Case 3 demonstrates that bar holes placed outside the plume and beyond the radius of influence are ineffective, leading to bypass of the contaminated region and a substantial reduction in CH4 removal.
These results highlight that optimal bar hole spacing depends on both plume size and radius of influence. CH4 removal is maximized when the radius of influence fully encompasses the plume and when bar holes are placed within the plume at appropriate spacing. Bar holes placed too close can reduce efficiency due to interference, while those placed too far apart or outside the plume fail to contribute to removal.

3.7. Study Limitations

Although this study provides new insights into how soil properties and aeration system design jointly control subsurface CH4 removal, several limitations should be acknowledged. The experimental results were obtained under controlled field-scale conditions and may not capture the full range of site heterogeneity, stratification, or complex release scenarios encountered in practice. For example, heterogeneous soils, layered deposits, or subsurface infrastructure may alter plume geometry and require site-specific bar hole placement strategies that were not evaluated herein.
Field experiments focused on relatively short aeration durations (≤60 min) representative of many NG leak-response operations. Consequently, longer-term gas redistribution, concentration rebound, and post-aeration plume evolution were not systematically investigated. Although rebound behavior was observed in several scenarios and is consistent with continued diffusive transport from less effectively aerated regions, the timing, magnitude, and controlling conditions of rebound were not quantitatively evaluated across the full simulation matrix. A comprehensive assessment of rebound would require extended post-aeration simulations and monitoring periods beyond the operational durations considered herein. Future work should investigate whether rebound potential can be predicted from soil properties, moisture conditions, vacuum pressure, and bar hole deployment and the possibility of incorporation into the aeration design.
Similarly, experimental observations and simulations indicate that CH4 removal occurs in two stages: an initial advection-dominated removal period, followed by a slower diffusion-controlled phase. While this study qualitatively identified the transition between these regimes, a quantitative characterization of the transition time as a function of soil properties, moisture conditions, vacuum pressure, and bar hole configuration was beyond the scope of the present work. Future research should evaluate whether this transition can be represented through characteristic timescales or dimensionless relationships and used as a design parameter for optimizing aeration duration and system configuration.
Moreover, the numerical simulations were performed using a two-dimensional representation of the monitored experimental cross-section. This approach was selected to evaluate first-order controls on CH4 removal and to maintain consistency with the available field measurements. While the model captures the dominant advective and diffusive transport processes governing aeration performance, it does not explicitly resolve three-dimensional plume geometry or site-specific heterogeneity.
Finally, the numerical model employs simplified representations of soil structure, permeability, and gas-phase connectivity. These assumptions are consistent with the study objective of identifying dominant controls on NG soil aeration performance and developing a computationally efficient framework for evaluating design alternatives. Despite these limitations, the combined experimental and modeling approach provides a mechanistic understanding of CH4 removal during NG soil aeration and establishes a foundation for incorporating soil conditions and transport processes into future aeration design and operation.

4. Conclusions

This study combined controlled field-scale experiments with numerical simulations to investigate how soil properties, moisture conditions, vacuum pressure (pressure drawdown), and bar hole deployment influence CH4 removal during NG soil aeration. Results consistently demonstrate that aeration performance is governed by coupled interactions between subsurface conditions and system design, with direct implications for field implementation.
Experimental observations and simulations showed that CH4 removal occurs in two distinct stages: an initial advection-dominated phase characterized by rapid gas removal near aeration bar holes, followed by a slower diffusion-controlled phase associated with methane stored in less accessible pore spaces and regions farther from the active aeration zone. More than 50% of the residual CH4 mass was removed within the first 10 min of aeration in permeable soils, while greater than 90% removal was achieved within 30 min under favorable conditions. Advective fluxes during the early stages of aeration were approximately one order of magnitude greater than diffusive fluxes, explaining the rapid initial reduction in CH4 concentrations. However, continued diffusive transport controlled the contraction of the residual plume and the persistence of low-concentration methane during later stages of aeration. Additionally, the observed transition from advection-dominated to diffusion-controlled CH4 removal suggests that a characteristic transition timescale may exist and could provide a useful basis for future optimization of aeration duration and system design.
Soil properties exert primary control on aeration effectiveness. High-permeability, low-moisture soils promoted greater gas mobility, larger bar hole radius of influence, and faster CH4 removal than lower-permeability soils. Sand and sandy loam exhibited similar removal behavior, whereas silty clay soils showed substantially slower CH4 removal and smaller treatment zones because of restricted gas transport. Increasing soil moisture reduced the radius of influence by approximately 5% between (Sw = 0.2) and (Sw = 0.4), demonstrating the influence of moisture on aeration coverage and treatment effectiveness.
Aeration system design is equally important. Increasing the number of bar holes generally improved plume coverage and CH4 removal; however, performance depended strongly on spacing relative to the radius of influence. In the field experiments, the five-bar hole configuration achieved complete removal of the measurable CH4 plume within approximately 30 min, whereas improperly spaced configurations exhibited slower removal and evidence of concentration rebound. These findings demonstrate that bar hole placement and spacing can be as important as the number of bar holes deployed.
Applied vacuum pressure influenced both CH4 removal rates and the radius of influence of individual bar holes. Increasing vacuum pressure from 0.1 to 0.9 atm improved residual CH4 removal by approximately 15 percentage points after 60 min of aeration, although the relationship was non-linear and exhibited diminishing returns at higher vacuum pressures. These results indicate that moderate-to-high vacuum pressures are generally sufficient to maximize removal performance without unnecessary increases in system intensity.
Collectively, the results demonstrate that successful NG soil aeration requires matching aeration system design to site-specific subsurface conditions. Rather than relying solely on generalized practices or overdesign, operators should consider soil permeability, moisture conditions, plume geometry, vacuum pressure, and bar hole deployment together when planning aeration activities. By quantifying the relationships among these factors, this study bridges the gap between subsurface gas transport processes and current NG soil aeration practice. The combined experimental and modeling framework provides a mechanistic basis for improving aeration design, reducing unnecessary operational effort, and supporting safer and more effective mitigation of subsurface natural gas releases.

Supplementary Materials

The following supporting information can be downloaded at https://www.mdpi.com/article/10.3390/pr14132202/s1, Figure S1: Comparison of simulated and experimental local CH4 removal efficiency (ReCCH4) for the six experimental scenarios. is estimated with a vacuum pressure of 0.3 atm (5 psi) and an average plume diameter of 2.6 m. The overall agreement between simulations and observations shows = 0.78. The black line represents a 1:1 line; Figure S2: Variation in simulated radius of influence (RI) for a single aeration bar hole (Case #1) evaluated at T = 60 min in sand for vacuum pressures of 0.1–0.9 atm and soil water saturations (Sw) of 0.2, 0.4, and 0.6; Figure S3: Simulated subsurface residual CH4 concentration variation in sand at Sw =0.2 for Cases #1 to #3 before (T = 0 min) and during (T = 30 and 60 min) soil aeration. The CH4 plume at T = 0 min (a, d, and g) indicates the initial distribution of CH4 before aeration. Green squares indicate the locations of aeration bar holes: a single bar hole in Case #1 (a to c), three bar holes spaced 1 m apart in Case #2 (d to f), and three bar holes spaced 5 m apart in Case #3 (g to i). All bar holes operate at a vacuum pressure of 0.9 atm relative to atmospheric pressure. The white dashed line marks the pipeline at 0.91 m depth. The red circle denotes the isolated leak point. The color bar represents CH4 concentration by volume (% v/v); Figure S4: Simulated subsurface residual CH4 concentration variation in sandy loam at Sw =0.2 for Cases #1 to #3 before (T = 0 min) and during (T = 30 and 60 min) soil aeration. The CH4 plume at T = 0 min (a, d, and g) indicates the initial distribution of CH4 before aeration. Green squares indicate the locations of aeration bar holes: a single bar hole in Case #1 (a to c), three bar holes spaced 1 m apart in Case #2 (d to f), and three bar holes spaced 5 m apart in Case #3 (g to i). All bar holes operate at a vacuum pressure of 0.9 atm relative to atmospheric pressure. The white dashed line marks the pipeline at 0.91 m depth. The red circle denotes the isolated leak point. The color bar represents CH4 concentration by volume (% v/v); Figure S5: Simulated subsurface residual CH4 concentration variation in silty clay at Sw =0.2 for Cases #1 to #3 before (T = 0 min) and during (T = 30 and 60 min) soil aeration. The CH4 plume at T = 0 min (a, d, and g) indicates the initial distribution of CH4 before aeration. Green squares indicate the locations of aeration bar holes: a single bar hole in Case #1 (a to c), three bar holes spaced 1 m apart in Case #2 (d to f), and three bar holes spaced 5 m apart in Case #3 (g to i). All bar holes operate at a vacuum pressure of 0.9 atm relative to atmospheric pressure. The white dashed line marks the pipeline at 0.91 m depth. The red circle denotes the isolated leak point. The color bar represents CH4 concentration by volume (% v/v); Figure S6: Simulated subsurface residual CH4 concentration variation when aerating with (a) 1 bar hole, (b) 3 bar holes, and (c) 5 bar holes placed 3.3 m apart with an applied pressure drawdown of 0.9 atm in a sandy loam soil at a soil water saturation of 0.2. Red arrows represent the direction of gas migration when vacuum is applied at the bar holes; Figure S7: Simulated subsurface residual CH4 concentration variation when aerating with (a) 1 bar hole, (b) 3 bar holes placed at 1 m spacing, and (c) 3 bar holes placed at 5 m spacing with an applied pressure drawdown of 0.9 atm in a sandy loam soil at a soil water saturation of 0.2. Red arrows represent the direction of gas migration when vacuum is applied at the bar holes; Figure S8: Simulated (a, b) horizontal and (c, d) vertical advective (Fadv) and diffusive (FDif) fluxes for Case #1 under sand conditions with a soil water saturation of 0.2. Fluxes are shown along a horizontal transect located 0.9 m below the ground surface during aeration at 30 minutes, with vacuum pressures ranging from 0 to 0.9 atm. These plots illustrate the relative contributions of advection and diffusion to CH4 transport under varying vacuum conditions; Table S1: Experimental scenarios conducted under different bar hole numbers, near-surface soil moisture saturations and aeration durations at a sandy loam testbed; Table S2: Variation in volumetric soil moisture content across depths during field experiments.; Table S3: Variation in soil moisture saturation across depths during field experiments; Table S4: Variation in soil temperature across depths during field experiments; Table S5: Statistical comparison of simulated and experimental aeration.

Author Contributions

J.-H.L.: Conceptualization, Formal Analysis, Investigation, Methodology, Writing—Original Draft, Writing—Review & Editing, Visualization; J.R.R.N.J.: Conceptualization, Investigation, Methodology, Writing—Original Draft, Writing—Review & Editing; D.J.Z.: Resources, Project Administration, Funding Acquisition; K.S.: Conceptualization, Funding Acquisition, Methodology, Project Administration, Resources, Supervision, Writing—Review & Editing. All authors have read and agreed to the published version of the manuscript.

Funding

This material is based upon work supported in part by the Northeast Gas Association (NYSEARCH) under Grant No. M2023-003 and the US Department of Transportation (DOT) Pipeline and Hazardous Materials Safety Administration (PHMSA) under Grant No. 693JK32010011POTA. Any opinions, findings, conclusions, or recommendations expressed herein are those of the authors and do not necessarily reflect the views of the funding agencies.

Data Availability Statement

The data presented in this study are openly available in Lo, Jui-Hsiang; Jayarathne, Navodi; Zimmerle, Daniel; Smits, Kathleen, 2026, “Replication Data for: Influence of Soil Properties and Soil Aeration Design on Subsurface Methane Removal”, https://doi.org/10.18738/T8/6NQJPI.

Acknowledgments

The authors would also like to thank Joseph Scalia, Fu-Wen Yang, Abhishek Dongol, Samuel Jacob, and Sergio Andrew Escudero Restrepo, for their expertise and assistance with field experiments at the METEC facility.

Conflicts of Interest

The authors declare no conflicts of interest.The authors declare that this study received funding from the Northeast Gas Association (NYSEARCH). The funder was not involved in the study design, collection, analysis, interpretation of data, the writing of this article or the decision to submit it for publication.

References

  1. Jayarathne, J.R.R.N.; Zimmerle, D.; Kolodziej, R.S.; Riddick, S.; Smits, K.M. Flow and Transport of Methane from Leaking Underground Pipelines: Effects of Soil Surface Conditions and Implications for Natural Gas Leak Classification. Environ. Sci. Technol. Lett. 2024, 11, 539–545. [Google Scholar] [CrossRef]
  2. PHMSA. Guidance Manual for Operators of Small Natural Gas Systems. January 2017. Available online: https://www.phmsa.dot.gov/sites/phmsa.dot.gov/files/docs/Small_Natural_Gas_Operator_Guide_%28January_2017%29.pdf (accessed on 10 May 2026).
  3. FOX 7 Austin. Georgetown Residents Dealing with Problems Following Evacuation. FOX 7 Austin. Austin, April 2019. Available online: https://www.fox7austin.com/news/georgetown-residents-dealing-with-problems-following-evacuation (accessed on 19 April 2019).
  4. Spectrum News. Georgetown Evacuation Order Lifted for 47 Structures Following Gas Leak. 2019. Available online: https://spectrumlocalnews.com/news/2019/04/09/georgetown-evacuation-order-lifted-for-47-structures-following-gas-leak (accessed on 8 March 2019).
  5. Six, E. Natural Gas Leak Detection & Odorant Monitoring; Ohio Gas Association: Columbus, OH, USA, 2014; Available online: https://www.ohiogasassoc.org/wp/wp-content/uploads/2014/06/OGA-Leak-Survey-2014-Part-1.pdf (accessed on 10 May 2026).
  6. Armstrong, J.E.; Frind, E.O.; McClellan, R.D. Nonequilibrium mass transfer between the vapor, aqueous, and solid phases in unsaturated soils during vapor extraction. Water Resour. Res. 1994, 30, 355–368. [Google Scholar] [CrossRef]
  7. Yoon, H.; Oostrom, M.; Wietsma, T.W.; Werth, C.J.; Valocchi, A.J. Numerical and experimental investigation of DNAPL removal mechanisms in a layered porous medium by means of soil vapor extraction. J. Contam. Hydrol. 2009, 109, 1–13. [Google Scholar] [CrossRef] [PubMed]
  8. Carroll, K.C.; Oostrom, M.; Truex, M.J.; Rohay, V.J.; Brusseau, M.L. Assessing performance and closure for soil vapor extraction: Integrating vapor discharge and impact to groundwater quality. J. Contam. Hydrol. 2012, 128, 71–82. [Google Scholar] [CrossRef] [PubMed]
  9. Hartge, K.-H.; Horn, R. Essential Soil Physics-An Introduction to Soil Processes, Functions, Structure and Mechanisms, 1st ed.; Schweizerbart Science Publishers: Stuttgart, Germany, 2016. [Google Scholar]
  10. Ball, B.C.; Dobbie, K.E.; Parker, J.P.; Smith, K.A. The influence of gas transport and porosity on methane oxidation in soils. J. Geophys. Res. Atmos. 1997, 102, 23301–23308. [Google Scholar] [CrossRef]
  11. Chamindu Deepagoda, T.K.K.; Chen Lopez, J.C.; Møldrup, P.; de Jonge, L.W.; Tuller, M. Integral parameters for characterizing water, energy, and aeration properties of soilless plant growth media. J. Hydrol. 2013, 502, 120–127. [Google Scholar] [CrossRef]
  12. Hamamoto, S.; Perera, M.S.A.; Resurreccion, A.; Kawamoto, K.; Hasegawa, S.; Komatsu, T.; Moldrup, P. The Solute Diffusion Coefficient in Variably Compacted, Unsaturated Volcanic Ash Soils. Vadose Zone J. 2009, 8, 942–952. [Google Scholar] [CrossRef]
  13. Iversen, B.V.; Moldrup, P.; Schjønning, P.; Loll, P. Air and water permeability in differently textured soils at two measurement scales. Soil Sci. 2001, 166, 643–659. [Google Scholar] [CrossRef]
  14. Currie, J.A. Gas diffusion through soil crumbs: The effects of wetting and swelling. J. Soil Sci. 1983, 34, 217–232. [Google Scholar] [CrossRef]
  15. Okamoto, H.; Gomi, Y. Empirical research on diffusion behavior of leaked gas in the ground. J. Loss Prev. Process Ind. 2011, 24, 531–540. [Google Scholar] [CrossRef]
  16. Chamindu Deepagoda, T.K.K.; Smits, K.M.; Oldenburg, C.M. Effect of subsurface soil moisture variability and atmospheric conditions on methane gas migration in shallow subsurface. Int. J. Greenh. Gas Control 2016, 55, 105–117. [Google Scholar] [CrossRef]
  17. Gao, B.; Mitton, M.K.; Bell, C.; Zimmerle, D.; Deepagoda, T.C.; Hecobian, A.; Smits, K.M. Study of methane migration in the shallow subsurface from a gas pipe leak. Elem. Sci. Anthr. 2021, 9, 00008. [Google Scholar] [CrossRef]
  18. Digiulio, D.C. Evaluation of soil venting application. J. Hazard. Mater. 1992, 32, 279–291. [Google Scholar] [CrossRef]
  19. Fischer, U.; Hinz, C.; Schulin, R.; Stauffer, F. Assessment of nonequilibrium in gas-water mass transfer during advective gas-phase transport in soils. J. Contam. Hydrol. 1998, 33, 133–148. [Google Scholar] [CrossRef]
  20. Suthersan, S.S.; Horst, J.; Schnobrich, M.; Welty, N.; McDonough, J. Remediation Engineering: Design Concepts; CRC Press: Boca Raton, FL, USA, 1999. [Google Scholar]
  21. USEPA. Soil Vapor Extraction (SVE) Enhamcement Technology Resource Guide; USEPA: Washington, DC, USA, 1995. Available online: https://nepis.epa.gov/Exe/ZyNET.exe/10002PBQ.TXT?ZyActionD=ZyDocument&Client=EPA&Index=1995+Thru+1999&Docs=&Query=&Time=&EndTime=&SearchMethod=1&TocRestrict=n&Toc=&TocEntry=&QField=&QFieldYear=&QFieldMonth=&QFieldDay=&IntQFieldOp=0&ExtQFieldOp=0&XmlQuery=&File=D%3A%5Czyfiles%5CIndex%20Data%5C95thru99%5CTxt%5C00000000%5C10002PBQ.txt&User=ANONYMOUS&Password=anonymous&SortMethod=h%7C-&MaximumDocuments=1&FuzzyDegree=0&ImageQuality=r75g8/r75g8/x150y150g16/i425&Display=hpfr&DefSeekPage=x&SearchBack=ZyActionL&Back=ZyActionS&BackDesc=Results%20page&MaximumPages=1&ZyEntry=1&SeekPage=x&ZyPURL (accessed on 10 May 2026).
  22. USACE. Soil Vapor Extraction and Bioventing DEPARTMENT OF THE ARMY: Washington, DC 20314-1000. 3 June 2002. Available online: https://www.publications.usace.army.mil/Portals/76/Publications/EngineerManuals/EM_1110-1-4001.pdf (accessed on 3 June 2022).
  23. Barnes, D.L.; Asce, M. Estimation of Operation Time for Soil Vapor Extraction Systems. J. Environ. Eng. 2003, 129, 873–878. [Google Scholar] [CrossRef]
  24. Barnes, D.L.; White, T.C. Application of a simple decision model for soil vapor extraction system operation. Ground Water Monit. Remediat. 2006, 26, 107–114. [Google Scholar] [CrossRef]
  25. Harper, B.M.; Stiver, W.H.; Zytner, R.G. Nonequilibrium Nonaqueous Phase Liquid Mass Transfer Model for Soil Vapor Extraction Systems. J. Environ. Eng. 2003, 129, 745–754. [Google Scholar] [CrossRef]
  26. Nguyen, V.T.; Zhao, L.; Zytner, R.G. Three-dimensional numerical model for soil vapor extraction. J. Contam. Hydrol. 2013, 147, 82–95. [Google Scholar] [CrossRef] [PubMed]
  27. Scientific Software Group. SVE-3D Modelling. Available online: http://www.scientificsoftwaregroup.com (accessed on 3 July 2025).
  28. Jayarathne, J.R.R.N.; Smits, K.M.; Riddick, S.; Zimmerle, D.J.; Cho, Y.; Schwartz, M.; Cheptonui, F.; Campbell, K.; Ronney, P. Understanding Mid-to Large Underground Leaks from Buried Pipelines as Affected by Soil and Atmospheric Conditions-Field Scale Experimental Study. In Proceedings of the Pipeline Research Council International (PRCI) REX2022 Meeting, Orlando, FL, USA, 8–10 March 2022. [Google Scholar]
  29. Ulrich, B.A.; Mitton, M.; Lachenmeyer, E.; Hecobian, A.; Zimmerle, D.; Smits, K.M. Natural gas emissions from underground pipelines and implications for leak detection. Environ. Sci. Technol. Lett. 2019, 6, 401–406. [Google Scholar] [CrossRef]
  30. Jayarathne, J.R.R.N.; Kolodziej, R.S.; Riddick, S.N.; Zimmerle, D.J.; Smits, K.M. Influence of soil-gas diffusivity on expansion of leaked underground natural gas plumes and application on simulation efforts. J. Hydrol. 2023, 625, 130049. [Google Scholar] [CrossRef]
  31. van Genuchten, M.T. A Closed-form Equation for Predicting the Hydraulic Conductivity of Unsaturated Soils. Soil Sci. Soc. Am. J. 1980, 44, 892–898. [Google Scholar] [CrossRef]
  32. Millington, R.J.; Quirk, J.P. Permeability of porous solids. Trans. Faraday Soc. 1961, 57, 1200–1207. [Google Scholar] [CrossRef]
  33. Bear, J. Dynamics of Fluids in Porous Media; American Elsevier Publishing Company, Inc.: New York, NY, USA, 1972. [Google Scholar]
  34. Terzaghi, K.; Peck, R.B.; Mesri, G. Soil Mechanics in Engineering Practice, 3rd ed.; John Wiley & Sons: Hoboken, NJ, USA, 1996; Available online: https://books.google.com/books/about/Soil_Mechanics_in_Engineering_Practice.html?id=bAwVvO71FXoC (accessed on 10 May 2026).
  35. Clapp, R.B.; Hornberger, G.M. Empirical Equations for Some Soil Hydraulic Properties. Water Resour. Res. 1978, 14, 601–604. [Google Scholar] [CrossRef]
  36. Johnson, P.C.; Stanley, C.C.; Kemblowski, M.W.; Byers, D.L.; Colthart, J.D. A Practical Approach to the Design, Operation, and Monitoring of In Situ Soil-Venting Systems. Ground Water Monit. Rev. 1990, 10, 159–178. [Google Scholar] [CrossRef]
  37. Kuo, J. Practical Design Calculations for Groundwater and Soil Remediation, 2nd ed.; CRC Press: Boca Raton, FL, USA; Taylor & Francis Group: Abingdon, UK, 2014. [Google Scholar]
  38. Brusseau, M.L.; Mainhagu, J.; Morrison, C.; Carroll, K.C. The vapor-phase multi-stage CMD test for characterizing contaminant mass discharge associated with VOC sources in the vadose zone: Application to three sites in different lifecycle stages of SVE operations. J. Contam. Hydrol. 2015, 179, 55–64. [Google Scholar] [CrossRef] [PubMed]
  39. Høier, C.K.; Sonnenborg, T.O.; Jensen, K.H.; Gudbjerg, J. Model analysis of mechanisms controlling pneumatic soil vapor extraction. J. Contam. Hydrol. 2009, 103, 82–98. [Google Scholar] [CrossRef] [PubMed]
  40. Moldrup, P.; Olesen, T.; Komatsu, T.; Schjønning, P.; Rolston, D.E. Tortuosity, Diffusivity, and Permeability in the Soil Liquid and Gaseous Phases. Soil Sci. Soc. Am. J. 2001, 65, 613–623. [Google Scholar] [CrossRef]
  41. Sihota, N.J.; Mayer, K.U.; Toso, M.A.; Atwater, J.F. Methane emissions and contaminant degradation rates at sites affected by accidental releases of denatured fuel-grade ethanol. J. Contam. Hydrol. 2013, 151, 1–15. [Google Scholar] [CrossRef] [PubMed]
Figure 1. Schematic of the testbed vertical profile with the soil aeration and sensor systems in place. Each aeration bar hole is 0.9 m deep, with a diameter of 5 cm, and installed at an average spacing of 1.5 m.
Processes 14 02202 g001
Figure 2. Two-dimensional conceptual model of soil aeration. The white rectangles represent aeration bar holes. J w and J g indicate water and gas flux, respectively. No-flux boundary conditions are applied on all outer sides ( J g = J w = 0 ). The bar hole boundary condition for the gas phase was defined to represent aeration induced by vacuum pressure ( P b ) using the manufacturer’s purger specifications. Internal flow within the bar hole was not simulated. Each bar hole is 5 cm in diameter and 0.9 m deep ( D b ). The dashed line indicates the NG pipeline, and the red circle illustrates an isolated leak point. P g describes the gas pressure, while P a t m is atmospheric pressure. Three bar holes are shown here for illustration. The actual number varies across simulation cases.
Processes 14 02202 g002
Figure 3. Subsurface methane concentration distributions during soil aeration experiments for different bar hole configurations. Panels (ac) show results for a single bar hole, (df) for three bar holes, and (gi) for five bar holes spaced 1.5 m apart symmetrically about the leak. Within each configuration, methane concentrations are shown (a,d,g) prior to aeration, (b,e,h) after 30 min of aeration, and (c,f,i) after 60 min of aeration. Measured concentrations for the five bar hole scenario were scaled during 2D plotting to account for measurement variability. The white dashed line represents the pipeline buried at 0.9 m depth.
Processes 14 02202 g003
Figure 4. Simulated advective (a,c,e) and diffusive (b,d,f) CH4 fluxes during aeration under a vacuum pressure of 0.9 atm. Panels (a,b), (c,d), and (e,f) correspond to configurations with 1, 3, and 5 bar holes, respectively. Note that the y-axis scales differ between advective and diffusive fluxes.
Processes 14 02202 g004
Figure 5. Simulated variation in (a) normalized residual CH4 mass and (b) radius of influence for different soil types (sand, sandy loam, and silty clay). Simulations were conducted at a soil moisture saturation of 0.2 using a single bar hole with a vacuum pressure of 0.9 atm.
Processes 14 02202 g005
Figure 6. Simulated variation in (a) normalized residual CH4 mass and (b) radius of influence for different soil moisture saturations (Sw = 0.2, 0.4, and 0.6). Simulations were conducted for sandy loam soil using a single bar hole with a vacuum pressure of 0.9 atm.
Processes 14 02202 g006
Figure 7. Simulated variation in (a) normalized residual CH4 mass over time and (b) radius of influence (ROI) under various vacuum pressures for a single bar hole in sandy loam at a soil moisture saturation of 0.2.
Processes 14 02202 g007
Figure 8. Variation in measured normalized residual CH4 mass over time under varying bar hole numbers in sandy loam at soil moisture saturation of 0.2 and applied vacuum pressure of 0.4 atm. Here, BH in the legend stands for Bar hole.
Processes 14 02202 g008
Figure 9. Simulated normalized residual CH4 mass over time for different bar hole configurations in sandy loam at a soil moisture saturation of 0.2 and a vacuum pressure of 0.9 atm. Here, BH in the legend stands for bar hole.
Processes 14 02202 g009
Figure 10. Simulated normalized residual CH4 mass over time under various bar hole number–spacing combinations in sandy loam at a soil moisture saturation of 0.2.
Processes 14 02202 g010
Table 1. Experimental scenarios with different bar hole numbers and aeration durations conducted at a sandy loam testbed under an average surface soil moisture saturation of 0.8 and a leak rate of 10 slpm.
Experimental ScenarioNumber of
Aeration Bar Holes
Aeration Duration
(Hours)
112
231.3
351
Table 2. Physical and hydraulic properties used in numerical simulations for sand, sandy loam, and silty clay, including porosity ( ϕ ), residual soil moisture saturation ( S r ), van Genuchten parameters, and soil permeability ( k ) .
Porosity   ϕ   (cm3 cm−3)Residual Moisture Saturation S r (cm3 cm−3)Intrinsic Permeability k (m2)van Genuchten Parameters
α (cm−1) n
Sand 10.400.0341.80 × 10−110.032.383
Sandy Loam 20.440.0383.53 × 10−120.021.482
Silty clay 10.480.0533.82 × 10−1400131.228
1 sand and silty clay from Gao et al. [17]; 2 sandy loam from Clapp & Hornberger [35] and Gao et al. [17]. Soil aeration was not done for clay because it is not recommended for soils with intrinsic permeability less than 10−15 m2 [21].
Table 3. Summary of bar hole configurations used in simulations. Case #1 includes a single bar hole positioned directly above the leak. Cases #2 and #3 include two additional bar holes, symmetrically placed around the central bar hole at 1 m and 5 m spacing, respectively, to evaluate the effects of bar hole number and spacing on CH4 removal efficiency.
Case #Number of Bar Holes Spacing Between Bar Holes (m)
110
231
335
Disclaimer/Publisher’s Note: The statements, opinions and data contained in all publications are solely those of the individual author(s) and contributor(s) and not of MDPI and/or the editor(s). MDPI and/or the editor(s) disclaim responsibility for any injury to people or property resulting from any ideas, methods, instructions or products referred to in the content.