Article

Study of Sulfur Deposition Pattern of High-Sulfur Natural Gas Under Aqueous Conditions

1
Exploration and Development Research Institute of PetroChina Southwest Oil and Gas Field Company, Chengdu 610213, China
2
National Energy R&D Center of High Sulfur Gas Exploitation, Chengdu 610051, China
3
State Key Laboratory of Oil and Gas Reservoir Geology and Exploitation, Southwest Petroleum University, Chengdu 610500, China
*
Author to whom correspondence should be addressed.
Processes 2026, 14(13), 2195; https://doi.org/10.3390/pr14132195
Submission received: 13 May 2026 / Revised: 25 June 2026 / Accepted: 29 June 2026 / Published: 6 July 2026
(This article belongs to the Section Petroleum and Low-Carbon Energy Process Engineering)

Abstract

China is rich in high-sulfur natural gas resources. During reservoir development, reservoir temperature and pressure reduction induces the precipitation of elemental sulfur. Subsurface sulfur deposition seriously affects the recovery and the stable production of high-sulfur gas reservoirs. This study utilized multiple experimental techniques, including CT scanning, scanning electron microscopy, energy spectrum analysis, and nuclear magnetic resonance. The experiments were conducted under different water saturation levels and pressure differences. The results showed that the permeability of the rock samples decreased after sulfur deposition. The permeability reduction varied from 0.004 mD to 8.852 mD, with a relative change of 10.2% to 29.8%. Meanwhile, sample porosity also declined, and the porosity damage ranged from 1.5% to 11.9%. Scanning electron microscopy showed that sulfur presented a membrane adsorption morphology on the surface of skeleton particles, with spherical particles protruding from the membrane. Rock samples with poorer physical properties showed lamellar superposition sulfur deposition. Sulfur deposition damage became more severe with increasing pressure difference and weakened as water saturation increased. Beyond a water saturation of 40.6%, further increases no longer reduce sulfur deposition damage.

1. Introduction

The geological reserves of high-sulfur gas reservoirs are abundant, and more than 400 high-sulfur gas fields have been discovered around the world, mainly in China, North America, Europe and the Middle East. The geological reserves of high-sulfur gas in China are more than 1 × 10¹² m3, and typical high-sulfur gas fields include Puguang gas field, Luojiazhai gas field, Yuanba gas field, etc. [1,2,3,4]. However, elemental sulfur is precipitated from high-sulfur natural gas when the temperature and pressure drop [5]. When gas flow is insufficient to transport precipitated sulfur out of the formation and gathering pipelines, elemental sulfur gradually accumulates. It seriously reduces reservoir flow capacity or causes blockage in the wellbore and surface pipelines [6,7,8,9,10,11].
In order to investigate the mechanism of sulfur deposition, many researchers conducted core expulsion experiments. Most of their experimental results showed the precipitation and deposition of sulfur in highly sulfurous gases were correlated with the temperature, pressure, flow rate, and content of components [12,13,14,15,16,17]. Li et al. [18] selected three types of natural cores with typical carbonate pore structures for high temperature and high-pressure core drive experiments. The results showed that liquid sulfur was adsorbed and deposited in different types of pore spaces in the form of flocculent, spider web or reticulation, leading to different changes in the pore structure and physical properties of the reservoir. Huang et al. [19] used a multiphase tube flow experimental setup to investigate the migration behavior and critical sulfur loading velocity under the influence of various factors, such as wellbore inclination angle (30–90°), particle size (74–240 μm) and gas flow rate (30–160 m3/h). The results showed that the critical sulfur loading velocity decreased with the increase of mass flow rate of sulfur particles and increased with the increase of particle diameter, and the critical sulfur loading velocity increases and then decreased with the increase of wellbore inclination angle. Shedid et al. [20] investigated about the damage caused by elemental sulfur deposition to reservoirs through carbonate reservoir experiments and found that sulfur deposition caused greater damage to low-permeability reservoirs.
It is not enough to reveal the mechanism of sulfur deposition by experiments alone [21]. Therefore, many researchers chose to build numerical models to explain the mechanism of sulfur deposition theoretically [22,23,24,25]. Mahmoud et al. [26] developed a new analytical model to predict the effect of sulfur deposition on damage in the near-wellbore region, and their results showed that sulfur deposition was affected by radial distance from the wellbore and that sulfur solubility varied with decreasing pressure. Guo et al. [27] developed an improved sulfur saturation prediction model, which was based on non-Darcy flow and took into account the effects of reservoir compaction, changes in gas properties, and the dependence of sulfur solubility on pressure. Similarly, Hu et al. [28] developed a new numerical model based on the Roberts model, which was used to study the effect of sulfur deposition on permeability, porosity, and production performance. Hu et al. [29] developed a damage model for carbonate sour gas reservoirs in the presence of natural fractures in order to obtain prediction and management of sulfur deposition, and the results showed that the greater the production rate, the faster the pressure dropped and the faster the sulfur precipitated. Xu et al. [30] proposed a sulfur particle release model considering the critical release velocity and release rate, and applied it to actual gas wells with sulfur deposition. The results showed that the model correctly reflected the flow transport during sulfur deposition in porous media [31,32].
In summary, both experimental and numerical model predictions showed that the faster the pressure fell the faster the sulfur was deposited, and the more the solid- or liquid-phase sulfur caused greater damage to reservoirs with poorer physical properties. However, the above studies generally ignored how elemental sulfur precipitated and deposited under aqueous conditions. In this study, we designed a core water construction system to analyze the damage and distribution characteristics of sulfur deposition in reservoirs under aqueous conditions by combining experiments such as rock physical properties analysis, 3D CT scanning, nuclear magnetic resonance (NMR), scanning electron microscopy (SEM), and energy spectral analysis.

2. Materials and Methods

2.1. Experimental Materials

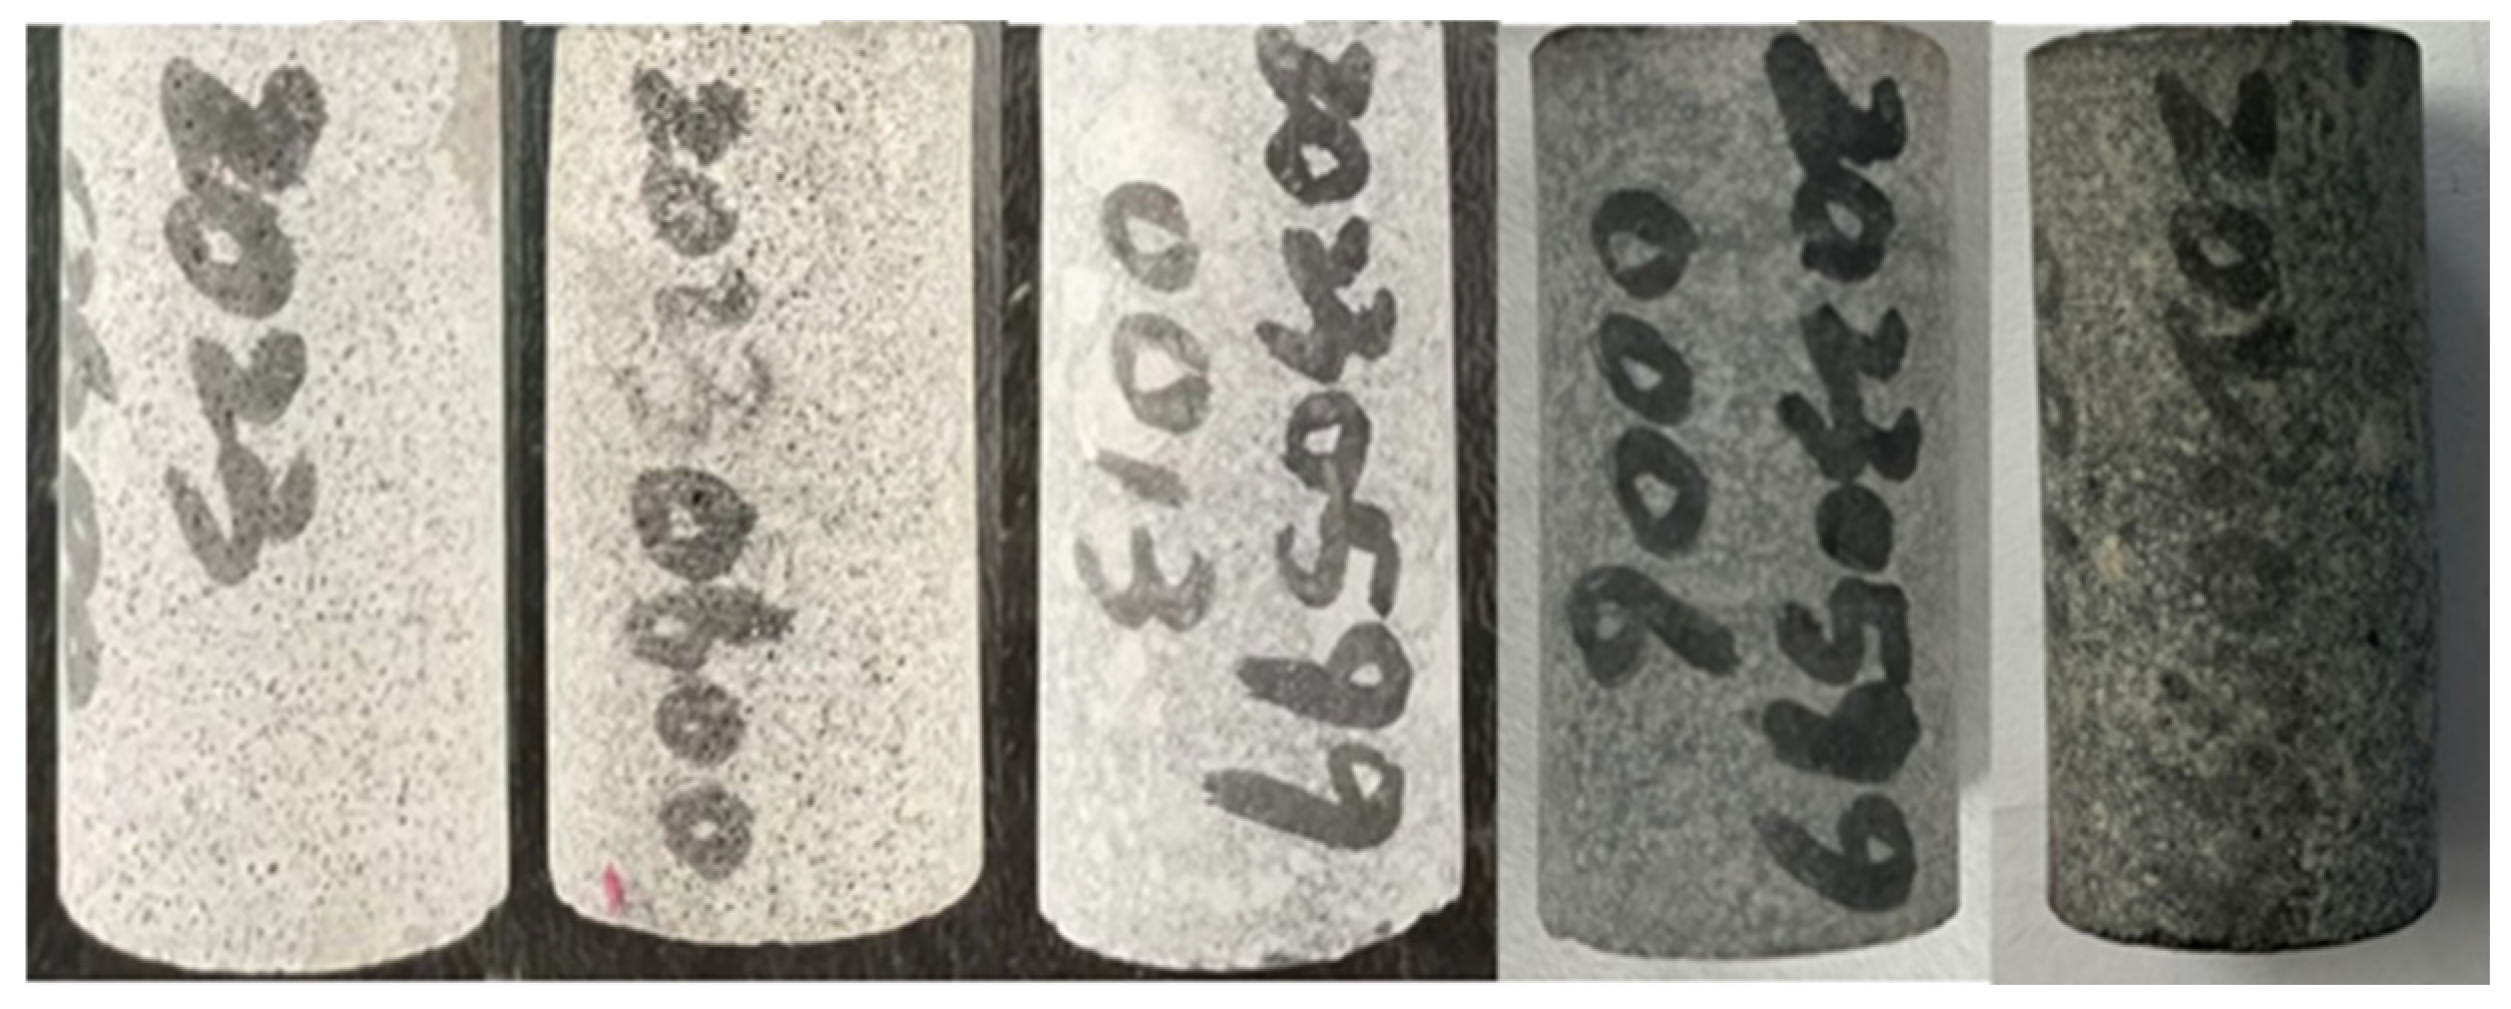
Core samples were obtained from a high-sulfur gas reservoir. (As shown in Figure 1), and the lithology is carbonate rock) [33,34]. The physical parameters of the core samples were measured prior to the sulfur deposition experiments, and the specific data are shown in Table 1. The gas used in the sulfur deposition experiment was high-sulfur gas from high-sulfur gas well P2; the main gas components are shown in Table 2, and the gas used in the control group was nitrogen, analytically pure, 99.999%. The experimental temperature was 97.8 °C, which corresponds to the actual formation temperature.

2.2. Experimental Device and Procedure

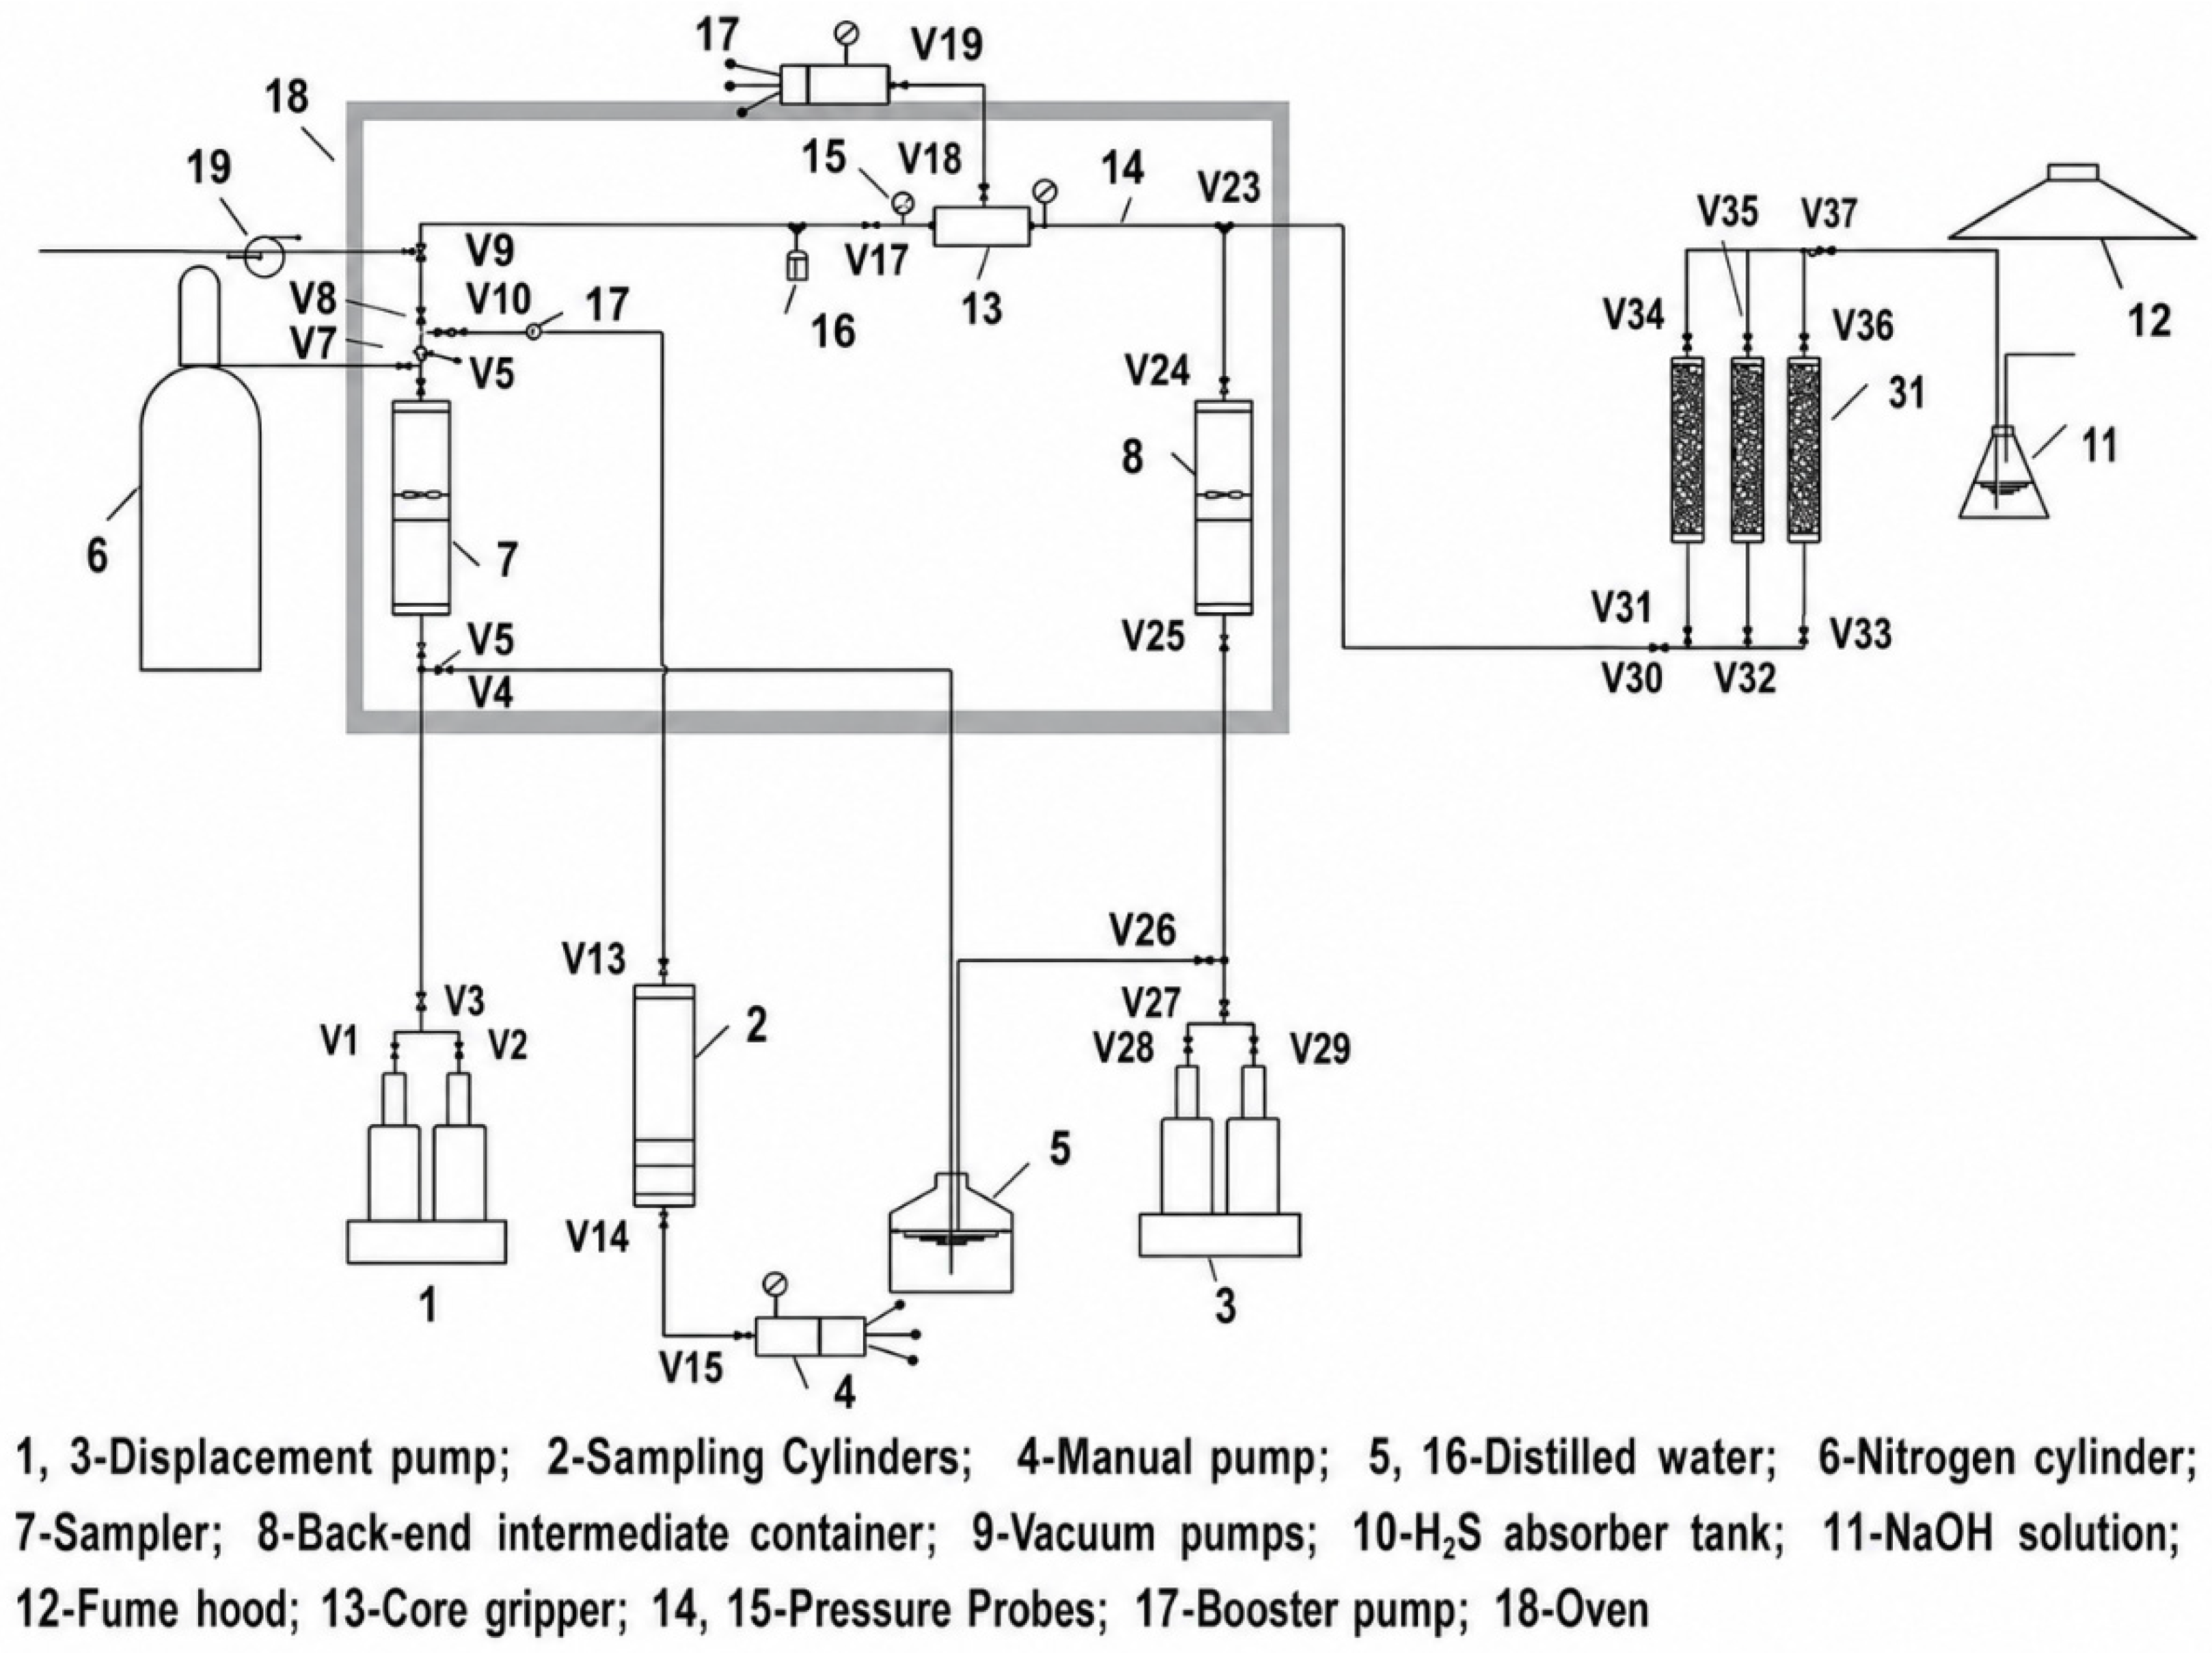
Sulfur deposition experimental device mainly consists of a core water system, rotating sample balance system, differential pressure control system, exhaust gas treatment system and other components (as shown in Figure 2).
The specific steps of the sulfur deposition experiment under aqueous conditions are as follows: (1) The selected rock samples were put into an intermediate container and evacuated to 133 Pa, saturated with distilled water at 20 MPa for more than 48 h to ensure that the rock samples were completely saturated with water, and the nuclear magnetic resonance (NMR) T2 spectral curves of the completely saturated water of the rock samples were determined before the sulfur deposition experiments; (2) Nitrogen was used to replace the fully saturated water samples, to establish different water saturation of the samples, and to determine the NMR T2 spectral curves of the samples under different water saturation. Rock samples were then dried; (3) High-pressure nitrogen was introduced into the apparatus and, after determining that the setup is gas-tight, slowly release the nitrogen through the fume hood; (4) Rock samples were placed into the core holder and set the enclosing pressure according to the experimental requirements, and pump the pipeline and the experimental device to the vacuum state; (5) The high-sulfur gas is introduced into the sampler at constant pressure, and the residual gas in the transfer line is absorbed through a lye solution before being released through the fume hood; (6) Set the pressure of the front-end displacement pump and the rear-end displacement pump, respectively, and keep the two displacement pumps at constant pressure, open the valve and start the sulfur deposition experiment; (7) At the end of the experiment, the high-sulfur gas was slowly vented. The rock samples were dried, and porosity, permeability, fully saturated water NMR T2 spectral curves, CT scans, and energy spectrum tests were determined after the experiment.
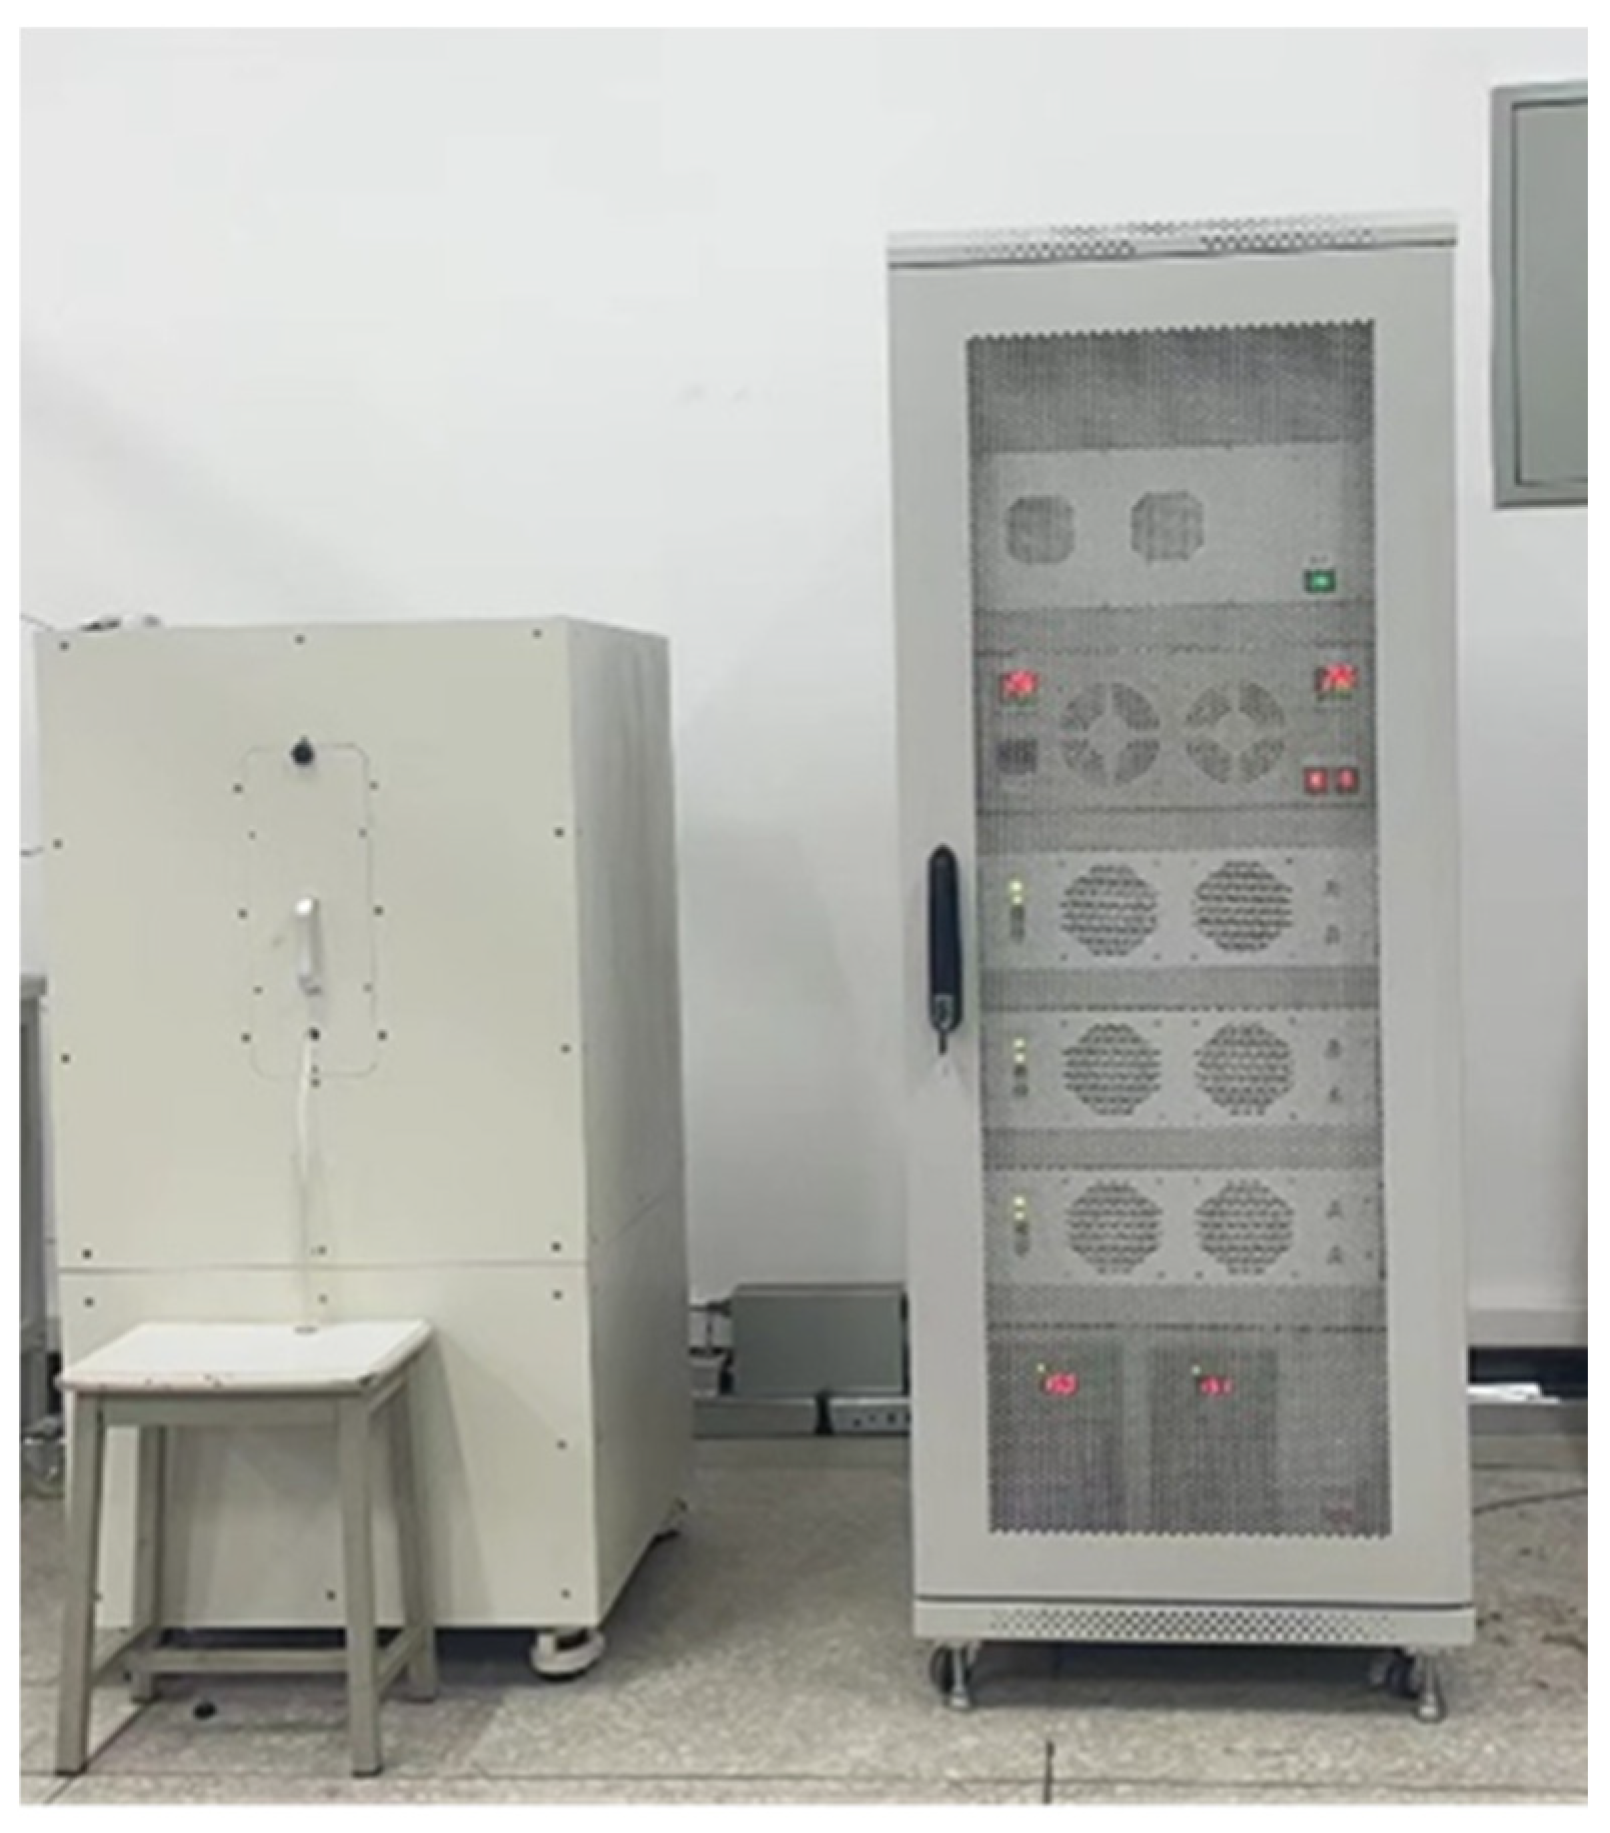
For steps (1) and (7), the nuclear magnetic resonance (NMR) experimental instrument used is the SPEC-NMR12 core analyzer (as show in Figure 3). This device operates at a magnetic field frequency of 12 MHz and a magnetic field strength of 0.5 T.
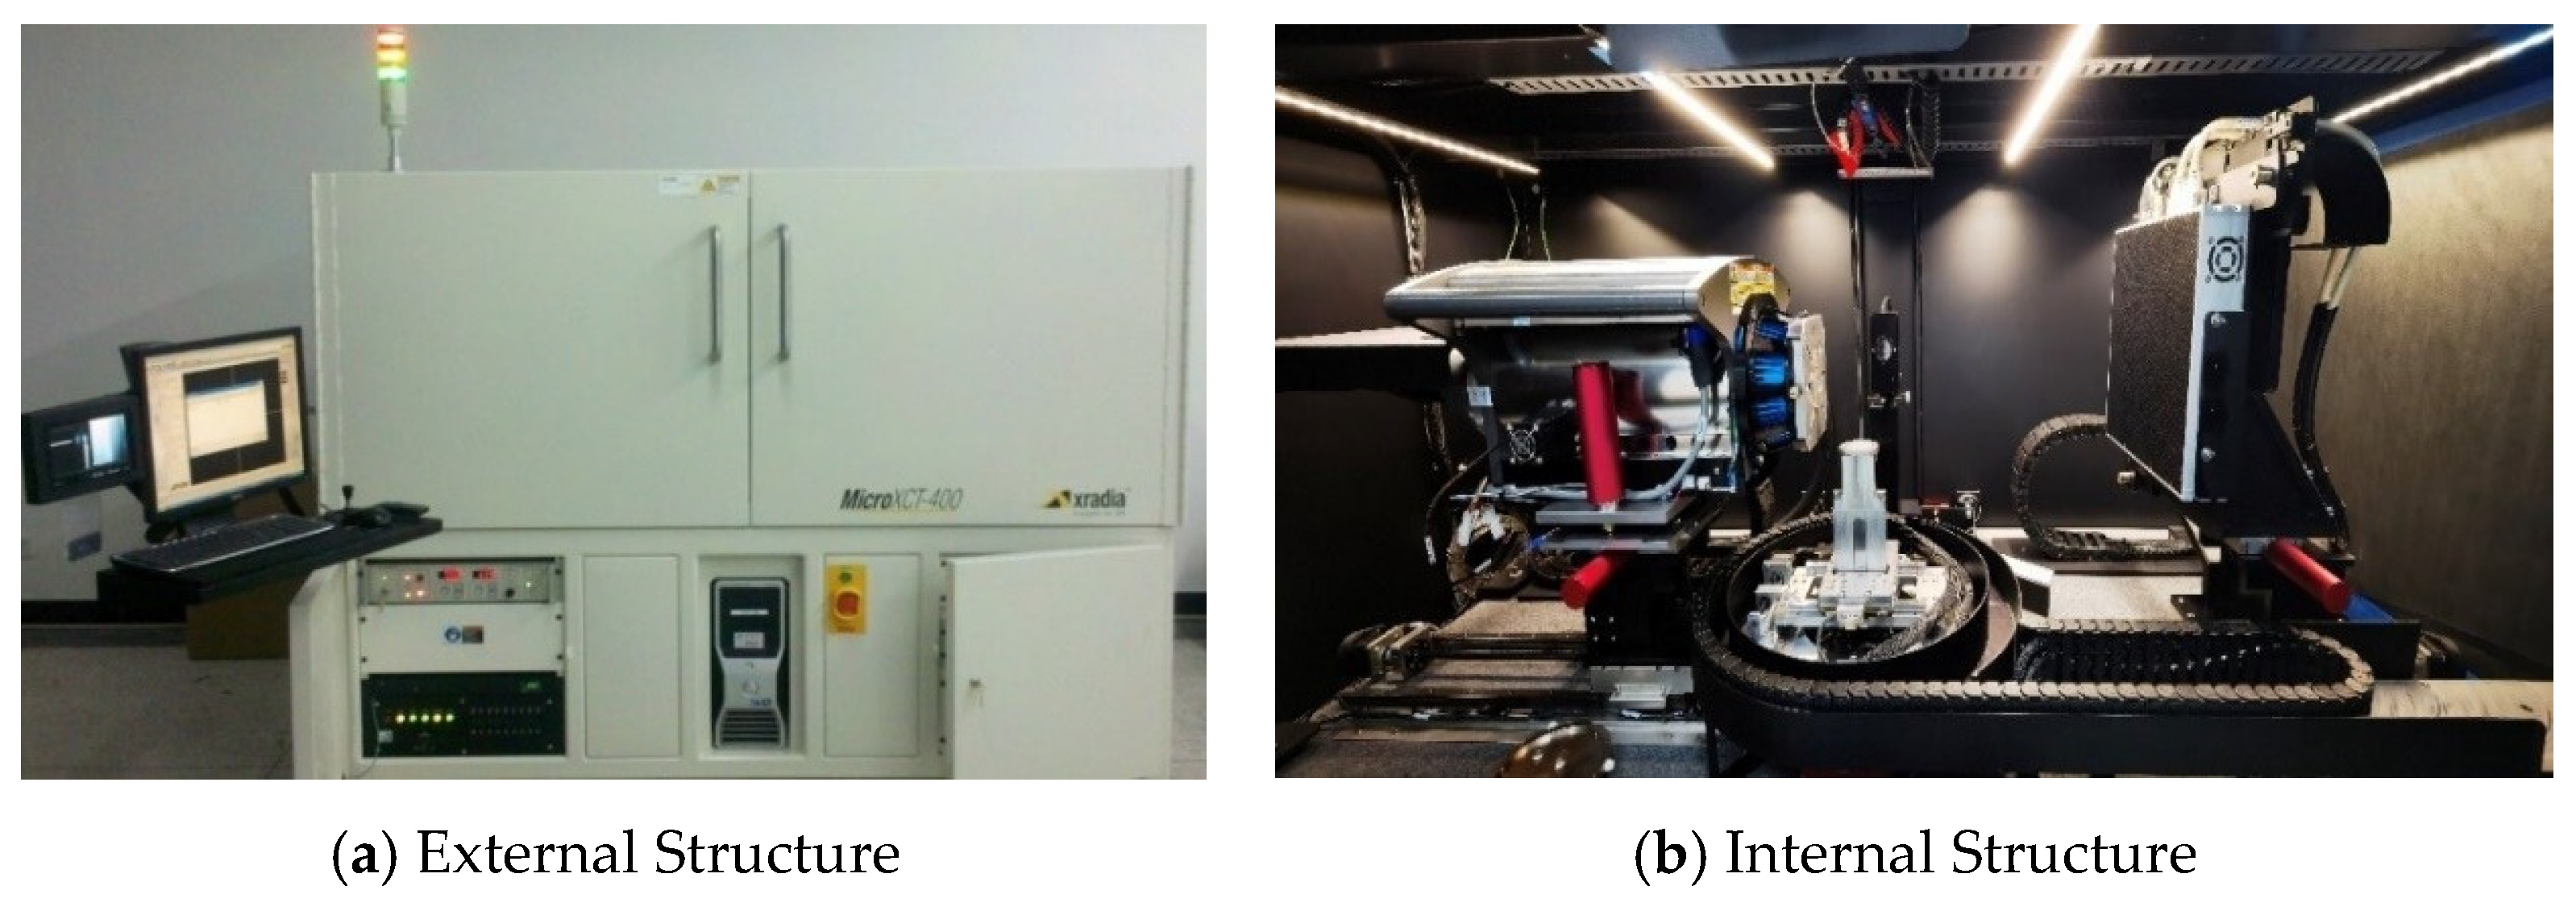
The experimental apparatus used for CT scanning experiments is the MicroXCT-400 CT scanner (Carl Zeiss X-ray Microscopy, Pleasanton, California, USA, as shown in Figure 4). The X-ray source voltage and power were set to 100 kV and 8 W, respectively. Low-magnification lenses were employed to capture images of the sample and background, thereby determining the required scanning voltage and current intensity. Based on the desired image resolution, the magnification of the high-magnification detection lens and the number of images to be captured were selected.
Scanning electron microscopy (SEM) is an imaging technique that generates images by utilizing signals produced from the interaction of an electron beam with rock samples, enabling direct observation of the microstructure of reservoir rock specimens at various magnifications. An energy-dispersive spectrometer collects particles that emit characteristic energy signals from elements on the rock sample surface, thereby determining the sample’s elemental composition.
Energy-dispersive spectroscopy (EDS) analysis and scanning electron microscopy (SEM) experiments were conducted on rock cores #1, #2, #6, #11, #15, #22, and #29. The experiment primarily involves the following steps: (1) Prepare square samples with a diameter of 1 cm, selecting a non-polished, flat natural fracture surface as the observation area; (2) Secure the sample onto a microscope slide and remove debris or impurities from the observation surface, then place the sample into the gold-sputtering chamber in sequence and evacuate the chamber; (3) Select appropriate voltage and sputtering duration to complete the gold-coating process; (4) Place the coated samples sequentially into the scanning chamber and evacuate the chamber. After adjusting the focus, observe the samples at different magnifications and use energy-dispersive spectroscopy (EDS) to analyze the elemental composition on the sample surface.

2.3. Experimental Program

In order to study the effect of water saturation and pressure difference on sulfur deposition, sulfur deposition damage experiments were carried out under different water saturation and pressure difference, in which the #1, #6, #11, and #15 rock samples were used to carry out experimental research on the factors affecting sulfur deposition damage under different water saturation, with the inlet pressure of the rock core being 16.9 MPa, the outlet pressure being 15.4 MPa, and the pressure difference between the rock core inlet and outlet being 1.5 MPa. The specific experimental parameters are shown in Table 3. Rock samples #2, #22, #29, and #6 were used to investigate the factors influencing sulfur deposition damage under varying pressure differentials. The inlet pressure was uniformly set at 15.9 MPa, while the pressure differentials across the cores were 1.5 MPa, 2.0 MPa, 2.5 MPa, and 3.0 MPa, respectively. The experimental parameters are detailed in Table 4. In order to study the effect of saturated water and surrounding pressure, etc., on core damage during the experimental process of water building and sulfur depositional damage, two experimental control groups were designed, and the rock samples of the experimental control group were numbered as #10 and #19 rock samples. Their experimental parameters are shown in Table 5.

3. Experimental Results and Discussion

3.1. Characterization of Rock Porosity and Permeability

After the sulfur deposition damage experiment, the permeability of rock samples decreased by 0.004 to 8.852 mD, with an average reduction of 1.954 mD. The range of permeability variation was 10.2% to 29.5%. This indicates that sulfur deposition has caused varying degrees of damage to the permeability of rock samples (as shown in Table 6). The results indicate that the poorer the physical properties (density, porosity, electrical conductivity, and magnetic properties) of the core samples, the greater the reduction in their permeability due to sulfur deposition. A possible reason is that sulfur has clogged the pores or throats in solid form, causing severe damage to permeability within a short period of time [35]. However, some researchers contend that liquid-phase sulfur has little impact on reservoirs with favorable physical properties [36]. Consequently, the effects of sulfur deposition on reservoir properties and gas well production are complex, depending on the state, flow, and distribution patterns of elemental sulfur within the reservoir.
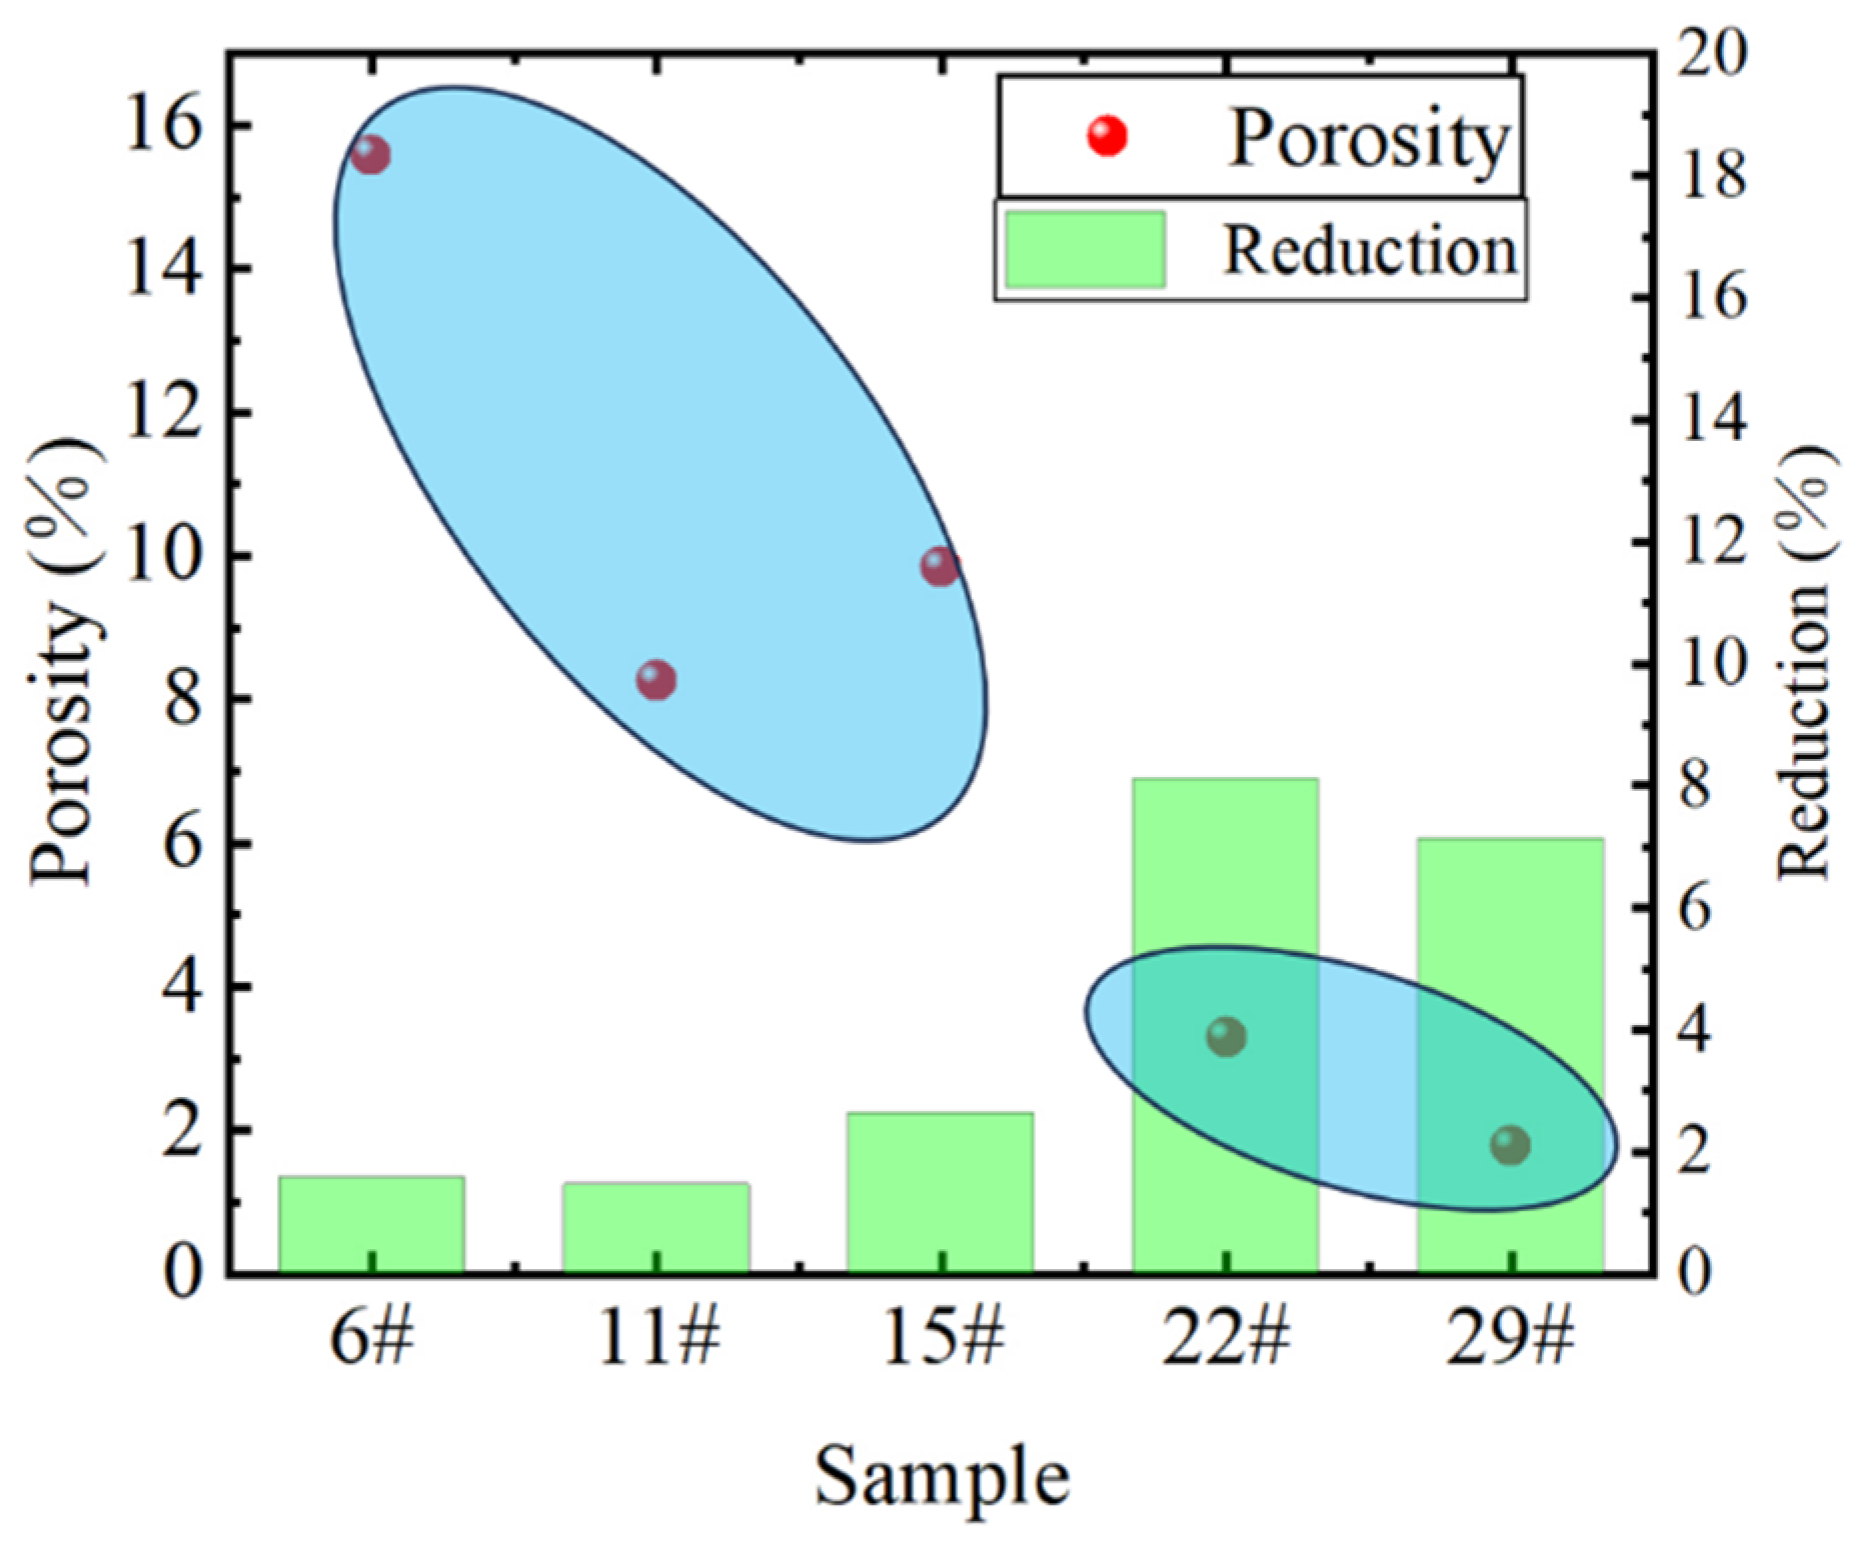
After the sulfur deposition experiments, the porosity of the rock samples decreased, and the range of porosity damage was between 1.5 and 11.9%. This data clearly indicates that sulfur deposition has caused a non-negligible impact on the core pore structure (as shown in Table 7). Further analysis revealed that there was a clear correlation between the initial porosity of the rock samples and their degree of porosity damage (as shown in Figure 5). The lower the initial porosity of the rock samples, the higher the degree of damage to their porosity after sulfur deposition, which indicates that the low porosity rock samples are more sensitive to the effect of sulfur deposition [37]. Before and after the experiments in the control group, the permeability and porosity of the rock samples were basically unchanged.

3.2. Characterization of Rock Pore Size Distribution

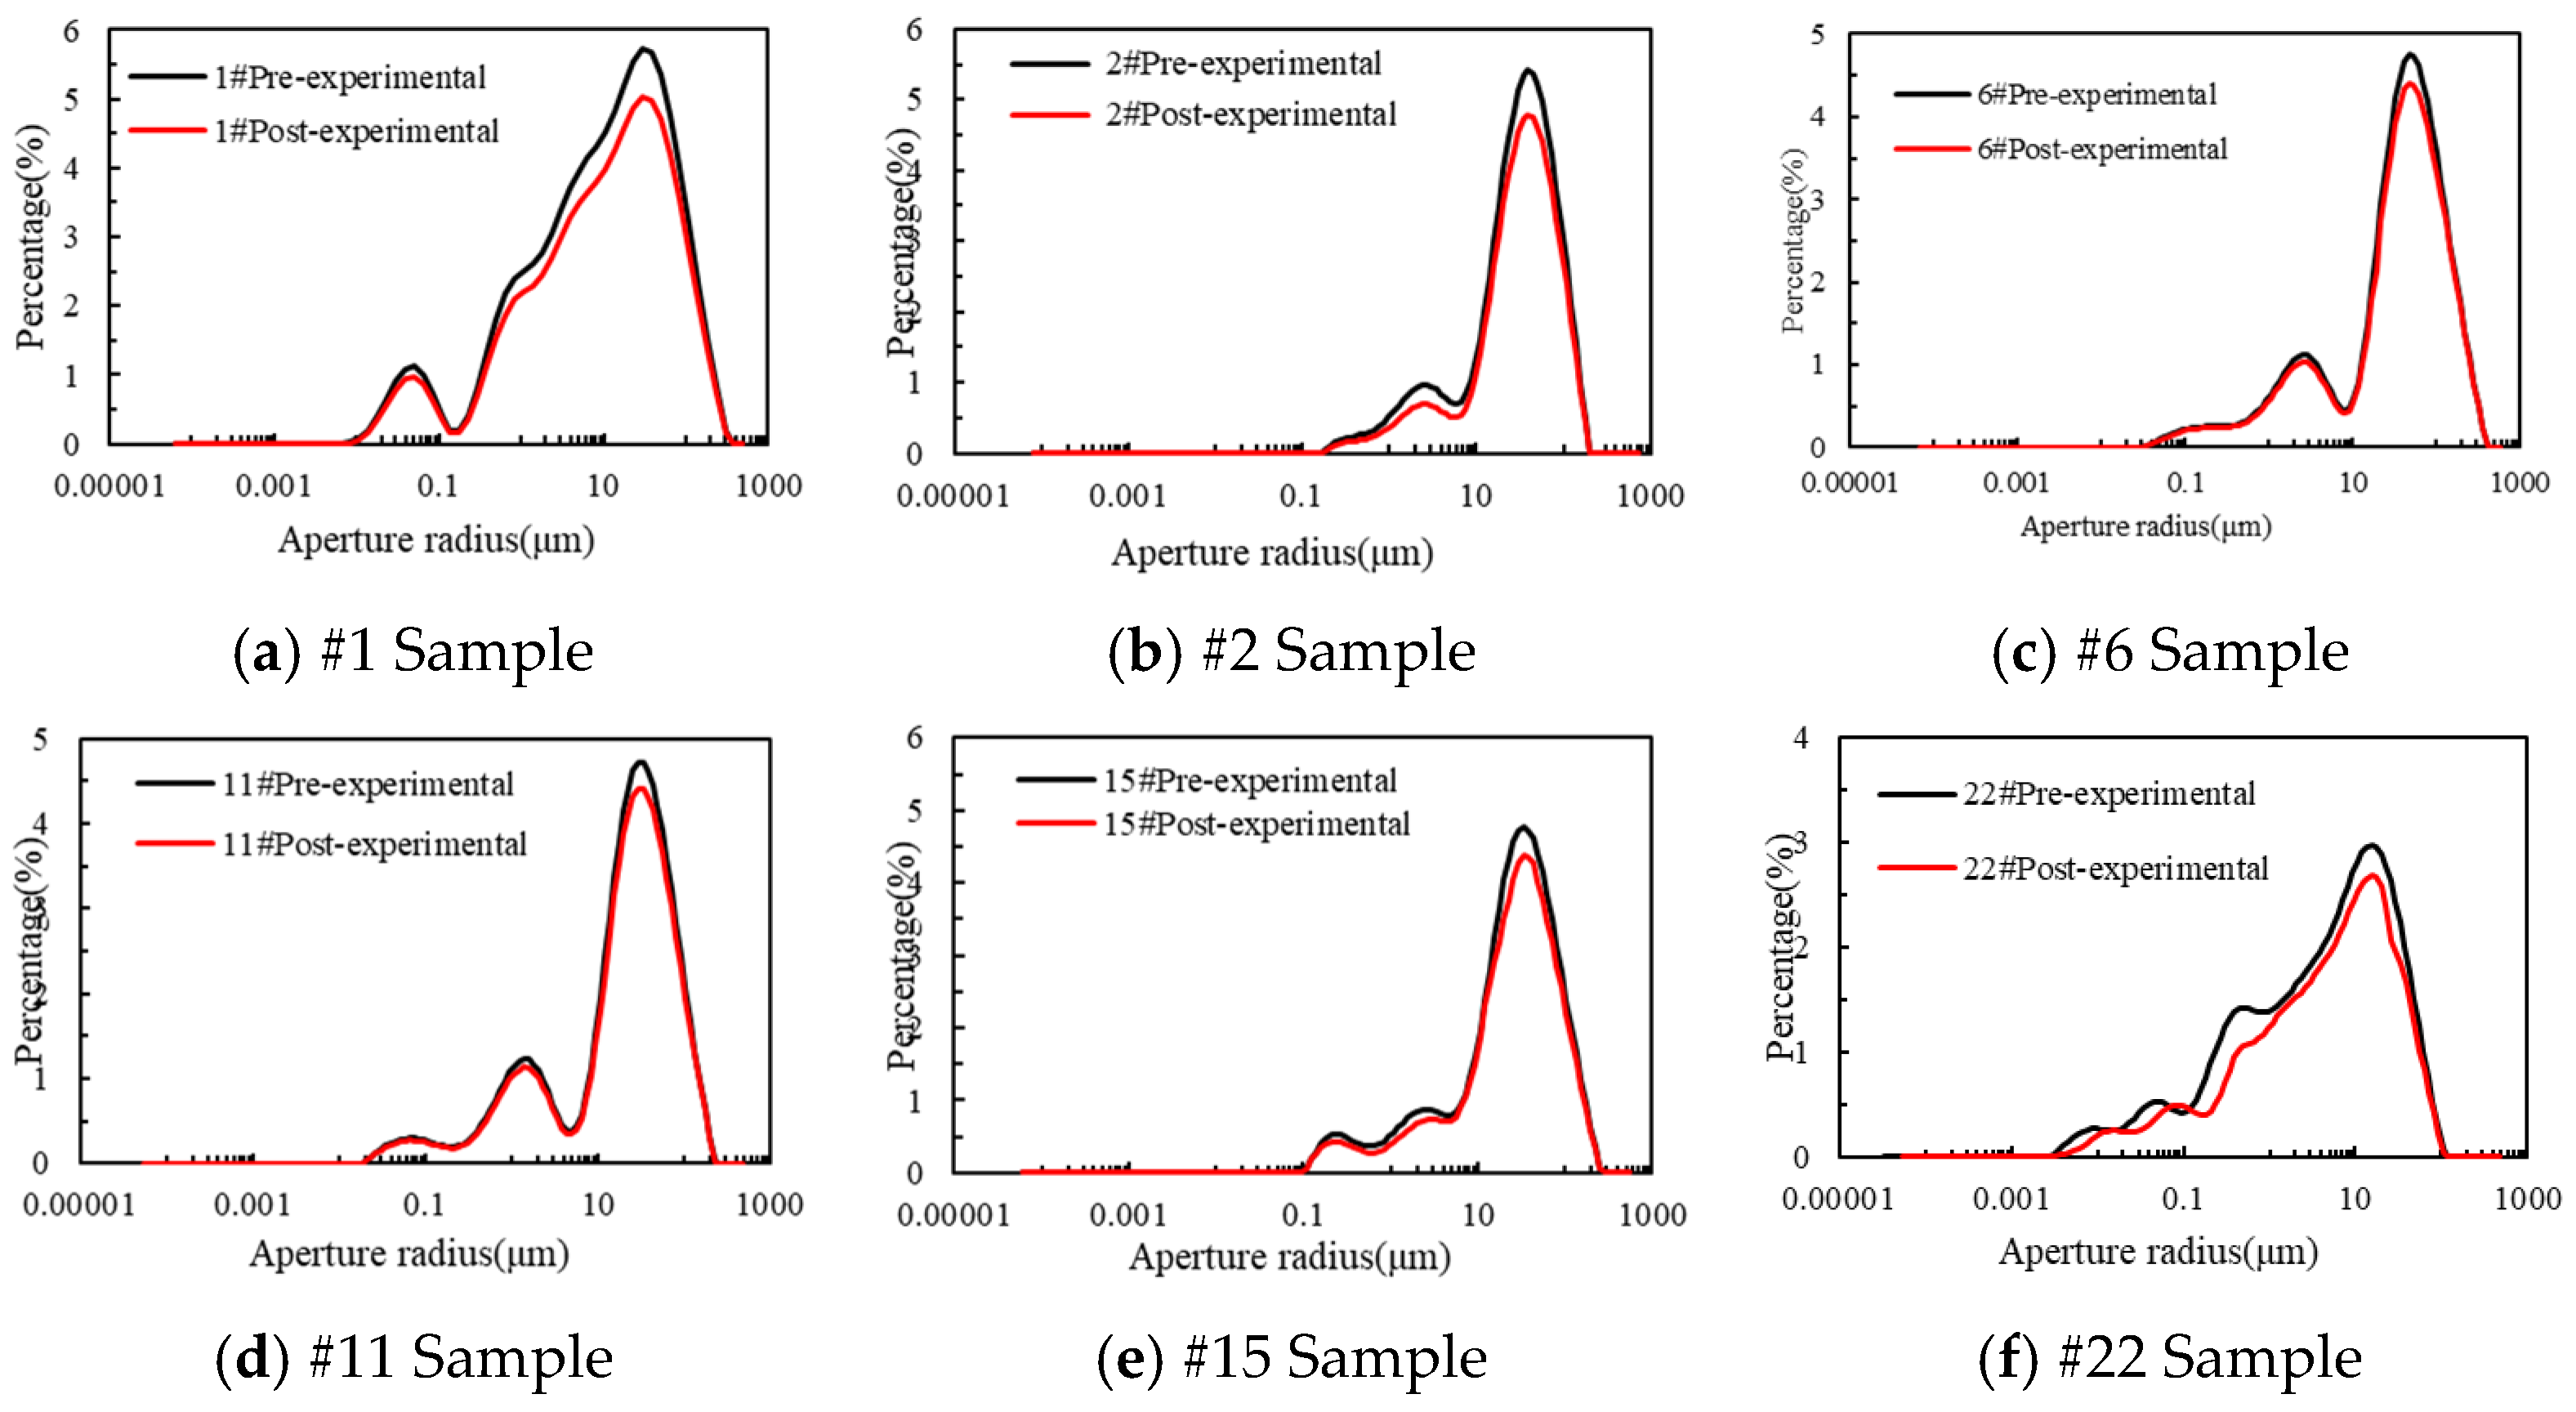
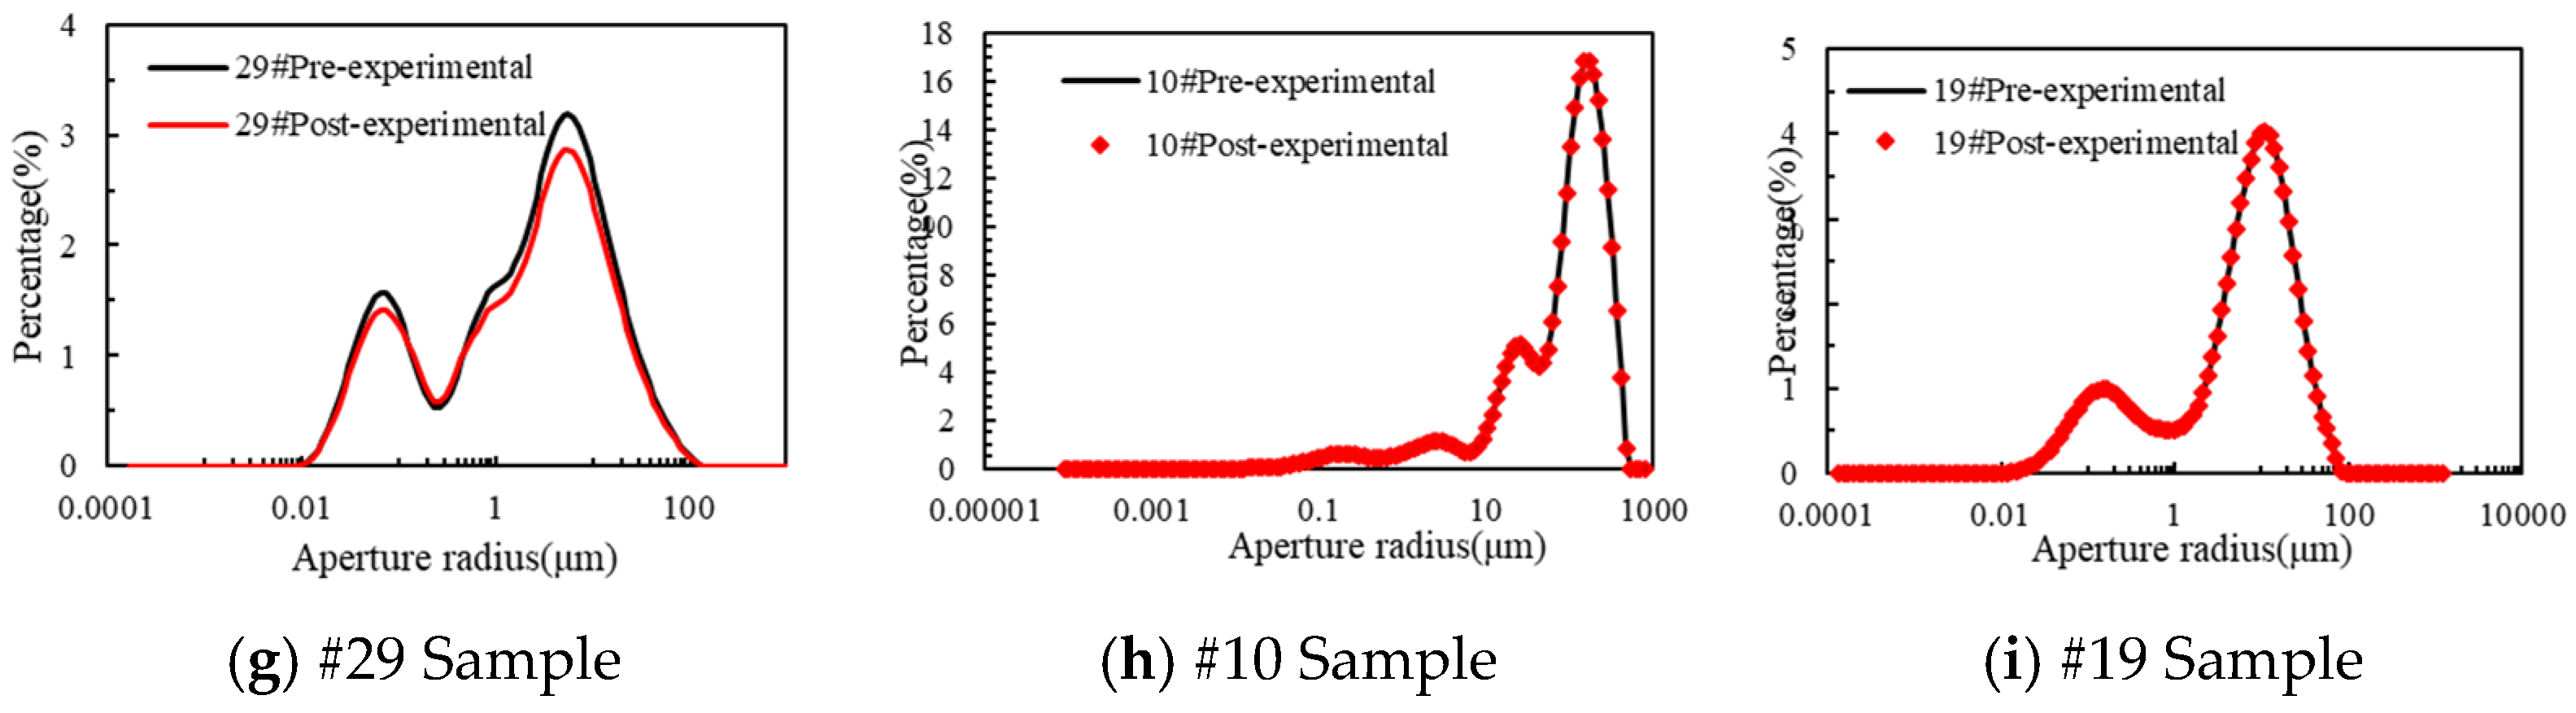
In this study, T2 spectra were obtained by NMR experiments, according to which the T2 spectra can reflect information about the pore structure of the core samples. Figure 6a–g show the pore throat radius distribution corresponding to the NMR of the rock samples after saturated water before and after sulfur deposition, from which it can be seen that the pore space of the cores decreases after the sulfur deposition damage experiments, and due to the different initial pore space of the cores, the sulfur deposition location is slightly different, but basically deposited in the pore throats measuring 10~50 μm. Figure 6h,i show the control group. After the control experiments, it was found that the pore structure of the rock samples basically remained unchanged, which indicates that the effects of water imbibition and confining pressure on the pore structure of the rock samples are negligible, and this further suggests that the changes in the pore structure of the rock samples before and after the sulfur deposition experiments are due to the sulfur deposition products.

3.3. Characterization of Sulfur Deposition Distribution

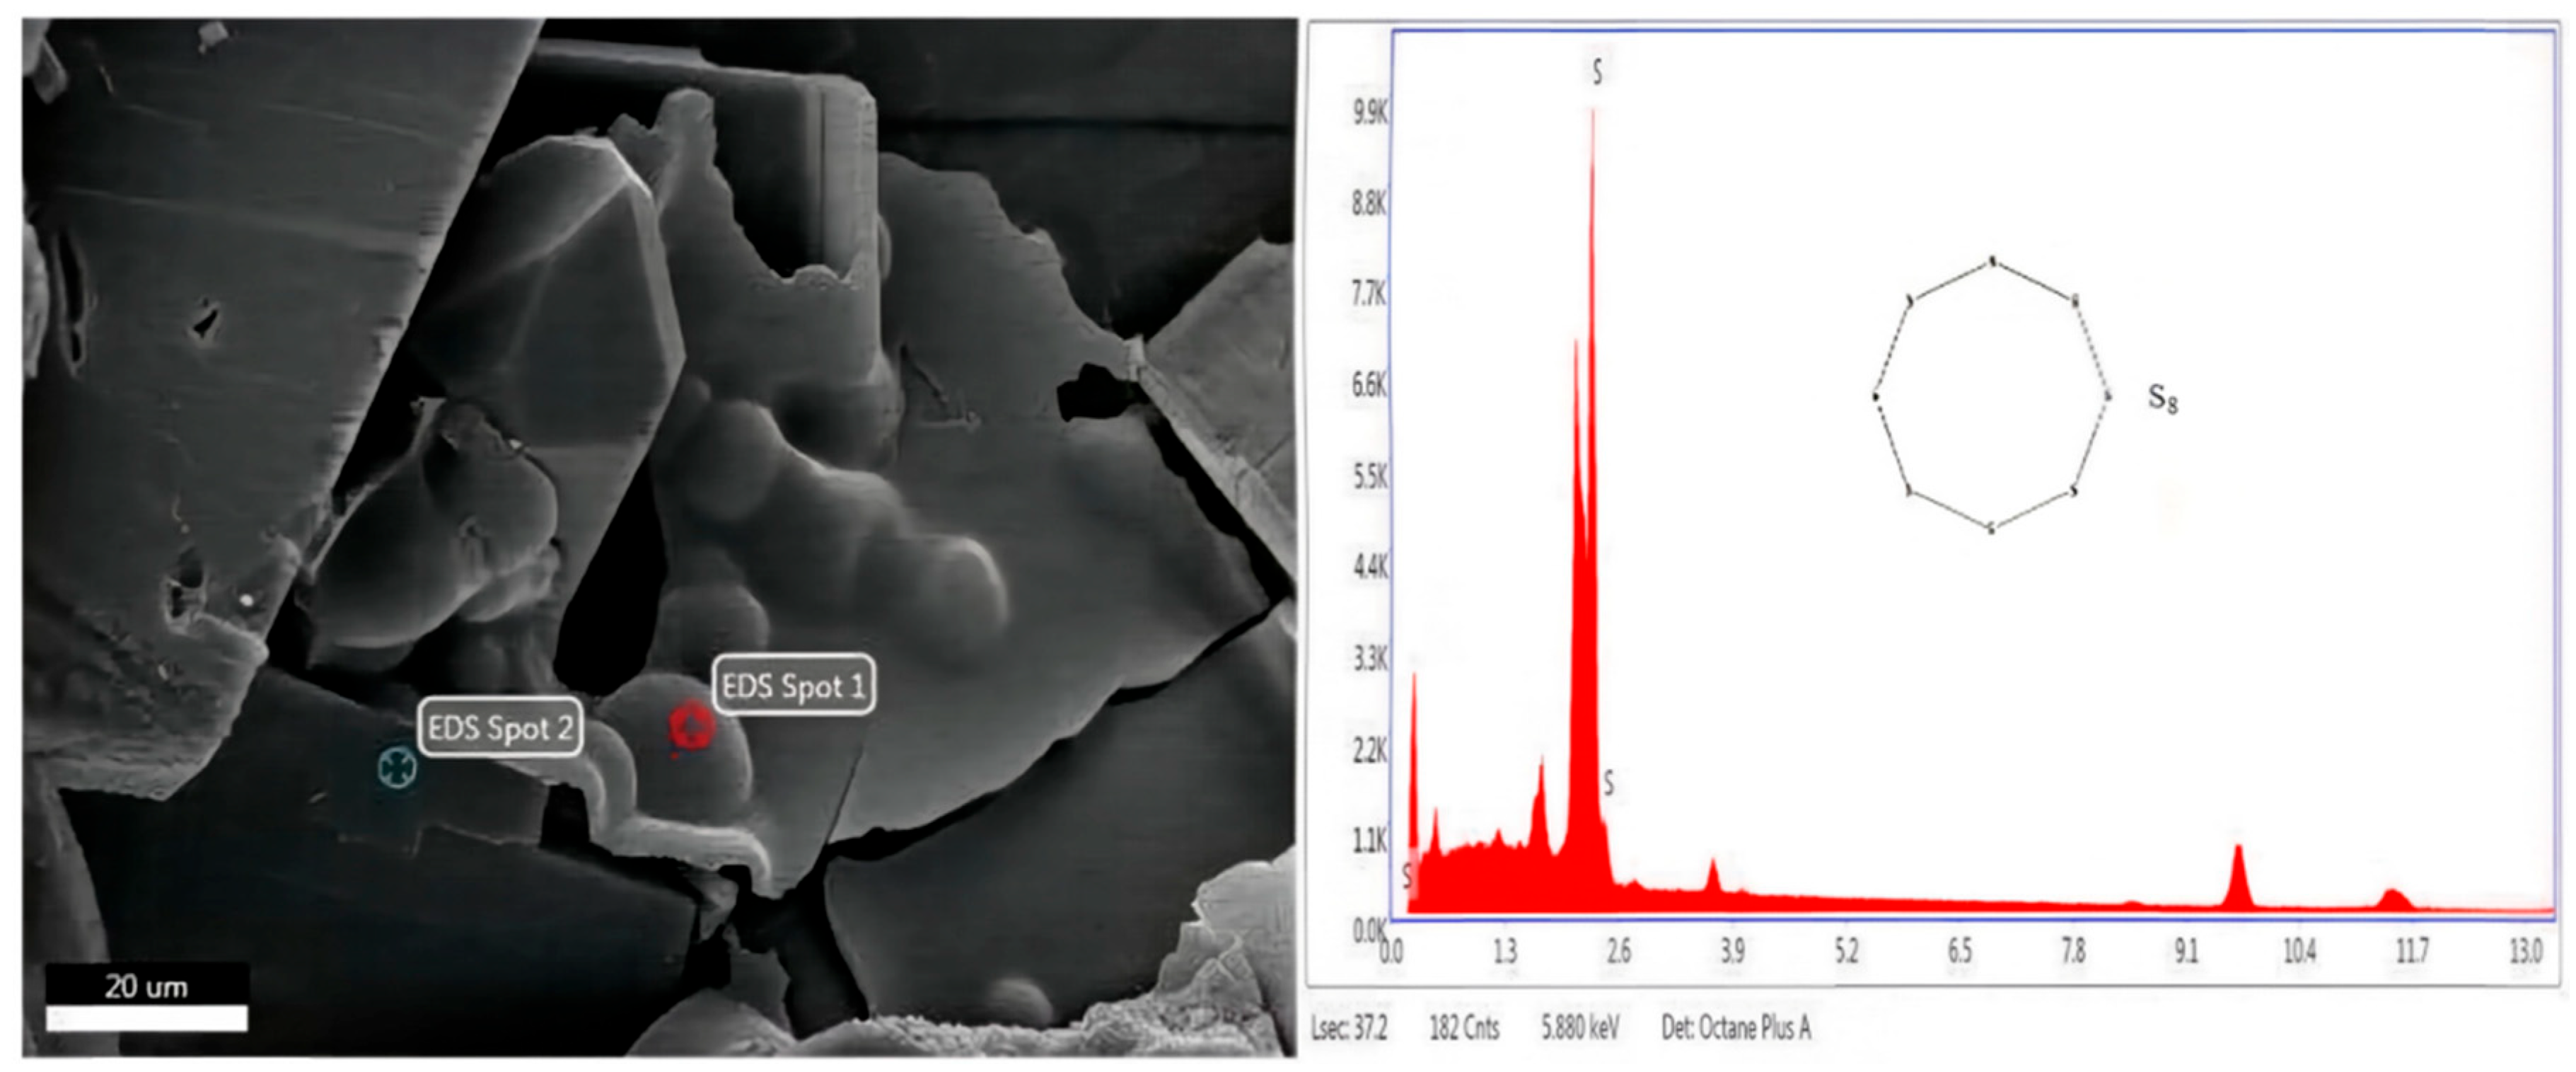
To confirm the formation of sulfur deposition products within the pores of the rock samples after the experiment, energy dispersive spectroscopy (EDS) analysis was conducted on the post-experimental samples. The results are presented in Table 8. These minerals exhibit a high-sulfur content, averaging 72.3%, confirming the formation of sulfur deposition products within the pores of rock samples following sulfur deposition damage experiments. Sample #22 exhibits a lower sulfur content compared to other samples. This discrepancy may stem from the scanning location coinciding with an area of reduced sulfur deposition. In other words, sulfur deposition is unevenly distributed, leading to significant variations in sulfur content across samples.
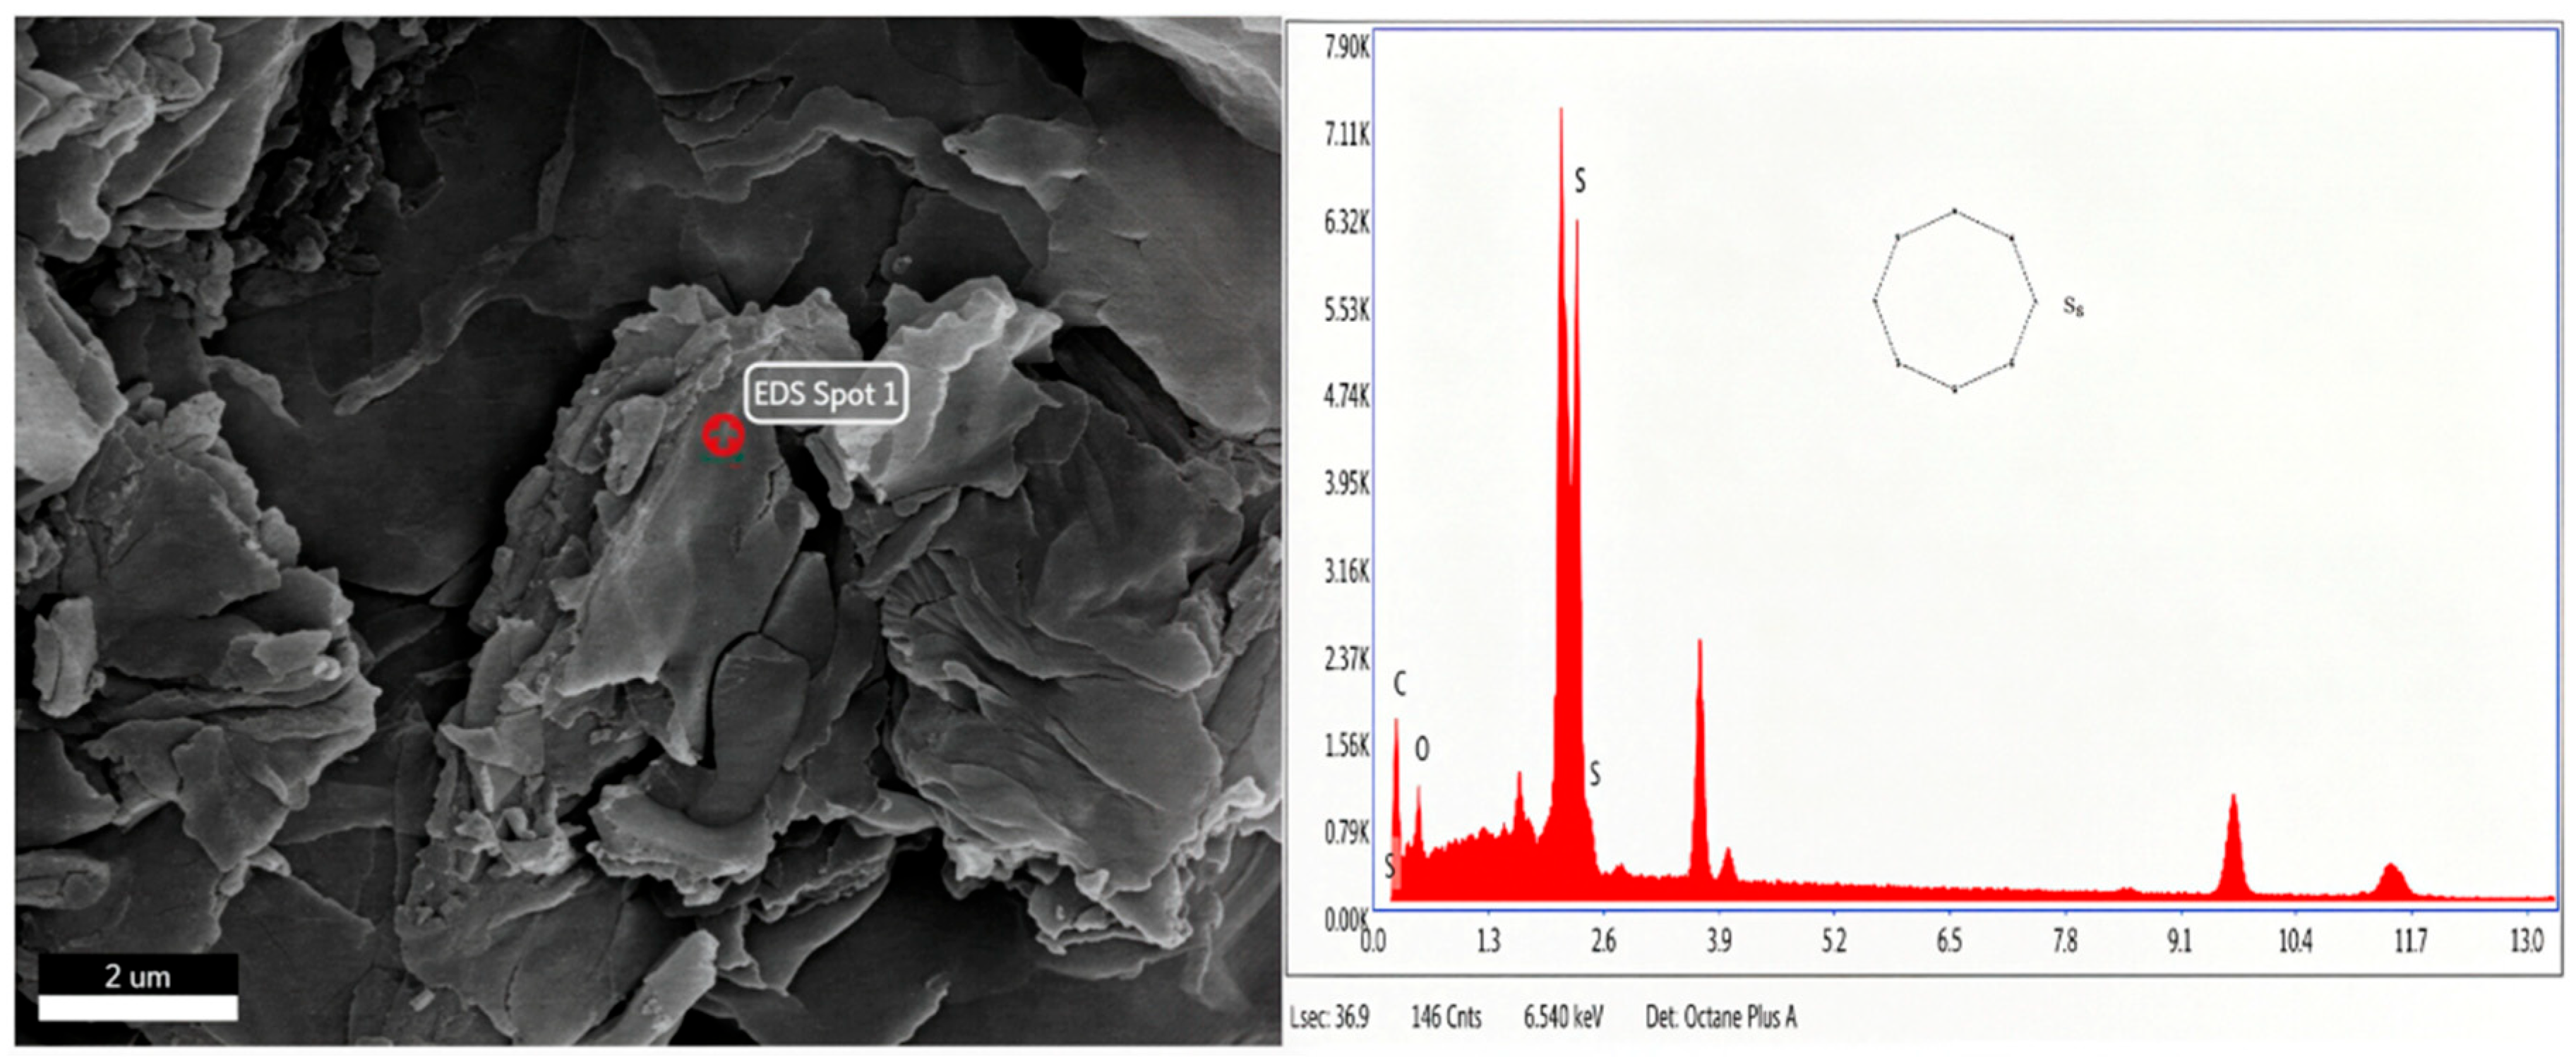
Through scanning electron microscope experiments, the deposition characteristics of elemental sulfur on the pore surface of reservoir rocks can be clearly observed, and the sulfur deposition location and deposition morphology can be determined. The results show that for the rock samples with good physical properties, the morphology of sulfur deposition is mainly in the form of a membrane, which is tightly adsorbed in the pore space, and there are also spherical particle projections on the membrane (shown in Figure 7), possibly reflecting crystallization or particle aggregation during sulfur deposition. For the rock samples with poorer physical properties, the morphology of sulfur deposition is different, which shows membranous flake deposition, and these lamellar deposits also exhibit a stacked, overlapping morphology, which may reflect that sulfur underwent multiple deposition or recrystallization during the pore deposition of the rock samples with poorer physical properties [38] (shown in Figure 8).
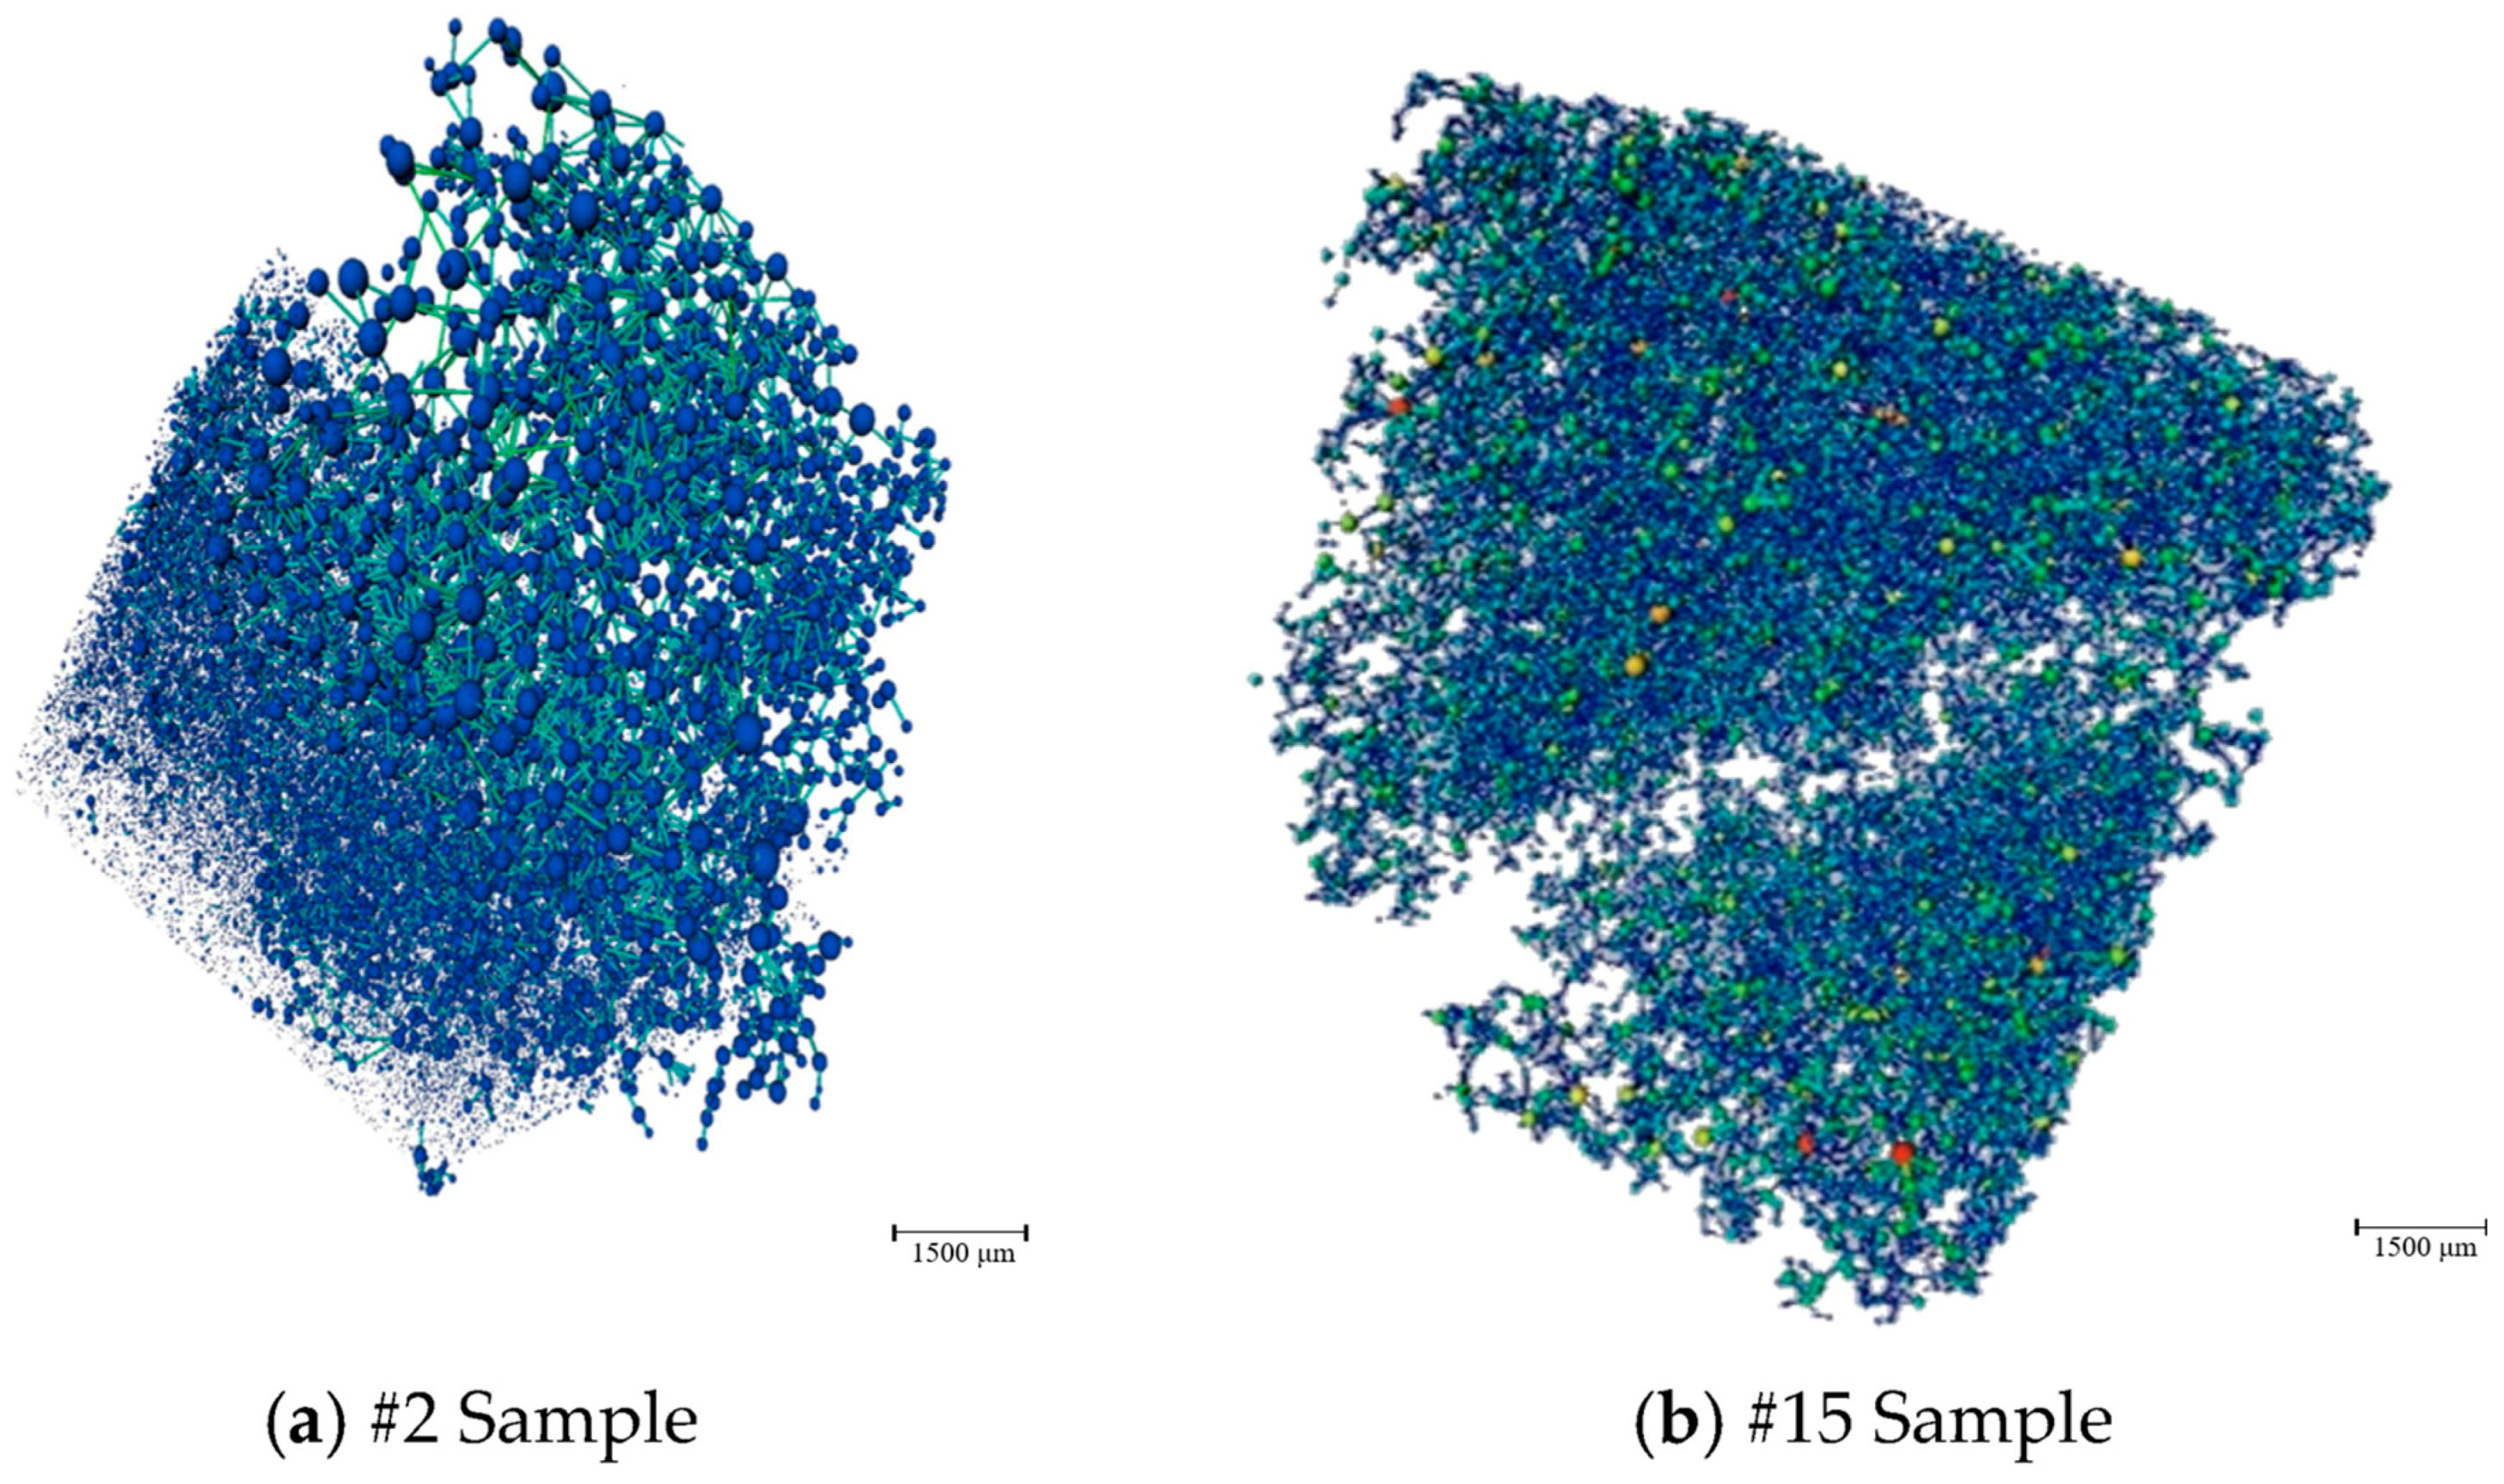
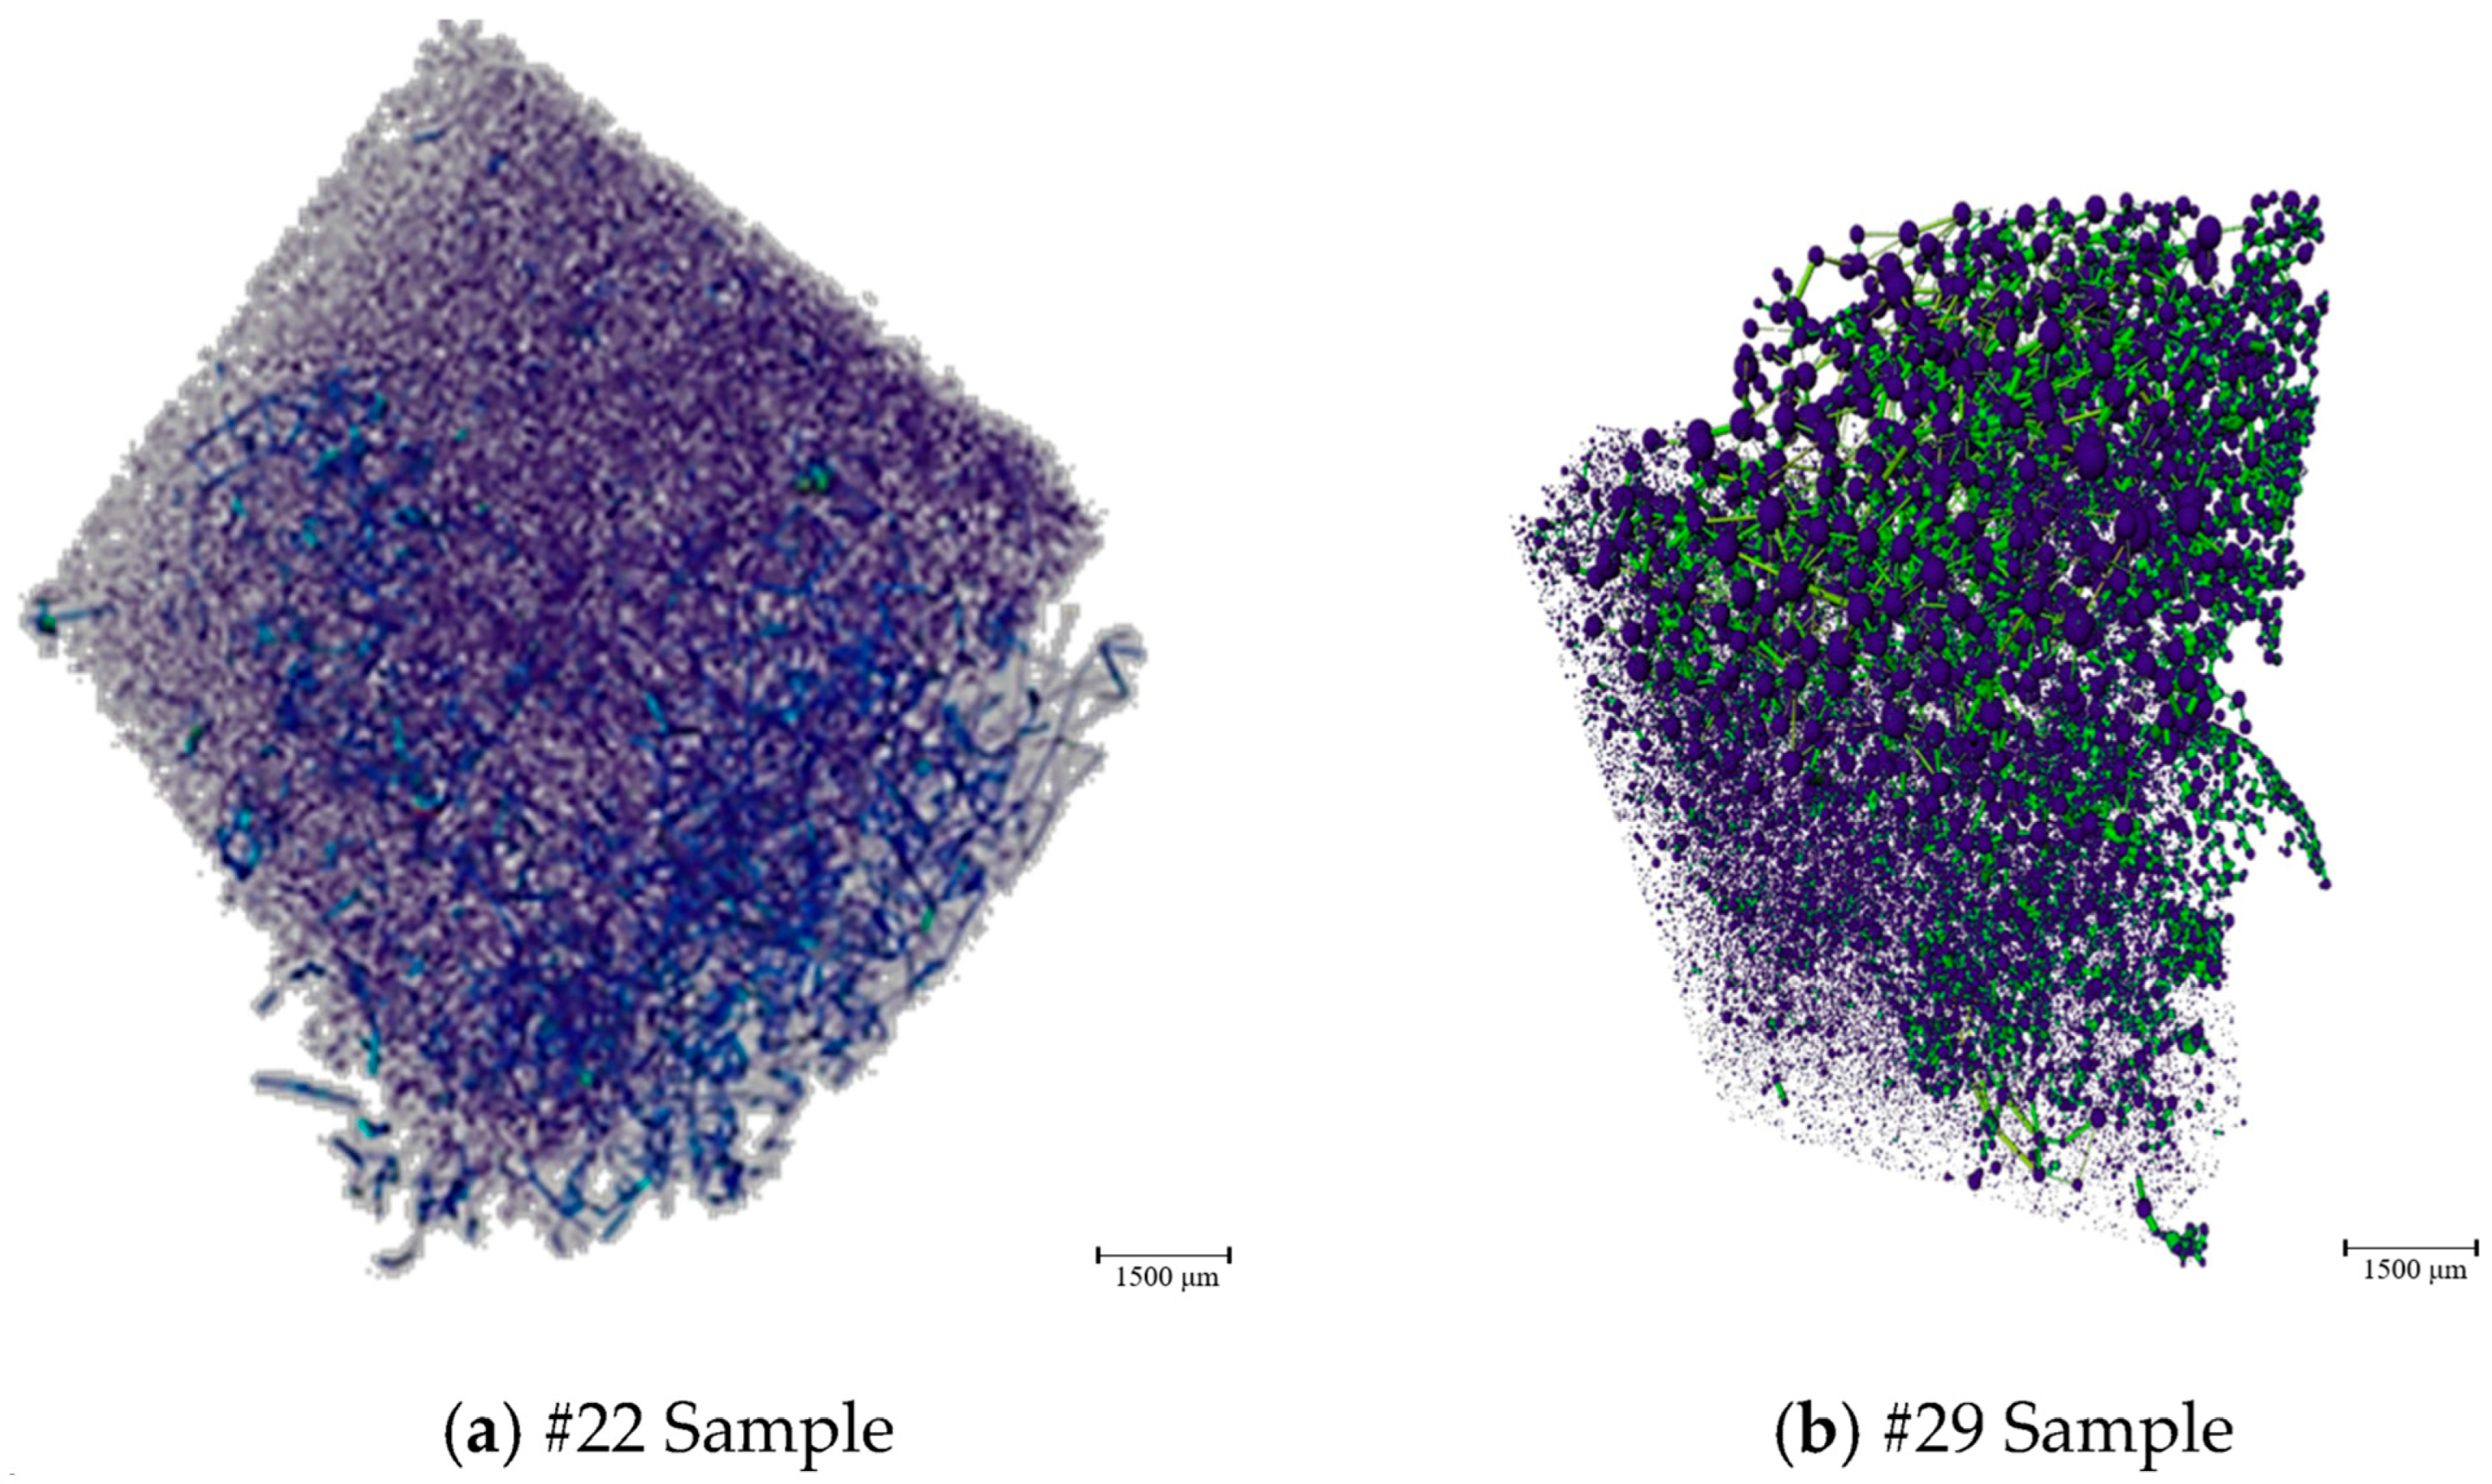
CT scanning of the rock samples before and after the experiments can quantitatively analyze the pore characteristics inside the rock samples and the distribution range of the pore throats of each rock sample before the experiments, and the 3D structure of the rock samples and its corresponding ball-and-stick models can be obtained through data reconstruction [39]. Through the detailed analysis of the ball-and-stick model, it was found that there are significant differences in the pore structure and throat characteristics of rock samples with different physical properties. For rock samples with better physical properties, such as rock samples #2 and #15 (as shown in Figure 9), sulfur deposition is most likely to occur in the pore-throat space within the pore-throat radius range of 10–100 μm. However, for rock samples with poor physical properties, such as rock samples #22 and #29 (as shown in Figure 10), the pore radius and throat radius in which sulfur deposition occurs are relatively small, and sulfur deposition is most pronounced in the pore-throat radius range of 0~30 μm.
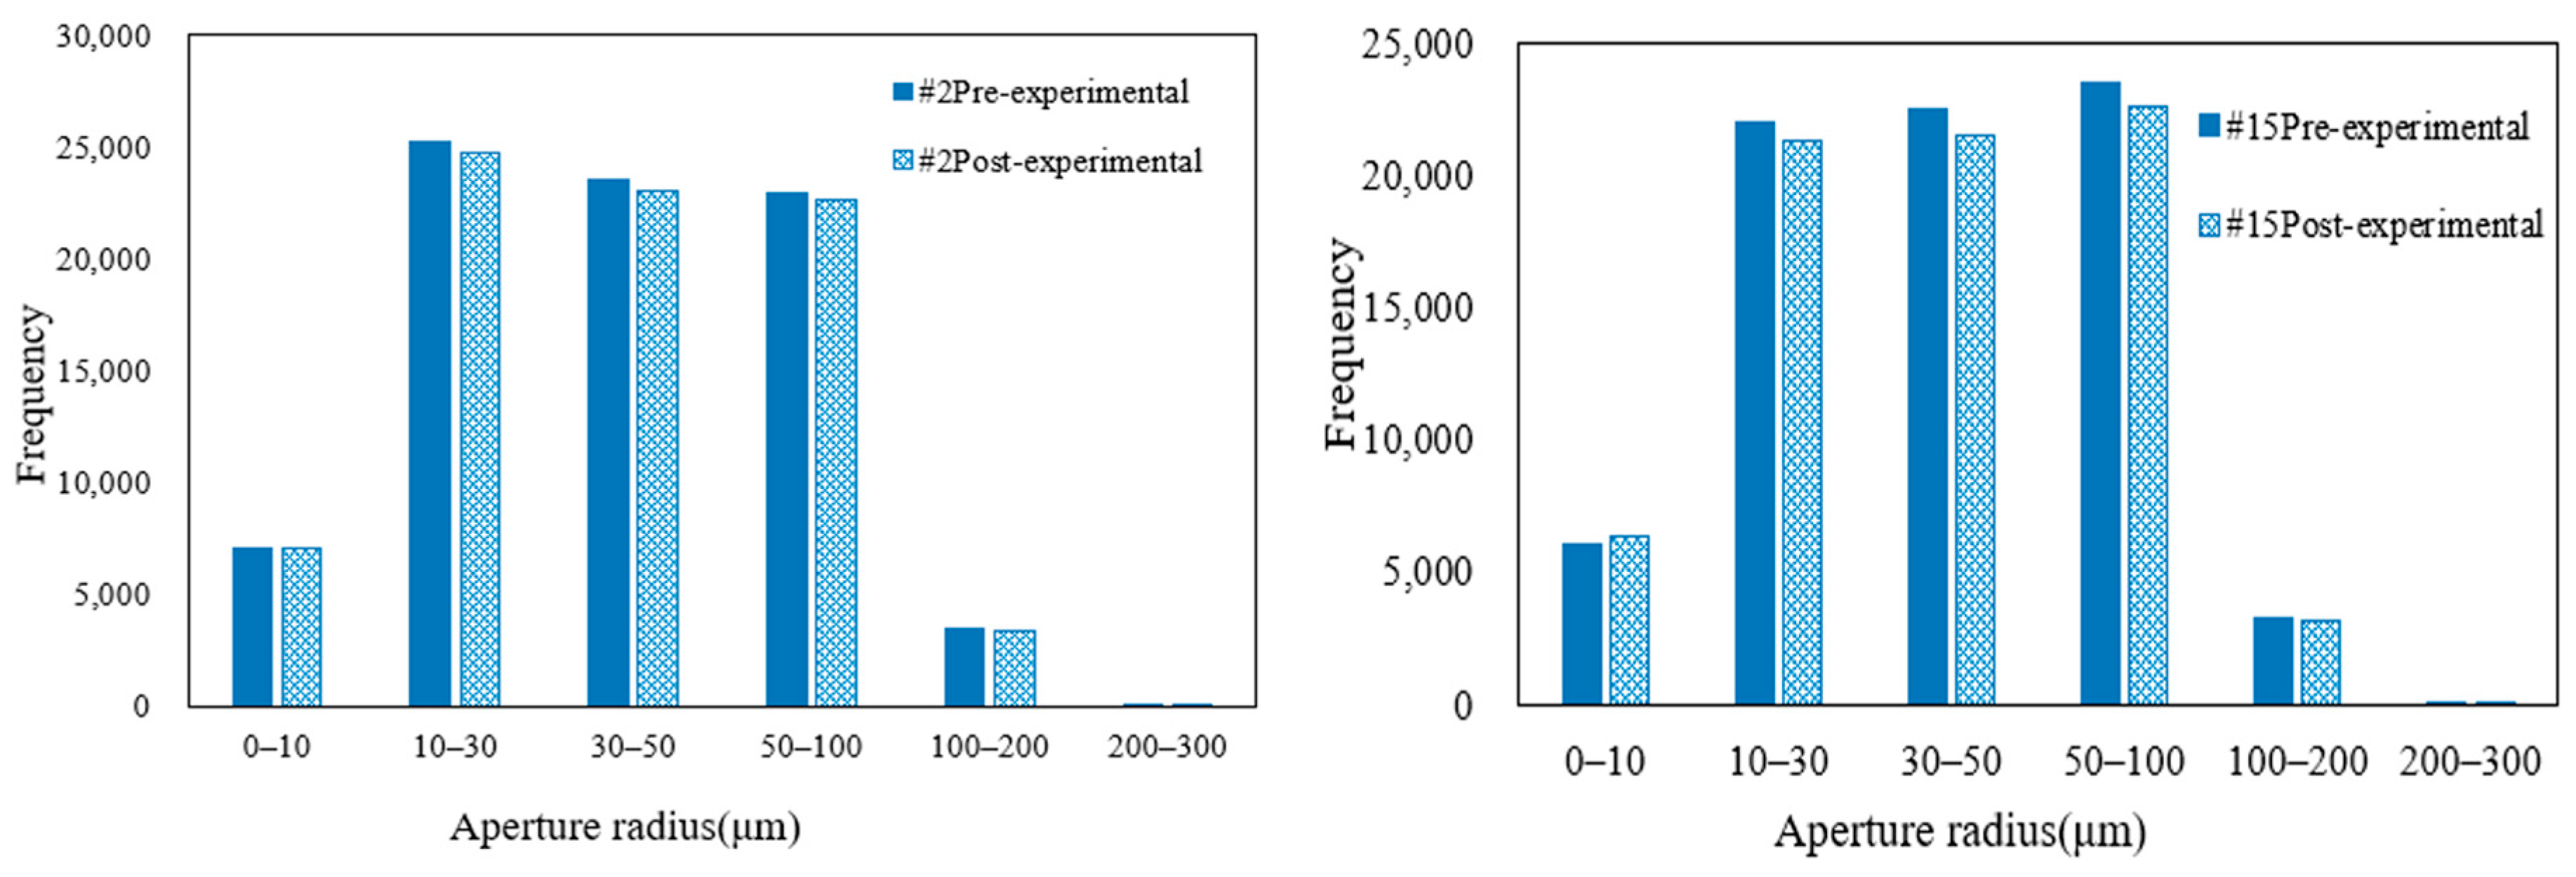
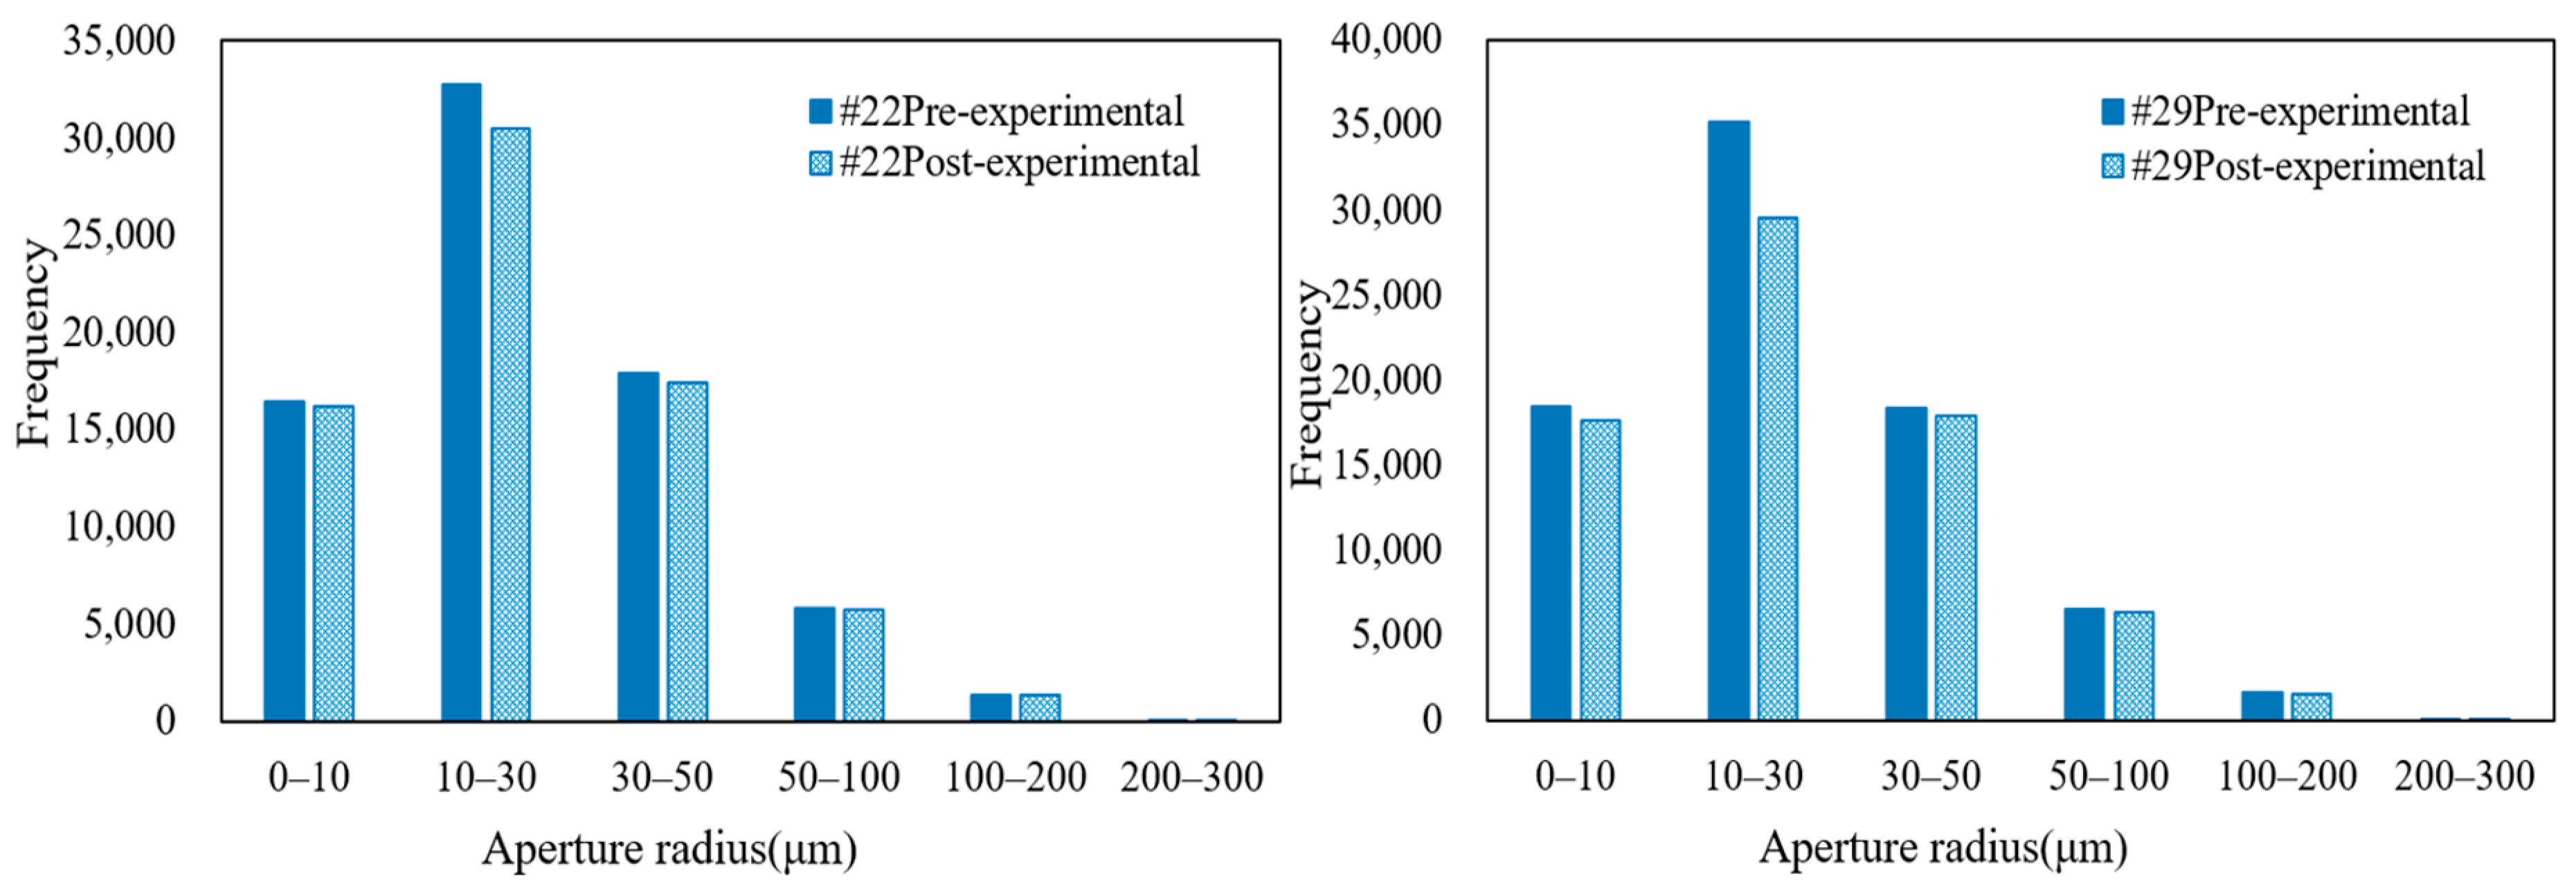
Based on the 3D pore reconstruction images of the rock samples, the number and volume changes of different pore sizes and apertures in the rocks before and after the sulfur deposition experiments can be statistically analyzed. The degrees of sulfur deposition damage varies with different physical properties of the rock samples, and the degree of sulfur deposition damage is lower for rock samples with better physical properties (as shown in Figure 11) and higher for rock samples with poorer physical properties (as shown in Figure 12). Additionally, sulfur deposition primarily affects pores in the 0~10 micrometer range within rock samples, while its impact on pores in the 10~100 micrometer range is relatively minor. The number of pores in the 10~100 micrometer range shows no significant change, but the reduction in pores within the 0~10 micrometer range still adversely affects the overall permeability of the rock samples. These changes in pores and throats resulted in a decrease in the coordination number (the number of adjacent pores surrounding a given pore, serving as a crucial parameter for describing pore structure and connectivity) of the rock samples and poorer pore connectivity. The decrease in the coordination number implies that the connectivity between pores in the rock samples is reduced, and the flow paths of hydrocarbons in the pore network become more complicated and obstructed. This not only reduces the permeability of the rock samples but may also affect the hydrocarbon storage capacity. Therefore, the damage of sulfur deposition to reservoir rocks is multifaceted, which not only changes the pore structure of rock samples, but also affects the connectivity and permeability between pores.

3.4. The Rules of Sulfur Deposition Under Different Influencing Factors

3.4.1. Effect of Differential Pressure on the Extent of Sulfur Deposition

Four groups of sulfur deposition damage experiments were designed under different pressure differentials. To maintain experimental rigor, the water saturation levels of all samples were kept essentially consistent throughout the experiments. The experimental results show that the differential pressure affects the degree of sulfur deposition and its damage to the rock pore structure, and as the differential pressure increases, the degree of damage to the rock pore infiltration by sulfur deposition increases (as shown in Table 9). This is due to the fact that with a certain initial sulfur content, the higher the pressure difference, the more elemental sulfur is precipitated and the easier it is to be deposited in the rock pores, which leads to a higher degree of damage to the core by sulfur deposition. This trend is consistent with the inhibition effect of water film on sulfur adsorption reported in previous studies, which further verifies the rationality of the experimental results [35].

3.4.2. Effect of Water Saturation on the Extent of Sulfur Deposition

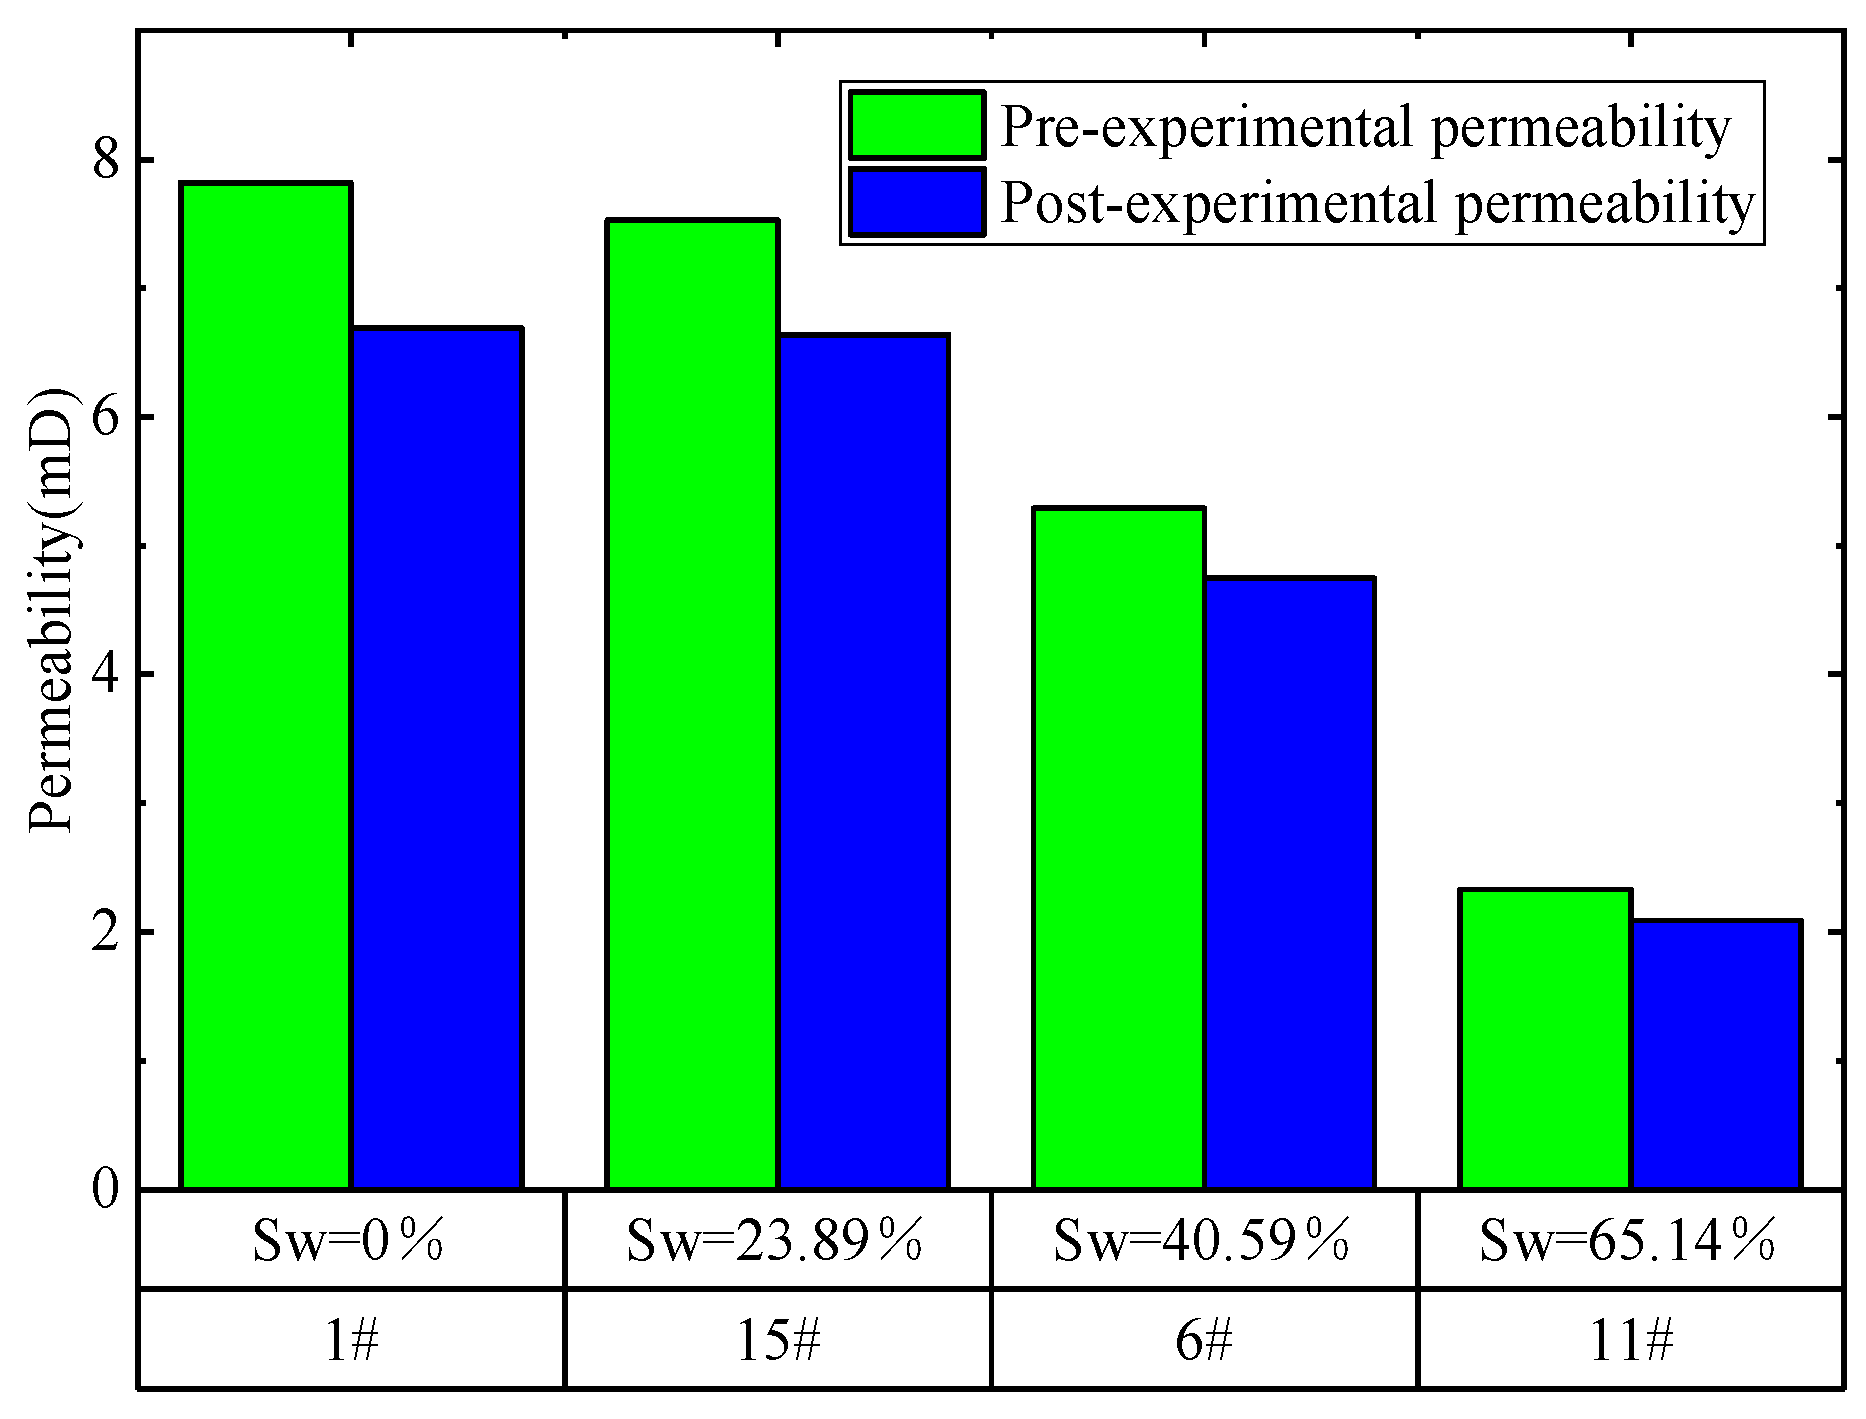
In order to investigate the effect of water saturation on sulfur deposition, sulfur deposition damage experiments under different water saturation conditions were carried out, and the extent of sulfur deposition damage under water-free conditions was compared to clarify the effect of water on the extent of sulfur deposition damage. The pressure at the inlet end of the core was always kept at 16.9 Mpa, and the pressure at the outlet end was kept at 15.4 MPa during the experimental process. The pressure difference between the inlet and outlet of the core was 1.5 MPa (as shown in Table 10). The experimental results show that when the water saturation is lower than about 40.6%, the higher the water saturation, the lower the sulfur deposition damage, and when the water saturation is higher than about 40.6%, sulfur deposition damage no longer decreases with increasing water saturation. The 40.6% threshold represents the irreducible water saturation. Below it, water is discontinuous and sulfur deposits readily. Above it, a continuous water film forms and prevents sulfur adsorption, stabilizing formation damage. (as shown in Figure 13). This inference is consistent with the conclusion that temperature change directly affects sulfur precipitation and deposition degree reported in previous research [7,13].

3.4.3. Effect of Temperature on the Extent of Sulfur Deposition

Temperature is a key factor controlling sulfur solubility and deposition intensity in high-sulfur gas reservoirs. Although this study did not conduct experiments on sulfur deposition as a function of temperature, the topic can be discussed based on previous reports. Some studies have demonstrated that temperature significantly affects sulfur precipitation and formation damage [7,13]. Sulfur solubility in natural gas increases with rising temperature under constant pressure. A temperature drop sharply reduces the sulfur-carrying capacity of gas and accelerates elemental sulfur precipitation, similar to the effect of pressure reduction [7,26]. Lower temperature favors solid sulfur formation and aggregation, which causes more severe pore-throat plugging than liquid sulfur [26,35]. Temperature also interacts with water saturation. At lower temperatures, the water film on rock surfaces becomes more stable and strengthens the inhibition of sulfur adsorption, which would lower the critical water saturation threshold observed in this work. Meanwhile, temperature affects deposition morphology: lower temperature tends to form lamellar or clustered sulfur, while moderate temperature favors membranous deposition as observed in the experiments [35].

4. Conclusions

(1) After the experiment, the permeability of rock samples decreased by 0.004 to 8.852 mD, representing a reduction of 10.2% to 29.8%; porosity decreased by 1.5% to 11.9%. Pore-throat volume within the cores was significantly reduced due to sulfur deposition. In rock samples with favorable physical properties, deposition occurred primarily within throat radii of 10~100 μm, while in samples with poor physical properties, deposition was more pronounced within the range below 30 μm.
(2) Energy dispersive X-ray spectroscopy (EDS) and scanning electron microscopy (SEM) confirmed the deposits as elemental sulfur. In rock samples with good physical properties, sulfur formed a film-like coating on particle surfaces with spherical protrusions; in samples with poor physical properties, sulfur exhibited a layered, overlapping morphology.
(3) The higher the experimental pressure differential, the more severe the sulfur deposition damage; the higher the water saturation, the less severe the damage, but beyond approximately 40.6%, the effect no longer diminishes.
Although this study considered the influence of water saturation on sulfur deposition, temperature remains a significant factor that cannot be ignored in practical scenarios. The experimental temperature was set to replicate a specific reservoir condition under constant-temperature conditions. Future research should focus on investigating the effects of varying temperatures on sulfur deposition patterns to achieve results that more closely approximate real-world conditions.
(4) This study is constrained by the fact that each experimental condition (water saturation, pressure difference) was conducted on a single core sample. Although the results reveal consistent macroscopic and microscopic trends, the lack of replication means the observed relationships, especially the water saturation threshold effect, are preliminary.
In addition, the cores used for water saturation analysis have different initial porosities and permeabilities. As physical properties influence sulfur deposition, this prevents definitive attribution of trends to water saturation alone.

Author Contributions

Conceptualization, L.W. and Y.Y.; methodology, Y.W.; validation, D.Z.; investigation, W.L.; resources, D.T.; data curation, Q.Z., Z.P. and Z.D.; writing—original draft preparation, L.W., W.L., H.C. and J.W.; writing—review and editing, Y.P., S.C., J.L. and X.L.; supervision, Y.Y.; project administration, L.W. All authors have read and agreed to the published version of the manuscript.

Funding

This research received no external funding.

Data Availability Statement

The data presented in this study are available on request from the corresponding author. The data is unavailable due to privacy.

Conflicts of Interest

Authors Li Wang, Yan Yang, Ying Wan, Dihong Zhang, Daqing Tang, Qingxiu Zhang, Zhijin Pu, and Zhao Ding were employed by the Exploration and Development Research Institute of PetroChina Southwest Oil and Gas Field Company. Authors Weiyi Luo, Haoqi Chen, Jiaxing Wang, Shuang Chen, Jiyu Li, Xinhan Li, and Yu Peng were employed by the State Key Laboratory of Oil and Gas Reservoir Geology and Exploitation, Southwest Petroleum University. The authors declare that the research was conducted in the absence of any commercial or financial relationships that could be construed as a potential conflict of interest. The Exploration and Development Research Institute of PetroChina Southwest Oil and Gas Field Company had no role in the design of the study; in the collection, analyses, or interpretation of data; in the writing of the manuscript, or in the decision to publish the results.

Nomenclature

NMRNuclear magnetic resonanceSEMScanning electron microscopy
φ Porosity, %kPermeability, mD
SwWater saturation, %DDiameter, mm
piPressure at inlet side, MPapoPressure at outlet side, MPa
Δ pPressure difference, MPaLLength, mm

References

  1. Li, B.; Zhao, S.; Liu, Y.; Yang, X.; Liu, Y.; Zhang, J.; Zhang, C.; Li, J.; Wang, G.; Yin, M. Fracture features and fault influence on gas accumulation in the Longmaxi Formation in Changning block, southern Sichuan Basin. Nat. Gas Ind. B 2024, 11, 482–495. [Google Scholar] [CrossRef]
  2. Hu, Y.; Hui, D.; Peng, X.; Xiong, G.; Yang, J.; Li, L.; Li, T. Key development technologies for high-sulfur gas reservoirs: New progress, challenges and key research directions. Nat. Gas Ind. 2022, 42, 23–31. [Google Scholar]
  3. Zeng, D.; Zhang, Q.; Li, T.; Su, Y.; Zhang, R.; Zhang, C.; Peng, S. Key technologies for long-period high and stable production of the Puguang high-sulfur gas field, Sichuan Basin. Nat. Gas Ind. 2023, 43, 65–75. [Google Scholar]
  4. Yang, X.; Yan, W.; Zhou, C.; Yin, S. Experiment-based reserve calculation for carbonate gas reservoirs: Taking X gas reservoir as an example. Nat. Gas Explor. Dev. 2024, 47, 12–22. [Google Scholar]
  5. Fang, Q.; He, J.; Wang, Y.; Pan, H.; Ren, H.; Liu, H. A Predictive Model for Wellbore Temperature in High-Sulfur Gas Wells Incorporating Sulfur Deposition. Processes 2024, 12, 1073. [Google Scholar] [CrossRef]
  6. Wilkes, C.; Pareek, V. Sulfur Deposition in a Gas Turbine Natural Gas Fuel Control System; General Electric Co.: Schenectady, NY, USA, 1999. [Google Scholar]
  7. Cézac, P.; Serin, J.P.; Reneaume, J.M.; Mercadier, J.; Mouton, G. Elemental sulphur deposition in natural gas transmission and distribution networks. J. Supercrit. Fluids 2008, 44, 115–122. [Google Scholar] [CrossRef]
  8. Liu, W.; Huang, X.; Zhang, L.; He, J.; Cen, X. Analysis of sulfur deposition for high-sulfur gas reservoirs. Pet. Sci. Technol. 2022, 40, 1716–1734. [Google Scholar] [CrossRef]
  9. Peng, Y.; Luo, A.; Li, Y.; Wu, Y.; Xu, W.; Sepehrnoori, K. Fractional model for simulating Long-Term fracture conductivity decay of shale gas and its influences on the well production. Fuel 2023, 351, 129052. [Google Scholar] [CrossRef]
  10. Piemjaiswang, R.; Khaisri, S.; Sema, T.; Chalermsinsuwan, B.; Nimmanterdwong, P. Performance of Data Segmentation ANN Model for Elemental Sulfur Solubility Prediction in Natural Gas Transportation Pipeline. In 2023 15th International Conference on Computer and Automation Engineering (ICCAE); IEEE: Piscataway, NJ, USA, 2023; pp. 287–291. [Google Scholar]
  11. Peng, Y.; Ma, H.; Li, Z.; Zhou, L.; Zhao, J.; Wen, X. Material balance evaluation method for water-bearing gas reservoirs considering the influence of relative permeability. Pet. Sci. Technol. 2024, 43, 570–585. [Google Scholar] [CrossRef]
  12. Zhang, N.; Zhang, Z.; Rui, Z.; Li, J.; Zhang, C.; Zhang, Q.; Zhao, W.; Patil, S. Comprehensive risk assessment of high sulfur-containing gas well. J. Pet. Sci. Eng. 2018, 170, 888–897. [Google Scholar] [CrossRef]
  13. Bemani, A.; Baghban, A.; Mohammadi, A.H. An insight into the modeling of sulfur content of sour gases in supercritical region. J. Pet. Sci. Eng. 2020, 184, 106459. [Google Scholar] [CrossRef]
  14. Peng, Y.; Ye, J.; Li, Y.; Chen, Y.; Li, Z.; Zhang, D. Development and Performance Evaluation of Novel Self-Degradable Preformed Particulate Gels with High-Temperature and High-Salinity Resistance. SPE J. 2025, 30, 1105–1115. [Google Scholar]
  15. Guo, X.; Wang, P.; Ma, J.; Jia, C. Numerical simulation of sulfur deposition in wellbore of sour-gas reservoir. Processes 2022, 10, 1743. [Google Scholar] [CrossRef]
  16. Wei, Y.; Wang, L.; Li, N.; Wen, L.; Huo, X.; Zhang, L.; Yang, M. Roles of carbon dioxide and methane in the dissolution of elemental sulfur in natural Gas. Energy Fuels 2022, 36, 13617–13625. [Google Scholar] [CrossRef]
  17. Ge, F.; Jia, C.; Li, H. Key technologies for safe and efficient development and long-term stable production of the Luojiazhai high-sulfur gas field in the Sichuan Basin. Nat. Gas Ind. 2023, 43, 85–92. [Google Scholar]
  18. Li, Z.; Du, Y.; Duan, Y.; Peng, Y.; Li, J.; Ma, S.; Sepehrnoori, K. Microscopic experimental study on the reaction of shale and carbon dioxide based on dual energy CT mineral recognition method. Fuel 2024, 371, 131874. [Google Scholar] [CrossRef]
  19. Huang, S.; Liu, J.; Wang, X.; Shi, S. Experimental study and modeling of sulfur particle migration in high-sulfur gas wells. Pet. Sci. Technol. 2025, 44, 1768–1794. [Google Scholar] [CrossRef]
  20. Shedid, S.A.; Zekri Abdulrazag, Y. Formation Damage Due to Simultaneous Sulfur and Asphaltene Deposition. In SPE International Symposium and Exhibition on Formation Damage Control; SPE: Houston, TX, USA, 2004. [Google Scholar]
  21. Hu, Y.; Peng, Y.; Hu, F.; He, F.; Guo, P. Anti-corrosion Performance of Chromium-coated Steel in a Carbon Dioxide-saturated Simulated Oilfield Brine. Int. J. Electrochem. Sci. 2017, 12, 5628–5635. [Google Scholar]
  22. Hu, J.H.; He, S.L.; Wang, X.D.; Zhao, J.-Z.; Dong, K. The modeling of sulfur deposition damage in the presence of natural fracture. Pet. Sci. Technol. 2013, 31, 80–87. [Google Scholar] [CrossRef]
  23. Shao, M.; Yang, Q.; Zhou, B.; Dai, S.; Li, T.; Ahmad, F. Effect of sulfur deposition on the horizontal well inflow profile in the heterogeneous sulfur gas reservoir. ACS Omega 2021, 6, 5009–5018. [Google Scholar] [CrossRef] [PubMed]
  24. Wang, L.; Lu, T.; Li, Z.; Guo, X. Microscopic Mechanism and Percolation Model of Dynamic Deposition of Elemental Sulfur Particles in Acidic Gas Reservoirs. ACS Omega 2024, 9, 30159–30168. [Google Scholar] [CrossRef] [PubMed]
  25. Hu, J.; Lei, Z.; Chen, Z.; Ma, Z. Effect of sulphur deposition on well performance in a sour gas reservoir. Can. J. Chem. Eng. 2018, 96, 886–894. [Google Scholar]
  26. Mahmoud, M.A. Effect of elemental-sulfur deposition on the rock petrophysical properties in sour-gas reservoirs. SPE J. 2014, 19, 703–715. [Google Scholar]
  27. Guo, X.; Zhou, X.; Zhou, B. Prediction model of sulfur saturation considering the effects of non-Darcy flow and reservoir compaction. J. Nat. Gas Sci. Eng. 2015, 22, 371–376. [Google Scholar] [CrossRef]
  28. Hu, J.; Chen, Z.; Liu, P.; Liu, H. A comprehensive model for dynamic characteristic curves considering sulfur deposition in sour carbonate fractured gas reservoirs. J. Pet. Sci. Eng. 2018, 170, 643–654. [Google Scholar] [CrossRef]
  29. Hu, J.; Yang, X.; He, S.L.; Zhao, J. Distribution of sulfur deposition near a wellbore in a sour gas reservoir. J. Geophys. Eng. 2013, 10, 015005. [Google Scholar]
  30. Xu, Z.; Gu, S.; Zeng, D.; Sun, B.; Xue, L. Numerical simulation of sulfur deposit with particle release. Energies 2020, 13, 1522. [Google Scholar] [CrossRef]
  31. Gao, F.; Li, J.; Yang, C.; Zhang, W.; Huang, H.; Peng, Z.; Gong, T. Advances on research of H2S removal by deep eutectic solvents as green solvent. Nat. Gas Ind. B 2025, 12, 26–36. [Google Scholar] [CrossRef]
  32. Wang, J.; Cheng, Y.; Li, Y.; Ma, P.; Xu, H.; Jiang, H. Inhibition performance and mechanisms of methane hydrate inhibitors in oil and gas pipelines. Nat. Gas Ind. B 2026, 13, 239–255. [Google Scholar] [CrossRef]
  33. Fan, X.; Yan, Y.; Zhang, Q.; Ji, R.; Bai, A.; Zhao, P.; He, L. Characteristics of carbonate reservoirs in Sinian Dengying Formation, Gaoshiti-Moxi area, Sichuan Basin. Nat. Gas Explor. Dev. 2023, 46, 1–11. [Google Scholar]
  34. Zhou, G.; Yan, Z.; Lei, D.; Li, Q.; Zhong, Y.; Yan, W.; Zhang, Y.; Qiao, Y.; Dou, S. Genetic model of dolomite and its influence on development of high-quality carbonate reservoir. Nat. Gas Explor. Dev. 2024, 47, 1–11. [Google Scholar]
  35. Roberts, B.E. Flow impairment by deposited sulfur—A review of 50 years of research. J. Nat. Gas Eng. 2017, 2, 84–105. [Google Scholar]
  36. Chernik, P.S.; Williams, P.J. Extended production testing of the bearberry ultra-sour gas resource. In SPE Unconventional Resources Conference/Gas Technology Symposium; SPE: Houston, TX, USA, 1993; p. SPE-26190-MS. [Google Scholar]
  37. Yurui, Y.; Xiao, G.; Peng, W. Modeling productivity of horizontal wells in a high sulfur gas reservoir: Consideration of the impact of porosity reduction by sulfur deposition. J. Eng. Res. 2018, 6, 1–15. [Google Scholar] [CrossRef]
  38. Guo, X.; Du, Z.; Yang, X.; Zhang, Y.; Fu, D. Sulfur deposition in sour gas reservoirs: Laboratory and simulation study. Pet. Sci. 2009, 6, 405–414. [Google Scholar] [CrossRef]
  39. Li, T.; Ma, Y.; Zeng, D.; Li, Q.; Zhao, G.; Sun, N. Fine quantitative characterization of high-H2S gas reservoirs under the influence of liquid sulfur deposition and adsorption. Pet. Explor. Dev. 2024, 51, 416–429. [Google Scholar]
Figure 1. Selected experimental samples.
Processes 14 02195 g001
Figure 2. Schematic diagram of the sulfur deposition simulation device.
Processes 14 02195 g002
Figure 3. Nuclear magnetic resonance experimental instrument.
Processes 14 02195 g003
Figure 4. MicroXCT-400 CT Scanner.
Processes 14 02195 g004
Figure 5. Relationship between initial porosity and degree of injury.
Processes 14 02195 g005
Figure 6. Distribution curve of pore throat radius before and after sulfur deposition experiment for different samples.
Processes 14 02195 g006aProcesses 14 02195 g006b
Figure 7. Post-experimental energy spectrum analysis and energy spectrum element distribution of #2 sample.
Processes 14 02195 g007
Figure 8. Post-experimental energy spectrum analysis and energy spectrum element distribution of #29 rock sample.
Processes 14 02195 g008
Figure 9. 3D structural model of #2 and #15 rock samples.
Processes 14 02195 g009
Figure 10. 3D structural model of #22 and #29 rock samples.
Processes 14 02195 g010
Figure 11. #2 Sample and #15 Sample pore throat radius variation before and after experiments.
Processes 14 02195 g011
Figure 12. #22 Sample and #29 Sample pore throat radius variation before and after experiments.
Processes 14 02195 g012
Figure 13. Effect of different water saturations on permeability.
Processes 14 02195 g013
Table 1. Physical parameters of experimental core samples.
NumberSample NumberLengthDiameterPorosityPermeabilityExperimental Content
(mm)(mm)(%)(mD)
1#14.892.546.577.820Non-water–sulfur deposition experiments
2#24.952.5412.2829.700Water–sulfur deposition experiment
3#64.952.5415.595.290Water–sulfur deposition experiment
4#113.952.548.262.570Water–sulfur deposition experiment
5#154.972.549.717.530Water–sulfur deposition experiment
6#224.452.543.290.019Water–sulfur deposition experiment
7#294.942.541.780.063Water–sulfur deposition experiment
8#104.932.5412.2629.510Nitrogen comparison experiment control
9#194.912.542.050.009Nitrogen comparison experiment control
Table 2. Experimental gas components.
ComponentsH2SH2HeCO2C1C2
Content (mol%)15.271.020.038.4575.20.03
Table 3. Experimental parameters for sulfur deposition injury at different water saturation levels.
NumberSample NumberWater Saturation
(%)
Pressure at Inlet Side (MPa)Pressure at Outlet Side (MPa)Pressure Difference
(MPa)
1#1016.915.41.5
2#640.5916.915.41.5
3#1165.1416.915.41.5
4#1523.8916.915.41.5
Table 4. Experimental parameters of sulfur deposition damage at different pressure differences.
NumberSample NumberPressure at Inlet Side (MPa)Pressure at Outlet Side (MPa)Pressure Difference
(MPa)
1#215.912.93
2#2215.913.42.5
3#2915.913.92
4#615.914.41.5
Table 5. Experimental parameters of the control group.
NumberSample NumberWater Saturation
(%)
Pressure at Inlet Side (MPa)Pressure at Outlet Side (MPa)Pressure Difference
(MPa)
1#1023.2416.915.41.5
2#1952.7616.914.92
Table 6. Changes in permeability of core samples before and after sulfur depositional injury experiments.
Sample NumberExperimental FluidsPermeability (mD)Absolute Value of Permeability Difference
(mD)
Decrease in Permeability (%)
Pre-ExperimentalPost-Experimental
#1High-sulfur gas7.8206.6901.13014.5
#2High-sulfur gas29.70020.8488.85229.8
#6High-sulfur gas5.2904.7500.54010.2
#11High-sulfur gas2.3292.0900.23910.3
#15High-sulfur gas7.5306.6400.89011.8
#22High-sulfur gas0.0190.0140.00423.5
#29High-sulfur gas0.0630.0500.01320.0
#10Nitrogen29.51029.5300.020−0.1
#19Nitrogen0.0090.0090.0000.0
Table 7. Changes in porosity of rock samples before and after sulfur deposition injury experiments.
Sample NumberExperimental FluidsPorosity (%)Absolute Value of Porosity DifferenceDecrease in Porosity (%)
Pre-ExperimentalPost-Experimental
#1High-sulfur gas6.575.790.7811.9
#2High-sulfur gas12.2811.151.139.2
#6High-sulfur gas15.5915.340.251.6
#11High-sulfur gas8.268.140.121.5
#15High-sulfur gas9.849.580.262.6
#22High-sulfur gas3.293.020.278.1
#29High-sulfur gas1.781.650.137.1
#10Nitrogen12.2612.250.010.1
#19Nitrogen2.052.050.000.0
Table 8. Post-experimental elemental occupancies of samples.
Elemental Composition
Number
S (%)O (%)Na (%)Ca (%)Mg (%)
#179.110.14.63.23.0
#283.25.23.42.45.8
#674.37.32.56.99.0
#1185.44.82.53.83.5
#1576.323.7000
#2240.621.08.511.218.7
#2967.217.95.84.74.4
Table 9. Effect of different differential pressures on the extent of sulfur deposition damage.
NumberSampleDifferential Pressure Between Inlet and Outlet
(MPa)
Decrease in Porosity (%)Decrease in Permeability (%)
1#61.51.610.2
2#2927.120.0
3#222.56.923.5
4#239.229.8
Table 10. Effect of different water saturations on the extent of sulfur deposition injury.
NumberSampleWater Saturation (%)Decrease in Porosity (%)Decrease in Permeability (%)
11#011.914.5
2#1523.892.611.8
3#640.591.610.2
4#1165.141.510.3
Disclaimer/Publisher’s Note: The statements, opinions and data contained in all publications are solely those of the individual author(s) and contributor(s) and not of MDPI and/or the editor(s). MDPI and/or the editor(s) disclaim responsibility for any injury to people or property resulting from any ideas, methods, instructions or products referred to in the content.