Article

Simulation of Oxygen-Enriched Combustion Characteristics of Different Biomass Circulating Fluidized Beds Based on CPFD Model


1
Northeast Electric Power Design Institute Co., Ltd. of China Power Engineering Consulting Group, Changchun 130021, China
2
School of Energy and Power Engineering, Northeast Electric Power University, Jilin 132012, China
3
Engineering Research Centre of Oil Shale Comprehensive Utilization, Ministry of Education, Northeast Electric Power University, Jilin 132012, China
*
Author to whom correspondence should be addressed.
Processes 2026, 14(13), 2124; https://doi.org/10.3390/pr14132124
Submission received: 26 May 2026 / Revised: 18 June 2026 / Accepted: 26 June 2026 / Published: 29 June 2026

Abstract

Biomass oxy-fuel combustion based on circulating fluidized bed (CFB) technology is one of the important pathways to achieving carbon neutrality due to its potential in carbon capture and negative carbon emissions. Combining biomass, as a substitute for coal, with oxy-fuel combustion technology can enrich CO2 while helping to control NOx emissions and carbon stock. In this study, a three-dimensional numerical model of a 20 t/h biomass CFB boiler was established based on the computational particle fluid dynamics (CPFD) method. Under an oxy-fuel atmosphere of 30% O2/65% CO2/5% H2O, the combustion characteristics of three typical biomass fuels—corn straw, rice husk, and poplar wood—were systematically compared, with emphasis on the furnace temperature distribution and the formation and emission of CO, NOX, and SO2. The results show that the axial temperature profiles all exhibit a rapid increase to a peak, followed by a gradual decrease. The peak temperatures in descending order are poplar wood (1091 K), corn straw (1084 K), and rice husk (1047 K), and the differences are mainly attributed to variations in volatile content, ash content, and calorific value. CO is primarily concentrated in the dense phase zone; it increases first and then decreases along the furnace height. CO generated from poplar wood combustion has the highest concentration at the furnace outlet, while the steady-state outlet mass fraction of NO is the lowest for poplar wood. Corn straw combustion yields the highest NO emission. Overall, the carbon stock of the three fuels is very low, and total CO emission is extremely low. NO concentration is jointly regulated by fuel nitrogen content and CO reduction, while SO2 emission is directly related to fuel sulfur content—corn straw and rice husk show significantly higher SO2 emission than poplar wood due to their higher sulfur content. In summary, fuel characteristics play a decisive role in the temperature field and pollutant formation during oxy-fuel combustion. This study provides a theoretical basis for the fuel selection and operational optimization of biomass oxy-fuel CFB boilers.

1. Introduction

The escalating challenge of global climate change is accelerating the transition of energy systems toward low-carbon pathways. As a carbon-containing renewable energy source, biomass offers both carbon neutrality and the potential for negative emissions. When integrated with carbon capture, utilization, and storage (CCUS), it forms a Bioenergy with Carbon Capture and Storage (BECCS) framework—a critical pathway toward net-zero targets. Bioenergy is currently the largest renewable energy source, accounting for approximately 10% of the global total primary energy supply [1], and its consumption is projected to reach around 100 EJ by 2050, representing roughly 20% of global energy demand under net-zero scenarios [2]. Nevertheless, biomass fuels are inherently characterized by low calorific value, high moisture content, and substantial compositional variability [3], posing formidable challenges for large-scale efficient and clean utilization, combustion stability, and pollutant control.
Oxy-fuel combustion replaces air with high-purity oxygen and regulates combustion temperature via flue gas recirculation, yielding flue gas with CO2 concentrations exceeding 90% and substantially reducing the energy penalty and cost of carbon capture. Notable advances in biomass oxy-fuel combustion have been reported: Sher et al. demonstrated a CO2 recovery rate of 96.24%, with approximately 70% flue gas recirculation [4]; Zhang et al. showed that oxy-fuel combustion mitigates heat loss while enhancing combustion stability and boiler efficiency [5]; and Ling et al. reported that pulverized fuel systems generally exhibit better performance than circulating fluidized beds under oxy-fuel combustion conditions; however, with increasing oxygen concentration, circulating fluidized beds can demonstrate comparable performance to pulverized fuel systems [6]. However, biomass oxy-fuel combustion exhibits diverse behaviors across 750–1500 °C, and temperature analysis alone cannot fully elucidate the underlying mechanisms without considering the coupled effects of heat transfer, reaction kinetics, and gas–solid hydrodynamics. Moreover, existing studies have predominantly focused on single biomass feedstocks or coal–biomass co-firing, whereas systematic cross-comparisons of different biomass types under identical oxy-fuel atmospheres remain scarce.
Among the limited studies on biomass oxy-fuel combustion, clear feedstock-dependent differences have been documented. Riaza et al. reported that woody and herbaceous biomass exhibited significantly different burnout behaviors under oxy-fuel conditions, with herbaceous fuels showing higher reactivity due to elevated volatile matter content [7]. Yuzbasi et al. investigated the oxy-fuel combustion of olive residue, almond shell, and corn straw, finding that ash-rich feedstocks delayed char combustion and altered NOx emission profiles [8]. Wang et al. demonstrated in a laboratory-scale fluidized bed that rice husk, owing to its high ash content, generated substantially different temperature distribution and gas emission patterns compared with poplar wood [9]. Cardozo et al. further showed that the relative conversion of fuel-S to SO2 varied among different biomass types, which directly affected the final SO2 emission levels [10]. These studies, however, were conducted under different reactor configurations or varying oxygen concentrations, and a systematic comparison of multiple biomass feedstocks under strictly identical oxy-fuel conditions in an industrial-scale CFB has not been reported.
Circulating fluidized bed (CFB) combustion offers broad fuel flexibility, high efficiency, and superior heat and mass transfer, enabling stable operation at 800–900 °C and effective handling of high-ash, high-moisture biomass. Extensive numerical and experimental investigations have been conducted. Yang et al. developed a three-dimensional CFD model for industrial-scale CFB biomass combustion using an Eulerian–Lagrangian framework, with predicted temperatures agreeing well with measurements [11]. Wang et al. applied the CPFD method to a 130 t/h CFB boiler to elucidate the influence of coal–biomass blending ratios on O2, CO2, NOx, and SO2 concentrations [12]. Nukkhong et al. constructed a CFD-based digital twin of a co-firing CFB boiler, systematically revealing fuel type and blending ratio effects on bed temperature, heat flux, and gaseous emissions [13,14]. Guo et al. developed a dynamic prediction model based on the theory of burning carbon particles, clarifying NOx emission patterns under load fluctuations [15]. Zhang et al. further demonstrated the significant impact of fuel properties on combustion behavior in dedicated biomass-fired CFB boilers [16]. Despite these advances, most existing studies operate under conventional air-firing conditions, inherently constrained by low flue gas CO2 concentrations and high carbon capture costs.
Oxy-fuel CFB combustion integrates the high-efficiency carbon capture of oxy-fuel technology with the fuel flexibility of CFB and is regarded as one of the most promising CCUS routes. Research by Chen et al. progressed from the laboratory to industrial scale, with inlet O2 concentrations increasing from 21–30% to over 50%, covering fuels including coal, biomass, sewage sludge, and oil shale [17,18]. Kosowska-Golachowska et al. experimentally investigated three biomass types in an O2/CO2 atmosphere in a laboratory-scale CFB, finding that under 30% and 40% O2, N2O and CO emissions decreased while NO and SO2 increased [19,20]. Moreno et al. studied the combustion of hard coal, wheat straw, and solid recovered fuel in a 200 kWth calcium-looping CFB calciner, observing stable hydrodynamics across varying blending ratios and inlet O2 concentrations [21]. Ling et al. developed an integrated biomass oxy-fuel CFB combustor with a supercritical CO2 cycle, demonstrating the potential to offset the CCS energy penalty through process simulation and economic assessment [22,23]. Nevertheless, systematic comparative investigations of diverse biomass feedstocks under identical oxy-fuel atmospheres remain critically scarce, and the mechanistic influence of interspecies variations in volatile matter, fixed carbon, and ash composition on temperature field, gas-phase species evolution, and pollutant formation pathways has yet to be substantiated by in-depth numerical simulation.
Oxy-fuel CFB combustion integrates the high-efficiency carbon capture of oxy-fuel technology with the fuel flexibility of CFB and is regarded as one of the most promising CCUS routes. The adoption of oxy-fuel combustion in this study is not merely a contrast to conventional air combustion but is driven by its direct relevance to BECCS-oriented biomass utilization. By replacing N2 with CO2/H2O, oxy-fuel combustion produces a CO2-rich flue gas suitable for carbon capture while substantially modifying heat transfer, volatile oxidation, char conversion, and pollutant formation. These effects are especially important for biomass fuels with distinct volatile matter, fixed carbon, and ash characteristics, making it necessary to evaluate rice straw, rice husk, and poplar wood under identical oxy-fuel CFB conditions.
A systematic numerical comparison of distinctly different biomass types—herbaceous, woody, and high-ash agricultural residues—under identical oxy-fuel conditions in an industrial-scale CFB is still lacking. In particular, the mechanistic influence of fuel-specific properties on temperature field, gas-phase species evolution, and pollutant formation remains poorly understood. To fill this gap, this study numerically investigates the oxy-fuel combustion of rice straw, rice husk, and poplar wood under an identical 30% O2/65% CO2/5% H2O atmosphere using the Computational Particle Fluid Dynamics (CPFD) approach. A three-dimensional industrial-scale CFB model is developed, and the combustion processes are systematically simulated under consistent operational parameters. The influence of fuel characteristics on temperature distribution, species concentration profiles, and pollutant formation is analyzed to elucidate the mechanistic effects of biomass type on oxy-fuel combustion behavior, thereby providing a theoretical basis for fuel selection, operational optimization, and industrial scale-up.

2. Numerical Simulation Methodology and Model Development

2.1. Fuel Properties and Boiler Geometry

2.1.1. Biomass Fuel Properties

The proximate and ultimate analyses of the biomass fuels were conducted in accordance with Chinese national standards. Proximate analysis parameters, including moisture, volatile matter, ash, and fixed carbon contents, were determined according to GB/T 28731-2012 [24]. Total moisture content was measured according to the GB/T 28733-2012 [25] specifications for the determination of total moisture for solid biomass fuels. Total sulfur content was quantified in compliance with the GB/T 28732-2012 [26] method for the determination of total sulfur in solid biomass fuels. Carbon and hydrogen contents were determined following the GB/T 28734-2012 [27] determination method for carbon and hydrogen in solid biomass fuels. Nitrogen content was measured according to the GB/T 30728-2014 [28] specifications for the determination of nitrogen in solid biomass fuels. The oxygen content was calculated by difference. The proximate analysis is reported on an as-received basis, whereas the ultimate analysis is presented on a dry ash-free basis, as summarized in Table 1.

2.1.2. Geometric Model

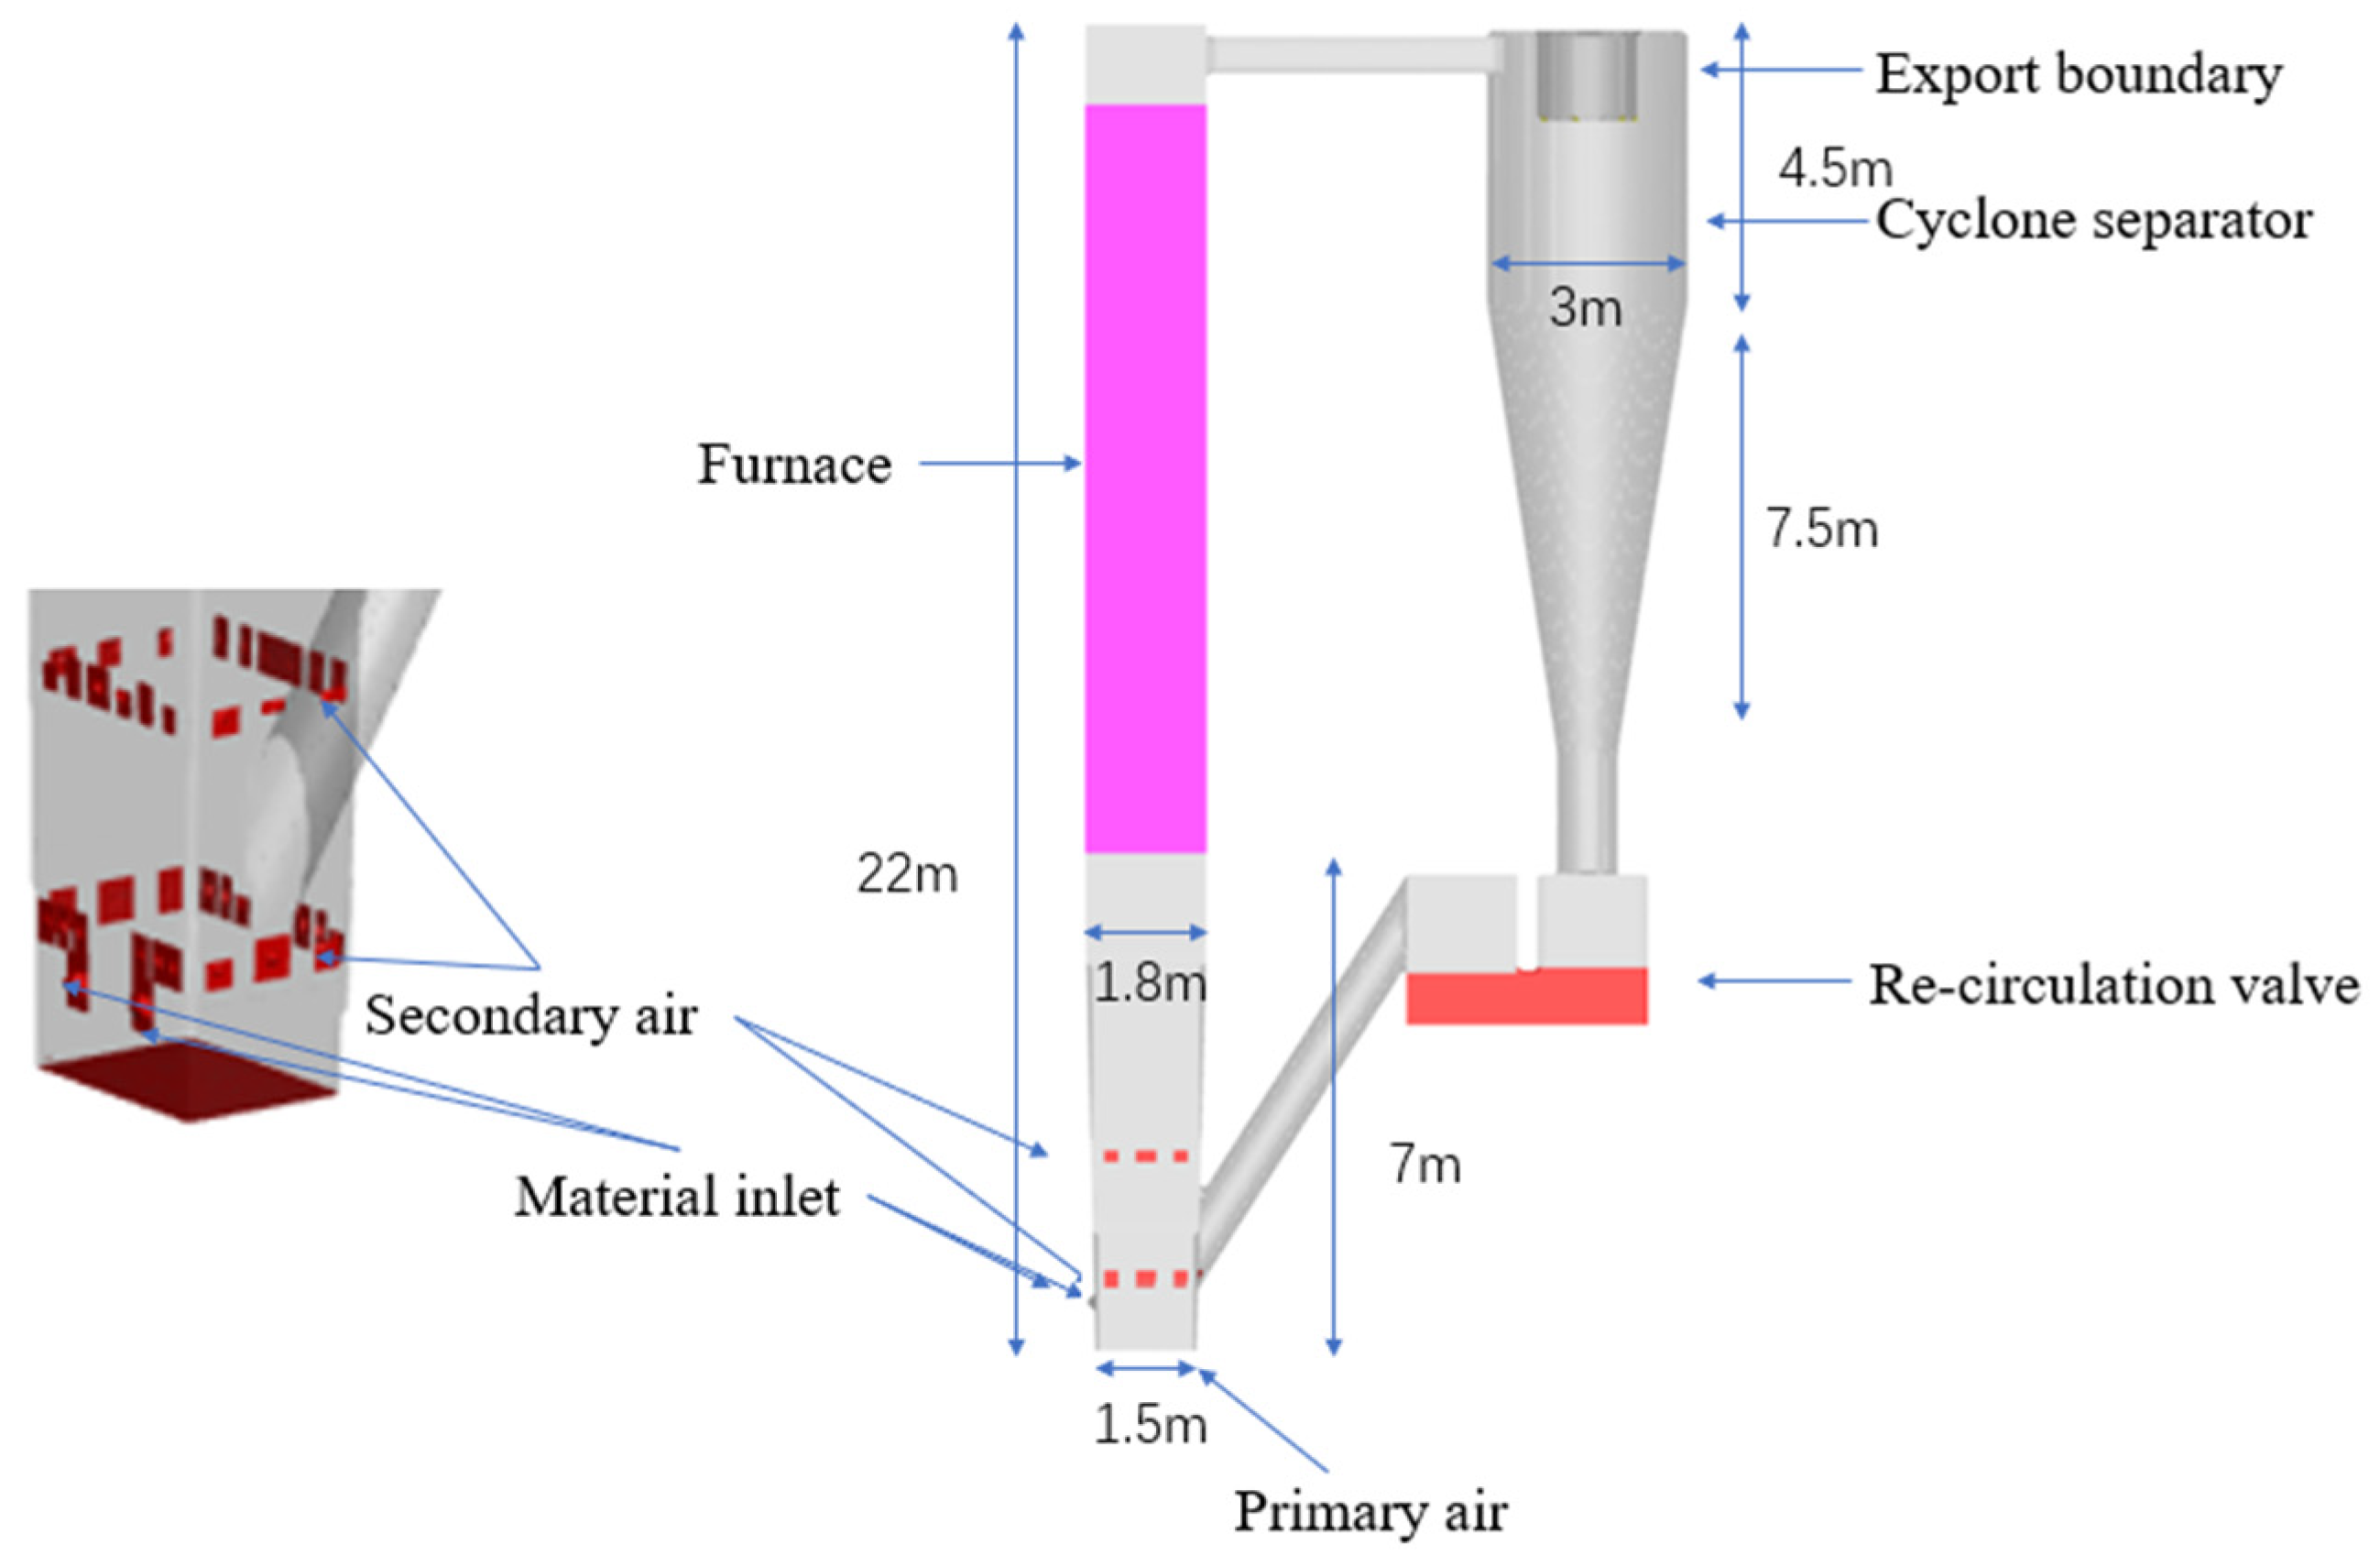
The present simulation is based on the geometric configuration of a 20 t/h (steam output) biomass-fired circulating fluidized bed (CFB) boiler, as shown in Figure 1. The primary components of the model include the fluidized bed furnace (comprising a dense phase zone in the lower section and a dilute phase zone in the upper section), a cyclone separator, a standpipe, and a loop seal (or non-mechanical return valve). Primary air is introduced into the furnace through the air distributor plate located at the bottom, while secondary air is injected via multiple ports situated in the upper region of the dense phase zone.

2.2. Mathematical Model and Governing Equations

In this study, three-dimensional, transient, multiphase flow numerical simulations were performed using the commercial CPFD software Barracuda VR 17.0. Barracuda is a numerical simulation platform based on the Computational Particle Fluid Dynamics (CPFD) methodology, with the Multiphase Particle-in-Cell (MP-PIC) approach at its computational core. This method enables fully coupled calculations between the continuous fluid phase and the high-concentration, discrete particle phase within a three-dimensional domain, thereby efficiently resolving complex gas–solid two-phase flow and reaction problems encountered in equipment such as circulating fluidized beds.
The MP-PIC method employs a hybrid Eulerian–Lagrangian framework. For the gas-phase simulation, the three-dimensional, unsteady Navier–Stokes equations are solved based on the Eulerian approach, wherein turbulence models such as Large Eddy Simulation (LES) can be incorporated to accurately capture gas-phase flow structures [29]. For the particle-phase simulation, computational parcels—each representing a cluster of real particles with identical properties—are tracked using the Lagrangian approach [30]. Each computational parcel possesses independent attributes, including position, velocity, temperature, and species composition, thereby maintaining simulation fidelity while substantially enhancing computational efficiency.
The core strength of this method resides in the two-way coupling between the gas and solid phases: the gas phase influences particle motion through forces such as drag and buoyancy, whereas the particle phase provides feedback to the gas-phase-governing equations in the form of source terms, thereby achieving real-time phase interaction. The software further integrates models for particle collision, heat and mass transfer, and chemical reaction kinetics, enabling the simulation of both the physical transformations and chemical reaction processes of particles. This multiscale simulation capability renders Barracuda particularly well-suited for modeling industrial systems—such as biomass oxy-fuel combustion in circulating fluidized beds—that are characterized by high particle concentrations, broad particle size distributions, complex particle morphologies, and intense chemical reactions. It thus provides an effective tool for both mechanistic investigations and engineering optimization [31].

2.2.1. Gas-Phase Governing Equations

Gas-phase continuity equation:
θ g ρ g t + θ g ρ g u g = 0
where θ g is the gas-phase volume fraction; ρ g is the gas-phase density; and u g is the gas-phase velocity vector.
Gas-phase momentum equation:
θ g u g t + θ g u g u g = 1 ρ g P 1 ρ g F + θ g g + 1 ρ g τ
where P is the gas-phase pressure; F is the macroscopic stress tensor of the gas phase; and τ is the rate of momentum exchange per unit volume between the gas and particle phases.
The macroscopic stress tensor of the gas phase, F, is expressed as follows:
F = f V p ρ p D u g u p 1 ρ p P d V p d p d u p

2.2.2. Particle-Phase Governing Equations

The momentum equation for the particle phase is expressed as follows:
d u p d t = D u g u p 1 ρ p P + g 1 θ p ρ g τ p
where u p is the particle velocity; ρ p is the particle density; and τ p is the particle-phase normal stress.
This equation characterizes the particle acceleration resulting from the combined effects of fluid-phase drag, pressure gradient, gravity, and the gradient of normal stress within the particle phase.
The particle volume fraction within a given computational grid cell is determined using the following expression:
θ p = f V p d p d u p
The particle normal stress equation is primarily employed to resolve particle–particle collisions and is formulated as
τ = P s θ p β max θ c p θ p , ε 1 θ p
where P s is a material-specific constant; β is a model parameter typically ranging between 2 and 5; θ c p is the particle volume fraction at close packing; and ε is a small quantity introduced to eliminate singularities during numerical computation.

2.2.3. Drag Model

In the CPFD methodology, the drag force between the fluid phase and the particle phase is expressed as follows:
D s = C d 3 ρ g 8 ρ s u f u s r s
where D s is the drag function; u f is the fluid velocity vector; and u s is the particle velocity vector.
The Barracuda software provides multiple options for calculating the drag coefficient Cd, including the constant model, Stokes model, Wen–Yu model, Ergun model, Wen–Yu/Ergun blended model, and EMMS-Yang-2004 model. After a comprehensive evaluation of findings reported in the relevant literature, the Wen–Yu/Ergun drag model was selected for the numerical simulations conducted in this study [32,33]. This blended model integrates the characteristics of both the Wen–Yu model and the Ergun model, thereby maintaining satisfactory computational accuracy across a broad range of particle sizes and enabling effective simulation of the distribution characteristics in both the dense and dilute phases within circulating fluidized bed boilers.
The Wen–Yu/Ergun drag model is formulated as follows:
θ p > 0.85 θ c p           D = D p 2
0.85 θ c p θ p 0.75 θ c p           D = θ p 0.85 θ c p 0.85 θ c p 0.75 θ c p D p 2 D p 1 + D p 1
θ p < 0.75 θ c p           D = D p 1
In the above expressions, D p 1 denotes the drag force calculated by the Wen–Yu model, and D p 2 denotes the drag force calculated by the Ergun model.

2.2.4. Heat Transfer Equations

In circulating fluidized bed boilers, heat transfer within the furnace is dominated by radiation and convection, with radiative heat transfer playing the predominant role. When solving radiative heat transfer, the Barracuda software accounts for radiation between particles and walls as well as between the fluid and walls, whereas particle-to-particle radiation is not considered.
The heat transfer rate is calculated using the following expression:
q w p = A w F w p ε w p σ T w 4 T p 4
where A w is the wall heat transfer area; F w p is a coefficient; ε w p is the effective emissivity between the particles and the wall; σ is the Stefan–Boltzmann constant; T w 4 is the wall temperature; and T p 4 is the mass-weighted average particle temperature within a given computational cell.
The effective emissivity ε w p is expressed as
ε w p = 1 ε p + 1 ε w 1 1
where ε w is the wall emissivity and ε p is the volume-weighted average particle emissivity.
Convective heat transfer between the fluid phase and the wall is determined as follows:
h f w = h l + f d h d
f d = 1 e 10 θ p / θ c r
where h l is the heat transfer coefficient in the dilute-phase region of the furnace; h d is the heat transfer coefficient in the dense-phase region; and f d represents the contact time between the fluid and the wall in the dense-phase region.
Convective heat transfer between the particle phase and the wall is determined as follows:
h p = c 0 Re L n 1 Pr 0.33 + c 1 k f d p + c 2
where c 0 , c 1 , c 2 , and n 1 are empirical constants; k f is the thermal conductivity of the fluid; and d p is the particle diameter.

2.2.5. Devolatilization Model

The volatile release rate, k, can be specified according to coefficients c 0 , c 1 , c 2 , c 3 , E and E 0 . The release rate expression takes the following form:
k = c 0 T c 1 P c 2 ρ f c 3 exp E / T + E 0
where T is the temperature (K); P is the pressure (Pa); ρ f is the fluid density (kg/m3); E is the activation energy (K); and E 0 is an additional Arrhenius activation energy term. The release rate has units of s−1.
The rate of change of volatile mass due to release is given by
m volatiles d t = k m volatiles

2.2.6. Reaction Kinetics Model

The CPFD methodology employs simplified chemical reaction schemes to simulate key in-furnace processes, with the relevant reaction rate constants typically derived from experimental data. Within the Barracuda software, chemical reactions are primarily handled according to two approaches: the discrete reaction model, which focuses on the physical and chemical attributes of individual particles and is suitable for describing heterogeneous reactions of the particle phase, and the volume-averaged reaction model, which is based on averaged properties within grid cells and is better suited for simulating homogeneous gas-phase reactions, catalytic reactions, and other heterogeneous reactions.
The combustion reaction models and associated kinetic parameters used in this work are presented in the subsequent text and Table 2. The rate of biomass devolatilization is denoted as R9. The model assumes that all fuel-bound nitrogen resides within the volatile matter and is released in the form of precursor species such as NH3, which subsequently participate in oxidation pathways leading to NOx formation. This simplification has a limited impact on the accuracy of the simulation results. Given that NO typically accounts for over 95% of total NOx emissions, the present study only simulates the formation and reduction pathways of NO.
NOx formation primarily originates from three distinct mechanisms: thermal NOx and prompt NOx, both resulting from the oxidation of atmospheric nitrogen at elevated temperatures, and fuel NOx, which arises from the oxidation of nitrogen-containing compounds within the fuel. The operating temperature of circulating fluidized bed boilers is generally maintained below 1000 °C, under which conditions the formation of thermal NOx is negligible and the contribution of prompt NOx typically accounts for only approximately 3%. Consequently, these two pathways are excluded from consideration in the present simulation. Fuel NOx constitutes the predominant source of NOx in circulating fluidized bed boilers, and its formation and reduction mechanisms are the primary focus of this investigation. The oxidation pathways of precursors derived from volatile nitrogen conversion are presented in the literature [34], and other reactions are detailed below. In Table 2, m s denotes the mass fraction.
C + H 2 O C O + H 2
2 C + O 2 2 C O
C O + H 2 C + H 2 O
C O + 0.5 O 2 C O 2
C O + H 2 O C O 2 + H 2
C H 4 + O 2 C O 2 + 2 H 2
H 2 S + 1.5 O 2 S O 2 + H 2 O
2 N H 3 + 2.5 O 2 2 N O + 3 H 2 O
H 2 + 0.5 O 2 H 2 O
V o l a t i l e s C H 4 + C O + C O 2 + H 2 + H 2 S + 2 N H 3 + H C N + H 2 O
B i o m a s s V o l a t i l e   m a t t e r + F i x e d   c a r b o n + A s h + M o i s t u r e

2.3. Grid Independence Verification and Simulation Case Setup

2.3.1. Grid Independence Verification

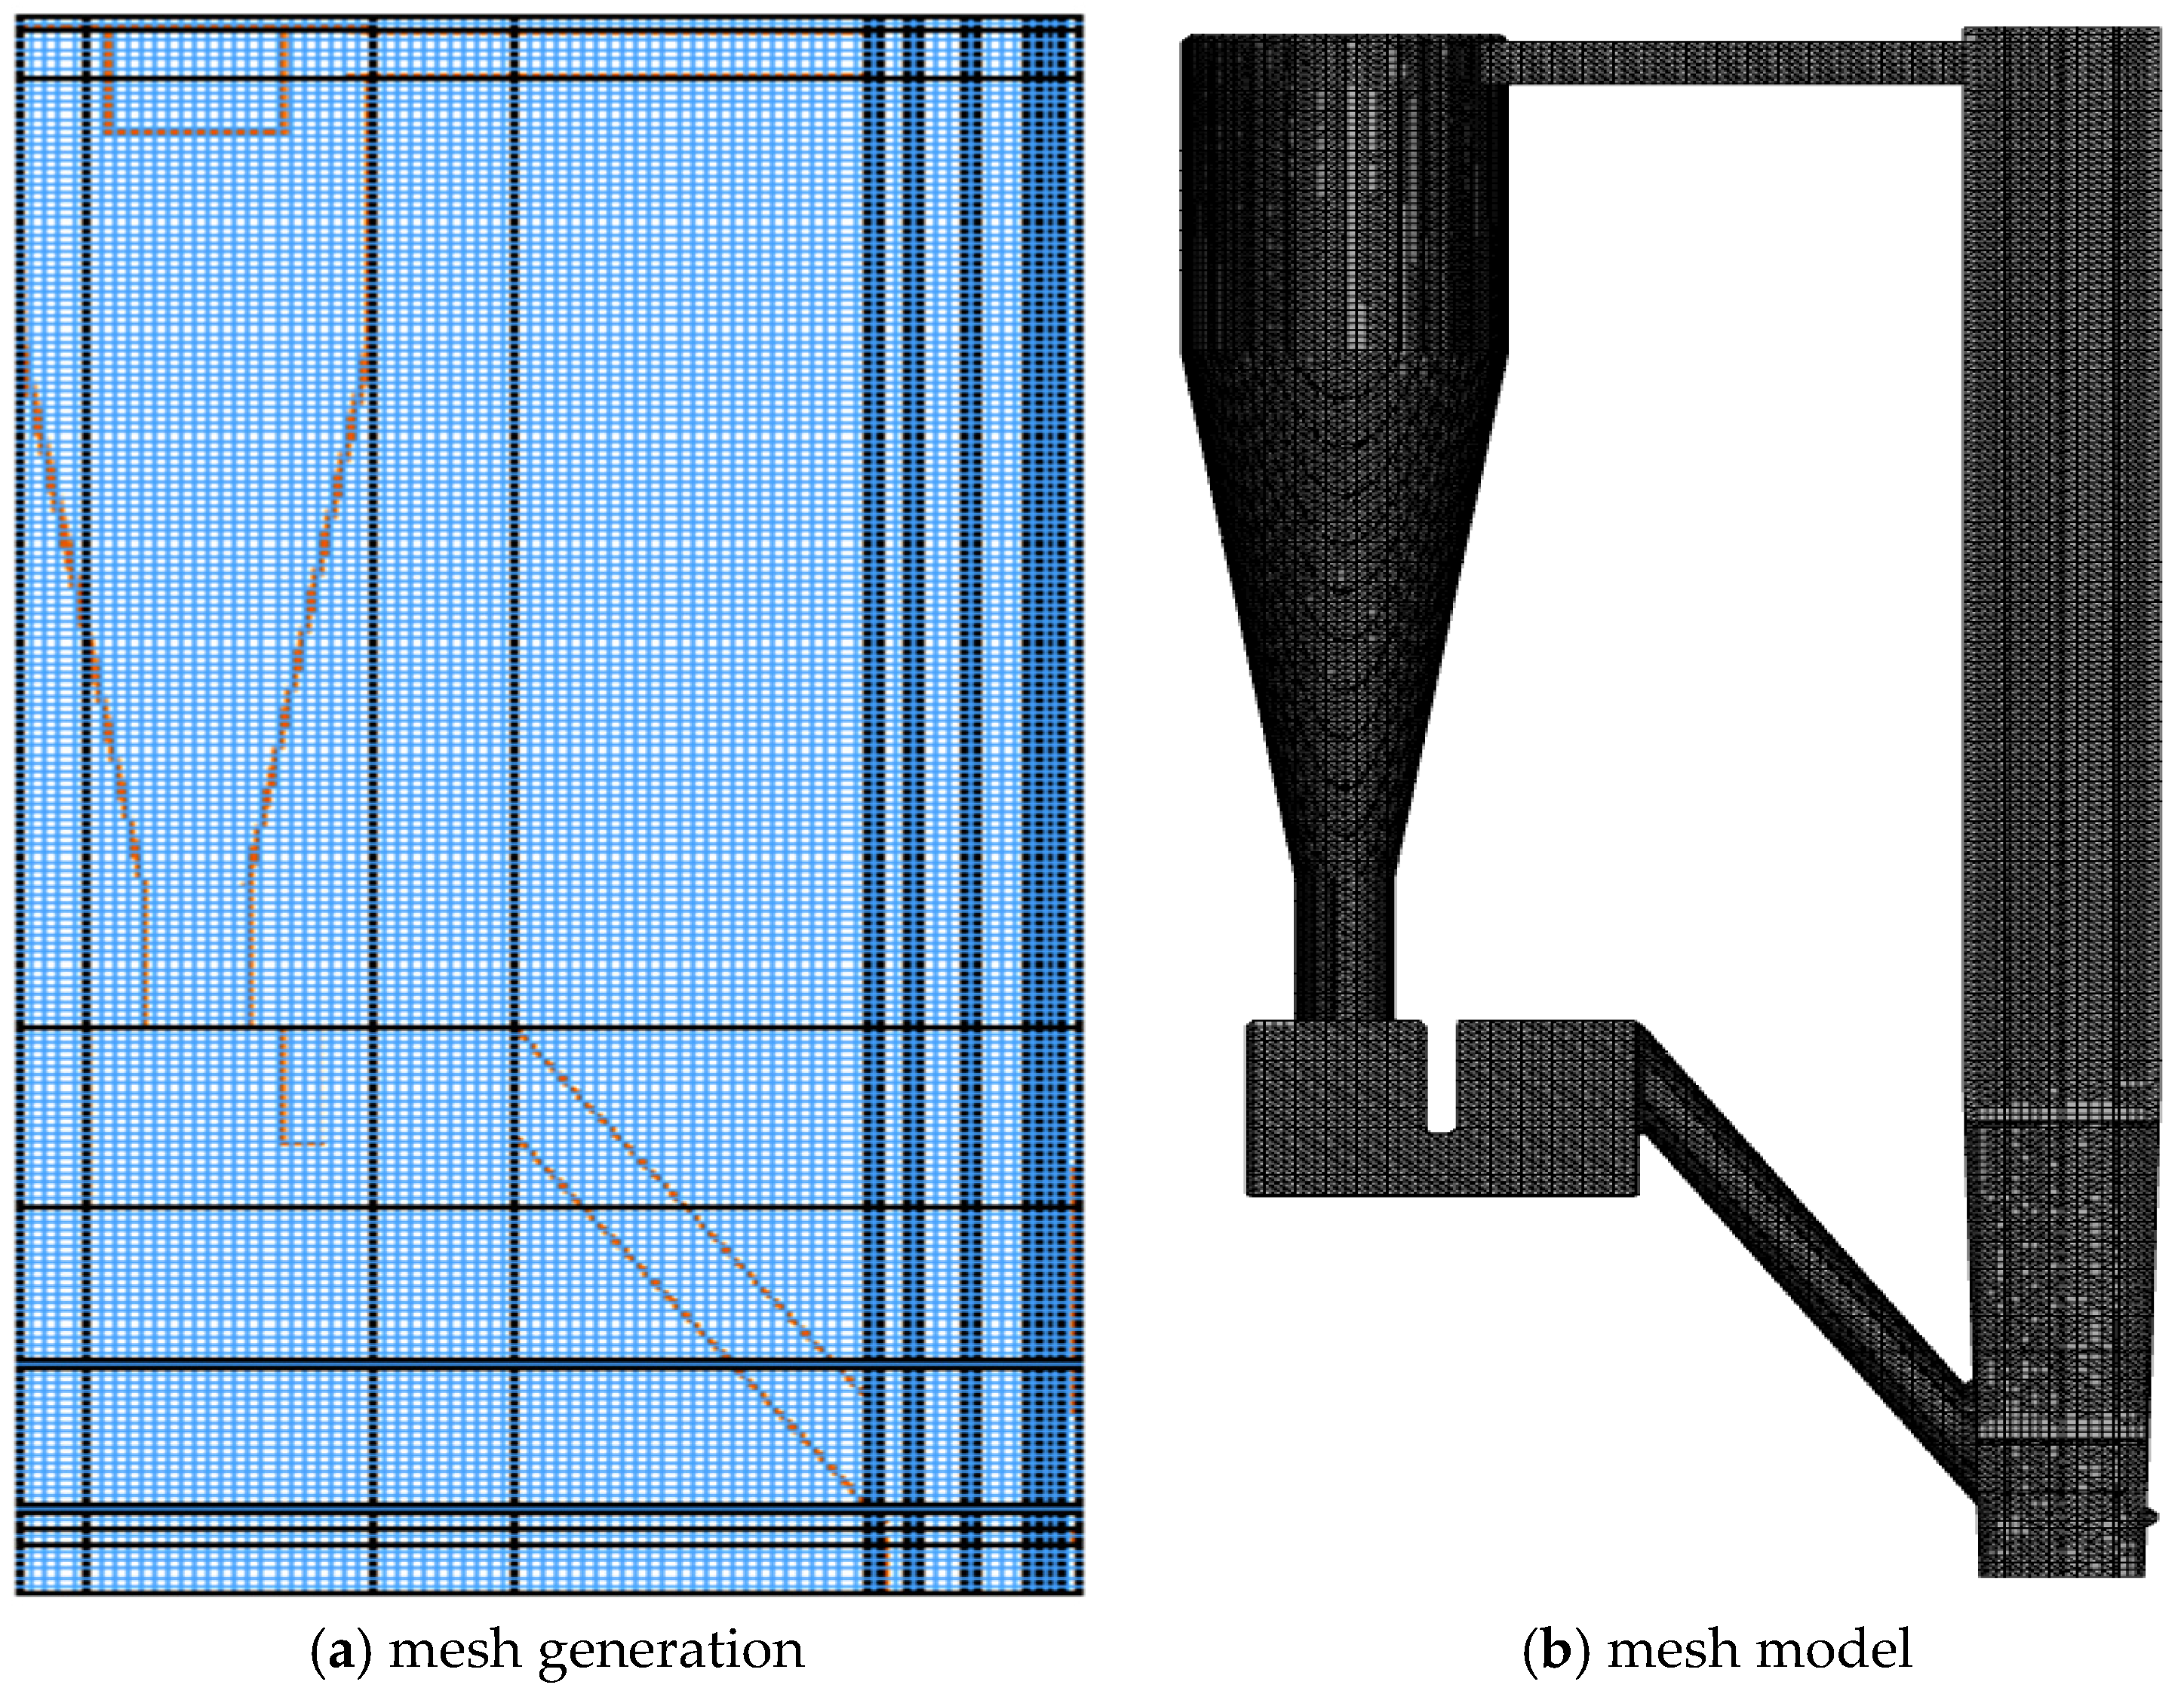
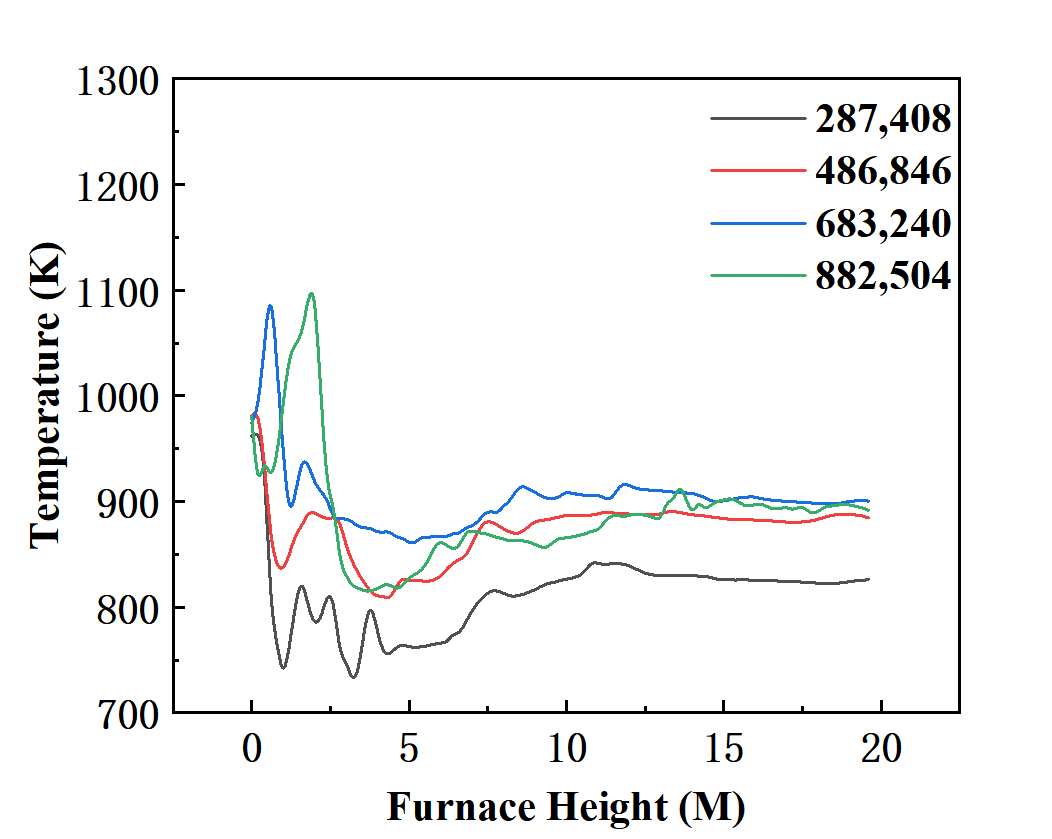
The computational domain was discretized using a Cartesian grid with adaptive refinement capabilities, as illustrated in Figure 2. To achieve an optimal balance between computational accuracy and efficiency, local grid refinement was implemented in critical regions, including the air distributor plate, the secondary air injection zone, the cyclone separator, and the loop seal. Grid independence verification was performed using four grid resolutions with cell counts of 287,408, 486,846, 683,240, and 882,504, respectively, with a fixed time step of 0.001 s. The verification was conducted by monitoring the temperature distribution along the furnace height direction [35], as illustrated in Figure 3.
As evident from the figure, when the grid count was below 486,846, excessive fluctuations were observed within the dense-phase zone, accompanied by substantially lower predicted temperatures. This indicates that coarser grid resolutions are incapable of accurately capturing the complex chemical reaction processes occurring in the dense-phase region of the boiler. In contrast, the simulation results obtained with grid counts of 683,240 and 882,504 exhibited close agreement. Consequently, taking into consideration both the accuracy of the simulation results and the associated computational cost, a grid resolution comprising 683,240 cells was selected for all subsequent simulations.
To eliminate the influence of mesh number on the numerical results, a grid independence verification was conducted under a representative operating condition. Four meshes containing 287,408, 486,846, 683,240, and 882,504 cells were established for comparative analysis, while keeping the furnace geometry, fuel feeding rate, primary air flow rate, secondary air flow rate, wall heat transfer conditions, particle properties, and chemical reaction model unchanged. Figure 3 shows the temperature distribution along the furnace height under different mesh numbers. As shown in the figure, the furnace temperature predicted by the 287,408-cell mesh is generally lower than that obtained using the other three meshes, indicating that the coarse mesh is insufficient to resolve the furnace temperature field. With increasing mesh number, the temperature distribution gradually becomes stable. In particular, the temperature curves obtained using the 683,240-cell and 882,504-cell meshes nearly overlap in the middle and upper regions of the furnace, suggesting that further mesh refinement has only a limited influence on the temperature distribution in the main furnace region.
It should be noted that, in the lower furnace region of 0–3 m, the local temperature peaks differ among the meshes because this region is jointly affected by fuel feeding, primary-air fluidization, secondary-air jetting, and volatile release and combustion. Therefore, gas–solid flow and combustion reactions fluctuate strongly in this region. However, above 5 m, the temperature distributions predicted by the 683,240-cell and 882,504-cell meshes show good convergence. To further quantitatively evaluate the effect of mesh number on the calculation results, the finest mesh with 882,504 cells was taken as the reference, and the relative deviation of the furnace average temperature under different meshes was calculated. The results are listed in Table 3.
As shown in Table 3, compared with the 882,504-cell mesh, the furnace average temperature obtained with the 287,408-cell mesh differs by 65.6 K, corresponding to a relative deviation of 7.28%. This indicates that the mesh number is insufficient, and the calculation result is significantly affected by the mesh resolution. When the mesh number increases to 486,846, the relative deviation decreases to 3.12%, showing a clear improvement in the calculation result. When the mesh number further increases to 683,240, the furnace average temperature reaches 907.3 K, with a difference of only 6.6 K from the 882,504-cell mesh and a relative deviation of 0.73%. This indicates that further mesh refinement has a negligible influence on the furnace average temperature.
Although the 882,504-cell mesh can further improve the resolution of local regions, its mesh number is approximately 29.2% higher than that of the 683,240-cell mesh, which would significantly increase the computational time and resource consumption, while the furnace average temperature changes by only 0.73%. Therefore, considering both computational accuracy and computational cost, the 683,240-cell mesh was ultimately selected for the subsequent numerical simulations.

2.3.2. Operating Conditions and Case Setup

As summarized in Table 4 and Table 5, three simulation cases were established in this study to comparatively investigate the combustion and emission characteristics of different biomass feedstocks under identical oxy-fuel combustion conditions. An oxy-fuel atmosphere was employed as the combustion oxidizer for all three cases, with fixed volumetric fractions of 30% O2, 5% H2O, and 65% CO2 [36]. The biomass feeding rate was maintained constant at 1.06 kg/s across all cases.
The rationale for case selection is as follows: Case 1, utilizing corn straw, serves as the baseline condition. Case 2 employs rice husk, a feedstock with a substantially different lower heating value (HHV) but comparable nitrogen and sulfur contents relative to the baseline. This case is designed to elucidate the influence of variations in fuel heating value on temperature field distribution and pollutant species formation under conditions of similar elemental N and S contents. Case 3 employs poplar wood, which possesses a heating value similar to that of corn straw but differs markedly in nitrogen and sulfur contents. This case is intended to isolate the effects of elemental N and S variations on temperature field characteristics and pollutant emissions under conditions of comparable fuel heating value.
The proximate and ultimate analyses of the three biomass fuels—corn straw (Case 1), rice husk (Case 2), and poplar wood (Case 3)—are presented previously in Table 1.

2.4. Model Validation

The present work takes a 20 t/h biomass-fired circulating fluidized bed boiler under construction as the research object. A three-dimensional numerical model was established based on the fluidized bed structure, the fuels used, and the actual operating parameters to simulate and predict the oxy-fuel combustion process of biomass. The simulation results were validated by comparison with literature data to ensure the rationality of the model predictions. Existing studies on biomass combustion in circulating fluidized beds and oxy-fuel circulating fluidized beds have shown that the suitable combustion temperature of biomass fuels in circulating fluidized beds is generally concentrated within the range of 800–900 °C. Yi et al. conducted combustion experiments of rice husk in a circulating fluidized bed and showed that, under appropriate air-to-fuel ratios and primary/secondary air ratios, the furnace combustion temperature was mainly controlled within 800–850 °C [37]. Duan et al. investigated the co-combustion of biomass fuels such as rice husk, wood chips, and dry wood flour with coal in a 10 kWth oxy-fuel circulating fluidized bed, and the experimental temperature was approximately 850 °C [38]. Wang et al. studied the co-combustion of corn straw, wheat straw, and coal under a high-oxygen atmosphere in a circulating fluidized bed, with an experimental temperature range of 800–900 °C [39]. Kosowska-Golachowska et al. carried out combustion experiments for biomass fuels such as wheat straw, willow, and pine under air and O2/CO2 atmospheres in a bench-scale circulating fluidized bed, and the combustion temperature was also set at 850 °C [20]. In addition, Yang and Xu pointed out in the engineering design of a bulk biomass direct-fired circulating fluidized bed boiler that the furnace temperature of biomass fuels should be controlled below 820 °C, with the actual operating furnace temperature being approximately 810 °C [40].
The simulated average furnace temperatures for poplar, corn straw, and rice husk were 818 °C, 811 °C, and 774 °C, respectively. Among them, the temperature of the poplar case was 818 °C, which was slightly lower than the 850 °C reported for woody biomass combustion in oxy-fuel circulating fluidized beds, with a relative deviation of approximately 3.8%. It was also close to the actual operating temperature of 810 °C for an engineering biomass circulating fluidized bed boiler, indicating that the predicted temperature of the poplar case was within a reasonable range. The temperature of the corn straw case was 811 °C, which was comparable to the 800–900 °C range reported for oxy-fuel co-combustion of corn straw/wheat straw in a circulating fluidized bed and thus fell within a reasonable range. Compared with the typical experimental temperature of 850 °C, it was approximately 4.6% lower. The temperature of the rice husk case was 774 °C, which was slightly lower than the optimal combustion temperature range of 800–850 °C reported for rice husk combustion in a circulating fluidized bed. Considering the higher ash content and lower effective heat release intensity of rice husk in this study, as well as the fact that higher ash content enhances heat absorption by inert components and weakens the effective heat release per unit mass of fuel, the lower furnace temperature of the rice husk case compared with the poplar and corn straw cases is reasonable. From the perspective of fuel properties, poplar has a higher heating value and lower ash content, resulting in the highest simulated temperature; rice husk has the highest ash content and the lowest simulated temperature; and corn straw falls between the two. The temperature variation trend is consistent with the proximate and ultimate analysis results of the fuels. In summary, the furnace average temperatures predicted by the model are generally within or close to the reasonable ranges reported in existing studies on biomass circulating fluidized bed and oxy-fuel circulating fluidized bed combustion. The temperature differences among different biomass fuels can also be explained by differences in heating value, ash content, and volatile matter content, indicating that the established combustion model has a certain reliability in predicting furnace temperature.

3. Results and Discussion

3.1. Comparison of Temperature Distributions Among Different Biomass Fuels Under Identical Oxy-Fuel Atmosphere

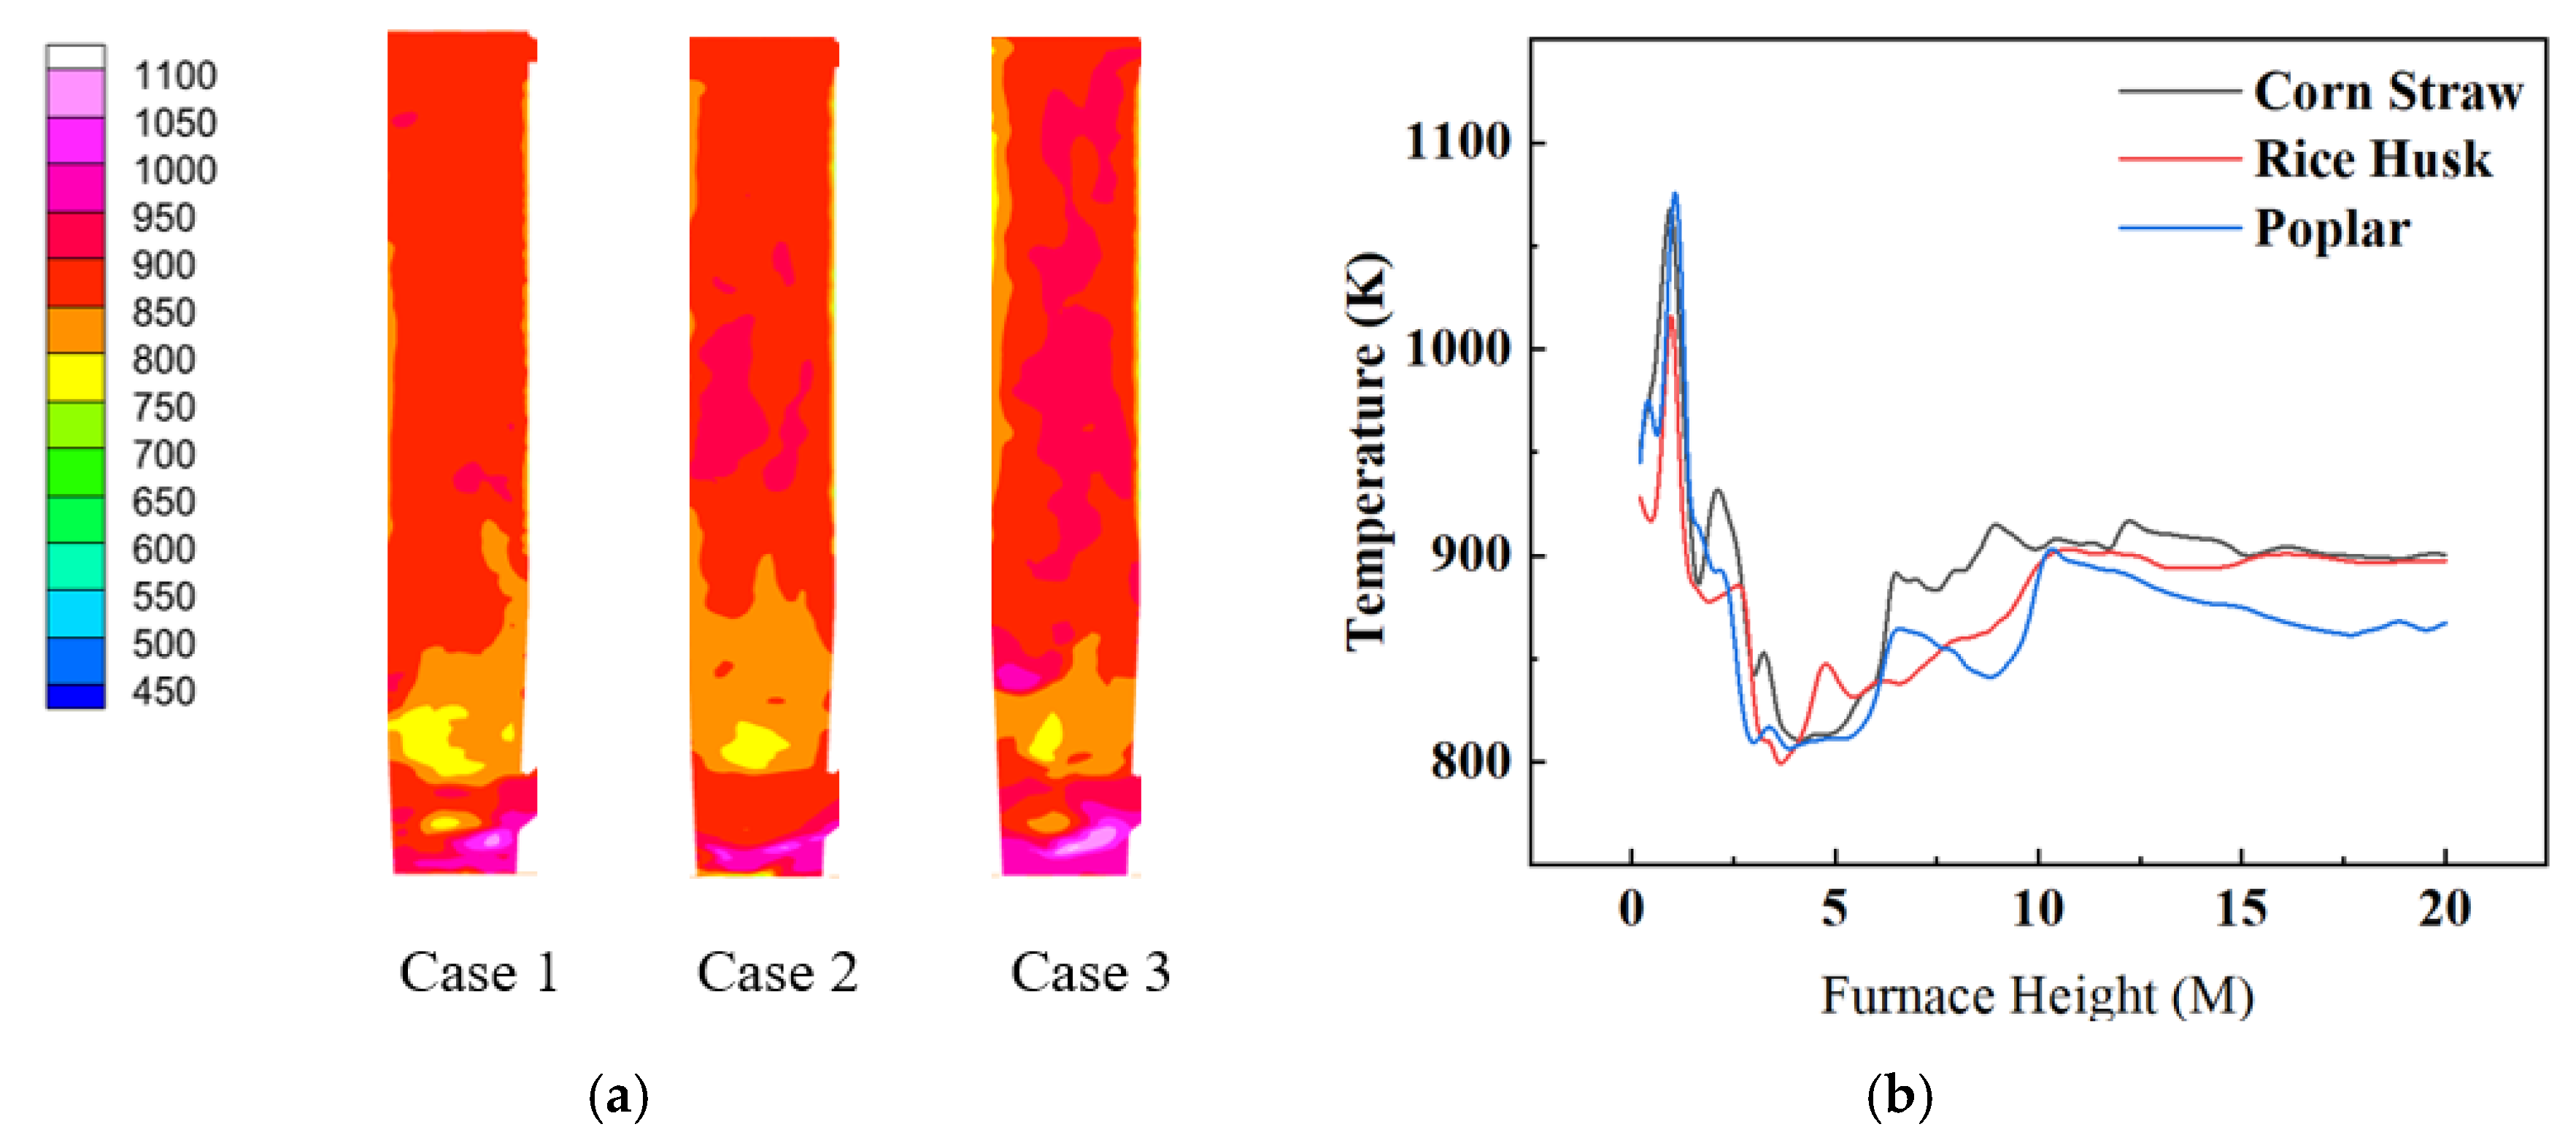
Figure 4a shows the furnace temperature distribution contours for three biomass fuels—corn straw, rice husk, and poplar wood—under oxy-fuel combustion conditions (this figure presents the cross-section at the furnace central plane). The contours indicate that the dense phase zone at the bottom of the furnace appears purplish red, while the dilute phase zone in the middle and upper sections appears reddish orange. This phenomenon can be explained as follows: in the dense phase zone, the solid particle concentration is extremely high, the fuel mixes vigorously with the high-temperature bed material, volatiles are rapidly released and combust intensely, and the majority of the heat is released, causing the temperature to rise sharply to a peak. In the dilute phase zone, the particle concentration decreases, the combustion heat release weakens and, meanwhile, the high-temperature flue gas and solid particles flow upward, while the water-cooled wall heating surfaces around the furnace begin to absorb a large amount of heat, causing the flue gas temperature to decrease gradually along the height direction and eventually stabilize. Although the contour trends are similar for the three cases, differences exist in the extent of the high-temperature core region. In the contours for poplar wood and corn straw, the high-temperature region in the dense phase zone is more concentrated, brighter, and located lower, whereas for rice husk, the high-temperature core region is relatively dispersed and the purplish red area is less distinct.
Figure 4b presents the corresponding axial temperature distribution curves along the furnace height for the three biomass fuels. For all three cases, the temperature along the furnace axis shows a trend of first rising rapidly to a peak, then decreasing slowly, and finally stabilizing. The combustion zone temperatures [41] for all three fuels are around 1050 K, with poplar wood exhibiting the highest peak temperature of 1091 K, followed by corn straw at 1084 K and rice husk at 1047 K. This difference is mainly attributed to variations in the proximate analysis, ultimate analysis, and calorific value among the three biomass fuels. Poplar wood has the highest volatile content (72.5%), moderate fixed carbon, extremely low ash, and high calorific value; therefore, it ignites easily, and its volatile combustion is intense and concentrated, exhibiting the highest combustion intensity and the highest overall furnace temperature level. Corn straw has the lowest volatile content (49.79%), the highest fixed carbon content (29.92%), and low ash content, resulting in an overall temperature level slightly lower than that of poplar wood. Rice husk possesses a loose structure and a comparatively low volatile content of 59%, the highest ash content, and moderate fixed carbon; it requires a longer time for combustion and burnout in the CFB, leading to the lowest combustion intensity. Thus, its temperature curve is lower overall than those of poplar wood and corn straw.
Under the same oxy-fuel atmosphere, the axial temperature profiles of the three biomass fuels all exhibit a distribution pattern of rising rapidly to a peak and then decreasing slowly. The high-temperature core region is concentrated in the dense phase zone. The peak temperature in descending order is poplar wood (1091 K), corn straw (1084 K), and rice husk (1047 K). The differences mainly originate from variations in volatile content, ash content, and calorific value of the biomass. Poplar wood shows the highest combustion intensity due to its high volatile content, extremely low ash, and high calorific value, while rice husk exhibits the lowest combustion intensity due to its lowest volatile content and highest ash content, resulting in the most dispersed temperature distribution.

3.2. CO Formation Characteristics of Different Biomass Fuels Under Identical Oxy-Fuel Atmosphere

Figure 5a shows the CO mass fraction contours in the dense phase zone during the oxy-fuel combustion of different biomass fuels (this figure presents the cross-section at the furnace central plane, at a height of 7 m). CO is mainly distributed in the dense phase zone at the bottom of the furnace, while its content in the dilute phase zone is very low or even close to zero. Moreover, the high CO concentration region is primarily concentrated on the right side of the furnace. Among the three cases, the CO concentration along the furnace height, in descending order, is corn straw, rice husk, and poplar wood.
Figure 5b presents the distribution of CO mass fraction along the furnace height. For all three cases, the CO mass fraction rises sharply to a peak along the furnace height and then decreases. The reason for this behavior is as follows: in the dense phase zone, the biomass fuel is rapidly heated, a large amount of volatiles is released and undergoes incomplete combustion, oxygen is rapidly consumed, and a localized reducing atmosphere is formed, leading to the massive generation of CO as an intermediate product and causing its concentration to rapidly reach a peak. After entering the dilute phase zone, with the upward flow of flue gas and the injection of secondary air, oxygen becomes sufficient, and the temperature remains high, so the previously generated CO is further oxidized to CO2. Even if a small amount of CO is not oxidized, its mass fraction decreases due to the dilution effect of the secondary air. Consequently, the CO mass fraction gradually decreases along the furnace height.
As shown in Figure 6, the CO outlet mass fractions for all three cases exhibit a trend of initially rising and then fluctuating around a certain stable value. In the initial stage, due to fuel feeding and massive volatile release and combustion, CO is rapidly generated and accumulated. After approximately 10 s of combustion, the process enters a fluctuating stage, where the CO generation rate and oxidation consumption rate reach a dynamic equilibrium. At steady state, distinct differences in the CO outlet mass fraction are observed among the three cases: poplar wood shows the highest CO outlet mass fraction, presumably because its higher ignition temperature makes it more difficult to burn out, resulting in a slightly higher CO mass fraction than corn straw and rice husk [42]. Additionally, as a woody fuel, poplar wood has the highest volatile content and a dense structure, leading to a violent and concentrated volatile release process, rapid oxygen consumption in the early stage, and thus the tendency to produce a large amount of CO. The steady-state CO mass fraction of poplar wood also exhibits the largest fluctuation amplitude, confirming its most intense combustion reaction and concentrated heat release characteristics. In contrast, the lower ignition temperatures of corn straw and rice husk make them easier to burn out, leading to similar and lower CO mass fractions [43], and their curves are the most stable. It should be pointed out that the actual amount of CO produced in all three cases is very small; even the highest CO outlet mass fraction, observed for poplar wood, is extremely low.
In summary, CO rises sharply to a peak along the furnace height and then decreases, being mainly distributed in the dense phase zone. In the dilute phase zone, the CO concentration decreases significantly due to secondary air injection and oxidation reactions. The CO outlet mass fractions for all three cases rise rapidly at first and enter a steady-state fluctuation stage after approximately 10 s. Poplar wood exhibits the highest steady-state CO outlet mass fraction and the largest fluctuation amplitude due to its high volatile content, dense structure, and violent initial oxygen consumption, whereas corn straw and rice husk produce lower and more stable CO levels. Despite these differences, the total amount of CO produced in all three cases is extremely low, indicating that CO oxidation is nearly complete under oxy-fuel combustion conditions. In this simulation, the steady-state CO outlet mass fraction is as low as 3.5 × 10⁻¹⁰, which is mainly attributed to the rapid CO oxidation reaction (R4) under the high oxygen concentration of 30% and the sufficient mixing of secondary air in the dilute phase zone. This result demonstrates that CO is almost completely burned out under the given operating conditions.

3.3. NO Formation Characteristics of Different Biomass Fuels Under Identical Oxy-Fuel Atmosphere

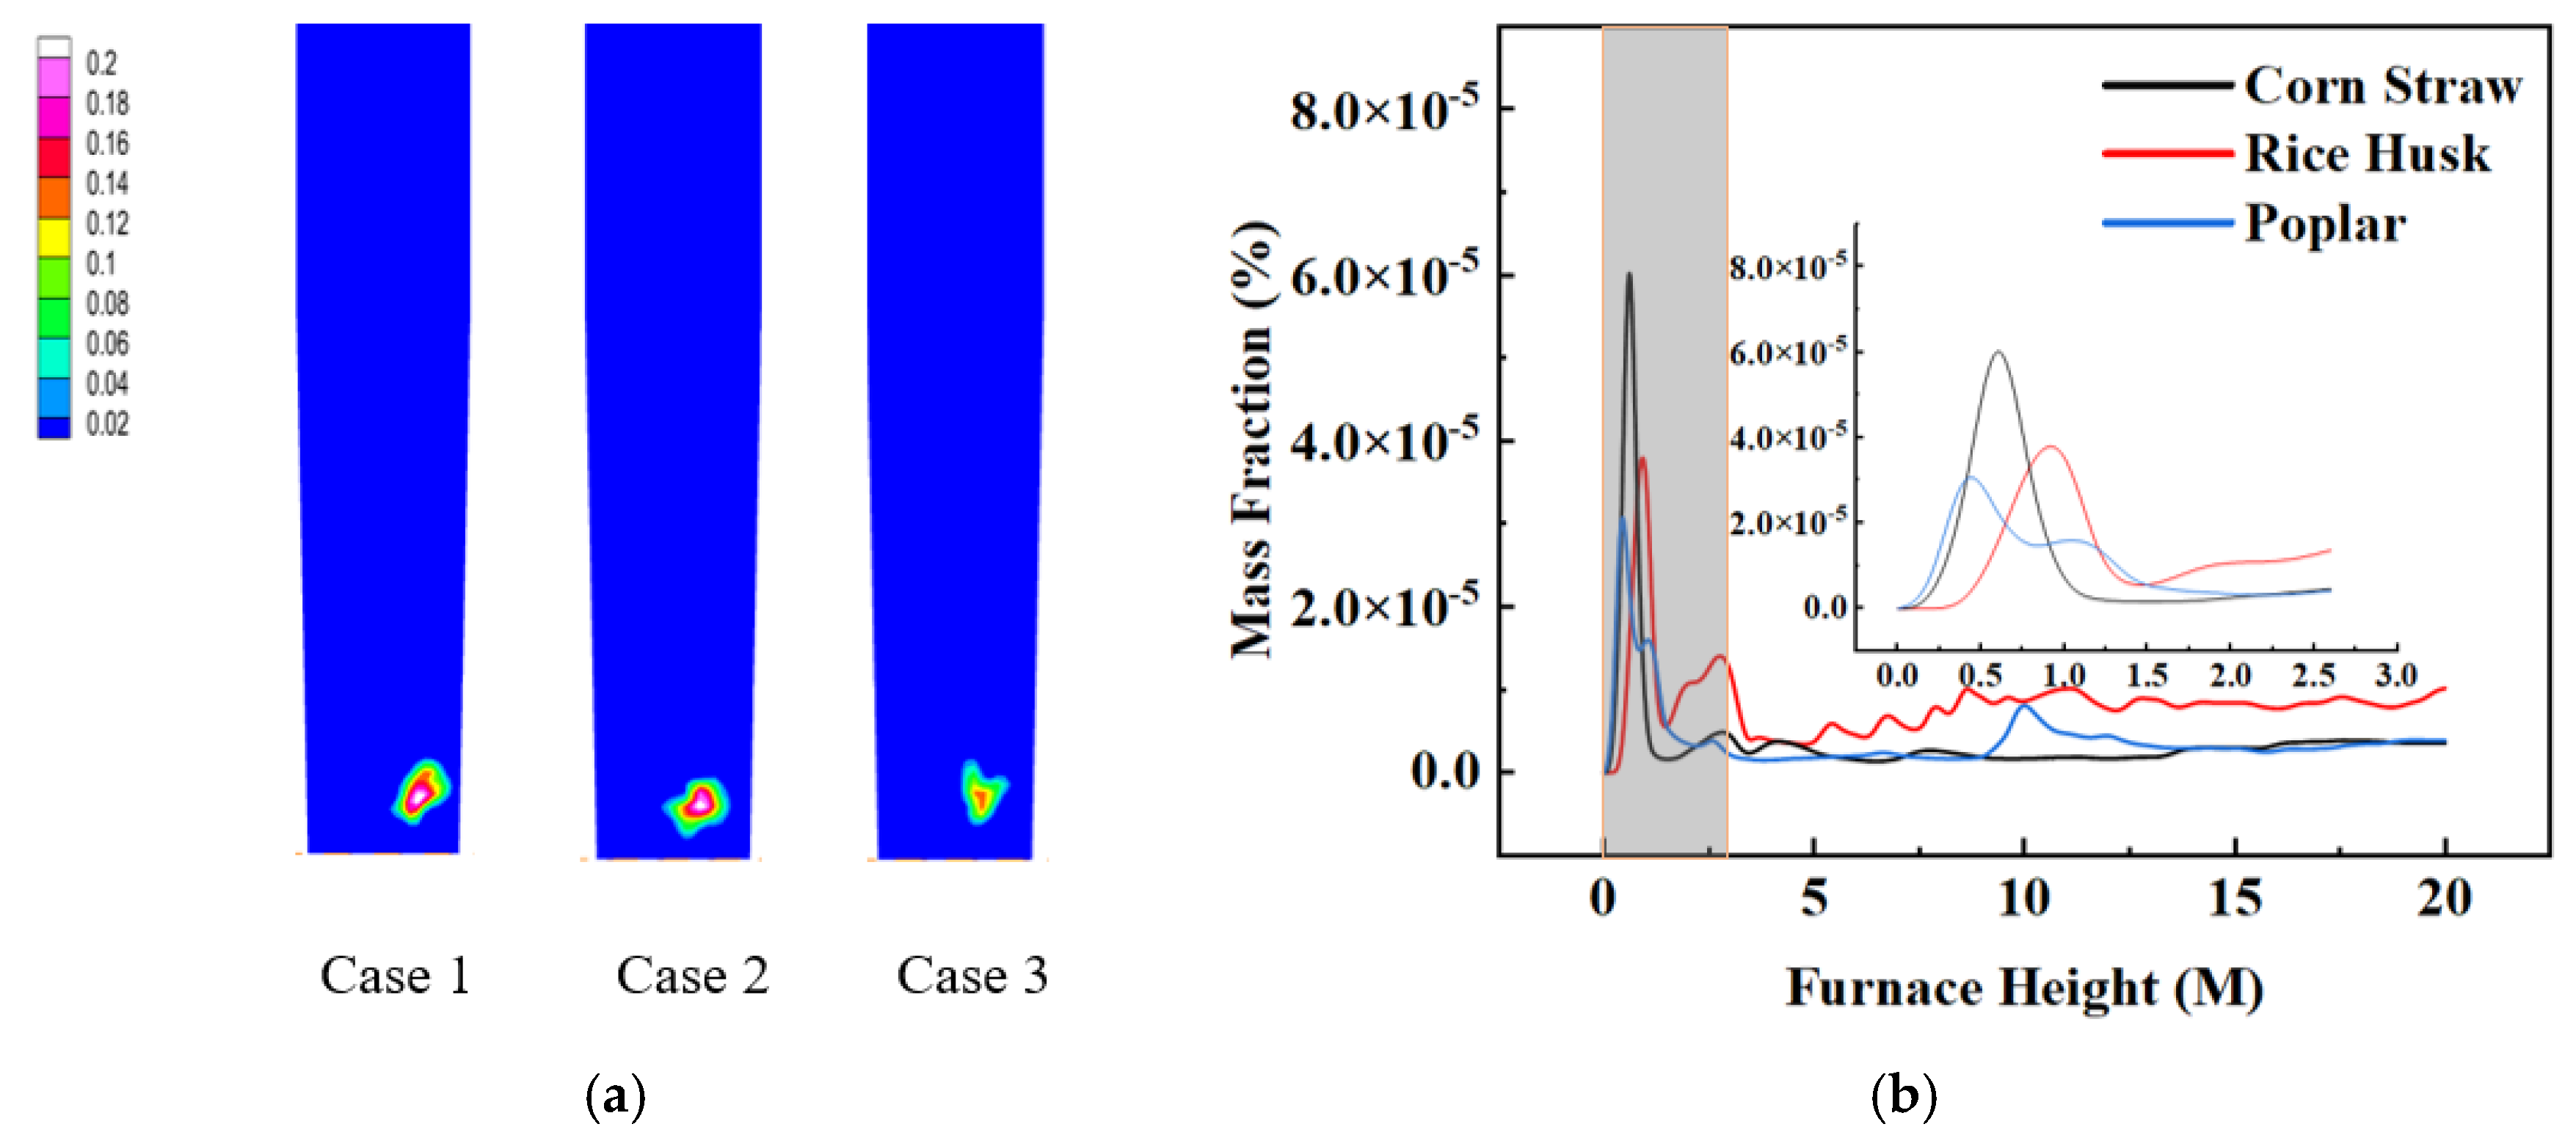
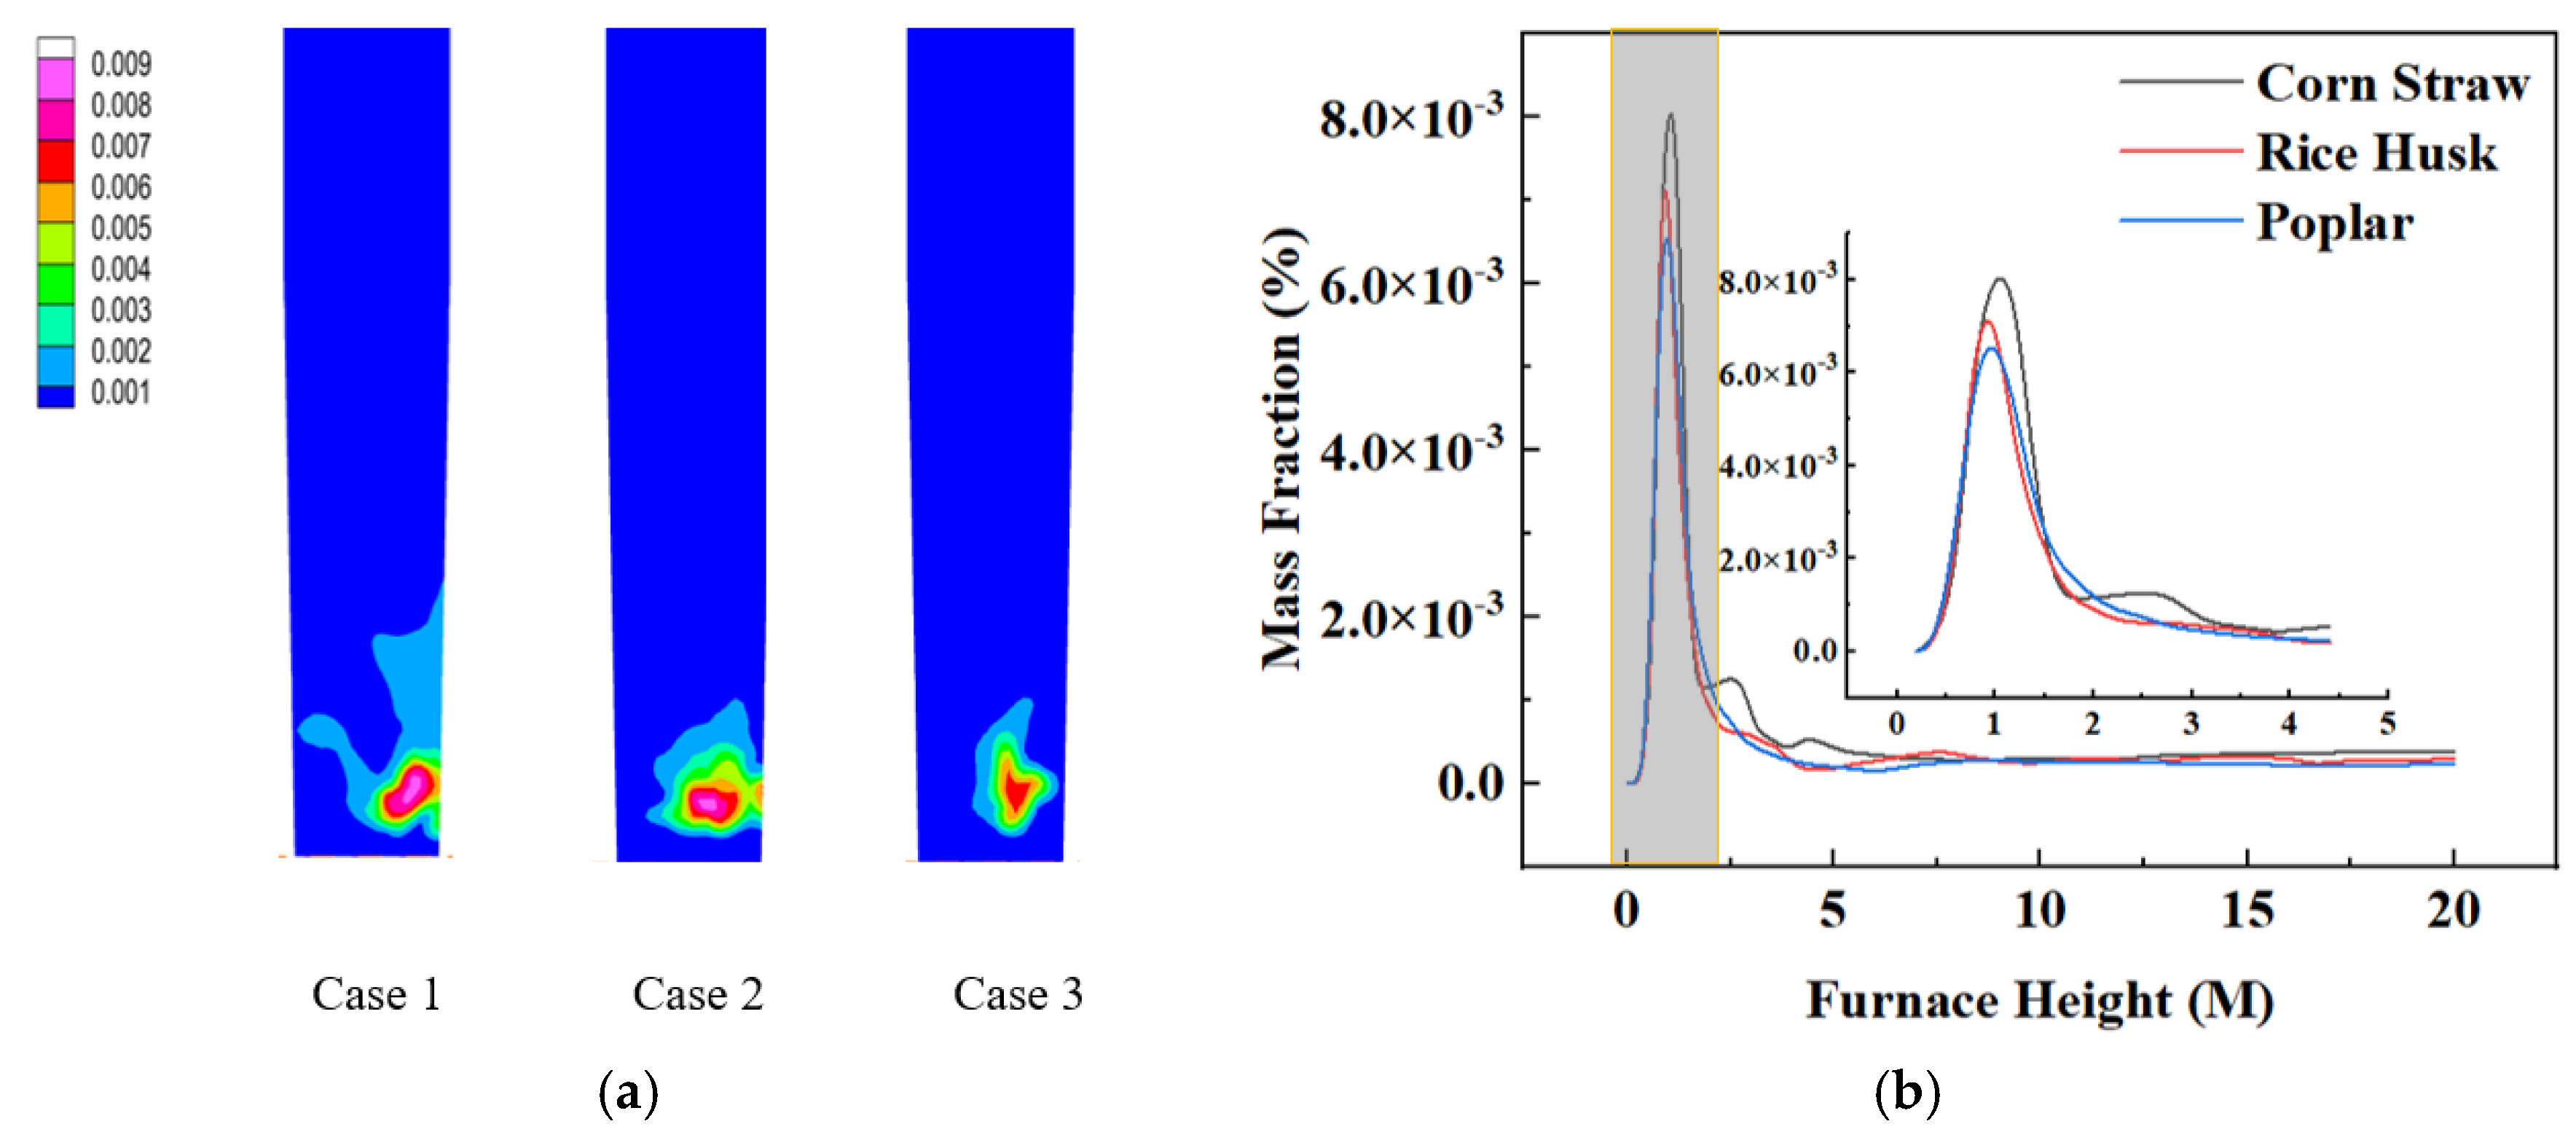
Figure 7a shows the NO mass fraction contours during oxy-fuel combustion of different biomass fuels (this figure presents the cross-section at the furnace central plane). NO is mainly distributed at the bottom of the furnace in the dense phase zone, while its content in the dilute phase zone is relatively low. Furthermore, the high NO concentration region is primarily concentrated on the left side of the furnace. This phenomenon can be attributed to the combined effects of the flame temperature in the furnace combustion zone [44] and the CO mass fraction level [45]. As indicated in Figure 4, the high-temperature zone in the furnace is concentrated in the middle-to-lower region of the dense phase zone. Figure 5a indicates that CO is concentrated on the right side of the dense phase zone. Figure 7a reveals that NO is concentrated on the left side of the dense phase zone. Combining these two observations, it can be concluded that the furnace temperature level affects the NO mass fraction, with higher temperature resulting in higher NO mass fraction; the CO mass fraction level also exerts an influence, with higher CO mass fraction leading to lower NO mass fraction. The NO concentration along the furnace height in descending order is corn straw, rice husk (slightly higher than poplar wood), and poplar wood.
Figure 7b presents the distribution of the NO outlet mass fraction along the furnace height. In the early stage of combustion, the NO mass fraction for all fuels rises rapidly and accumulates quickly in the dense phase zone, exhibiting a steep peak. The reason for this phenomenon is as follows: in the initial stage, the temperature in the dense phase zone is relatively high, accelerating the biomass pyrolysis rate and producing a large amount of ammonia (NH3) [46]; simultaneously, the oxygen concentration in the dense phase zone is high, enhancing the efficiency of ammonia oxidation. The combined effect of these two factors causes the NO mass fraction to increase rapidly. In the dilute phase zone, NO is present only in a small portion of the region, and its mass fraction decreases. This is because, with the injection of secondary air, NO flows into the dilute phase zone and mixes with gases such as CO2 in the secondary air, leading to a dilution effect that reduces the NO mass fraction. Therefore, the NO mass fraction for all three biomass fuels exhibits a distribution pattern of being higher in the dense phase zone than in the dilute phase zone, increasing first and then decreasing along the furnace height.
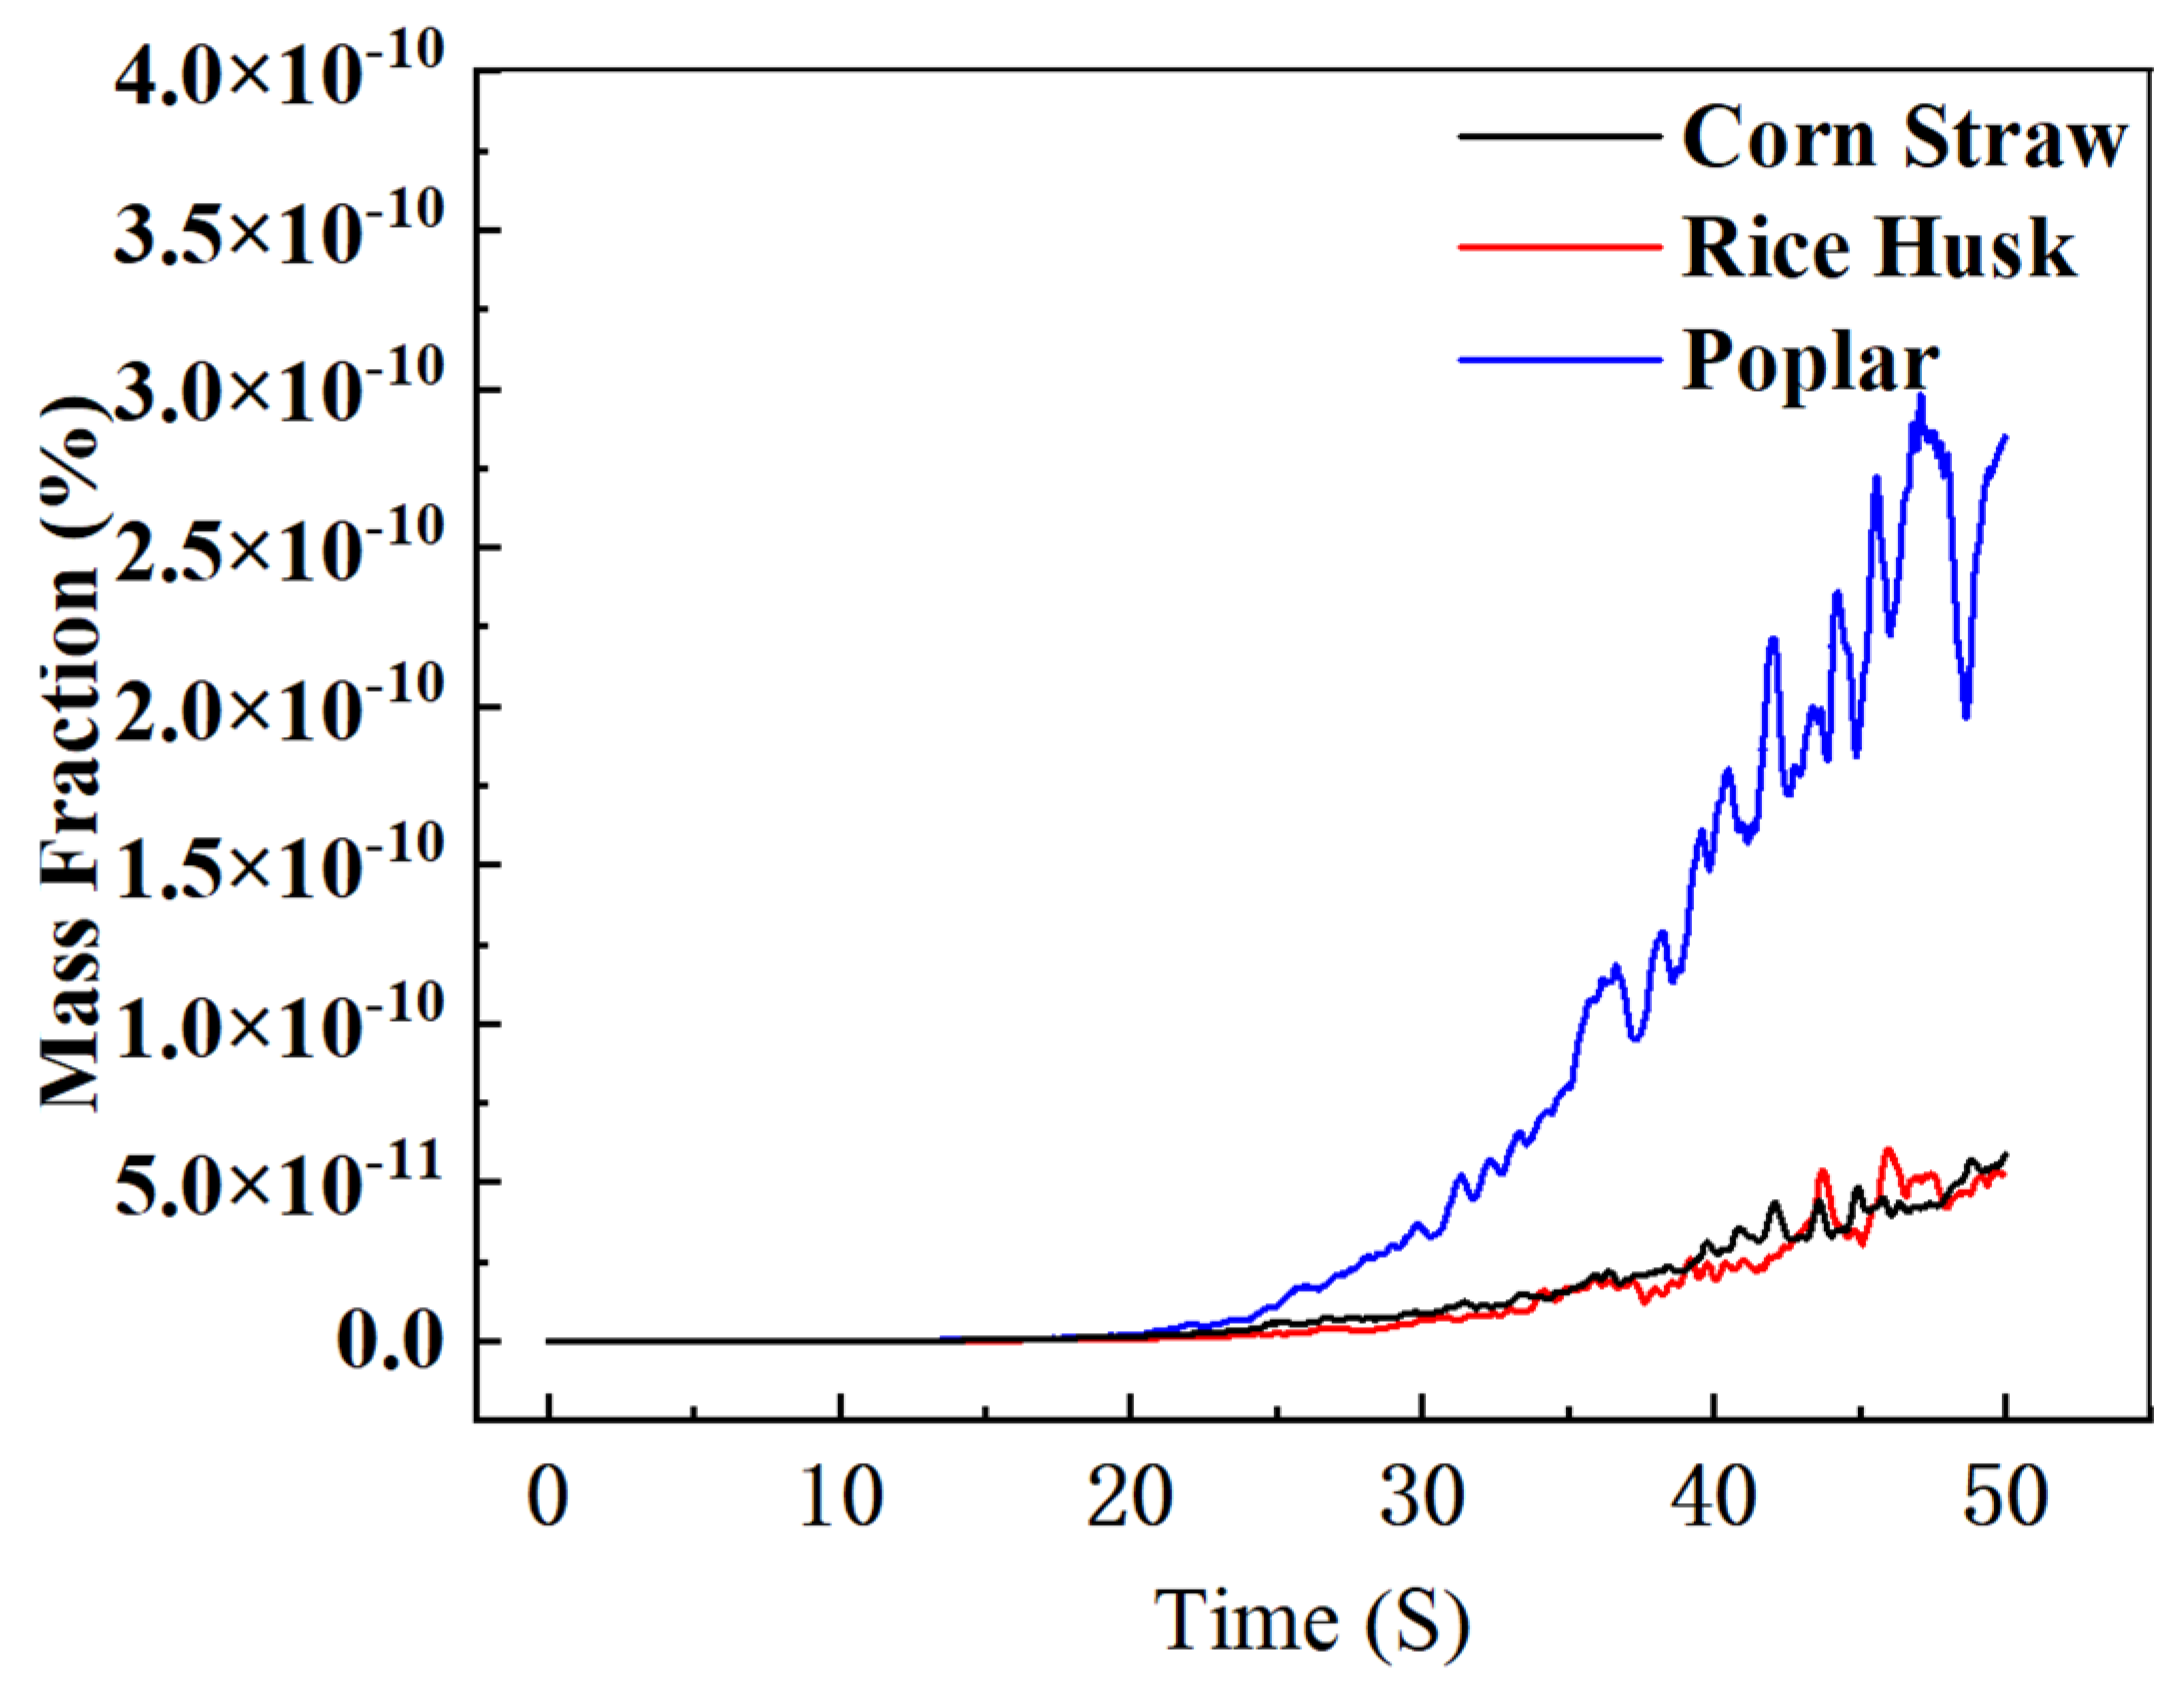
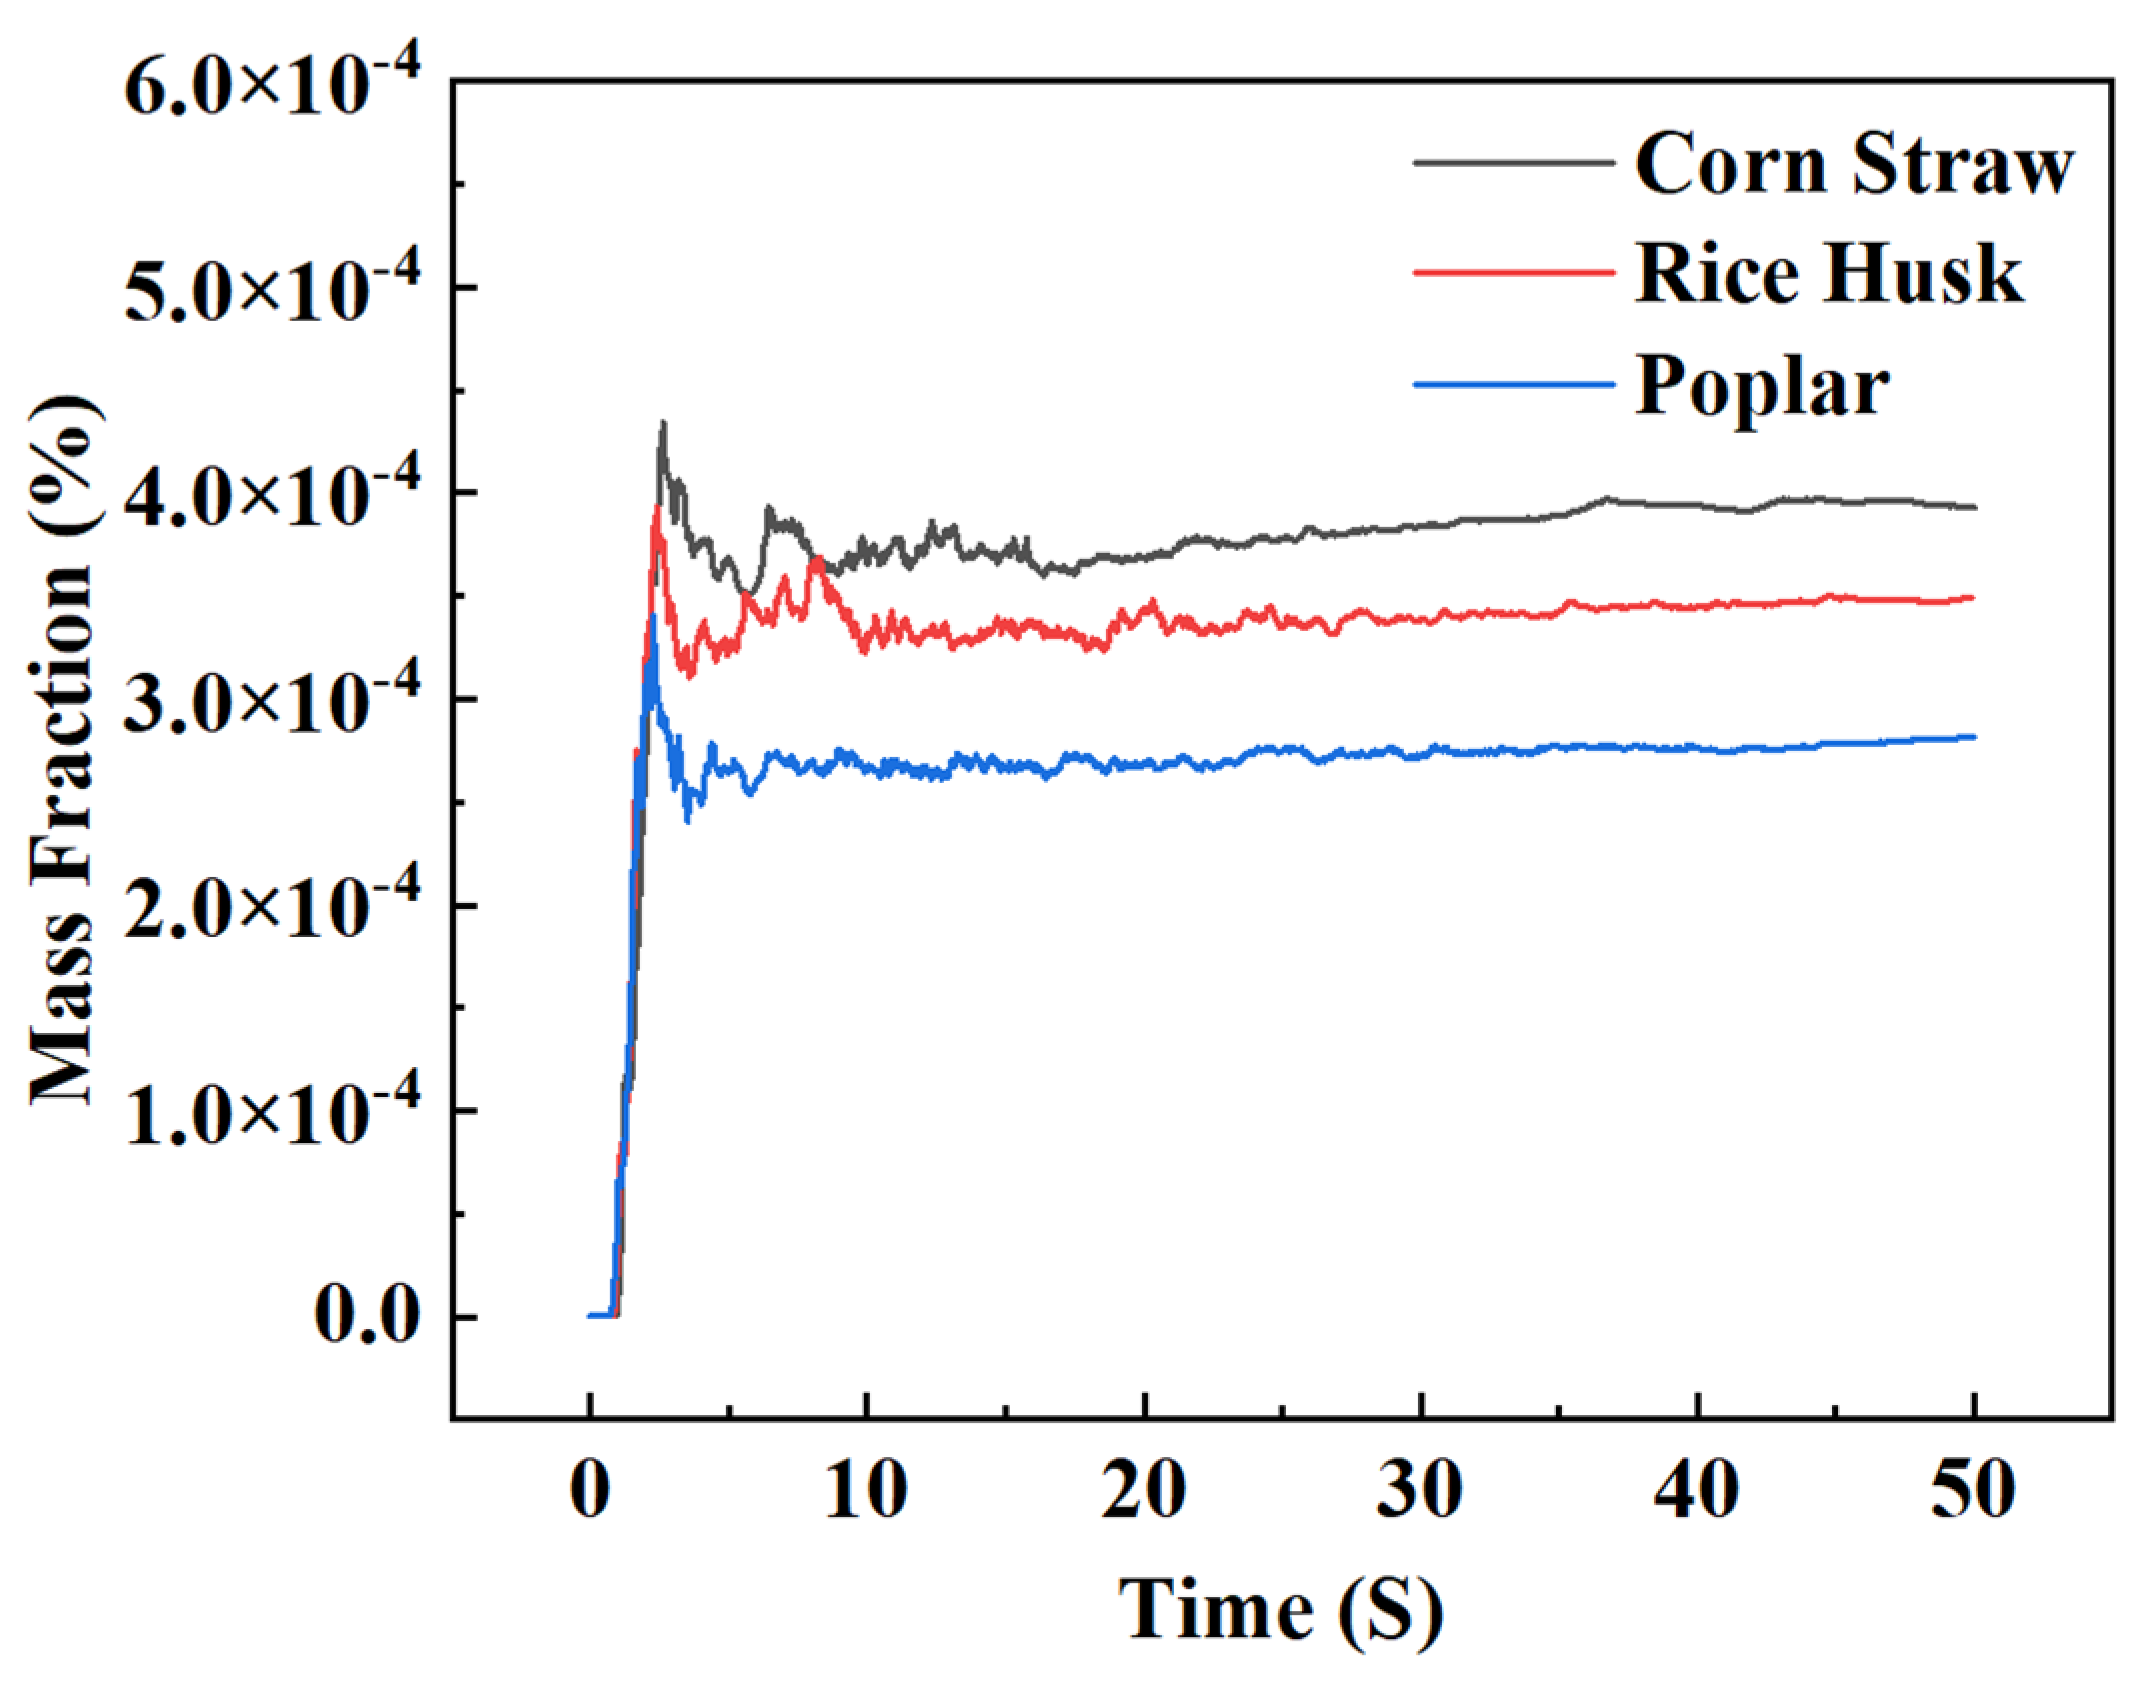
As shown in Figure 8, significant differences exist in the NO released from the combustion of different fuels. Corn straw exhibits the highest steady-state NO outlet mass fraction, indicating that it has the highest fuel nitrogen content. Concurrently, its relatively high ash content impedes heat transfer, which is unfavorable for NO reduction reactions, resulting in the highest NO outlet mass fraction. The steady-state NO outlet mass fraction of rice husk is the next highest. This is because rice husk has a lower volatile content and consequently lower volatile nitrogen content, but its ash content is the highest, severely hindering heat transfer and making NO reduction difficult in the later stage; therefore, its steady-state value is slightly lower than that of corn straw. Poplar wood produces the lowest amount of NO, owing to its lowest nitrogen content and lowest ash content. The high heat transfer efficiency and high temperature facilitate the reduction reactions of the generated NO, thereby significantly suppressing the net NO emission and resulting in the lowest NO outlet mass fraction.
In summary, NO increases rapidly to a peak along the furnace height and then decreases. The dense phase zone exhibits the highest NO concentration because the high temperature promotes the conversion of fuel nitrogen to NH3 and its subsequent oxidation, whereas the dilute phase zone shows a decreased NO concentration due to secondary air dilution and mixing effects. At steady state, the NO outlet mass fraction in descending order is corn straw, rice husk, and poplar wood. Corn straw produces the highest NO due to its high fuel nitrogen content and high ash content, which impede heat transfer and make NO reduction difficult; rice husk is the next highest; poplar wood produces the lowest NO because of its low nitrogen and ash contents, high heat transfer efficiency, and favorable conditions for NO reburning and reduction.

3.4. SO2 Formation Characteristics of Different Biomass Fuels Under the Same Oxy-Fuel Atmosphere

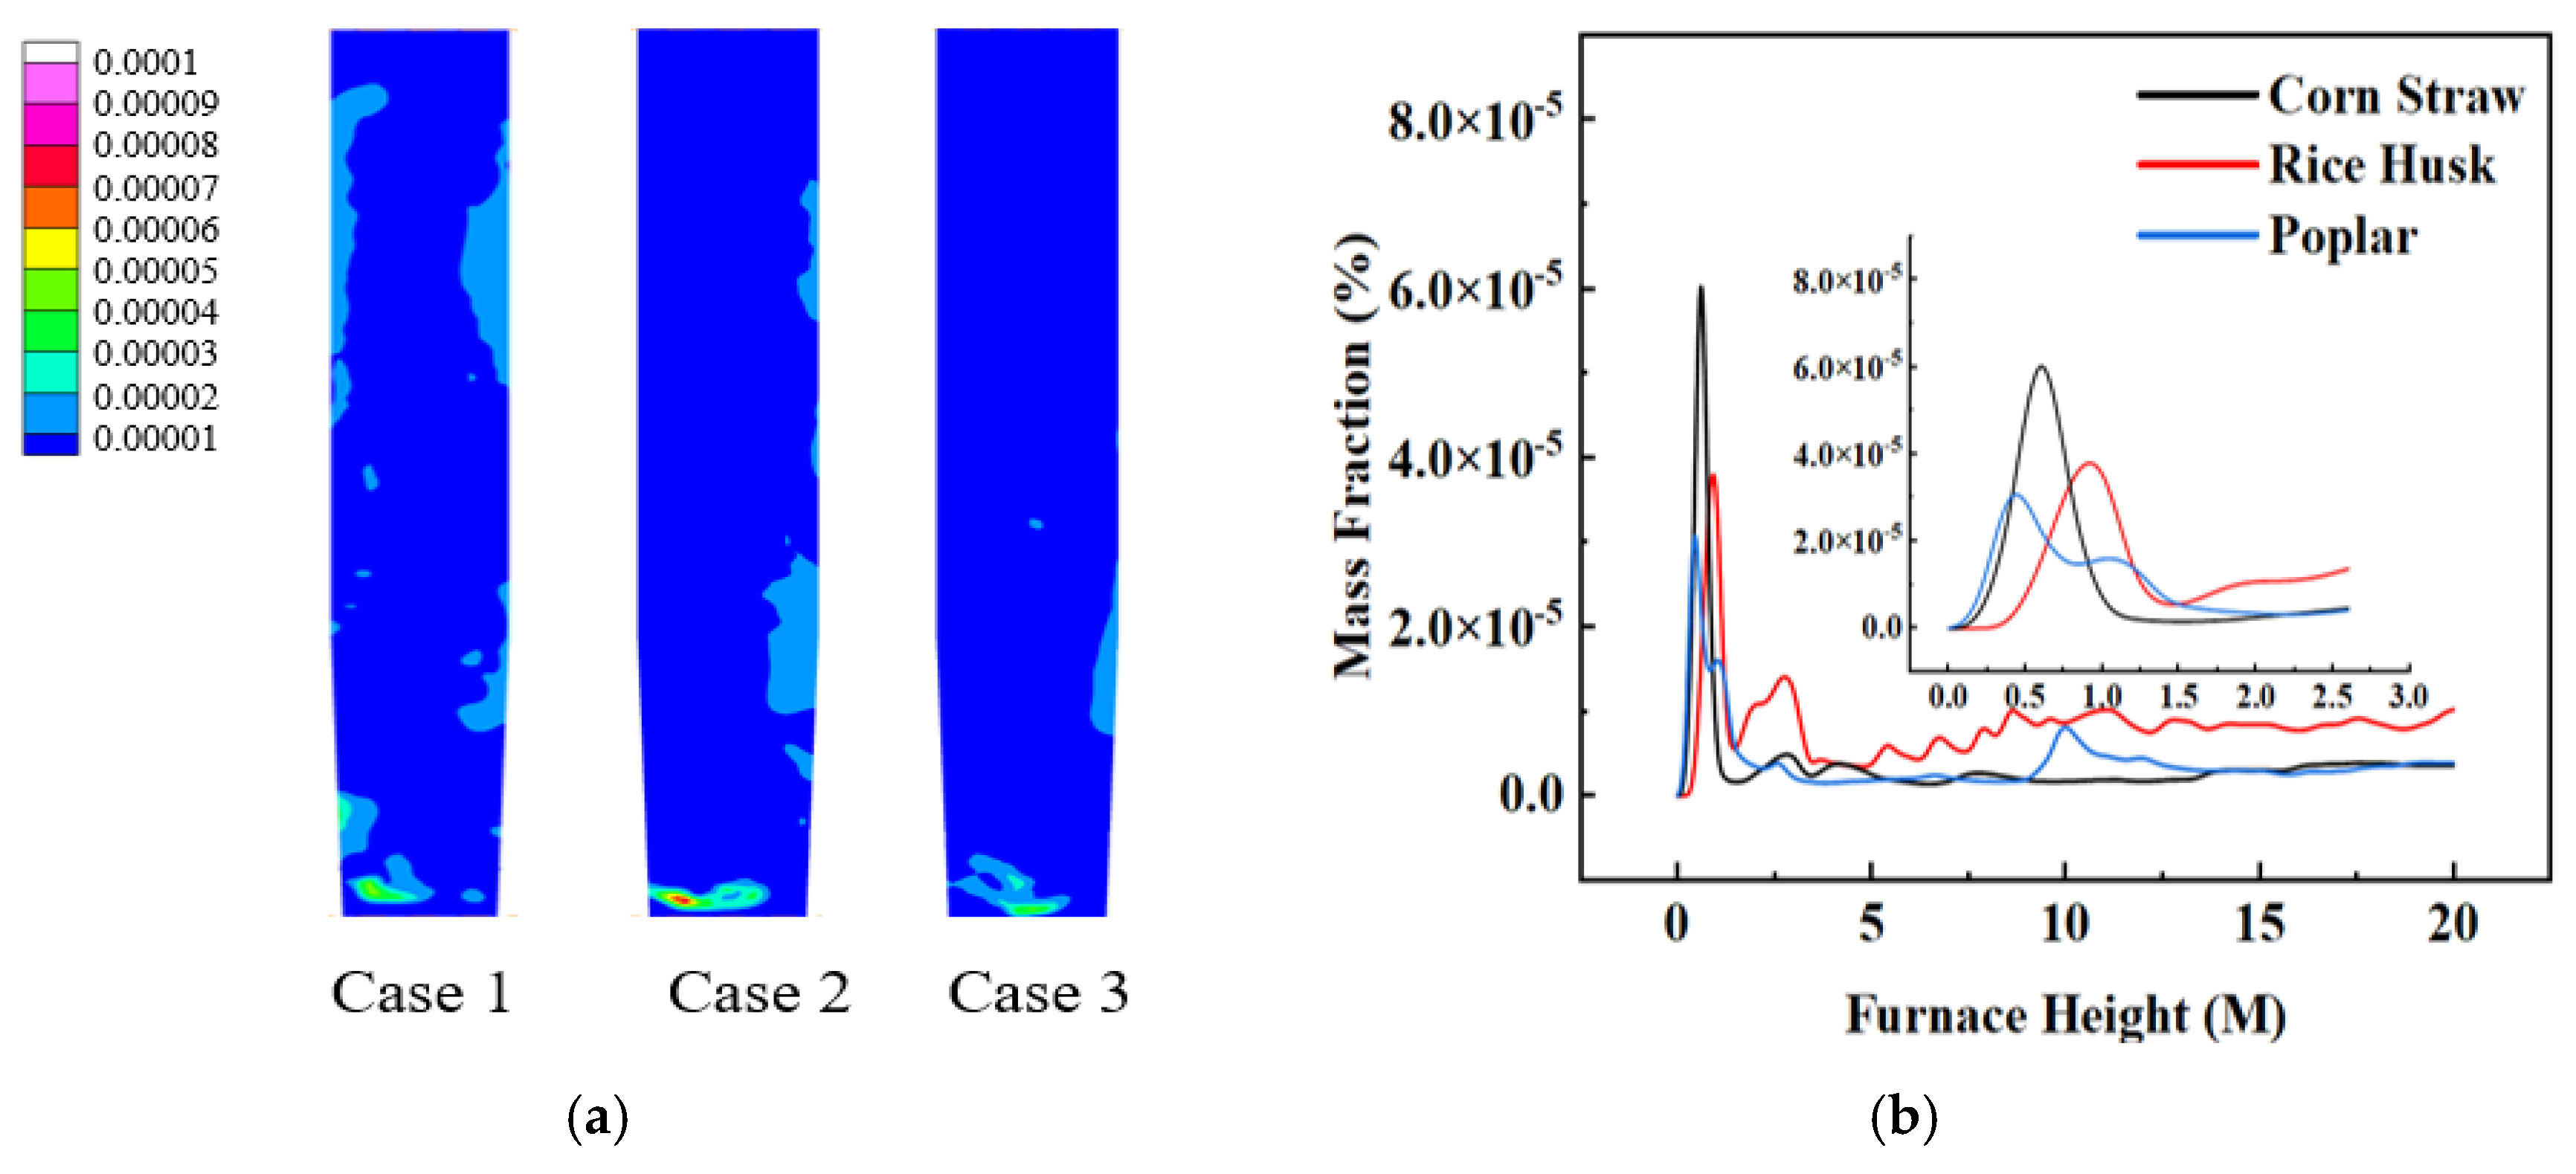
Figure 9a shows the SO2 mass fraction contour distribution in the dense phase zone of the furnace during the oxy-fuel combustion of three biomass fuels—corn straw, rice husk, and poplar wood (this figure presents the cross-section at the furnace central plane, at a height of 7 m). For all three cases, the SO2 mass fraction increases sharply in the dense phase zone and is mainly concentrated there, while the content in the dilute phase zone is very low. The SO2 concentration along the furnace height in descending order is corn straw, rice husk, and poplar wood.
Figure 9b presents the distribution of SO2 mass fraction along the furnace height. The SO2 mass fraction exhibits a trend of first increasing and then decreasing along the furnace height. This phenomenon can be explained as follows: in the dense phase zone, the three biomass fuels combust intensely, the temperature rises rapidly, and pyrolysis reactions occur, during which organic sulfur is released in the form of H2S gas. Meanwhile, a small portion of the inorganic sulfur contained in the biomass also generates a minor amount of SO2 at high temperatures. Subsequently, a large amount of H2S reacts with oxygen at the high furnace temperature to produce a substantial quantity of SO2, causing the SO2 mass fraction to surge to a peak within a very short distance along the furnace height. Upon entering the dilute phase zone, the combustion reactions are essentially complete, and SO2 loses its main source. Concurrently, as the flue gas rises, the CO2 in the secondary air dilutes the large amount of SO2 generated in the furnace, reducing its mass fraction. Consequently, the SO2 mass fraction exhibits a trend of first increasing, then decreasing, and finally stabilizing along the furnace height.
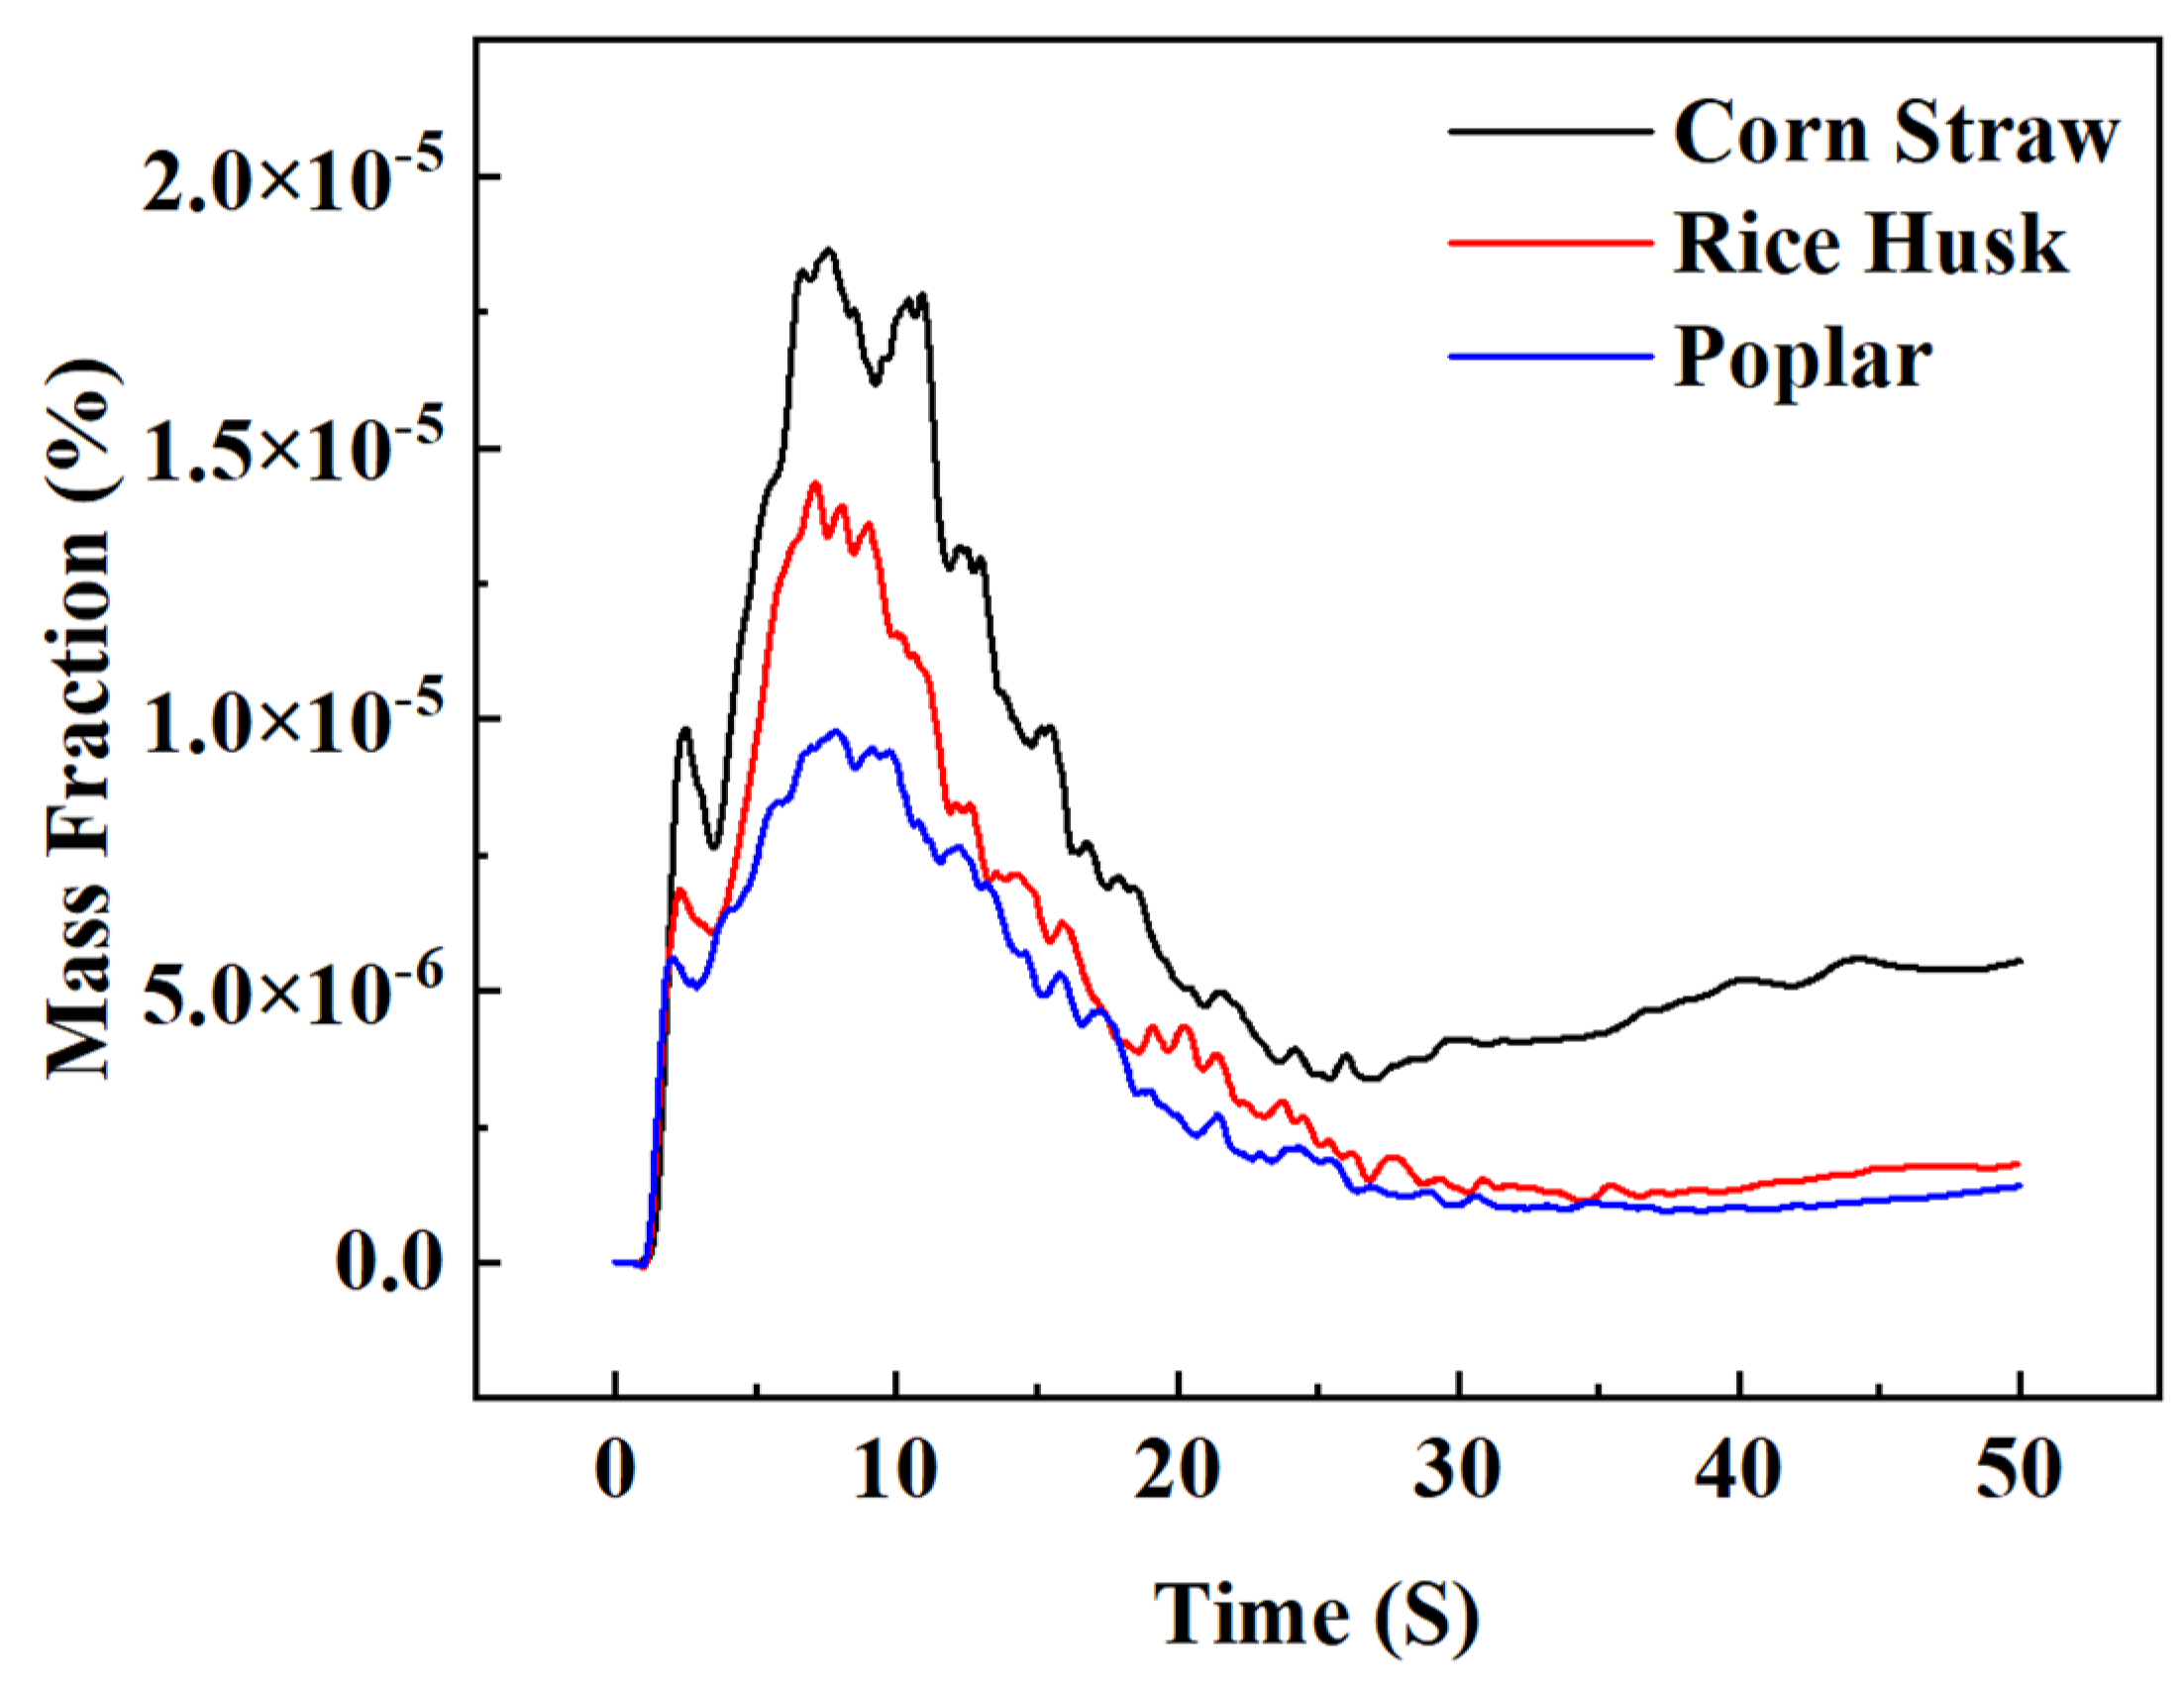
As shown in Figure 10, significant differences exist in the SO2 released from the combustion of different fuels. The SO2 outlet mass fractions of corn straw and rice husk are both higher than that of poplar wood. Based on the ultimate and proximate analyses of the biomass fuels, the sulfur content in the fuel characteristics exerts a core influence on SO2 formation: the sulfur contents of corn straw and rice husk are both much higher than that of poplar wood; therefore, under the same oxy-fuel combustion conditions, the total amount of SO2 they release is naturally greater. Poplar wood, with the lowest intrinsic sulfur content, produces the lowest SO2 concentration. In addition, temperature also has a certain influence on SO2 formation. Studies have found that the adsorption behavior of SO2 changes with temperature; the higher the temperature, the more the SO2 adsorption capacity of char is inhibited, which directly affects the final SO2 emission. The combined effect of these two factors [47] results in the trend shown in Figure 9a: in the SO2 contour of poplar wood, the area occupied by SO2 in the furnace is the smallest and the color is the lightest, indicating that poplar wood combustion releases the least sulfur; in the contour of rice husk, the area occupied by SO2 is intermediate; in the contour of corn straw, the area occupied by SO2 is the largest, indicating that corn straw combustion releases the most sulfur.
In summary, SO2 rises sharply to a peak along the furnace height and then decreases. The dense phase zone exhibits the highest SO2 concentration because biomass pyrolysis releases H2S, which is subsequently oxidized to SO2, whereas the dilute phase zone shows a decreased SO2 concentration due to the completion of combustion reactions and the dilution effect of secondary air. At steady state, the SO2 outlet mass fraction in descending order is corn straw and rice husk, both higher than poplar wood, directly depending on the sulfur content in the fuel. Poplar wood produces the least SO2 due to its lowest sulfur content, while corn straw and rice husk generate higher SO2 emissions because of their higher sulfur contents [48].

4. Conclusions

In this study, based on the CPFD method and using the Barracuda software, a numerical simulation was conducted for a 20 t/h biomass oxy-fuel circulating fluidized bed boiler. Under the same oxy-fuel atmosphere of 30% O2/65% CO2/5% H2O, the combustion characteristics of three biomass fuels—corn straw, rice husk, and poplar wood—were systematically compared, with emphasis on the furnace temperature distribution and the formation and emission patterns of CO, NO, and SO2. For all three biomass fuels under the oxy-fuel atmosphere, the furnace temperature exhibits a trend of first rising rapidly to a peak and then decreasing slowly. The peak temperatures in descending order are poplar wood (1091 K), corn straw (1084 K), and rice husk (1047 K). The differences mainly originate from variations in volatile content, ash content, and calorific value. Poplar wood, with high volatile content and low ash content, shows the highest combustion intensity; rice husk, with low volatile content and high ash content, exhibits the lowest combustion intensity and a more dispersed temperature distribution. CO is mainly concentrated in the dense phase zone and increases first then decreases along the furnace height. Poplar wood has the highest steady-state CO outlet mass fraction and the largest fluctuation amplitude, due to its higher ignition point, more incomplete combustion, and high volatile content. Corn straw and rice husk produce lower and more stable CO levels. Overall, CO oxidation is nearly complete under oxy-fuel conditions, resulting in extremely low CO emissions. NO increases first and then decreases along the furnace height, with the highest concentration occurring in the dense phase zone. The steady-state NO outlet mass fraction in descending order is corn straw, rice husk, and poplar wood. Corn straw and rice husk exhibit higher NO emissions due to lower furnace temperatures and lower CO levels, whereas poplar wood, despite having a higher furnace temperature, also has the highest CO level, which favors NO reduction and leads to the lowest NO formation. Furnace temperature and the reduction effect of CO have a significant influence on NO emissions. SO2 increases first and then decreases along the furnace height, with the highest concentration in the dense phase zone. The steady-state SO2 outlet mass fraction is highly correlated with furnace temperature and fuel sulfur content: corn straw and rice husk, with high sulfur contents, produce high SO2 emissions; poplar wood, with the lowest sulfur content, produces the lowest SO2 emissions. Temperature also has a certain influence on the SO2 adsorption behavior of char.

Author Contributions

Conceptualization and Writing—Original Draft, Y.P.; Methodology and Writing—Original Draft, Y.W.; Data Curation and Formal Analysis, X.Z.; Validation, D.L.; Formal Analysis, N.D.; Writing—Review and Editing, and Validation, J.M.; Writing—Original Draft and Supervision, Q.W. All authors have read and agreed to the published version of the manuscript.

Funding

This work was supported by the major project of China Power Engineering Consulting Group Co., Ltd.: Research on CFB boiler technology based on biomass oxy-fuel combustion and CO2 purification, capture, and green methanol synthesis (grant number: DG3-J04-2024).

Data Availability Statement

Data are contained within the article.

Acknowledgments

During the preparation of this manuscript, the authors used ChatGPT (OpenAI, GPT-5.2) to assist with language polishing, sentence restructuring, and improving the clarity and coherence of the text. All AI-generated content was carefully reviewed, verified, and edited by the authors, who take full responsibility for the scientific accuracy and originality of the manuscript.

Conflicts of Interest

Authors Yufeng Pei, Yuexi Wang, Xiuyan Zhang and Dandan Li were employed by Northeast Electric Power Design Institute Co., Ltd. of China Power Engineering Consulting Group. The remaining authors declare that the research was conducted in the absence of any commercial or financial relationships that could be construed as a potential conflict of interest. The Northeast Electric Power Design Institute Co., Ltd. of China Power Engineering Consulting Group had no role in the design of the study; in the collection, analyses, or interpretation of data; in the writing of the manuscript, or in the decision to publish the results.

References

  1. IEA Bioenergy. How Bioenergy Contributes to a Sustainable Future—IEA Bioenergy Review Update 2023; International Energy Agency: Paris, France, 2023. [Google Scholar]
  2. IEA. Net Zero by 2050: A Roadmap for the Global Energy Sector; International Energy Agency: Paris, France, 2021. [Google Scholar]
  3. Cui, D.; Zhou, X.P.; Wu, S.; Luk, H.M.; Lu, Q.Y.; Bai, J.R.; Liu, B.; Xu, X.M.; Pan, S.; Wang, Q.; et al. Synergistic mechanism radicals interaction of the Co-SCWGof cellulose polystyrene based on ReaxFF-MD and DFT. J. Energy Inst. 2026, 125, 102441. [Google Scholar] [CrossRef]
  4. Wu, S.; Wu, D.; Luk, H.M.; Cui, D.; Lu, Q.; Wu, C.; Panchal, D.; Pan, S.; Wang, Q.; Zhang, X. Green coal-based fuel produced via hydrothermal carbonization of disposable tableware in seawater medium. Renew. Energy 2026, 266, 125662. [Google Scholar] [CrossRef]
  5. Zhang, Z.; Mao, W.; Yue, X.; Dong, X.; Luo, C.; Zhang, L. Research progress on biomass oxy-fuel combustion technology. Clean Coal Technol. 2026, 32, 72–91. (In Chinese) [Google Scholar]
  6. Ling, J.L.J.; Yang, W.; Park, H.S.; Lee, H.E.; Lee, S.H. A comparative review on advanced biomass oxygen fuel combustion technologies for carbon capture and storage. Energy 2023, 284, 128566. [Google Scholar] [CrossRef]
  7. Riaza, J.; Gil, M.V.; Álvarez, L.; Pevida, C.; Pis, J.J.; Rubiera, F. Oxy-fuel combustion of coal and biomass blends. Energy 2012, 41, 429–435. [Google Scholar] [CrossRef]
  8. Yuzbasi, N.S.; Selçuk, N. Air and oxy-fuel combustion characteristics of biomass/lignite blends in TGA-FTIR. Fuel Process. Technol. 2011, 92, 1101–1108. [Google Scholar] [CrossRef]
  9. Wang, X.; Li, S.; Wang, Y.; Cai, N. Oxy-fuel combustion of rice husk and poplar in a lab-scale fluidized bed. Appl. Therm. Eng. 2017, 124, 1123–1131. [Google Scholar] [CrossRef]
  10. Cardozo, E.; Erlich, C.; Alejo, L.; Fransson, T.H. Combustion of agricultural residues: An experimental study for small-scale applications. Fuel 2014, 115, 778–787. [Google Scholar] [CrossRef]
  11. Yang, M.; Zhong, S.; Xu, S.; Xu, L.; Ottosson, P.; Fatehi, H.; Bai, X.S. CFD simulation of biomass combustion in an industrial circulating fluidized bed furnace. In Combustion Science and Technology; 2023; Taylor & Francis: London, UK; Volume 195, pp. 3310–3340. [Google Scholar]
  12. Wang, Y.; Chen, X.; Xu, L.; Ma, M.; Huang, X.; Han, F.; Zhou, Y.; Du, C.; Da, Y.; Deng, L. Computational particle fluid dynamics simulation on combustion characteristics of blended fuels of coal, biomass, and oil sludge in a 130 t h−1 circulating fluidized bed boiler. Energies 2023, 17, 149. [Google Scholar] [CrossRef]
  13. Tanprasert, S.; Rangton, N.; Nukkhong, W.; Wises, P.; Piumsomboon, P.; Chalermsinsuwan, B. Impact of biomass fuel feeding ratio in co-firing circulating fluidized bed boiler: A computational fluid dynamics study. J. Adv. Res. Numer. Heat. Transf. 2024, 17, 44–54. [Google Scholar] [CrossRef]
  14. Varapiang, T.; Rangton, N.; Nukkhong, W.; Wises, P.; Piumsomboon, P.; Piemjaiswang, R.; Chalermsinsuwan, B. Digital twin of biomass/coal co-firing circulating fluidized bed boiler by using computational fluid dynamics simulation. Energy Rep. 2023, 9, 6–9. [Google Scholar] [CrossRef]
  15. Guo, J.N.; Gao, M.M.; Lü, J.F.; Yue, G.X. Modeling optimal control for nitrogen oxide emissions from biomass circulating fluidized bed. J. Chin. Soc. Power Eng. 2024, 44, 45–55. (In Chinese) [Google Scholar]
  16. Zhang, K.P.; Gao, M.M.; Long, J.; Zhang, H.F.; Wang, Y.K.; Yue, G.X. Modeling prediction of biomass direct fired circulating fluidized bed boiler combustion system. J. Chin. Soc. Power Eng. 2023, 43, 452–460. (In Chinese) [Google Scholar]
  17. Chen, G.; Li, S.Y.; Wang, L.W. Current investigation status of oxy-fuel circulating fluidized bed combustion. Fuel 2023, 342, 127699. [Google Scholar] [CrossRef]
  18. Ge, C.; Wang, C.H.; Li, S.Y. Areview on the progress of oxy-fuel combustion technology in circulating fluidized bed. J. Eng. Thermophys. 2023, 44, 840–849. (In Chinese) [Google Scholar]
  19. Kosowska-Golachowska, M.; Kijo-Kleczkowska, A.; Luckos, A.; Wolski, K.; Musiał, T. Oxy-combustion of biomass in a circulating fluidized bed. Arch. Thermodyn. 2016, 37, 17–32. [Google Scholar] [CrossRef]
  20. Kosowska-Golachowska, M.; Luckos, A.; Kijo-Kleczkowska, A. Pollutant emissions during oxy-fuel combustion of biomass in a bench scale CFB combustor. Energies 2022, 15, 706. [Google Scholar] [CrossRef]
  21. Moreno, J.; Hornberger, M.; Schmid, M.; Scheffknecht, G. Oxy-fuel combustion of hard coal, wheat straw, and solid recovered fuel in a 200 kWth calcium looping CFB calciner. Energies 2021, 14, 2162. [Google Scholar] [CrossRef]
  22. Ling, J.L.J.; Kim, H.W.; Go, E.S.; Oh, S.; Park, H.; Jeong, C.; Lee, S. Analysis of operational characteristics of biomass oxygen fuel circulating fluidized bed combustor with indirect supercritical carbon dioxide cycle. Energy Convers. Manag. 2022, 254, 115222. [Google Scholar]
  23. Ling, J.L.J.; Oh, S.S.; Park, H.J.; Lee, S.H. Process simulation and economic evaluation of a biomass oxygen fuel circulating fluidized bed combustor with an indirect supercritical carbon dioxide cycle. Renew. Sustain. Energy Rev. 2023, 182, 113380. [Google Scholar] [CrossRef]
  24. GB/T 28731-2012; Proximate Analysis Methods for Solid Biofuels. Standards Press of China: Beijing, China, 2012.
  25. GB/T 28733-2012; Determination of Total Moisture in Solid Biofuels. Standards Press of China: Beijing, China, 2012.
  26. GB/T 28732-2012; Determination of Total Sulfur in Solid Biofuels. Standards Press of China: Beijing, China, 2012.
  27. GB/T 28734-2012; Determination of Carbon and Hydrogen in Solid Biofuels. Standards Press of China: Beijing, China, 2012.
  28. GB/T 30728-2014; Determination of Nitrogen in Solid Biofuels. Standards Press of China: Beijing, China, 2014.
  29. Andrews, M.J.; O‘Rourke, P.J. The multiphase particle-in-cell (MP-PIC) method for dense particulate flows. Int. J. Multiph. Flow 1996, 22, 379–402. [Google Scholar] [CrossRef]
  30. Snider, D.M. An incompressible three-dimensional multiphase particle-in-cell model for dense particle flows. J. Comput. Phys. 2001, 170, 523–549. [Google Scholar] [CrossRef]
  31. Bandara, J.C.; Jayarathna, C.; Thapa, R.; Nielsen, H.K.; Moldestad, B.M.; Eikeland, M.S. Loop seals in circulating fluidized beds—Review and parametric studies using CPFD simulation. Chem. Eng. Sci. 2020, 228, 115917. [Google Scholar] [CrossRef]
  32. Öner, B.A.; Bektaş, Z.; Yılmaz, B. Numerical analysis and experimental verification on flow characteristics of a pressurized fluidized bed system. J. Energy Resour. Technol. 2023, 145, 032301. [Google Scholar]
  33. Liu, Q.W. Experimental and Numerical Simulation Study on Characteristics of Coal/Biomass Fluidized Oxy-Fuel Combustion. Master’s Thesis, Southeast University, Nanjing, China, 2020. (In Chinese) [Google Scholar]
  34. Li, S.C. Simulation Study on combustion Characteristics of Biomass Circulating Fluidized Bed Boiler with Biogas Co-Firing. Master’s Thesis, Northeast Electric Power University, Jilin, China, 2024. (In Chinese) [Google Scholar]
  35. Liu, D.; Peng, L.Y.; Xu, Z.; Zhang, Q.B.; Chen, G.W.; Zhou, X.Y. Simulation of combustion characteristics of Turkish lignite in a circulating fluidized bed based on CPFD model. Clean Coal Technol. 2025, 31, 429–436. (In Chinese) [Google Scholar]
  36. Kosowska-Golachowska, M.; Luckos, A.; Czakiert, T. Composition of flue gases during oxy-combustion of energy crops in a circulating fluidized bed. Energies 2022, 15, 6889. [Google Scholar] [CrossRef]
  37. Yi, X.L.; Zhang, W.J.; Guo, D.Y.; Xu, J.; Xu, M.; Sun, L. Experimental study on combustion of rice husk in a circulating fluidized bed. Trans. Chin. Soc. Agric. Eng. 2007, 23, 212–216. (In Chinese) [Google Scholar]
  38. Duan, L.; Duan, Y.; Zhao, C.; Anthony, E.J. NO emission during co-firing coal and biomass in an oxy-fuel circulating fluidized bed combustor. Fuel 2015, 150, 8–13. [Google Scholar] [CrossRef]
  39. Wang, X.; Ren, Q.; Li, W.; Li, H.; Li, S.; Lu, Q. Nitrogenous gas emissions from coal/biomass co-combustion under a high oxygen concentration in a circulating fluidized bed. Energy Fuels 2017, 31, 3234–3242. [Google Scholar] [CrossRef]
  40. Yang, Z.B.; Xu, R. Development and design of a direct-fired circulating fluidized bed boiler for bulk biomass. Eng. Constr. 2021, 4, 55–58. (In Chinese) [Google Scholar]
  41. Yan, Y.L.; Clough, P.T.; Anthony, E.J. Investigation of the apparent kinetics of air and oxy-fuel biomass combustion in a spouted fluidised-bed reactor. Fuel 2019, 254, 115622. [Google Scholar]
  42. Zhang, B.T.; Zhang, Z.J.; Wang, J.; Hou, Y.H. Study of pyrolysis and explosion characteristics of two types of wood fiber. China For. Prod. Ind. 2024, 61, 20–25. (In Chinese) [Google Scholar]
  43. Wang, H.S.; Fang, Y.R.; Zhang, T.H.; Liu, H.; Wang, C.S. Combustion characteristics and kinetics analysis of rice husk with different pretreatment and mixing with poplar sawdust. Biomass Chem. Eng. 2020, 54, 1–8. (In Chinese) [Google Scholar]
  44. Wang, C.B.; Wang, J.X.; Lei, M. Co-combustion characteristics NO emission characteristics of pulverized coal biomass blends at constant temperature. J. China Coal Soc. 2013, 38, 1247–1252. (In Chinese) [Google Scholar]
  45. Liu, J.; Xia, Y.G.; Liu, M.F.; Hu, B.; Zhang, H.-J.; Li, J.-H.; Zhang, Z.-X.; Lu, Q. Theoretical and experimental insights into the effects of CO2 on the heterogeneous NO reduction over char surface: Gasification and CO2-mediated oxygen rearrangement. J. Environ. Chem. Eng. 2024, 12, 113976. [Google Scholar] [CrossRef]
  46. Yang, J.C.; Wang, C.B.; Zhang, Y. Numerical simulation on fuel-nitrogen conversion during flameless oxy-fuel combustion of biomass blended with pulverized coal. J. Fuel Chem. Technol. 2019, 47, 538–547. (In Chinese) [Google Scholar]
  47. Nie, H. Study on Emission Characteristics of Pollutants from Biomass Combustion. Master’s Thesis, Zhejiang University, Hangzhou, China, 2010. (In Chinese) [Google Scholar]
  48. Tang, R.; Liu, Q.W.; Zhong, W.Q.; Lian, G.; Yu, H. Experimental study of SO2 emission and sulfur conversion characteristics of pressurized oxy-fuel co-combustion of coal and biomass. Energy Fuels 2020, 34, 14740–14749. [Google Scholar] [CrossRef]
Figure 1. Geometric model of the boiler.
Processes 14 02124 g001
Figure 2. Mesh generation and visualization.
Processes 14 02124 g002
Figure 3. Axial temperature distribution along the furnace height under different grid resolutions.
Processes 14 02124 g003
Figure 4. Temperature distribution of different biomass fuels under oxy-fuel combustion conditions: (a) furnace temperature distribution contours at the central plane; (b) axial temperature profiles along the furnace height.
Processes 14 02124 g004
Figure 5. CO mass fraction distribution of different biomass fuels under oxy-fuel combustion conditions: (a) CO mass fraction contours in the dense phase zone; (b) axial CO mass fraction profiles along the furnace height.
Processes 14 02124 g005
Figure 6. Temporal distribution of CO outlet mass fraction under oxy-fuel combustion of different biomass fuels.
Processes 14 02124 g006
Figure 7. NO mass fraction distribution of different biomass fuels under oxy-fuel combustion conditions: (a) NO mass fraction contours at the central plane; (b) axial NO mass fraction profiles along the furnace heig.
Processes 14 02124 g007
Figure 8. Temporal distribution of NO outlet mass fraction under oxy-fuel combustion of different biomass fuels.
Processes 14 02124 g008
Figure 9. SO2 mass fraction distribution of different biomass fuels under oxy-fuel combustion conditions: (a) SO2 mass fraction contours in the dense phase zone; (b) axial SO2 mass fraction profiles along the furnace height.
Processes 14 02124 g009
Figure 10. Temporal distribution of SO2 outlet mass fraction under oxy-fuel combustion of different biomass fuels.
Processes 14 02124 g010
Table 1. Ultimate analysis, proximate analysis, and HHV results of biomass fuels.
SampleUltimate Analysis (wt.%) dafProximate Analysis (wt.%)HHVs
(MJ/kg)
CHO aNSMFCVMAsh
Corn straw46.886.0044.212.270.6410.2529.9249.7910.0412.9
Rice husk50.477.0039.921.860.758.3415.5959.0017.0713.2
Poplar47.86.0046.140.030.0310.215.272.52.116.5
Note: daf: dry ash free; a: by difference.
Table 2. Chemical reaction rate coefficients.
Chemical Reaction RateReaction Rate Coefficient
R 0 = k 0 C H 2 O k 0 = 1.272 m s T e x p ( 22,645 / T )
R 1 = k 1 C C O 2 2 k 1 = 1.044 × 10 4 m s T 2 e x p ( 2363 / T 20.92 )
R 2 = k 2 C C O C H 2 k 2 = 1.04 × 10 4 m s T 2 e x p ( 6319 / T 17.92 )
R 3 = k 3 C C O 2 k 3 = 1.04 × 10 4 m s T 2 e x p ( 2363 / T 20.92 )
R 4 = k 4 C C O C O 2 0.5 k 4 = 5.62 × 10 12 e x p ( 16,000 / T )
R 5 = k 5 C C O 0.5 C H 2 O k 5 = 7.68 × 10 10 T e x p ( 36,640 / T )
R 6 = k 6 C C H 4 C O 2 k 6 = 3.552 × 10 11 T 1 e x p ( 15,700 / T )
R 7 = k 7 C H 2 S C O 2 k 7 = 5.2 × 10 8 e x p ( 2321 / T )
R 8 = k 8 C N H 3 C O 2 k 8 = 3.1 × 10 8 e x p ( 25,000 / T )
R 9 = k 9 C H 2 1.5 C O 2 k 9 = 1.63 × 10 9 T 1.5 e x p ( 3420 / T )
R 10 = k 10 C V o l a t i l e s k 10 = 16,000 T   e x p ( 4500 / T )
Table 3. Furnace average temperature and relative deviation under different mesh numbers.
Mesh NumberFurnace Average Temperature/KTemperature Difference from 882,504-Cell Mesh/KRelative Deviation/%
287,408835.165.67.28
486,846872.628.13.12
683,240907.36.60.73
882,504900.700
Table 4. Boundary condition settings.
OptionParameter Settings
Bed material temperature1000 K
Fuel temperature300 K
Primary air temperature473 K
Secondary air temperature473 K
Loop seal air temperature473 K
Water-wall temperature573 K
Pressure outlet101,325 Pa
Table 5. Summary of simulation operating conditions.
CasePrimary Air Mass Flow Rate (kg/s)Secondary Air Mass Flow Rate (kg/s)Biomass Feeding Rate (kg/s)Biomass Fuel
Case 13.6452.431.06 kg/sCorn straw
Case 24.42.931.06 kg/sRice husk
Case 34.693.431.06 kg/sPoplar
Disclaimer/Publisher’s Note: The statements, opinions and data contained in all publications are solely those of the individual author(s) and contributor(s) and not of MDPI and/or the editor(s). MDPI and/or the editor(s) disclaim responsibility for any injury to people or property resulting from any ideas, methods, instructions or products referred to in the content.