1. Introduction
Thin interbedded reservoirs are hydrocarbon-bearing strata vertically compartmentalized by non-pay layers such as dry sandstone or mudstone, forming lithologically layered systems [
1]. To optimize economic viability and enhance recovery in such reservoirs, horizontal wells and multi-cluster hydraulic fracturing are commonly used to improve vertical communication among thin pay layers [
2,
3,
4].
Recent studies on CO
2 fracturing fluids have emphasized both solid particle transport and crack propagation behavior in reservoir stimulation. Li et al. analyzed the sedimentation behavior and influencing factors of solid particles in CO
2 fracturing fluid [
5], and Li et al. further examined the settling behavior and mechanism of kaolinite as a fracture proppant in CO
2 fracturing fluid [
6]. In addition, crack propagation experiments and factor analysis in unconventional low-permeability reservoirs demonstrated that CO
2 fracturing fluid properties can affect fracture propagation mechanisms and stimulation efficiency [
7]. These findings indicate that fluid particle interaction, sedimentation stability, and fluid-driven crack propagation are important for understanding hydraulic fracturing performance in low-permeability reservoirs.
The fracture propagation during cross-layer fracturing involves three mechanical challenges: (1) interaction mechanisms between hydraulic fractures and bedding interfaces [
8,
9,
10], (2) fracture propagation patterns in different lithological layers [
11,
12], and (3) stress shadow effects from multi-cluster fractures on cross-layer propagation. Extensive experimental [
13,
14,
15] and numerical simulation studies [
16,
17] have identified critical influencing factors, including geological parameters (rock mechanical properties [
18,
19], in situ stress magnitude [
20]) and engineering controls (fracturing fluid viscosity and pump rate [
21,
22,
23,
24,
25]), which collectively govern fracture initiation and extension behaviors. When hydraulic fractures propagate vertically through adjacent strata with abrupt or gradual lithological transitions, significant variations emerge in rock mechanical parameters, in situ stress magnitudes, porosity, and permeability across different layers [
26]. Unlike conventional heterogeneous models, these parameter discrepancies induced by lithological variations exhibit wider fluctuation ranges, particularly intensifying near bedding interfaces [
27,
28]. In abrupt lithological transitions (e.g., sandstone–mudstone alternations), mechanical and petrophysical parameters change discontinuously across interfaces, creating distinct physical field distributions above and below the bedding plane [
29,
30]. Among these factors, the discontinuity of in situ stress across layers exerts the most substantial influence on fracture propagation [
31].
For horizontal well cross-layer fracturing, vertical stress difference (VSD) is defined as the difference between overburden stress and the minimum horizontal principal stress within a single geological layer. Interlayer stress difference (ISD) refers to the difference in minimum horizontal principal stress magnitudes across adjacent strata separated by a bedding interface [
32,
33,
34,
35,
36]. When the maximum horizontal stress is also varied in a simulation case, this variation is stated explicitly in the corresponding model setup.
Previous studies have examined bedding interface interaction, fracture deflection, multi-cluster stress shadows, and engineering controls separately [
37,
38,
39,
40,
41,
42,
43]. However, fewer studies jointly evaluate bedding interface shear failure, VSD, ISD, cluster number, injection rate, and fluid viscosity in a unified multi-cluster framework. Unlike previous studies that mainly considered single-fracture crossing or stress-shadow effects separately, this study jointly evaluates multi-cluster stress interference, bedding interface shear damage, VSD, ISD, injection rate, and fluid viscosity in one coupled fracture–matrix interface model. This framework identifies how stress shadows change the local interface failure state and thereby control fracture-height growth in thin sandstone–mudstone interbeds.
Classic fracture mechanics studies of layered materials show that fracture spacing and interaction are controlled by stress transition across adjacent layers and by crack-tip process-zone effects [
44,
45]. These concepts provide a broader mechanical basis for interpreting stress shadow interaction and cross-layer fracture arrest in multi-cluster hydraulic fracturing.
This study develops a coupled numerical model for multi-cluster cross-layer fracture propagation in sandstone–mudstone interbeds from the He-8 section of the Sulige Gas Field. The numerical model was validated against previously published true triaxial hydraulic fracturing experiments [
44]. No new true triaxial hydraulic fracturing experiments or fiber-optic monitoring tests were conducted in this study.
2. Geological Setting
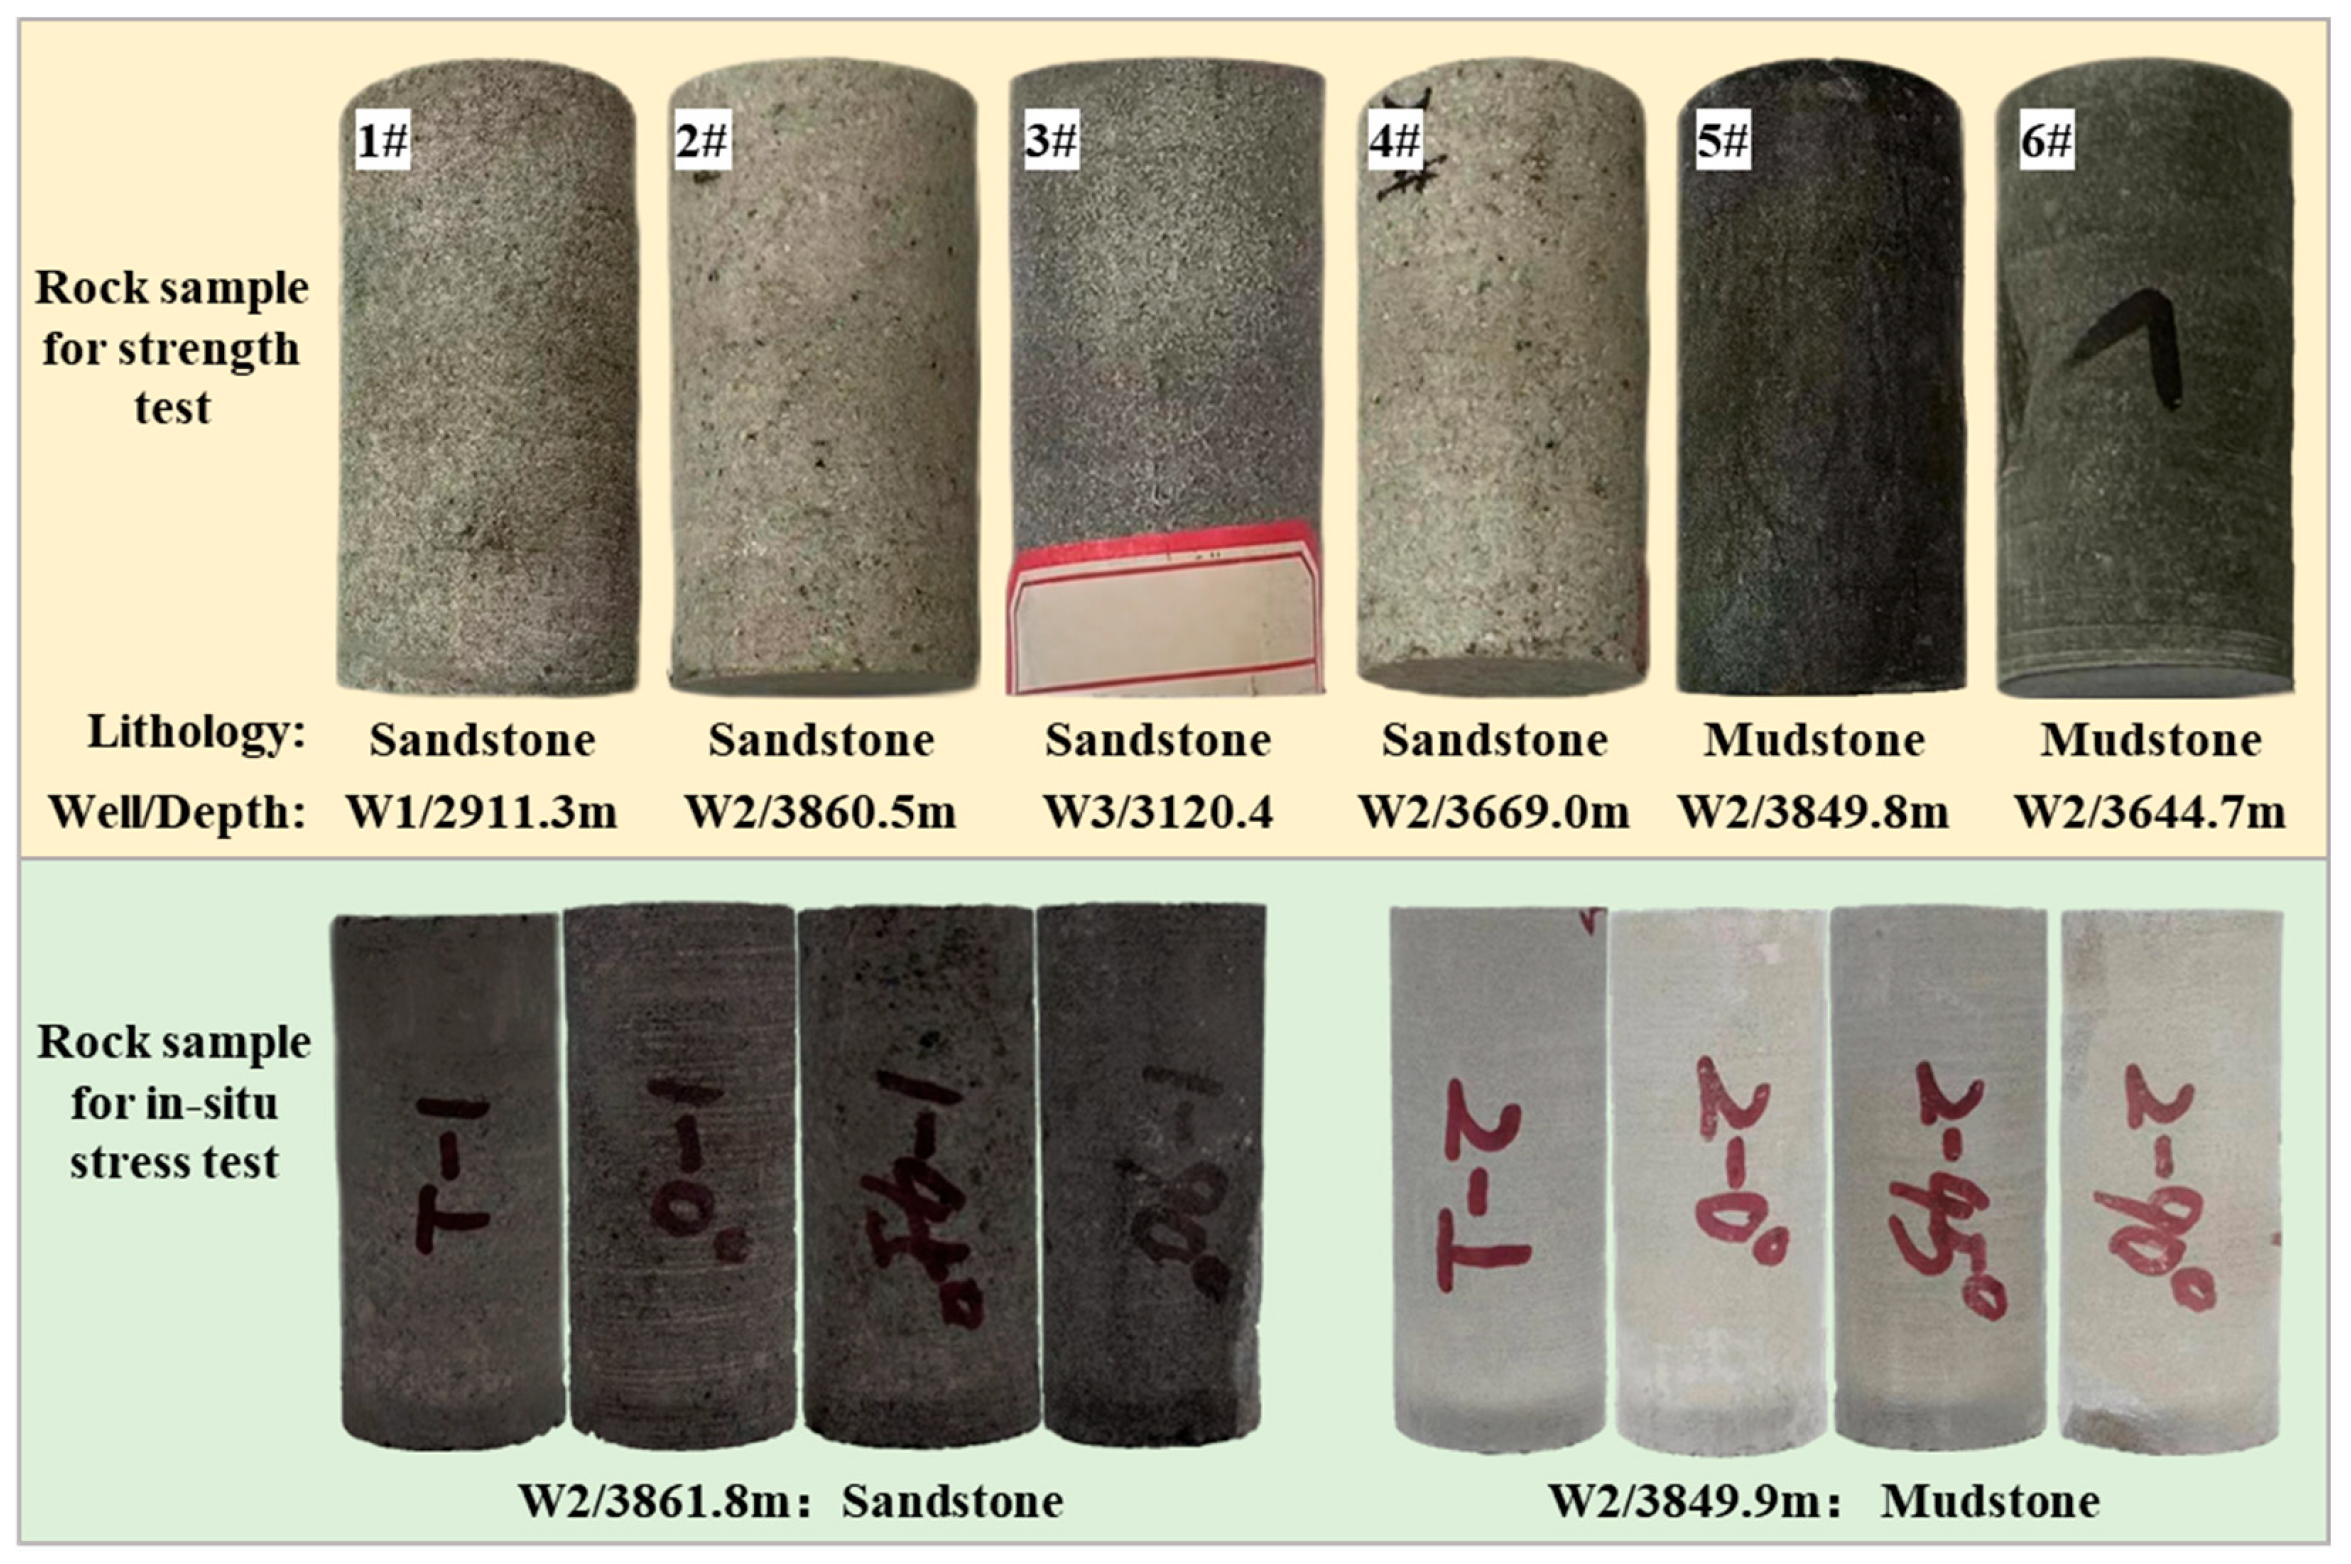
The main development area of the He-8 gas reservoir in the Sulige Gas Field is located in the northwestern Ordos Basin, northern China, with formation burial depths ranging from 3100 m to 3400 m. The depth labels in
Figure 1 correspond to individual cored wells located at locally higher structural positions; therefore, some core depths (e.g., W2) are shallower than the regional burial depth range. These cores are still from the He-8 sandstone–mudstone interbedded interval and were used to characterize the same lithologic assemblage for model parameterization. The lithology predominantly consists of bluish-gray and brown sandstones interbedded with dark gray mudstones, exhibiting strong brittleness with minor natural fractures. The well-cemented sandstone–mudstone sequences form multiple vertically stacked thin interbedded combinations. Full-diameter core samples retrieved from downhole were processed into Φ50 × 20 mm cylindrical standard cores. Triaxial compression tests and Kaiser tests were conducted to obtain rock mechanical parameters including elastic modulus, Poisson’s ratio, and compressive strength for simulating fracturing intervals in sandstone and mudstone. These experimental parameters provide critical guidance for numerical simulations of interlayer fracturing. The downhole cores and processed specimens are illustrated in
Figure 1.
The selected He-8 interval is representative of thin interbedded tight gas reservoirs in the Sulige area because it combines thick gas-bearing sandstone, 3–4 m mudstone barriers, low matrix porosity and permeability, and measurable contrasts in elastic modulus, strength, and minimum horizontal stress between sandstone and mudstone. These features make the interval suitable for evaluating cross-layer fracture arrest and communication mechanisms.
The six strength-test specimens were selected from visually intact full-diameter cores to represent the two dominant lithologies, sandstone and mudstone, and to cover the confining-pressure range needed for Mohr–Coulomb parameter fitting. Some specimens were taken from nearby depths within the same well because their lithology and core quality were comparable, allowing the confining-pressure effect to be evaluated with reduced lithologic interference.
Kaiser-effect in situ stress tests require intact oriented cores from the x, y, and z directions. Because the available core volume was limited and some intervals had already been allocated to strength and petrophysical tests, not every lithology in W1 and W2 could be used for Kaiser testing. The selected stress-test specimens were those with the most reliable orientation and integrity within the He-8 sandstone–mudstone interval.
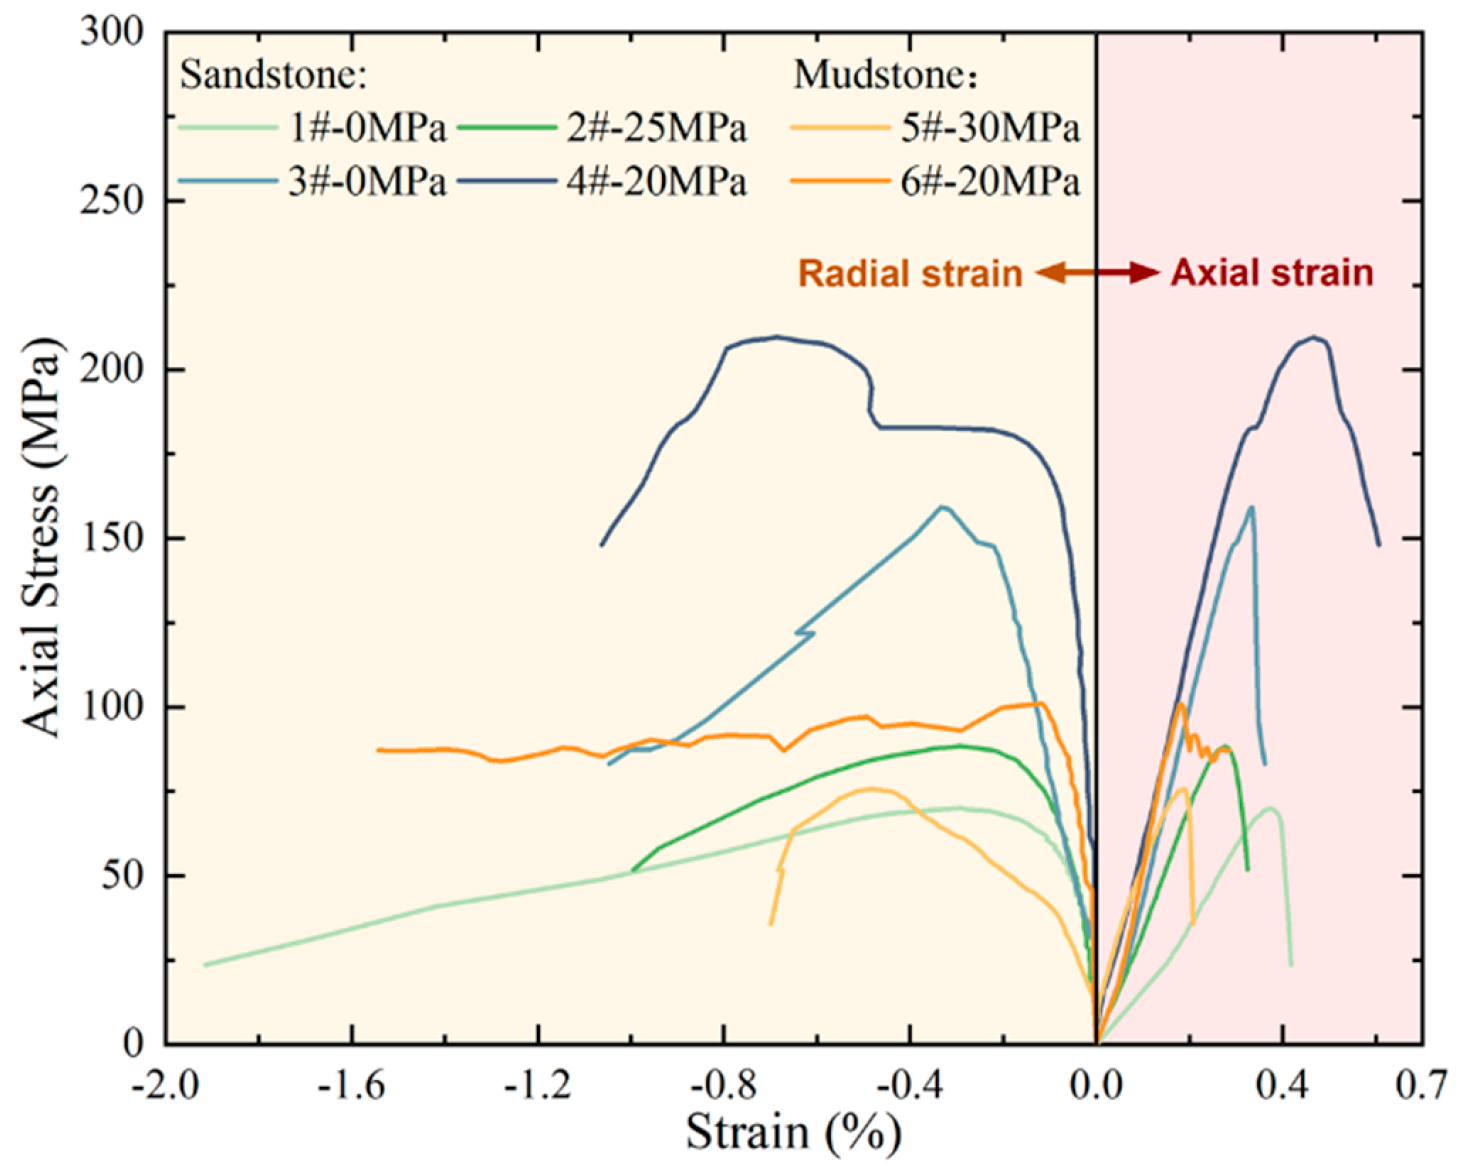
Triaxial compression tests under varying confining pressures were conducted to quantitatively evaluate the elastoplastic mechanical responses of sandstone and mudstone, with experimental results presented in
Figure 2. Sample 1#, tested under 0 MPa confinement, exhibited a relatively gentle slope and a lower peak value, indicating lower compressive strength and a more ductile failure mode. When the confining pressure increased to 20 MPa (Sample 2#), the curve displayed a steeper slope and higher peak stress, reflecting significant enhancements in both elastic modulus and compressive strength. This trend persisted in Samples 3# and 4# (25 MPa and 30 MPa, respectively), where the curves demonstrated steeper slopes within the elastic regime, followed by abrupt post-peak stress drops, characteristic of brittle failure. Mudstone specimens (Samples 5# and 6#) exhibited analogous behavioral patterns under varying confining pressures, with stress–strain curves progressively steepening and peak stresses elevating as confinement increased from 0 MPa to 20 MPa, demonstrating a transition from ductile to brittle.
The rock mechanical parameters calculated from experimental data are summarized in
Table 1. For sandstone specimens (Samples 1# to 4#), as the confining pressure increased from 0 MPa to 30 MPa, the stress–strain curves revealed a progressive enhancement in compressive strength from 70.02 MPa to 209.88 MPa, accompanied by an increase in elastic modulus from 23.17 GPa to 60.51 GPa. The Mohr–Coulomb fitting yielded a cohesion of 19.5 MPa and an internal friction angle of 43.0°. Mudstone specimens were tested under uniaxial and 20 MPa confining pressure conditions, exhibiting strength characteristics consistent with the sandstone’s parametric trends. The fitting procedure produced a cohesion of 35.5 MPa and an internal friction angle of 20.3° for the mudstone.
The microcracks inherent within rock masses propagate upon exceeding their historically sustained maximum stress thresholds, generating acoustic signals captured by acoustic emission monitoring systems. This methodology, termed the Kaiser effect method, has been extensively employed for experimental determination of in situ stress magnitudes. The three stress components can be calculated by [
45]:
where the root of
is vertical in situ stress, maximum in situ stress and minimum in situ stress, respectively, Pa.
,
and
are Kaiser stress of sampling from the x, y and z directions, Pa.
,
and
are shear stress in three directions, Pa.
Based on this approach, the evaluated in situ stress magnitudes for the simulated fracturing intervals in sandstone and mudstone are summarized in
Table 2.
Kaiser-effect stress interpretation may be affected by core orientation, sample disturbance, acoustic emission threshold selection, and limited sample number. Therefore, the stresses in
Table 2 are treated as representative values rather than exact field constants. The VSD and ISD sensitivity ranges in
Section 4.1 and
Section 4.2 were designed to evaluate how plausible stress variation changes fracture-height growth and interface shear failure.
3. FEM-Based Modeling of Sandstone–Mudstone Interbedded Formations
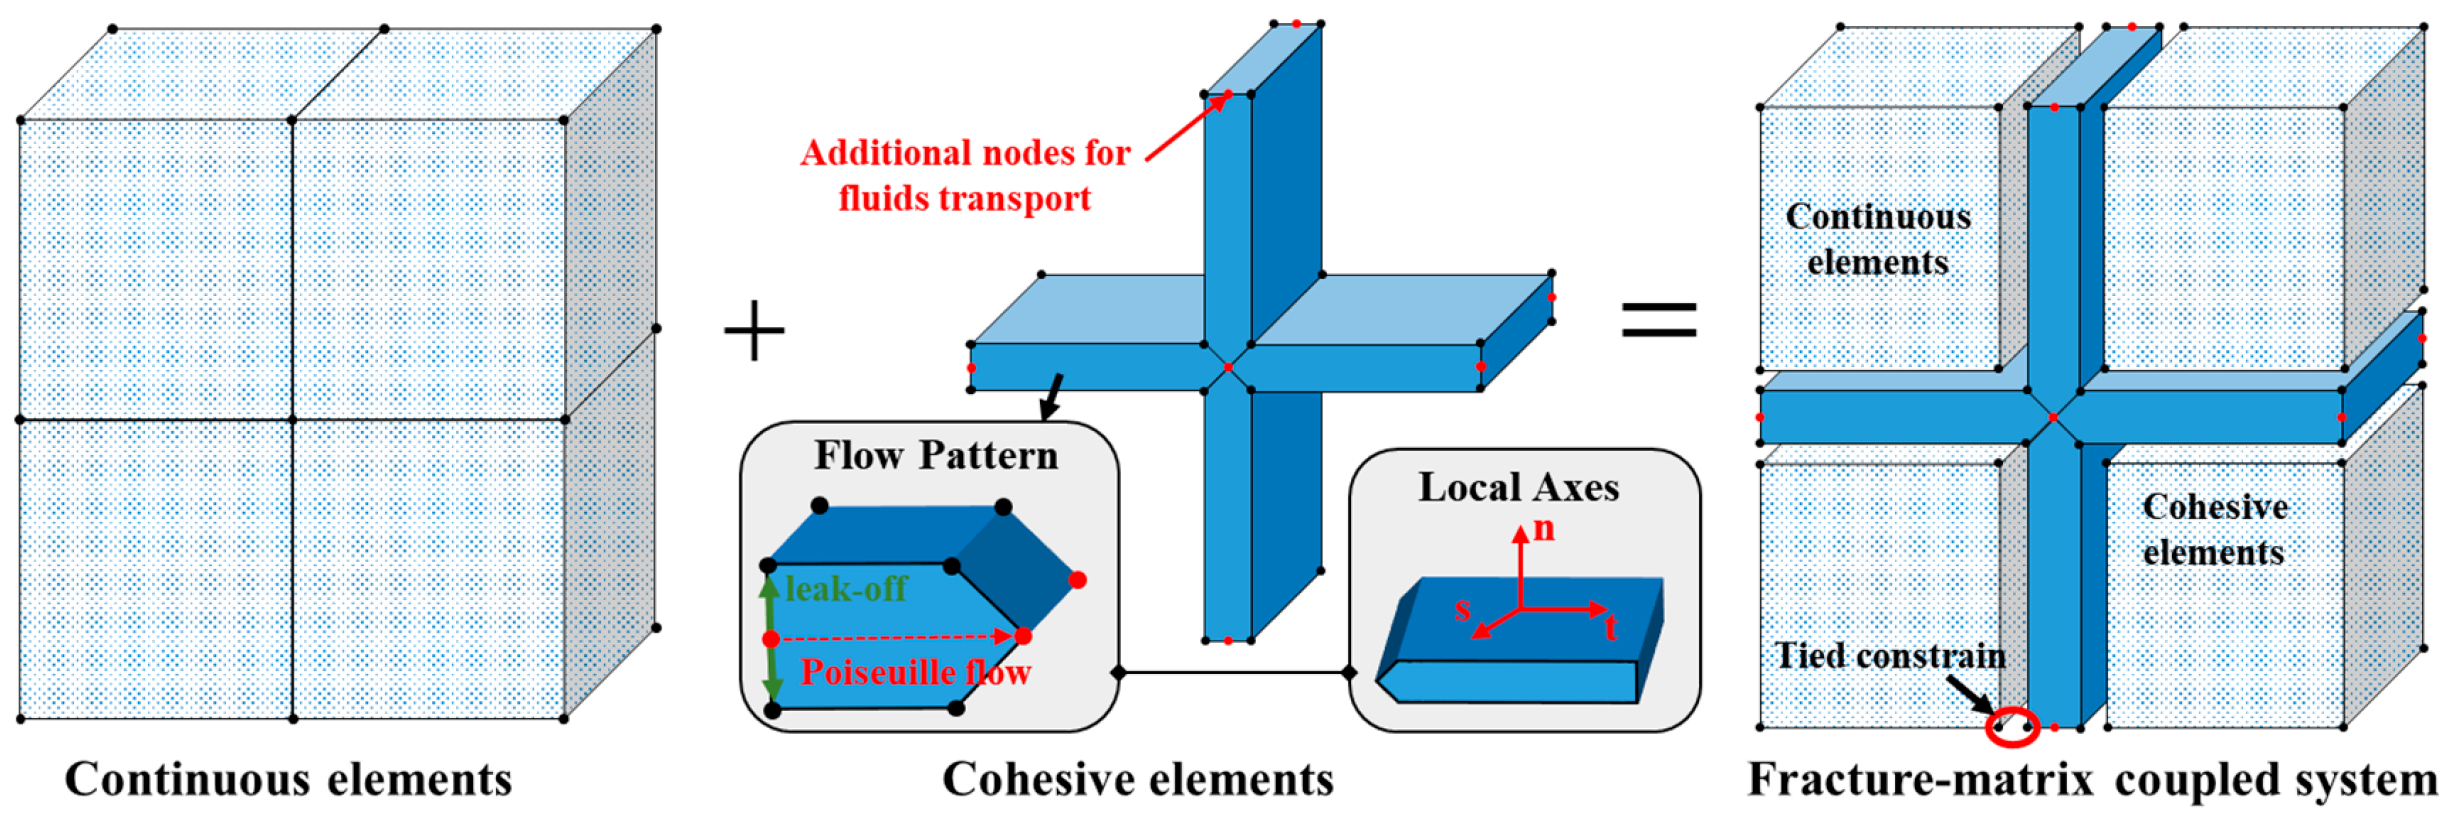
The formation rock was modeled as a continuous porous medium, with the finite element method utilized to characterize variations in formation pore pressure and stress fields caused by continuous fracturing fluid injection. To represent the initiation and propagation of hydraulic fractures within the formation, cohesive elements were inserted at element boundaries. These elements were bonded to matrix elements through shared nodal connectivity, enabling displacement transfer and fluid pressure coupling. This treatment was uniformly implemented across all meshes, establishing a fracture–matrix coupled numerical model for hydraulic fracturing. The developed finite element model is schematically presented in
Figure 3.
3.1. Pressure–Stress–Damage Coupling Equations
3.1.1. Fracture Initiation and Propagation Principle
The initiation of hydraulic fractures is characterized by the failure of cohesive elements. The failures of a preceding cohesive element trigger subsequent failures in neighboring units, representing the propagation process of hydraulic fractures. For cohesive elements, the stress is simplified as the normal stress perpendicular to the element surface and two orthogonal tangential stresses parallel to the element surface. Prior to rock failure, the stress–displacement relationship remains linear, as shown in Equation (2).
where
,
and
are stress components for the cohesive element in local axes, Pa.
,
and
are stiffness components, Pa/m.
,
and
are displacement components, m.
A 0.25 m perforation was numerically implemented in the simulated formation. The damage variable
D was employed to quantify degradation states in cohesive elements. At fracturing initiation,
D = 1 was assigned only to the initial perforation-derived fracture segment to represent a pre-opened fluid-entry path with zero cohesive strength; all other cohesive elements were initialized at
D = 0 and could fail only when the stress criterion was satisfied. The perforation length was selected to match the laboratory notch scale in the validation model and the effective perforated interval used in the field-scale simulation. The continuous injection of fracturing fluid induced progressive damage in cohesive elements, initiating a gradual increase in
D from 0 to 1. Failure of the cohesive element initiates when its stress satisfies Equation (3), signifying the onset of damage at
D = 0.
where
presents cohesive elements only damaged under tensile stress, if
,
.
,
and
are the critical stresses in each direction, Pa.
The damage variable
D is calculated by the following equation:
where
is displacement at the cohesive element damaged, m.
is displacement at fracture initiation, m.
is the current displacement, m.
When rock failure initiates (i.e.,
D > 0), stress decreases with increasing displacement, with the reduction magnitude quantified through the damage variable
D.
where
,
and
are stress under linear elastic conditions, which can be calculated by Equation (2).
3.1.2. Flow–Solid Coupling Equation
The governing equation of the stress field of fluid–solid coupling is:
where
is the stress tensor for the matrix, Pa. Subscript
i,
j =
x,
y,
z under the circumstance of three dimensions.
is Biot’s coefficient, unitless.
is external stress, Pa. This equation follows the Einstein notation.
Darcy’s law is employed to describe the flow of fracturing fluid in the matrix and undamaged cohesive units.
where
is the flow velocity in porous media, m/s;
is the permeability of the formation, m
2.
is the fracturing fluid’s specific weight, unitless.
is the gradient of the pore pressure, Pa/m.
The flow of fracturing fluid within the fracture is simplified as pressure gradient-driven tangential flow (Poiseuille flow between two parallel plates) and normal leak-off driven by the pressure difference between the fracture and matrix. The tangential flow provides the driving force for fracture propagation, while the normal leak-off establishes the coupling relationship between the fracture and the matrix, as shown in Equation (7).
where
is the tangential flow rate in the fracture, m
3/s.
is the fracture opening, m.
is fracturing fluid viscosity.
is the tangential fluid pressure gradient in the fracture, Pa/m.
is the leak-off rate of the fracturing fluid from the fracture to the matrix on each side of the fracture surface, m/s.
is the leak-off coefficient, m/(s·Pa).
is the pore pressure in the fracture, Pa.
The normal leak-off coefficient c was set to 1.0 × 10
−13 m/(s·Pa) for sandstone and 1.0 × 10
−14 m/(s·Pa) for mudstone, consistent with the permeability contrast listed in
Table 3 and with Darcy-type pressure-driven filtration from the fracture into the matrix. Sensitivity to leak-off is mainly reflected through the viscosity comparison in
Section 4.3, where increased viscosity reduces fluid loss and promotes vertical fracture growth.
Matrix porosity and permeability control normal leak-off from the fracture to the matrix and therefore affect fracture-tip pore pressure. In low-permeability He-8 sandstone (porosity about 6%, permeability about 0.4 mD), limited leak-off can help maintain fracture pressure, whereas pore-pressure-driven dilation ahead of the fracture tip may locally modify effective normal stress on the bedding interface. Because dilatancy hardening is not explicitly resolved, the reported ISD thresholds should be interpreted as model-specific values that may shift where dilation, permeability anisotropy, or pressure-dependent permeability are significant.
The governing flow equations for the undamaged state (
D = 0) and fully damaged state (
D = 1) should be read with the equation numbering in this section. For intermediate damage states (0 <
D < 1), the fluid transport mechanism transitions from Darcy flow to Poiseuille flow, as described by the transition equation below.
where
is the volume flow rate vector, m
3/s.
is a function of fracture opening
d.
is the critical width while the cohesive element begins to be damaged, m.
For 0 < D < 1, the flow transition function is used as a damage-weighted interpolation between Darcy seepage in undamaged cohesive units and Poiseuille flow after fracture opening. The function was calibrated by matching the laboratory fracture morphology and injection-pressure evolution. Because direct aperture-scale measurements during damage evolution were unavailable, this transition treatment is acknowledged as a model assumption.
3.1.3. Stress Shadow
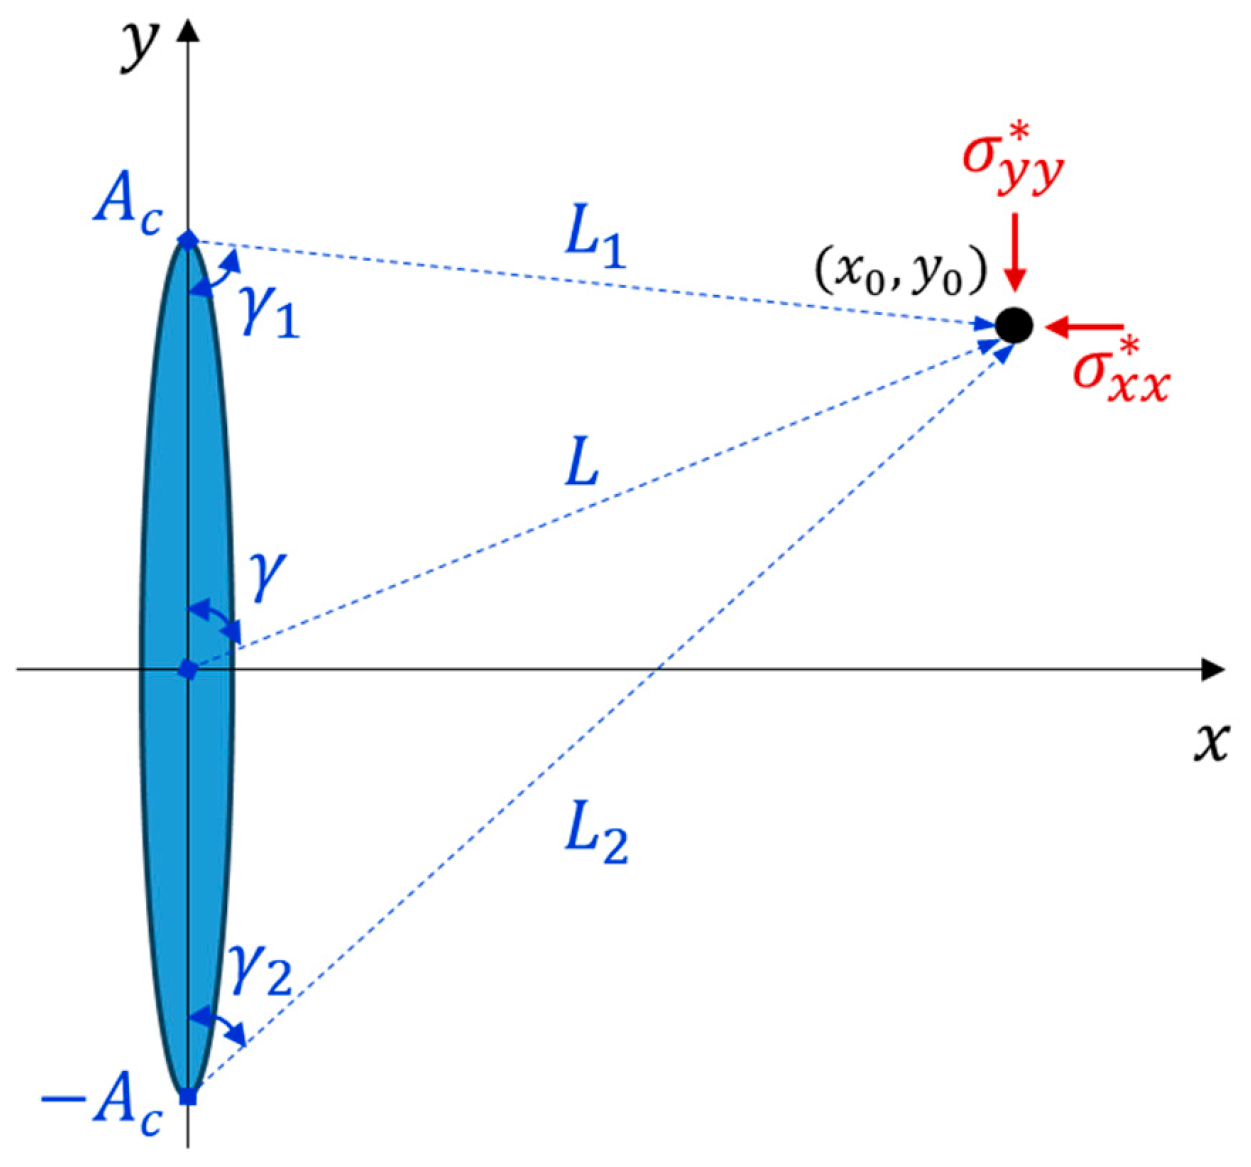
The initiation of a single hydraulic fracture generates an additional stress field, also referred to as a stress shadow or stress perturbation. Each additional stress field generated by a hydraulic fracture is independent of the others and linearly superposed. A schematic diagram of the additional stress field generated by a single hydraulic fracture at point (
x0,
y0) in the plane is shown in
Figure 4.
The magnitude of the additional stress generated by a single hydraulic fracture at this point is given by:
where
and
are the two components of the additional stress at point (
x0,
y0), Pa.
P is the net pressure within the fracture, Pa.
L,
L1, and
L2 are the distances from the upper endpoint, central point, and lower endpoint of the fracture to point (
x0,
y0), respectively, m;
γ,
γ1, and
γ2 are the angles between the lines connecting the upper endpoint, central point, and lower endpoint of the fracture to point (
x0,
y0), respectively, deg.
3.2. Interlayer Tensile–Shear Coupled Failure Criterion
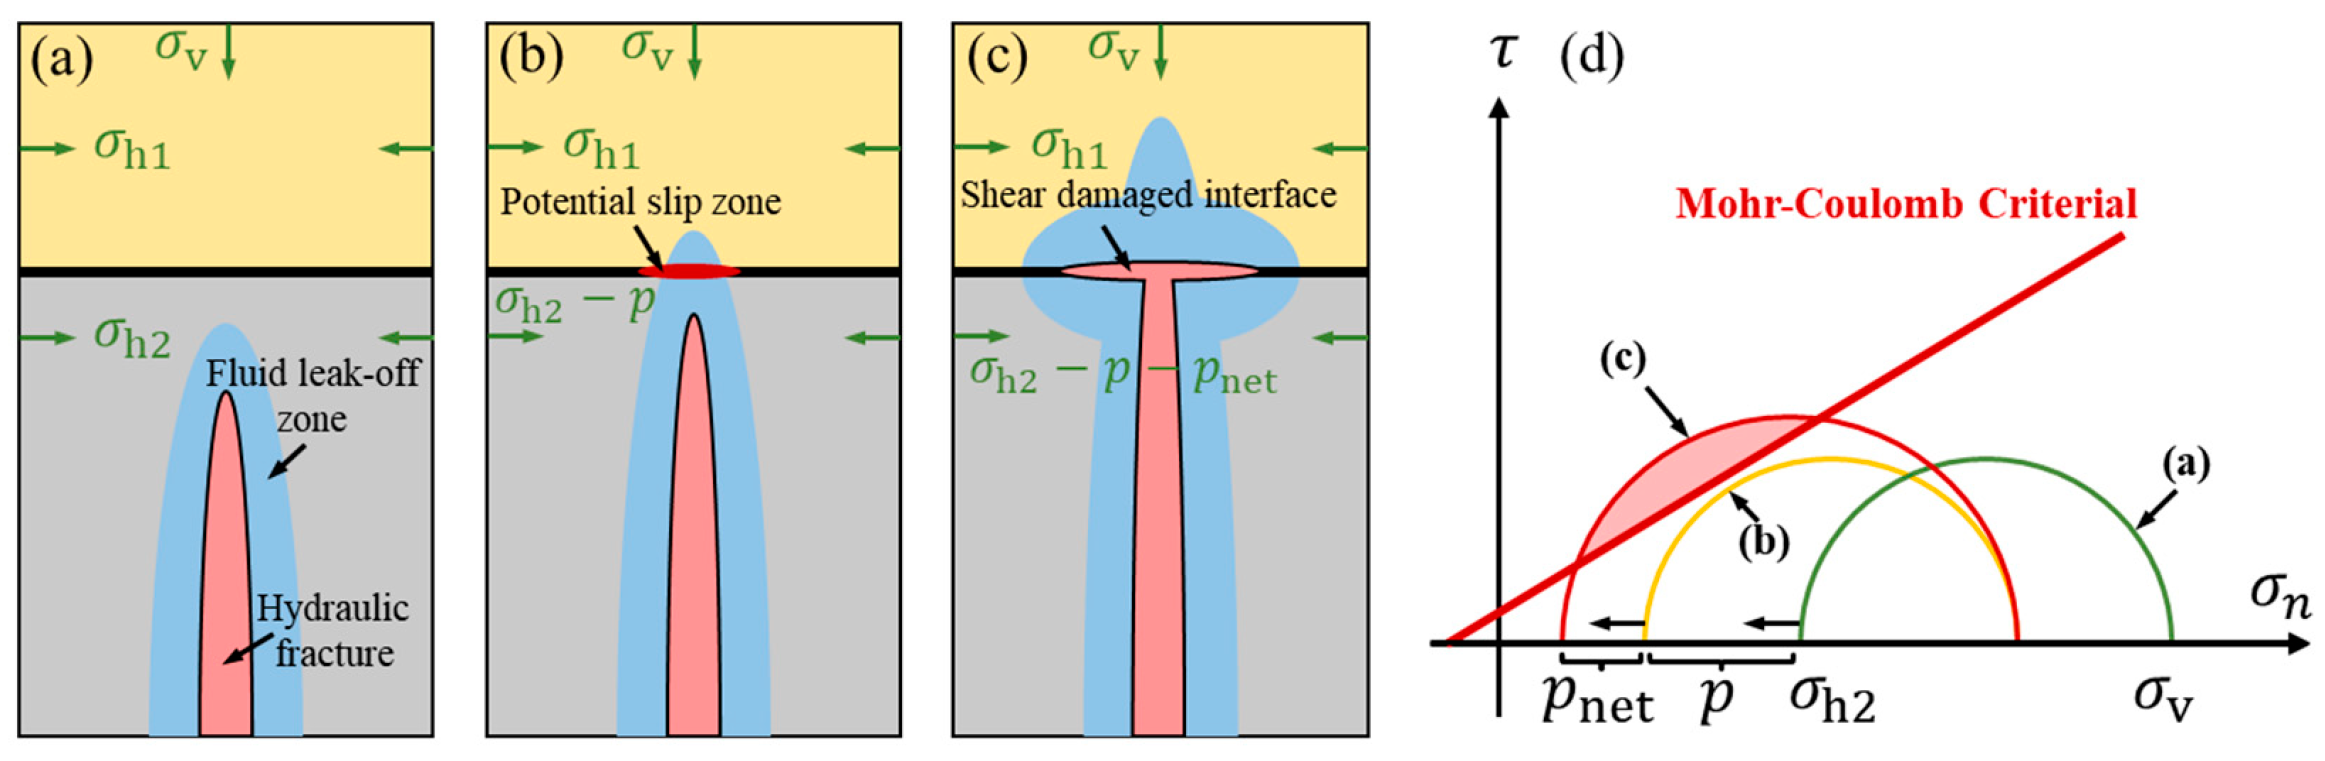
The Mohr–Coulomb criterion was employed to characterize the failure-slip behavior of interlayer interfaces during fracturing. Direct shear tests were conducted under normal stresses of 5 MPa and 10 MPa, yielding measured shear strengths of 5.41 MPa and 8.44 MPa, respectively. Fitting via the Mohr–Coulomb equation provided an internal friction angle of 31.2° and a cohesion of 2.4 MPa for the interlayer interfaces.
where
is shear strength under different normal stress, Pa.
is the cohesion of the interlayer, Pa.
is normal stress (also vertical in situ stress in this research), Pa.
is the internal friction angle, °.
During fracturing, fluid leak-off and fracture-tip pressure perturb the local effective stress state near the bedding interface. The interface failure assessment should therefore project the local normal and shear tractions onto the bedding interface coordinate system before applying the Mohr–Coulomb criterion. In the present model, ISD is treated as a controlling stress contrast rather than as a direct substitute for the interface shear traction
Figure 5.
Bedding interfaces were represented by equivalent Mohr–Coulomb parameters obtained from direct shear tests. Local roughness, mineralogical heterogeneity, and natural fractures were not explicitly resolved. These features may locally increase or decrease interface shear strength, alter leak-off, and promote asymmetric fracture diversion; therefore, the results should be interpreted as first-order mechanistic trends for layered sandstone–mudstone systems.
3.3. Model Validation
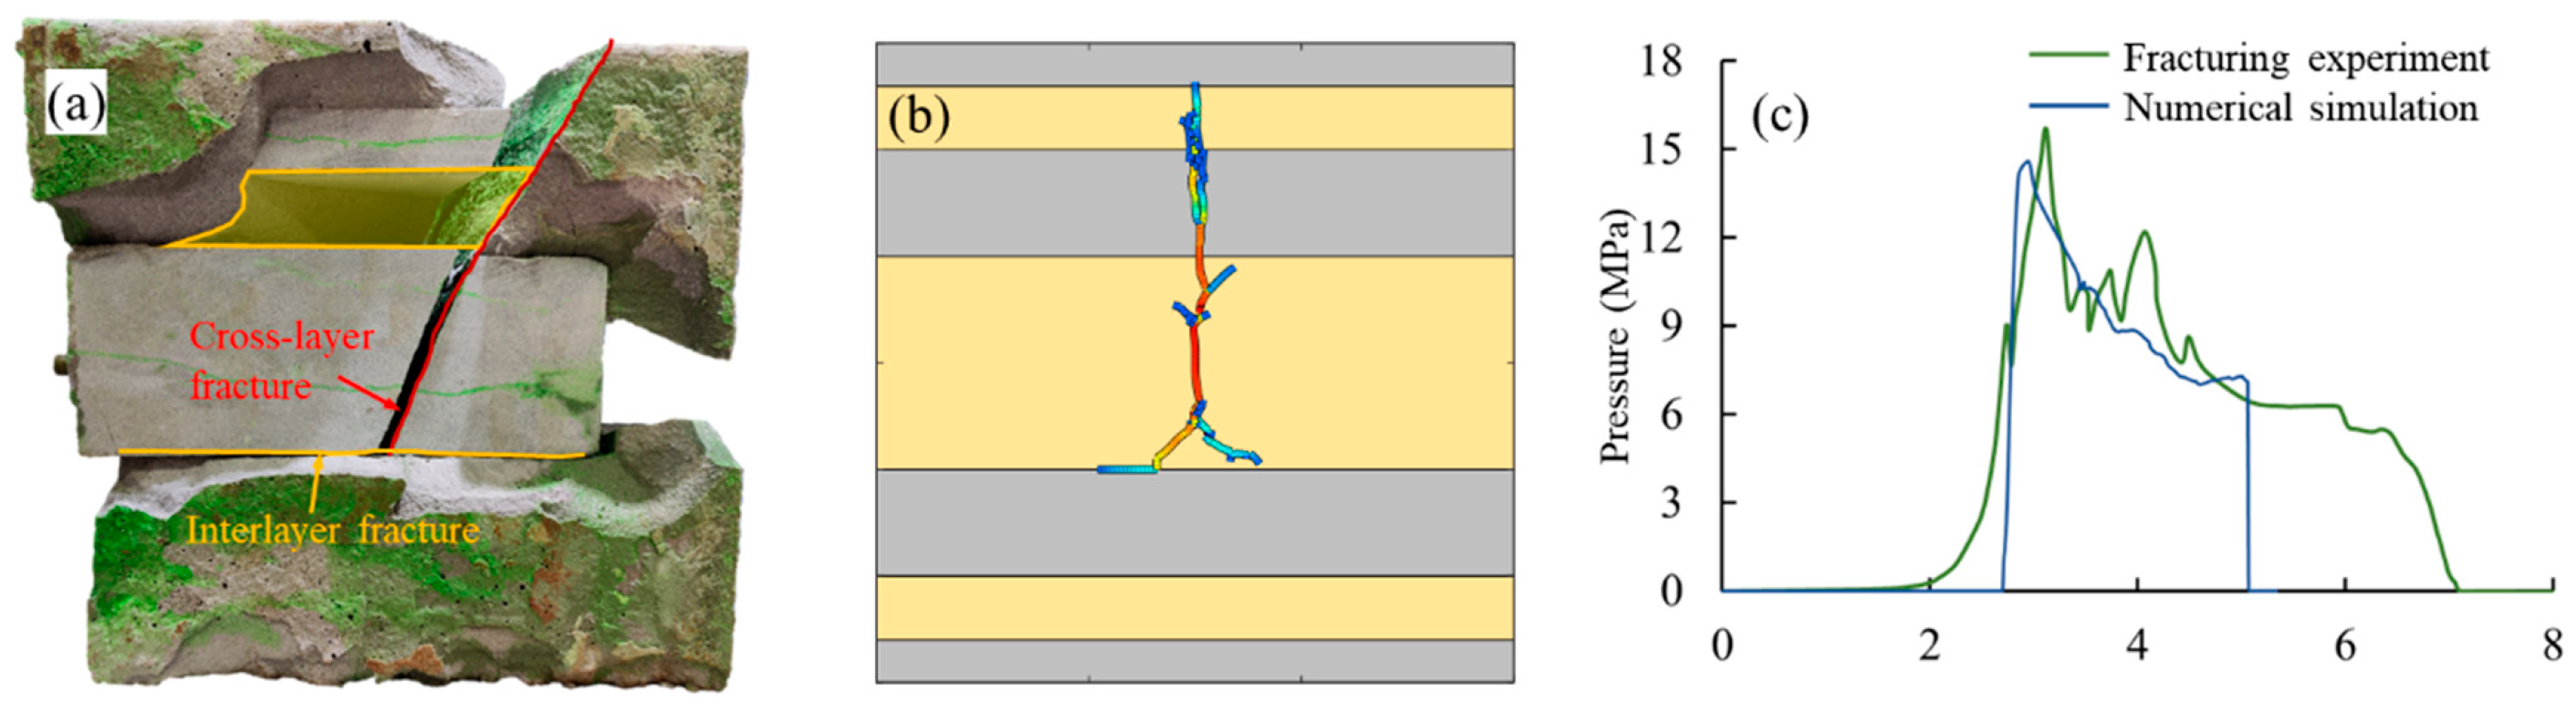
The reliability of the model was validated using laboratory true triaxial hydraulic fracturing experimental results from Li et al. [
44]. A numerical simulation model measuring 300 mm × 300 mm was established, consistent with the dimensions of the experimental specimen. Matrix elements were treated as linear-elastic porous media, while cohesive elements were inserted at element boundaries and along bedding interfaces to capture tensile fracture propagation and interface damage. Normal displacement was constrained at external boundaries according to the imposed in situ stress state, and injection was applied at the perforation elements. The parameters adopted in the numerical simulation are listed in
Table 3.
Because the available full-diameter cores were limited, the mechanical parameters in
Table 3 were selected as representative measured values consistent with the tested lithologies rather than as mean values from repeated large-sample statistics. This limitation is now stated explicitly.
The post-fracturing fracture geometry and injection pressure curves are presented in
Figure 6. Under identical fracturing parameters, the numerical simulation produced an asymmetrically propagating T-shaped fracture morphology, consistent with laboratory experimental observations. The fluid pressure characteristics at the injection point in the simulation also closely matched experimental measurements. These results demonstrate that the numerical model effectively captures the interlayer fracture propagation characteristics in thinly interbedded sandstone–mudstone formations.
The
y-axis of
Figure 6c was checked against the source injection-pressure data and corrected to the proper MPa scale. Because the validation specimen measured 300 mm × 300 mm, the pressure comparison is used to verify the pressure trend, breakdown timing, and relative agreement between the experiment and simulation rather than to represent field-scale treatment pressure.
3.4. Construction of the Sandstone–Mudstone Interbedded Formation Model
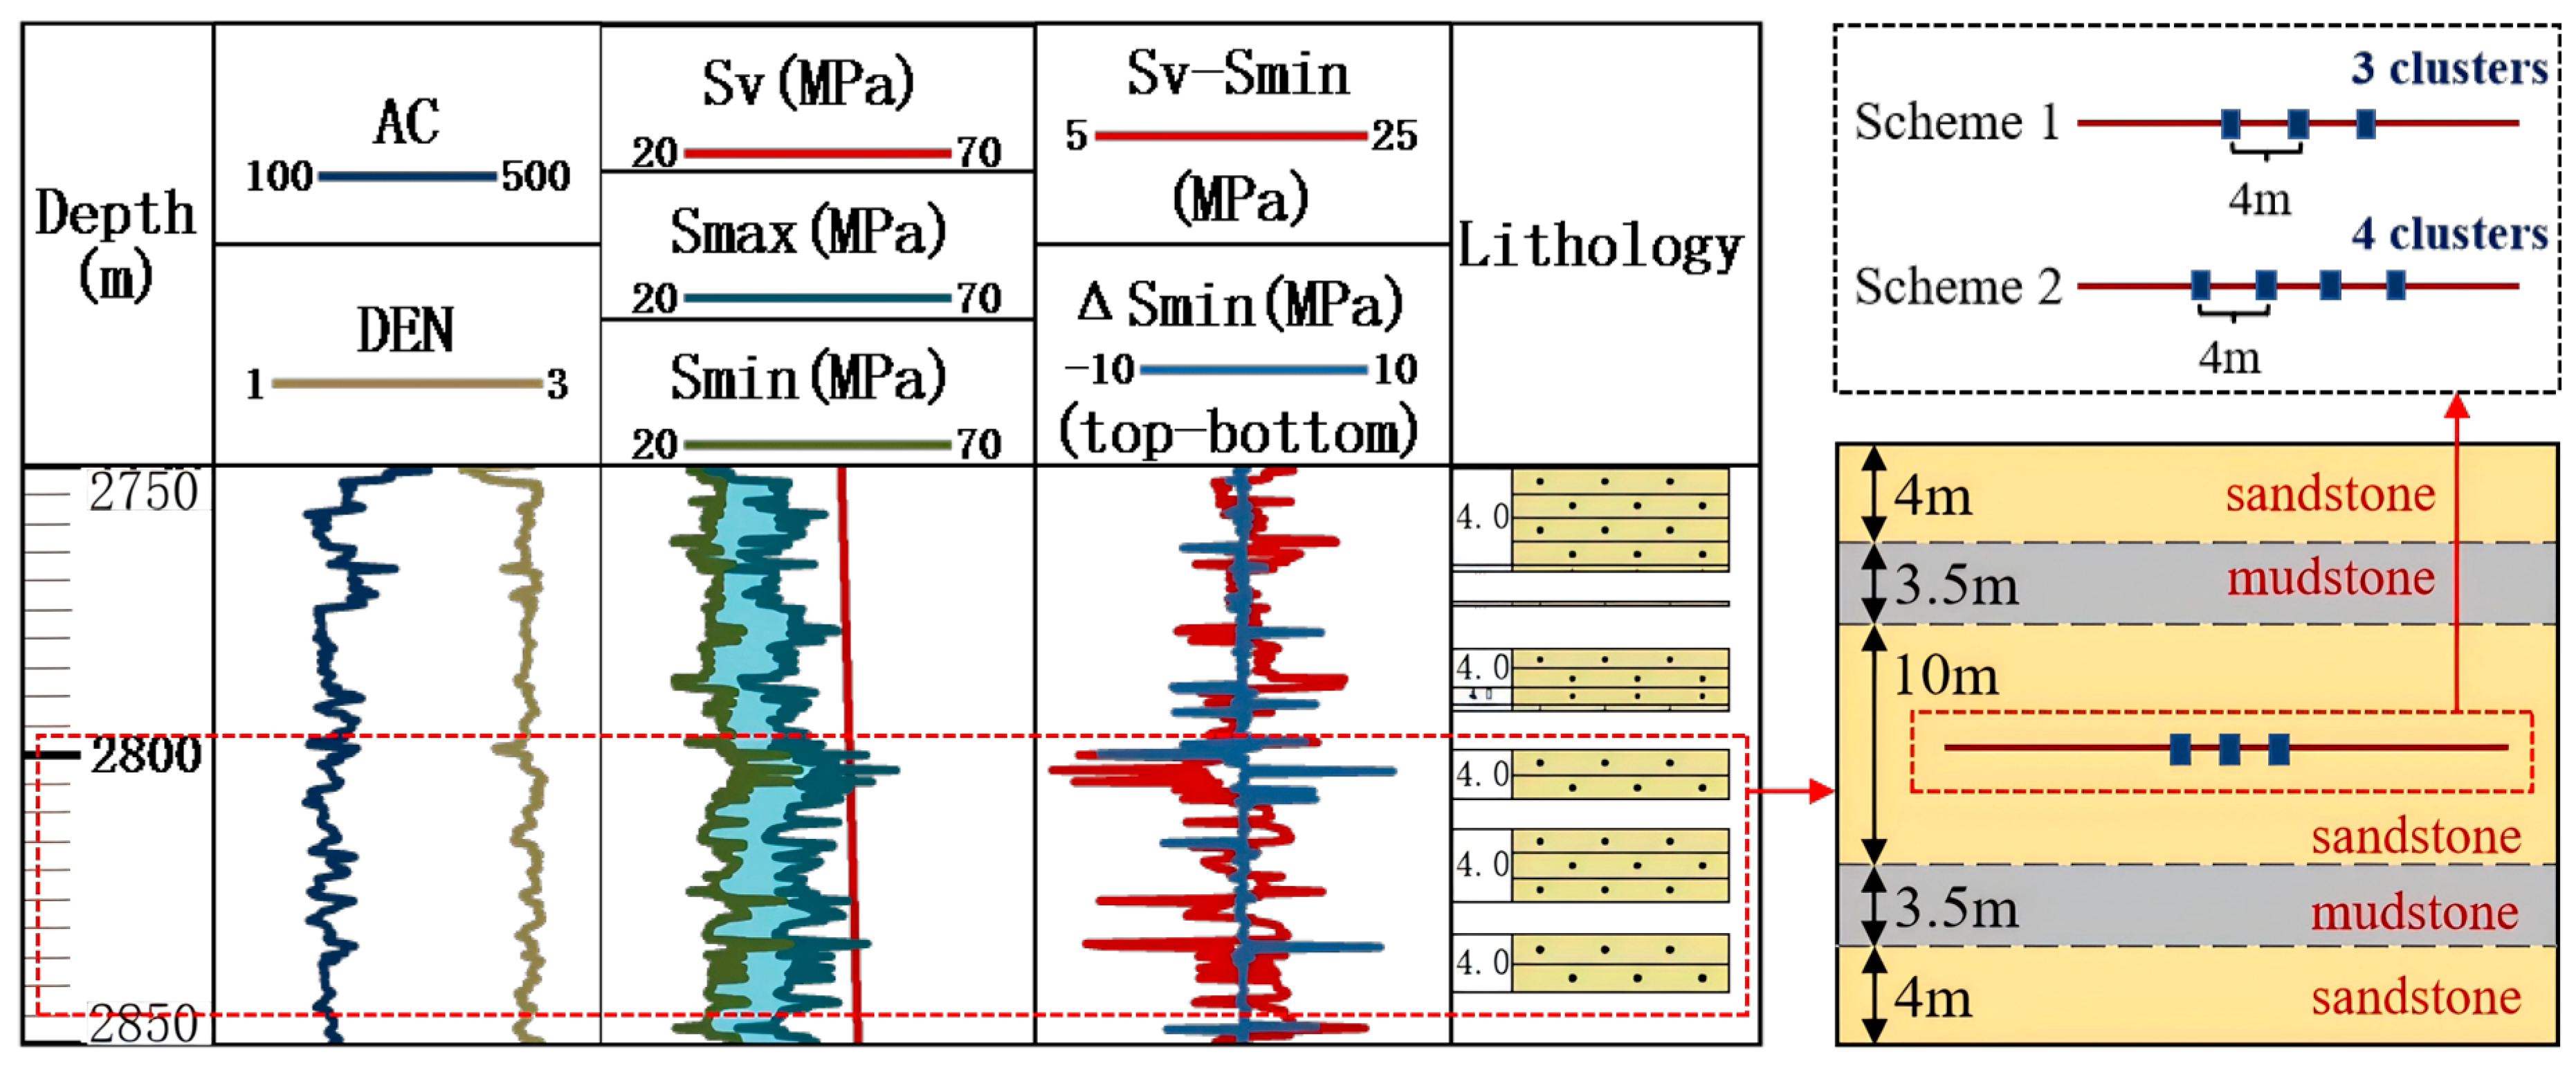
Based on representative logging data (
Figure 7), the main gas-bearing sandstone layers in Member He-8 are typically interbedded with mudstones. The stratigraphic assemblage is dominated by thick gas-bearing sandstones vertically separated by thin mudstone interlayers, with one potential sandstone layer requiring communication via vertical fractures for commingled production. Geomechanical parameters were obtained from experimental tests. Engineering parameters were determined by considering the operational capacity of field operation equipment and the lateral distribution characteristics of sand bodies, with two scenarios of 3 or 4 clusters set and a cluster spacing of 4 m. Accordingly, two numerical simulation schemes were designed as follows. Scheme 1: Three clusters of perforations with a cluster spacing of 4 m. Scheme 2: Four clusters of perforations with a cluster spacing of 4 m.
The three-cluster and four-cluster schemes were selected according to field operational capacity, typical stage design in the He-8 interval, and the lateral distribution of thin sand bodies. A constant 4 m cluster spacing was used to isolate the influence of cluster number and stress-shadow superposition from the influence of spacing.
Figure 7 presents the logging interpretation and model schematic using a consistent vertical scale. The AC and DEN curves were used to identify lithologic boundaries: sandstone intervals are interpreted from the combined acoustic and density responses of the gas-bearing reservoir, whereas mudstone interlayers show contrasting density/acoustic signatures. These log-defined layer thicknesses were then scaled into the numerical model.
In all simulation schemes, the model was constructed as a cuboid with a length of 30 m, and the thickness of specific layers was scaled according to actual logging data. Logging data show that the middle thick sandstone layer is approximately 10 m thick, the adjacent upper and lower formations are mudstone interlayers with a thickness of 3.5 m each, and there is an additional thin sandstone reservoir with a thickness of 4 m on the outer side of each mudstone interlayer. Thus, the model is composed of one 10 m thick sandstone layer, two 3.5 m thick mudstone layers and two 4 m thick sandstone layers stacked in sequence. For perforation design, the optimal scenario is that fractures propagate through the middle thick sandstone layer to achieve indirect fracturing. To facilitate indirect fracturing, perforations are positioned at the middle of the thick sandstone layer with a length of 20 cm.
In the field-scale He-8 model, matrix elements were treated as linear-elastic porous media, while cohesive elements were inserted at element boundaries and along bedding interfaces to capture tensile fracture propagation and interface damage. Normal displacement was constrained at external boundaries according to the imposed in situ stress state, and injection was applied at the perforation elements. This configuration was used to isolate the roles of VSD, ISD, stress shadow, and interface failure in the comparative simulations.
The baseline simulation conditions were ISD = 2 MPa, injection rate = 6 m
3/min, and fluid viscosity = 20 mPa·s for VSD sensitivity; VSD = 10 MPa, injection rate = 6 m
3/min, and fluid viscosity = 20 mPa·s for ISD sensitivity; and ISD = 4 MPa for the engineering parameter comparison.
Section 4 refers to these settings instead of repeating them.
4. Results and Analysis
4.1. Effect of Vertical–Horizontal Stress Difference
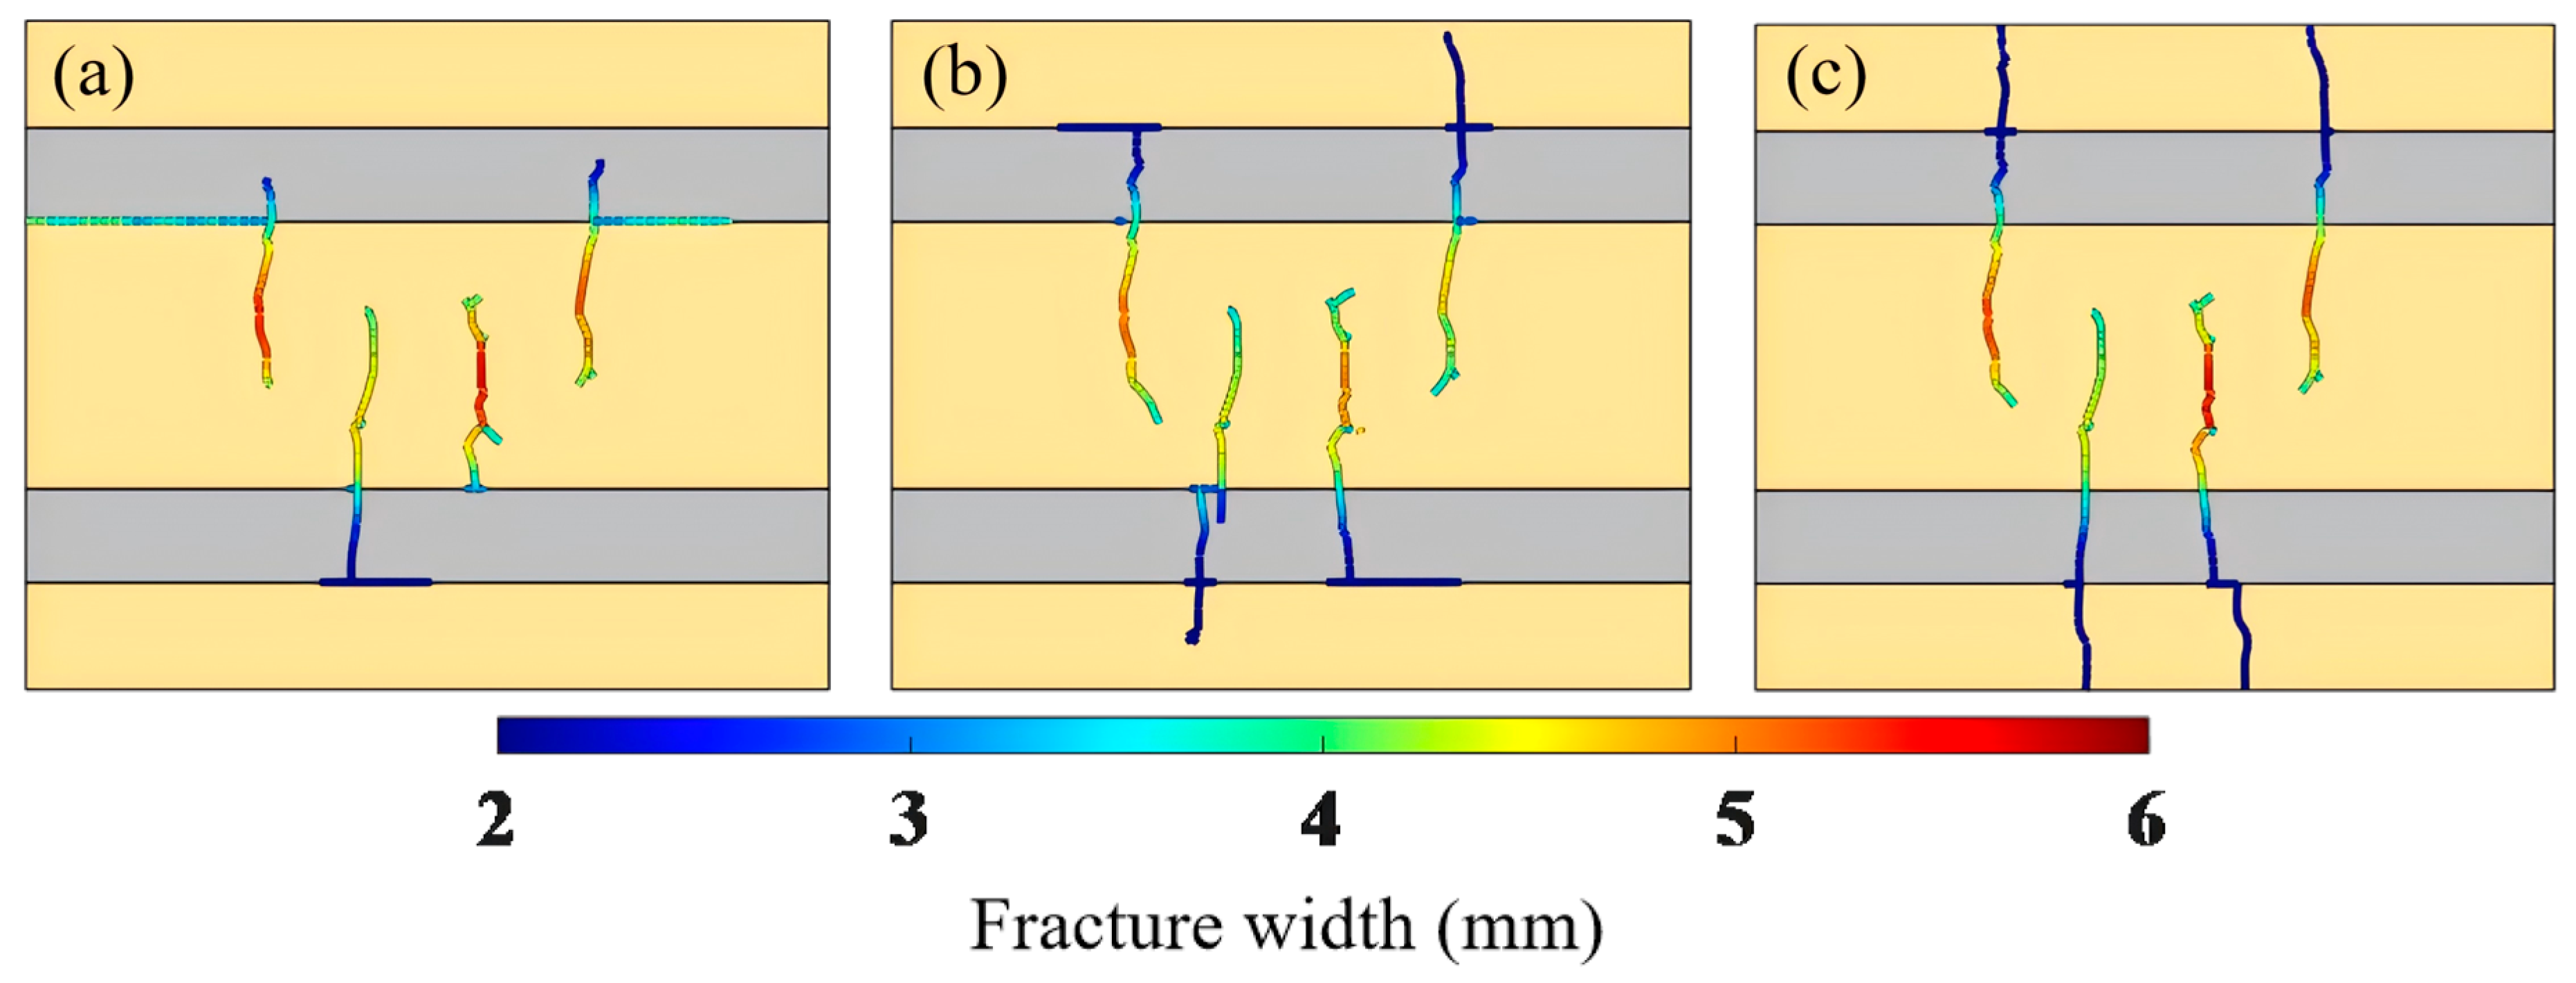
During the initiation of multi-cluster fractures, inter-cluster interference exacerbates the complexity of fracture morphology. Specifically, it manifests as the complementarity of propagation directions among multi-cluster fractures after initiation and the backward propagation of adjacent fractures. To clarify the influence of the VSD on the propagation morphology of multi-cluster fractures, simulations were performed to investigate the vertical tortuous propagation characteristics of three-cluster fractures under VSD of 6 MPa, 10 MPa, and 14 MPa, respectively. The VSD sensitivity simulations followed the baseline settings described in
Section 3.4. The results are shown in
Figure 8.
Figure 8a shows the propagation morphology of three-cluster fractures at a vertical–horizontal in situ stress difference of 6 MPa. Under the influence of inter-cluster interference, hydraulic fractures propagate in a staggered manner after initiation, exhibiting vertical complementarity among the three clusters: Cluster 1 and Cluster 3 propagate downward, while Cluster 2 propagates upward. This regular complementary propagation arises because the additional stress field generated by the downward propagation of Cluster 1 creates different propagation resistances for the upper and lower halves of Cluster 2, making upward propagation easier for Cluster 2. By the same mechanism, Cluster 3 is driven to propagate downward. In fact, this process occurs within an extremely short time, making it difficult to artificially determine the sequence of propagation. The propagation direction of a given cluster is the result of global energy minimization.
Figure 8b presents the propagation morphology of three-cluster fractures at a vertical–horizontal in situ stress difference of 10 MPa. After increasing the vertical–horizontal in situ stress difference by 4 MPa, the trend of vertical complementary propagation among multi-cluster fractures remains unchanged. However, the interaction mode between hydraulic fractures and interlayer interfaces shifts from induced diversion of hydraulic fractures to penetration of hydraulic fractures through interlayer interfaces, indicating that increasing the vertical–horizontal in situ stress difference can enhance the cross-layer capability of hydraulic fractures.
Figure 8c displays the propagation morphology of three-cluster fractures at a vertical–horizontal in situ stress difference of 14 MPa. With a further 4 MPa increase in the vertical–horizontal in situ stress difference, the fracture heights of Cluster 1 and Cluster 3 become larger, and both penetrate the mudstone interlayers.
Under the same simulation parameters, the staggered propagation characteristics of hydraulic fractures after initiation under vertical–horizontal in situ stress differences of 6 MPa, 10 MPa, and 14 MPa for four-cluster perforation were simulated, as shown in
Figure 9. At the same cluster spacing of 4 m, four-cluster perforation is subject to more severe stress interference. For example, by comparing
Figure 8a and
Figure 9a, under the same vertical–horizontal in situ stress difference, the fracture height of four-cluster perforation is smaller, and the vertical propagation of Clusters 2 and 3 located in the middle of the interval is severely restricted. In contrast, for the three-cluster perforation, the middle Cluster 2 can propagate through the layers. When the number of clusters is four, Clusters 2 and 3 are not only affected by the additional stress generated by the fractures of Clusters 1 and 4, propagating mainly downward but also repel each other and propagate backward. This results in the fracture of Cluster 2 in the figure being induced to divert by the interlayer interface after penetrating the mudstone interlayer. Although it penetrates the layer, it fails to connect the isolated sandstone layers and thus does not significantly improve productivity. With the increase in the vertical–horizontal in situ stress difference, the influence of inter-cluster interference on fracture propagation weakens.
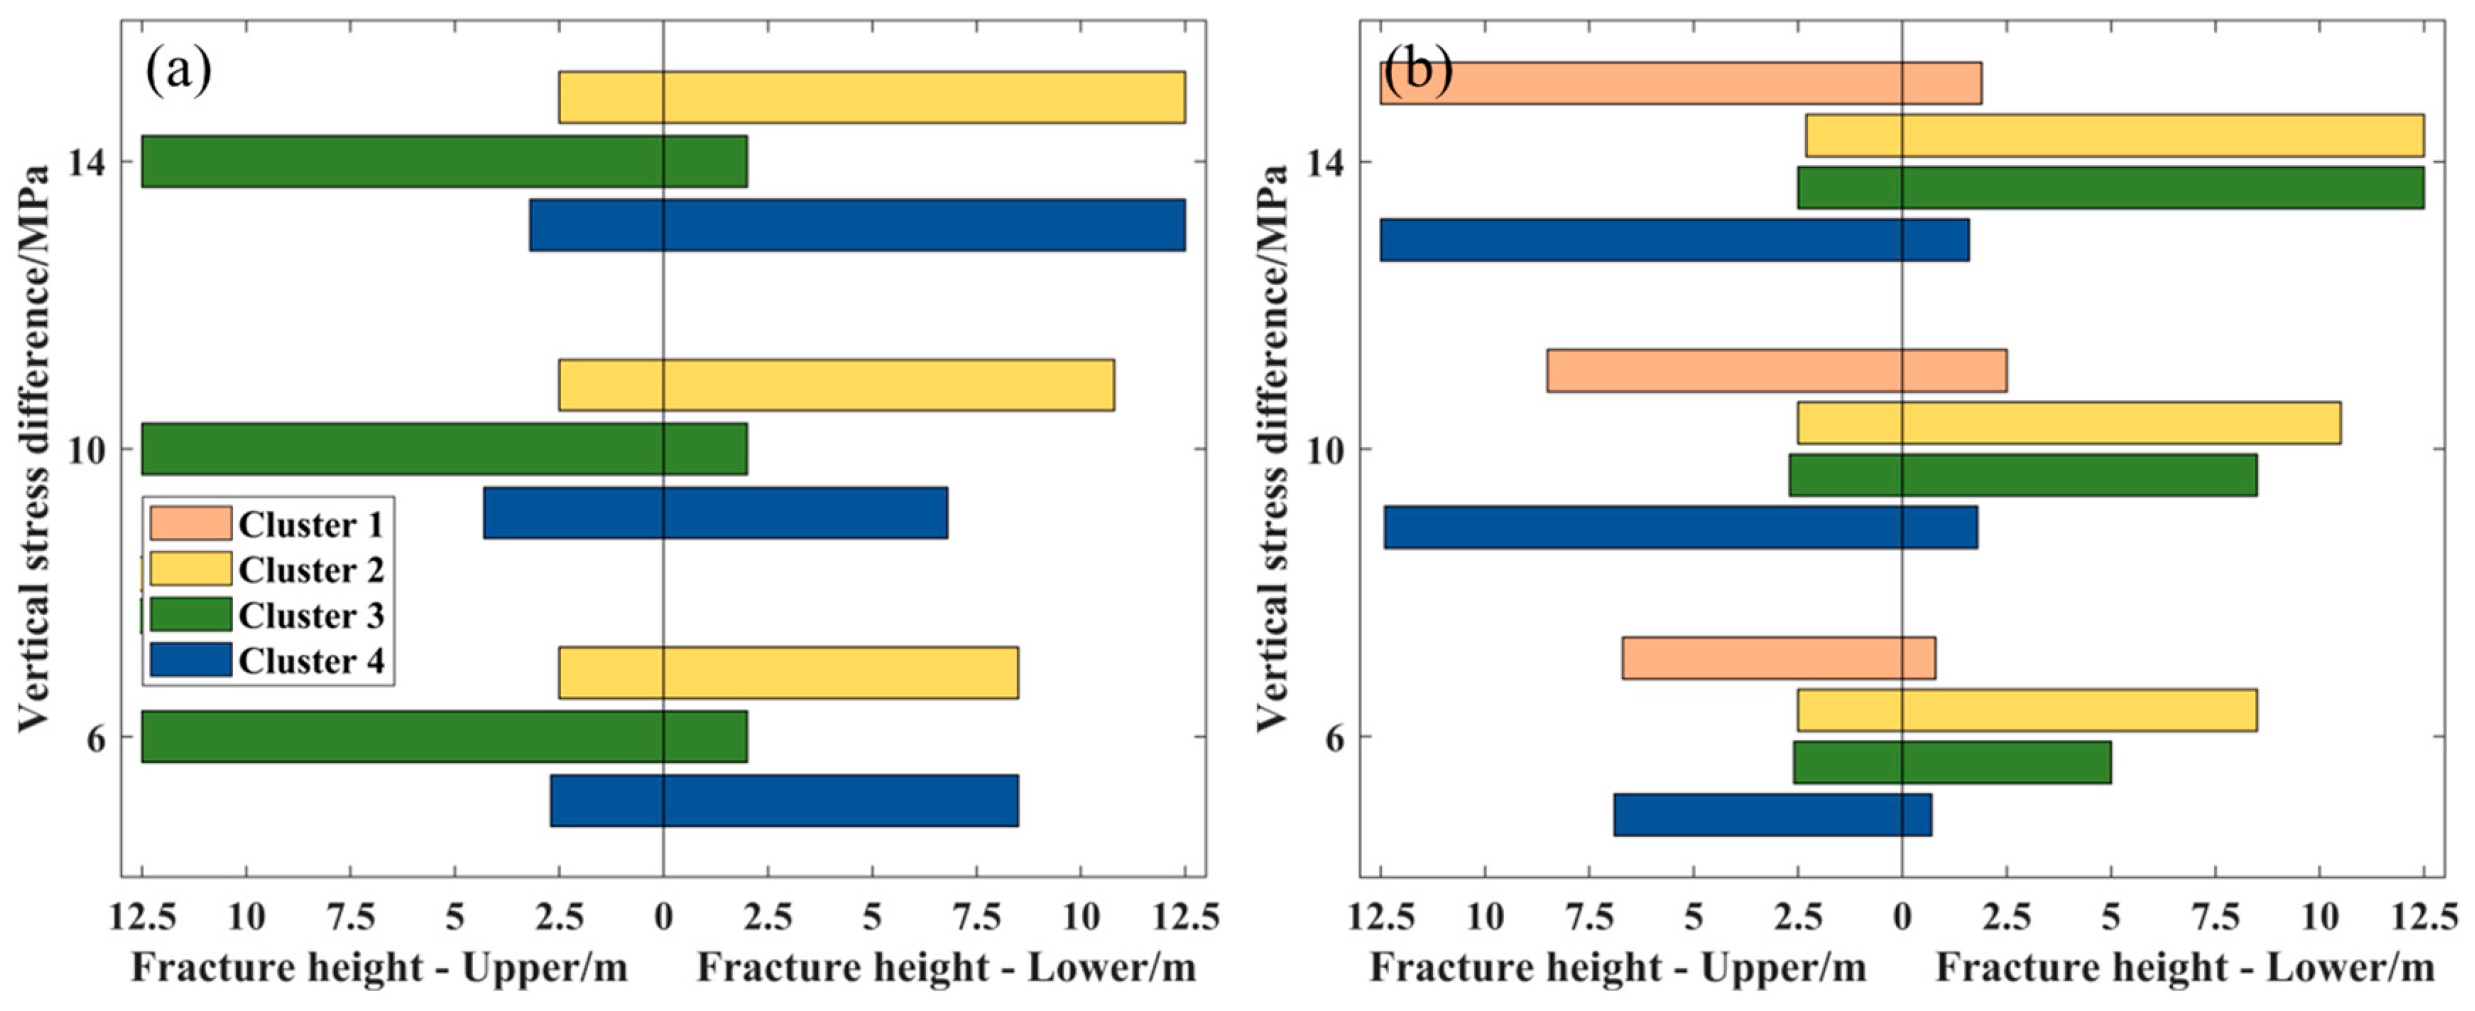
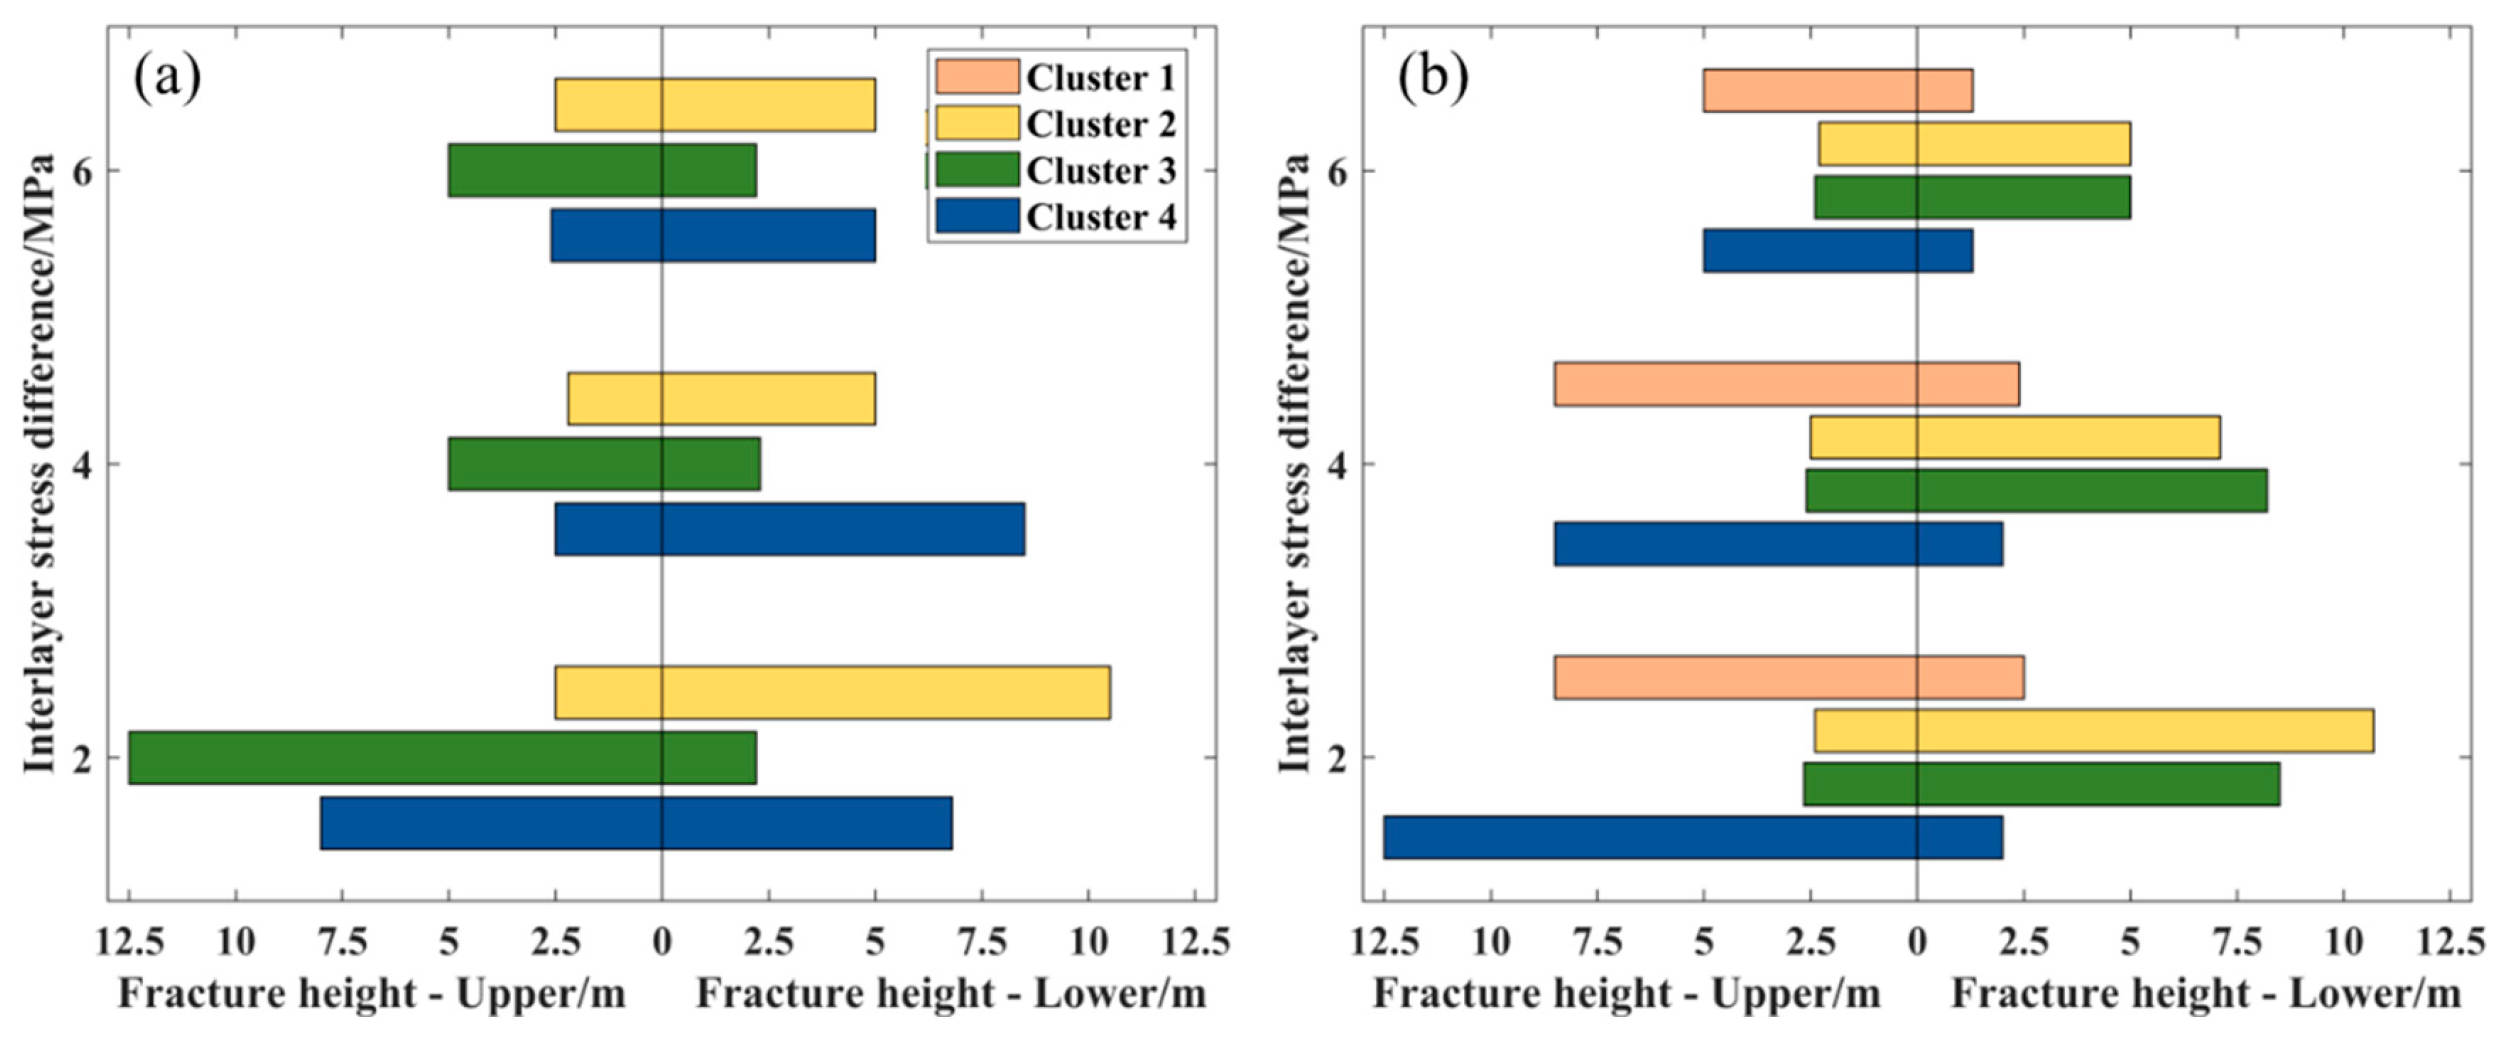
Bar charts were used to compare the upper and lower fracture heights of hydraulic fractures under different vertical–horizontal in situ stress differences for three-cluster and four-cluster fracturing, as shown in
Figure 10 below.
Figure 10a shows the chart of fracture heights for three-cluster fracturing. The fracture height of Cluster 2 is nearly consistent under different vertical–horizontal in situ stress differences, as its upper side is free from inter-cluster interference and can propagate freely. The lower side is affected by the superposed inter-cluster interference from Clusters 1 and 3, leading to an increase in propagation resistance for the fracture in all directions. In contrast, Cluster 1 is subject to inter-cluster interference from Clusters 2 and 3, with lower resistance when propagating outward. At this time, increasing the vertical–horizontal in situ stress difference inhibits the failure of interlayer interfaces, further facilitating the vertical propagation of fractures on both sides. The final trend shows that for every 4 MPa increase in the vertical–horizontal in situ stress difference, the fracture height of the side clusters increases by 1.5 m, while that of the middle cluster remains unchanged.
Figure 10b presents the chart of fracture heights for four-cluster fracturing. The fracture height of each cluster increases with the rise in the vertical–horizontal in situ stress difference. Firstly, for four-cluster fractures, the middle Clusters 2 and 3 are subjected to different degrees of stress interference from the other clusters. For Cluster 2, the stress interference on the right side is stronger, causing the fracture to divert and propagate to the left. Under this condition, as the vertical–horizontal in situ stress difference increases, the inhibition of interlayer interface failure is enhanced, and the fracture heights of Clusters 1–4 all increase. Specifically, the increase in the fracture height of the outer clusters is more significant, and they can fully propagate upward through layers at a stress difference of 10 MPa. For every 4 MPa increase in the vertical–horizontal in situ stress difference, the fracture height of the middle clusters (Clusters 2 and 3) increases by 1.8 m.
For the investigated deterministic simulations, the 1.5 m and 1.8 m increments are model-predicted fracture-height changes for the specified three-cluster and four-cluster configurations rather than statistical confidence intervals.
The difference observed at VSD = 10 MPa reflects a transition state between bedding interface diversion and direct penetration. Under this near-threshold condition, a slight asymmetry in the superposed stress shadow changes the local propagation resistance of individual clusters, so geometrically similar clusters can produce different heights. At VSD = 14 MPa, the stronger vertical driving stress reduces this difference and promotes more consistent layer crossing.
4.2. Effect of Interlayer Stress Difference
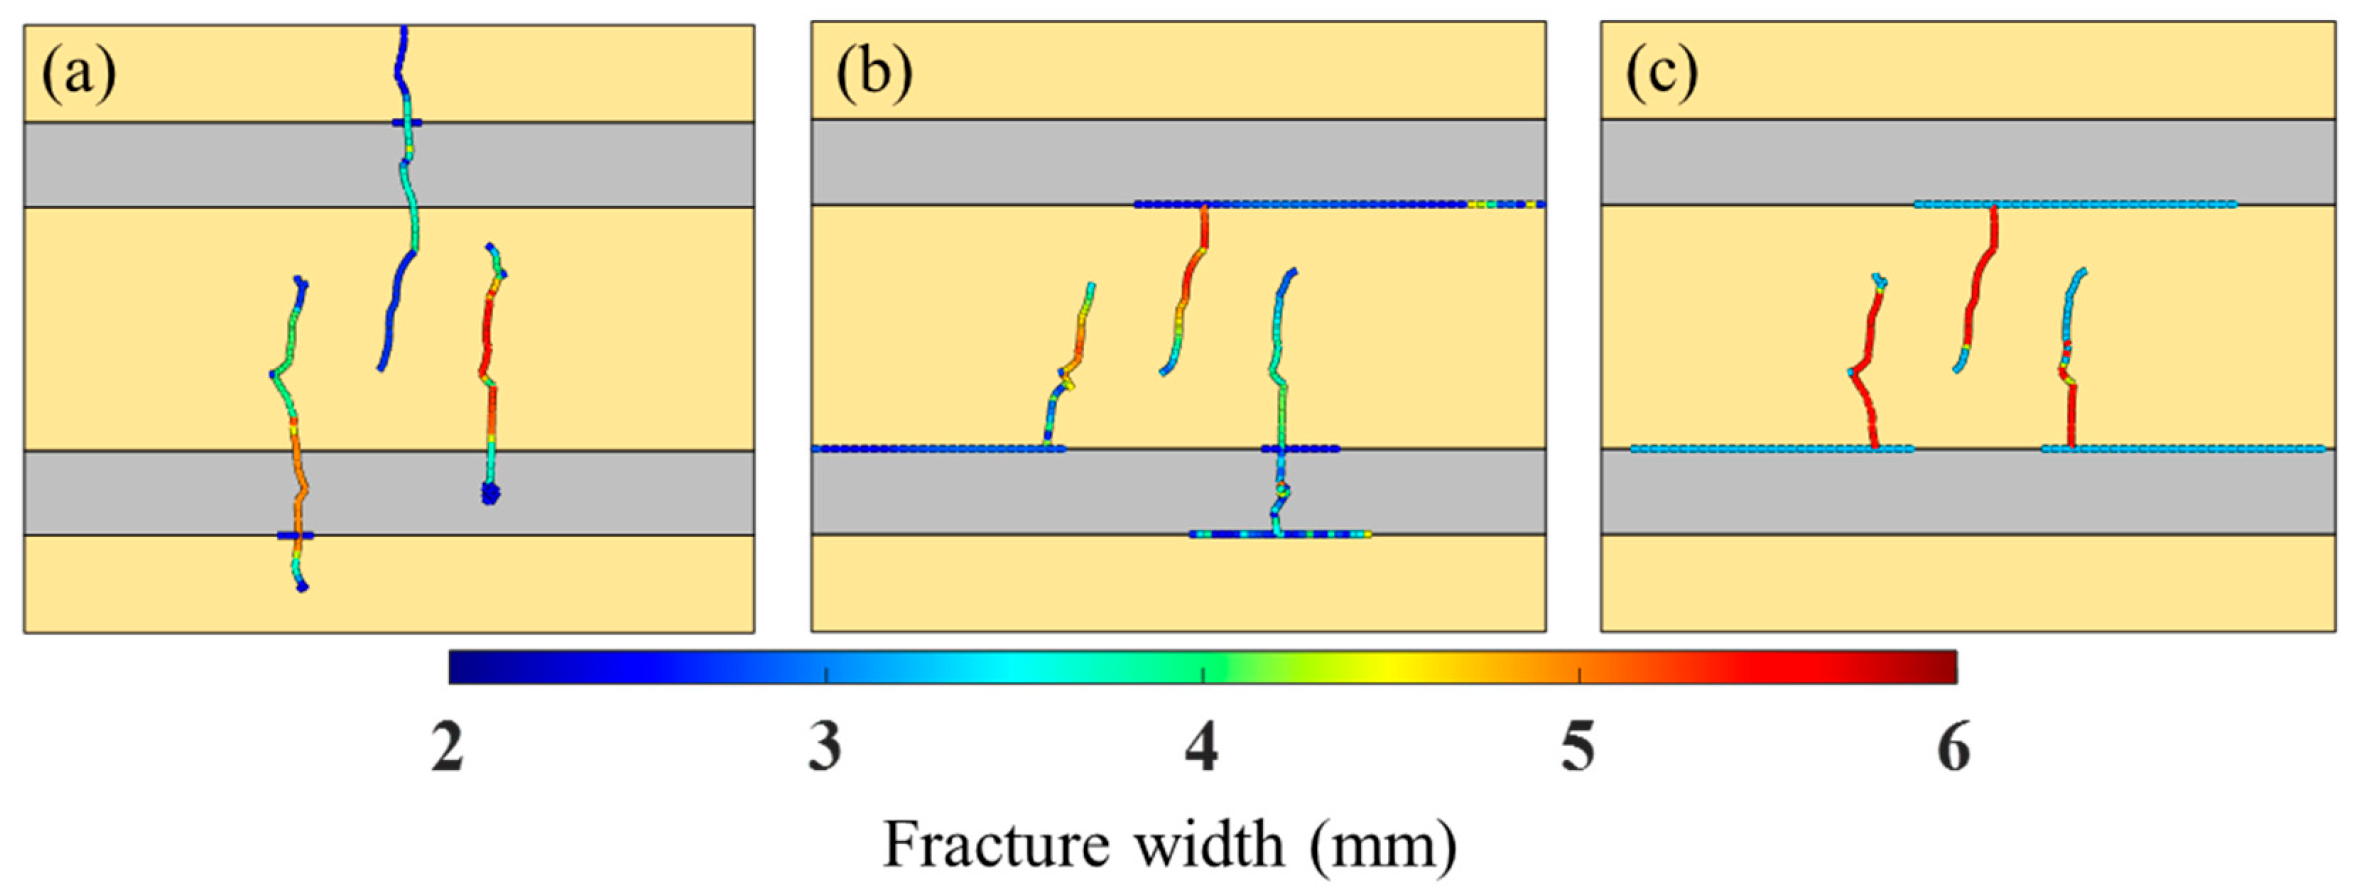
Figure 11 shows the fracture morphology of three-cluster fracturing under an ISD of 2–6 MPa. In
Figure 11a, the interlayer interface remains intact; when hydraulic fractures intersect with the interlayer interface, they penetrate directly through it, resulting in a relatively ideal fracture height. In
Figure 11b, after the ISD is increased from 2 MPa to 4 MPa, shear failure occurs at the interlayer interface when hydraulic fractures intersect with it, which in turn induces hydraulic fractures to propagate laterally. The vertical propagation of fractures is restricted by the shear-failed interlayer interface. When the ISD is 6 MPa, hydraulic fractures are completely unable to propagate through layers vertically, as shown in
Figure 11c, and the fracture height is the smallest at this time.
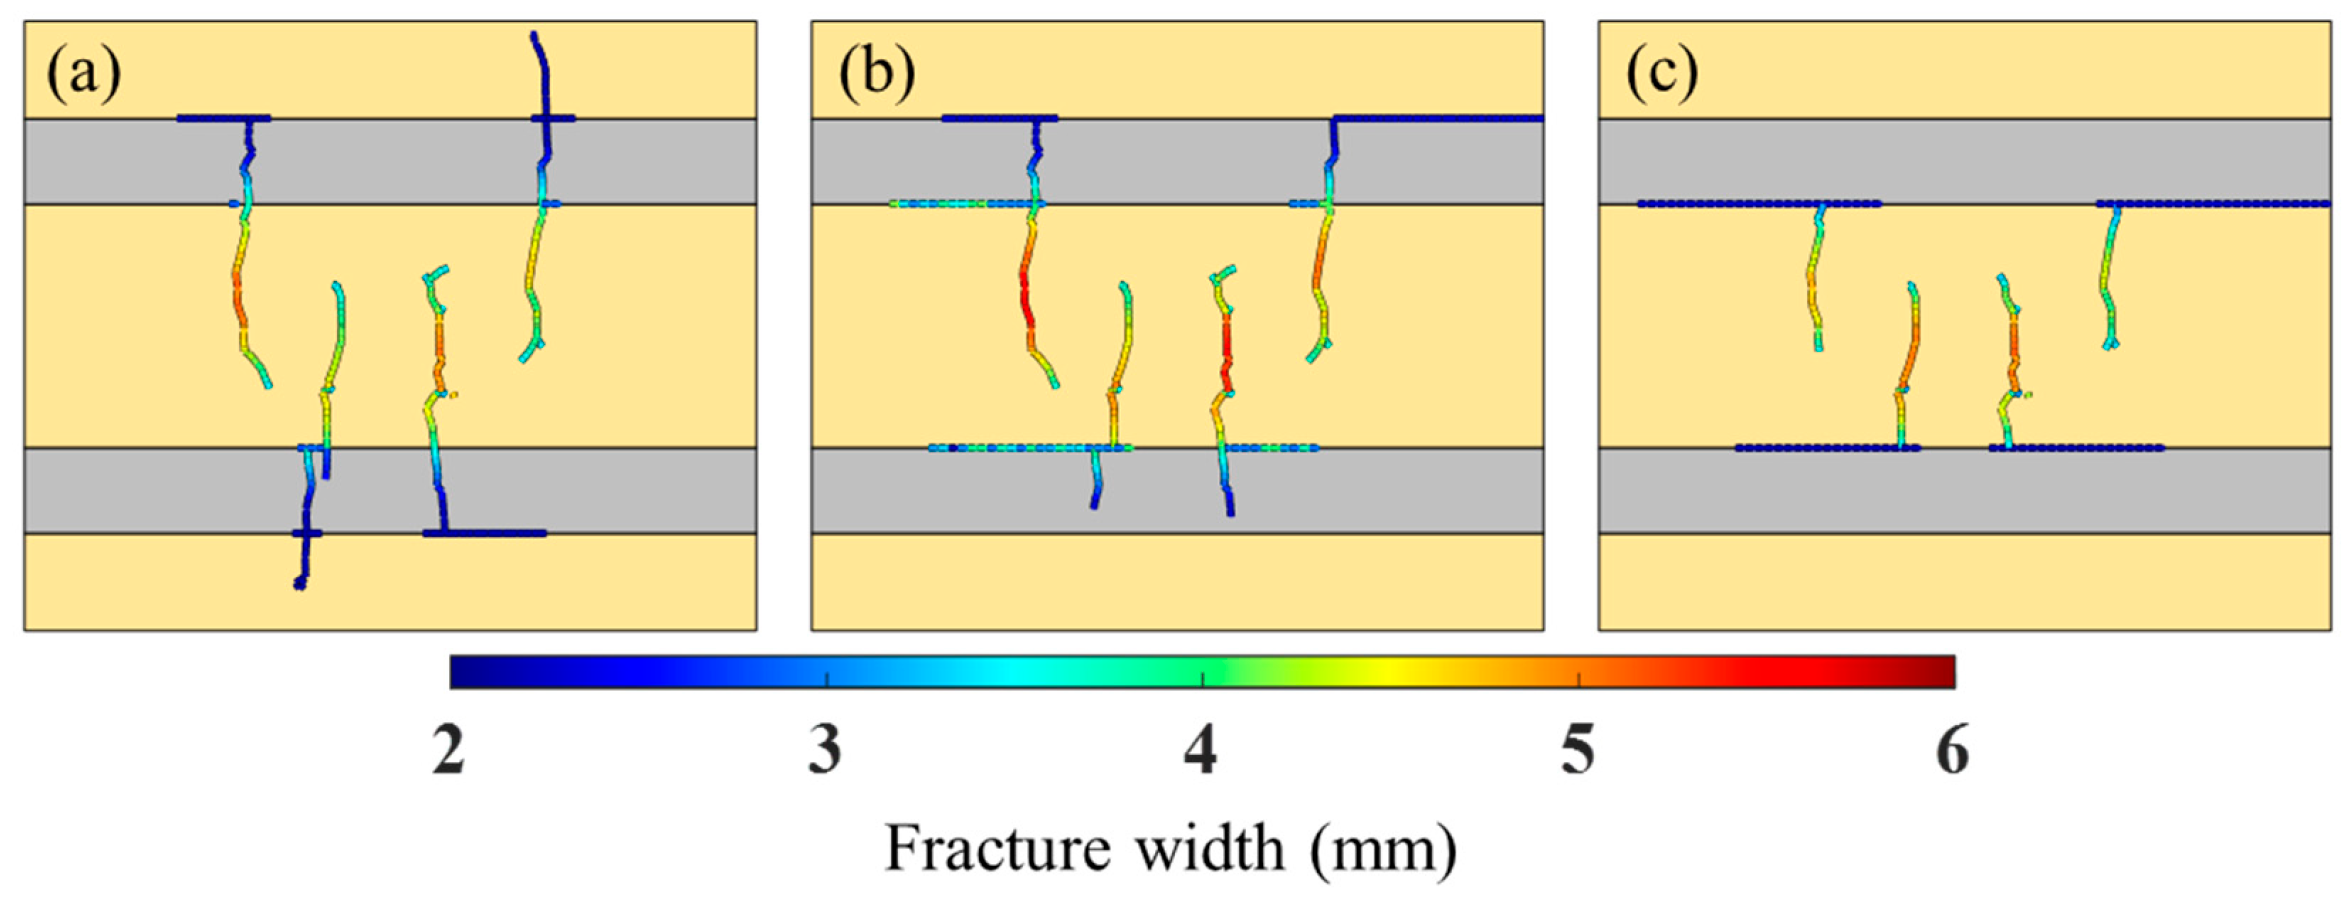
The fracture propagation morphology of four-cluster fractures under different ISD is shown in
Figure 12, below. Under four-cluster fracturing conditions, the inter-cluster interference of hydraulic fractures is more severe, resulting in higher shear stress at the interlayer interface when hydraulic fractures interact with it under the same ISD.
As shown in
Figure 11a, at an ISD of 2 MPa, the interlayer interface does not undergo shear failure when hydraulic fractures intersect with it, and hydraulic fractures propagate through layers. In contrast, in
Figure 12a, shear failure occurs at the interlayer interface after hydraulic fractures of Clusters 1 and 3 intersect with it, indicating that inter-cluster interference of fractures increases the risk of shear failure at interlayer interfaces and is not conducive to the vertical cross-layer propagation of fractures.
Figure 12b,c show the fracture morphology when the ISD is increased to 4 MPa and 6 MPa, respectively. The simulation results indicate that inter-cluster complementary propagation of multi-cluster fractures still exists under different ISD. The outer clusters of the fracturing interval have greater difficulty in cross-layer propagation, while the inner clusters are subject to nearly symmetric stress interference from other clusters, which in turn has a smaller impact on interlayer interface failure. Therefore, for four-cluster fracturing, the middle clusters of the fracturing interval exhibit a better cross-layer effect.
Figure 13 is a chart of the two-wing fracture heights of each cluster for three-cluster and four-cluster fracturing under different ISD. Each 2 MPa increase in ISD reduced the average fracture height by approximately 4.0 m in the three-cluster case and 3.5 m in the four-cluster case.
Figure 13a shows that when the ISD increases from 2 MPa to 4 MPa, only Cluster 1 fractures penetrate through layers, and under an ISD of 6 MPa, none of the clusters can achieve cross-layer propagation.
Figure 13b shows that the overall fracture height of each cluster under the same ISD is higher than that in
Figure 13a. This is because in four-cluster fracturing, the upward propagation of Clusters 2 and 3 in the middle of the fracturing interval is more severely restricted, which in turn facilitates the upward propagation of Clusters 1 and 4 on the outer side of the fracturing interval.
At ISD = 2 MPa, the stress barrier across the bedding interface is weak, so fracture height is controlled mainly by stress-shadow complementarity among clusters. This produces a pattern different from the 4 and 6 MPa cases, where interface shear failure becomes the dominant mechanism and restricts vertical propagation more uniformly.
4.3. Effect of Pump Rates and Viscosity
The simulations above indicate that under an ISD of 2 MPa, the bedding interface is less likely to fail in shear, whereas at an ISD of 6 MPa, under the investigated conditions, interface shear failure can restrict vertical fracture growth. To clarify the engineering response under a moderate ISD, injection rate and fluid viscosity were compared for the ISD = 4 MPa case.
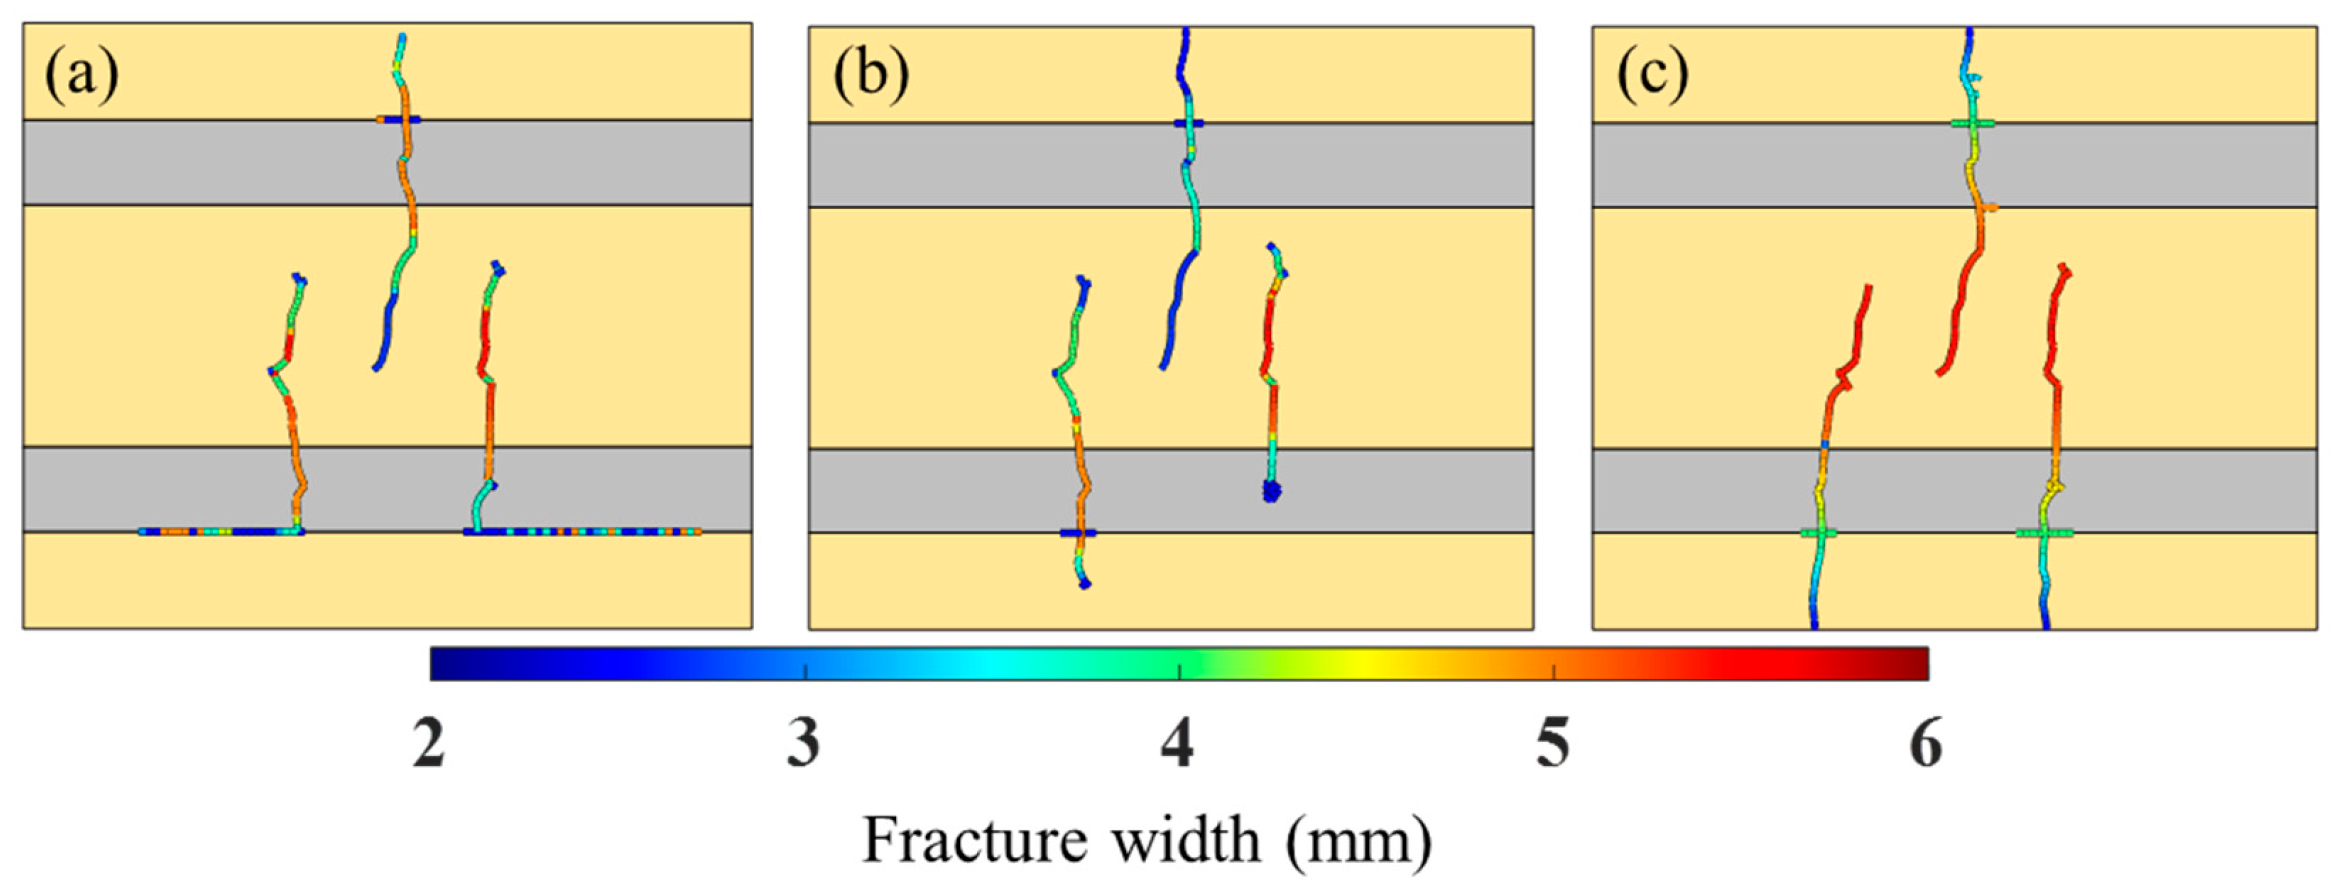
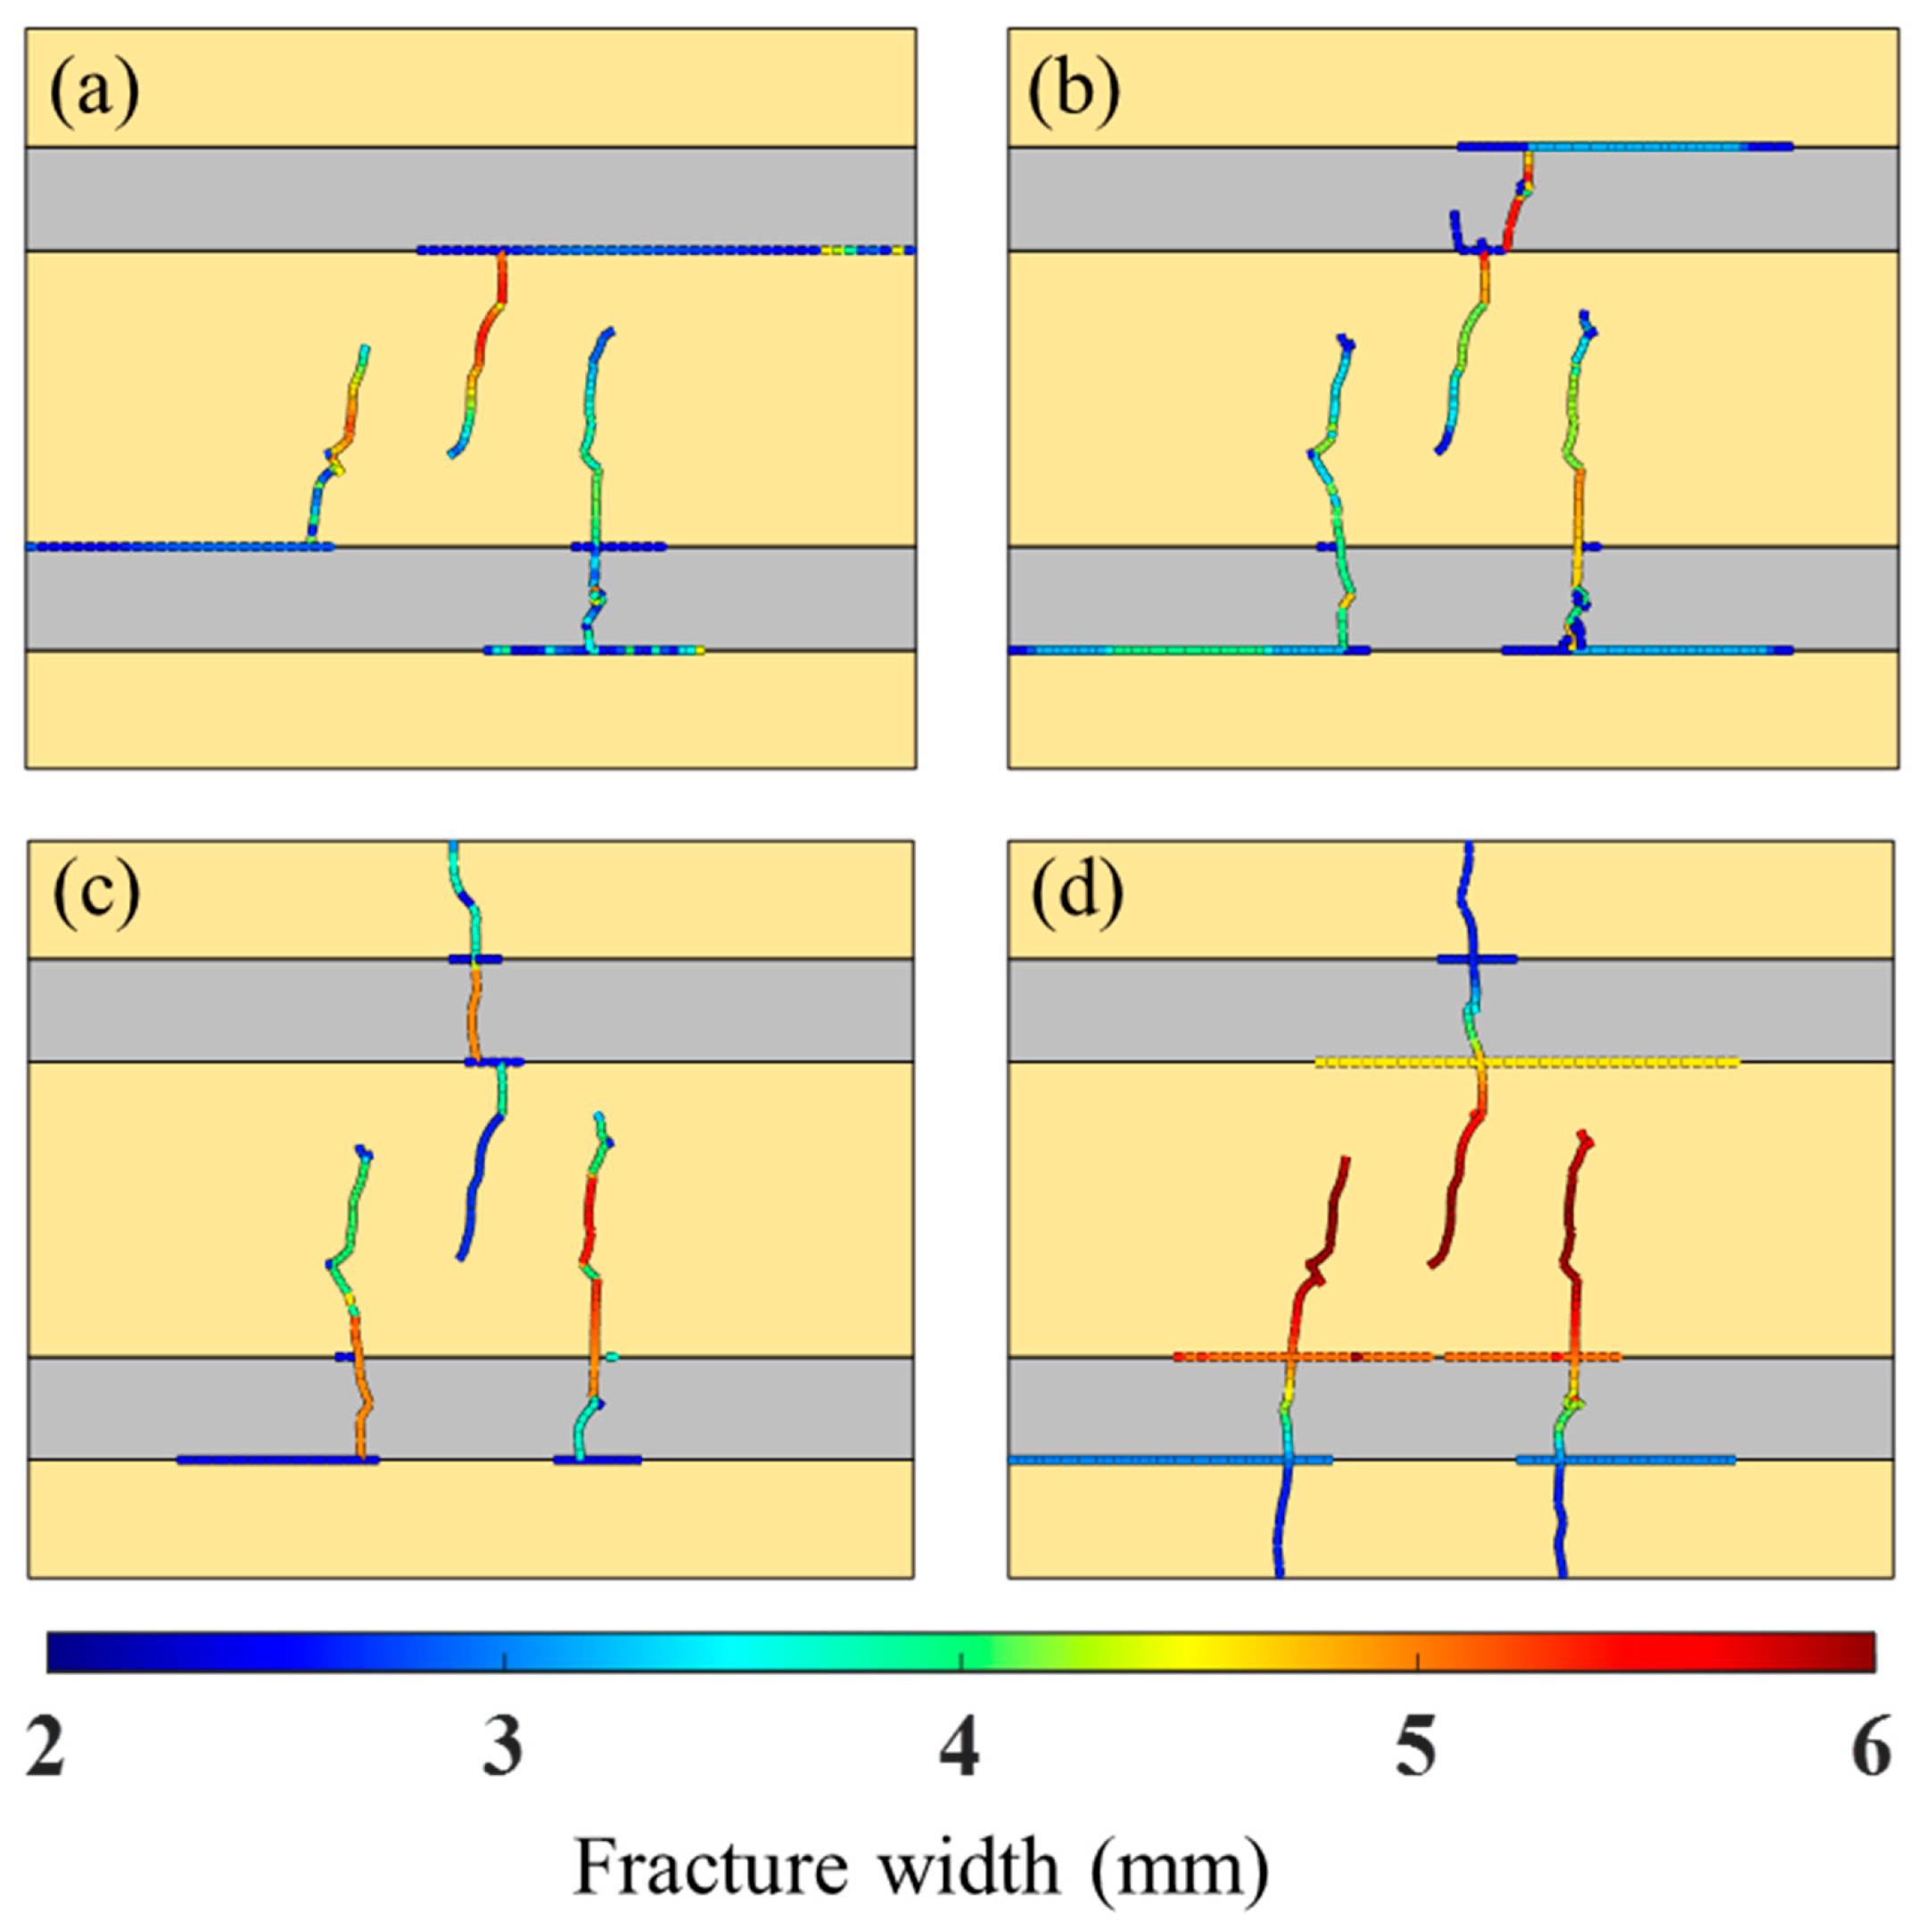
The simulation results under three-cluster fracturing are shown in
Figure 14. At an injection rate of 6 m
3/min and a viscosity of 20 mPa·s (
Figure 14a), fractures encountered difficulty in cross-layer propagation: two clusters failed to penetrate through the layers, and although Cluster 1 penetrated the mudstone layer, it failed to enter the isolated sandstone reservoir, resulting in an unsatisfactory stimulation effect. With viscosity kept constant and the injection rate increased to 10 m
3/min (
Figure 14b), all three clusters of fractures penetrated the mudstone interlayers but still failed to propagate into the sandstone reservoir, failing to achieve the optimal stimulation effect. When the injection rate was maintained at 6 m
3/min and viscosity was increased to 50 mPa·s (
Figure 14c), the cross-layer fracture height of hydraulic fractures increased: not only did Clusters 1 and 3 penetrate the mudstone interlayers, but Cluster 2 also successfully connected the upper isolated sand body separated by mudstone. When both injection rate and viscosity were increased to 10 m
3/min and 50 mPa·s, respectively (
Figure 14d), all three clusters of hydraulic fractures penetrated the mudstone barriers and connected the separate isolated sandstone layers, achieving the optimal overall stimulation effect. Although the degree of interlayer interface failure in
Figure 14d is the most severe among the four groups, all hydraulic fractures achieved complete cross-layer propagation with the maximum fracture height. This indicates that under this condition, the pressure inside the fractures is high, and cross-shaped fractures are instantly formed when hydraulic fractures intersect with the interlayer interface, so the interlayer interface does not hinder the vertical propagation of fractures.
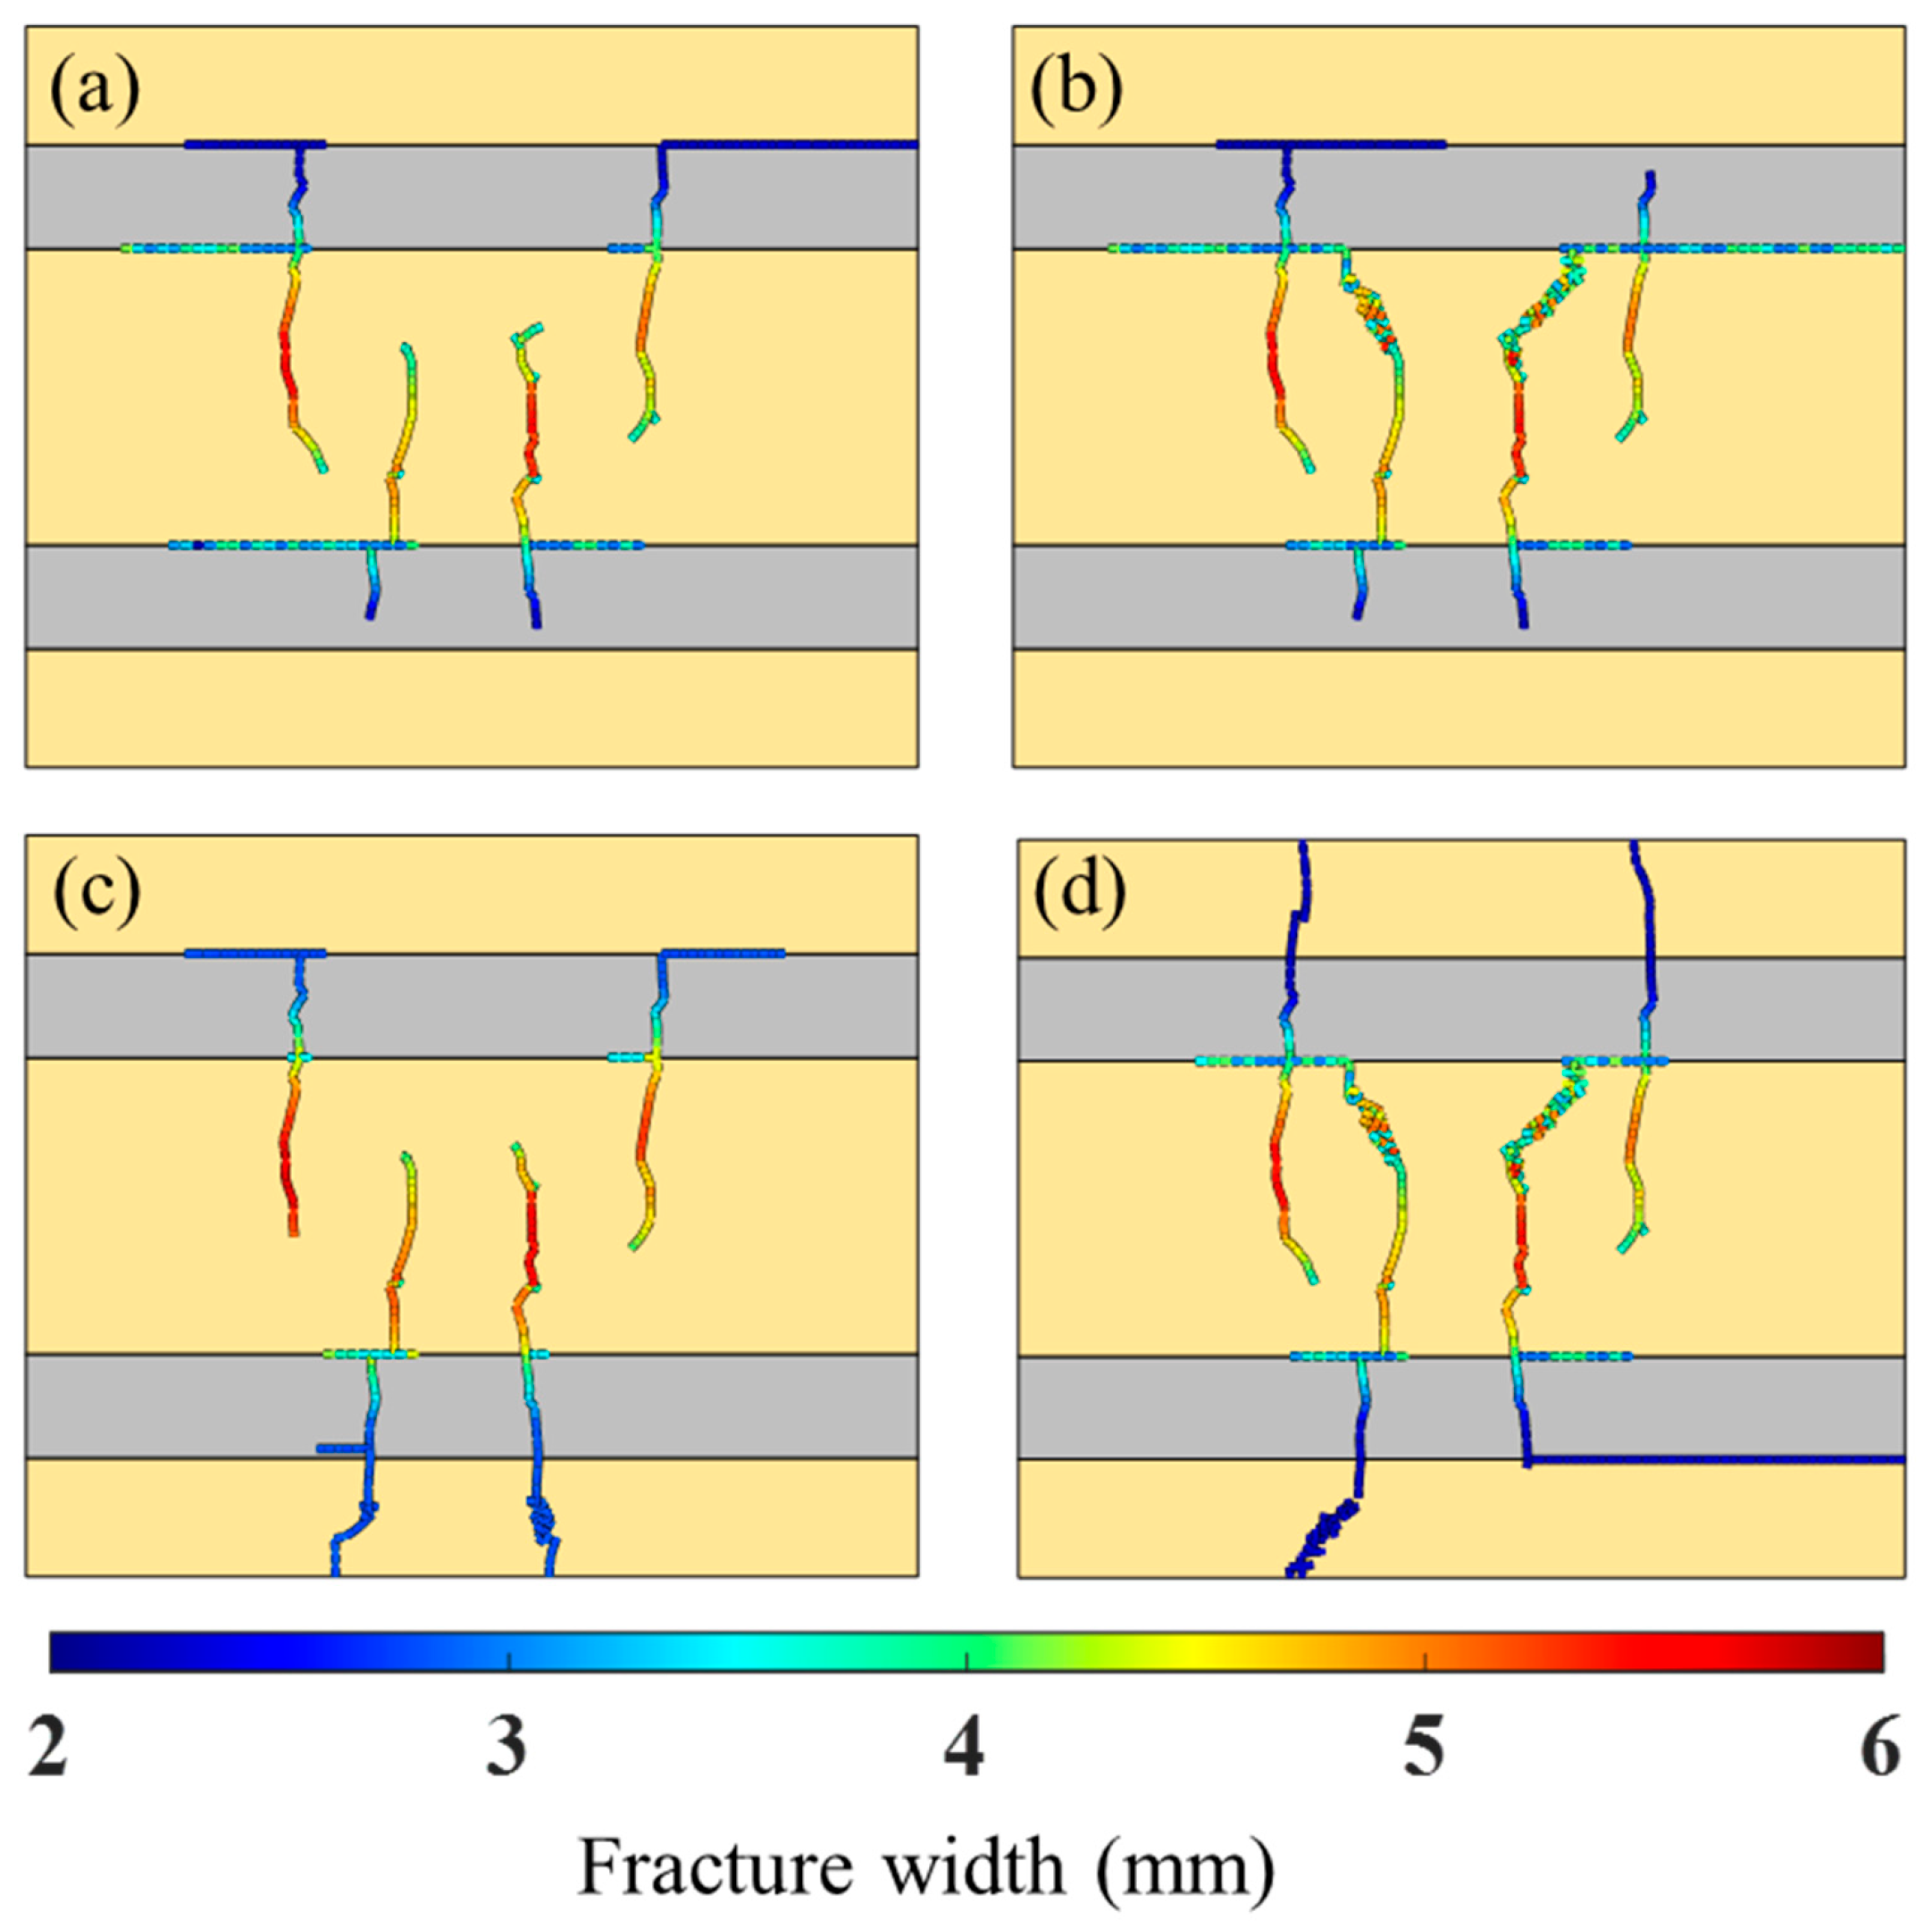
The simulation results under four-cluster fracturing are shown in
Figure 15. Similar to the simulation results of three-cluster fracturing, under four-cluster fracturing, merely increasing the fracturing fluid injection rate does not significantly increase the fracture height; instead, it exacerbates shear failure of the interlayer interfaces under high net pressure inside fractures, thereby restricting the fracture height (
Figure 15b). In contrast, increasing the fracturing fluid viscosity restricts fracturing fluid leak-off, reduces the risk of shear failure, and increases the fracture height (
Figure 15c). However, four-cluster fracturing is accompanied by more complex inter-cluster stress interference. Under the conditions of an injection rate of 10 m
3/min and a viscosity of 50 mPa·s, shear failure of the interlayer interfaces still restricts the vertical propagation of Cluster 3 fractures (
Figure 15d).
5. Discussion
Interlayer Stress Difference (ISD) is a key geological factor constraining the vertical cross-layer propagation of hydraulic fractures. However, this is not merely caused by the stress barrier effect, but rather the result of the coupling between interfacial mechanical properties and the local stress field. Simulation results show that when ISD is high, the fracture tip cannot directly penetrate the interface; instead, it induces interfacial shear failure. From the perspective of fracture mechanics, this is because the minimum horizontal principal stress is greater in mudstone layers, making the shear stress on the interface more likely to reach the Coulomb failure envelope. Shear slip occurs at the interlayer interface, leading to a sharp drop in the energy driving the vertical extension of fractures, thereby forming a trapped fracture morphology. This finding explains, from the perspective of stress-damage coupling, why high ISD can force fracture arrest or diversion even when the vertical principal stress gradient favors fracture height growth in strongly heterogeneous sand–mudstone interbeds.
Unlike single-fracture models, fracture morphology in multi-cluster fracturing systems exhibits strong non-planar characteristics, which is a direct manifestation of the complex superposition of inter-cluster induced stress fields. This study observes that in the four-cluster perforation scheme, the vertical propagation of middle-cluster fractures is significantly inhibited, and their paths show severe tortuosity. This is not a random phenomenon, but arises from the superposition of compressive stress shadows generated by the opening of outer fractures in the middle of the fracturing interval, which elevates the minimum horizontal principal stress in the central region. The increase in this induced stress not only raises the breakdown pressure of middle clusters but also alters the local maximum principal stress direction, forcing fractures to deviate from the preset trajectory to seek the minimum resistance path. In contrast, the “staggered complementary” pattern observed in the three-cluster scheme indicates that the stress shadow distribution is relatively symmetric under odd-numbered cluster distribution, resulting in a larger vertical fracture height for the middle cluster. This mechanism reveals that in a thin interbed fracturing design, simply increasing the number of clusters may be counterproductive due to intense stress interference, leading to a loss of effective stimulated reservoir volume (ESRV).
Regarding engineering parameters, increasing the injection rate can raise fracture net pressure, but the model results indicate that rate increase alone may also enhance bedding interface shear slippage under high ISD. For the investigated three-cluster case under moderate ISD, increasing viscosity was more effective than increasing injection rate alone; however, the benefit of high rate depended on cluster number and interface failure state.
The elastic-matrix assumption is suitable for isolating the roles of VSD, ISD, stress shadow, and interface failure because most deformation before fracture initiation is represented in the elastic regime and the dominant inelastic process is captured through cohesive damage and bedding interface shear failure. However, neglecting matrix plasticity may underestimate near-tip energy dissipation and local irreversible deformation.
The applicability of these results is limited by the modeling assumptions. The current model does not explicitly resolve proppant transport, wellbore-friction-induced cluster flow redistribution, natural fractures, lateral heterogeneity, spatial variability of bedding roughness, or field-scale operational fluctuations. The three-cluster and four-cluster comparison should therefore be treated as a case-specific contrast rather than a general odd–even cluster-number rule. Therefore, field application should combine the present mechanism-based trends with site-specific stress calibration, microseismic interpretation, and production verification.
Although the model was parameterized for the He-8 sandstone–mudstone interbeds, the coupled roles of stress shadow and interface shear failure are also relevant to other injection-driven fractured systems. In enhanced geothermal systems, stress-shadow-induced fracture diversion and ISD-controlled arrest can influence heat-exchanger connectivity. Similarly, the bedding interface Mohr–Coulomb assessment can help evaluate potential shear activation at weak layer boundaries during injection, provided that site-specific stresses, permeability, and fault properties are calibrated.
6. Field Application
The horizontal Well H1 in the Sulige Gas Field contains thin sand–mudstone interbeds in the He-8 formation, with a buried depth of 2800–2850 m, a sand body thickness of 10 m, a porosity of 6%, a permeability of 0.4 mD, and a mudstone interlayer thickness of 3 m. The VSD is approximately 10 MPa, and the ISD is approximately 4 MPa; three-cluster fracturing was adopted per stage, corresponding to the simulation results in
Figure 14. To improve single-well production, simultaneous stimulation was conducted on the gas layers above and below this interval to expand the single-well controlled area.
After fracturing Well H1 with an injection rate of 7 m
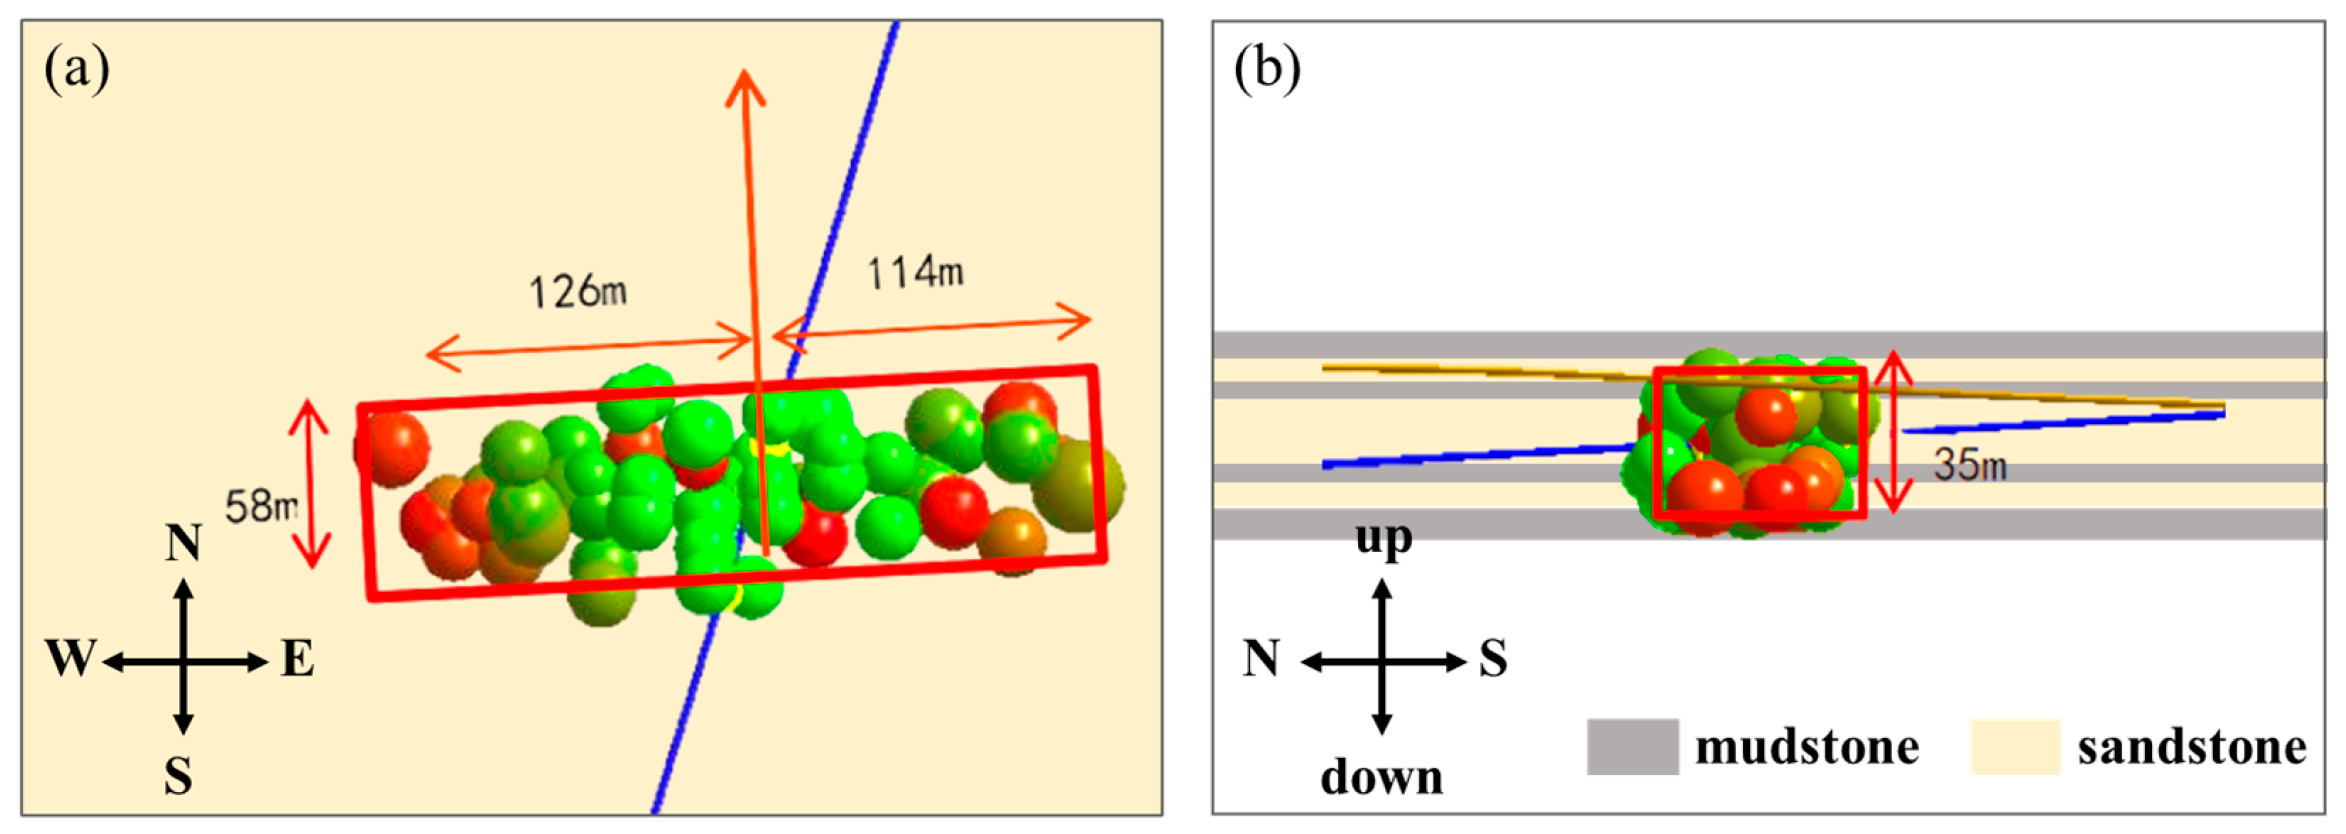
3/min and a fracturing fluid viscosity of 50 mPa·s, microseismic monitoring indicated a vertical event-cloud extent of about 35 m. The microseismic event-cloud height is treated as a qualitative indicator of stimulated vertical extent rather than a direct hydraulic-fracture-height measurement. Quantitative conversion would require calibrated event-location uncertainty, velocity-model verification, and independent fracture-height constraints. The field comparison is subject to uncertainty from microseismic event-location error, velocity-model assumptions, production allocation, and the single-well nature of the example. Therefore, the H1 case is used as qualitative field support for the simulated connectivity trend rather than as a statistically calibrated performance validation.
Figure 16 shows the top view of fracture event points (
Figure 16a) and the side view of event distribution (
Figure 16b).
7. Conclusions
Fracture propagation is controlled by competing stress contrasts. For the investigated deterministic simulations, VSD promoted vertical fracture crossing, with each 4 MPa increase producing a model-predicted fracture-height increase of approximately 1.5 m in the three-cluster case and 1.8 m in the four-cluster case. These values should be interpreted as sensitivity results for the specified model configuration rather than statistical confidence intervals. ISD acts as a stress barrier that promotes bedding interface shear failure and reduces fracture-height growth; at an ISD of 6 MPa under the investigated conditions, cross-layer propagation was strongly restricted.
Stress shadow effects exhibit a strong dependence on cluster configuration, and fracture trajectories are significantly altered by multi-cluster interference. In three-cluster schemes, fractures exhibit a stable “staggered” complementary pattern. However, in four-cluster schemes, stronger suppression is exerted on the inner clusters (Clusters 2 and 3) by the superposition of stress shadows, leading to severe diversion and limited height growth. Distinct perforation strategies are therefore required for different cluster counts to ensure uniform stimulation.
For the investigated three-cluster case under moderate ISD, increasing fracturing fluid viscosity was more effective than increasing injection rate alone in promoting cross-layer communication. High injection rate can increase fracture net pressure, but it may also increase the risk of interface shear slippage, especially when cluster interference and weak bedding interfaces are present.
For the He-8 model configuration with moderate ISD (~4 MPa), a high-viscosity fluid combined with the investigated three-cluster perforation scheme improved the likelihood of connecting isolated sandstone layers. This recommendation should be applied within the stated model assumptions and updated when site-specific flow allocation, proppant transport, and calibrated field data are available.