All articles published by MDPI are made immediately available worldwide under an open access license. No special
permission is required to reuse all or part of the article published by MDPI, including figures and tables. For
articles published under an open access Creative Common CC BY license, any part of the article may be reused without
permission provided that the original article is clearly cited. For more information, please refer to
https://www.mdpi.com/openaccess.
Feature papers represent the most advanced research with significant potential for high impact in the field. A Feature
Paper should be a substantial original Article that involves several techniques or approaches, provides an outlook for
future research directions and describes possible research applications.
Feature papers are submitted upon individual invitation or recommendation by the scientific editors and must receive
positive feedback from the reviewers.
Editor’s Choice articles are based on recommendations by the scientific editors of MDPI journals from around the world.
Editors select a small number of articles recently published in the journal that they believe will be particularly
interesting to readers, or important in the respective research area. The aim is to provide a snapshot of some of the
most exciting work published in the various research areas of the journal.
Inter-well interference in multi-well pad development is a critical factor influencing the recovery efficiency of shale gas reservoirs. This study presents a comprehensive semi-analytical model to characterize the transient pressure behavior and interference mechanisms of multi-well multi-stage fractured horizontal wells (MFHWs). Utilizing point source functions and the principle of superposition, the model accounts for complex shale gas transport mechanisms, including gas desorption, diffusion, and real-gas compressibility via pseudo-pressure transformation. The proposed model is validated against the industrial standard numerical simulator KAPPA-Saphir, showing an excellent match across most flow regimes, with a maximum relative error of 3.2% and an average relative error of less than 1% across the entire production period. The results identify five distinct flow stages: fracture linear flow, fracture radial flow, compound linear flow, compound radial flow, and boundary-dominated flow. Sensitivity analysis reveals that decreasing the inter-well spacing significantly shortens the fracture radial flow duration, while longitudinal staggering of wellbore centers effectively mitigates early-time interference and promotes more uniform reservoir drainage. Furthermore, it is observed that in multi-well systems, inner wells suffer from more severe energy competition and faster pressure depletion than peripheral wells. Based on these findings, it is proposed that the inter-well spacing should exceed four times the fracture half-length, and a staggered fracture arrangement (the relative positions in the x-direction of the fractures between the wells are not the same) should be prioritized. This work provides a robust theoretical framework and practical guidelines for optimizing well spacing and infill drilling strategies in shale gas reservoirs.
The global energy landscape has undergone a significant transformation with the rapid development of unconventional resources, particularly shale gas [1,2,3,4]. Due to its ultra-low permeability and complex transport mechanisms, the commercial exploitation of shale gas reservoirs heavily relies on horizontal drilling coupled with multi-stage hydraulic fracturing technology [5]. In recent years, to maximize land utilization and reduce operational costs, the “pad drilling” or “factory mode” [5,6,7,8] development strategy has become the industry standard. This approach involves drilling multiple horizontal wells from a single surface pad, resulting in closely spaced wellbores and complex fracture networks [9]. While this intensification improves recovery efficiency, it simultaneously introduces severe challenges related to inter-well interference [10,11,12,13,14,15,16], often referred to as “frac-hits” or pressure communication [9,17], which can significantly jeopardize the production performance of both parent and child wells.
Understanding the mechanisms of inter-well interference is pivotal for optimizing well spacing, fracture design, and infill drilling strategies [18,19,20,21]. When wells are spaced too closely, premature pressure interference occurs, leading to “energy competition” where wells compete for the same drainage volume, thereby accelerating pressure depletion and reducing individual well estimated ultimate recovery (EUR) [22,23]. Conversely, excessively large well spacing leaves drainage areas untapped, resulting in resource waste. Therefore, accurately characterizing the transient pressure behavior of multi-well systems and determining the optimal well placement in bounded reservoirs is an imperative task for reservoir engineers.
To date, transient analysis [24,25] is the main tool used to study reservoir performance, primarily categorized into numerical simulation and analytical/semi-analytical modeling. Numerical simulation [26,27,28,29] is a robust tool capable of handling complex heterogeneities and multiphase flow. For example, Du et al. [26] established a field-scale distinct element numerical model to hydromechanically simulate the multi-well fracturing process, while Wang et al. [29] utilized numerical reservoir and fracture extension models to evaluate inter-well fracture communication. However, it is often computationally expensive, time-consuming, and cumbersome for conducting extensive sensitivity analyses required for well pattern optimization. In contrast, analytical and semi-analytical models [30,31,32] offer a computationally efficient alternative that provides physical insights into flow regimes and pressure propagation characteristics.
The source function method, systematically developed by Gringarten [33,34] and later extended to different boundaries and various well types by Ozkan [35,36], serves as a mathematical foundation for modern pressure transient analysis. Existing models for multi-fractured horizontal wells have matured significantly, demonstrating robust capabilities in solving transient pressure behaviors for individual wells. To accurately reflect complex formation conditions, these single-well models have successfully incorporated a variety of intricate physical mechanisms. For instance, recent studies have comprehensively integrated gas desorption, diffusive flow, and the stress-sensitivity of reservoir permeability [37]. Furthermore, these models have accounted for the pressure-dependence of gas properties [38], as well as the finite conductivity of hydraulic fractures [39]. However, existing semi-analytical models often face limitations when applied to realistic shale gas field development. Field applications have demonstrated the profound economic and operational impact of well spacing and inter-well dynamics. For instance, as reported in Reference [40], transitioning to multi-well pad development and deploying infill wells can significantly boost the overall recovery factor from 12.6% to 23.3%. However, optimizing such complex well-pad designs requires an accurate characterization of spatial energy competition. Previous single-well models are fundamentally inadequate for this task. Some studies assume infinite reservoirs [37,38,39], neglecting the critical impact of boundary-dominated flow in closed rectangular systems. Others ignore or simplify the complex geometric configurations of multi-well interference, particularly in asymmetric or staggered well layouts [41,42,43].
To address these gaps, this paper presents a comprehensive semi-analytical model designed to characterize the inter-well interference of multi-well multi-stage fractured horizontal wells (MFHWs) in rectangular closed shale gas reservoirs. By integrating the point source solution with the method of images and the principle of superposition, the model considered the shale gas desorption, diffusion, and real-gas pseudo-pressure variations. The accuracy of the proposed model is validated against a standard industry numerical simulator (KAPPA-Saphir). Subsequently, type curves are generated to identify distinct flow regimes, and detailed sensitivity analyses are conducted to evaluate the impacts of inter-well spacing, well staggering, production allocation, and well count on interference intensity. Finally, based on the theoretical findings, optimization strategies for well pattern design and infill well deployment are proposed to enhance the recovery factor of shale gas reservoirs.
2. Materials and Methods
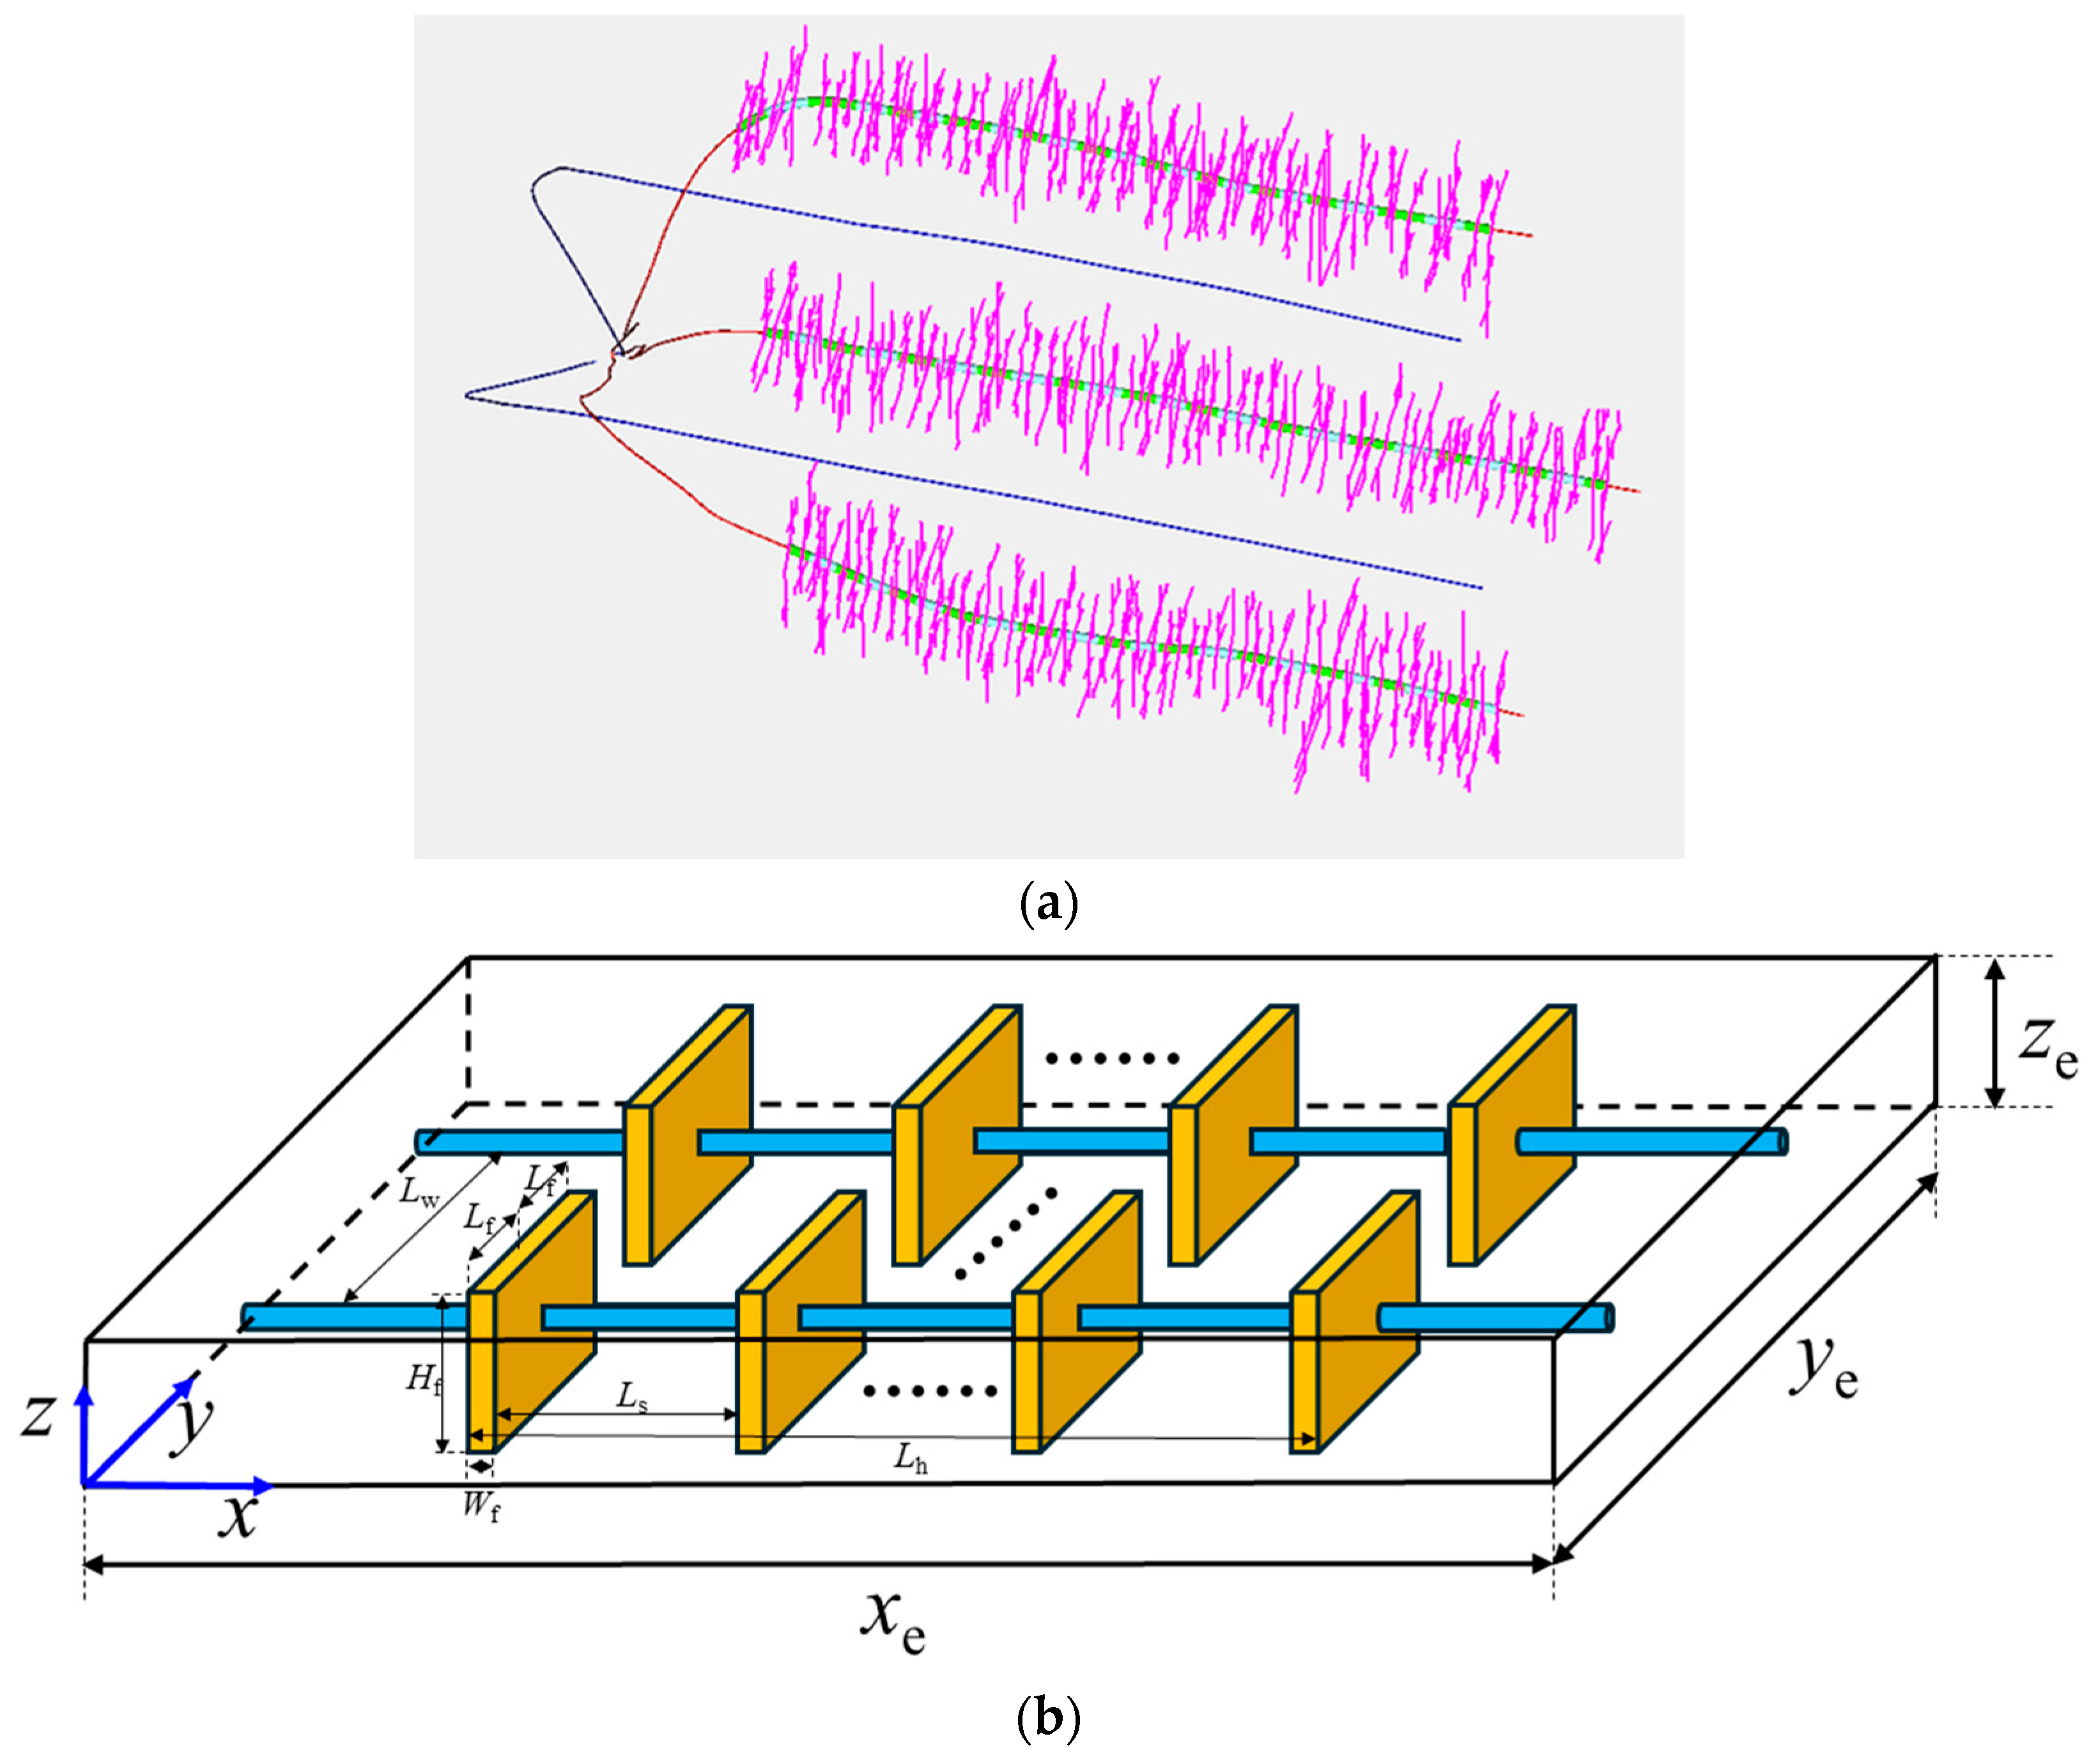
Shale gas development typically employs a platform development model, where multiple adjacent shale gas wells operate together on a single platform (Figure 1a). Interference can occur between these wells during production. To illustrate the inter-well interference in fractured horizontal wells within a shale gas reservoir, it is typically assumed that the boundaries of shale gas reservoirs are rectangular closed boundaries, Figure 1b illustrates a physical model using two interfering wells as an example.
2.1. Model Assumptions
The mathematical model is based on the following set of assumptions:
Fracture Geometry: Each fracturing stage generates one bi-wing symmetric hydraulic fracture. The fractures are planar, with a height of Hf, a half-length of Lf and a width of Wf.
Reservoir and Well Spacing: The length, width, and height of the reservoir in the x-, y-, and z-directions are xe, ye, and ze, respectively. The well length is Lh, the intra-well fracture spacing is Ls, and the inter-well spacing is Lw. No fracture hit occurs, and fractures from different wells do not cross-link or overlap.
Fluid and Flow Regime: The reservoir fluid is a single-phase gas. The fluid transport in the shale matrix follows Darcy’s law. The fluid flow process in the formation does not take into account temperature changes.
Reservoir and Boundary Conditions: The reservoir has a rectangular shape with no-flow outer boundaries. The fractures are assumed to fully penetrate the formation, meaning the fracture height equals the formation thickness.
2.2. Point Source Solution in a Rectangular Reservoir
The source function method provides a powerful framework for solving the linear diffusivity equations that govern fluid flow in porous media. The fundamental principle is to derive the solution for an instantaneous point source, which then serves as a “building block.” By applying the principle of superposition, solutions for reservoirs with complex well configurations and boundary conditions can be rigorously constructed.
2.2.1. Governing Equation and Dimensionless Formulation
For a shale gas reservoir, the primary fluid component, methane, is a compressible gas. Consequently, its transport properties—namely viscosity and the gas deviation factor are strong functions of pressure. This renders the flow equation non-linear. To linearize the governing equation, the real gas pseudo-pressure, is introduced, defined as:
where μg is the gas viscosity, z is the gas deviation factor, is the real gas pseudo-pressure (function of pressure), p is the pressure, p0 is the reference pressure.
To generalize the solution and reduce the number of variables, the governing equation is cast into a dimensionless form. The dimensionless variables are defined in Appendix ATable A2.
Considering the combined effects of Darcy flow, gas desorption, and diffusion, the dimensionless governing equation for gas flow in the Laplace domain can be expressed as:
where is the dimensionless pseudo-pressure in Laplace domain, is the dimensionless x distance, is the dimensionless y distance, is the dimensionless z distance, s is the Laplace variable corresponding to dimensionless time tD.
The function f(s) [44] encapsulates the multiple storage and transport mechanisms characteristic of shale reservoirs, including flow in porous media, adsorption desorption, and diffusion:
where is the interporosity flow coefficient from shale matrix to fracture, km is the matrix permeability, kf is the fracture permeability, L is the reference length, R is the radius of spherical matrix rock block, is the modified coefficient of permeability, bm is the slippage factor, pm is the pressure in the matrix system, is the storativity ratio, is the fracture porosity, is the fracture compressibility of gas, is the matrix porosity, is the matrix compressibility of gas, is the free gas storativity ratio, is the matrix total compressibility, is the standard density, is the Langmuir constant, is the Langmuir pressure.
This dimensionless formulation provides a generalized mathematical framework. The solution derived from this point forward will be universally applicable to any reservoir with similar dimensionless parameters.
2.2.2. Source Functions in a Bounded Reservoir
For an infinite-acting reservoir, the instantaneous point source solution [35] at a dimensionless distance rD from the source in the Laplace domain is given by:
If a point source produces at a continuous constant rate q, its response in the Laplace domain:
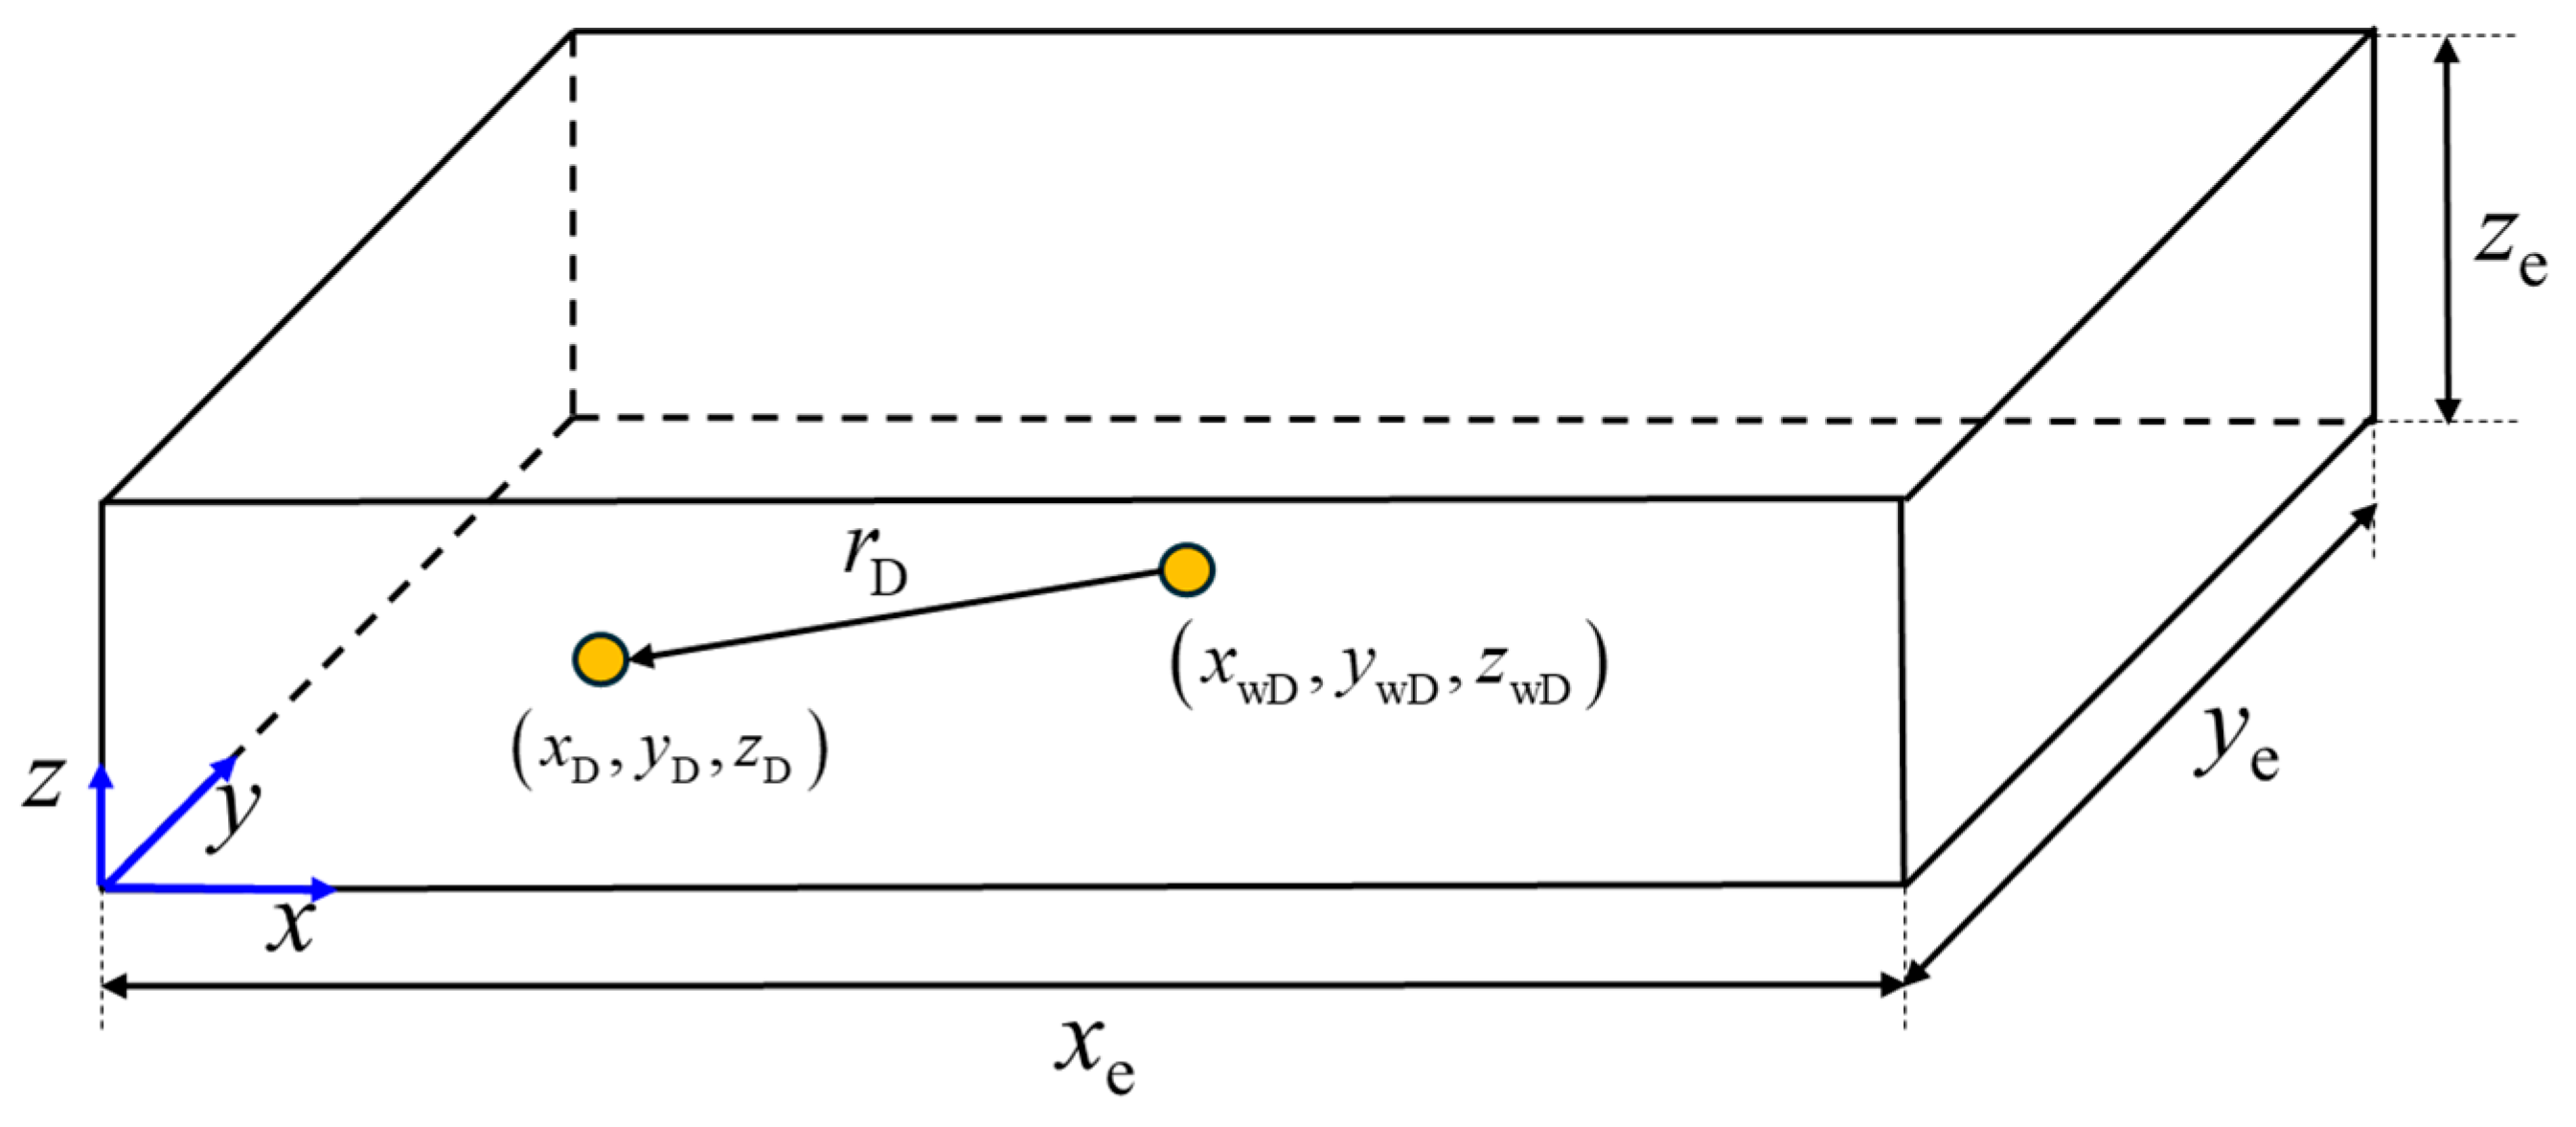
where the terms rD represent the dimensionless distances between the observation point and the point sources as Figure 2, is the dimensionless observation point x position, is the dimensionless observation point y position, is the dimensionless observation point z position, is the dimensionless sources point x position, is the dimensionless sources point y position, is the dimensionless sources point z position, is the instantaneous point source solution in Laplace domain, is pseudo-pressure drop at the observation point in Laplace domain, is the standard pressure, is the reservoir temperature, q is the point source production rate, is the standard temperature.
To account for the no-flow boundaries of the rectangular reservoir, as specified in the model assumptions, the method of images is employed. This involves placing an infinite array of image sources outside the physical domain to ensure the no-flow condition is satisfied on all six boundaries. By superimposing the effects of the real source and all image sources, the continuous point source solution in a rectangular closed reservoir is obtained:
where
For
The direct summation of the infinite series in Equation (7) is computationally prohibitive. To accelerate the convergence and obtain a computationally efficient solution, the approach developed by Ozkan [36] is adopted. This method utilizes the Poisson summation formula and the integral representation of the Macdonald’s function to convert the slowly converging series into a rapidly converging one. This procedure transforms the eight triple-infinite summation terms into a final, computable solution for the dimensionless continuous point source in the Laplace domain:
where , , , is the dimensionless pseudo-pressure in Laplace domain, is the dimensionless reservoir length, is the dimensionless reservoir width, is the dimensionless reservoir height. The truncation limit of approximately 400 terms is recommended.
2.3. Single-Well Solution in a Rectangular Reservoir
Building upon the point source solution derived in the previous section, the model is now extended to describe the transient behavior of a single multi-stage fractured horizontal well (MFHW). In 3D framework, each hydraulic fracture is modeled as a planar source. The pressure response for this planar source is obtained by spatially integrating the fundamental point source solution. This is achieved through a double integration: first along the fracture height (in the z-direction from 0 to HfD, where HfD = zeD) and subsequently along the fracture length (in the x-direction from −LfD to LfD). Correspondingly, the flux from the planar source is determined by integrating the point source flux over the same surface area.
A significant benefit of this integration is the simplification of the computational formula. The integration along the z-direction analytically remove one of the infinite series terms from the point source solution, which substantially reduces the overall computational complexity. This process yields the final Laplace-domain solution for the pressure response of a single planar fracture source within the rectangular bounded system, as follow:
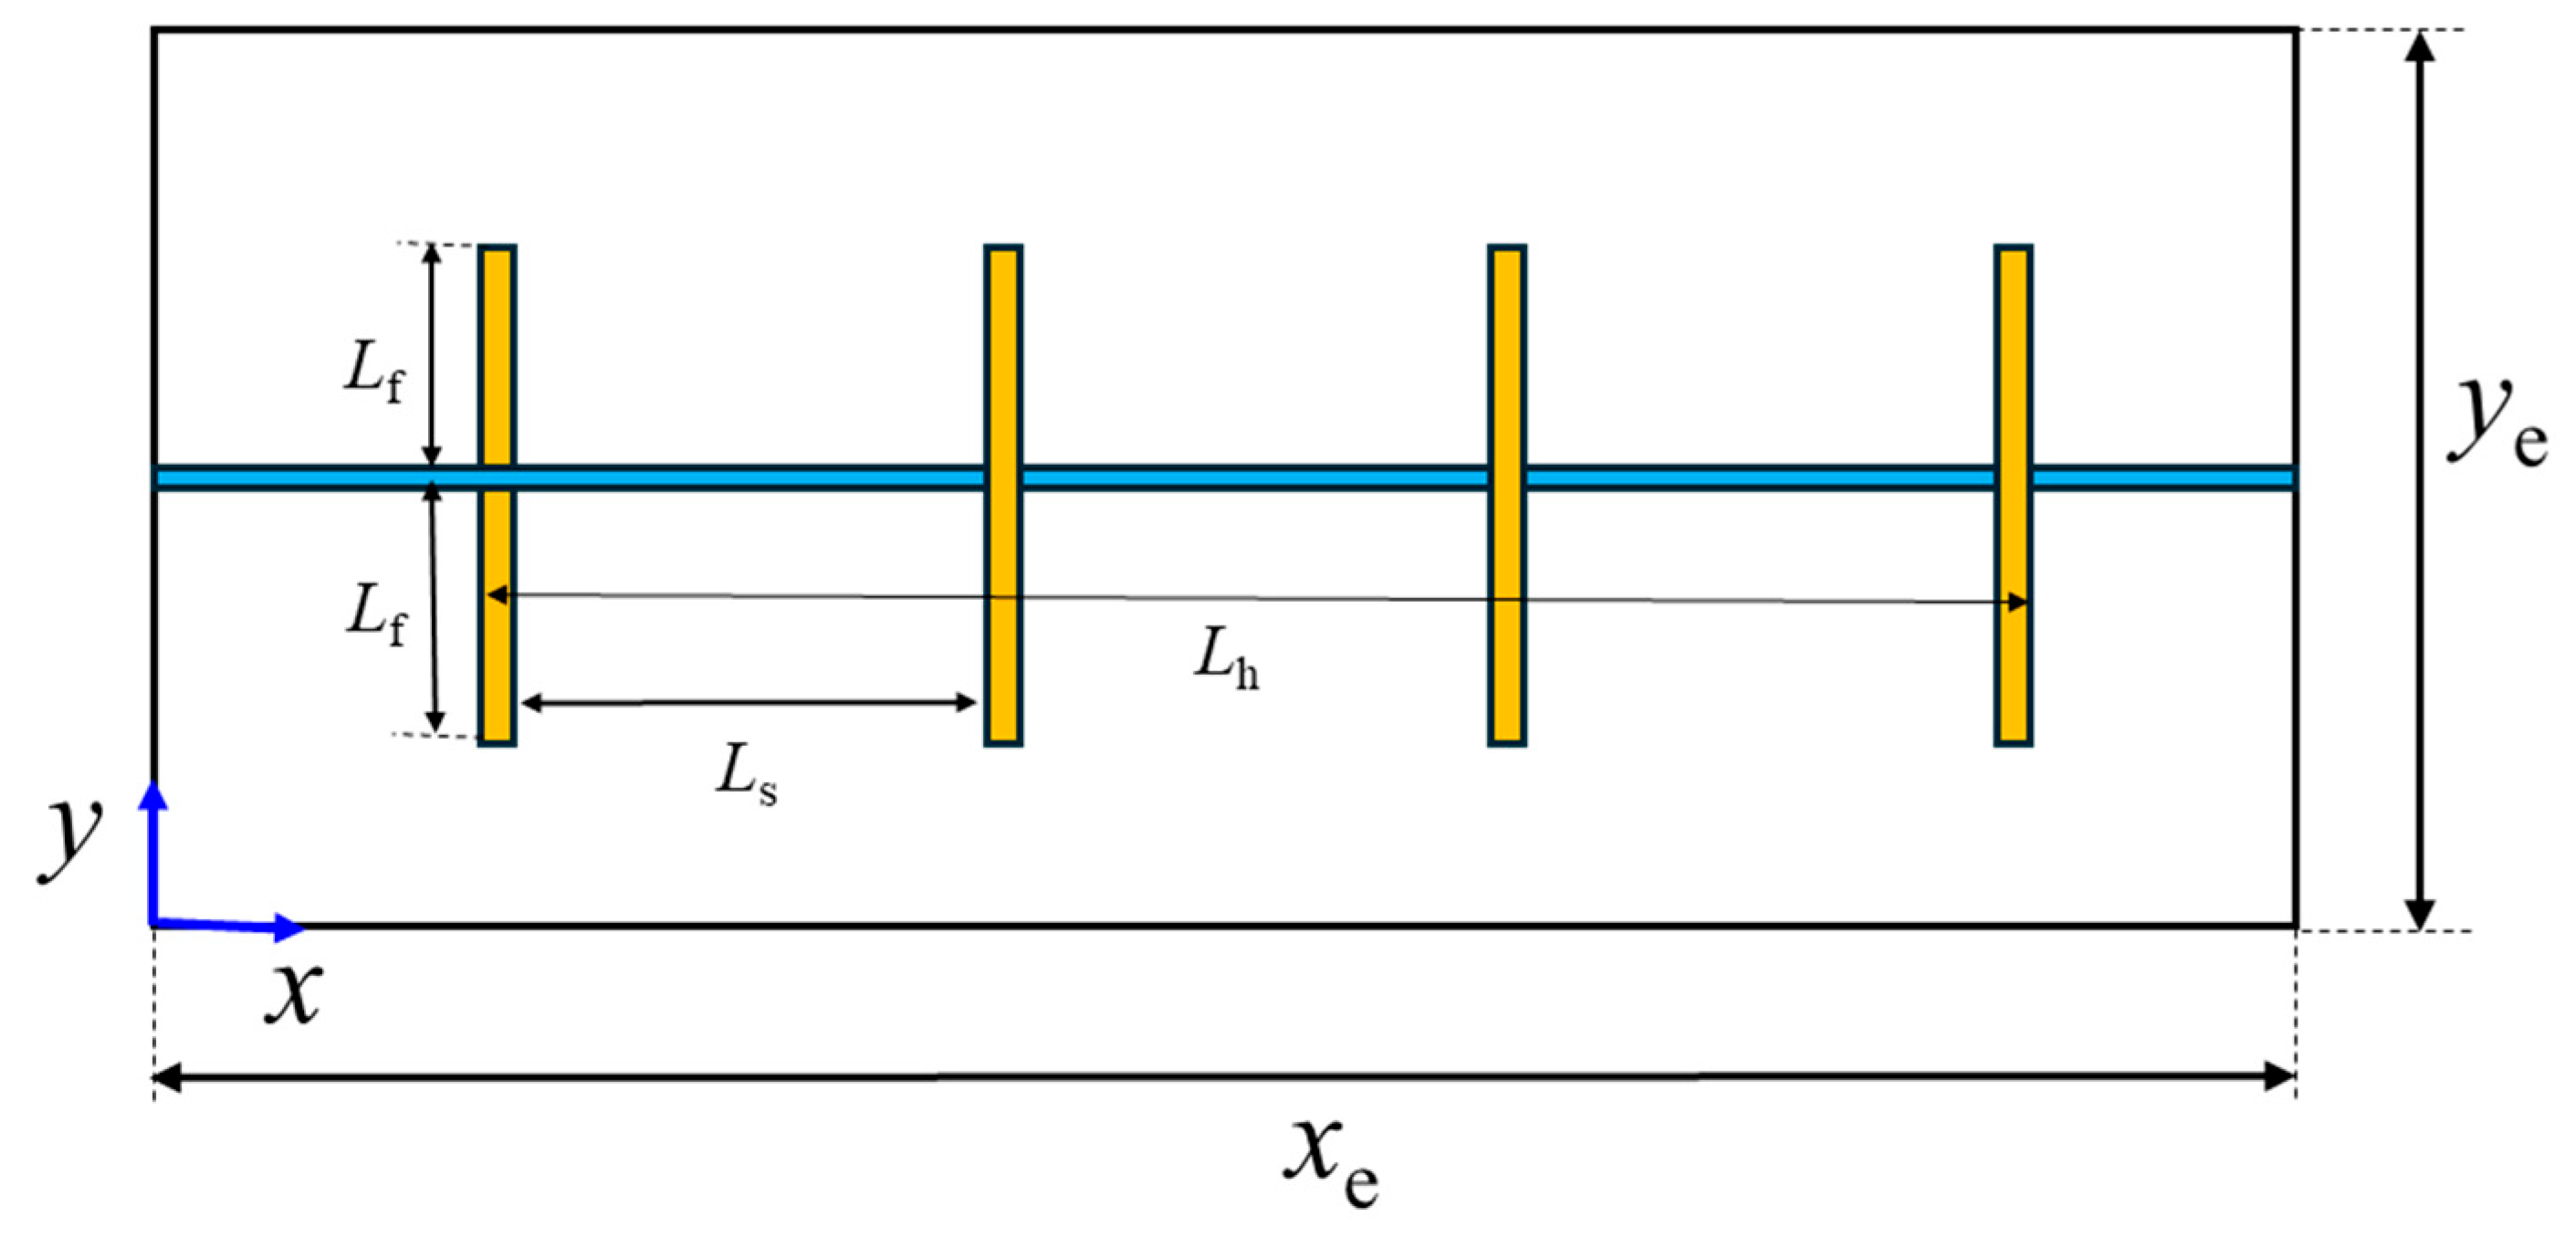
Based on the assumption that the hydraulic fractures fully penetrate the formation height, the 3D physical model can be rigorously simplified to a 2D planar representation, as depicted in Figure 3.
For a well completed with M hydraulic fractures, the principle of superposition is applied to account for the interactions among all fractures. The model also incorporates the effect of finite fracture conductivity, which introduces an additional pressure drop within the fracture. The total pressure response at any given fracture [32] is therefore the sum of its own production response and the interference pressure caused by all other fractures in the same well. This relationship can be expressed mathematically:
where
where is the equivalent location of the observation fracture, is the dimensionless m-th observation fracture x position, is the dimensionless m-th observation fracture y position, is the location of the n-th fracture surface source, is the dimensionless n-th fracture surface source x position, is the dimensionless n-th fracture surface source y position, is the dimensionless pseudo-pressure of on in Laplace domain, is the dimensionless fracture conductivity.
The total production rate from the well is the sum of the individual flow rates from each of the m fractures. In the Laplace domain, this constraint is written as a summation:
Furthermore, it is assumed that the frictional pressure drop along the horizontal wellbore is negligible, which implies that all fractures share a common wellbore pressure at any instant in time.
The coupling of these individual fracture responses under the constraints of a total flow rate and a common wellbore pressure allows the problem to be formulated as a system of linear equations. This system can be written in a compact matrix form. By solving this matrix equation, the transient flow rate distribution among the individual fractures and the corresponding wellbore pressure drop can be determined for a well producing at a constant total rate.
where is the dimensionless production rate of m-th fracture in Laplace domain, is the dimensionless well bottom pseudo-pressure in Laplace domain.
In the subsequent section, this single-well framework will be extended to develop the solution for the multi-well interference problem.
2.4. Multi-Well Solution in a Rectangular Reservoir
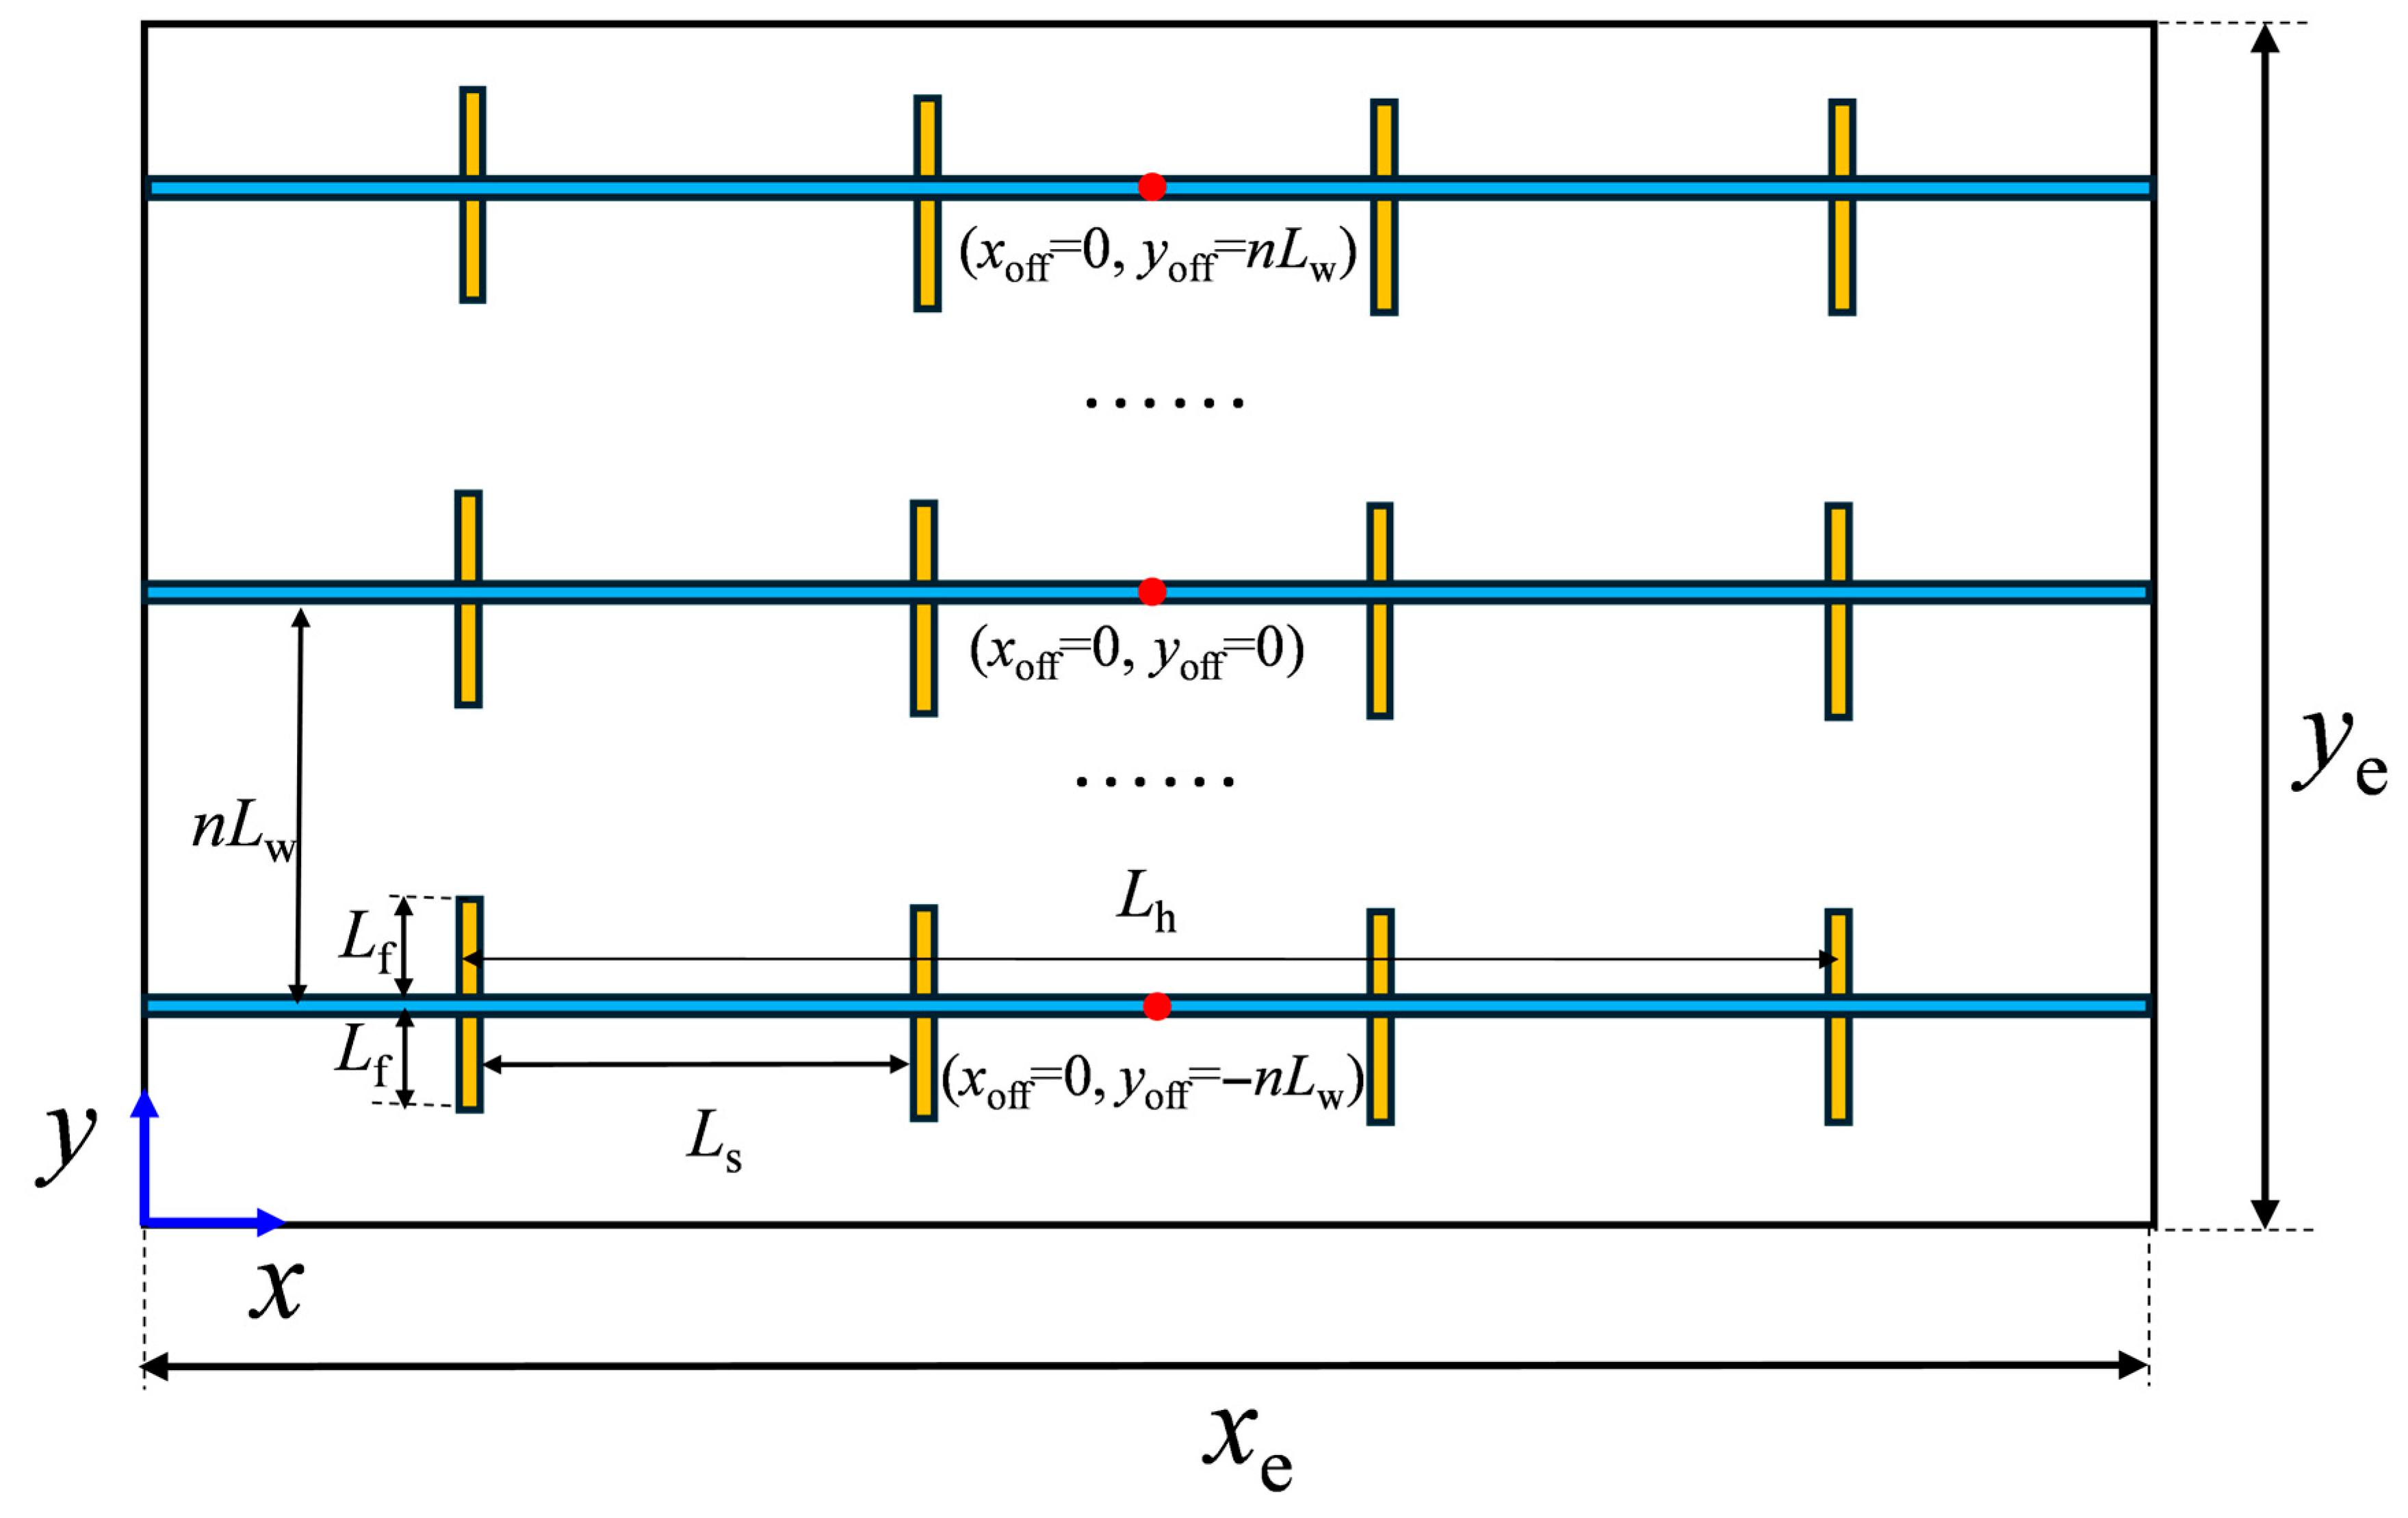
In field development, it is common for multiple horizontal wells to be produced simultaneously from the same shale reservoir to maximize recovery. The physical model for this multi-well, multi-fracture system is illustrated schematically in Figure 4. In Figure 4, xoff represents the distance in the x-direction between the x-coordinate of the center of each horizontal well and the x-coordinate of the center of the reservoir. yoff represents the distance in the y-direction between the y-coordinate of the center of each horizontal well and the y-coordinate of the center of the reservoir.
The methodology for the multi-well solution is a direct extension of the single-well framework. The core principle remains the application of superposition, but it is now applied on a larger scale to account for both intra-well interference (between fractures in the same well) and inter-well interference (between fractures in different wells).
To construct the solution, the production constraints for the entire system must first be defined. Consider a reservoir developed by N wells, with each well i having M hydraulic fractures. The production rate of each well contributes to the total reservoir production rate, and a governing relationship can be established to link them. In the Laplace domain, each well’s flow rate—expressed in terms of the Laplace variable (s)—is connected to the proportion of its own production compared to the total field output.
where is the dimensionless production rate of m-th fracture belonging to the n-th well in Laplace domain, is the dimensionless production rate of n-th well in Laplace domain.
The pressure response at any fracture (m) in any given well (n) is the cumulative result of its own production plus the interference from every other fracture in the entire system, including those in neighboring wells. The pressure interference at an arbitrary fracture in well n, caused by the production from an arbitrary fracture in well i, can be calculated using the same planar source solution derived previously.
where is the equivalent location of the mth observation fracture belonging to the nth well, is the dimensionless observation fracture position x of m-th fracture belonging to the n-th well, is the dimensionless observation fracture position y of m-th fracture belonging to the n-th well, is the location of the j-th fracture surface source belonging to the i-th well, is the dimensionless fracture surface source position x of j-th fracture belonging to the i-th well, is the dimensionless fracture surface source position y of j-th fracture belonging to the i-th well, is the dimensionless pseudo-pressure of on in Laplace domain.
By systematically accounting for all these interactions and coupling them with the production constraints, the entire multi-well, multi-fracture problem can be formulated as a single, comprehensive system of linear equations. This system is most effectively expressed in a large-scale matrix form. Solving this matrix equation allows for the determination of the transient flow rate distribution for every fracture in the system, as well as the pressure response of each well.
where is the dimensionless well bottom pseudo-pressure of n-th well in Laplace domain.
By solving the matrix equation system given in Equation (16), the dimensionless bottom-hole pseudo-pressure solution for each well can be obtained in the Laplace domain. Subsequently, the Stehfest numerical inversion algorithm [45] is employed to transform the results back into the real-time domain. Finally, the corresponding dimensional variables are recovered using the dimensionless definitions provided in Table A2.
3. Model Validation
To verify the accuracy and reliability of the proposed semi-analytical model, a comparative study was conducted using the numerical module of KAPPA-Saphir. The validation case considers two fractured horizontal wells producing at a constant gas rate of 105 m3/d for a total duration of 105 h within a rectangular closed reservoir. The key reservoir and fracture parameters used for both the numerical simulation and the proposed model are summarized in Table 1. Table 2 shows the parameter values for the theoretical model after the numerical simulation conversion.
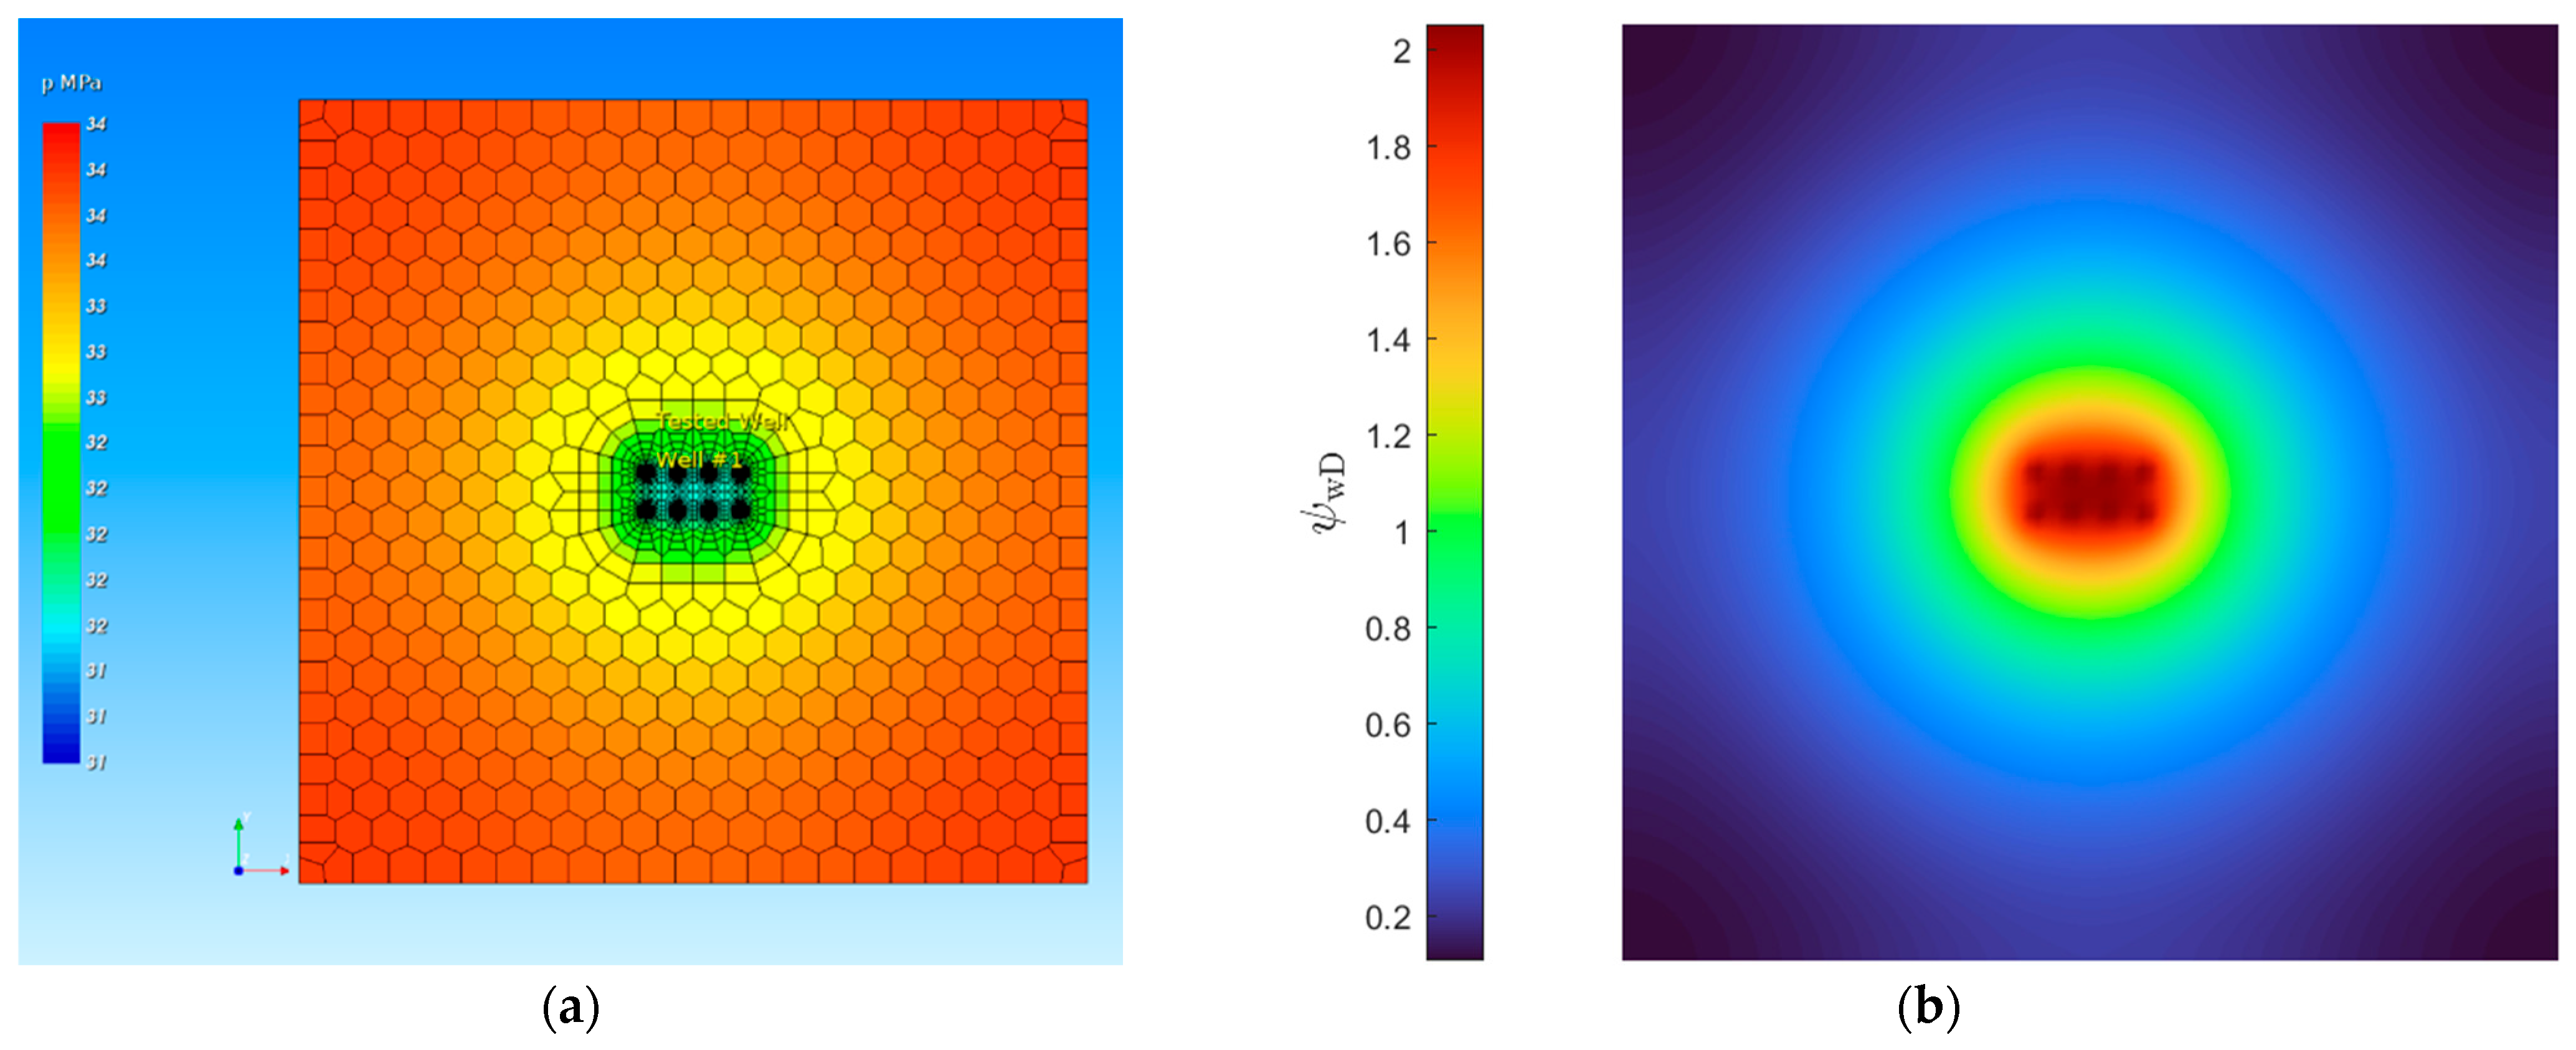
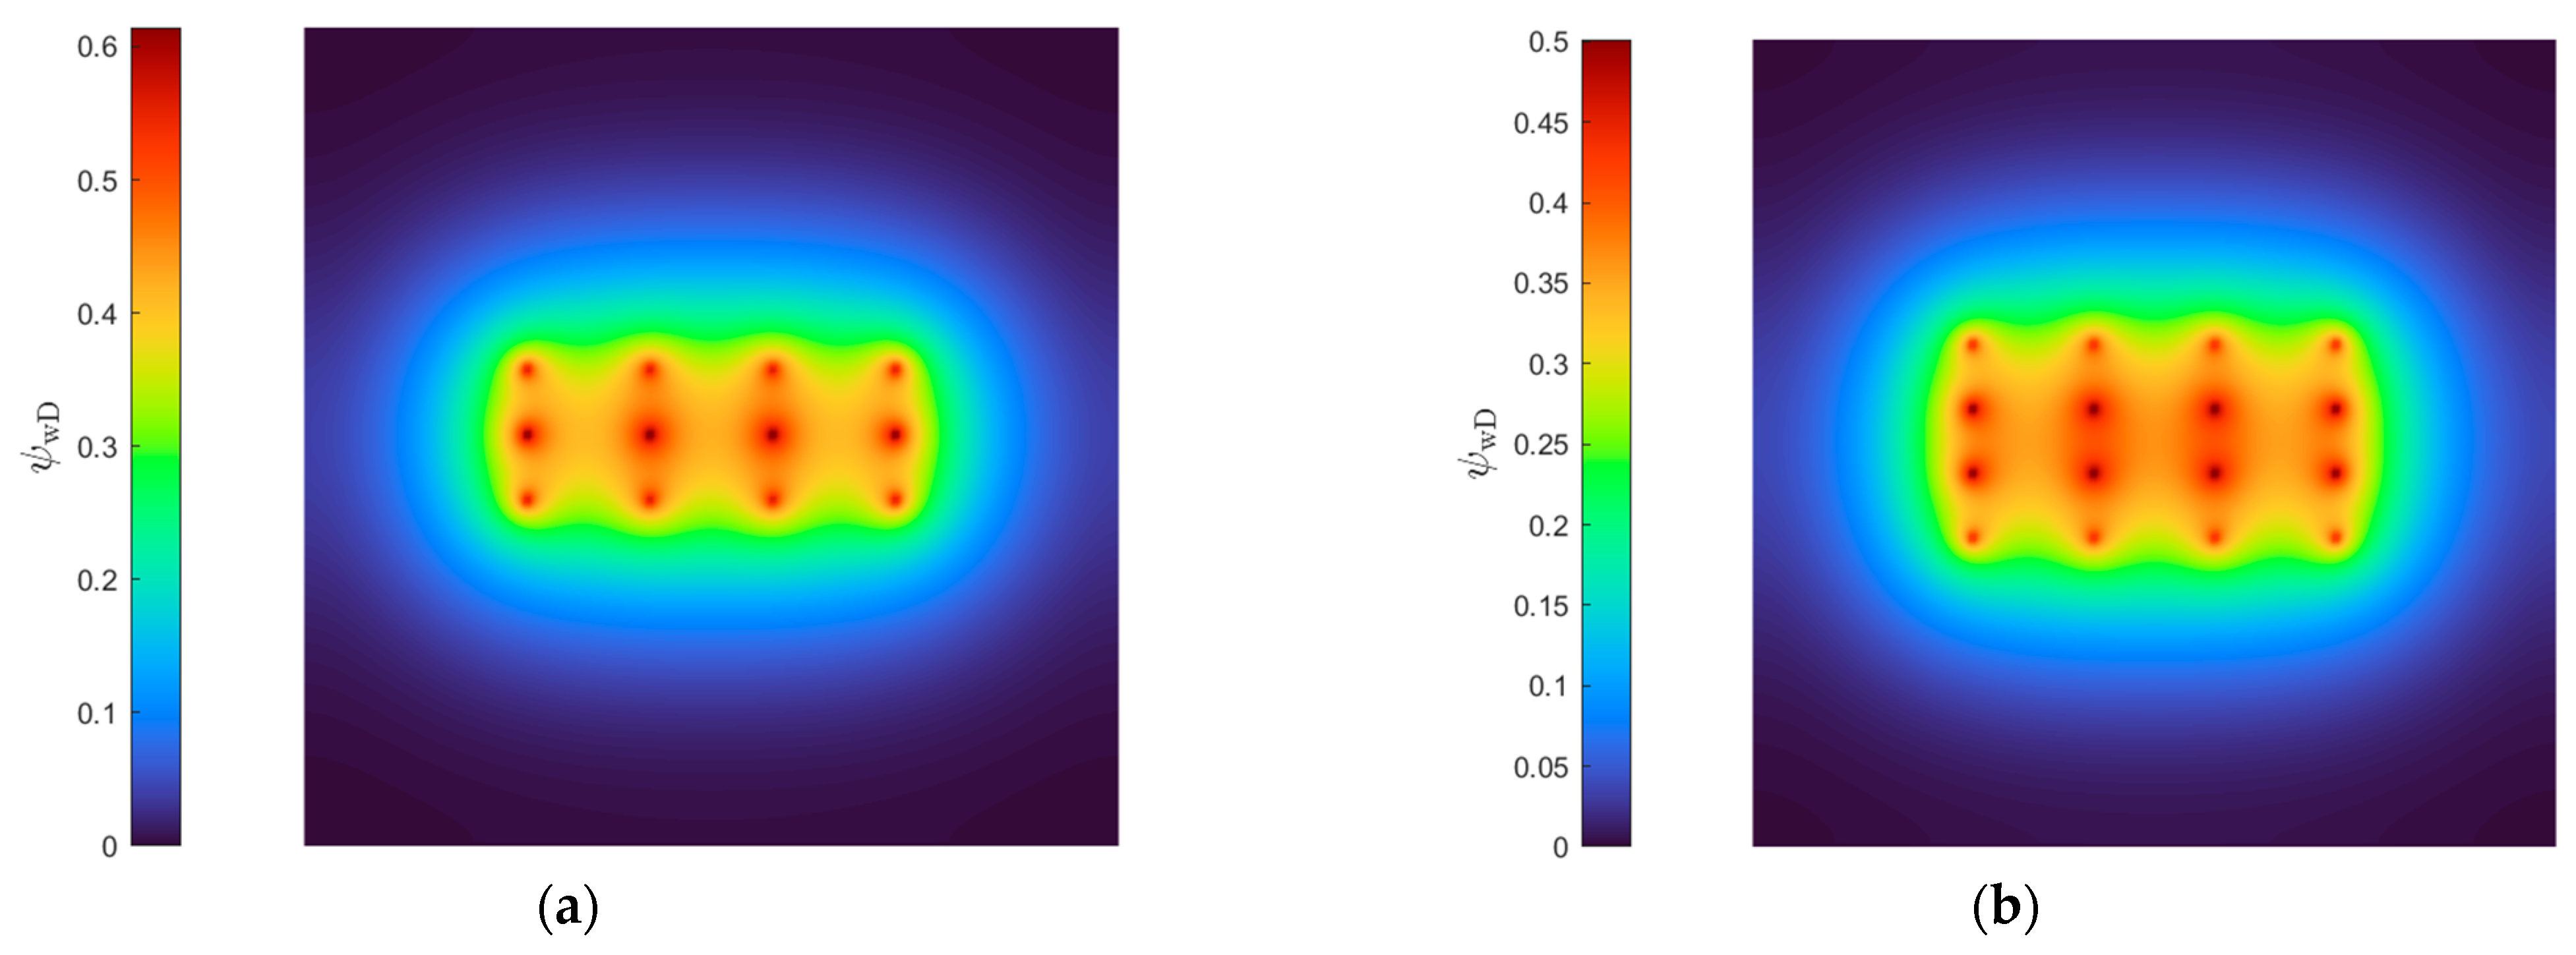
Figure 5 presents a comparison of the pressure distributions (pressure contours) between the Saphir numerical simulator and the proposed model at 40,500 h. The spatial pressure depletion patterns observed in both models are highly similar, demonstrating the model’s capability to capture inter-well interference and boundary effects.
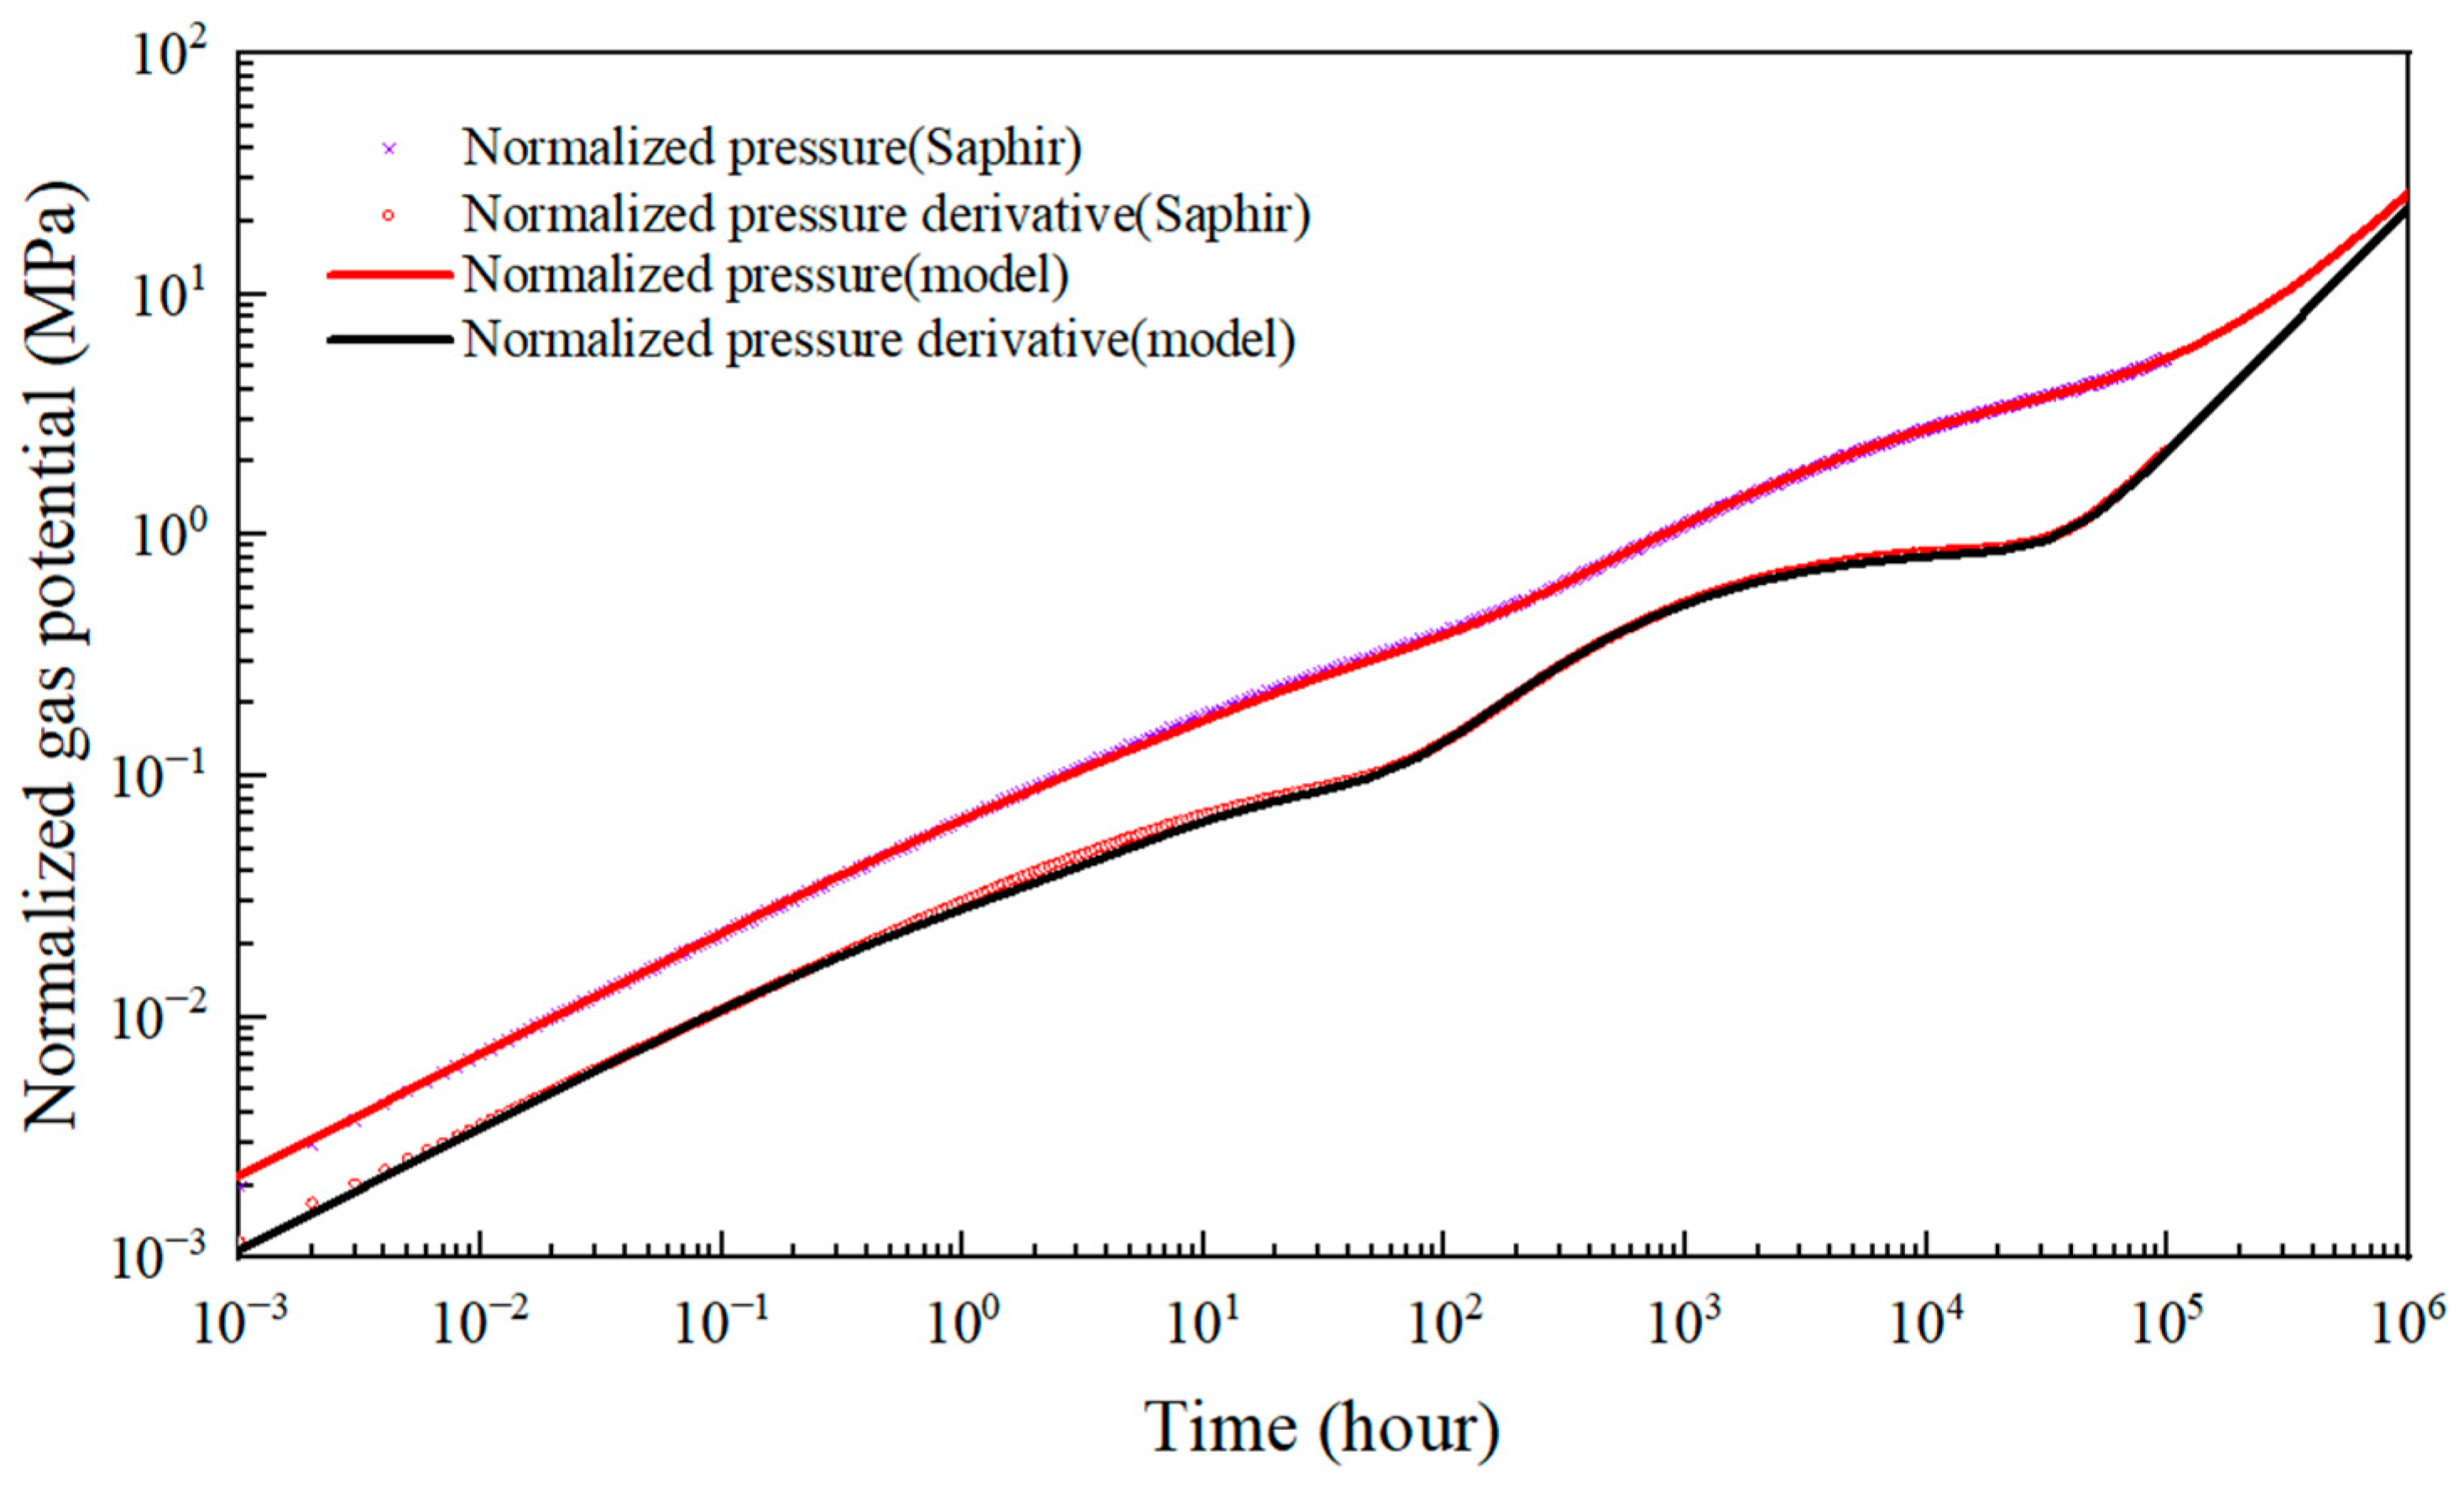
Furthermore, Figure 6 shows the comparison of the log-log type curves (Normalized pressure drop and Normalized pressure derivative) generated by Saphir and our model. The results exhibit an excellent match across most flow regimes, with a maximum relative error of 3.2% and an average relative error of less than 1% across the entire production period. our model (after appropriate truncation) achieves a solution in only 0.8 s, whereas the numerical simulation requires 224.6 s, a 99.6% reduction in computation time. This high degree of agreement confirms the mathematical rigor of our derivation and the robustness of the solution method. Consequently, the validated model provides a reliable foundation for the subsequent complexity analysis and sensitivity studies of various influencing factors.
4. Result and Discussion
4.1. Type Curves and Flow Regimes
To investigate the interference behavior between multi-well multi-stage fractured horizontal wells (MFHWs) in shale gas reservoirs, transient pressure analysis is conducted by plotting log-log type curves. These curves characterize the unstable pressure behavior and the impact of inter-well interference on flow signatures. For this analysis, a base case consisting of two identical MFHWs with an inter-well spacing of 40LfD (the remaining parameters are shown in Table 3) is utilized to identify the typical flow regimes.
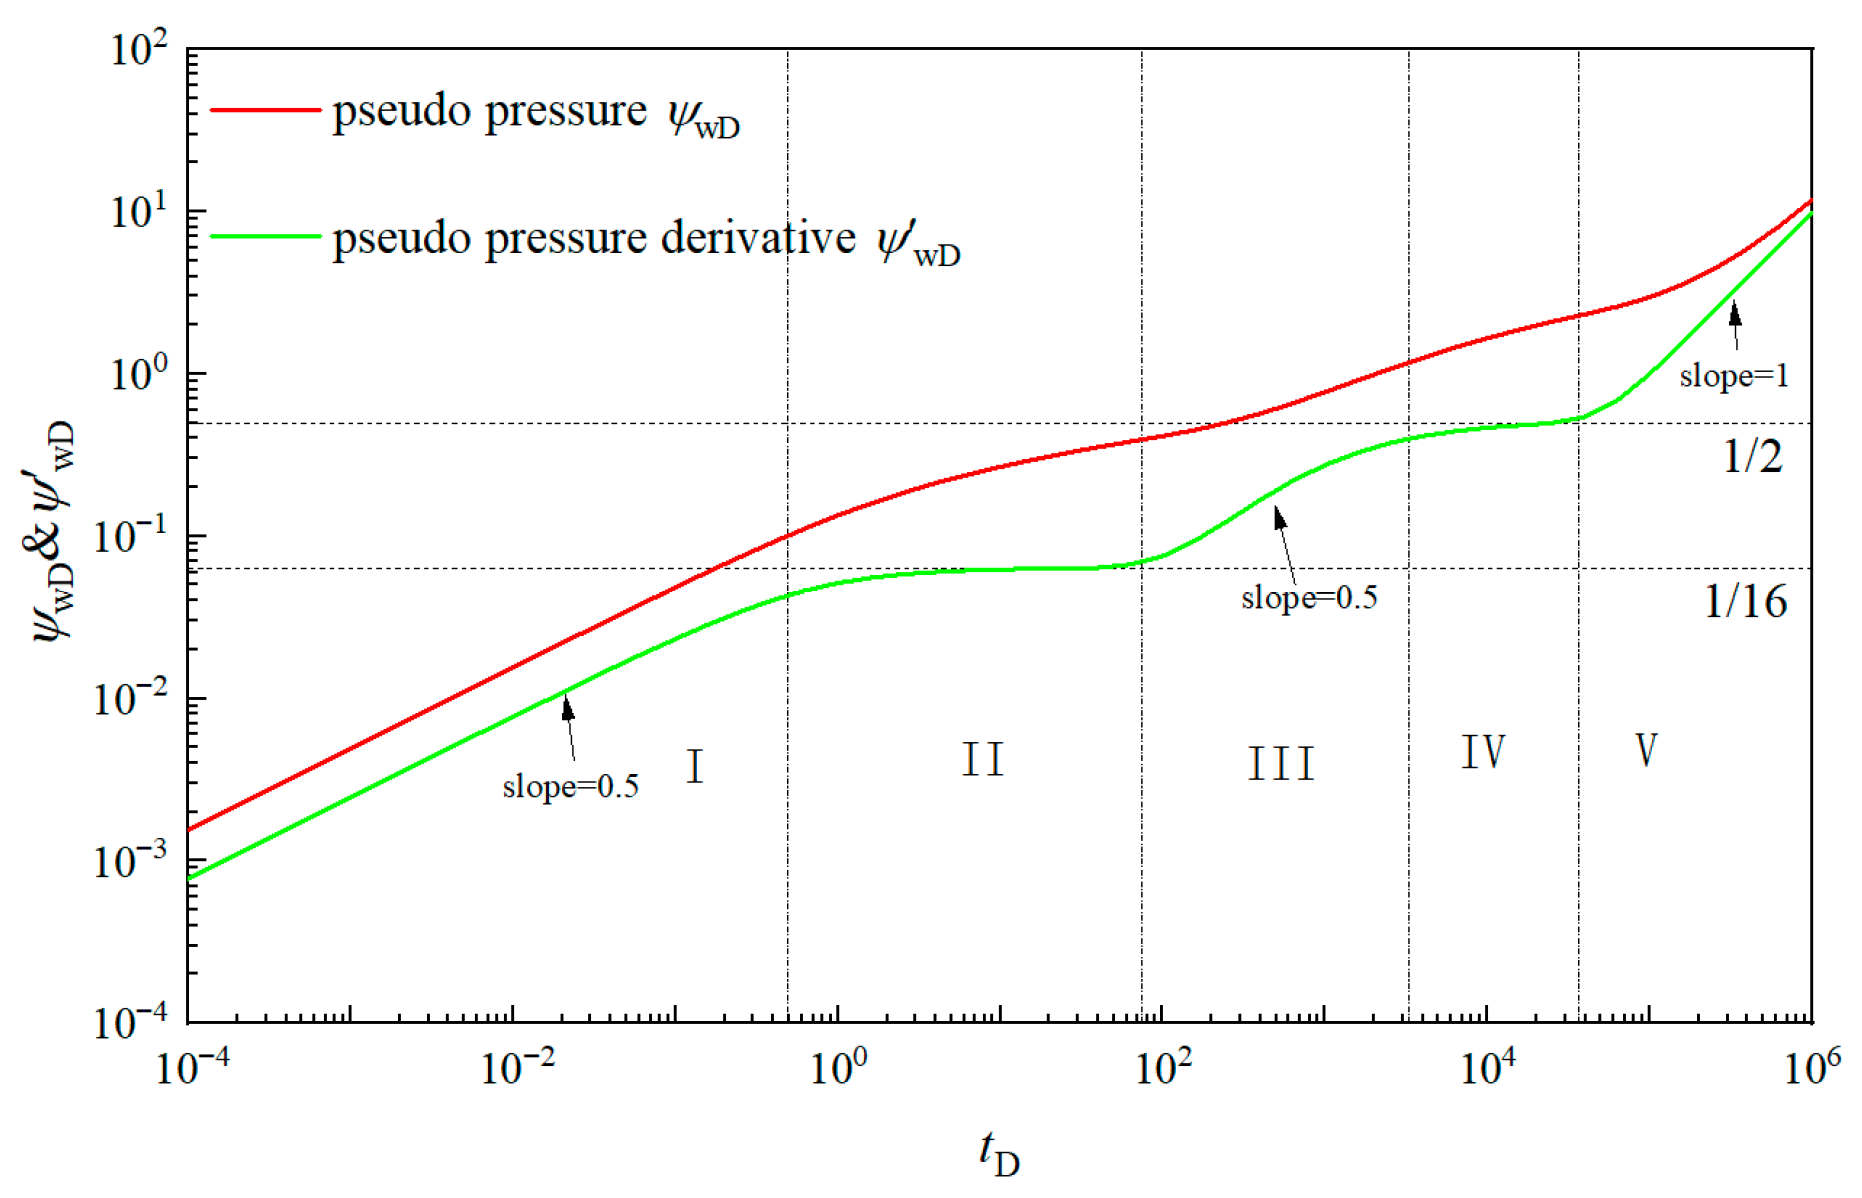
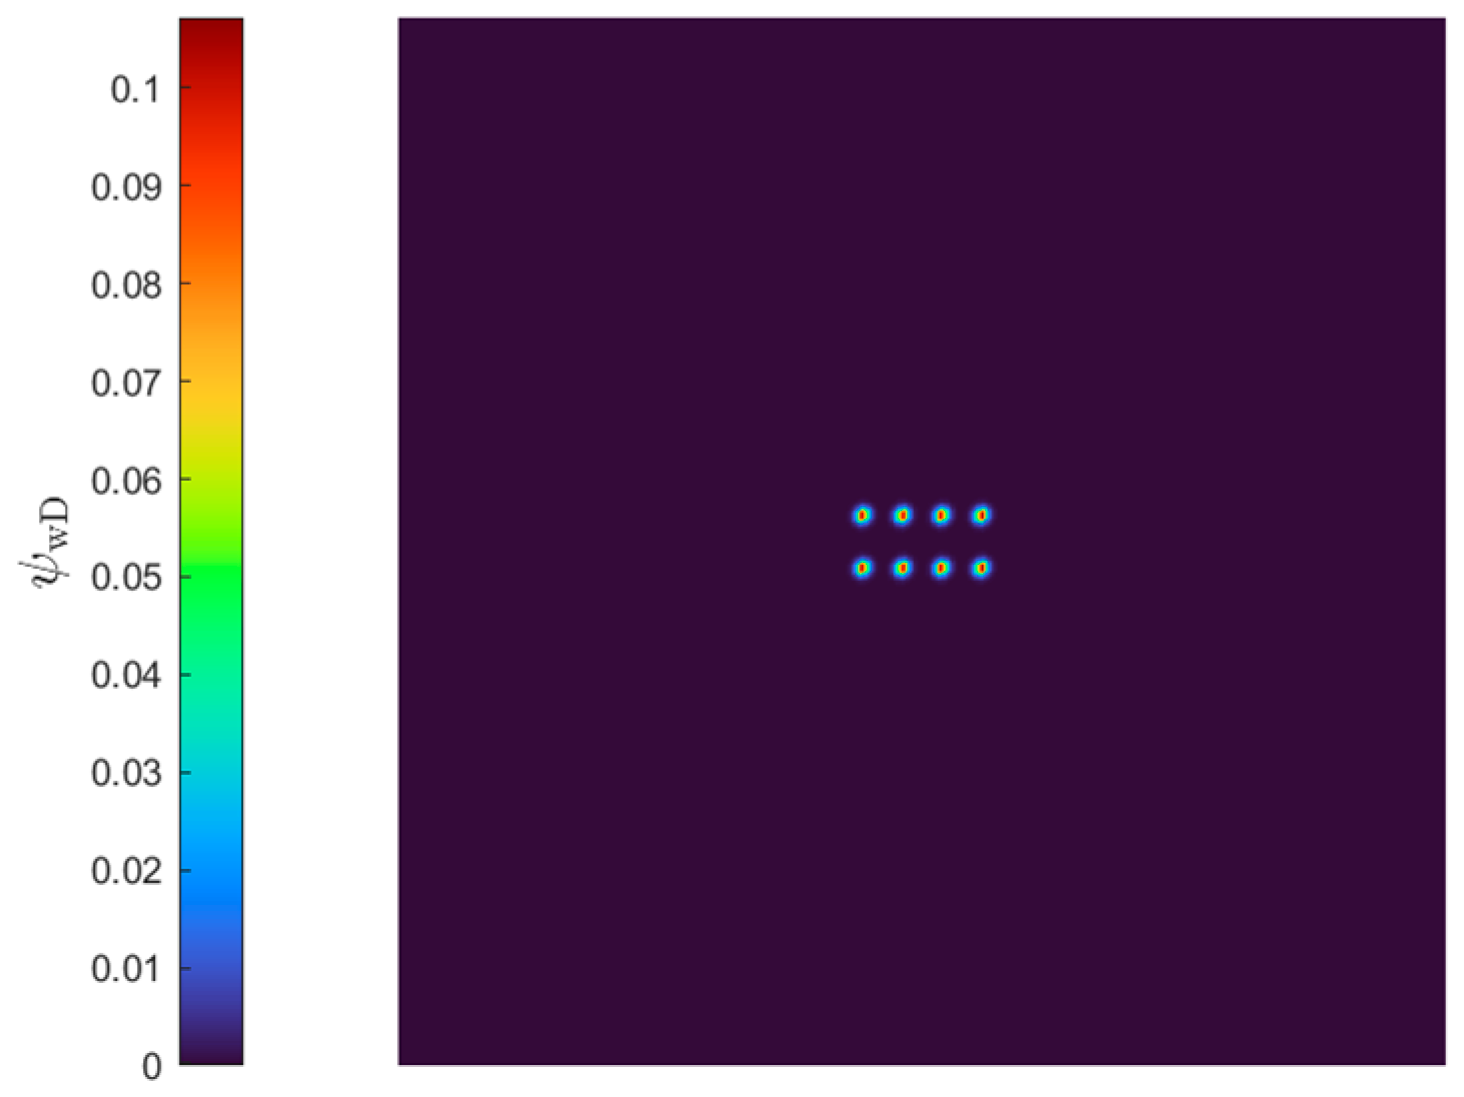
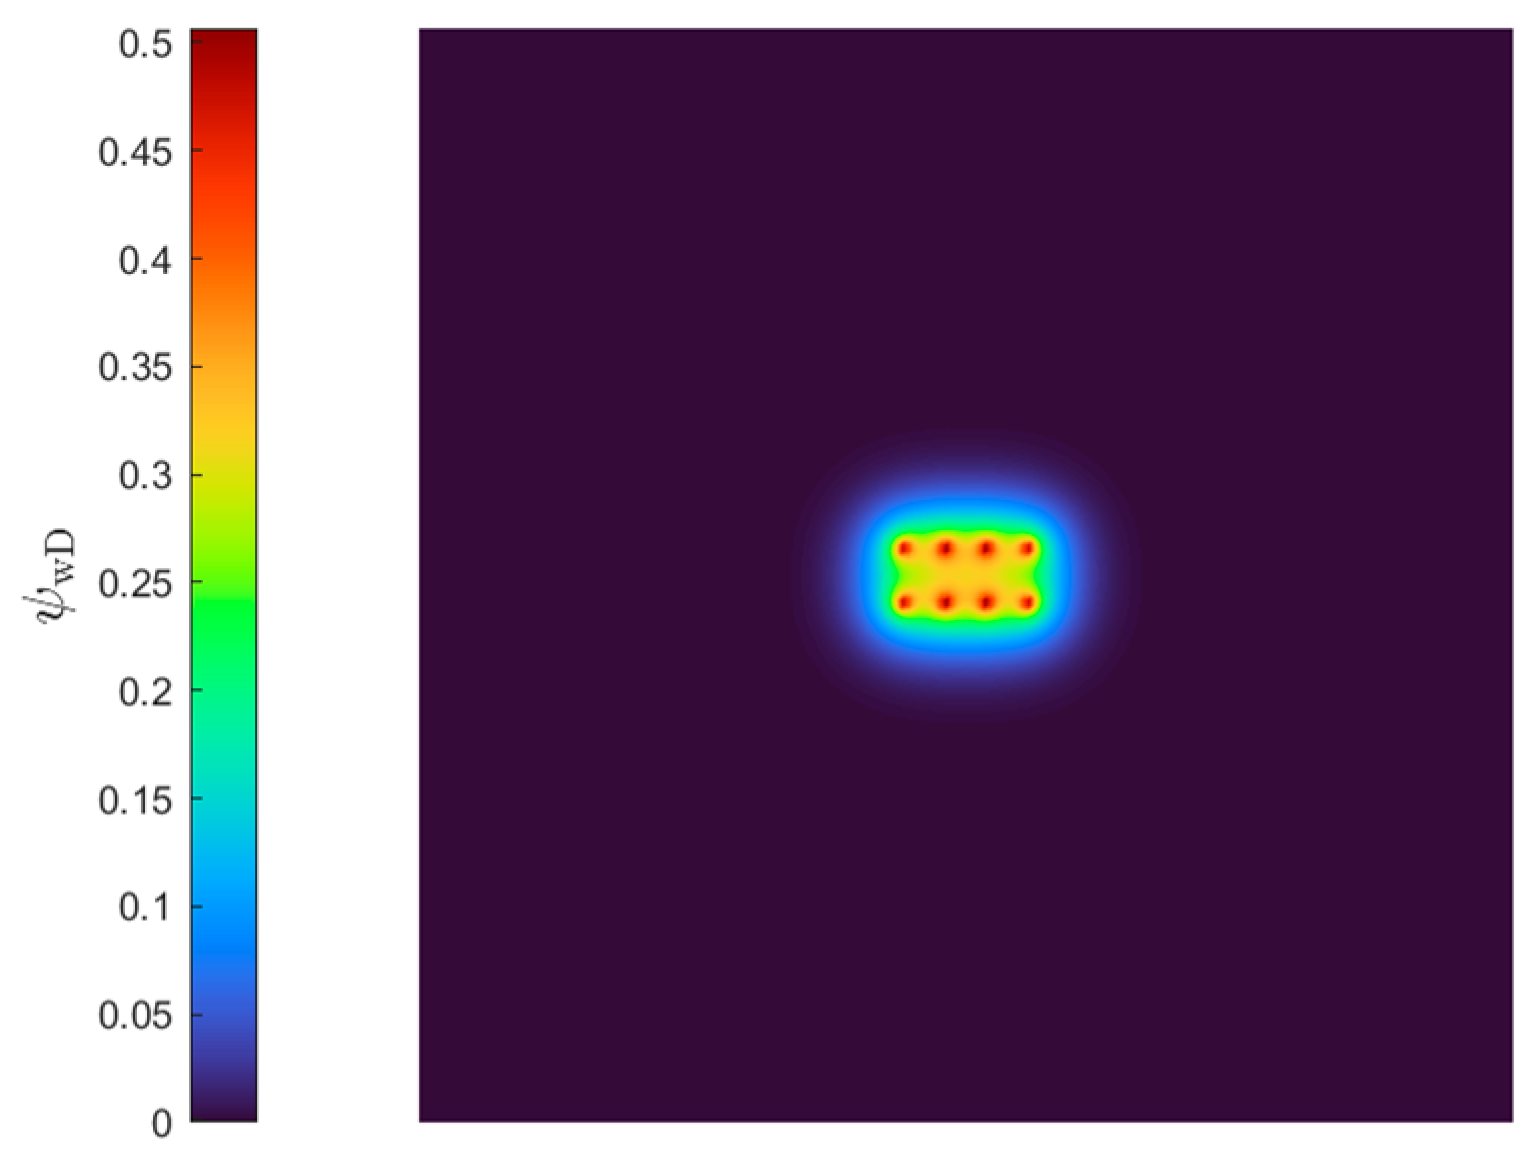
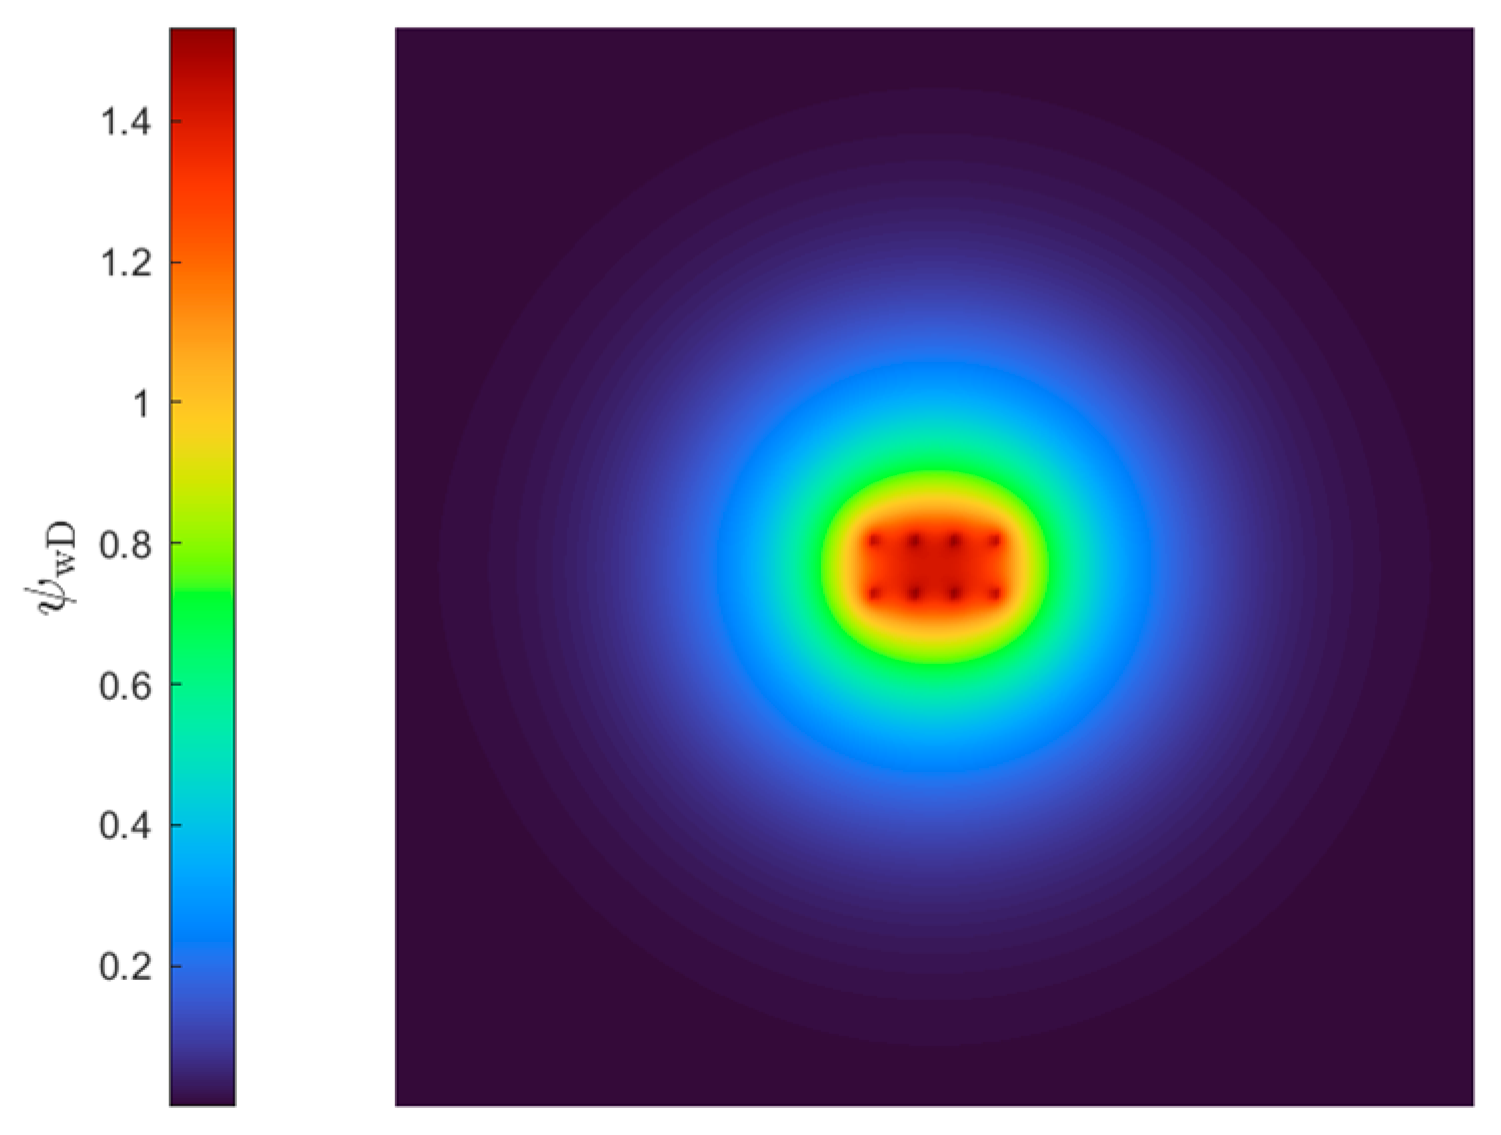
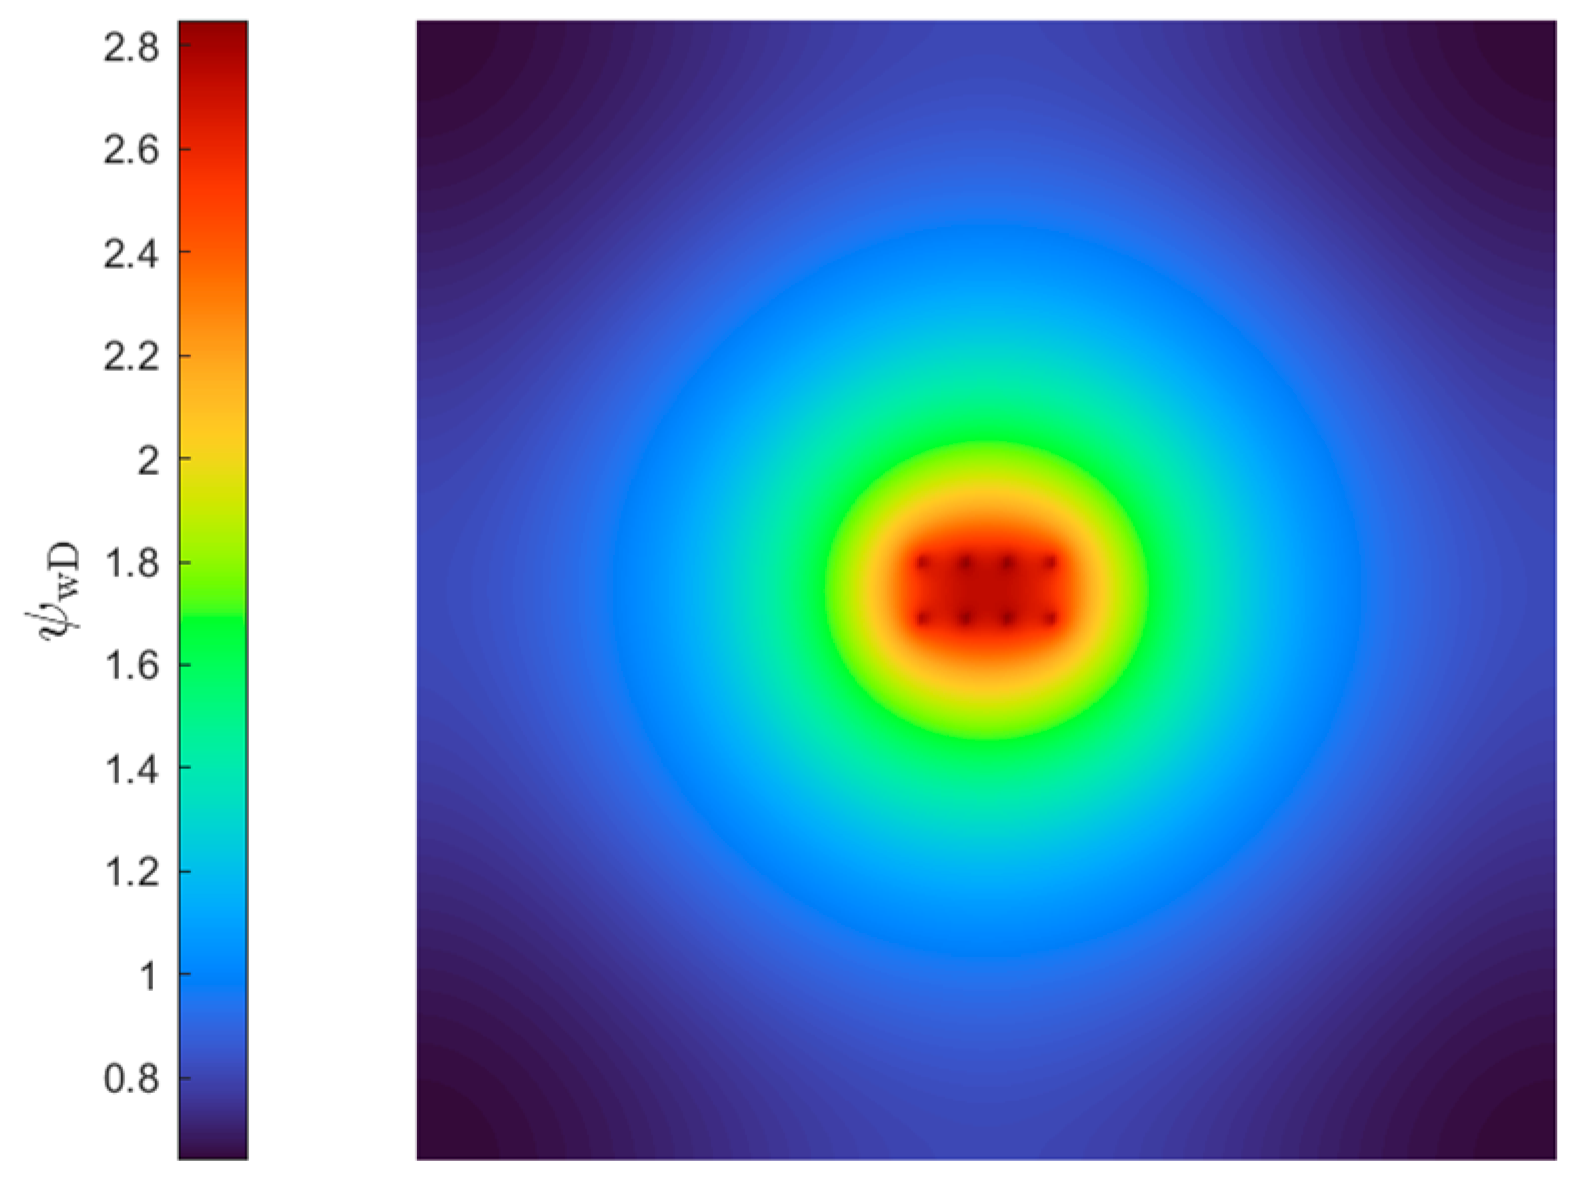
As illustrated in Figure 7, the transient flow process of MFHWs in a bounded shale reservoir can be categorized into five distinct flow regimes. Each stage is characterized by specific signatures on the dimensionless pseudo-pressure () and its derivative () curves, complemented by dimensionless pressure contours:
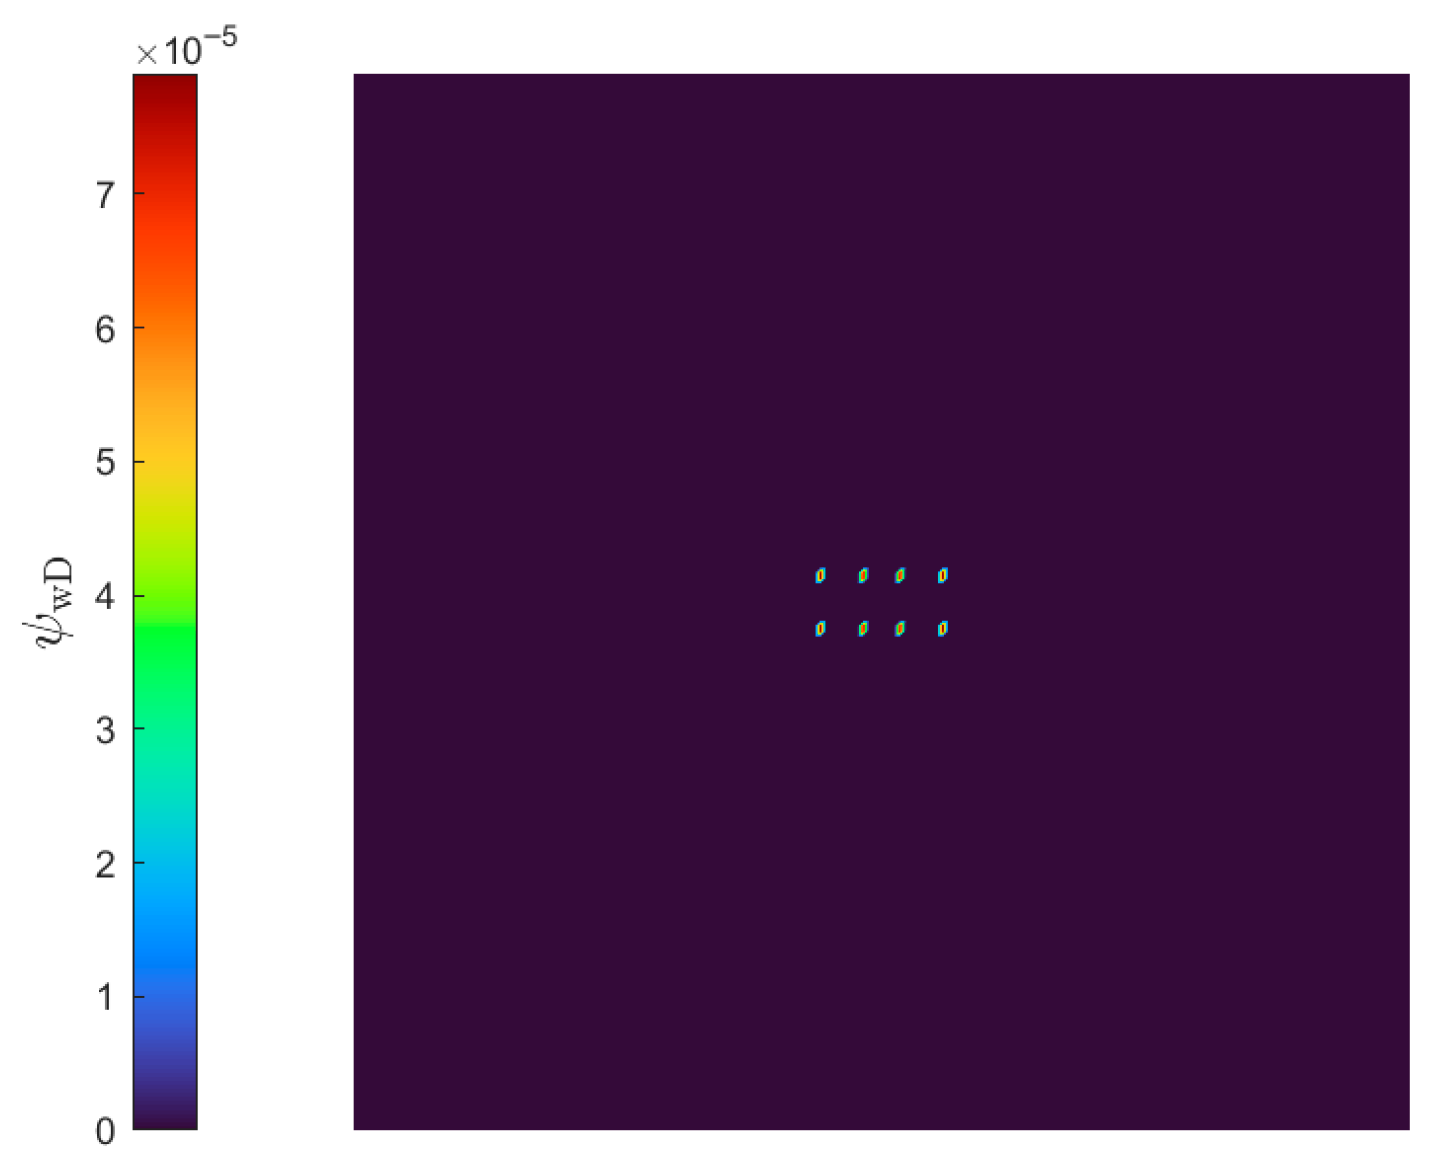
Stage I: Fracture Linear Flow. This stage is dominated by the linear flow of gas within the hydraulic fractures. On the log-log plot, both the pseudo-pressure and pressure derivative curves are parallel with a characteristic slope of 0.5. The pressure contours (Figure 8) indicate that the pressure drop is primarily concentrated within and immediately adjacent to the fracture systems.
Stage II: Fracture Radial Flow. As flow progresses, a radial flow pattern develops around each individual fracture. This stage is identified by a horizontal plateau on the pressure derivative curve. The value of this plateau is related to the number of fractures, while its duration is governed by the fracture spacing. If the fractures are spaced too closely, this stage may be suppressed. The pressure contours (Figure 9) show that the pressure drawdown begins to expand radially from the fractures into the surrounding matrix.
Stage III: Compound Linear Flow. During this stage, the gas flow from the reservoir toward the fractures exhibits a linear pattern collectively for each well. The derivative curve again shows a slope of 0.5. Critically, the pressure contours (Figure 10) reveal the onset of inter-well interference; the pressure drop in the region between the two wells occurs significantly faster than in the outlying areas.
Stage IV: Compound Radial Flow. As the pressure waves from the wells further interact, the entire multi-well system begins to behave as a single source, exhibiting a compound radial flow pattern. The derivative curve shows a slope approaching 0, typically with a stabilized value of 0.5 (depending on normalization). The contours (Figure 11) illustrate that inter-well interference is fully developed, and the pressure drawdown envelopes evolve into elliptical and eventually circular isopotential lines centered around the well group.
Stage V: Boundary-Dominated Flow (BDF). The final stage occurs when the pressure wave reaches the rectangular closed boundaries of the reservoir. This is characterized by the derivative curve rising with a unit slope (slope = 1). The contours (Figure 12) confirm that the pressure drawdown has extended to the reservoir limits, and the pressure waves have fully contacted the no-flow boundaries.
4.2. Sensitivity Analysis
To evaluate the impact of various well configurations and production schemes on inter-well interference, a series of sensitivity analyses were performed. The factors investigated include the vertical inter-well spacing (controlled by the dimensionless y-offset) in symmetric layouts, the horizontal staggering distance in asymmetric layouts (controlled by the dimensionless x-offset), production rate allocation (flow rate ratios), and the number of wells in the cluster.
In these configurations, the dimensionless y-offset (yoff) is defined as the dimensionless distance in the y-direction between the y-coordinate of the center of each horizontal well and the y-coordinate of the center of the reservoir. The dimensionless x-offset (xoff) represents the dimensionless distance in the x-direction between the x-coordinate of the center of each horizontal well and the x-coordinate of the center of the reservoir. Consequently, the total vertical spacing between the two symmetric wells is 2×yoff. Similarly, the dimensionless x-offset (xoff) represents the lateral displacement of each well from the vertical centerline (x = xeD/2). Unless otherwise specified, the default parameters used for the sensitivity analysis are summarized in Table 3.
4.2.1. Effect of Inter-Well Spacing in Symmetric Configurations
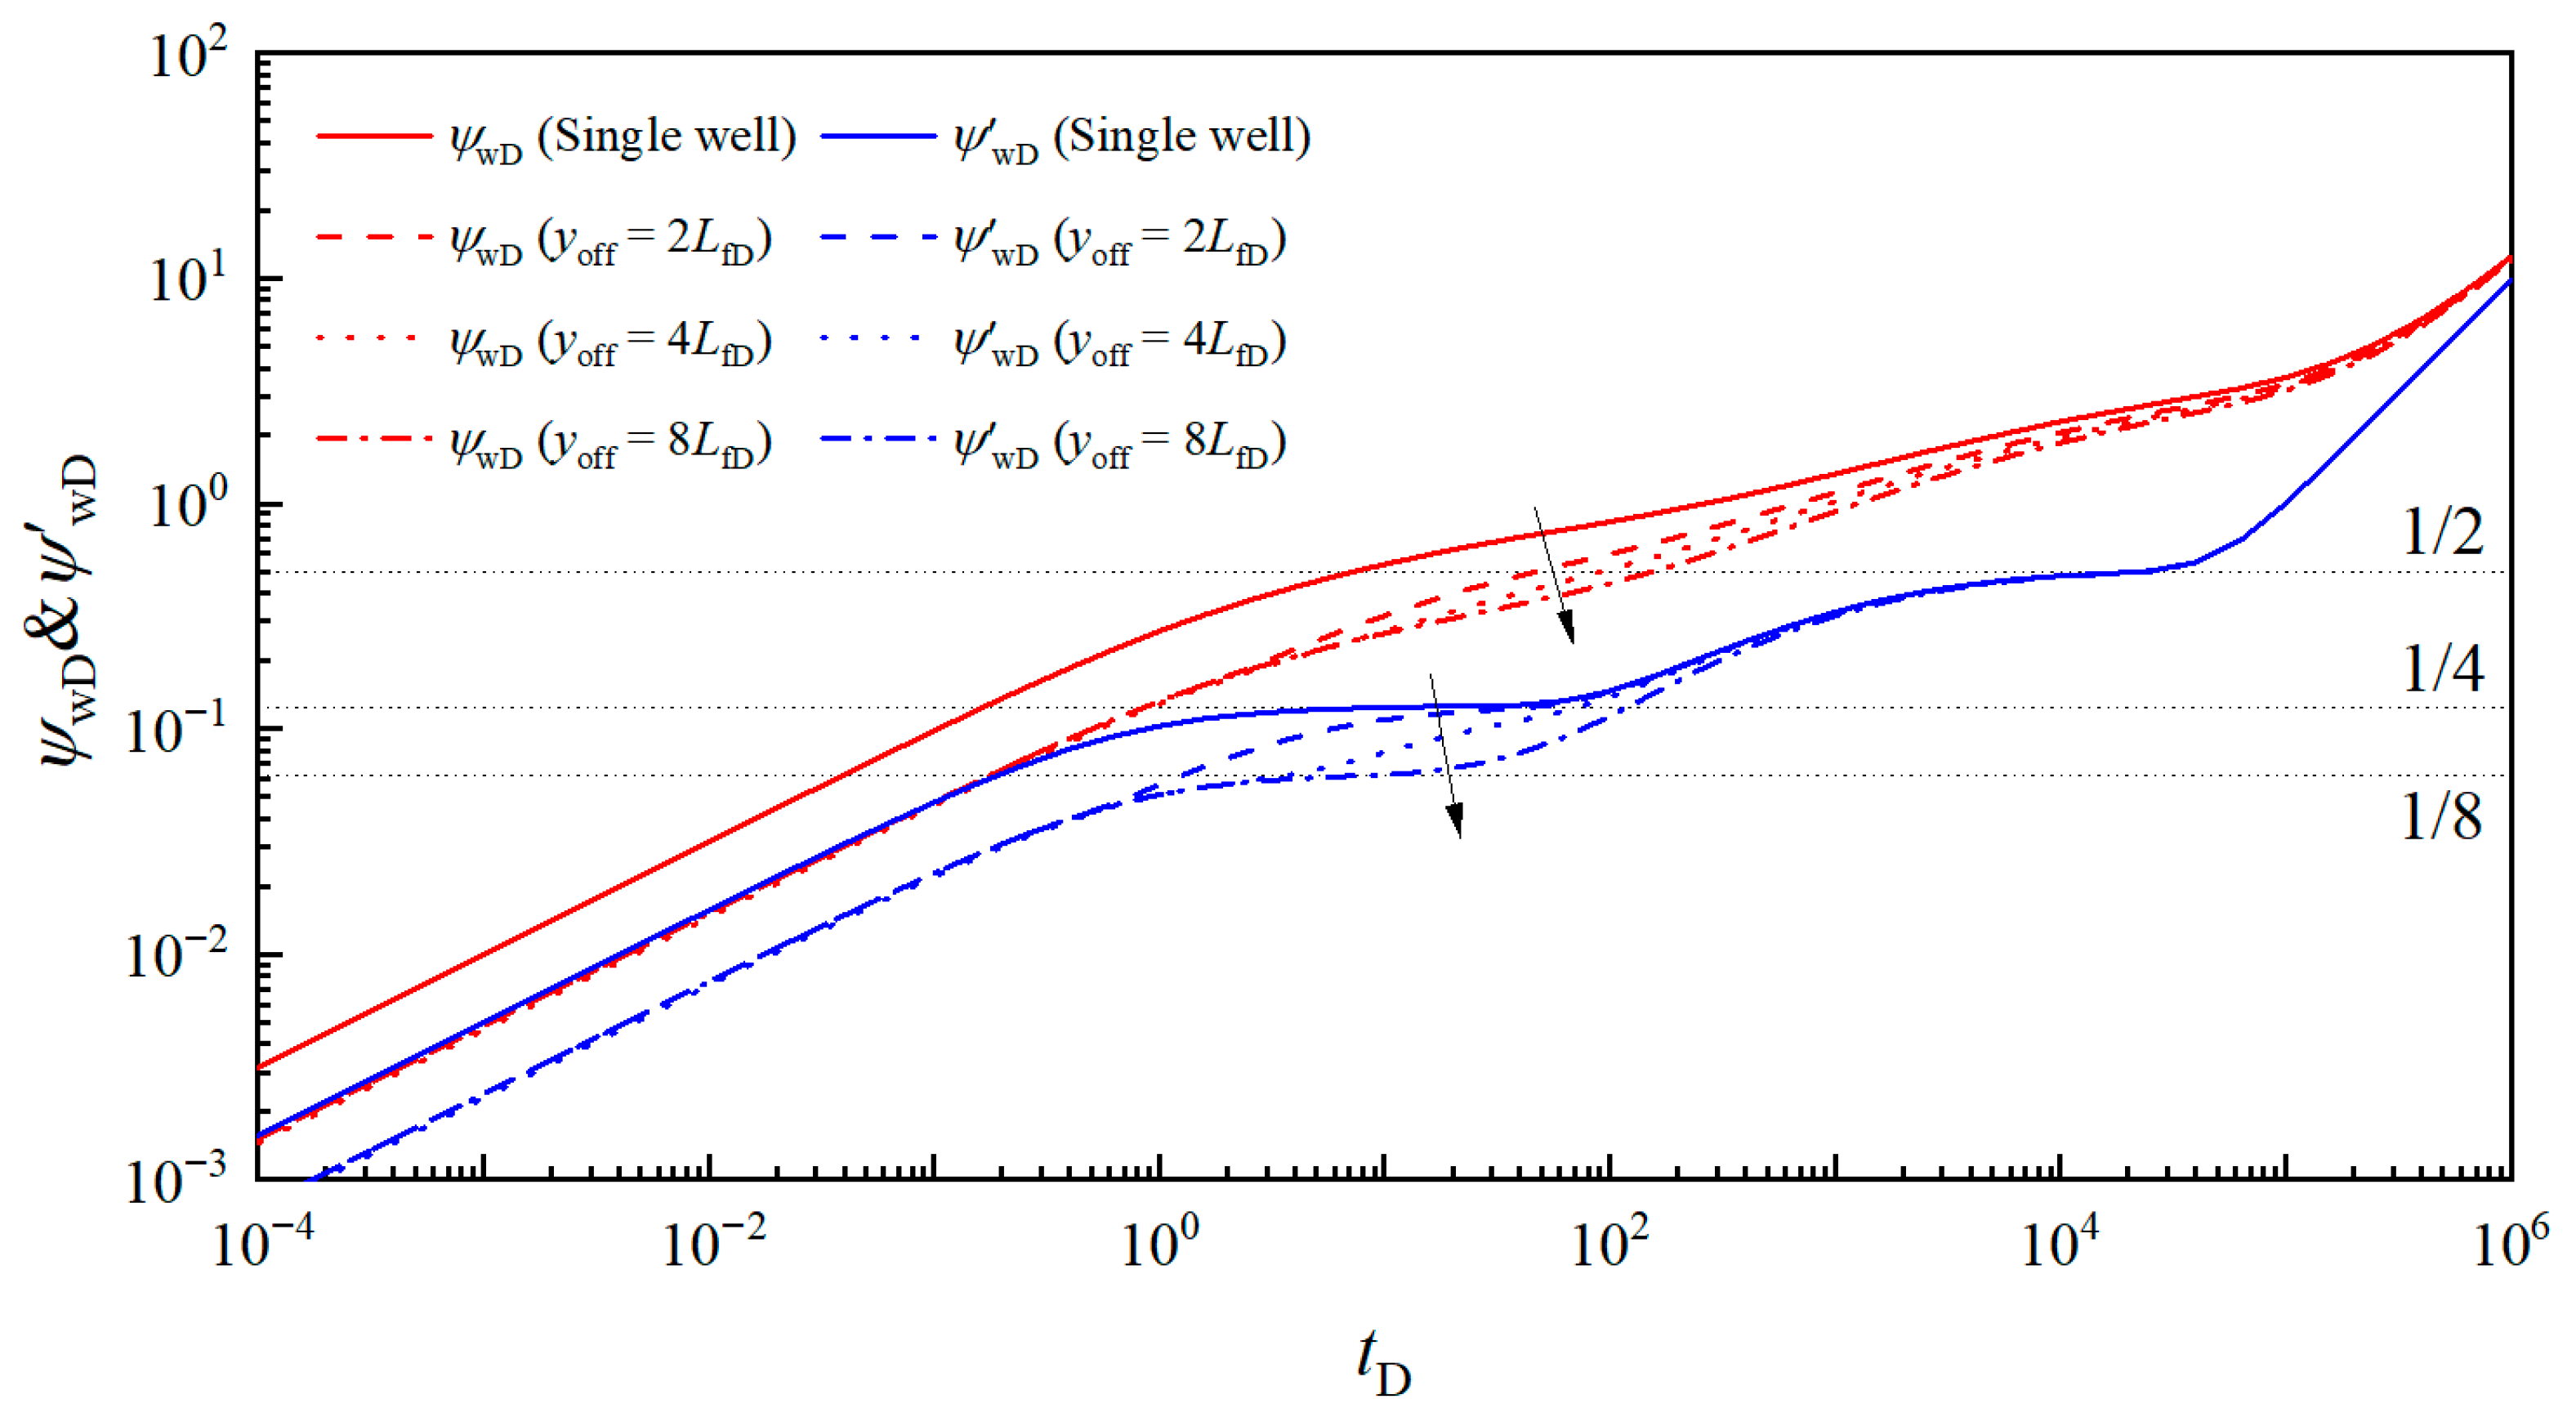
In this study, a “symmetric well configuration” refers to a layout where two wells are positioned symmetrically across the central axis of the reservoir (y = yeD/2), with both wellbore centers located at x = xeD/2. In field practice, the spacing between fractured horizontal wells typically ranges from 200 m to 400 m. Assuming a fracture half-length (Lf) of 50 m, the interference effects for single well and three dimensionless vertical distances from the central axis (yoff): 2LfD (inter-well spacing of 200 m), 4LfD (400 m), and 8LfD (800 m) were analyzed.
The sensitivity results in Figure 13 indicate that the inter-well spacing significantly influences the pressure derivative curves. As the distance between adjacent wells decreases, the duration of the fracture radial flow stage is notably shortened. This is because the pressure waves from neighboring wells encounter each other earlier, triggering an earlier onset of interference. Consequently, the transition period from fracture radial flow to compound linear flow becomes more prolonged.
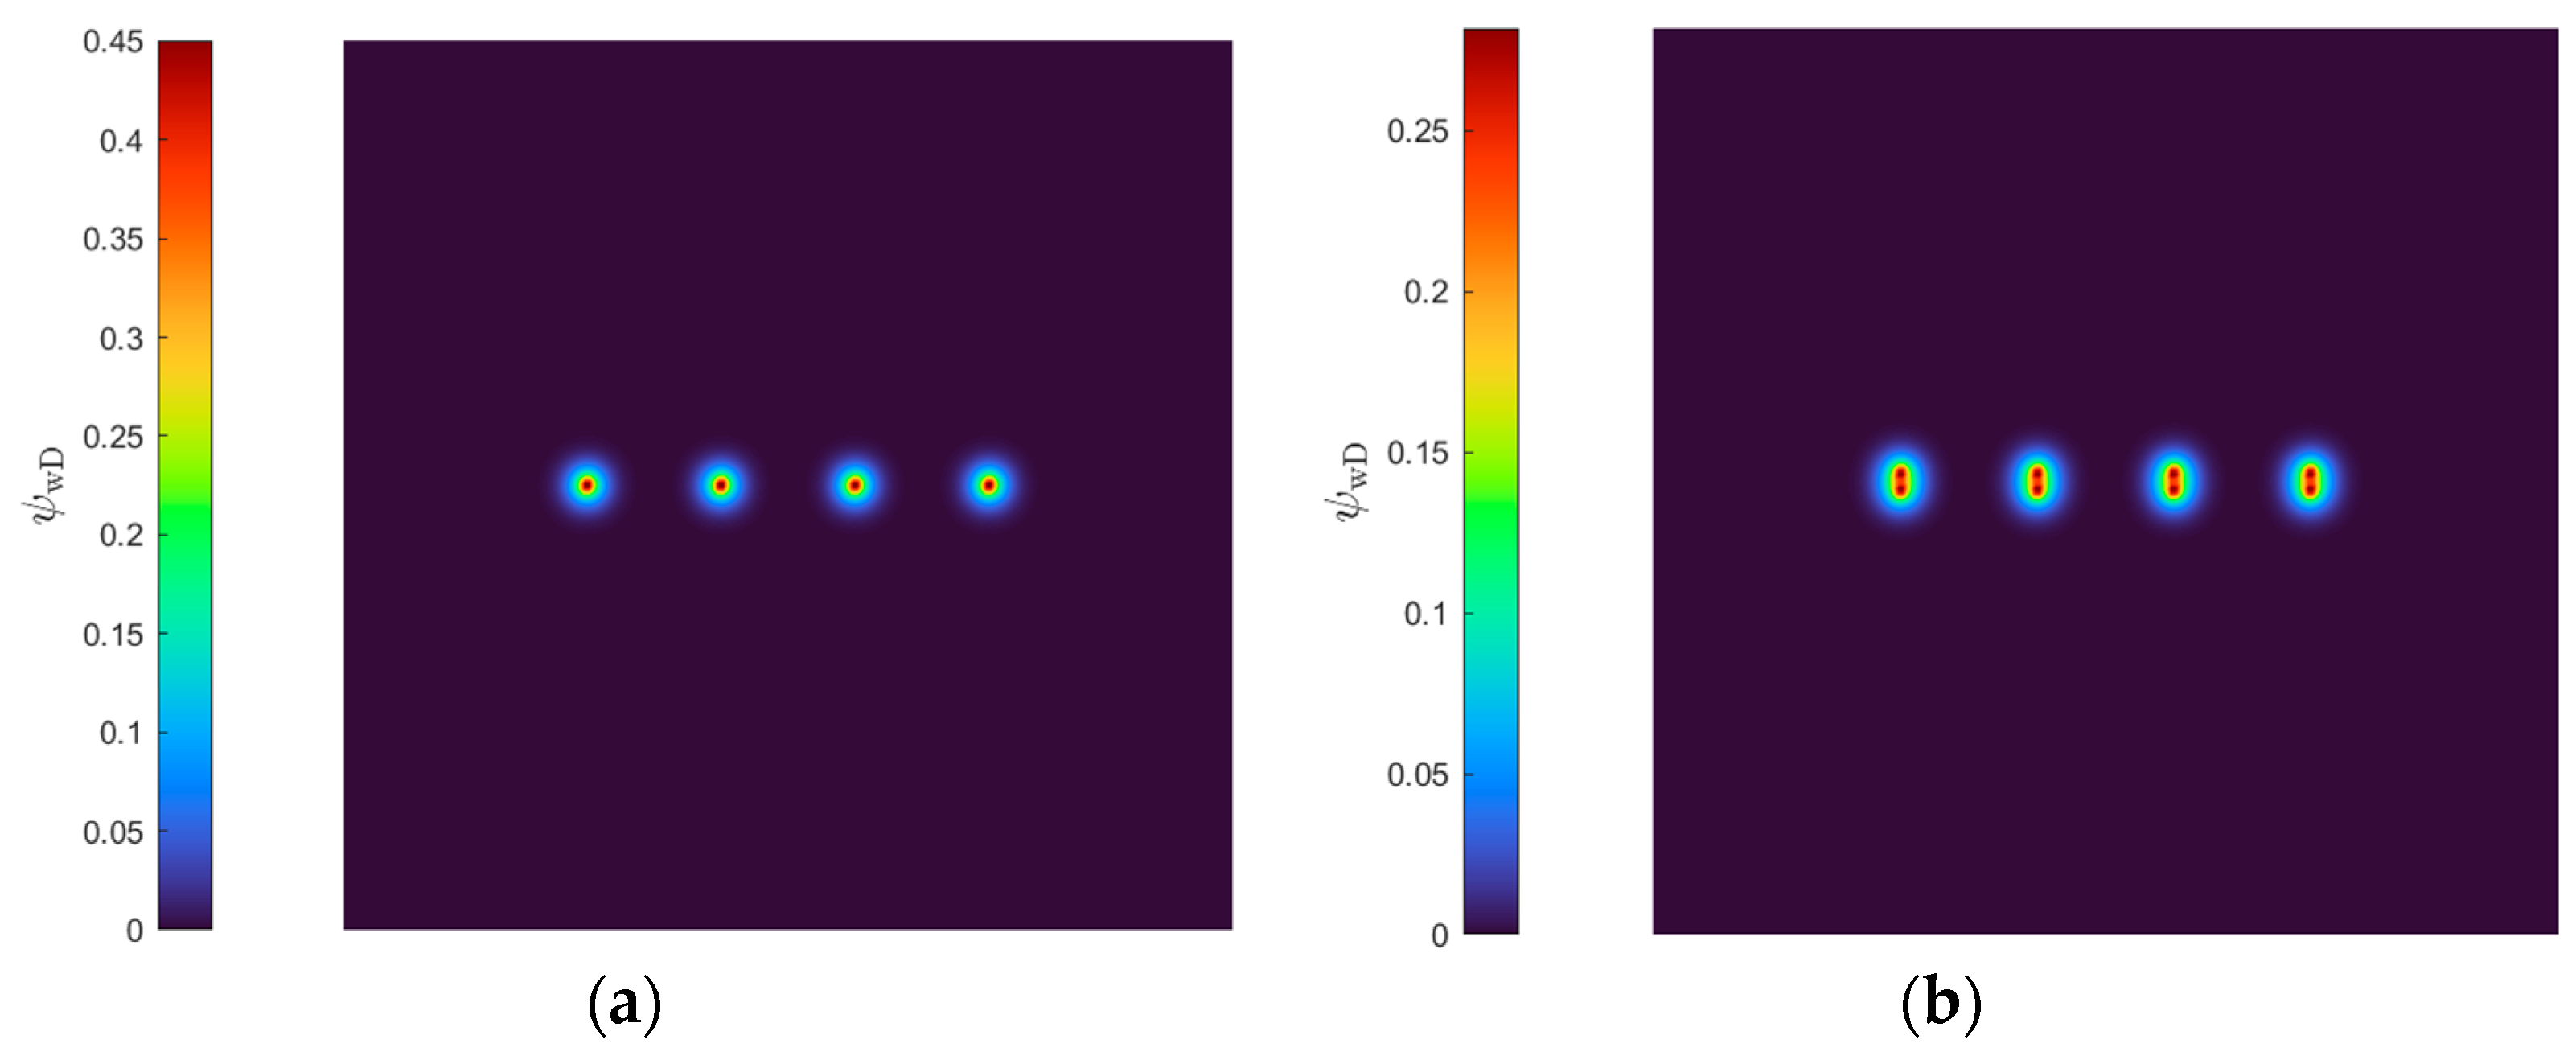
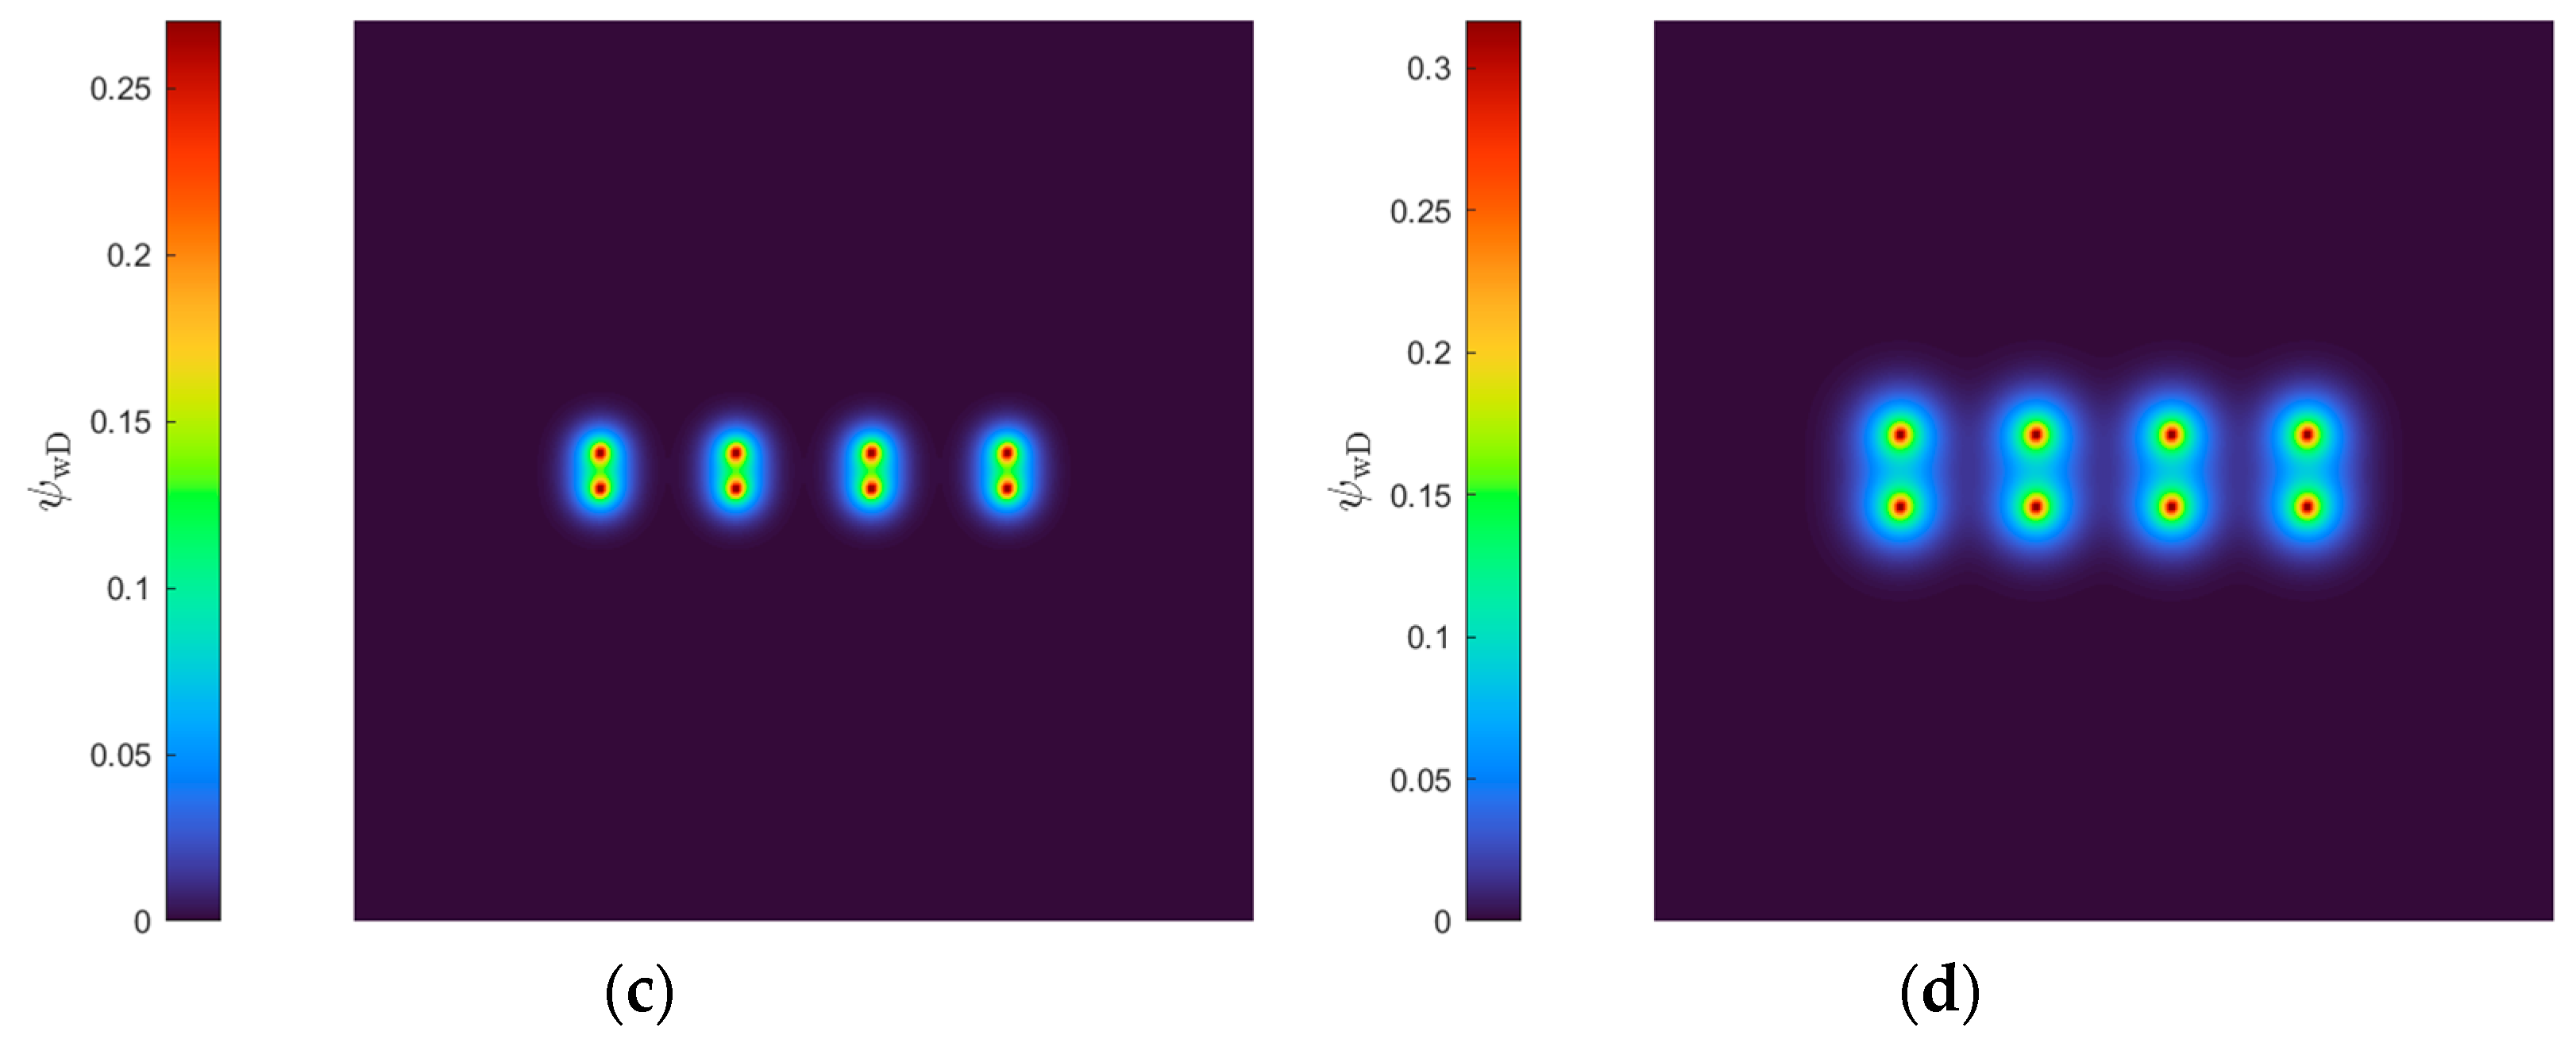
The pressure contours in Figure 14 provide a spatial visualization of this phenomenon. At smaller inter-well spacings, the pressure drawdown in the region between the wells is more pronounced, indicating a stronger interference effect. For the case with yoff = 2LfD, the pressure interference is already significant at an early time (tD = 6), whereas for larger spacings (yoff > 2LfD or LwD > 4LfD), the wells maintain independent drainage patterns for a longer duration before the interference becomes dominant.
4.2.2. Asymmetric Well Configurations (Staggered Layout)
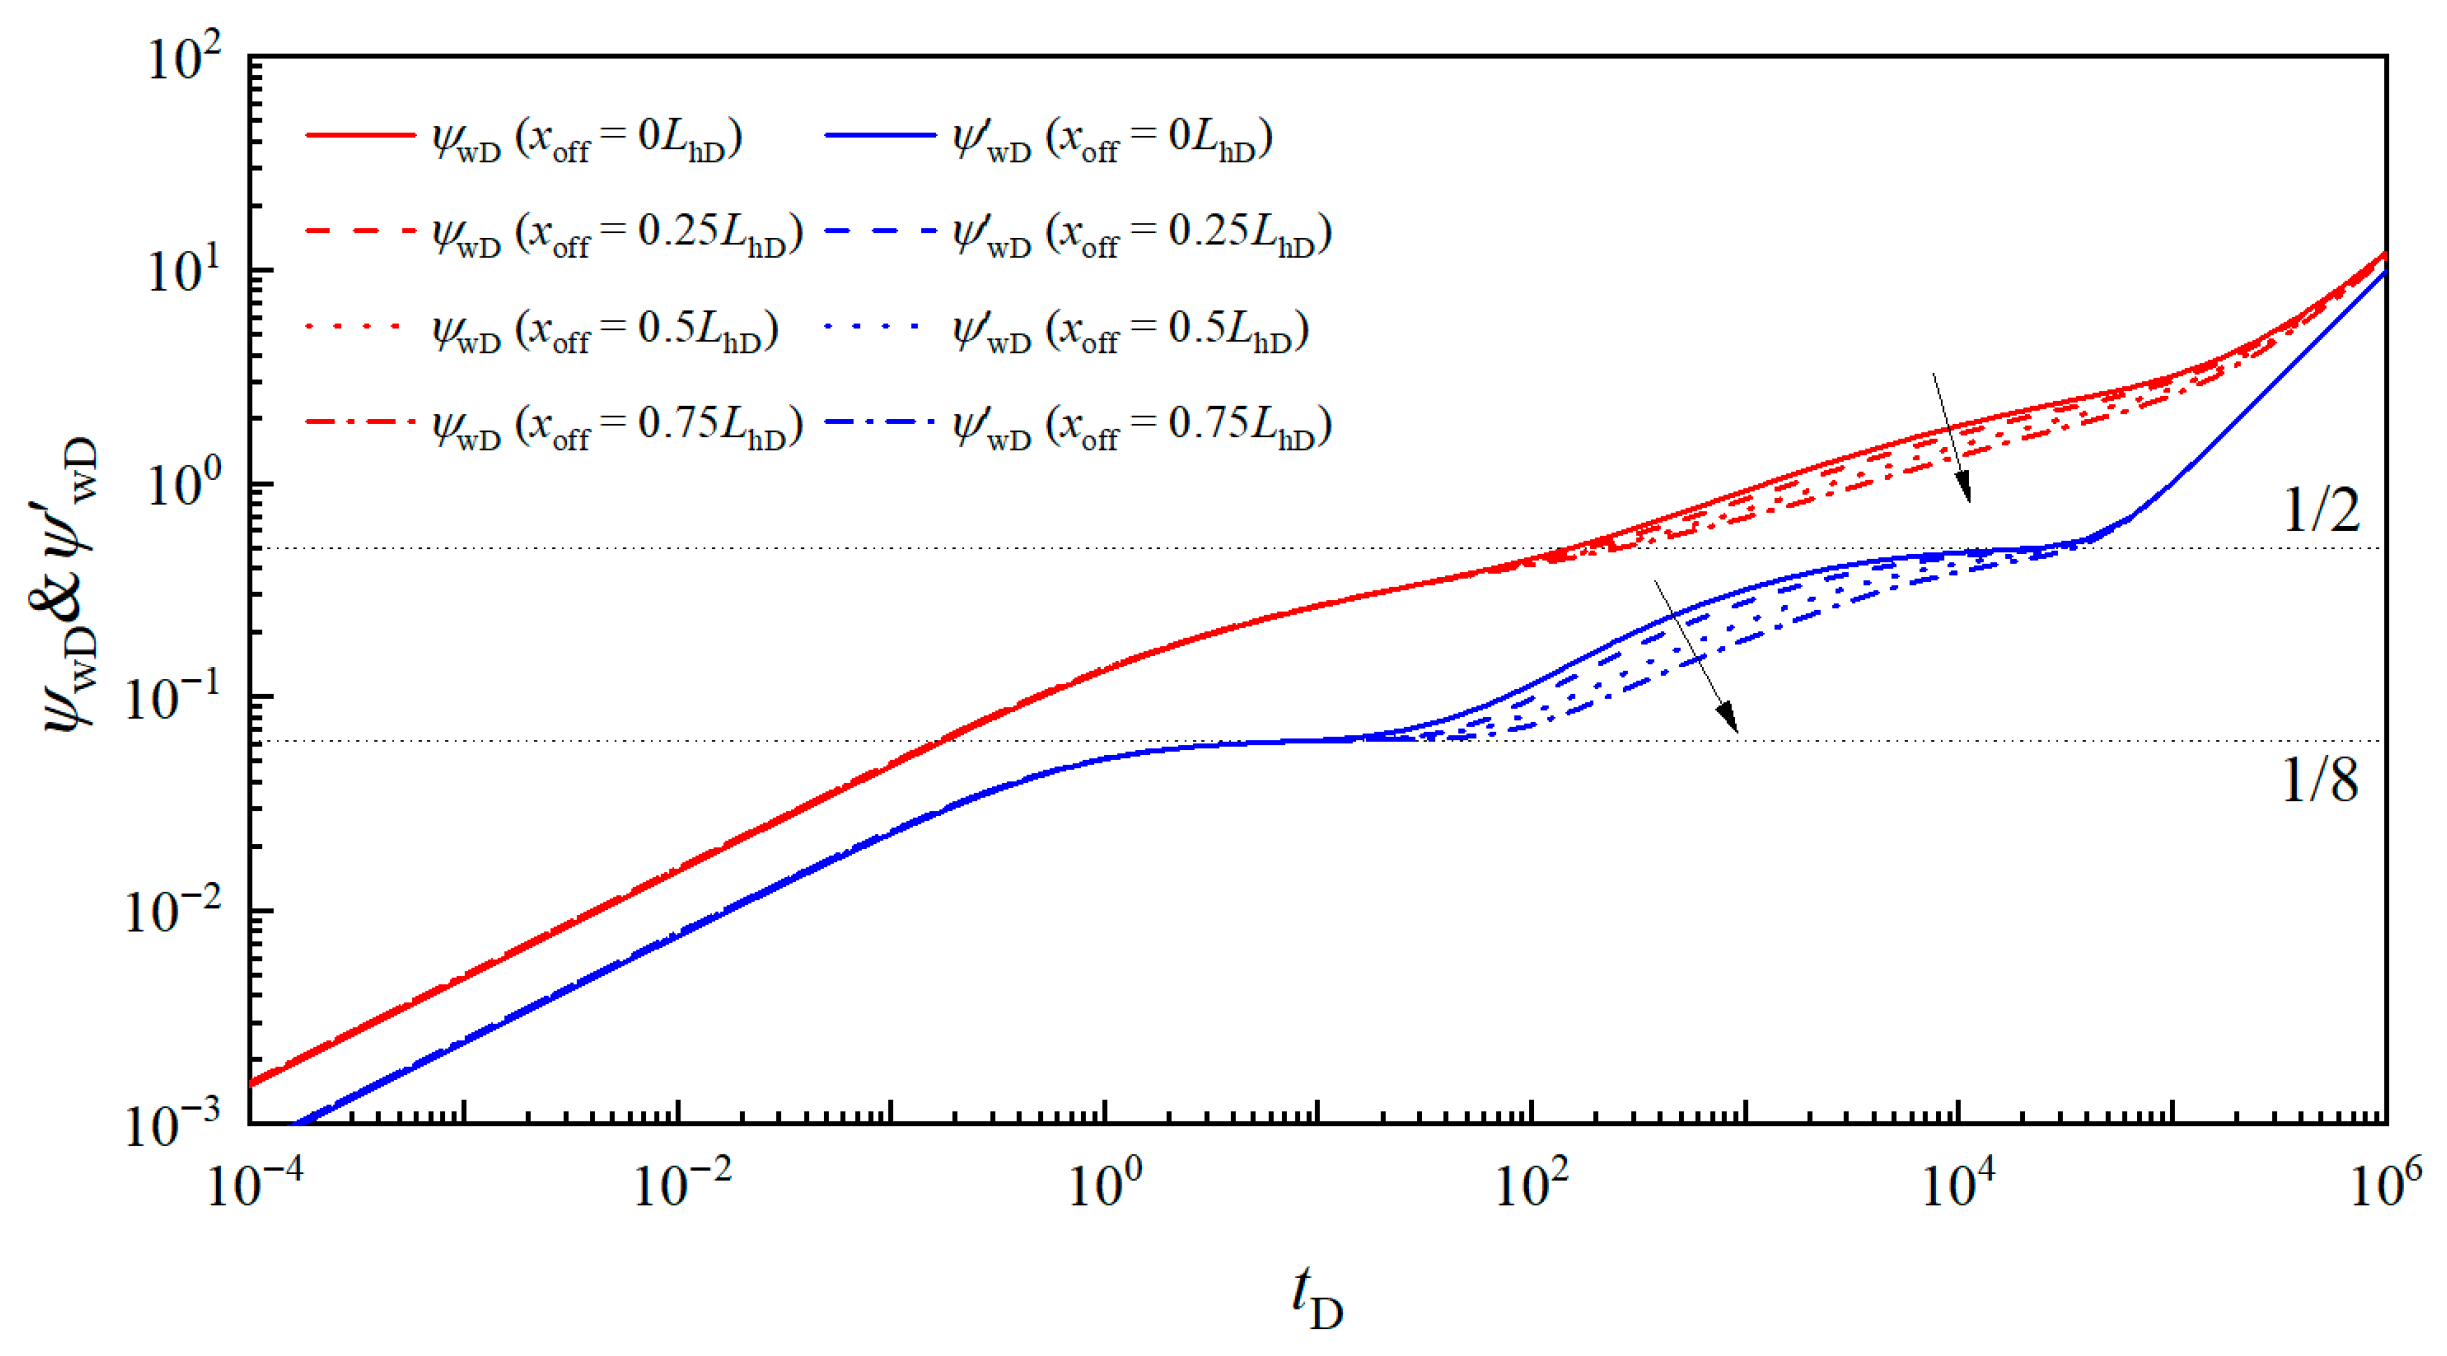
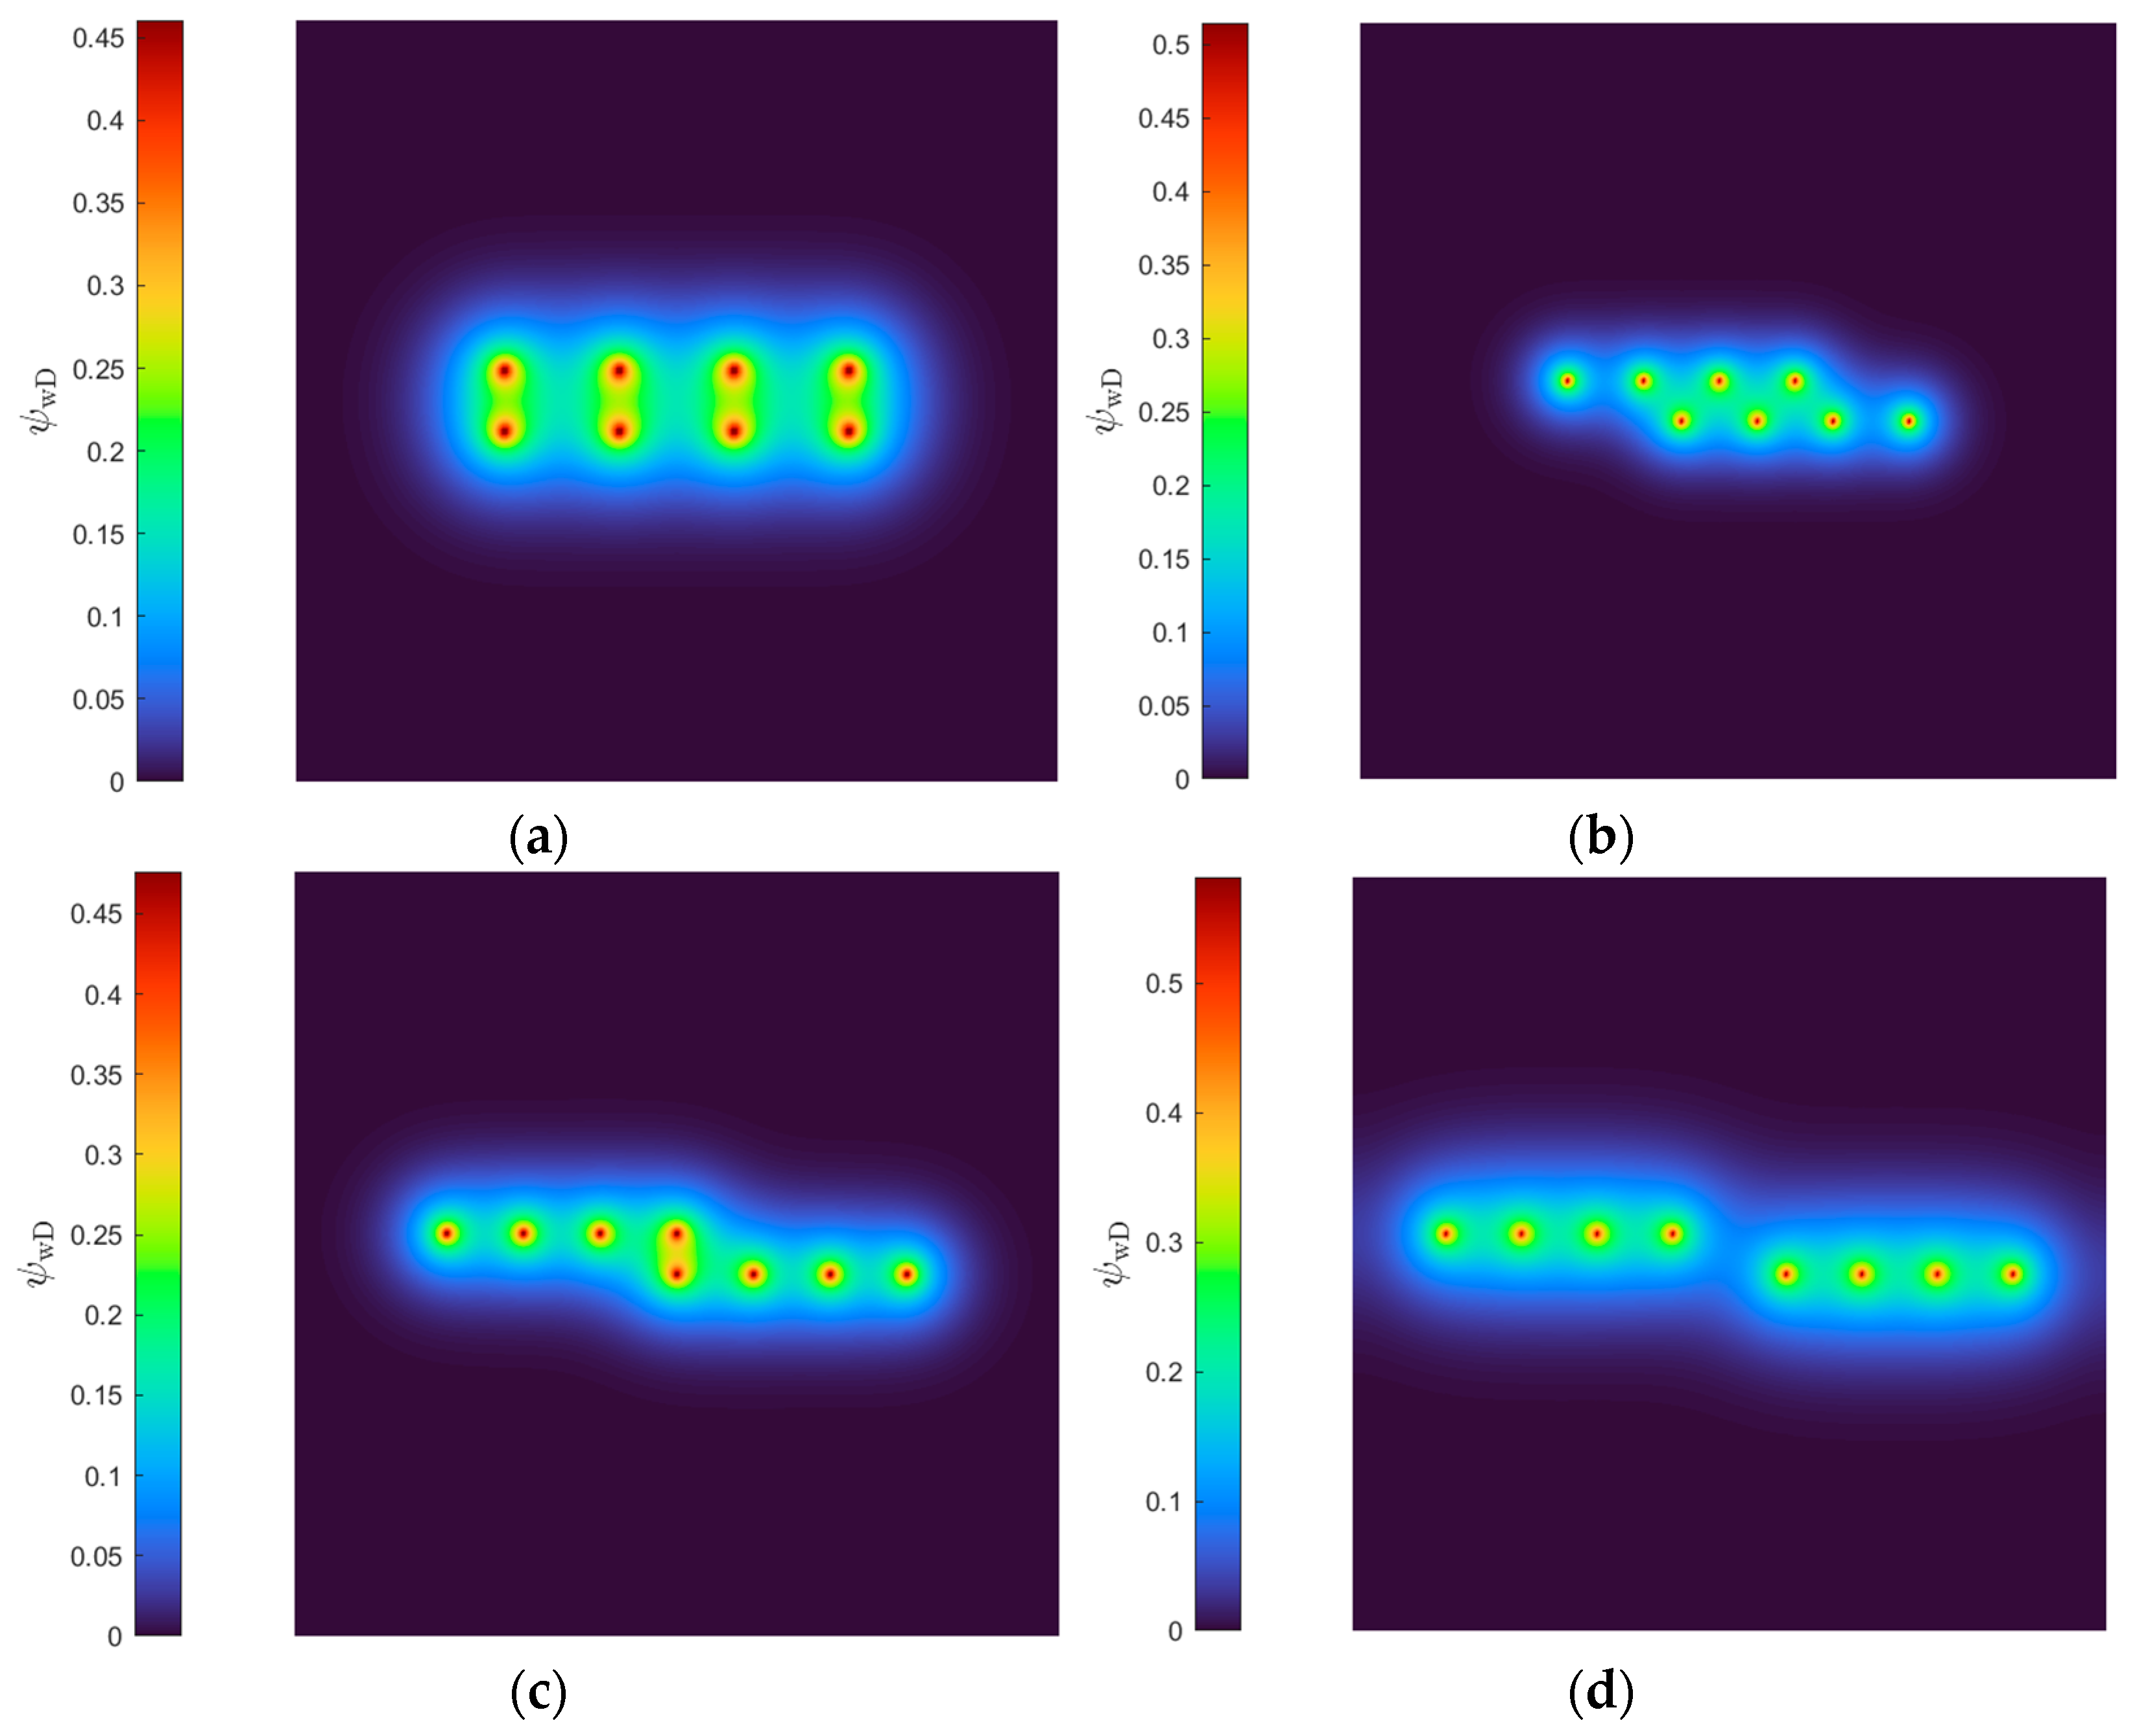
The asymmetric configuration refers to a layout where two wells are maintained at a constant yoff from the central y-axis, but their wellbore centers are shifted in opposite directions (positive and negative) along the y-axis relative to the reference centerline (x = xeD/2). This creates a staggered arrangement. The influence of this longitudinal asymmetry on inter-well interference was investigated for xoff of 0LhD, 0.25LhD, 0.5LhD, and 0.75LhD, where LhD denotes the dimensionless horizontal well length.
The type curves in Figure 15 demonstrate that as the longitudinal center-to-center distance increases (i.e., a higher degree of asymmetry), the duration of the fracture radial flow stage is significantly prolonged. Concurrently, the onset of the compound linear flow stage is delayed, and the duration of the subsequent compound radial flow stage is shortened.
This behavior is further elucidated by the pressure contours in Figure 16. It is evident that a larger longitudinal offset delays the emergence of inter-well interference because the pressure waves must travel over a greater distance before interacting. Furthermore, in the overlapping regions where the wellbore sections align, the pressure drawdown is more intense due to concentrated drainage. As the wells become more staggered, the drainage area becomes more distributed, which effectively mitigates the early-time interference intensity between the two wells.
4.2.3. Effect of Flow Rate Allocation
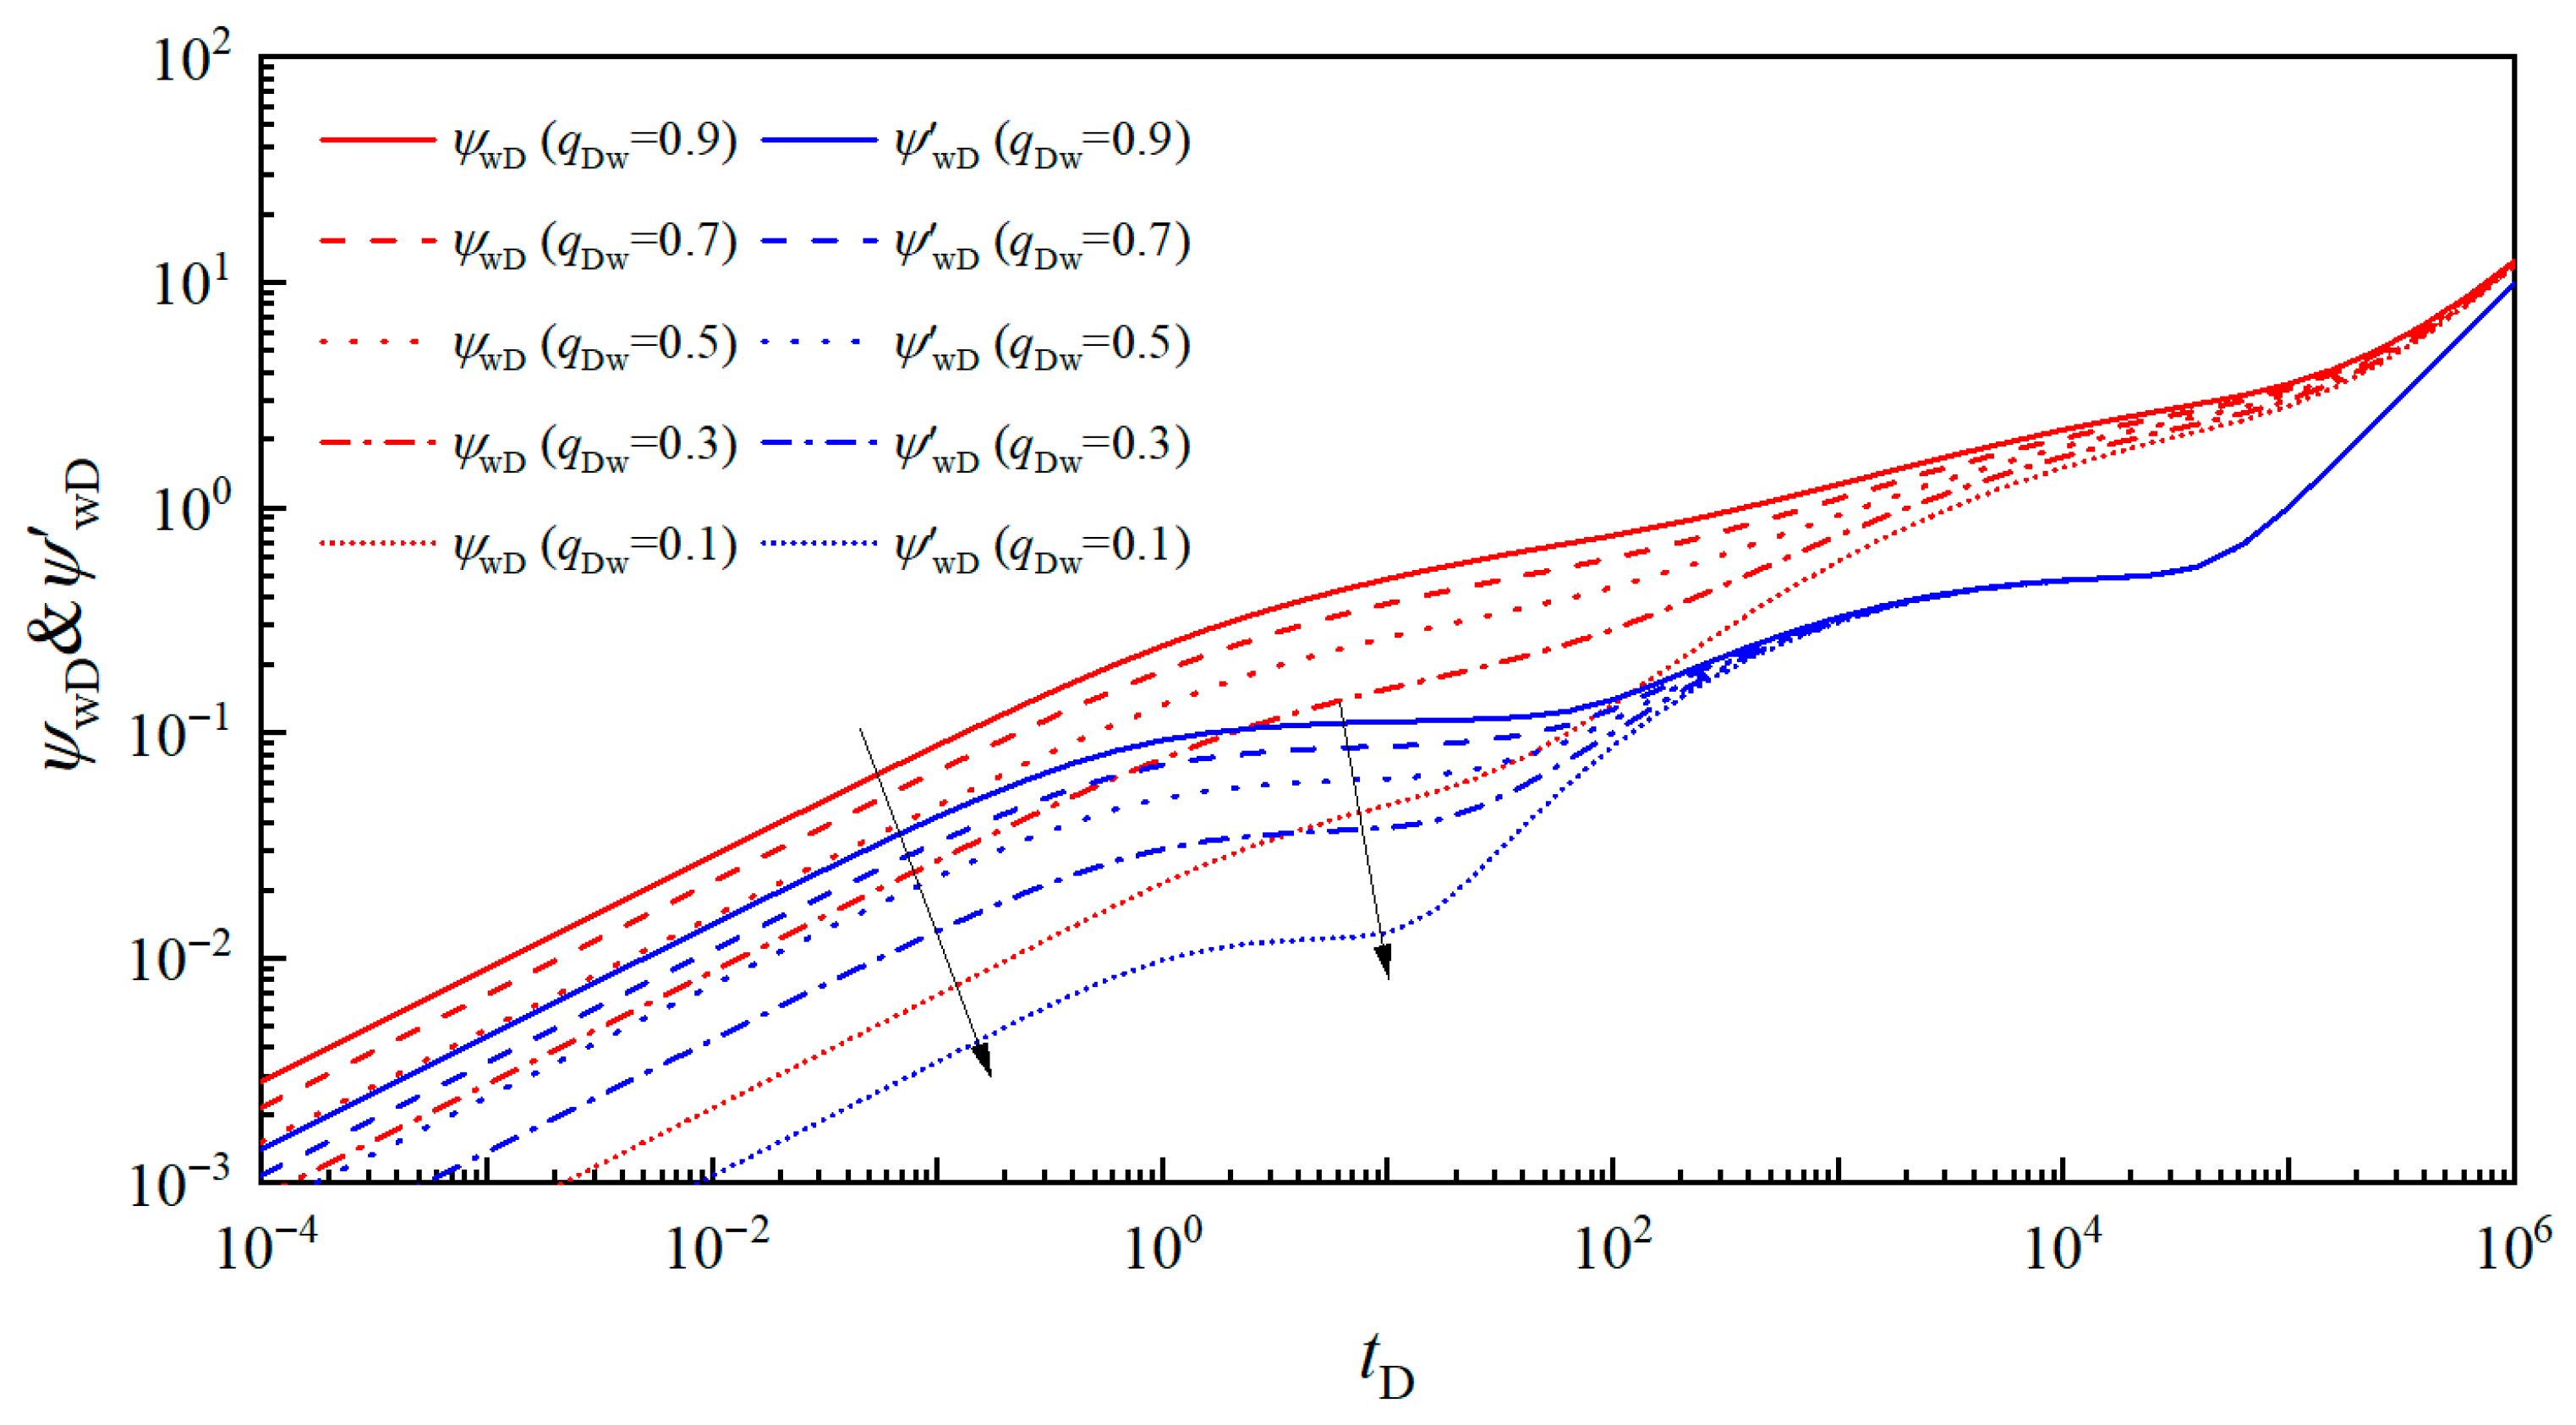
To analyze the interference between wells with different production rates, two wells were placed symmetrically relative to the horizontal centerline, with both wellbore centers located at x = xeD/2. Three production rate ratios (qDw1:qDw2) were investigated: 0.5:0.5 (symmetric), 0.3:0.7, and 0.1:0.9. Note that for the 0.5:0.5 ratio, the type curves for both wells are identical, and the pressure distribution is the same as that shown in the previously discussed base case.
For cases where the production rates are unevenly allocated, the type curves in Figure 17 reveal that the well with a higher flow rate exhibits higher magnitudes of dimensionless pseudo-pressure and its derivative during the fracture linear and radial flow stages, resulting in a clear upward shift in the curves. Furthermore, the duration of the fracture radial flow stage is notably extended for the high-rate well. In contrast, for the well with the lower production rate, the pressure declines at a significantly accelerated pace once it is affected by the interference from its high-rate neighbor.
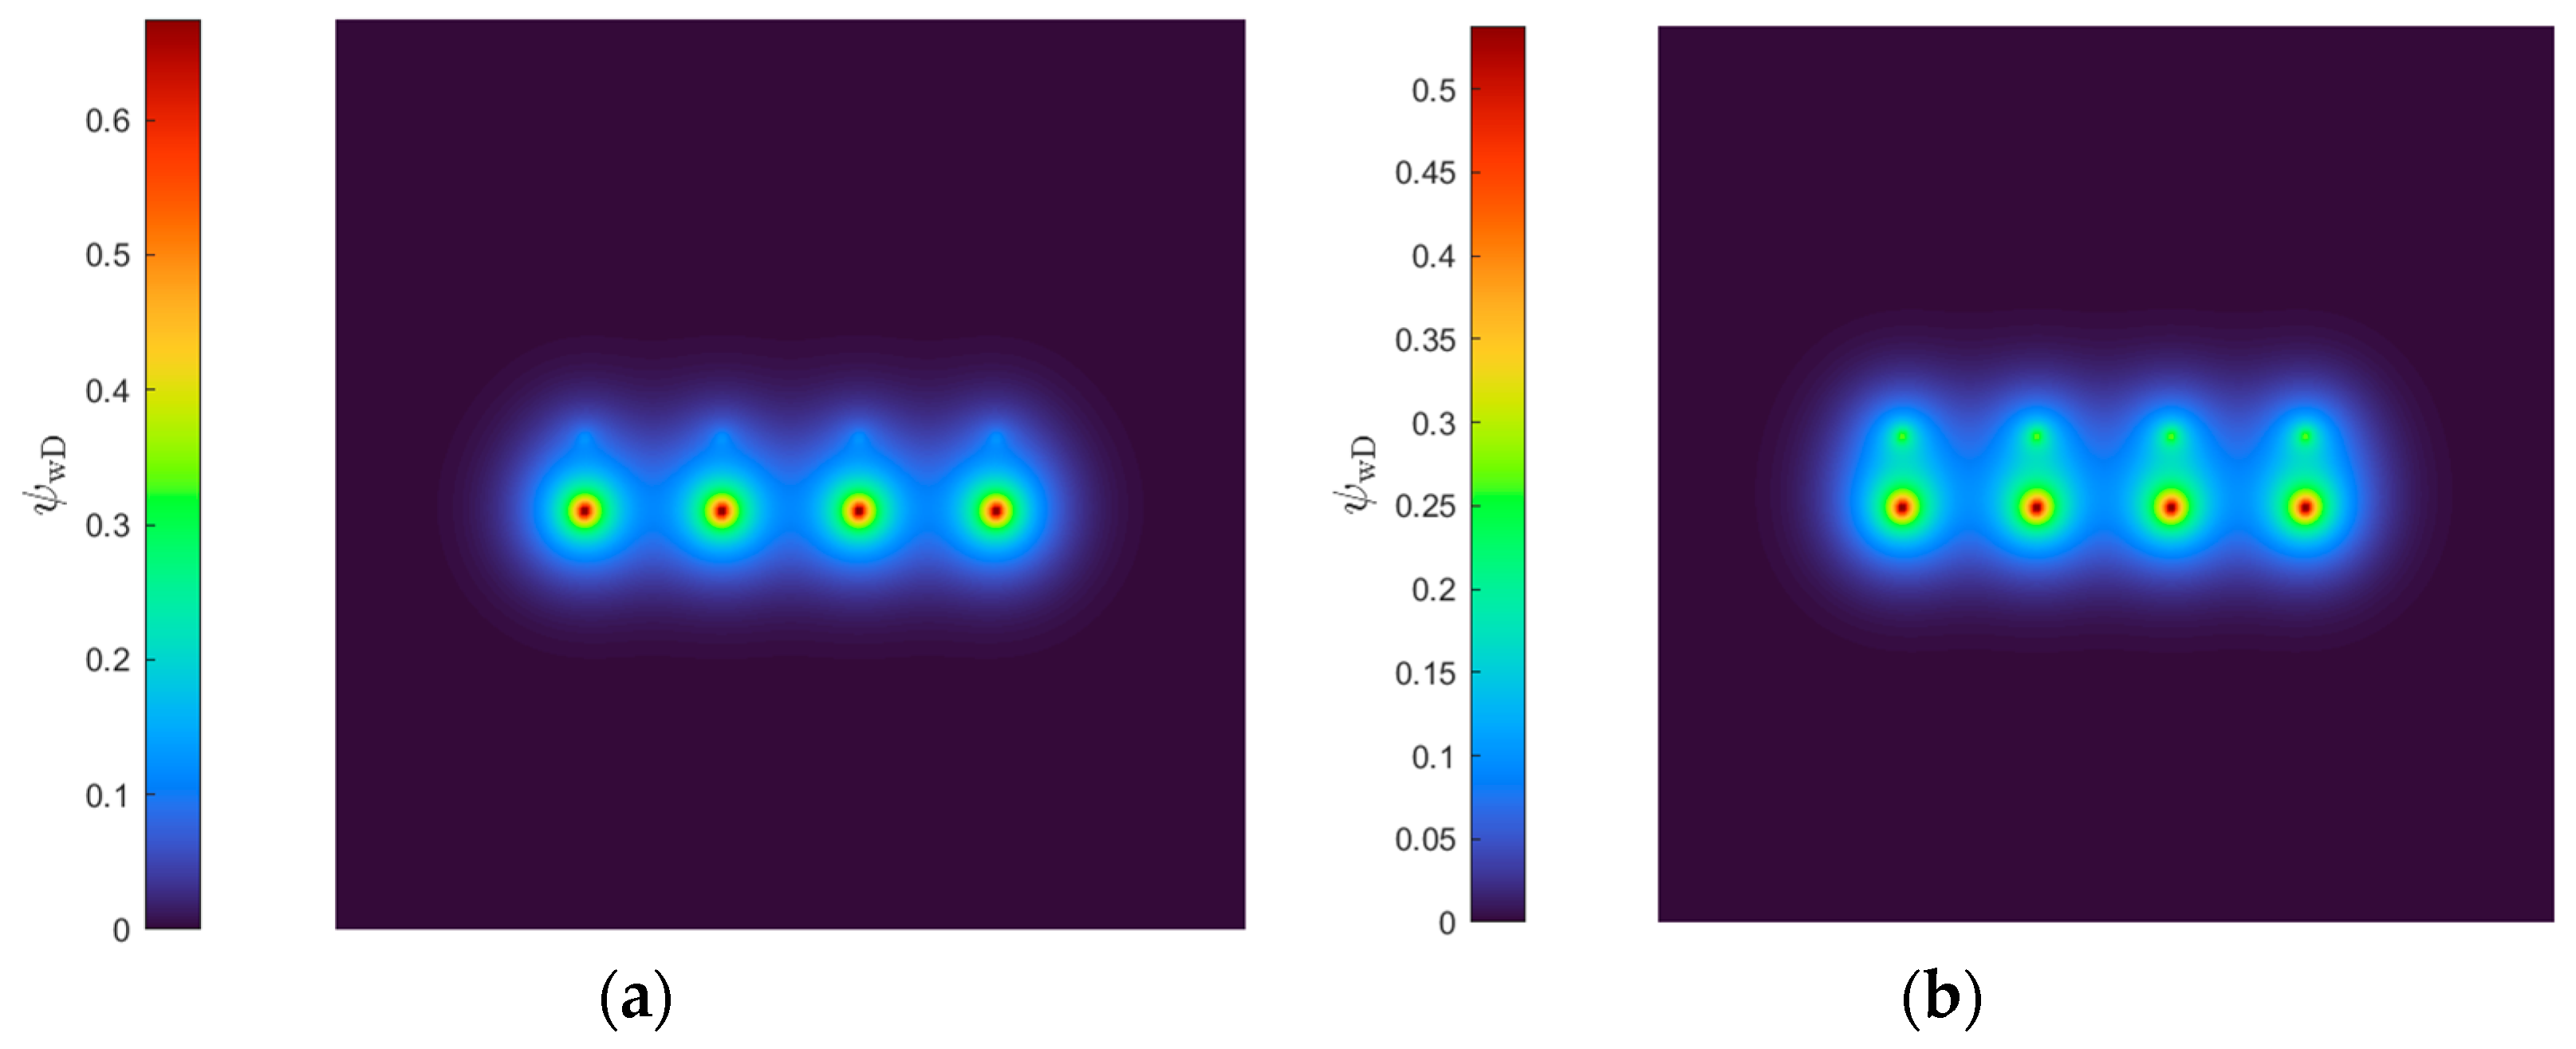
The pressure contours in Figure 18 further elucidates this behavior. At the same time, the well with the larger production rate creates a much more extensive and deeper pressure sink. As the production rate ratio deviates further from the symmetric 0.5:0.5 allocation, the degree of asymmetry in the reservoir pressure depletion becomes more pronounced. This indicates that the high-rate well acts as a dominant sink, significantly influencing the drainage area and pressure behavior of the adjacent lower-rate well through strong inter-well interference.
4.2.4. Effect of the Number of Wells
To investigate the impact of well count on interference behavior, configurations with 1, 2, 3, and 4 wells were analyzed. In all scenarios, the total reservoir production rate is normalized to unity. All wells are assumed to have their wellbore centers aligned at the reference line x = xeD/2, while their vertical positions are distributed relative to the horizontal centerline (y = yeD/2).
For the three-well system, the production rate is equally allocated among the wells (qDw1:qDw2:qDw3 = 1/3:1/3:1/3). Geometrically, the central well is positioned exactly at y = yeD/2, while the two peripheral wells are located symmetrically at a distance of 8LfD from the central well (i.e., at y = yeD/2 ± 8LfD).
For the four-well system, the production rate is distributed as qDw1:qDw2:qDw3:qDw4 = 0.25:0.25:0.25:0.25. The four wells are arranged symmetrically relative to the horizontal centerline (y = yeD/2) with specific yoff of −16LfD, −8LfD, 8LfD, and 16LfD, respectively.
The results for the single-well and two-well cases are omitted here as they have been discussed in previous sections and exhibit identical behavior for each well due to geometric symmetry.
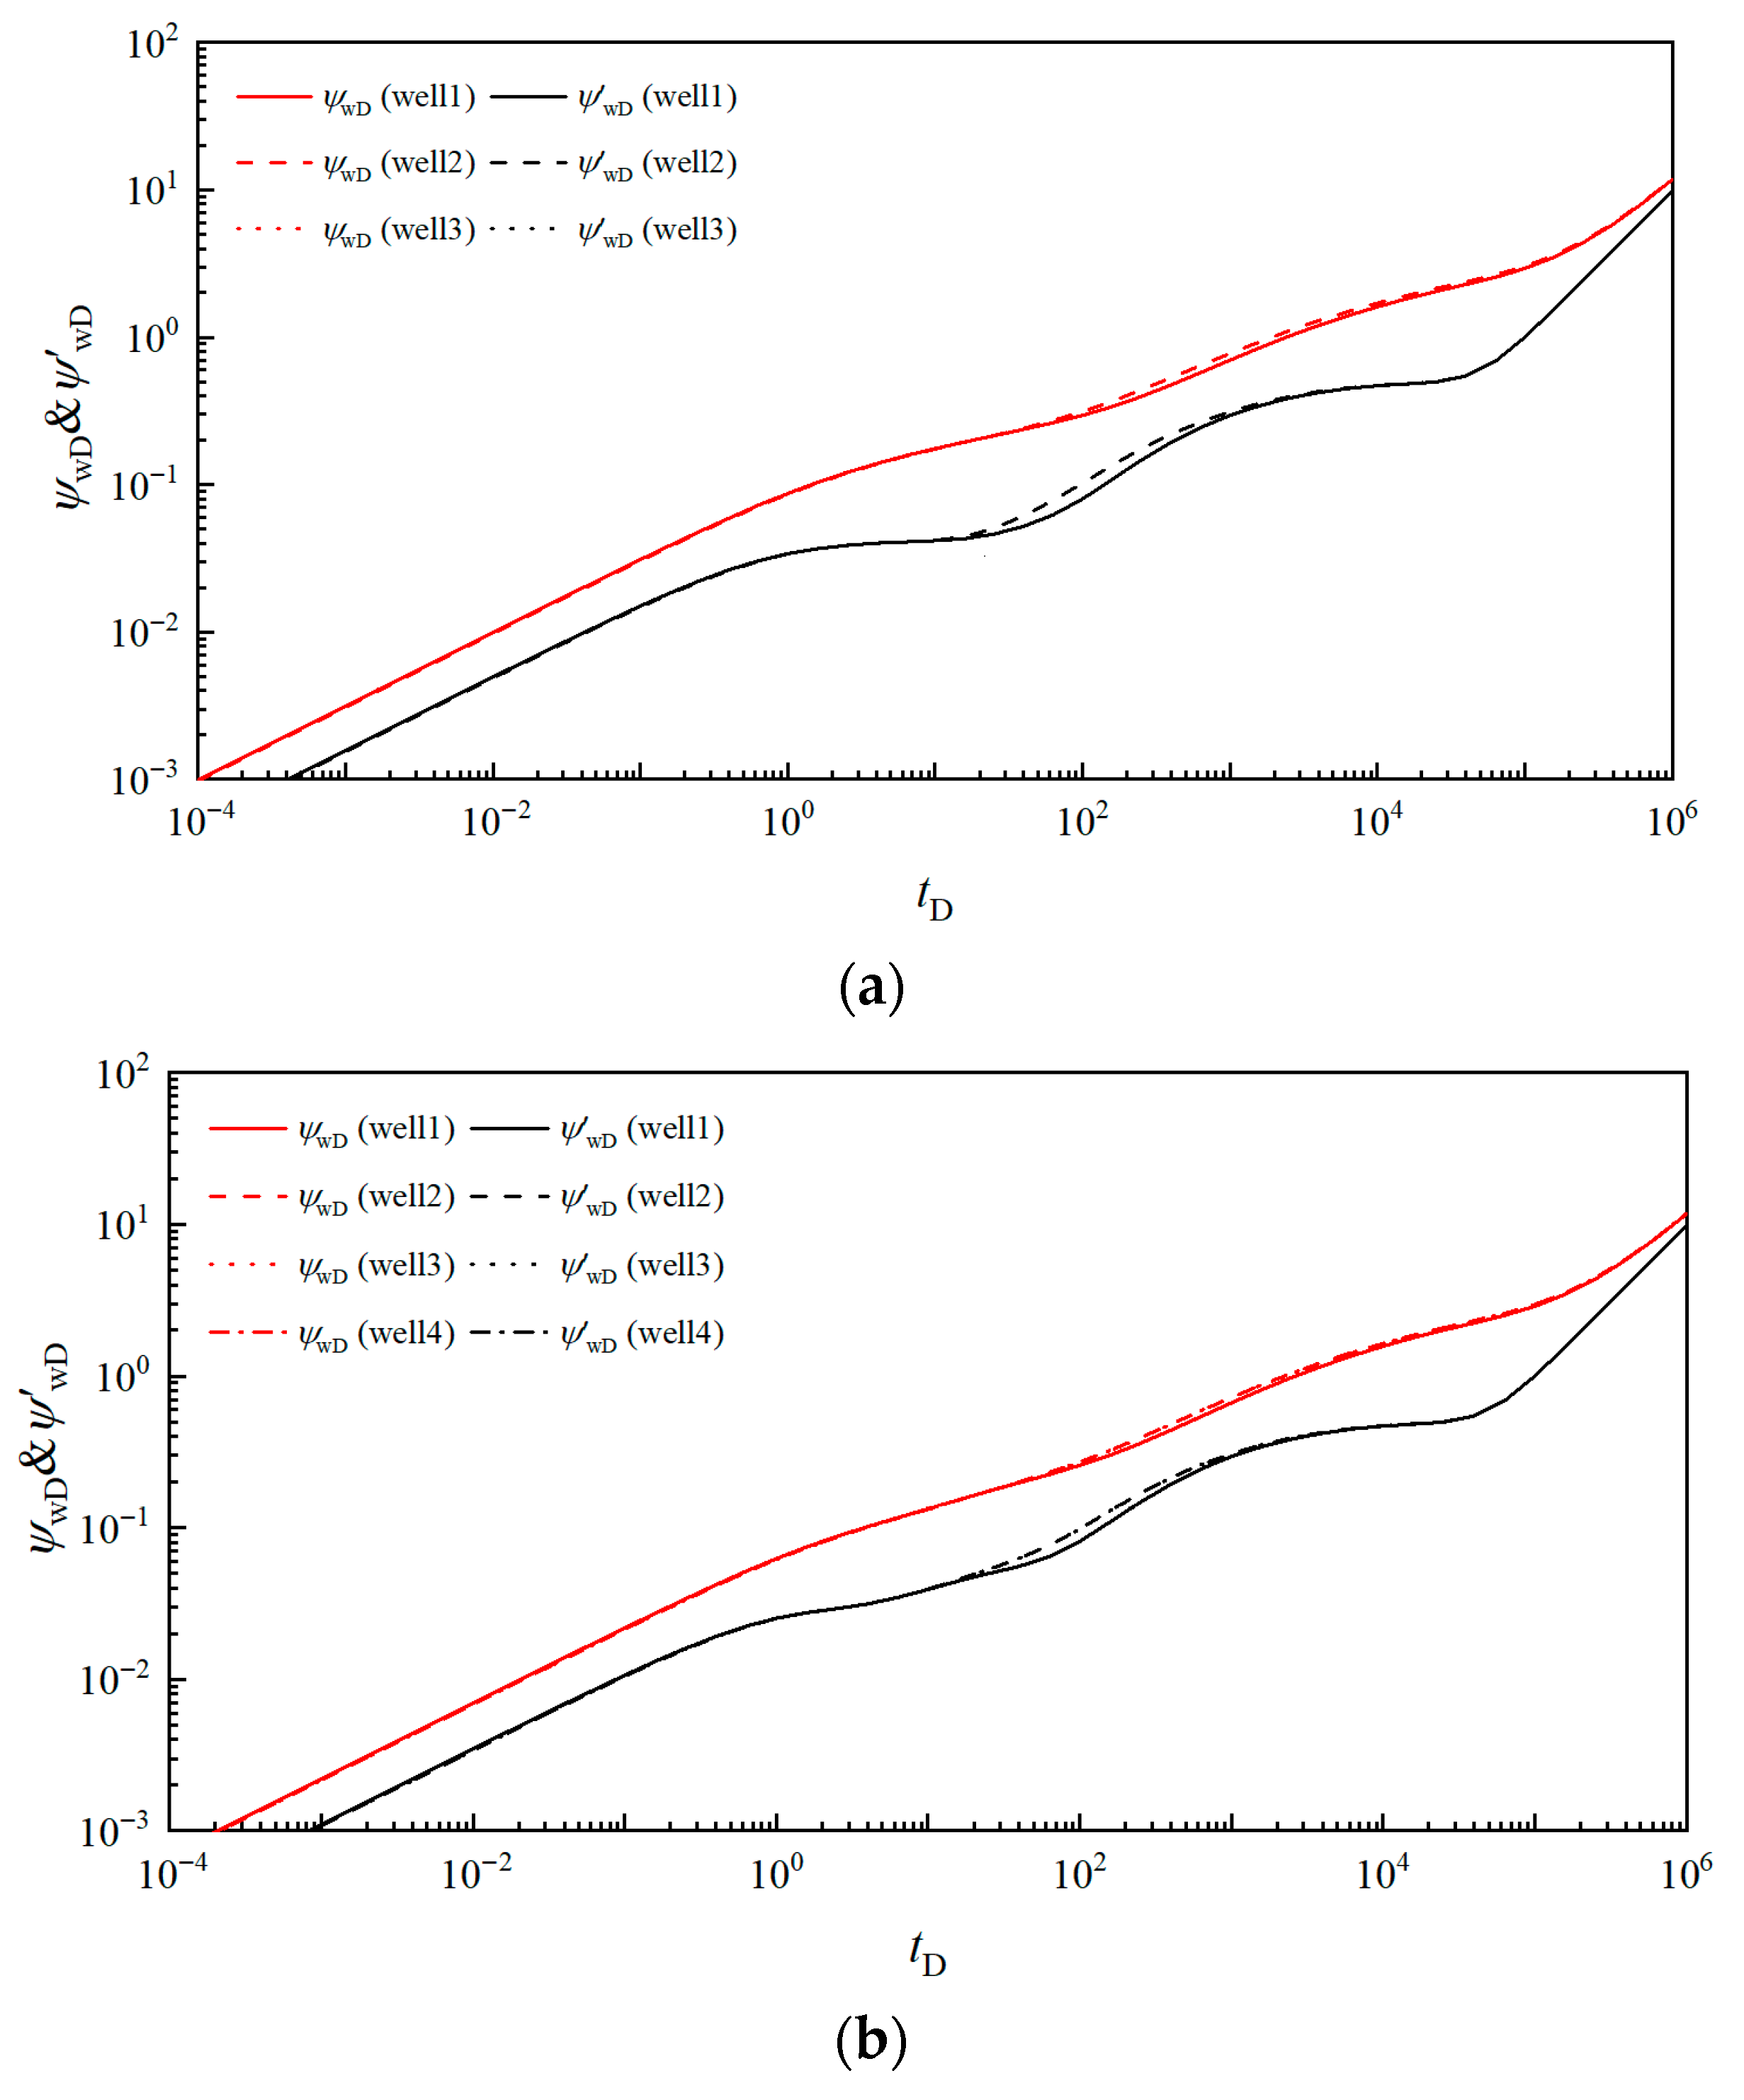
The type curves for the three-well configuration (Figure 19a) clearly demonstrate the disparity in pressure behavior between the central and peripheral wells. The central well exhibits a significantly more rapid pressure decline, with its pseudo-pressure and derivative curves shifting upward—particularly during the compound linear flow stage—compared to the two outer wells. The central well is subjected to intense pressure interference and competition for drainage from neighbors on both sides. Due to geometric symmetry, the two peripheral wells exhibit identical pressure responses.
A similar trend is observed in the four-well system (Figure 19b). The two inner wells show identical pressure responses but experience a more rapid pressure drawdown compared to the two outer wells during the compound linear flow stage. The pressure contours in Figure 20 further confirm that the interior region of the well cluster undergoes more intense depletion, as the inner wells are “hemmed in” by adjacent producing wells, effectively restricting their drainage volumes.
These findings suggest that in multi-well pad developments, inner wells are more vulnerable to severe energy competition, leading to faster local pressure depletion. This spatial imbalance in reservoir drainage must be accounted for when optimizing well spacing to maximize overall recovery.
4.3. Optimization Strategies for Well Interference Management and Infill Drilling
Based on the comprehensive analysis of inter-well interference under various well patterns and production schemes, the following optimization strategies are proposed for the layout of fractured horizontal wells and the deployment of subsequent infill wells:
Optimization of Inter-well Spacing: It is recommended that the spacing between adjacent horizontal wells be maintained at more than four times the fracture half-length (LwD > 4LfD). This configuration is crucial to mitigating premature inter-well interference during the early fracture linear flow stage and reducing the risk of potential fracture hits (frac-hits) during the stimulation process.
Staggered Fracture Configuration (the relative positions in the x-direction of the fractures between the wells are not the same.): In the design of fracture stages, an asymmetric or staggered arrangement of fractures between adjacent wells should be prioritized. Such a layout facilitates a more uniform pressure drawdown in the inter-well regions, thereby maximizing the utilization of the reservoir volume and enhancing productivity during the fracture radial flow stage.
Strategic Infill Well Deployment: For reservoir areas where existing wells exhibit suboptimal performance, infill drilling should be targeted on the side opposite to high-productivity wells to avoid intense energy competition. When deploying “child wells,” operators should avoid the heavily depleted central zones of existing well pads. Instead, infill wells should be positioned on the periphery of the original well pattern, integrating the spacing and staggering principles mentioned in Recommendations 1 and 2 to ensure efficient reservoir drainage.
4.4. Limitations of the Model and Future Work
Heterogeneous Matrix Distribution: The current analytical model assumes a homogeneous matrix and cannot account for a heterogeneous matrix distribution, which may oversimplify flow behaviors in highly complex geologic formations.
Simplification of the SRV: The effects of the Stimulated Reservoir Volume (SRV) are uniformly simplified and lumped into the effective fracture properties, rather than being modeled as a distinct, heterogeneous region.
While this study provides some insights into multi-well interference using a 2D semi-analytical framework, several complexities remain for future investigation:
Transition to 3D Modeling: The current model assumes that hydraulic fractures fully penetrate the formation height. However, in thick shale reservoirs, fractures are often partially penetrating. Future work will extend the current 2D solution to a 3D domain. In the mathematical derivation, this requires modifying the integration of the point source solution in the z-direction from the current full-height interval [0, zeD] to a specific fracture height interval [h1,h2], where 0 ≤ h1 < h2 ≤ zeD.
Reservoir Anisotropy: The 2D simplification inherently limits the ability to account for vertical flow components. Subsequent research will incorporate reservoir anisotropy by considering the disparity between vertical permeability and lateral permeability, which is critical for accurately modeling parent–child well interference in shale systems.
5. Conclusions
In this study, a semi-analytical mathematical model for multi-well interference in shale gas reservoirs was established and validated. Through type curve analysis and sensitivity studies, the following major conclusions are drawn:
(1)
The developed model, which integrates source functions and matrix coupling, effectively captures the complex interactions between multiple fractured horizontal wells. The high degree of consistency with numerical simulation results confirms its accuracy in describing the transient flow behavior in bounded shale reservoirs.
(2)
The unstable pressure behavior of multi-well MFHWs consists of five stages. The transition from fracture-dominated flow to system-wide compound flow is a key indicator of the onset and intensity of inter-well interference, which can be visualized through pressure contour evolution.
(3)
Both lateral and longitudinal well offsets play a crucial role in interference management. A smaller inter-well spacing accelerates interference, whereas increasing the longitudinal staggering distance between wells delays the interference onset and balances the drainage area, enhancing the utilization of the reservoir during the fracture radial flow stage.
(4)
Production rate allocation significantly affects pressure depletion patterns; wells with higher rates act as dominant sinks that accelerate the pressure decline in neighboring wells. Additionally, in well clusters, inner wells experience more intense interference and faster energy depletion compared to outer wells due to concentrated drainage.
(5)
For shale gas pad development, it is recommended to maintain an inter-well spacing of at least four times the fracture half-length. Strategic deployment of infill wells should avoid heavily depleted central zones and favor the periphery of existing patterns using staggered fracture layouts to maximize overall reservoir recovery.
Author Contributions
Y.S.: Investigation, Methodology. H.W.: Conceptualization, Methodology, Software, Writing—original draft, Validation, Visualization, Formal analysis. M.W.: Conceptualization, Methodology, Validation, Writing—original draft. H.Y.: Formal analysis, Software. Q.L.: Conceptualization. All authors have read and agreed to the published version of the manuscript.
Funding
This research was funded by the Oil & Gas Major Project (Grant No. 2025ZD1404103); by the CNPC’s Basic and Foresight-Oriented Science and Technology Program, project “Mechanisms of Shale Oil and Gas Development and Volumetric Development Technology” (Grant No. 2023ZZ08); and by PetroChina Company Limited, project “Key Technology Research and Demonstration of the ‘Ballast Stone Project’ for Mature Gas Fields” (Grant No. 2023YQX10301).
Data Availability Statement
The data that support the findings of this study are available from the corresponding author upon reasonable request.
Acknowledgments
The authors gratefully acknowledge the support of the National Energy Shale Gas R&D Center for this work.
Conflicts of Interest
The authors declare that this study received funding from the Oil & Gas Major Project, the CNPC’s Basic and Foresight-Oriented Science and Technology Program, and PetroChina Company Limited. The funders were not involved in the study design; in the collection, analyses, or interpretation of data; in the writing of the manuscript; or in the decision to publish the results.
Appendix A
Table A1.
Nomenclature.
Table A1.
Nomenclature.
Symbol
Description
Unit
Hf
Fracture height
m
Lf
Fracture half-length
m
Wf
Fracture width
m
xe
Reservoir boundary length
m
ye
Reservoir boundary width
m
ze
Reservoir boundary height
m
Lh
Well length
n
Ls
Intra-well fracture spacing
n
Lw
Inter-well spacing
m
μg
Gas viscosity
mPa∙s
z
Gas deviation factor
/
p0
Reference pressure
Pa
Pseudo-pressure
Pa/s
t
Time
s
Fracture permeability
m2
Fracture porosity
/
Fracture compressibility of gas
Pa−1
Matrix porosity
/
Matrix compressibility of gas
Pa−1
Reference length
m
Standard temperature
K
Standard pressure
Pa
Standard production rate
m3/s
Reservoir temperature
K
Reservoir initial pseudo-pressure
Pa/s
r
Distance from point source to observation position
m
q
Point source production rate
m3/s
x
x-coordinate
m
y
y-coordinate
m
z
z-coordinate
m
km
Matrix permeability
m2
R
Radius of spherical matrix rock block
m
bm
Slippage factor
/
pm
Pressure in the matrix system
Pa
Standard density
kg/m3
Langmuir constant
/
Langmuir pressure
Pa
Matrix density
kg/m3
s
Laplace variable
/
Instantaneous unit point source solution
/
Fracture pressure response position
/
Fracture face source position
/
Dimensionless combined pressure response function incorporating the plane source solution and the finite fracture conductivity effect
/
Dimensionless well bottom pseudo-pressure
/
Table A2.
Parameter definition.
Table A2.
Parameter definition.
Parameter Symbol
Parameter Name
Definition
Dimensionless time
Dimensionless pseudo-pressure
Dimensionless radius
Dimensionless x distance
Dimensionless y distance
Dimensionless z distance
Dimensionless reservoir length
Dimensionless reservoir width
Dimensionless reservoir height
Dimensionless xw distance
Dimensionless yw distance
Dimensionless zw distance
Dimensionless production rate
Dimensionless fracture height
Dimensionless fracture half-length
Dimensionless inter-well spacing
Dimensionless fracture conductivity
Transfer coefficient from matrix to fracture
Modified coefficient of permeability
Storage coefficient of gas
Free gas storage coefficient
Matrix total compressibility
Where L is the reference length, usually taken as Lf.
References
Wen, Z.; Wang, J.; Wang, Z.; He, Z.; Song, C.; Chen, R.; Liu, X.; Ji, T.; Li, Z. Analysis of the Current Status of Global Oil, Gas, and Associated Resources Exploration in 2023. Pet. Explor. Dev.2024, 51, 1465–1479. [Google Scholar] [CrossRef]
Qian, X.; Zhang, J. Exploration and Development Technology of Shale Oil and Gas in the World: Progress, Impact, and Implication. IOP Conf. Ser. Earth Environ. Sci.2020, 526, 012131. [Google Scholar] [CrossRef]
Sun, C.; Nie, H.; Dang, W.; Chen, Q.; Zhang, G.; Li, W.; Lu, Z. Shale Gas Exploration and Development in China: Current Status, Geological Challenges, and Future Directions. Energy Fuels2021, 35, 6359–6379. [Google Scholar] [CrossRef]
Melikoglu, M. Shale Gas: Analysis of Its Role in the Global Energy Market. Renew. Sustain. Energy Rev.2014, 37, 460–468. [Google Scholar] [CrossRef]
Lei, Q.; Xu, Y.; Cai, B.; Guan, B.; Wang, X.; Bi, G.; Li, H.; Li, S.; Ding, B.; Fu, H.; et al. Progress and Prospects of Horizontal Well Fracturing Technology for Shale Oil and Gas Reservoirs. Pet. Explor. Dev.2022, 49, 191–199. [Google Scholar] [CrossRef]
Zhang, L.; Wang, B.; Hu, M.; Shi, X.; Yang, L.; Zhou, F. Research Progress on Optimization Methods of Platform Well Fracturing in Unconventional Reservoirs. Processes2025, 13, 1887. [Google Scholar] [CrossRef]
Tuo, Y.-H.; Lin, T.-J.; Yu, H.; Lian, Z.-H.; Chen, F.-X. Prediction of Casing Failure Risk Locations under Multi-Stage Hydraulic Fracturing Inter-Well Interference in “Well Factory” Mode. Pet. Sci.2025, 22, 1611–1624. [Google Scholar] [CrossRef]
Huls, B.; Hurey, M.; Johnson, J. Gas Factory: Operational Efficiencies in the Marcellus Shale Lead to Exceptional Results. In Proceedings of the SPE Eastern Regional Meeting, Pittsburgh, PA, USA, 20–22 August 2013; OnePetro: London, UK, 2013. [Google Scholar]
He, Y.; He, Z.; Tang, Y.; Xu, Y.; Xu, J.; Li, J.; Sepehrnoori, K. Interwell Fracturing Interference Evaluation in Shale Gas Reservoirs. Geoenergy Sci. Eng.2023, 231, 212337. [Google Scholar] [CrossRef]
Zhang, J.; Chu, H.; Ju, H.; Zhu, W.; Wang, F.; Gao, Y.; Lee, W.J. A Transient Analysis Method for a Multi-Horizontal-Well Pad with Well Interference and Gas–Water Flow in Shale. Phys. Fluids2024, 36, 126627. [Google Scholar] [CrossRef]
Wei, C.; Liu, Y.; Deng, Y.; Cheng, S.; Hassanzadeh, H. Analytical Well-Test Model for Hydraulicly Fractured Wells with Multiwell Interference in Double Porosity Gas Reservoirs. J. Nat. Gas Sci. Eng.2022, 103, 104624. [Google Scholar] [CrossRef]
Chen, J.; Wei, Y.; Wang, J.; Yu, W.; Qi, Y.; Wu, J.; Luo, W. Inter-Well Interference and Well Spacing Optimization for Shale Gas Reservoirs. J. Nat. Gas Geosci.2021, 6, 301–312. [Google Scholar] [CrossRef]
Xu, J.; Xu, Y.; Wang, Y.; Tang, Y. Multi-Well Pressure Interference and Gas Channeling Control in W Shale Gas Reservoir Based on Numerical Simulation. Energies2023, 16, 261. [Google Scholar] [CrossRef]
Liu, L.; Tang, Y.; Zheng, A.; Zhang, Q.; Wang, Y.; Cai, J. New Approach of Evaluating Fracturing Interference Based on Wellhead Pressure Monitoring Data: A Case Study from the Well Group-a of Fuling Shale Gas Field. J. Pet. Explor. Prod. Technol.2024, 14, 139–148. [Google Scholar] [CrossRef]
Ozkan, E.; Makhatova, M. Pressure- and Rate-Transient Model for an Array of Interfering Fractured Horizontal Wells in Unconventional Reservoirs. SPE J.2024, 29, 4194–4217. [Google Scholar] [CrossRef]
Esquivel, R.; Blasingame, T.A. Optimizing the Development of the Haynesville Shale—Lessons Learned from Well-to-Well Hydraulic Fracture Interference. In Proceedings of the SPE/AAPG/SEG Unconventional Resources Technology Conference (URTeC), Austin, TX, USA, 24–26 July 2017; OnePetro: London, UK, 2017. [Google Scholar]
Ren, L.; Li, G.; Zhao, J.; Lin, R.; Wu, J. Infill Well Deployment Optimization Based on a Novel Multi-Well Productivity Model Considering Inter-Well Interference for Shale Gas Reservoir. Pet. Sci. Technol.2025, 43, 174–201. [Google Scholar] [CrossRef]
Wang, J.; Jia, A.; Wei, Y.; Jia, C.; Qi, Y.; Yuan, H.; Jin, Y. Optimization Workflow for Stimulation-Well Spacing Design in a Multiwell Pad. Pet. Explor. Dev.2019, 46, 1039–1050. [Google Scholar] [CrossRef]
Weijermars, R.; Khanal, A. Production Interference of Hydraulically Fractured Hydrocarbon Wells: New Tools for Optimization of Productivity and Economic Performance of Parent and Child Wells. In Proceedings of the SPE Europec featured at 81st EAGE Conference and Exhibition, London, UK, 3–6 June 2019; OnePetro: London, UK, 2019. [Google Scholar]
Schofield, J.; Rodriguez-Herrera, A.; Garcia-Teijeiro, X. Optimization of Well Pad & Completion Design for Hydraulic Fracture Stimulation in Unconventional Reservoirs. In Proceedings of the SPE EUROPEC 2015, Madrid, Spain, 1–4 June 2015; OnePetro: London, UK, 2015. [Google Scholar]
Bharali, S.G.; Sharma, A.; Sehra, S.S. Effect of Well down Spacing on EUR for Shale Oil Formations. In Proceedings of the SPE Western North American and Rocky Mountain Joint Meeting, Denver, CO, USA, 17–18 April 2014; OnePetro: London, UK, 2014. [Google Scholar]
Yuan, C.; Zhong, S.; Wu, Y.; Chen, M.; Wang, Y.; Cao, Y.; Chen, J. Evaluation of Estimated Ultimate Recovery for Shale Gas Infill Wells Considering Inter-Well Crossflow Dynamics. Fluid Dyn. Mater. Process.2025, 21, 1689–1710. [Google Scholar] [CrossRef]
Li, Y.; Zhou, Z.; Zhang, N. Semi-Analytical Modeling of Transient Flow to a Partially Penetrating Variable-Discharge Well in a Complex Aquifer-Aquitard System. J. Hydrol.2026, 668, 134967. [Google Scholar] [CrossRef]
Zhou, B.; Chen, Z.; Song, Z.; Tang, Z.; Wang, B.; Olorode, O. A New Analytically Modified Embedded Discrete Fracture Model for Pressure Transient Analysis in Fluid Flow. J. Hydrol.2024, 636, 131330. [Google Scholar] [CrossRef]
Du, B.; Zhang, F.; Dontsov, E.; Meng, K. Numerical Simulation of Hydraulic Fracturing Optimization in Multi-Well and Multi-Layer Shale Gas Development: Insights from Inter-Well Interference Analysis. Geoenergy Sci. Eng.2025, 250, 213825. [Google Scholar] [CrossRef]
Hu, P.; Geng, S.; Liu, X.; Li, C.; Zhu, R.; He, X. A Three-Dimensional Numerical Pressure Transient Analysis Model for Fractured Horizontal Wells in Shale Gas Reservoirs. J. Hydrol.2023, 620, 129545. [Google Scholar] [CrossRef]
Luo, L.; Zhou, J.; Duan, Y.; Wei, M.; Long, T.; Zhao, L. Transient Fluid Flow Simulation and Optimization of Cleanup in Offshore Low-Permeability Wells: Integration of Core Flooding and Nuclear Magnetic Resonance Characterization. Phys. Fluids2025, 37, 093103. [Google Scholar] [CrossRef]
Wang, Q.; Ma, X.; Ma, H.; Liu, Y. The Impact of Formation Depletion on Fracturing Interference and the Methods for Preventing Interference. Phys. Fluids2025, 37, 056608. [Google Scholar] [CrossRef]
Wang, X.; Luo, W.; Hou, X.; Wang, J. Pressure Transient Analysis of Multi-Stage Fractured Horizontal Wells in Boxed Reservoirs. Pet. Explor. Dev.2014, 41, 82–87. [Google Scholar] [CrossRef]
Yang, D.; Zhang, F.; Styles, J.A.; Gao, J. Performance Evaluation of a Horizontal Well with Multiple Fractures by Use of a Slab-Source Function. SPE J.2015, 20, 652–662. [Google Scholar] [CrossRef]
Zhao, Y.-L.; Zhang, L.-H.; Liu, Y.; Hu, S.-Y.; Liu, Q.-G. Transient Pressure Analysis of Fractured Well in Bi-Zonal Gas Reservoirs. J. Hydrol.2015, 524, 89–99. [Google Scholar] [CrossRef]
Gringarten, A.C.; Ramey, H.J., Jr. The Use of Source and Green’s Functions in Solving Unsteady-Flow Problems in Reservoirs. SPE J.1973, 13, 285–296. [Google Scholar] [CrossRef]
Gringarten, A.C.; Ramey, H.J., Jr. Unsteady-State Pressure Distributions Created by a Well with a Single Horizontal Fracture, Partial Penetration, or Restricted Entry. SPE J.1974, 14, 413–426. [Google Scholar] [CrossRef]
Ozkan, E. Performance of Horizontal Wells. Ph.D. Thesis, The University of Tulsa, Tulsa, OK, USA, 1988. [Google Scholar]
Raghavan, R.; Ozkan, E. A Method for Computing Unsteady Flows in Porous Media; Routledge: Abingdon, UK, 1994. [Google Scholar]
Wang, H.-T. Performance of Multiple Fractured Horizontal Wells in Shale Gas Reservoirs with Consideration of Multiple Mechanisms. J. Hydrol.2014, 510, 299–312. [Google Scholar] [CrossRef]
Guo, J.; Wang, H.; Zhang, L. Transient Pressure Behavior for a Horizontal Well with Multiple Finite-Conductivity Fractures in Tight Reservoirs. J. Geophys. Eng.2015, 12, 638–656. [Google Scholar] [CrossRef]
Heidari Sureshjani, M.; Behmanesh, H.; Soroush, M.; Clarkson, C.R. A Direct Method for Property Estimation from Analysis of Infinite Acting Production in Shale/Tight Gas Reservoirs. J. Pet. Sci. Eng.2016, 143, 26–34. [Google Scholar] [CrossRef]
Sun, H.; Cai, X.; Hu, D.; Lu, Z.; Zhao, P.; Zheng, A.; Li, J.; Wang, H. Theory, Technology and Practice of Shale Gas Three-Dimensional Development: A Case Study of Fuling Shale Gas Field in Sichuan Basin, SW China. Pet. Explor. Dev.2023, 50, 651–664. [Google Scholar] [CrossRef]
Wang, B.; Zhang, Q.; Yao, S.; Zeng, F. A Semi-Analytical Mathematical Model for the Pressure Transient Analysis of Multiple Fractured Horizontal Well with Secondary Fractures. J. Pet. Sci. Eng.2022, 208, 109444. [Google Scholar] [CrossRef]
Chang, C.; Yang, X.; Xie, W.; Dai, D.; Chen, Y.; Ji, X.; Liang, Y.; Teng, B. A Semi-Analytical Model for Pressure Transient Analysis of Multiple Fractured Horizontal Wells in Irregular Heterogeneous Reservoirs. Energies2025, 18, 1861. [Google Scholar] [CrossRef]
Wei, M.; Wei, S.; Duan, Y.; Wang, H. Blasingame Decline Theory for Hydrogen Storage Capacity Estimation in Shale Gas Reservoirs. Int. J. Hydrogen Energy2023, 48, 13189–13201. [Google Scholar] [CrossRef]
Wei, M.; Wen, M.; Duan, Y.; Fang, Q.; Ren, K. Production Decline Type Curves Analysis of a Finite Conductivity Fractured Well in Coalbed Methane Reservoirs. Open Phys.2017, 15, 143–153. [Google Scholar] [CrossRef]
Stehfest, H. Algorithm 368: Numerical Inversion of Laplace Transforms [D5]. Commun. ACM1970, 13, 47–49. [Google Scholar] [CrossRef]
Figure 1.
Model of multi-stage fractured horizontal wells with inter-well interference in a closed rectangular shale gas reservoir (a) field map (b) physical model.
Figure 1.
Model of multi-stage fractured horizontal wells with inter-well interference in a closed rectangular shale gas reservoir (a) field map (b) physical model.
Figure 2.
Schematic diagram of three-dimensional closed rectangular boundary point source response.
Figure 2.
Schematic diagram of three-dimensional closed rectangular boundary point source response.
Figure 3.
2D schematic of a multi-stage fractured horizontal well in a rectangular closed reservoir.
Figure 3.
2D schematic of a multi-stage fractured horizontal well in a rectangular closed reservoir.
Figure 4.
2D schematic of a multi-well, multi-stage fractured system in a rectangular closed reservoir.
Figure 4.
2D schematic of a multi-well, multi-stage fractured system in a rectangular closed reservoir.
Figure 5.
Comparison of pressure contours at 40,500 h (a) KAPPA-Saphir numerical module (b) the proposed model.
Figure 5.
Comparison of pressure contours at 40,500 h (a) KAPPA-Saphir numerical module (b) the proposed model.
Figure 6.
Verification of the proposed model against Saphir numerical results (Log-log plot).
Figure 6.
Verification of the proposed model against Saphir numerical results (Log-log plot).
Figure 7.
Identification of flow regimes on typical log-log type curves for MFHWs.
Figure 7.
Identification of flow regimes on typical log-log type curves for MFHWs.
Figure 8.
Dimensionless pressure contours during the fracture linear flow stage (tD = 1).
Figure 8.
Dimensionless pressure contours during the fracture linear flow stage (tD = 1).
Figure 9.
Dimensionless pressure contours during the fracture radial flow stage (tD = 10).
Figure 9.
Dimensionless pressure contours during the fracture radial flow stage (tD = 10).
Figure 10.
Dimensionless pressure contours during the compound linear flow stage (tD = 630).
Figure 10.
Dimensionless pressure contours during the compound linear flow stage (tD = 630).
Figure 11.
Dimensionless pressure contours during the compound radial flow stage (tD = 104).
Figure 11.
Dimensionless pressure contours during the compound radial flow stage (tD = 104).
Figure 12.
Dimensionless pressure contours during the boundary-dominated flow stage (tD = 105).
Figure 12.
Dimensionless pressure contours during the boundary-dominated flow stage (tD = 105).
Figure 13.
Comparison of log-log type curves for MFHWs with different inter-well spacings.
Figure 13.
Comparison of log-log type curves for MFHWs with different inter-well spacings.
Figure 14.
Dimensionless pressure contours for different inter-well spacings (a) Single well no interference (tD = 6) (b) yoff = 2LfD (tD = 6) (c) yoff = 4LfD (tD = 10) (d) yoff = 8LfD (tD = 25).
Figure 14.
Dimensionless pressure contours for different inter-well spacings (a) Single well no interference (tD = 6) (b) yoff = 2LfD (tD = 6) (c) yoff = 4LfD (tD = 10) (d) yoff = 8LfD (tD = 25).
Figure 15.
Comparison of log-log type curves for MFHWs with different longitudinal center-to-center distances.
Figure 15.
Comparison of log-log type curves for MFHWs with different longitudinal center-to-center distances.
Figure 17.
Comparison of log-log type curves for MFHWs under different flow rate ratios.
Figure 17.
Comparison of log-log type curves for MFHWs under different flow rate ratios.
Figure 18.
Dimensionless pressure contours for different production rate ratio (a) qDw1:qDw2 = 0.1:0.9 (tD = 100) (b) qDw1:qDw2 = 0.3:0.7 (tD = 100).
Figure 18.
Dimensionless pressure contours for different production rate ratio (a) qDw1:qDw2 = 0.1:0.9 (tD = 100) (b) qDw1:qDw2 = 0.3:0.7 (tD = 100).
Figure 19.
Comparison of log-log type curves for different well counts (a) 3-well system (b) 4-well system.
Figure 19.
Comparison of log-log type curves for different well counts (a) 3-well system (b) 4-well system.
Figure 20.
Dimensionless pressure contours for different well counts (a) 3-well system (tD = 400) (b) 4-well system (tD = 400).
Figure 20.
Dimensionless pressure contours for different well counts (a) 3-well system (tD = 400) (b) 4-well system (tD = 400).
Table 1.
Numerical simulation parameters used for model validation.
Table 1.
Numerical simulation parameters used for model validation.
Group
Item
Value
Unit
Reservoir Design
Reservoir length
10,000
m
Reservoir width
10,000
m
Thickness
10
m
Initial pressure
34.47
MPa
Permeability
3
md
Porosity
0.1
/
kz/kr
0.1
/
Tested Well
Tested Well X
−600
m
Tested Well Y
240
m
Number of fractures
4
/
Fracture half length
80
m
Fracture height
10
m
Fracture mid-point height
5
m
Well length
1200
m
Well #1
Well #1 X
−600
m
Well #1 Y
−240
m
Number of fractures
4
/
Fracture half length
80
m
Fracture height
10
m
Fracture mid-point height
5
m
Well length
1200
m
Table 2.
Theoretical model parameters used for model validation.
Table 2.
Theoretical model parameters used for model validation.
Group
Dimensionless Item
Value
Reservoir Design
Reservoir length
10,000/80 = 125
Reservoir width
10,000/80 = 125
Thickness
10/80 = 0.125
Tested Well
Well length
1200/80 = 15
Number of fractures
4
Fracture half length
80/80 = 1
Fracture height
10/80 = 0.125
Well #1
Well length
1200/80 = 15
Number of fractures
4
Fracture half length
10/80 = 0.125
Fracture height
10/80 = 0.125
Table 3.
Default parameters for sensitivity analysis.
Table 3.
Default parameters for sensitivity analysis.
Item
Value
Item
Value
Flow rate ratios (qDw1:qDw2)
0.5:0.5
Dimensionless reservoir length (xeD)
800
Dimensionless well length (LhD)
90
Dimensionless reservoir width (yeD)
800
Dimensionless fracture half-length (LfD)
1
Dimensionless reservoir thickness (zeD)
1
Dimensionless y-offset (yoff)
8 LfD
Number of fractures per well
4
Dimensionless x-offset (xoff)
0 LhD
Number of wells
2
Disclaimer/Publisher’s Note: The statements, opinions and data contained in all publications are solely those of the individual author(s) and contributor(s) and not of MDPI and/or the editor(s). MDPI and/or the editor(s) disclaim responsibility for any injury to people or property resulting from any ideas, methods, instructions or products referred to in the content.
Sun, Y.; Wang, H.; Yuan, H.; Wei, M.; Li, Q.
Transient Pressure Behavior and Interference Mechanisms of Multi-Well Pads in Rectangular Bounded Shale Gas Reservoirs. Processes2026, 14, 1534.
https://doi.org/10.3390/pr14101534
AMA Style
Sun Y, Wang H, Yuan H, Wei M, Li Q.
Transient Pressure Behavior and Interference Mechanisms of Multi-Well Pads in Rectangular Bounded Shale Gas Reservoirs. Processes. 2026; 14(10):1534.
https://doi.org/10.3390/pr14101534
Chicago/Turabian Style
Sun, Yuping, Hao Wang, Hang Yuan, Mingqiang Wei, and Qiaojing Li.
2026. "Transient Pressure Behavior and Interference Mechanisms of Multi-Well Pads in Rectangular Bounded Shale Gas Reservoirs" Processes 14, no. 10: 1534.
https://doi.org/10.3390/pr14101534
APA Style
Sun, Y., Wang, H., Yuan, H., Wei, M., & Li, Q.
(2026). Transient Pressure Behavior and Interference Mechanisms of Multi-Well Pads in Rectangular Bounded Shale Gas Reservoirs. Processes, 14(10), 1534.
https://doi.org/10.3390/pr14101534
Note that from the first issue of 2016, this journal uses article numbers instead of page numbers. See further details here.
Article Metrics
No
No
Article Access Statistics
For more information on the journal statistics, click here.
Multiple requests from the same IP address are counted as one view.
Sun, Y.; Wang, H.; Yuan, H.; Wei, M.; Li, Q.
Transient Pressure Behavior and Interference Mechanisms of Multi-Well Pads in Rectangular Bounded Shale Gas Reservoirs. Processes2026, 14, 1534.
https://doi.org/10.3390/pr14101534
AMA Style
Sun Y, Wang H, Yuan H, Wei M, Li Q.
Transient Pressure Behavior and Interference Mechanisms of Multi-Well Pads in Rectangular Bounded Shale Gas Reservoirs. Processes. 2026; 14(10):1534.
https://doi.org/10.3390/pr14101534
Chicago/Turabian Style
Sun, Yuping, Hao Wang, Hang Yuan, Mingqiang Wei, and Qiaojing Li.
2026. "Transient Pressure Behavior and Interference Mechanisms of Multi-Well Pads in Rectangular Bounded Shale Gas Reservoirs" Processes 14, no. 10: 1534.
https://doi.org/10.3390/pr14101534
APA Style
Sun, Y., Wang, H., Yuan, H., Wei, M., & Li, Q.
(2026). Transient Pressure Behavior and Interference Mechanisms of Multi-Well Pads in Rectangular Bounded Shale Gas Reservoirs. Processes, 14(10), 1534.
https://doi.org/10.3390/pr14101534
Note that from the first issue of 2016, this journal uses article numbers instead of page numbers. See further details here.